Article

Leaf Nitrogen Traits in Response to Plant Density and Nitrogen Supply in Oilseed Rape

1
Faculty of Agricultural Science, Campus Isla Teja, Graduate School, Universidad Austral de Chile, 5090000 Valdivia, Chile
2
Centre for Crop Systems Analysis, Wageningen University and Research, P.O. Box 430, 6700 AK Wageningen, The Netherlands
3
Institute of Plant Production and Protection, Universidad Austral de Chile, Campus Isla Teja, 5090000 Valdivia, Chile
*
Author to whom correspondence should be addressed.
Agronomy 2020, 10(11), 1780; https://doi.org/10.3390/agronomy10111780
Submission received: 16 October 2020 / Revised: 9 November 2020 / Accepted: 11 November 2020 / Published: 13 November 2020
(This article belongs to the Special Issue New Oilseed Crops for Biofuel and Biobased Applications)

Abstract

:
Understanding the response of plant nitrogen (N) and carbon (C) economies in oilseed rape, as well as their role in defining phenotypic plasticity, is necessary for designing new strategies to optimize plant and canopy C assimilation to improve potential yield. This paper aims to elucidate the extent to which the interaction between N supply and plant population density alters N distribution in oilseed rape plant (Brassica napus L.) and whether this interaction changes plant investment in leaf area or leaf mass per area. Spring oilseed rape was grown at two rates of N supply (50 and 150 kg N·ha−1) and two plant population densities (50 and 150 plants·m−2). Photosynthesis, leaf area, leaf biomass, and N content of selected leaves were measured at 20% of flowers on main raceme open. The interaction between N supply and plant population density altered leaf N content per area, which is the main determinant of photosynthesis. This interaction also affected leaf mass per area, while N supply determined N content per unit leaf mass. These results suggest that the interaction between N supply and population density affects both nitrogen distribution and leaf mass per area, which could have important implications for light distribution and, therefore, for C assimilation at the plant level.

1. Introduction

During the last 50 years, oil crops have been the commodities with the greatest relative increase in terms of contribution to the world’s food supply [1]. Oil from oilseed rape (Brassica napus L.) is the third most consumed vegetable oil after soybean and palm oil, while it is one of the healthiest edible oils for human consumption [2]. Additionally, the rising demand of biofuels [3] has resulted in an exponential growth of oilseed rape production since 1980, reaching 71 million tons in 2017 [4]. Future increases in crop production should be accompanied by improved sustainability of crop production systems; therefore, there is a need for developing and improving crop nitrogen (N) management which can maintain high levels of production, while minimizing N input [5], and more insight into regulatory mechanisms controlling plant N economy is vital for improving N-use efficiency [6,7]. Since the N economy is closely associated with the carbon (C) economy [8], the interaction between both should be considered.
Oilseed rape has the potential of maintaining a similar seed yield across a wide range of plant population densities [9,10], opening the opportunity to reduce sowing rates. As the light environment at every leaf and leaf traits are modified by plant population density, the plant acclimation and photosynthetic performance would be different as well. However, little is known on the effects of the interaction between N supply and light interception on plant and leaf architectural traits in oilseed rape.
Leaf photosynthetic capacity is strongly related to N content per unit of leaf area (Narea) [11], but wide variation in the photosynthetic capacity for a given Narea has been observed in different plant species [12,13]. Narea is associated with leaf mass per area (LMA mg mass·cm−2), which is an indicator of the plant investment in light-capturing and photosynthetic organs [14]. This sensitivity to photosynthetically active radiation (PAR) contributes to explain the sensitivity of LMA to different plant population densities observed [15]. However, the response of LMA to N supply is less clear; this trait has been found to be negatively correlated with N supply [16] or not correlated at all [17], depending on the plant or crop species. The other physiological determinant of Narea is N content per leaf mass (Nmass), but the environmental factors affecting Nmass are poorly understood. Neither LAI nor LMA was affected in response to N supply and plant population density in maize (Zea mays L.) [18].
The N demand of plants is not completely matched by the N supplied as fertilizer; available N is variable at a short time scale due to environmental constraints that affect the N cycle [19]. Under N deficiency, due to low availability in the soil, N distribution in plants is more dependent on N soil status and subsequent N uptake by the plant, rather than on leaf light interception [20]. Ipomoea tricolor [21], grown in an hydroponic solution at 0.12 and 12 mmol NO3·L−1, showed a decrease in Narea associated with aging of leaves, while leaf Nmass of Xanthium canadense was strongly affected by leaf position on the plant, independent of the relative photon flux density, in an experiment under low N availability, where the plants did not receive N fertilizer supply [22].
A substantial body of literature about N distribution stems from studies performed on woody, perennial crops or wild plant species [17,23,24], while only a limited number of studies have been performed on annual crops [25,26]. Since wild plants and crops differ in their preferences for N forms (i.e., NO3, NH4+), mycorrhizal associations, amounts of N storage, breeding pressure, and adaptive responses to low soil N availability [27], the conclusions from ecological studies cannot be directly extrapolated to crop species such as oilseed rape, especially when grown under different plant population densities.
Understanding the combined effects of N supply and plant population density on leaf N distribution, as well as their impact on plant N and C partitioning, is of major importance for the design of new strategies to improve seed yield of oilseed rape. For that reason, the current study addresses the following research questions: (1) to what extent does the interaction between N supply and plant population density affect N distribution in oilseed rape? (2) does the plant respond to this interaction by modifying assimilate investment in leaf area or by modifying leaf mass per area (LMA)?
To answer these questions, we focused on the plant developmental stage Biologische Bundesanstalt, Bundessortenamt and Chemical industry (BBCH) 62 (20% of flowers on main raceme open) because the plant carbon status during the period bracketing flowering determines branch appearance [28] and seed yield in oilseed rape [29,30]. Moreover, while exploring this period, N remobilization from leaves to reproductive organs is largely avoided.

2. Materials and Methods

2.1. Experimental Set-Up and Treatments

On 17 April 2013, spring oilseed rape (B. napus “Solar CL”) was sown under an open-sided shelter with transparent roof in Wageningen, the Netherlands (51°58′ north (N), 5°40′ east (E)). The treatments consisted of combinations of two rates of N fertilization, 50 (N50) and 150 (N150) kg·ha−1, and two plant population densities, 50 (D50) and 150 (D150) plants·m−2, with the goal to obtain contrasting N supply and light environments and, thus, different N distribution at the plant level. The plant population density of 150 plants·m−2 was chosen according to similar experiments performed in spring oilseed rape [31]. On the other hand, we assessed a contrasting low population density (50 plants·m−2) taking into account that this density increases branching and modifies carbon partitioning within the plants. The N supplies of 150 and 50 kg N·ha−1 applied in our experiment were also contrasting and similar to the highest and lowest N availabilities used in a study performed under similar conditions [31].
Treatment effects were tested on plants growing in containers (0.7 × 0.9 m), which contained from bottom to top a layer of 35 cm of sandy soil, upon which fertilizers (Ca(H2PO4)2 and K2SO4.MgSO4) were applied and covered with 1 cm of soil. On this layer, seeds were placed in a hexagonal spatial pattern and covered with a layer of 2 cm soil. The containers were arranged closely together to ensure canopy homogeneity, and 12 guard containers were placed around the experimental containers aimed at avoiding border effects on the plants to be measured. Treatments were assessed in a single container and we used individual plants as pseudo-replicates as in previous studies [32,33,34], which, in agreement with the homogeneity of the soil (coefficient of variation of N present in the soil at sowing was 3.7%; data not shown) and plants in this well-managed experiment, allowed very high similarity across plants at each experimental unit. In addition, the containers were rearranged twice to reduce position effects in the open-sided shelter. Phenological growth stages in oilseed rape were recorded according to the coding of developmental growth stages of mono- and dicotyledonous plant species designed by the Biologische Bundesanstalt, Bundessortenamt and Chemical industry (also known as BBCH phenological scale) [35].
The N fertilizer KAS-27 (13.5% NO3 and 13.5% NH4+) was applied to the soil by hand (containing 30 kg N·ha−1 and 3.1% organic material) to reach 50 and 150 kg N·ha−1. In the lower N treatment, 50 kg N·ha−1 was applied 2 days after emergence, while, in the higher N treatment, 150 kg N·ha−1 was split into two applications: 100 kg·ha−1 2 days after emergence (BBCH 10) and 50 kg·ha−1 when the fifth internode was expanded (BBCH 35) (Figure 1). The containers were irrigated daily or twice per day dependent on the environmental temperature, while fungal diseases such as Phoma lingam and Sclerotinia sclerotiorum were chemically controlled by using the fungicides prothioconazole (Proline®, Bayer CropScience, Monheim, Germany) and iprodione (Rovral®, BASF, Ludwigshafen, Germany), respectively. Weeds were manually removed.

2.2. Temperature Conditions

Temperature was recorded (Data taker DT600, Datataker Data Loggers, Cambridgeshire, UK) with shielded thermocouples (type T, TempControl Industrial Electronic Products, Voorburg, The Netherlands) at 15 min intervals from sowing to flowering. Thermocouples were placed at mid-canopy and below the soil surface at 7 cm depth. Plant development and leaf appearance were expressed in thermal time (TT) after emergence and calculated by summing daily mean temperatures (Tmean) using a base temperature (Tbase) of 0 °C for spring oilseed rape; n is the variable being summed up to and i is the starting term [36].
T T = i n ( T mean   i T base ) .
For the first 15 days after emergence, thermal time was estimated on the basis of soil temperature, since the apex was below the soil surface; canopy temperature was used thereafter.

2.3. Plant Measurements

One week after emergence, 10 representative plants of similar plant height, leaf size, and color grown in the center of the evaluated containers were randomly selected and labeled for each treatment (five plants for destructive measurements and five for photosynthesis measurements), and the leaves were coded according to their position on the stem (the phytomer rank). A leaf was considered to have appeared halfway between the last observation when it was absent and the first observation when the tip was visible. For each plant selected, the time of leaf tip appearance of leaf 9 and 11 on the main stem, as well as leaf 9.1 (i.e., the first leaf on the primary branch outgrowing from phytomer 9 on the main stem), was recorded twice a week from emergence (BBCH 10) to 20% of flowers on main raceme open (BBCH 62) in order to estimate the time of leaf appearance. Because, in oilseed rape, leaves placed at lower phytomers differ in their size, shape, and presence of petiole in comparison with middle and upper leaves [37], and because the beginning of flowering assimilate remobilization and/or senescence was evidenced in leaves positioned below phytomer rank 3, only sessile leaves positioned at higher phytomer ranks were evaluated. Plant height was measured at the beginning of flowering, as the distance from the base and the top of the main stem.
Light interception (IPAR) was measured twice per week at the canopy level in all the containers evaluated; thus, light interception by leaves located in a given layer was estimated by assuming IPAR (µmol·m−2·s−1) to attenuate through the leaf canopy following the Beer–Lambert law [38].
IPAR = PARinc × (1 − e k×LAI),
where k is the light extinction coefficient and depends upon the architecture of a canopy and transmission of radiation through individual leaves [39]; it was estimated by the following function:
k = −ln (PARtrans/PARinc)/LAI.
Incident light (PARinc, µmol·m−2·s−1) was recorded by the BF5 Sunshine Sensor (Delta-T Devices Ltd., Cambridge, United Kingdom), which was placed on a horizontal level 1.5 m close to the container evaluated, and transmitted light (PARtrans, µmol·m−2·s−1) was measured at ground level with a 1 m sensor probe of the SunScan Canopy Analysis System (Delta-T Devices Ltd., Cambridge, UK).
Leaf area index (LAI) is the total green leaf area by ground surface area. Cumulative LAI was estimated for each rank phytomer and, in this way, IPAR of individual leaves was estimated using Equation (2), assuming that each leaf layer has a similar k.
Net assimilation rate (An) measurements were done 5–7 days before flowering on leaves 9, 9.1, and 11 for treatment N150-D50 and on leaves 9 and 11 for treatments N50-D50, N150-D150, and N50-D150 because these treatments did not produce branches or leaf 9.1. At that moment, the evaluated leaves were fully expanded. The photosynthesis rate was determined with a LI-COR 6400XT Portable Photosynthesis System (LI-COR, Lincoln, NE, USA) at saturated incident light on surface area (Iinc) (Iinc = 1500 µmol·m−2·s−1; CO2 = 390 µmol·mol−1) and at a leaf temperature of 25 °C.
At BBCH 62, a destructive sampling was performed, and the leaf area of each individual leaf at each phytomer from the top of the canopy was measured. For this purpose, five plants per treatment (previously tagged) were harvested, and the leaf area of individual leaves 9, 9.1, and 11 was assessed (LI 3100; LI-COR, Lincoln, NE, USA). After oven-drying (at 70 °C for 48 h), the dry matter of leaves was also recorded. The remaining leaves and stems were also collected, to estimate dry matter and N uptake, but detached leaves were not considered for the analysis. N contents (%) of individual leaves, remaining leaves, and stems were determined in an N elemental analyzer using the combustion method of Dumas (Flash 2000, Thermo Fisher Scientific Inc., Delft, The Netherlands).
With this information, Narea, LMA, Nmass, and N uptake were calculated (see Table 1 for an explanation of all abbreviations used). Leaf N content per unit of leaf area (Narea) of leaves 9, 9.1, and 11 was determined as follows:
Narea = LMA × Nmass,
where LMA is the leaf mass per unit of area, and Nmass is the amount of leaf N per unit of leaf dry weight [22].

2.4. Soil Sampling

Nitrogen is present in the soil as a mixture of organic and inorganic forms [40], from which nitrate (NO3) is the most absorbed form of N [41], and the most associated with developmental and growing processes in oilseed rape [42,43]. In addition, due to N fertilization, mineralization, biological fixation, and losses by volatilization, the status of this nutrient varies over time; for that reason, the time course of NO3 availability is a more accurate way of analyzing the effects of N supply on oilseed rape than total mineral N availability. For this purpose, soil samples were collected at four different stages between sowing and beginning of flowering (BBCH 62), and total mineral N (NO3 + NH4+) and nitrate were determined on the basis of extraction with the 0.01 M calcium chloride method [44].
To obtain the dynamics of N availability and then the NO3 available at the moment that each leaf appeared, a three-parameter power function was fitted to the NO3 measured.
Y = A + B × RTT,
where Y is NO3 availability, A is the intercept, B determines the slope of the curve, R is the asymptotic maximum NO3 value, and TT is thermal time.

2.5. Statistical Analysis

Experimental data were subjected to analysis of variance using GENSTAT 17th edition [45], and differences were considered to be statistically significant at a probability level of 5%. To evaluate the effects of N supply, plant population density, and their interaction at plant level (i.e., plant height, leaf appearance, leaf area, N content per leaf, Narea, LMA, Nmass, and N uptake·m−2 and per plant), a two-way ANOVA was used and, when significant effects were found, differences between high and low N level or between high and low plant population level were evaluated by means of a two-sample t-test. When leaf position was also included as a factor, evaluated variables (Yijk; Yijk being leaf appearance, leaf area, N content per leaf, Narea, LMA, or Nmass) were analyzed using the following model:
Yijk = µ + Ni + Dj + NDij + NDLij(k) + ɛijk,
where µ represents the mean of the observations, and the effects of the treatments are represented as follows: Ni is the fixed effect of N supply, Dj is the fixed effect of plant population density, NDij represents the interaction between N supply and plant population density, and NDLijk represents the effect of leaf position within N supply and population density, plus a residual ɛijk, which represents the random variation. Since not all the treatments produced leaf 9.1, the effect of leaf position (Lk) was not evaluated. When significant effects were found, differences among treatments were evaluated by means of the Fischer least significant difference (LSD) test, and, when only two N level or densities were compared, a t-test was performed (see Supplementary Materials). Linear and exponential models were used to assess the associations between variables, and adjusted r-square (adjusted r2) was used to evaluate goodness of fit of these models, which is the difference between residual and total mean squares of the total mean square. The adjustment takes into account the number of parameters in the model compared to the number of observations [45].

3. Results

3.1. Plant and Leaf Characteristics

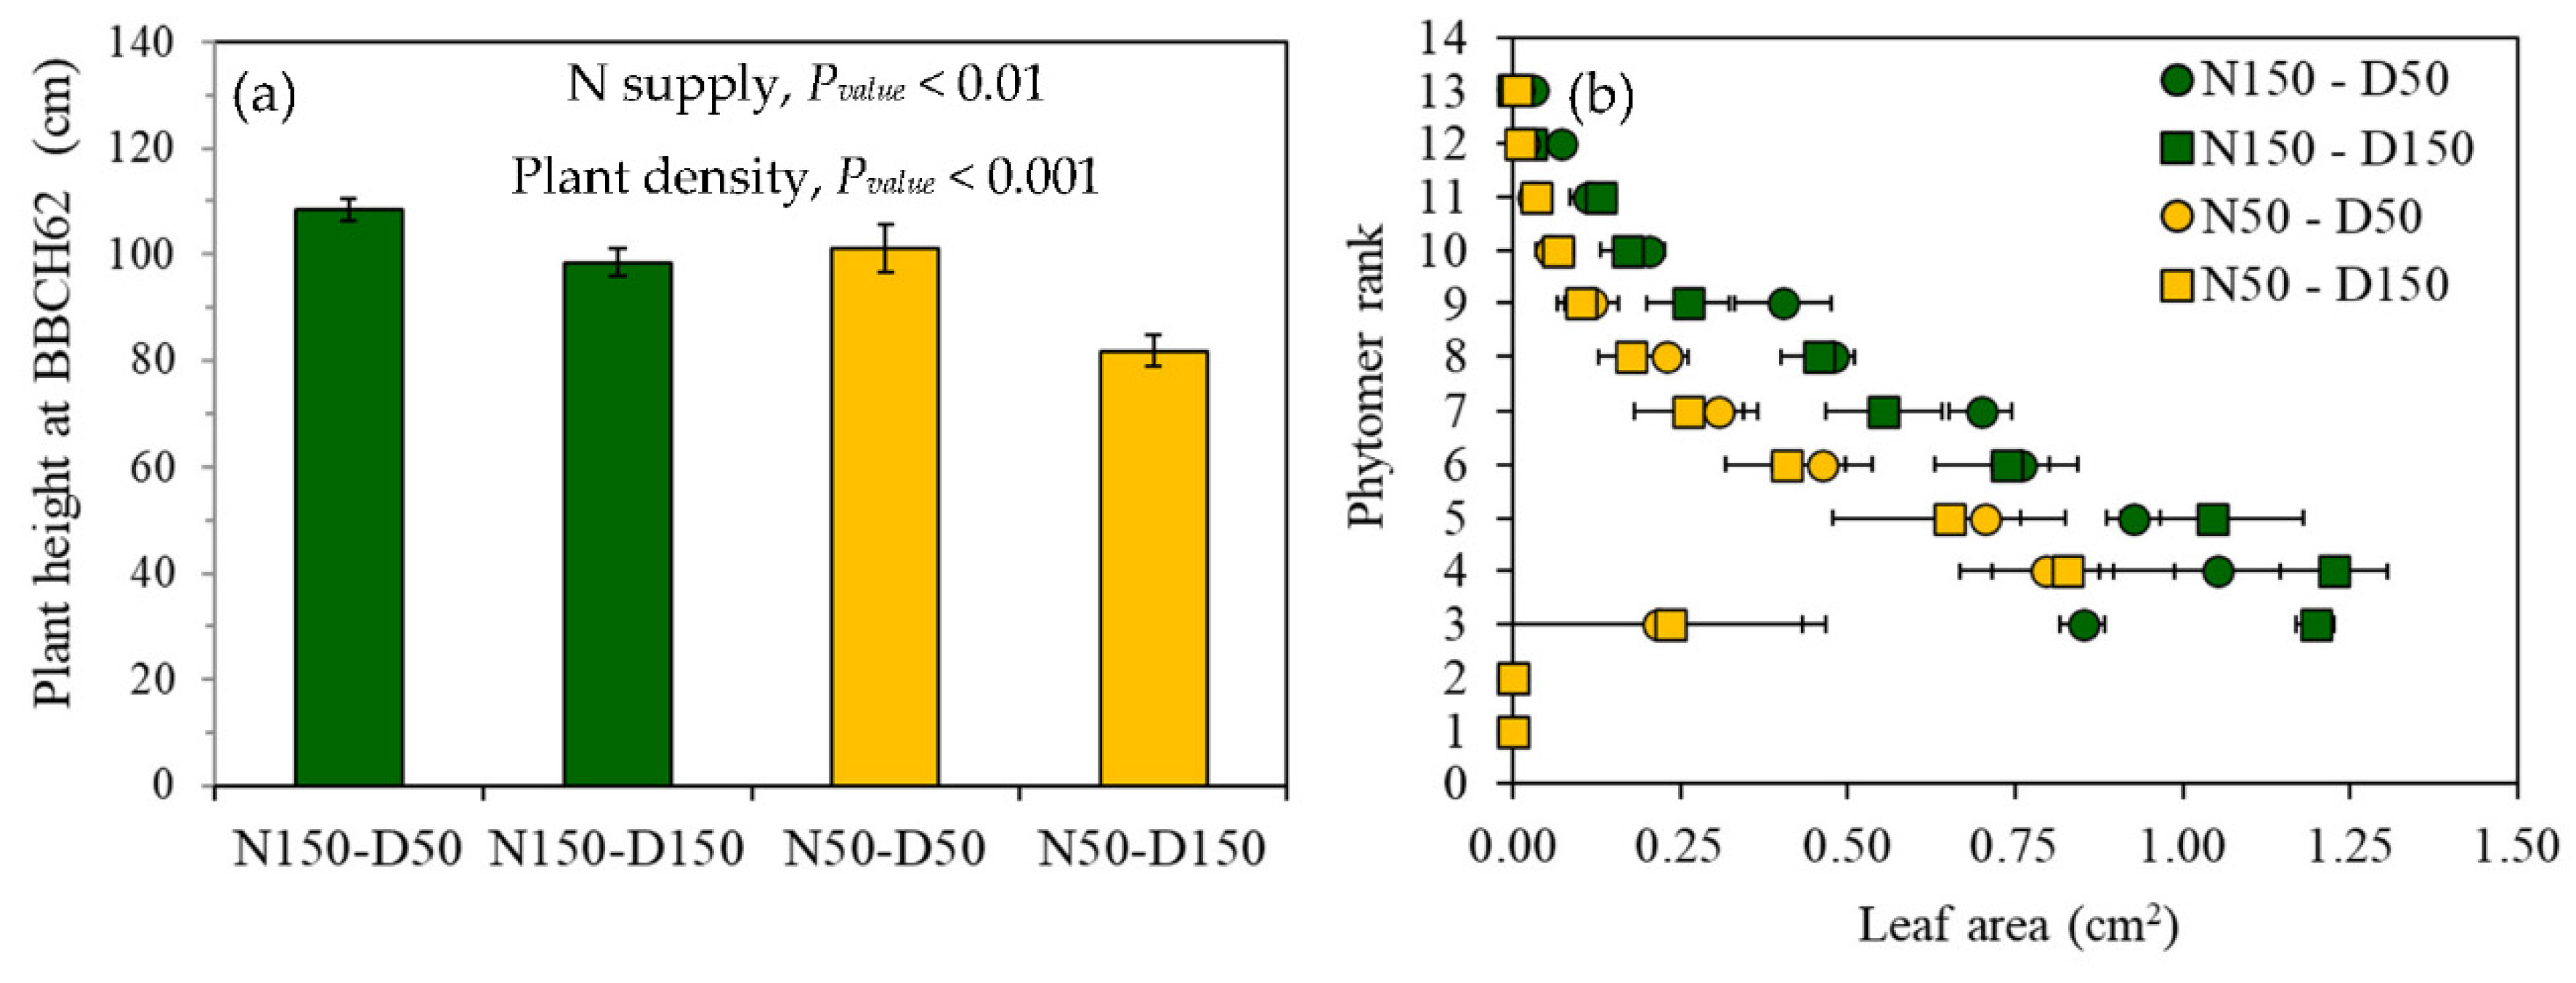
The times of emergence (BBCH 10), rosette formation (BBCH 25), and beginning of flowering (BBCH 62) were not affected (p > 0.05) by the treatments. Plants grown under N150 were 12 cm taller than plants grown under N50, while plants grown at low plant population density (D50) were 15 cm taller than those at high density (D150) (Figure 2a). Plant height was not affected (p > 0.05) by the interaction between N supply and plant population density.
Remarkable differences in leaf area at phytomer rank in response to N supply and, to a lesser degree, to plant population density were observed (Figure 2b), while yellowing and senescence were evident from phytomer 3 downward. In all the treatments, leaves positioned on phytomers 1 and 2 had already dropped at that time. These processes of leaf senescence and dropping are associated with reduced PAR and a decreased red/far-red ratio in leaves positioned at the bottom of the plant canopy [46,47]. The area of leaves positioned in phytomer ranks 3 and 4 was slightly higher in N150-D150 than in N150-D50, while these differences were not evident at higher phytomer ranks. This means that, at early stages, when plant competition was less of a limiting factor, plants grown at higher densities expanded slightly larger leaves than at low plant population density.
A significant interaction among N supply, plant population density, and leaf position was observed in leaf appearance, individual leaf area, and N content per leaf of the evaluated leaves (Table 2). Among the three positions measured, the leaf positioned at phytomer 9 was the first to appear, followed by leaves 11 and 9.1 in second and third place, respectively. While the timing of appearance was not affected in leaf 9 by the treatments and their interaction, leaf 11 appeared earlier in treatments N50-D150 and N50-D50 than in treatments N150-D150 and N150-D50. Across treatments, the leaf area of leaves 9 and 11 was larger in N150-D50 than in treatments with low N supply (N50-D50 and N50-D150), and the leaf area of leaf 9.1 was not different from the leaf area of leaf 11 (p > 0.05). The total N content of leaf 9 and 11 was higher in N150-D50 than in the other treatments.

3.2. Leaf N Content (Narea) and Photosynthesis

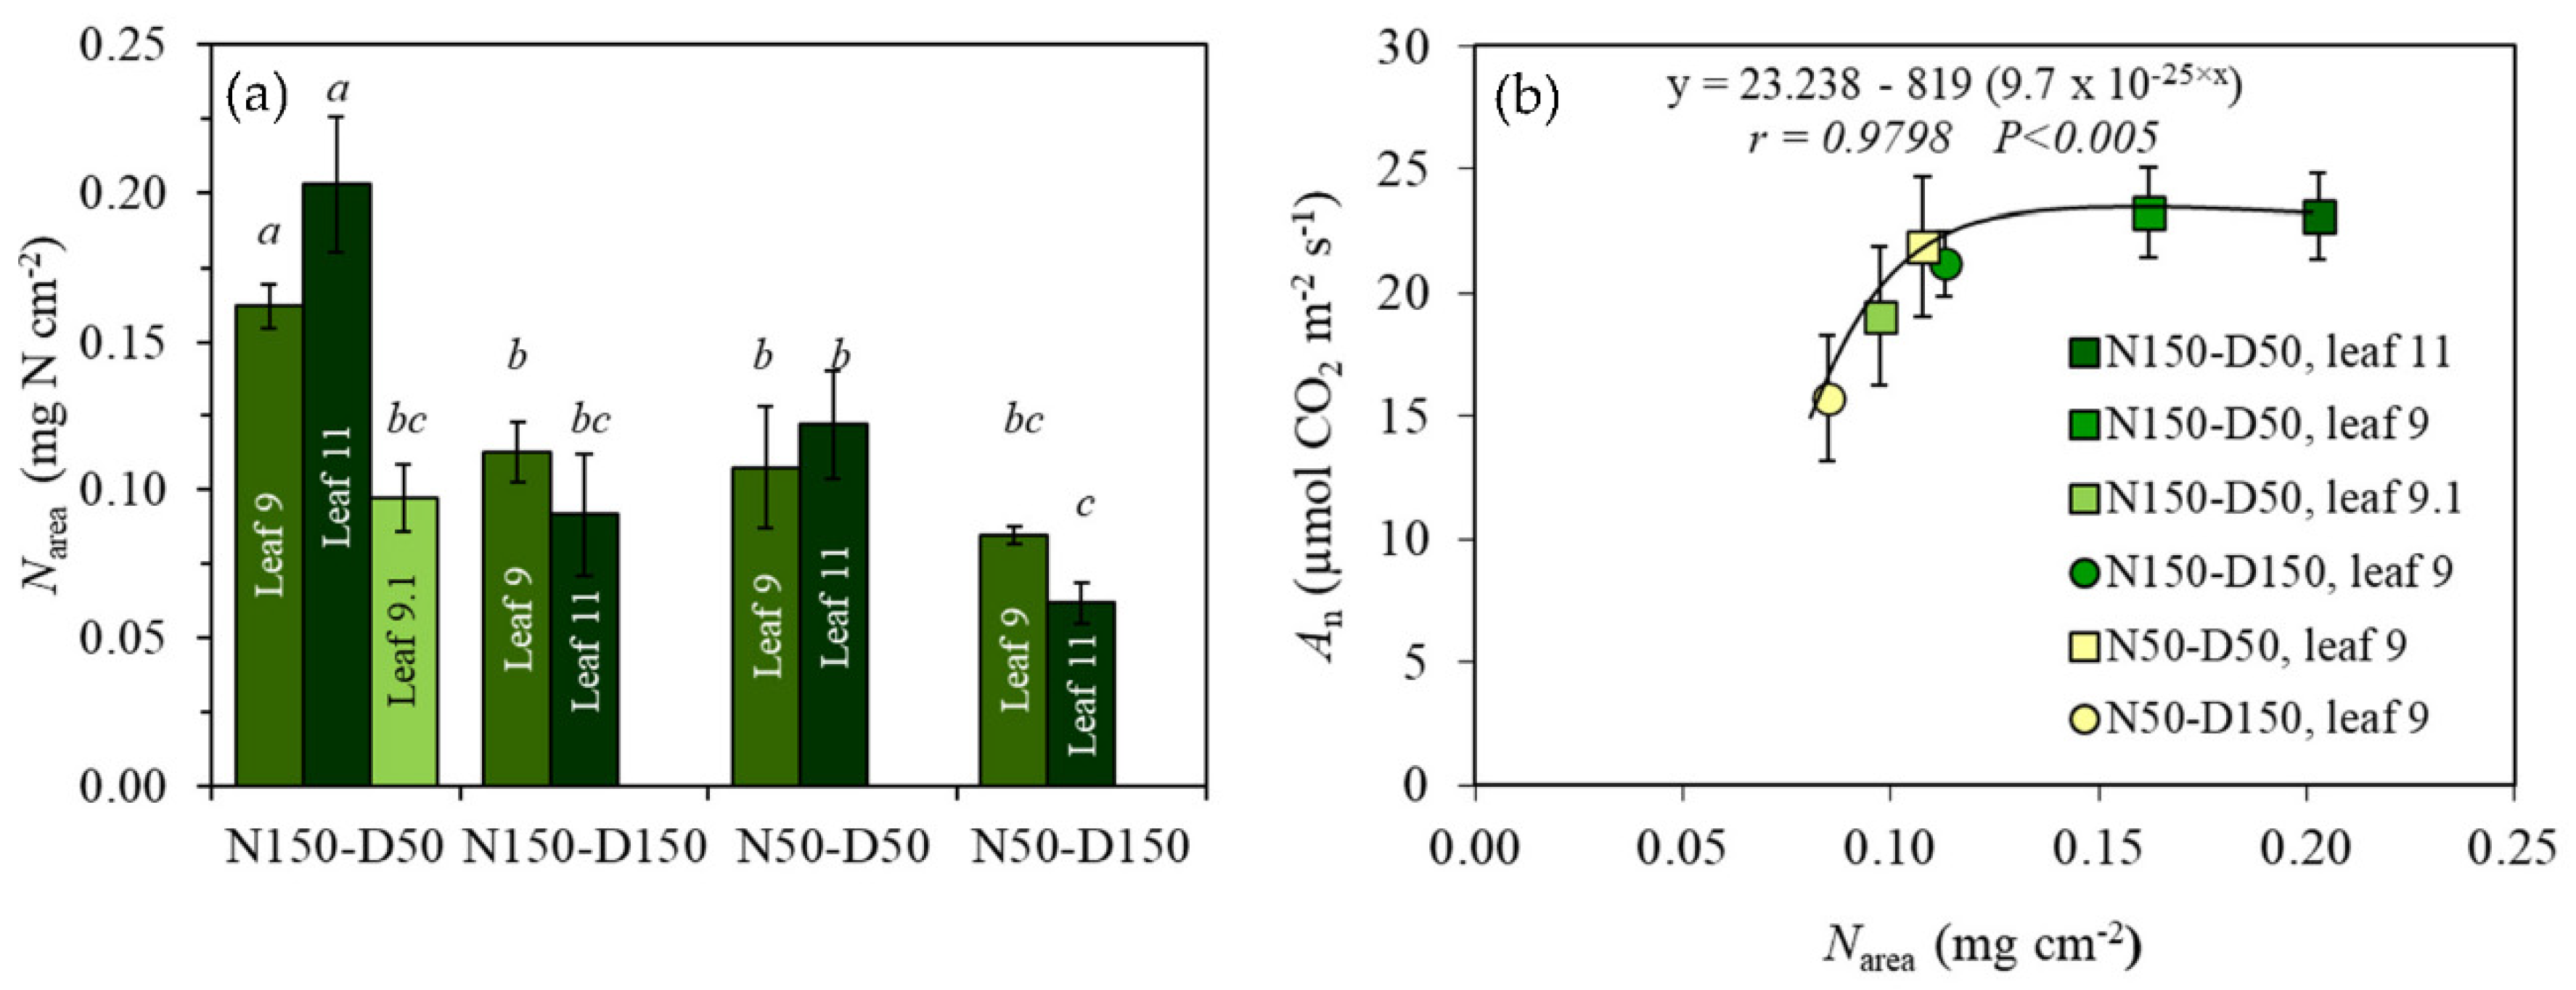
There was a significant interaction effect (p < 0.05) between N supply and plant population density on Narea in leaves 9, 9.1, and 11 (Figure 3a). The highest Narea value was reached in leaves 9 and 11 (0.16 and 0.20 mg·cm−2, respectively) grown under N150-D50, while leaf rank 9.1, the youngest leaf, recorded the lowest Narea (0.10 mg·cm−2). Narea of leaves 9 and 11 grown under N150-D150, N50-D50, and N50-D150 did not differ significantly (p > 0.05). Light-saturated photosynthesis rate per area (An) was asymptotically related to Narea across treatments and leaf positions (Figure 3b), whereas, at low Narea, An increased markedly until 0.12 mg N·cm−2 reaching a plateau at around 0.20 mg N·cm−2. This trend in oilseed rape has also been observed but at different critical values in a wide diversity of other crops including sunflower (Helianthus annuus L.), kenaf (Hibiscus cannabinus L.), and cynara (Cynara cardunculus L.) [48,49].

3.3. Physiological and Structural Determinants of Narea

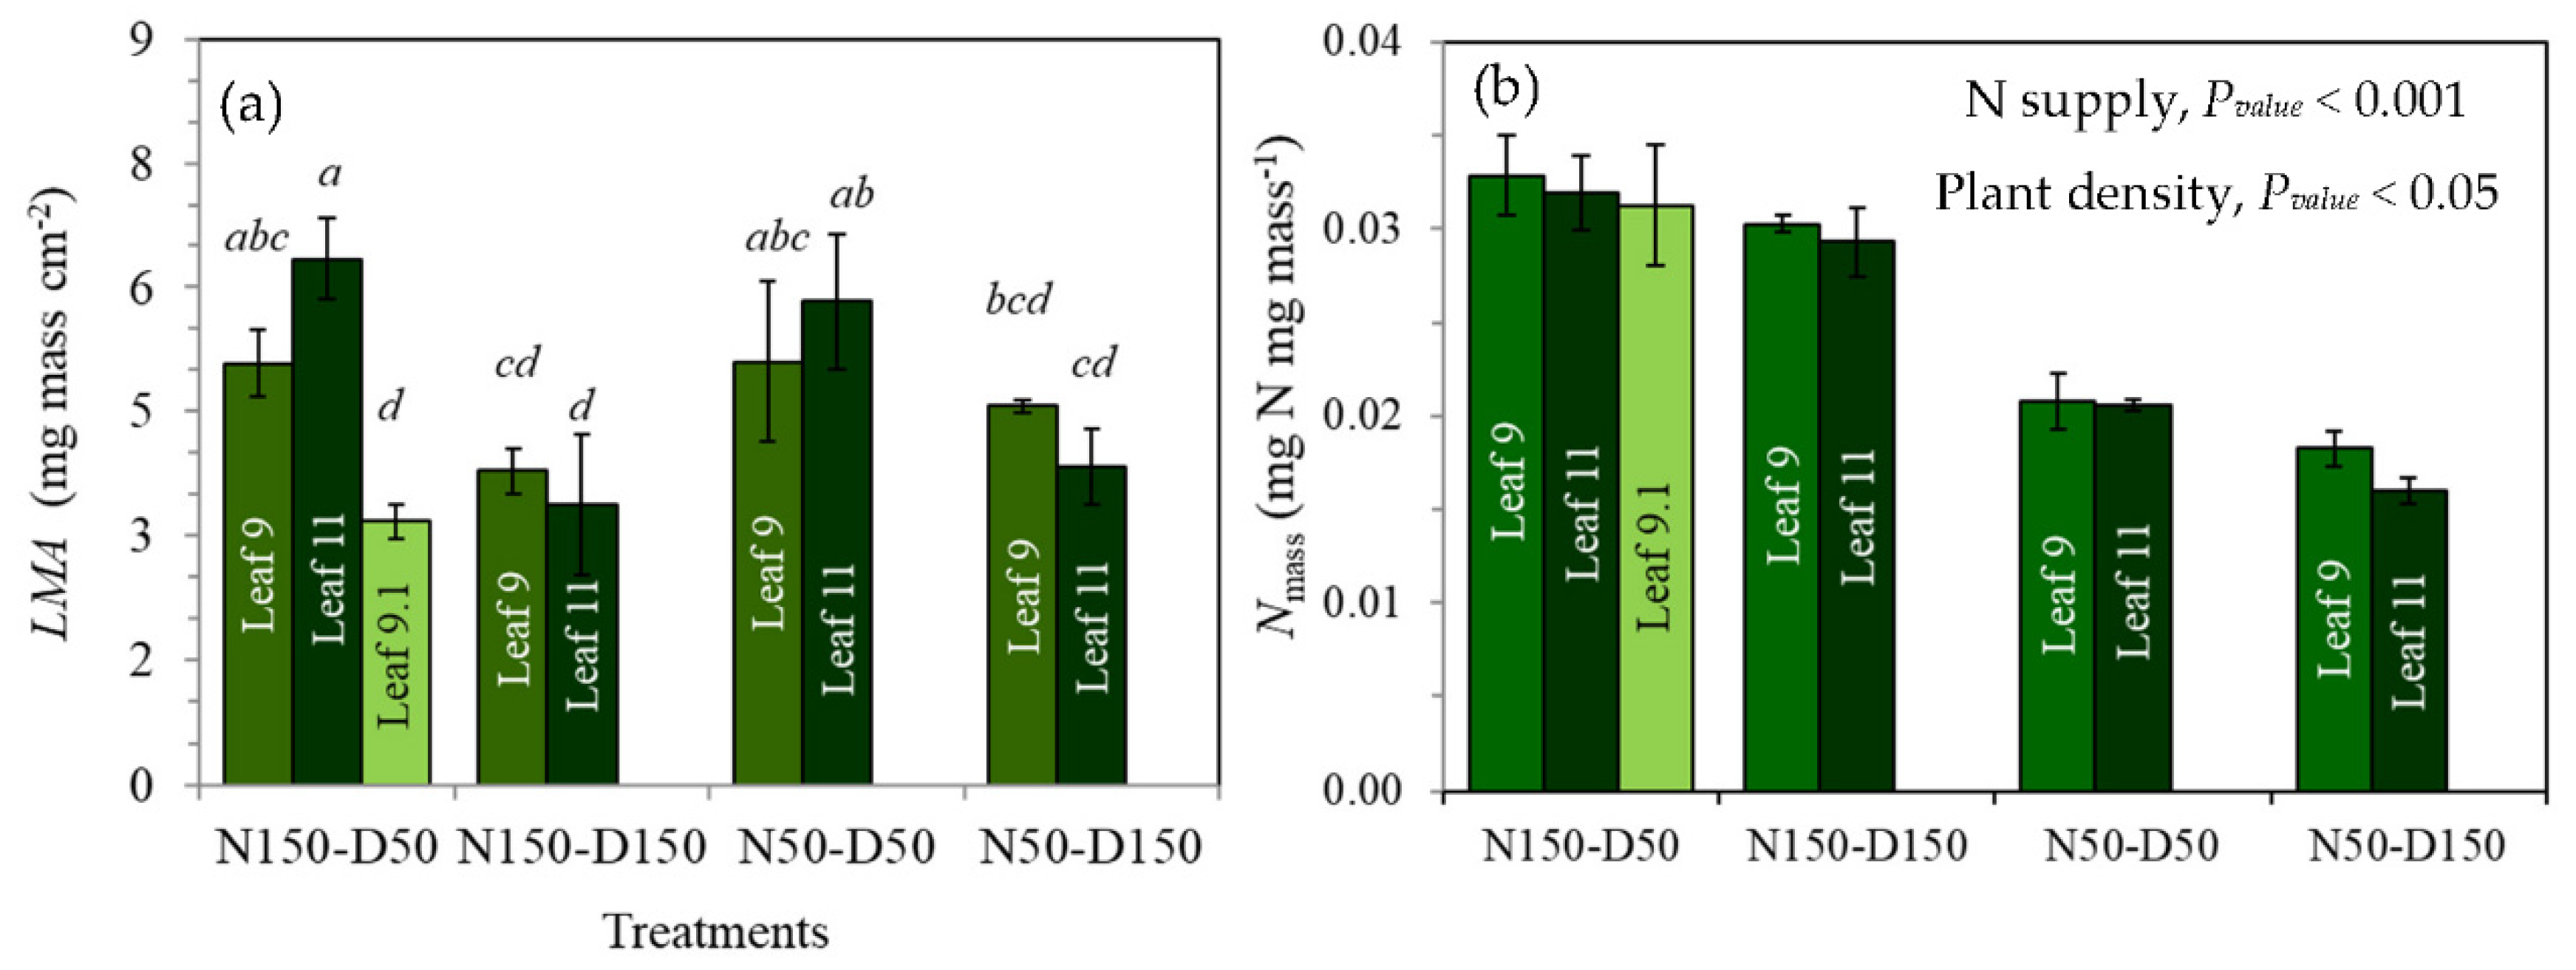
LMA was affected (p < 0.01) by the interaction among N supply, plant population density, and leaf position. Within a treatment, differences in LMA (Figure 4a) among the evaluated leaves were significant (p < 0.05) in N150-D50 where leaves 9 and 11 showed higher LMA than leaf 9.1, while the other treatments did not show differences among leaves.
Among treatments, LMA of leaf 11 was higher in treatments N150-D50 and N50-D50 than in N150-D150 and N50-D150. On the other hand, Nmass, the other physiological determinant of Narea, was analyzed considering both N and plant population density as independent factors because there was no interaction between them (Figure 4b). High N supply (N150) increased Nmass by 65% compared with the value for plants grown at low N supply (N50), while the high plant population density (D150) showed Nmass 11% lower than the low density (D50). These last results suggest that Nmass was affected by N availability per plant.
Narea was closer associated with LMA (Figure 5a) than with Nmass (Figure 5b) and showed a linear relationship depending on N supply. The intercepts of those relationships were lower at N150 than at N50; therefore, the minimum Narea was reached with smaller LMA at N150 than at N50.
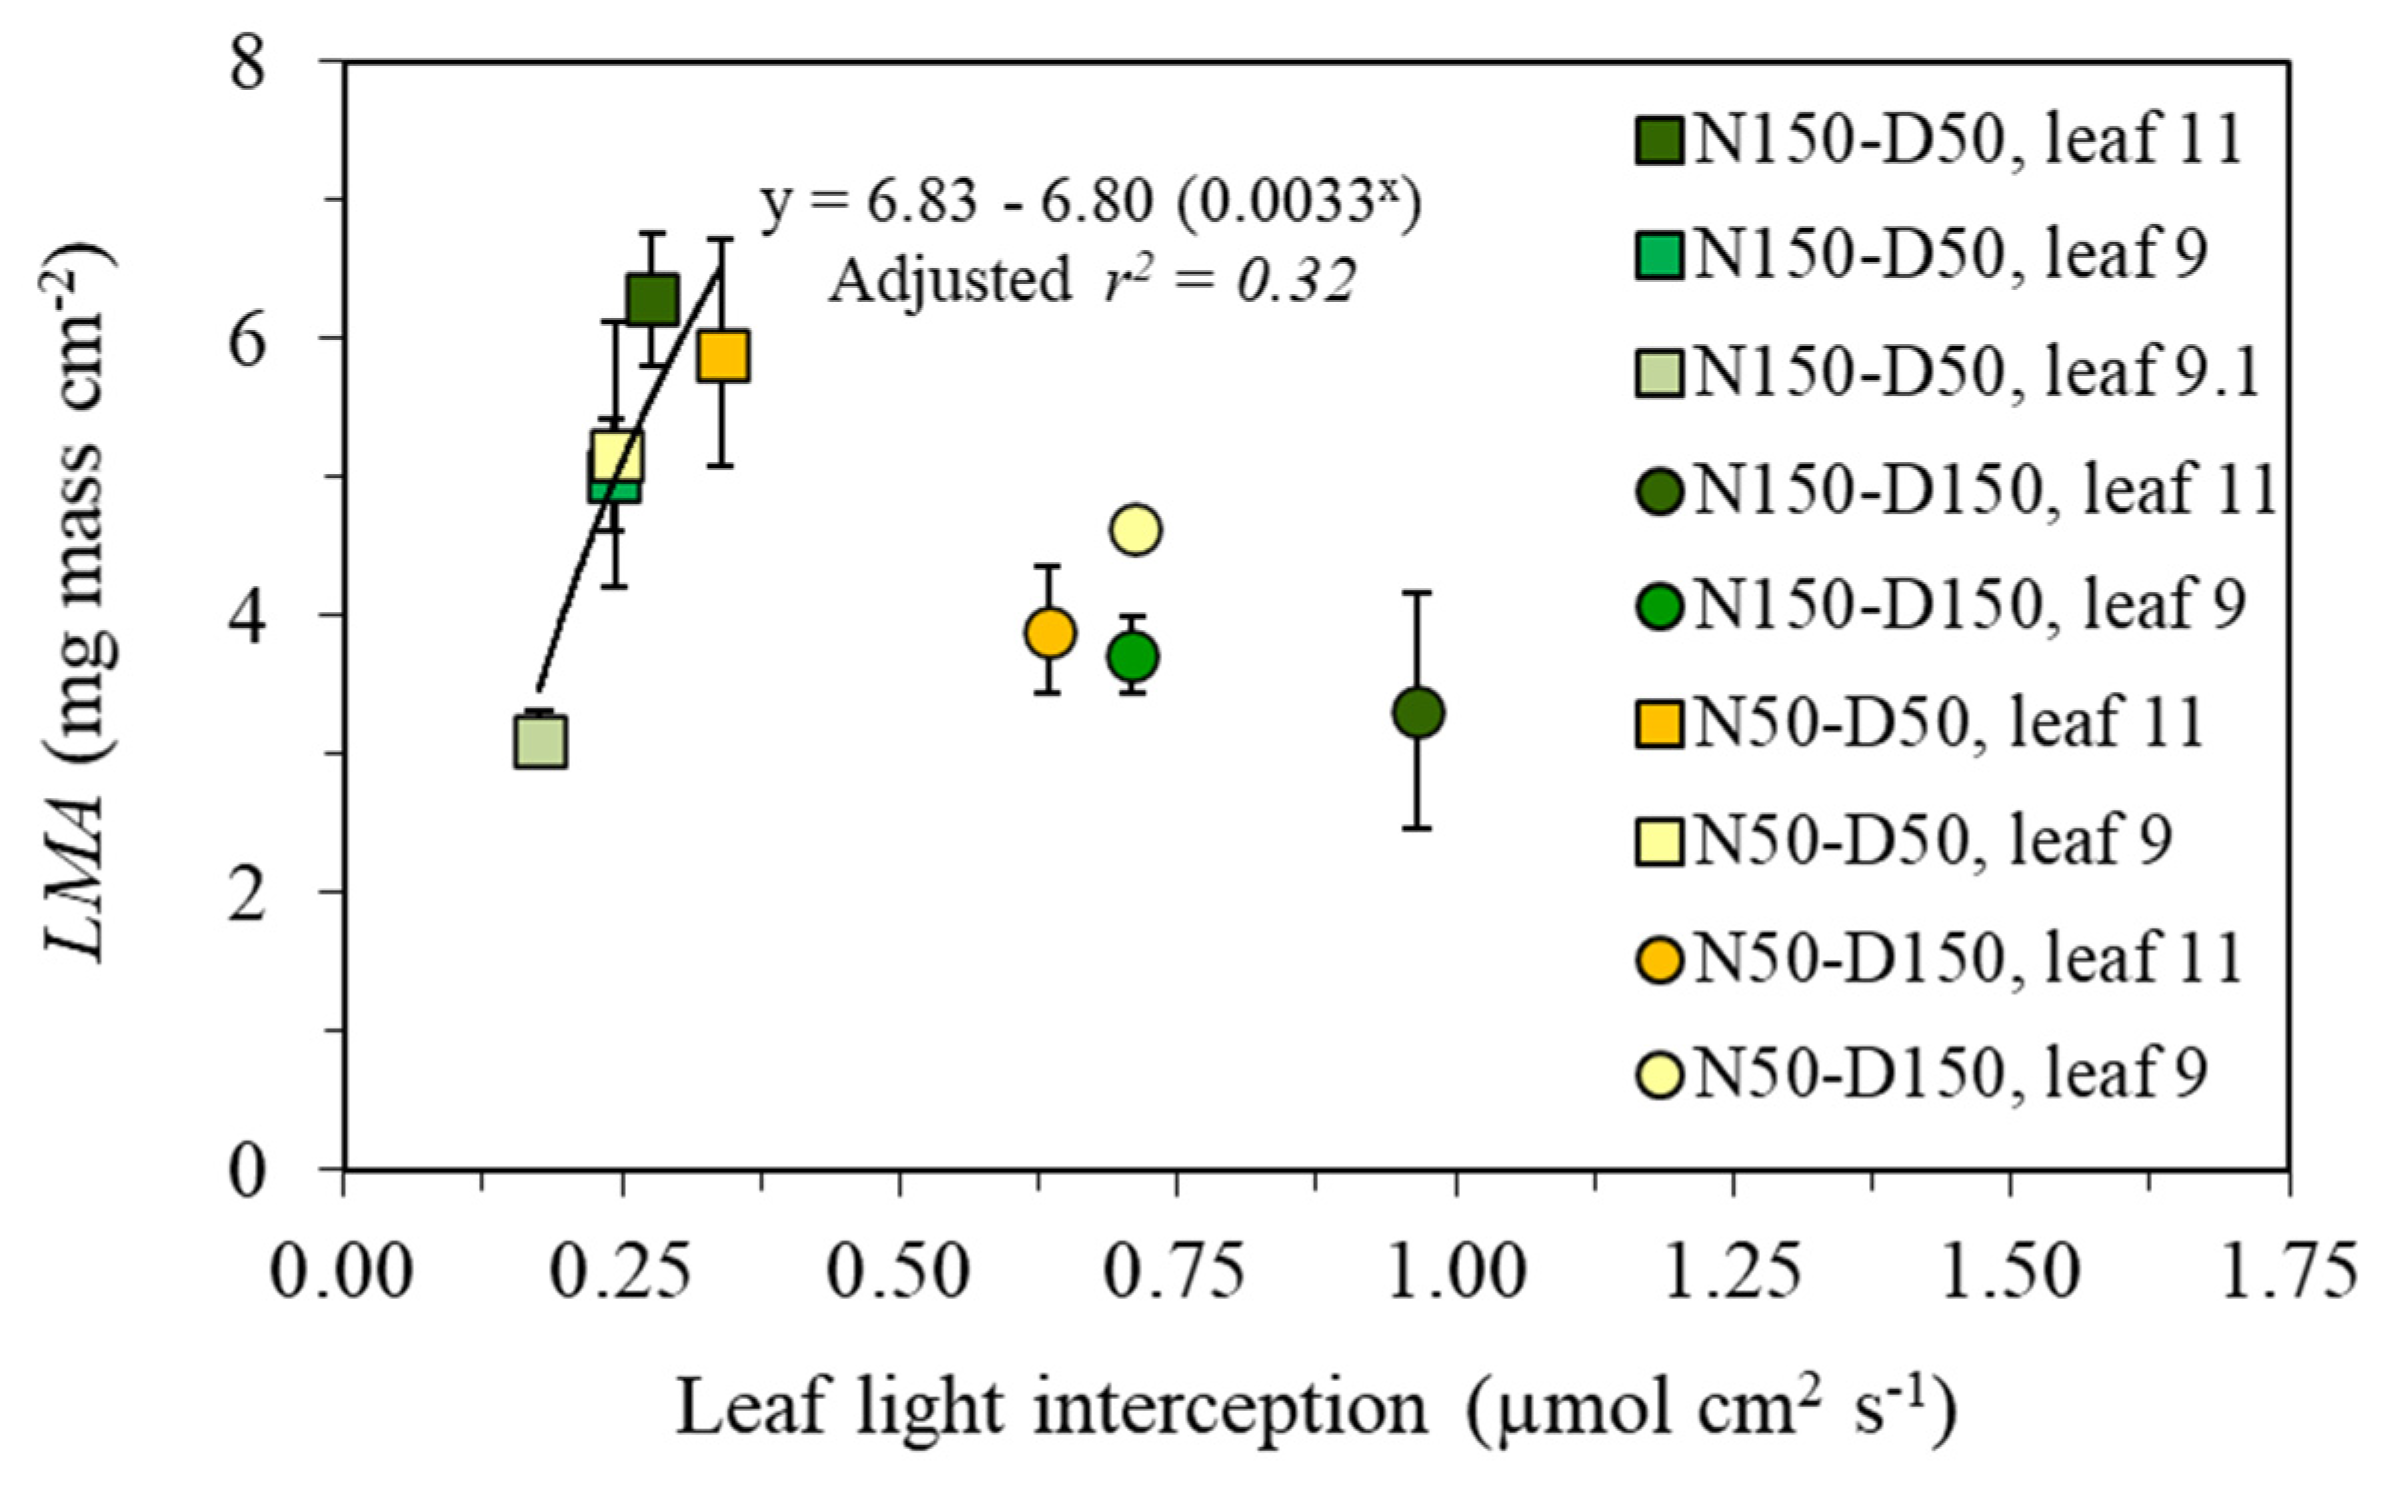
A positive relationship was observed between LMA and light interception by leaves located in a given layer for treatments grown at low plant population density (N150-D50 and N50-D50) irrespective of N supply (Figure 6) (p < 0.05). Thus, LMA was more sensitive to plant population density than to N supply. However, this trend was not valid for the high-density treatments (N150-D150 and N50-D150).
At increasing intraspecific competition, other environmental factors become limiting for leaf structure (i.e., red/far-red ratio, below-ground competition). To assess the efficiency of the N treatments, N uptake per square meter was evaluated (Figure 7a), and N uptake per square meter of N150 was two times higher than that of N50 (p < 0.01), while the interaction between N supply and plant population density was not significant (p > 0.05). At the plant level (Figure 7b), the interaction between N supply and plant population density was significant (p < 0.01) and treatment N150-D50 showed the highest (p < 0.05) N uptake per plant with 0.29 g N per plant followed by N150-D150 and N50-D50, while N50-D150 recorded the minimum N uptake with only 0.04 g N per plant.
Nitrogen partitioned to leaves in N150-D50 and N150-D150 was almost 10% higher than in N50-D50 and N50-D150, confirming that plants grown under N150 accumulated and partitioned more N to the leaves than plants grown under N50, since the latter grew under more restrictive N conditions and partitioned more N to the stem.
NO3 availability per plant decreased over time across the treatments, reaching its minimum level at around flowering (Figure 8a). From the fitted function (Equation (5)) and the values of leaf appearance (Table 2), NO3 available per plant when the evaluated leaves appeared was calculated. An asymptotic trend between Nmass and NO3 availability at the time of leaf appearance was observed (Figure 8b), while LMA was not associated with NO3 availability (data not shown).

4. Discussion

4.1. Effects at Plant Level

Both assessed factors, N supply and plant population density, affected plant growth and architecture, while the times of plant emergence, rosette formation, and beginning of flowering were not affected by the treatments. Only the interaction among N supply, plant population density, and leaf position affected leaf appearance. Low N supply reduced plant height and leaf area, while, at low density, plants were taller but developed smaller leaves than at high density. Reductions in plant height and individual leaf area in response to low N supply corroborate previous work in Triticum aestivum L. [50], Zea mays L. [51], and Gossypium hirsutum L. [52]. According to the literature [53], the interaction between N supply and plant population density influences the leaf area index, which determines the proportion of light intercepted by the canopy. It has been observed that the higher impact of N supply on leaf area is at early stages (i.e., budding stage), while the effect of plant population density is at later stages (i.e., seed filling stages) [53]. As our study focused on the phenological stage of the beginning of flowering (BBCH 62), both effects resulted as an emergent property of the interaction as a consequence of the effective availability of resources per plant.
On the other hand, an increase in plant density induces competition for solar radiation and nutrients among individuals, leading to taller plants and thinner stems (not measured in the current experiment), resulting in an increase in lodging risk [54], one of the most important problems in oilseed rape. In our study and at high N rates, the tallest plants were found at low plant density (50 plants·m−2), and not at high plant density (150 plants·m−2). These results are supported by studies performed in oilseed rape in field experiments (when comparing sowing rates of 15 vs. 45 plants·m−2) [55] and flax (Linum usitatissimum L.) [56], where increasing population density decreased plant height. This behavior is the result of an intensive intraspecies competition for resources (i.e., light or nutrients), at developmental stages when the plant requirements are higher than the resources available to satisfy such requirements, as has been demonstrated in sunflower [57] and now in oilseed rape. Thus, at conventional plant densities (e.g., 50 plants·m−2), increasing plant population density (e.g., 150 plants·m−2) leads to taller plants, but there is a critical level above which further increases in plant population density will cause a reduction in plant height, due to a shortage in resources available for plant C assimilation, causing a reduction in photoassimilates available for plant growth. Variations in leaf area in response to N supply were significant (p < 0.05) in all the evaluated leaves, while a delay in leaf appearance was evident only in the most apical leaves evaluated (i.e., leaves 11 and 9.1).
When soil N status exceeds the plant N requirements, N available in the soil is enough to satisfy the plant N demand [8]. Thus, N is absorbed, assimilated, and distributed in the plant to maximize photosynthesis [38] by means of building tissues for photosynthesis, meristematic activity, and stems [8]. However, when plant N demand exceeds N availability, N and C are mostly allocated to the roots, and shoot/root and leaf/stem ratios are reduced [8]; thus, reductions in leaf area and delays in leaf appearance are expected. The lower N uptake per square meter (Figure 7a) and the lower N leaf/stem ratio (Figure 7b) observed in treatments with low N supply, added to the later appearance of the younger leaves (leaves 11 and 9.1), coincided with the moment when N availability most likely started to become a limiting factor (Figure 8), confirming that N availability played an important role in leaf development and expansion. Because N uptake per plant was significantly affected by the interaction between N supply and plant density (Figure 7b), it is not possible to establish the individual importance of N supply and plant population density in plant N uptake. Since detached leaves were not considered as part of the evaluation, it is possible that N uptake and N redistribution were slightly underestimated.

4.2. Effects at Leaf Level

Leaf traits such as leaf thickness, palisade depth, and mesophyll cell density are summarized in a single concept: LMA [58]. In the current study, LMA showed a significant response to the interaction among N supply, plant population density, and leaf position, showing that oilseed rape plants respond to this interaction by modifying LMA, while the leaf area of individual leaves was affected by N supply and plant population density, but not by the interaction between these two factors. These results differ from studies performed in crops like soybean [15], in which LMA is mainly modified as a result of leaf light conditions, while interspecies studies [59] showed moderate responses of LMA to nutrient shortage. The same response was observed in Prunus persica [17], whereas, by contrast, Jullien et al. [60] observed in winter oilseed rape an increase in LMA grown at 200 kg·ha−1 of N supply in comparison with a higher fertilization rate (300 kg·ha−1). Discrepancies among these studies could be due to the fact that the effects of N and light on LMA are hidden by their interaction. In addition, there are differences in responses of LMA to N supply among plant species and genotypes [59,60]. Furthermore, assimilate allocation to different organs is a dynamic process that varies among phenological stages [8] and the moment of the season at which these phenological stages occur. This is important when comparing winter and spring oilseed rape or different varieties. For that reason, differences in LMA observed in spring oilseed rape during a specific phenological stage (BBCH 62) are not totally comparable with studies performed in winter oilseed rape at another phenological stage [60].
It is known that N supply has a higher impact on IPAR and LAI at early stages (i.e., budding stage), while density has the most significant impact during the seedling stage. Thus, the interaction between N supply and plant population density influences the IPAR and LAI during early and mid (i.e., seedling, budding and blossom) developmental stages [53]. Another determinant of Narea is Nmass, which was affected more by N supply than by plant population density. This is supported by a global study of relationships among leaf traits, climate, and soil nutrient fertility, where Nmass was more dependent on soil fertility than on light or other climatic factors [24], as observed in our study.
Although LMA and Nmass are both physiological determinants of Narea, this trait was more strongly associated with LMA as demonstrated in other plant species [61]; this phenomenon reflects a trade-off between the interaction between N supply and light interception with the potential for photosynthesis per unit of area (An). The An per unit of leaf area depends on Narea, with variations in the photosynthetic capacity for a given Narea among species [12]. In our work, An was strongly correlated with Narea in an asymptotical relationship (Figure 3b), as observed in a wide diversity of other crops including sunflower (Helianthus annuus L.), kenaf (Hibiscus cannabinus L.), and cynara (Cynara cardunculus L.) [48,49], but in contrast with a linear trend in Triticum aestivum L. grown in a hydroponic system [62].
In a scenario in which N supply is limiting, N availability is not able to satisfy plant N demand, because, in oilseed rape, N deficiency impacts leaf cell and tissue structure, with consequences for senescence [63], causing reductions in photosynthesis, plant height, N uptake, N partitioned toward the leaves, Nmass, and leaf area, as observed in the current study. On the other hand, the plant aims to maximize C assimilation maximizing An which is highly correlated with Narea. LMA was more sensitive to the interaction between N supply and plant population density than to N supply and plant population density independently.

4.3. Implications of the Present Results and Further Research

It is well known that the amount of N fertilizer and plant population density regulate canopy architecture and photosynthesis, affecting C accumulation and allocation between stems and reproductive organs, further influencing stem mechanical strength and final seed yield [53,64]. Although high density leads to limited growth and smaller photosynthetic area per plant, the change in LAI, IPAR, and radiation-use efficiency before flowering is the foundation of crop yield [53]. However, studies evaluating the interaction between both agronomical practices, i.e., N supply and plant density, on N distribution and leaf traits in oilseed rape or any other crop are scarce.
We show that the interaction between N supply and plant population density played a major role in altering N per unit of area (Narea), which is the main determinant of photosynthesis (An). This interaction also affects LMA, while N supply determines N content per unit leaf mass (Nmass). These results suggest that the interaction between N supply and plant population density has significant effects on both N distribution and leaf mass per area, which, together with the effects on plant height, could have important implications for light distribution and, therefore, for C assimilation at the plant level. In addition to the effects on N distribution and leaf traits, N supply and plant population density have been related to stem branching patterns in Arabidopsis, potato, and maize, which shape overall plant architecture [65,66,67]. We hypothesize that N availability interacting with light interception determines N distribution and defines stem branching patterns at the phytomer and plant level. To test this hypothesis, further studies are required, taking into account that N and C fluxes are dynamic processes [8,68,69], whereas the interaction among environmental factors and plant architecture should be addressed and scaled up from leaf to biological organizational levels relevant for ecophysiology and agronomy (i.e., population level).

Supplementary Materials

The following are available online at https://www.mdpi.com/2073-4395/10/11/1780/s1, File S1.

Author Contributions

Conceptualization, M.H.L., P.C.S., and D.F.C.; data curation, J.B.E.; formal analysis, M.H.L.; methodology, M.H.L., P.C.S., D.F.C., and J.B.E.; supervision, P.C.S., D.F.C., and J.B.E.; writing—original draft, M.H.L.; writing—review and editing, P.C.S., D.F.C., and J.B.E. All authors have read and agreed to the published version of the manuscript.

Funding

This research was funded by Fondo Nacional de Desarrollo Científico y Tecnológico, Comisión Nacional de Investigación Científica y Tecnológica (CONICYT).

Acknowledgments

We thank Olaf Sass (NPZ-Lembke, Germany) and Erik von Baer (Semillas Baer, Chile) for kindly providing the rapeseed for this experiment, Peter van der Putten, Jeroen de Bruijn, and Georgios Angelopoulus for their technical assistance during the experiment, and Jorad de Vries for the model used to make the schematic illustration (Figure 1). M.H.L. held a postgraduate scholarship from CONICYT (Chilean National Commission for Scientific and Technological Research).

Conflicts of Interest

The authors declare no conflict of interest.

References

  1. Khoury, C.K.; Bjorkman, A.D.; Dempewolf, H.; Ramirez-Villegas, J.; Guarino, L.; Jarvis, A.; Rieseberg, L.H.; Struik, P.C. Increasing homogeneity in global food supplies and the implications for food security. Proc. Natl. Acad. Sci. USA 2014, 111, 4001–4006. [Google Scholar] [CrossRef] [PubMed] [Green Version]
  2. Momoh, E.J.; Song, W.J.; Li, H.Z.; Zhou, W.J. Seed yield and quality responses of winter oilseed rape (Brassica napus) to plant density and nitrogen fertilization. Indian J. Agric. Sci. 2004, 74, 420–424. [Google Scholar]
  3. Rondanini, D.P.; Gomez, N.V.; Agosti, M.B.; Miralles, D.J. Global trends of rapeseed grain yield stability and rapeseed-to-wheat yield ratio in the last four decades. Eur. J. Agron. 2012, 37, 56–65. [Google Scholar] [CrossRef]
  4. FAOSTAT. Crop production. Food and Agriculture Organization of the United Nations, Statistics Division. Available online: http://www.fao.org/faostat/en/#data/QC (accessed on 29 February 2020).
  5. Dawson, J.C.; Huggins, D.R.; Jones, S.S. Characterizing nitrogen use efficiency in natural and agricultural ecosystems to improve the performance of cereal crops in low-input and organic agricultural systems. Field Crops Res. 2008, 107, 89–101. [Google Scholar] [CrossRef]
  6. Hirel, B.; Le Gouis, J.; Ney, B.; Gallais, A. The challenge of improving nitrogen use efficiency in crop plants: Towards a more central role for genetic variability and quantitative genetics within integrated approaches. J. Exp. Bot. 2007, 58, 2369–2387. [Google Scholar] [CrossRef] [PubMed]
  7. Stahl, A.; Vollrath, P.; Samans, B.; Frisch, M.; Wittkop, B.; Snowdon, R.J. Effect of breeding on nitrogen use efficiency-associated traits in oilseed rape. J. Exp. Bot. 2019, 70, 1969–1986. [Google Scholar] [CrossRef] [PubMed] [Green Version]
  8. Gastal, F.; Lemaire, G.; Durand, J.L.; Louarn, G. Quantifying crop responses to nitrogen and avenues to improve nitrogen-use efficiency. In Crop Physiology—Applications for Genetic Improvement and Agronomy, 2nd ed.; Sadras, V.O., Calderini, D., Eds.; Elsevier: Amsterdam, The Netherlands, 2015; pp. 161–206. [Google Scholar]
  9. Roques, S.E.; Berry, P.M. The yield response of oilseed rape to plant population density. J. Agric. Sci. 2016, 154, 305–320. [Google Scholar] [CrossRef]
  10. Seepaul, R.; George, S.; Wright, D.L. Comparative response of Brassica carinata and B-napus vegetative growth, development and photosynthesis to nitrogen nutrition. Ind. Crop. Prod. 2016, 94, 872–883. [Google Scholar] [CrossRef]
  11. Hikosaka, K. Interspecific difference in the photosynthesis-nitrogen relationship: Patterns, physiological causes, and ecological importance. J. Plant Res. 2004, 117, 481–494. [Google Scholar] [CrossRef]
  12. Evans, J.R. Photosynthesis and nitrogen relationships in leaves of C-3 plants. Oecologia 1989, 78, 9–19. [Google Scholar] [CrossRef]
  13. Bloomfield, K.J.; Farquhar, G.D.; Lloyd, J. Photosynthesis-nitrogen relationships in tropical forest tree species as affected by soil phosphorus availability: A controlled environment study. Funct. Plant Biol. 2014, 41, 820–832. [Google Scholar] [CrossRef] [PubMed]
  14. Lambers, H.; Poorter, H. Inherent variation in growth-rate between higher-plants—A search for physiological causes and ecological consequences. Adv. Ecol. Res. 1992, 23, 187–261. [Google Scholar] [CrossRef]
  15. Gan, Y.; Stulen, I.; Van Keulen, H.; Kuiper, P. Physiological response of soybean genotypes to plant density. Field Crop. Res. 2002, 74, 231–241. [Google Scholar] [CrossRef]
  16. Gammelvind, L.H.; Schjoerring, J.K.; Mogensen, V.O.; Jensen, C.R.; Bock, J.G.H. Photosynthesis in leaves and siliques of winter oilseed rape (Brassica napus L.). Plant Soil 1996, 186, 227–236. [Google Scholar] [CrossRef]
  17. DeJong, T.M.; Day, K.R.; Johnson, R.S. Partitioning of leaf nitrogen with respect to within canopy light exposure and nitrogen availability in peach (Prunus persica). Trees 1989, 3, 89–95. [Google Scholar] [CrossRef]
  18. Amanullah, M.J.H.; Nawab, K.; Ali, A. Response of specific leaf area (SLA), leaf area index (LAI) and leaf area ratio (LAR) of maize (Zea mays L.) to plant density, rate and timing of nitrogen application. World Appl. Sci. J. 2007, 2, 235–243. [Google Scholar]
  19. Stenger, R.; Priesack, E.; Beese, F. Spatial variation of nitrate-N and related soil properties at the plot-scale. Geoderma 2002, 105, 259–275. [Google Scholar] [CrossRef]
  20. Werger, M.J.A.; Hirose, T. Leaf Nitrogen Distribution and Whole Canopy Photosynthetic Carbon Gain in Herbaceous Stands. Vegetatio 1991, 97, 11–20. [Google Scholar]
  21. Hikosaka, K.; Terashima, I.; Katoh, S. Effects of leaf age, nitrogen nutrition and photon flux-density on the distribution of nitrogen among leaves of a vine (Ipomoea tricolor Cav) grown horizontally to avoid mutual shading of leaves. Oecologia 1994, 97, 451–457. [Google Scholar] [CrossRef]
  22. Anten, N.P.R.; Miyazawa, K.; Hikosaka, K.; Nagashima, H.; Hirose, T. Leaf nitrogen distribution in relation to leaf age and photon flux density in dominant and subordinate plants in dense stands of a dicotyledonous herb. Oecologia 1998, 113, 314–324. [Google Scholar] [CrossRef]
  23. Anten, N.P.R.; Schieving, F.; Werger, M.J.A. Patterns of light and nitrogen distribution in relation to whole canopy carbon gain in C-3 and C-4 monocotyledonous and dicotyledonous species. Oecologia 1995, 101, 504–513. [Google Scholar] [CrossRef] [PubMed]
  24. Ordonez, J.C.; van Bodegom, P.M.; Witte, J.P.M.; Wright, I.J.; Reich, P.B.; Aerts, R. A global study of relationships between leaf traits, climate and soil measures of nutrient fertility. Glob. Ecol. Biogeogr. 2009, 18, 137–149. [Google Scholar] [CrossRef]
  25. Connor, D.J.; Hall, A.J.; Sadras, V.O. Effect of Nitrogen-Content on the Photosynthetic Characteristics of Sunflower Leaves. Funct. Plant Biol. 1993, 20, 251–263. [Google Scholar] [CrossRef]
  26. Connor, D.J.; Sadras, V.O.; Hall, A.J. Canopy Nitrogen Distribution and the Photosynthetic Performance of Sunflower Crops during Grain Filling—A Quantitative-Analysis. Oecologia 1995, 101, 274–281. [Google Scholar] [CrossRef] [PubMed]
  27. Aerts, R.; Chapin, F.S. The mineral nutrition of wild plants revisited: A re-evaluation of processes and patterns. Adv. Ecol. Res. 2000, 30, 1–67. [Google Scholar]
  28. Al-Barzinjy, M.; Stolen, O.; Christiansen, J.L. Comparison of growth, pod distribution and canopy structure of old and new cultivars of oilseed rape (Brassica napus L.). Acta Agric. Scand. Sect. B Plant Soil Sci. 2003, 53, 138–146. [Google Scholar] [CrossRef]
  29. Dreccer, M.F.; Schapendonk, A.H.C.M.; van Oijen, M.; Pot, C.S.; Rabbinge, R. Radiation and nitrogen use at the leaf and canopy level by wheat and oilseed rape during the critical period for grain number definition. Aust. J. Plant Physiol. 2000, 27, 899–910. [Google Scholar] [CrossRef]
  30. Kirkegaard, J.A.; Lilley, J.M.; Brill, R.D.; Ware, A.H.; Walela, C.K. The critical period for yield and quality determination in canola (Brassica napus L.). Field Crop. Res. 2018, 222, 180–188. [Google Scholar] [CrossRef]
  31. Dreccer, M.F.; Schapendonk, A.H.C.M.; Slafer, G.A.; Rabbinge, R. Comparative response of wheat and oilseed rape to nitrogen supply: Absorption and utilisation efficiency of radiation and nitrogen during the reproductive stages determining yield. Plant Soil 2000, 220, 189–205. [Google Scholar] [CrossRef]
  32. Evers, J.B.; Vos, J.; Andrieu, B.; Struik, P.C. Cessation of tillering in spring wheat in relation to light interception and red: Far-red ratio. Ann. Bot. 2006, 97, 649–658. [Google Scholar] [CrossRef] [Green Version]
  33. Lyons, G.H.; Genc, Y.; Soole, K.; Stangoulis, J.C.R.; Liu, F.; Graham, R.D. Selenium increases seed production in Brassica. Plant Soil 2009, 318, 73–80. [Google Scholar] [CrossRef]
  34. Retuerto, R.; Rochefort, L.; Woodward, F.I. The influence of plant density on the responses of Sinapis alba to CO2 and windspeed. Oecologia 1996, 108, 241–251. [Google Scholar] [CrossRef] [PubMed]
  35. Meier, U. Growth Stages of Mono-and Dicotyledonous Plants. BBCH Monograph; Federal Biological Research Centre for Agriculture and Forestry, Ed.; Wissenschafts-Verlag: Berlin, Germany, 2001; 158p. [Google Scholar]
  36. Kirkegaard, J.A.; Sprague, S.J.; Lilley, J.M.; Mc Cormick, J.I.; Virgona, J.M.; Morrison, M.J. Physiological response of spring canola (Brassica napus) to defoliation in diverse environments. Field Crop. Res. 2012, 125, 61–68. [Google Scholar] [CrossRef]
  37. Bailey, L.H.; Bailey, E.Z. Hortus Third: A Concise Dictionary of Plants Cultivated in the United States and Canada; Macmillan: New York, NY, USA, 1976. [Google Scholar]
  38. Monsi, M.; Saeki, T. On the factor light in plant communities and its importance for matter production. Ann. Bot. 2005, 95, 549–567. [Google Scholar] [CrossRef] [PubMed] [Green Version]
  39. Monteith, J.L. Principles of environmental physics. Int. J. Environ. Stud. 1973, 5, 154–155. [Google Scholar]
  40. Miller, A.J.; Cramer, M.D. Root nitrogen acquisition and assimilation. Plant Soil 2005, 274, 1–36. [Google Scholar] [CrossRef]
  41. Arkoun, M.; Sarda, X.; Jannin, L.; Laine, P.; Etienne, P.; Garcia-Mina, J.M.; Yvin, J.C.; Ourry, A. Hydroponics versus field lysimeter studies of urea, ammonium and nitrate uptake by oilseed rape (Brassica napus L.). J. Exp. Bot. 2012, 63, 5245–5258. [Google Scholar] [CrossRef]
  42. Laine, P.; Ourry, A.; Boucaud, J. Shoot control of nitrate uptake rates by roots of Brassica napus L. Effects of localized nitrate supply. Planta 1995, 196, 77–83. [Google Scholar] [CrossRef]
  43. Li, S.X.; Wang, Z.H.; Stewart, B.A. Responses of crop plants to ammonium and nitrate N. Adv. Agron. 2013, 118, 205–397. [Google Scholar] [CrossRef]
  44. Houba, V.J.G.; Temminghoff, E.J.M.; Gaikhorst, G.A.; van Vark, W. Soil analysis procedures using 0.01 M calcium chloride as extraction reagent. Commun. Soil Sci. Plant Anal. 2000, 31, 1299–1396. [Google Scholar] [CrossRef]
  45. Payne, R.W.; Murray, D.A.; Harding, S.A.; Baird, D.B.; Soutar, D.M. An Introduction to GenStat for Windows, 14th ed.; VSN International: Hemel Hempstead, UK, 2011. [Google Scholar]
  46. Zhang, S.; Zhi, H.; Li, W.; Shan, J.; Tang, C.; Jia, G.; Tang, S.; Diao, X. SiYGL2 Is Involved in the Regulation of Leaf Senescence and Photosystem II Efficiency in Setaria italica (L.) P. Beauv. Front. Plant Sci. 2018, 9. [Google Scholar] [CrossRef]
  47. Gan, S.; Amasino, R.M. Making Sense of Senescence (Molecular Genetic Regulation and Manipulation of Leaf Senescence). Plant Physiol. 1997, 113, 313–319. [Google Scholar] [CrossRef] [PubMed] [Green Version]
  48. Archontoulis, S.V.; Yin, X.; Vos, J.; Danalatos, N.G.; Struik, P.C. Leaf photosynthesis and respiration of three bioenergy crops in relation to temperature and leaf nitrogen: How conserved are biochemical model parameters among crop species? J. Exp. Bot. 2012, 63, 895–911. [Google Scholar] [CrossRef] [PubMed] [Green Version]
  49. Trapani, N.; Hall, A.J. Effects of leaf position and nitrogen supply on the expansion of leaves of field grown sunflower (Helianthus annuus L.). Plant Soil 1996, 184, 331–340. [Google Scholar] [CrossRef]
  50. Reddy, M.R.; Prasad, R. Effect of nitrogen doses and row direction on LAI, light transmission, plant height and dry-matter production of wheat cultivars grown in pure and mixed stands. Biol. Plant. 1979, 21, 85–91. [Google Scholar] [CrossRef]
  51. Yin, X.H.; Hayes, R.M.; Mc Clure, M.A.; Savoy, H.J. Assessment of plant biomass and nitrogen nutrition with plant height in early-to mid-season corn. J. Sci. Food Agric. 2012, 92, 2611–2617. [Google Scholar] [CrossRef] [PubMed]
  52. Muharam, F.M.; Bronson, K.F.; Maas, S.J.; Ritchie, G.L. Inter-relationships of cotton plant height, canopy width, ground cover and plant nitrogen status indicators. Field Crop. Res. 2014, 169, 58–69. [Google Scholar] [CrossRef] [Green Version]
  53. Kuai, J.; Sun, Y.Y.; Zhou, M.; Zhang, P.P.; Zuo, Q.S.; Wu, J.S.; Zhou, G.S. The effect of nitrogen application and planting density on the radiation use efficiency and the stem lignin metabolism in rapeseed (Brassica napus L.). Field Crop. Res. 2016, 199, 89–98. [Google Scholar] [CrossRef]
  54. Xue, J.; Gou, L.; Zhao, Y.S.; Yao, M.N.; Yao, H.S.; Tian, J.S.; Zhang, W.F. Effects of light intensity within the canopy on maize lodging. Field Crop. Res. 2016, 188, 133–141. [Google Scholar] [CrossRef]
  55. Li, Y.S.; Yu, C.B.; Zhu, S.; Xie, L.H.; Hu, X.J.; Liao, X.; Liao, X.S.; Che, Z. High planting density benefits to mechanized harvest and nitrogen application rates of oilseed rape (Brassica napus L.). Soil Sci. Plant Nutr. 2014, 60, 384–392. [Google Scholar] [CrossRef]
  56. Lafond, G.P. The Effects of Nitrogen, Row Spacing and Seeding Rate on the Yield of Flax under a Zero-Till Production System. Can. J. Plant Sci. 1993, 73, 375–382. [Google Scholar] [CrossRef] [Green Version]
  57. Xiao, S.; Chen, S.Y.; Zhao, L.Q.; Wang, G. Density effects on plant height growth and inequality in sunflower populations. J. Integr. Plant Biol. 2006, 48, 513–519. [Google Scholar] [CrossRef]
  58. Thompson, W.A.; Kriedemann, P.E.; Craig, I.E. Photosynthetic response to light and nutrients in sun-tolerant and shade-tolerant rain-forest trees.1. Growth, leaf anatomy and nutrient content. Funct. Plant Biol. 1992, 19, 1–18. [Google Scholar] [CrossRef]
  59. Poorter, H.; Niinemets, U.; Poorter, L.; Wright, I.J.; Villar, R. Causes and consequences of variation in leaf mass per area (LMA): A meta-analysis. New Phytol. 2009, 182, 565–588. [Google Scholar] [CrossRef] [PubMed]
  60. Jullien, A.; Allirand, J.M.; Mathieu, A.; Andrieu, B.; Ney, B. Variations in leaf mass per area according to N nutrition, plant age, and leaf position reflect ontogenetic plasticity in winter oilseed rape (Brassica napus L.). Field Crop. Res. 2009, 114, 188–197. [Google Scholar] [CrossRef]
  61. Wright, I.J.; Groom, P.K.; Lamont, B.B.; Poot, P.; Prior, L.D.; Reich, P.B.; Schulze, E.D.; Veneklaas, E.J.; Westoby, M. Shorth communication: Leaf trait relationships in Australian plant species. Funct. Plant Biol. 2004, 31, 551–558. [Google Scholar] [CrossRef] [PubMed]
  62. Dreccer, M.F.; Van Oijen, M.; Schapendonk, A.H.C.M.; Pot, C.S.; Rabbinge, R. Dynamics of vertical leaf nitrogen distribution in a vegetative wheat canopy. Impact on canopy photosynthesis. Ann. Bot. 2000, 86, 821–831. [Google Scholar] [CrossRef] [Green Version]
  63. Sorin, C.; Leport, L.; Cambert, M.; Bouchereau, A.; Mariette, F.; Musse, M. Nitrogen deficiency impacts on leaf cell and tissue structure with consequences for senescence associated processes in Brassica napus. Bot. Stud. 2016, 57, 11. [Google Scholar] [CrossRef] [PubMed] [Green Version]
  64. Dordas, C. Dry matter, nitrogen and phosphorus accumulation, partitioning and remobilization as affected by N and P fertilization and source-sink relations. Eur. J. Agron. 2009, 30, 129–139. [Google Scholar] [CrossRef]
  65. de Jong, M.; George, G.; Ongaro, V.; Williamson, L.; Willetts, B.; Ljung, K.; McCulloch, H.; Leyser, O. Auxin and strigolactone signaling are required for modulation of Arabidopsis shoot branching by nitrogen supply. Plant Physiol. 2014, 166, 384–395. [Google Scholar] [CrossRef] [Green Version]
  66. Postma, J.A.; Dathe, A.; Lynch, J.P. The optimal lateral root branching density for maize depends on nitrogen and phosphorus availability. Plant Physiol. 2014, 166, 590–602. [Google Scholar] [CrossRef] [PubMed] [Green Version]
  67. Vos, J. The effects of nitrogen supply and stem density on leaf attributes and stem branching in potato (Solanum tuberosum L.). Potato Res. 1995, 38, 271–279. [Google Scholar] [CrossRef]
  68. Gombert, J.; Le Dily, F.; Lothier, J.; Etienne, P.; Rossato, L.; Allirand, J.M.; Jullien, A.; Savin, A.; Ourry, A. Effect of nitrogen fertilization on nitrogen dynamics in oilseed rape using N-15-labeling field experiment. J. Plant Nutr. Soil Sci. 2010, 173, 875–884. [Google Scholar] [CrossRef]
  69. Malagoli, P.; Laine, P.; Rossato, L.; Ourry, A. Dynamics of nitrogen uptake and mobilization in field-grown winter oilseed rape (Brassica napus) from stem extension to harvest. II. An N-15-labelling-based simulation model of N partitioning between vegetative and reproductive tissues. Ann. Bot. 2005, 95, 1187–1198. [Google Scholar] [CrossRef] [PubMed] [Green Version]
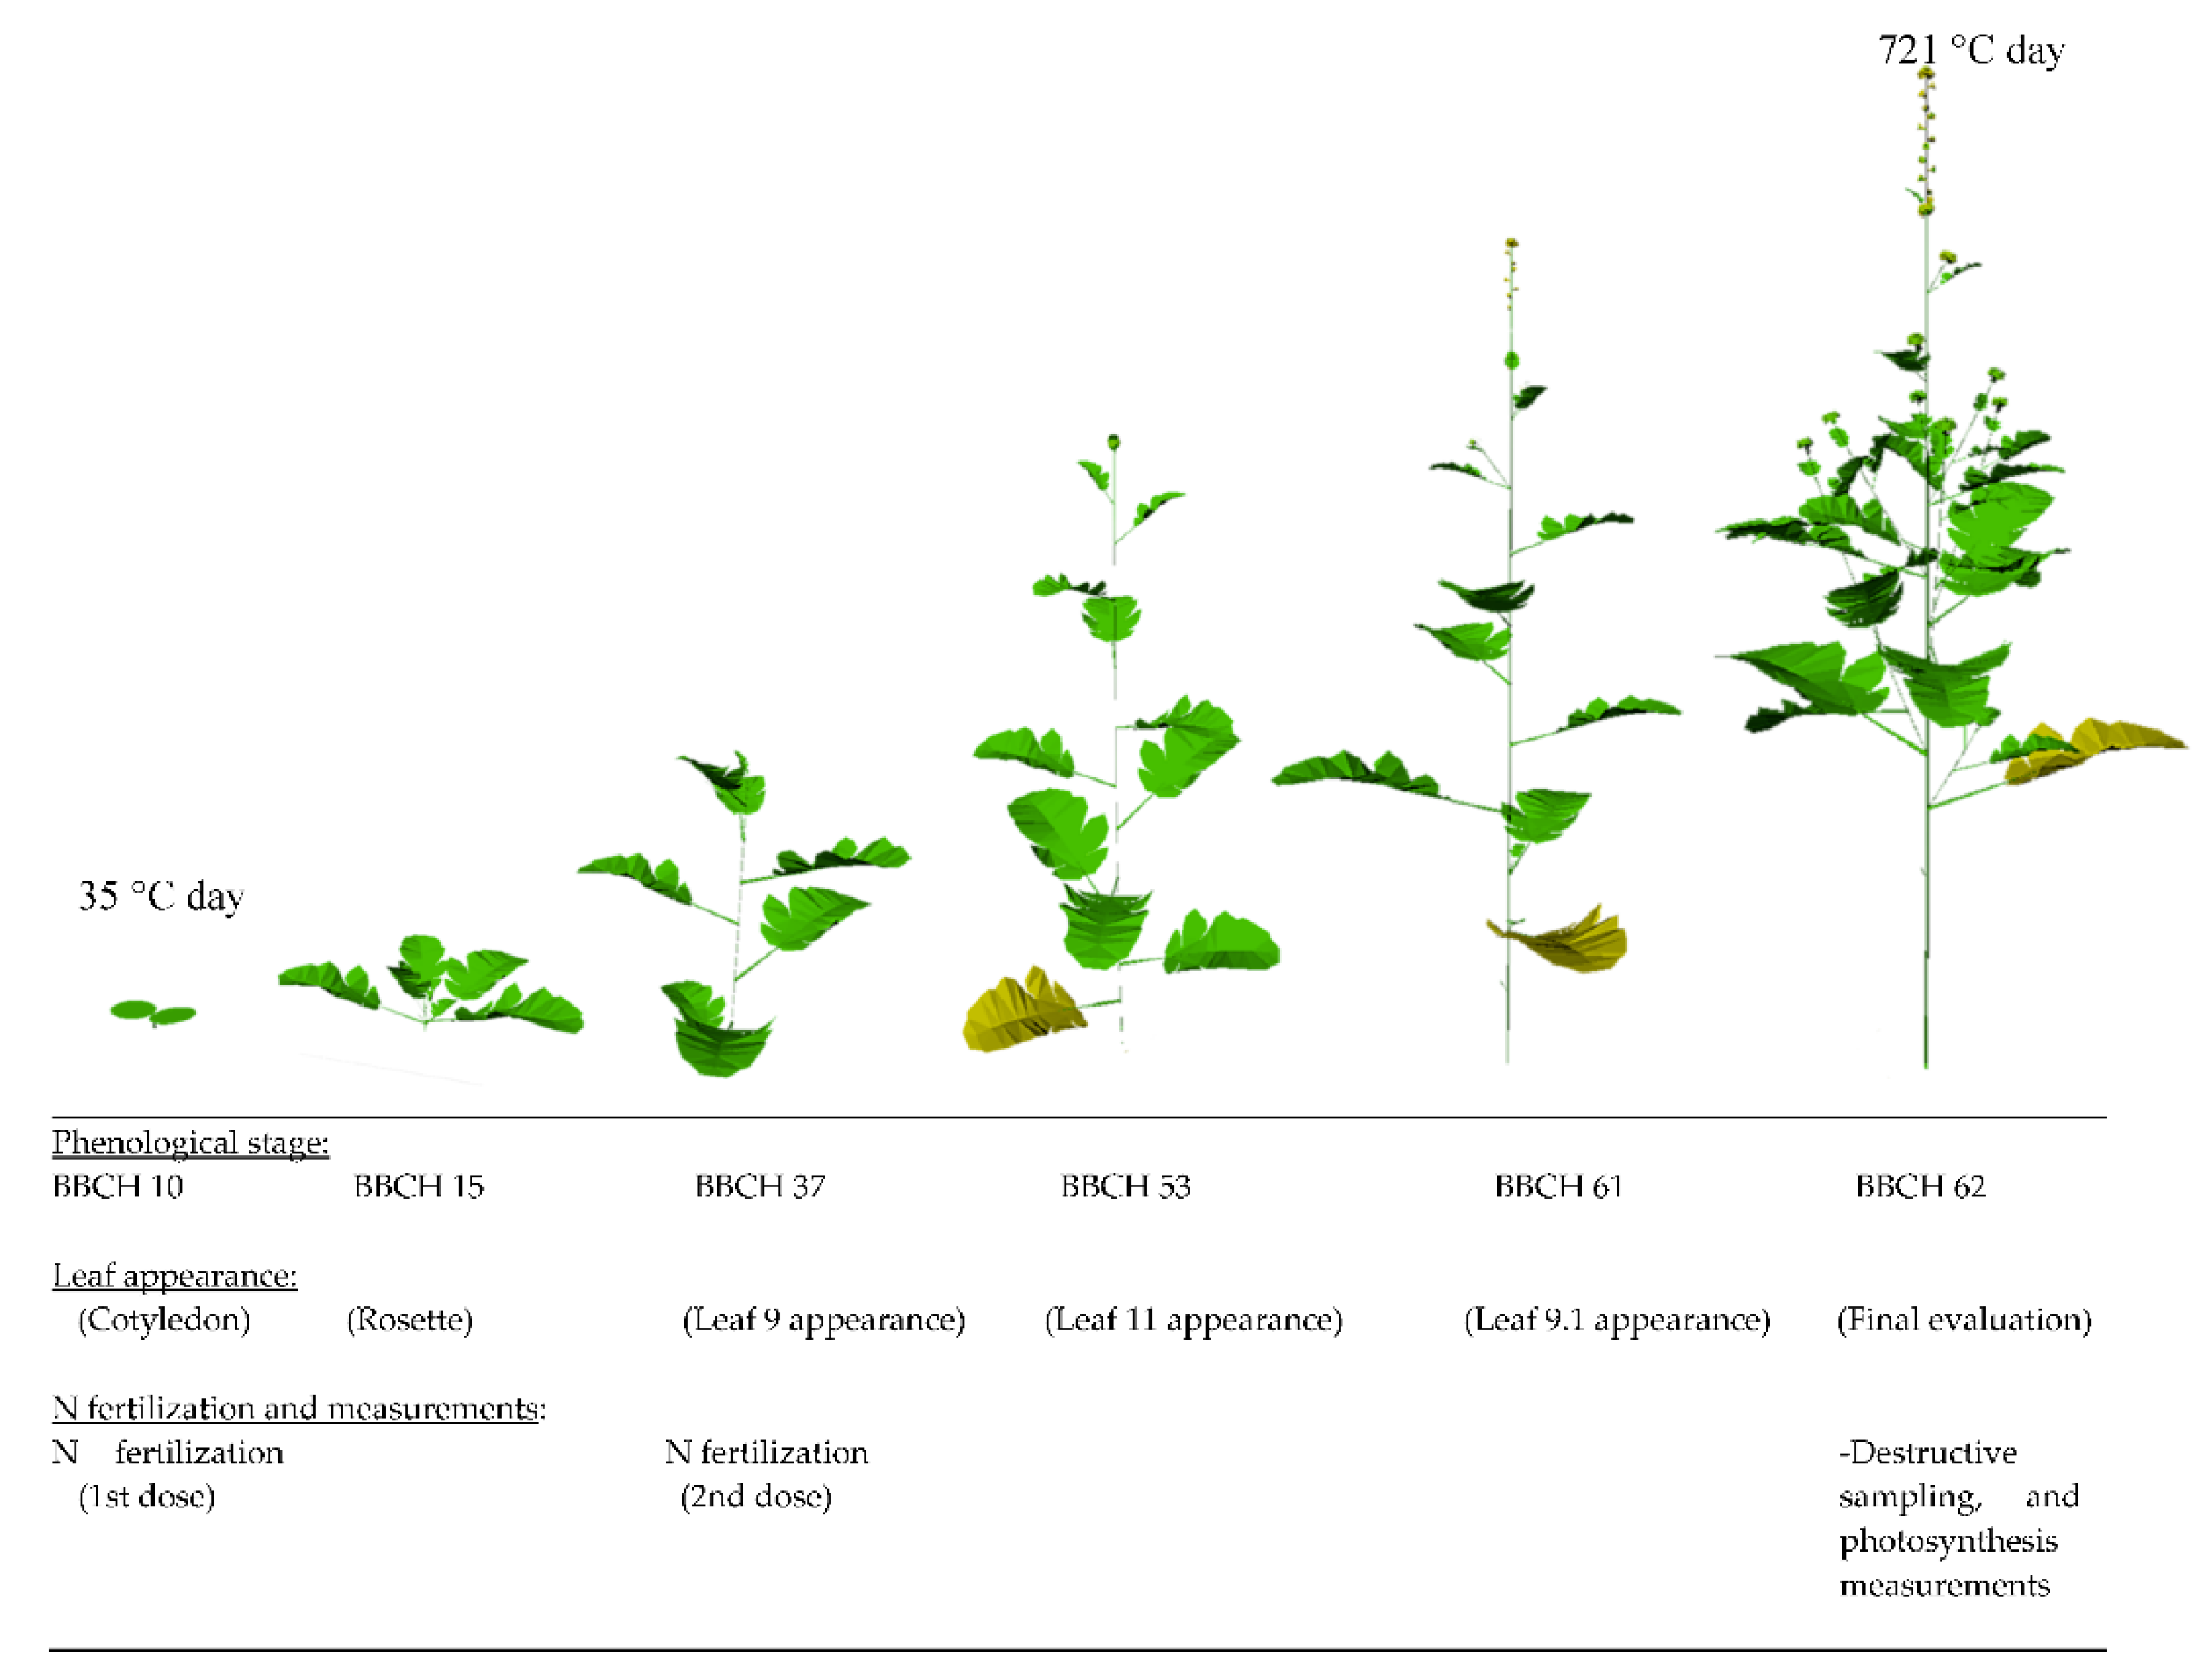
Figure 1. Schematic diagram of oilseed rape developmental stages, leaf appearance, moment of N fertilization, and measurements.
Agronomy 10 01780 g001
Figure 2. (a) Plant height in response to N supply and plant density. Vertical bars indicate the standard error of means. (b) Leaf area for each phytomer rank (includes main stem and branch leaf area) at Biologische Bundesanstalt, Bundessortenamt and Chemical industry (BBCH) 62 in response to N supply and plant population density. Horizontal bars indicate the standard error of means.
Agronomy 10 01780 g002
Figure 3. (a) Leaf N content per area (Narea) of leaves at different phytomer ranks in response to N supply and plant density. (b) Light-saturated photosynthesis (An) (Iinc = 1500 µmol·m−2·s−1; CO2 = 390 µmol·mol−1) in relation to Narea at 7 days before flowering (BBCH 62). Different letters indicate significant differences across treatments (p < 0.05), and vertical bars indicate the standard error of means.
Agronomy 10 01780 g003
Figure 4. (a) Leaf mass per unit of area (LMA) and (b) N content per unit of mass (Nmass), of leaves at different phytomer ranks in response to N supply and plant population density at 7 days before flowering (BBCH 62). Different letters indicate significant differences across treatments (p < 0.05), and vertical bars indicate the standard error of means.
Agronomy 10 01780 g004
Figure 5. Leaf N content per unit of area (Narea) versus (a) leaf mass per unit of area (LMA) and (b) N content per unit of mass (Nmass) at 7 days before flowering (BBCH 62). Each symbol corresponds to an individual leaf.
Agronomy 10 01780 g005
Figure 6. Relationship between leaf mass per unit of area (LMA) and light interception by leaves located in a given layer at 7 days before flowering (BBCH 62). Vertical bars indicate the standard error of means.
Agronomy 10 01780 g006
Figure 7. (a) N uptake per square meter, and (b) N uptake per plant and percentage of N in leaves and stems in response to N supply and plant population density at 7 days before flowering (BBCH 62). Different letters indicate significant differences across treatments (p < 0.05), and vertical bars indicate the standard error of means.
Agronomy 10 01780 g007
Figure 8. (a) Nitrate (NO3) availability as a function of thermal time since emergence until flowering (vertical arrows represent the moment when leaves evaluated appeared). Fitted functions were as follows: N150-D50, y = 3.60 + 103.90(0.997x), (r = 0.9182); N150-D150, y =1.41 + 34.27(0.9973x), (r = 0.9407); N50-D50, y = 6.60 + 91.24(0.962x), (r = 0.8695); N50-D150, y = 1.68 + 31.50(0.9620x), (r = 0.9813); (b) relationship between Nmass and NO3 availability at the moment when leaves 9, 9.1, and 11 appeared.
Agronomy 10 01780 g008
Table 1. List of abbreviations, as well as their definitions and units.
SymbolVariable NameDefinitionUnits
AnRate of photosynthesis Net CO2 uptake per leaf area per timeµmol CO2·m−2 s−1
IPARPAR intercepted PAR intercepted by the canopyµmol·m−2·s−1
kLight extinction coefficientExtinction coefficient for light in a stand -
LAILeaf area indexGreen leaf area/ground surface area-
LMALeaf mass per areaLeaf dry matter/leaf areamg mass·cm−2
PARPhotosynthetically active radiationSpectral range of solar radiation from 400 to 700 nmnm
PARincPAR incomingPAR incoming above the canopyµmol·m−2·s−1
NareaN content per green leaf areaLMA/Nmassmg N·cm−2
NmassN content per unit of massAmount of N/leaf dry weightmg N·g−1 leaf
NO3NitrateNitrate contentg·m−2
NtotalTotal mineral nitrogenNO3 + NH4+g·m−2
N uptakeNitrogen uptakeN contained in the plantg·plant−1
TTThermal timeAccumulation of daily mean temperature above a base temperature°C·day
Table 2. Time of appearance, leaf area, and N content of leaves at phytomers 9, 9.1, and 11.
TreatmentLeaf PositionLeaf Appearance (°C·Day)Individual Leaf Area (cm2 per Leaf)N content Per Leaf (mg N Per Leaf)
N150-D50Leaf 11539.1d14.86cd2.868b
Leaf 9473.1a60.74a9.916a
Leaf 9.1690.9e11.83de1.180cd
150-D150Leaf 11535.2cd9.44def0.892cd
Leaf 9470.4a19.26c2.184bc
N50-D50Leaf 11527.6bc6.27ef0.756d
Leaf 9466.9a26.59b2.729b
N50-D150Leaf 11523.7b3.44f0.136d
Leaf 9469.3a9.19def0.722d
N supply (N)*** *** ***
Plant population density (D)*** *** ***
N × D × Leaf position*** NS **
Different letters indicate significant differences between leaf positions in response to treatments according to ANOVA and Fischer least significant difference (LSD) test, where letter a indicates the highest value. Asterisks indicate differences between the treatments evaluated (*** significant at p < 0.001; ** significant at p < 0.01; NS = not significant).
Publisher’s Note: MDPI stays neutral with regard to jurisdictional claims in published maps and institutional affiliations.