Article

Physiological and Biochemical Properties of Potato (Solanum tuberosum L.) in Response to Ozone-Induced Oxidative Stress

1
Department of Crop Production, University of Rzeszow, Zelwerowicza 4, 35-601 Rzeszow, Poland
2
Department of Food Chemistry and Toxicology, University of Rzeszow, Ćwiklińskiej 1A, 35-601 Rzeszów, Poland
*
Author to whom correspondence should be addressed.
Agronomy 2020, 10(11), 1745; https://doi.org/10.3390/agronomy10111745
Submission received: 30 September 2020 / Revised: 27 October 2020 / Accepted: 6 November 2020 / Published: 10 November 2020
(This article belongs to the Special Issue Ozone Effects on Crop Production)

Abstract

:
We investigated the changes in the physiological and biochemical properties of potato plants exposed to differing ozone (O3) concentrations (5 ppm, 10 ppm) and exposure times (2, 4, 8, 12, 16 min) to determine the safe dose that could be used in crop protection programs. We measured the gas exchange, relative chlorophyll content, chlorophyll fluorescence and total antioxidant capacity in potato leaves exposed to O3 fumigation. The fresh weight (FW) of the aboveground part of the plants and a visual assessment of plant condition were determined after the end of the experiment. The plants were given two O3 treatments and measurements were carried out four times: on the 1st and 7th day after treatment. We conclude that O3 exposure time had a greater impact on the reduction in the efficiency of the potato photosynthetic apparatus than O3 concentration. Research has showed that O3 in 5 ppm concentration for 2 and 4 min and 10 ppm for 2 min increased the efficiency of the photosynthesis and antioxidant activity in leaf processes, and these doses could be taken into account in further research on the potential for using O3 in potato protection.

1. Introduction

Potatoes are the third most important crop in the world after wheat and rice, with an area of over 17.5 million hectares [1]. Potato tubers are a significant component of a diet and a valuable source of starch [2]. Chemical plant protection products are usually used to protect potato plants against diseases. In organic farming, where pesticides cannot be used, an alternative may be the use of ozone (trioxygen, O3), which has no negative impact on the environment and has disinfectant and antibacterial properties [3,4,5,6]. The primary purpose of ozonation is microbial decontamination due to its strong biocidal effect. Today, it is mainly used for the decontamination of raw materials and food products, as well as surface disinfection of equipment [7,8,9,10,11], and it increases the profitability of production by reducing losses during trading. There are also various reports in the literature on the possibility of using O3 as an elicitor to improve the quality of the raw material [12]. From a food safety point of view, it is important that O3 rapidly degrades to oxygen and leaves no residue so that it is safe and the ozonated product is suitable for food destined to be certified as organic food [6]. O3 treatment may have additional benefits, such as the effective degradation of pesticides [13,14] and mycotoxins [15].
O3 is a reactive gaseous allotropic form of oxygen that plays a dual role in the atmosphere. Stratospheric O3 is a layer that protects life on Earth against harmful UV radiation, while tropospheric O3 is treated as a major air pollutant, reducing the productivity of crops, including potatoes [16,17,18,19,20,21]. Plant response to O3 is closely related to Reactive Oxygen Species (ROS) produced in the apoplast, which are important mediators of signal transduction pathways. [22]. In the process of diffusion, O3 enters the plants through the stomata and continues to penetrate the apoplast, where it is rapidly transformed into ROS, such as hydrogen peroxide (H2O2), superoxide radicals (O2•−), and hydroxyl radicals (OH), which can react with wall and cell membrane components [22,23]. H2O2 obtained, inter alia, as a result of O3 transformation, plays an important role in the regulation of physiological processes taking place in the plant cell. H2O2 is transported through the cell membrane, causes a change in gene expression and modulates transcription factors [24]. ROS can be detoxified by ROS scavengers inside the apoplast or they can react with proteins or plasma membrane lipids. In order to protect against toxic ROS, plant cells and organelles (mitochondria, chloroplasts, and peroxisomes) have developed an antioxidant defense system. However an imbalance between ROS and ROS scavenger production may result in oxidative stress [25,26].
The effect of O3 on plants depends on its dose and exposure time [23,27]. Acute damage (high O3 dose within a short time frame) resembles the hypersensitive response (HR) in which the effect is similar to fungal elicitors, leading to programmed cell death (PCD) and leaf damage in sensitive species [28,29,30]. By contrast, chronic damage (low O3 dose within a long time frame) causes a decrease in the rate of photosynthesis, growth restriction and leaf senescence, leading to a decrease in plant productivity, without visible damage to the plant tissue [23,31,32]. A concentration of O3 in the air at a level of 40 ppb is critical for plant crops, and above that level it can have a negative effect on their growth and yield [33]. The tolerance of plant genotypes to the action of O3 is also due to the different antioxidant activity of enzymes in the cell [34]. The degree of O3 cytotoxicity depends on its concentration, exposure time and the alternative oxidase (AOX) pool. Damage caused by O3 is visible in the form of necrotic spots. They can also be invisible, causing physiological damage and stomatal apparatus disorders which results in decrease in photosynthetic activity [29].
Although O3 is toxic to plants due to its strongly oxidizing properties leading to reduced photosynthesis, growth inhibition, and, consequently, reduced crop yields (Ueda et al., 2013), it could be used as an alternative and ecological biocidal agent. Properly selected doses and O3 exposure time can also be taken into account in plant protection [6,9].
The purpose of the study was to investigate the effect of O3 concentration (5 ppm, 10 ppm) and exposure time (2, 4, 8, 12, 16 min) on the efficiency of the photosynthetic apparatus in potato plants (Solanum tuberosum L.) and to determine the safe dose that could be used in a potato crop protection program.

2. Materials and Methods

2.1. Plant Materials and Experimental Layout

The experiments were conducted at the University of Rzeszow (Poland). Potato plants (Solanum tuberosum L. cv. Santé) were cultivated according to the methodology proposed by Szpunar-Krok et al. [35].
O3 fumigation took place in a plastic chamber with a capacity of 180 L (dimensions 0.8 × 0.4 × 0.55 m) made of a material (PP) resistant to ozone gas. A chamber was composed of two twin superimposed elements, which allowed the placement of undamaged plants inside. A set of four pots (corresponding to one replication) was placed in a chamber. The chamber was fed with O3 using an Ozone generator (CSI, Ekotech, Warszawa, Poland). The O3 concentration was measured with a UV-106-M ozone analyzer (2B-Technologies, Boulder, CO, USA). The O3 concentration was kept constantly in the range of 5 ppm and 10 ppm ± 10%. For each concentration, the fumigation process was carried out for 2, 4, 8, 12, 16 min. After the fumigation process, the plants were stored at room temperature. Two treatments were applied: the 1st fumigation 21 days after planting (plants had 8–9 leaves), the 2nd fumigation seven days after the first one.

2.2. Physiological Measurements

The physiological measurements occurring in the potato leaves were taken four times: on the 1st and 7th day after each O3 fumigation. The measurements were performed on the 1st or 2nd fully expanded leaves. The purpose of measuring physiological parameters on the 1st day after fumigation was to determine the level of plant stress caused by this treatment, and on the 7th day after fumigation, to check how plants cope with stress thanks to the activation of repair mechanisms. Measurements of physiological parameters and antioxidant activity in leaves were performed according to the methodology proposed by Szpunar-Krok et al. [35].

2.2.1. Measuring Gas Exchange

Leaf photosynthesis was measured with a photosynthesis measurement system (LC pro-SD, ADC Bioscientific Ltd., Herts, UK) on two fully expanded leaves per pot. The intensity of photosynthesis net (PN), transpiration rate (E), stomatal conductance (gs), and intercellular CO2 concentration (Ci) were measured. In the determination process, the light intensity was 1500 mol m−2 s−1. The LCpro-SD plant leaf photosynthesis chamber has a flow rate accuracy of ±2% of its range.

2.2.2. Measuring Relative Chlorophyll Content

The relative chlorophyll (Chl) content was measured on five fully expanded potato leaves per pot using a hand-held Chlorophyll Content Meter CCM-200plus (Opti-Sciences, Hudson, NH, USA).

2.2.3. Measuring Plant Chlorophyll Fluorescence

Chlorophyll (Chl) fluorescence analysis was performed using a continuous excitation Pocket PEA fluorometer equipped with black leaf-clips (Pocket PEA, Hansatech Instruments, King’s Lynn, Norfolk, UK). The fluorescence signal was collected in red actinic light with a peak wavelength of 627 nm light diode source and applied for 1 s at the maximal available intensity of 3500 μmol(photon) of photosynthetically active radiation (PAR) m−2 s−1. Fluorescence measurements were conducted on the adaxial leaf lamina away from the leaf vein after 30 min of dark adaptation, two measurements on each pot. The following parameters were measured: the maximal quantum yield of Photosystem II (PSII) photochemistry (Fv/Fm), the maximum quantum yield of primary photochemistry (Fv/F0), and the performance index (PI).

2.3. Determination of Antioxidant Activity Using ABTS•+ and DPPH Radicals

The antioxidant activities (AA) in potato leaves were determined according to Szpunar-Krok et al. [35]. Plant tissue (1 g) was milled and homogenized with 15 mL of 75% methanol solution. The homogenate was shaken for 30 min (150 rpm) and clarified by centrifugation at 7500·g for 10 min.
A calibration curve was prepared for 100 µM–1.5 mM solutions of (±)-6-hydroxy-2,5,7,8-tetramethylchromane-2-carboxylic acid (Trolox) in methanol which was used to determine the antioxidant activity. The results obtained from the actual tests were presented as an equivalent of µmol of Trolox in 1 g of fresh leaf mass. For all samples of fumigated potatoes, three replications of the measurements of antioxidant activity were performed. The supernatant thus obtained was used to determine the AA (ABTS•+ and DPPH). Measurements were performed in triplicate.

2.3.1. Antioxidant Activity Against ABTS•+

First, a 7 mM solution of 2,2-azino-bis(3-ethylbenzothiazoline-6-sulphonic acid) diammonium salt (ABTS•+) was prepared in a water solution of 2.45 mM K2S2O8. Then, the solution was incubated in darkness for 24 h. Before each analysis, solution of ABTS radicals was made by diluting the base solution with distilled water until an absorbance 0.7 ± 0.02 at λ = 734 nm was obtained. Next, a 1 mL solution of ABTS radicals was transferred to a glass tube, and 10 µl of each sample was added. The solution prepared in this way was placed in darkness for six min. After the incubation process, the absorbance of the solutions was measured at λ = 734 nm (with a blank sample as reference).

2.3.2. Antioxidant activity against DPPH

30 µL of potato leaf extract was added to 1 mL of 100 µM 2,2-di(4-tert-octylphenyl)-1-picrylhydrazyl, free radical (DPPH) solution. The solution prepared in this way was incubated in darkness for 30 min. Then, the absorbance was measured at λ = 515 nm.

2.4. Determination of Fresh Weight and Condition Assessment of Plants

At the end of the experiment (7th day after the 2nd fumigation), the plant condition was visually assessed by assigning a 9-degree scale (9 corresponds to the absence of symptoms of damage to the leaves and stalks; 1 indicates total damage to the plants). The evaluation included the number of damaged leaves and stalks, degree of damage, and the turgor of the leaves and stalks. It was assumed that 9° is equivalent to 0–5%, 8° = 6–15%, 7° = 16–25%, 6° = 26–40%, 5° = 41–60%, 4° = 61–75%, 3° = 76–85, 2° = 86–95%, and 1° = 96–100% of the above-ground parts of plants with visible damage. The above-ground parts of plants were harvested and their fresh mass (FW) was weighed. The weight of plants from individual variants of the experiment was related to the weight of plants from the control (100%), according to the Equation (1):
F W ( % ) = m o z · 100 m c ,
where:
  • FW(%)—calculated fresh weight of plants;
  • moz—mass of above-ground part of fumigated plants; and
  • mc—mass of above-ground part of control plants.

2.5. Statistical Analysis

Statistical analysis was performed using TIBCO Statistica 13.3.0 (TIBCO Software Inc., Palo Alto, CA, USA). In order to check the normality of the distribution at α = 0.05, the Shapiro-Wilk test was performed. The homogeneity of variance was also checked. Then, a two-way ANOVA test with repeated measurements was used (with time evaluation as a factor). The least significant difference was calculated with the Tukey test at α ≤ 0.05.

3. Results

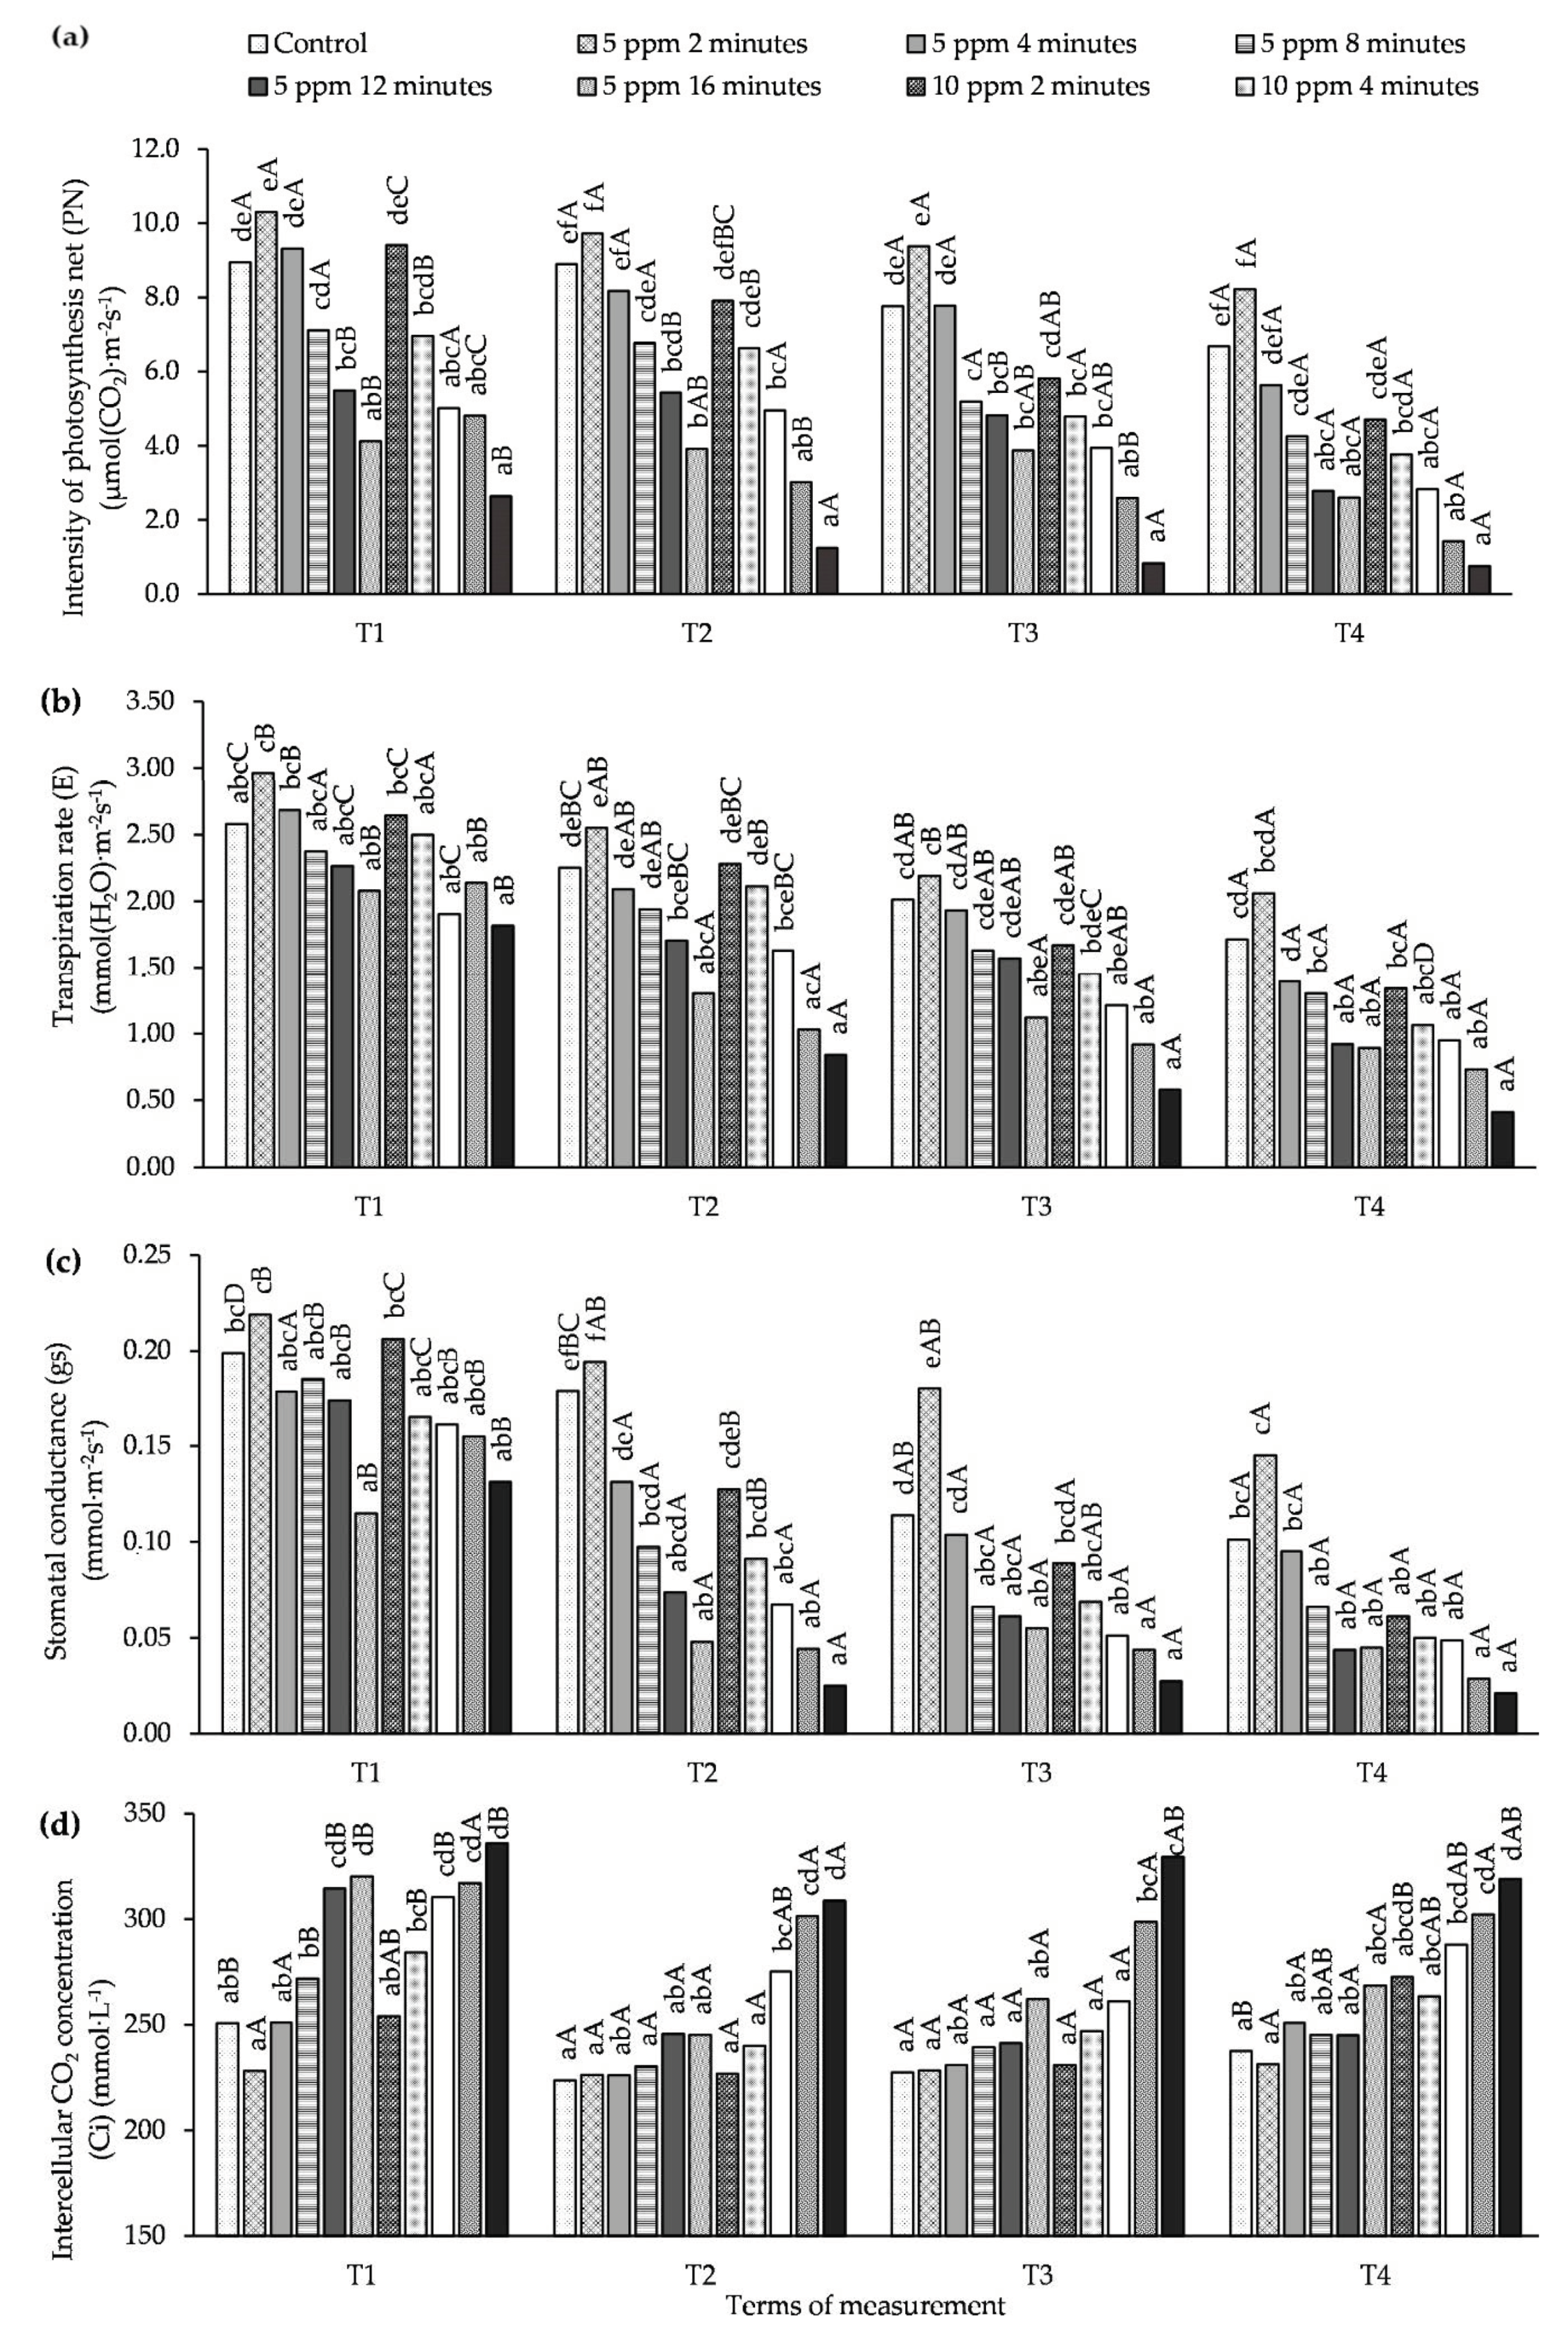
3.1. Influence of O3 Fumigation on the Efficiency Gas Exchange

A significant influence of various O3 concentrations and exposure times on the parameters of gas exchange in the leaves of potato plants was observed at each measurement time (Figure 1, Table S1). On the 1st day after each fumigation (T1, T3), a significant decrease was found in net photosynthetic rate (PN), transpiration rate (E), and stomatal conductance (gs) values as a result of longer exposure times, regardless of the O3 concentration. Data showed that shorter exposure times (2 and 4 min) increased PN and E values compared to the control, but the differences were not significant. On the other hand, an increase in gs value was only observed for the concentration of 5 ppm and time of 2 min (significant relationship in T3—the 1st day after the 2nd fumigation and no significant difference in T1—the 1st day after the 1st fumigation compared to the control). In the case of Ci, in both these terms, an increase in exposure time resulted in an increase in the value of this parameter. A similar relationship for E was observed on T3 (the 1st day after the 2nd O3 application). In the case of PN and gs, only a lower concentration (5 ppm) in shorter exposure times (2 and 4 min) had a stimulating effect on the plants, but no significant effect of a higher O3 concentration on these parameters was demonstrated.
On the 7th day after the 1st fumigation (T2) of potato plants with the lower O3 concentration for 2 and 4 min, the PN values in the leaf did not differ significantly when compared to the control, but for 5 ppm concentration and 2 min time the values of this parameter were higher than in the plants not ozonated.
At this time point, no significant difference in the PN was found between the control and 10 ppm concentration and 2 min time, while a further increase in O3 concentration and exposure time caused a decrease in PN values. At the T2 measurement term, a significant reduction in E value in relation to the control occurred under the influence of 5 ppm treatment for 16 min and 10 ppm for 12 and 16 min. In all variants of the experiment, the gs values were then significantly decreased in relation to the control, except for 5 ppm and 2 min. On the T4 measurement term (the 7th day after the 2nd application), PN, E, and gs values only did not differ significantly compared to the control under the influence of fumigation with 5 ppm for 2 and 4 min. At all measurement dates, the increase in O3 concentration and exposure time caused an increase in Ci values. Significantly, the highest Ci values were obtained for a higher O3 concentration (10 ppm) and an exposure time of 16 min.
On the 1st day after each O3 fumigation (T1, T3), decreases in the values of the PN, E, and gs parameters were observed compared to the control, while, on the 7th day, after both applications (T2, T4) there was an increase in their values. In the case of Ci, no such relationship was found.

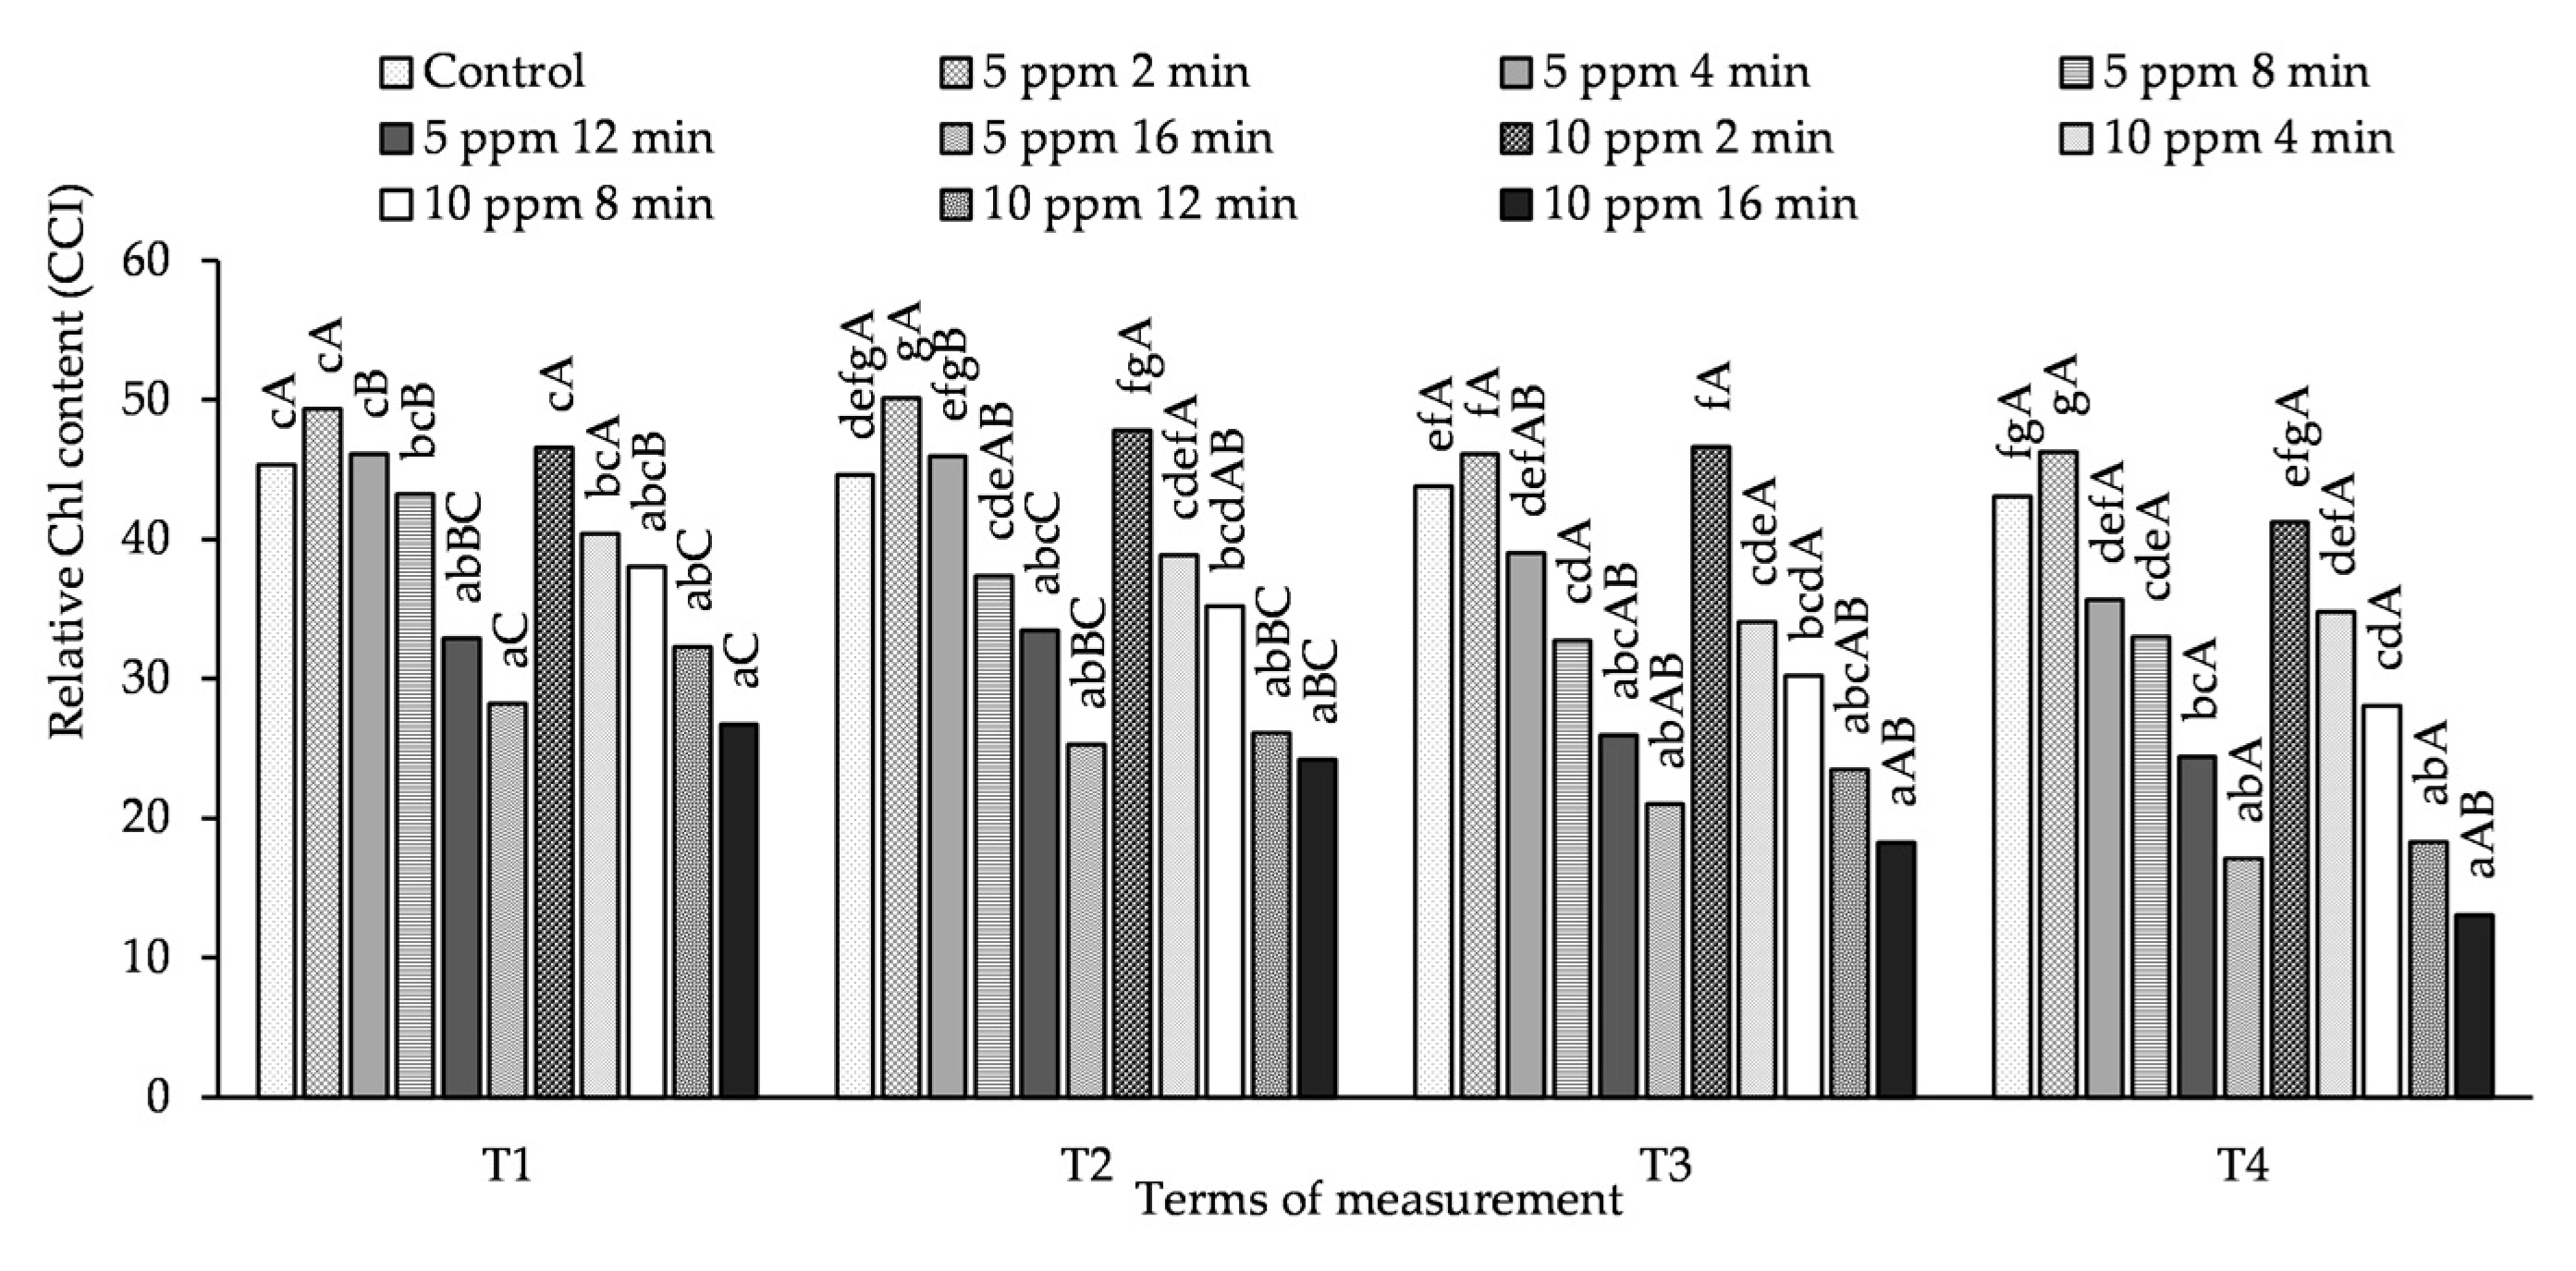
3.2. Influence of O3 Fumigation on Relative Chl Content

The relative Chl content in potato leaves depended more on the concentration and exposure time of the plants to O3 than on the time of measurement (Figure 2, Table S2). On the 1st day, after each O3 fumigation of potato plants (T1, T3), a relative Chl content in the leaves that was higher than that in the control (but not significantly different) was obtained by treating the plants with an O3 concentration of 5 ppm for 2 and 4 min and 10 ppm for 2 min. Under the influence of treating the plants with 10 ppm for 4 and 8 min, the relative Chl content at the T1 measurement term was lower than in the control, but did not differ significantly from it. Increasing the exposure time to 12 and 16 min, regardless of the measurement date and O3 concentration, caused a significant decrease in the relative Chl content in leaves.

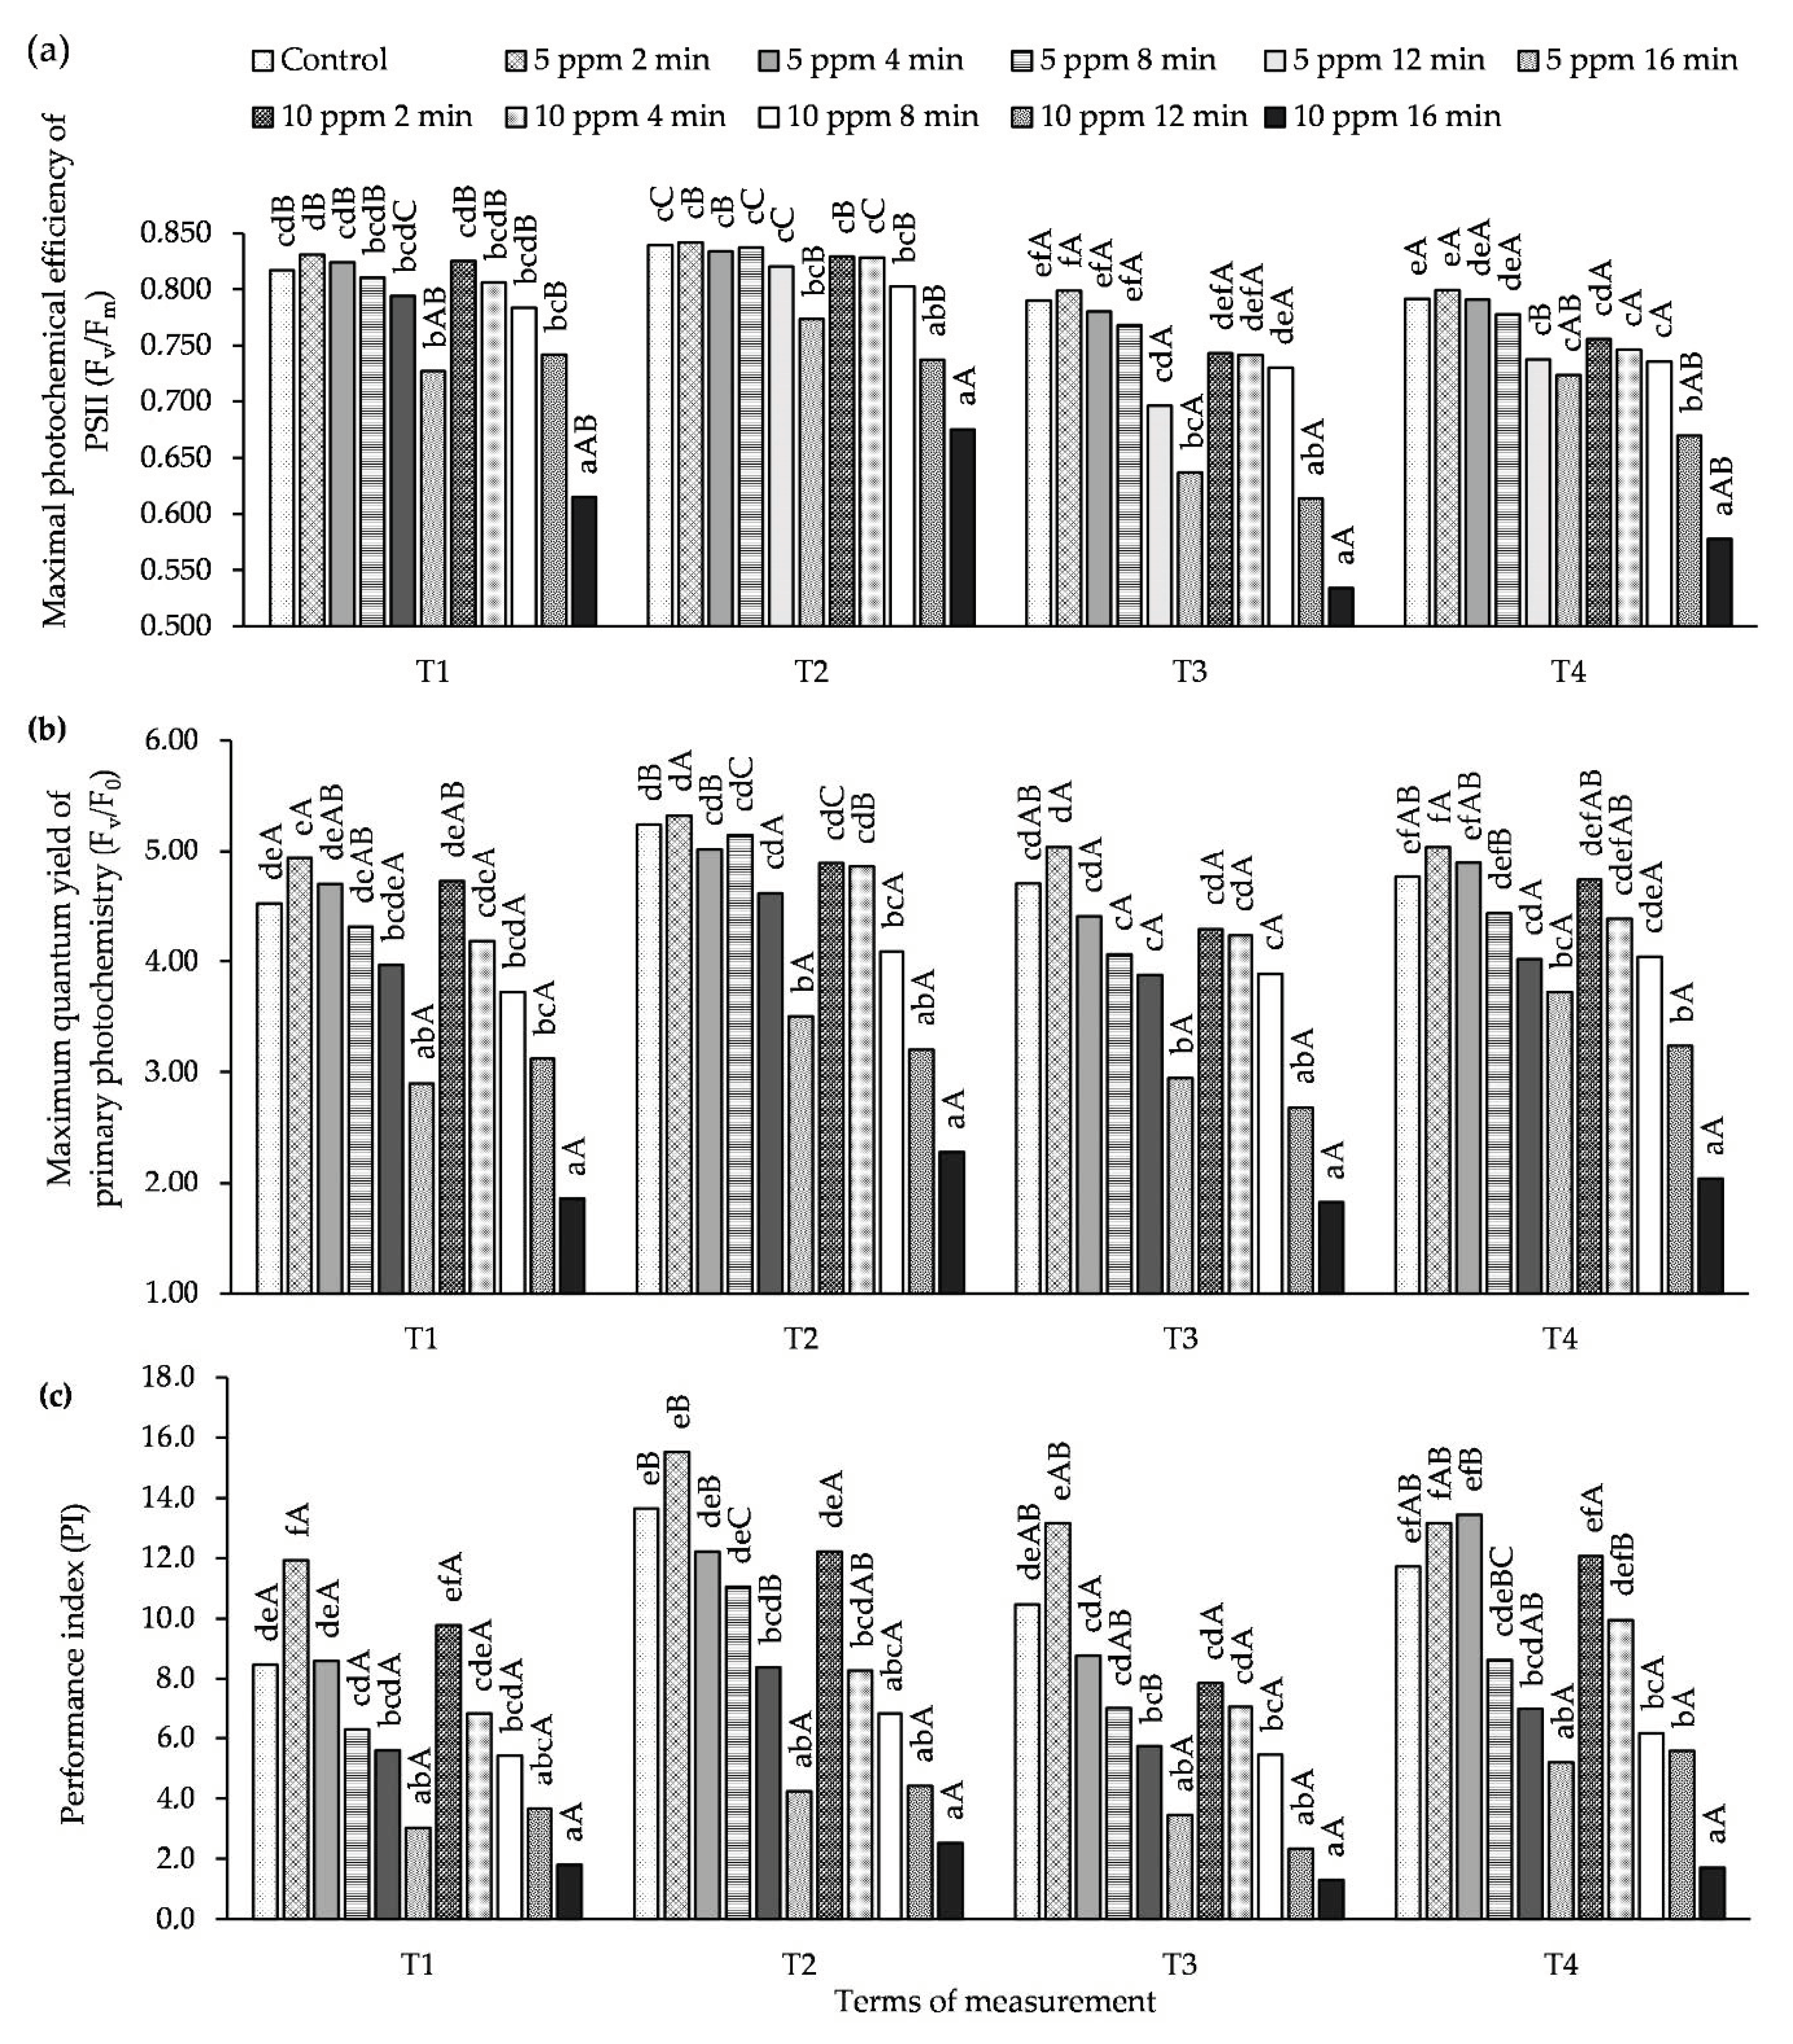
3.3. Influence of O3 Fumigation on Chlorophyll Fluorescence

At all measurement times (T1–T4), the value of the Fv/Fm parameter obtained in the leaves of plants treated with an O3 concentration of 5 ppm for 2 min was greater than or equal to the control (Figure 3, Table S3). A similar relationship was also observed for the concentration of 10 ppm and time of 2 min, but it was not a statistically significant difference. Under the influence of an O3 concentration of 5 ppm for 16 min and a concentration of 10 ppm and longer exposure times (12 and 16 min), a significant decrease in the Fv/Fm value in relation to the control was noted. Similar relationships were obtained for the parameters Fv/F0 and PI. At the T1 and T3 measurement terms (the 1st day after each ozonation of the plants) a decrease was observed in the values of the Chl fluorescence parameters (Fv/Fm, Fv/F0 and PI), while, at T1 and T3 (7th day after ozone treatment), the values of these parameters increased compared to the control.

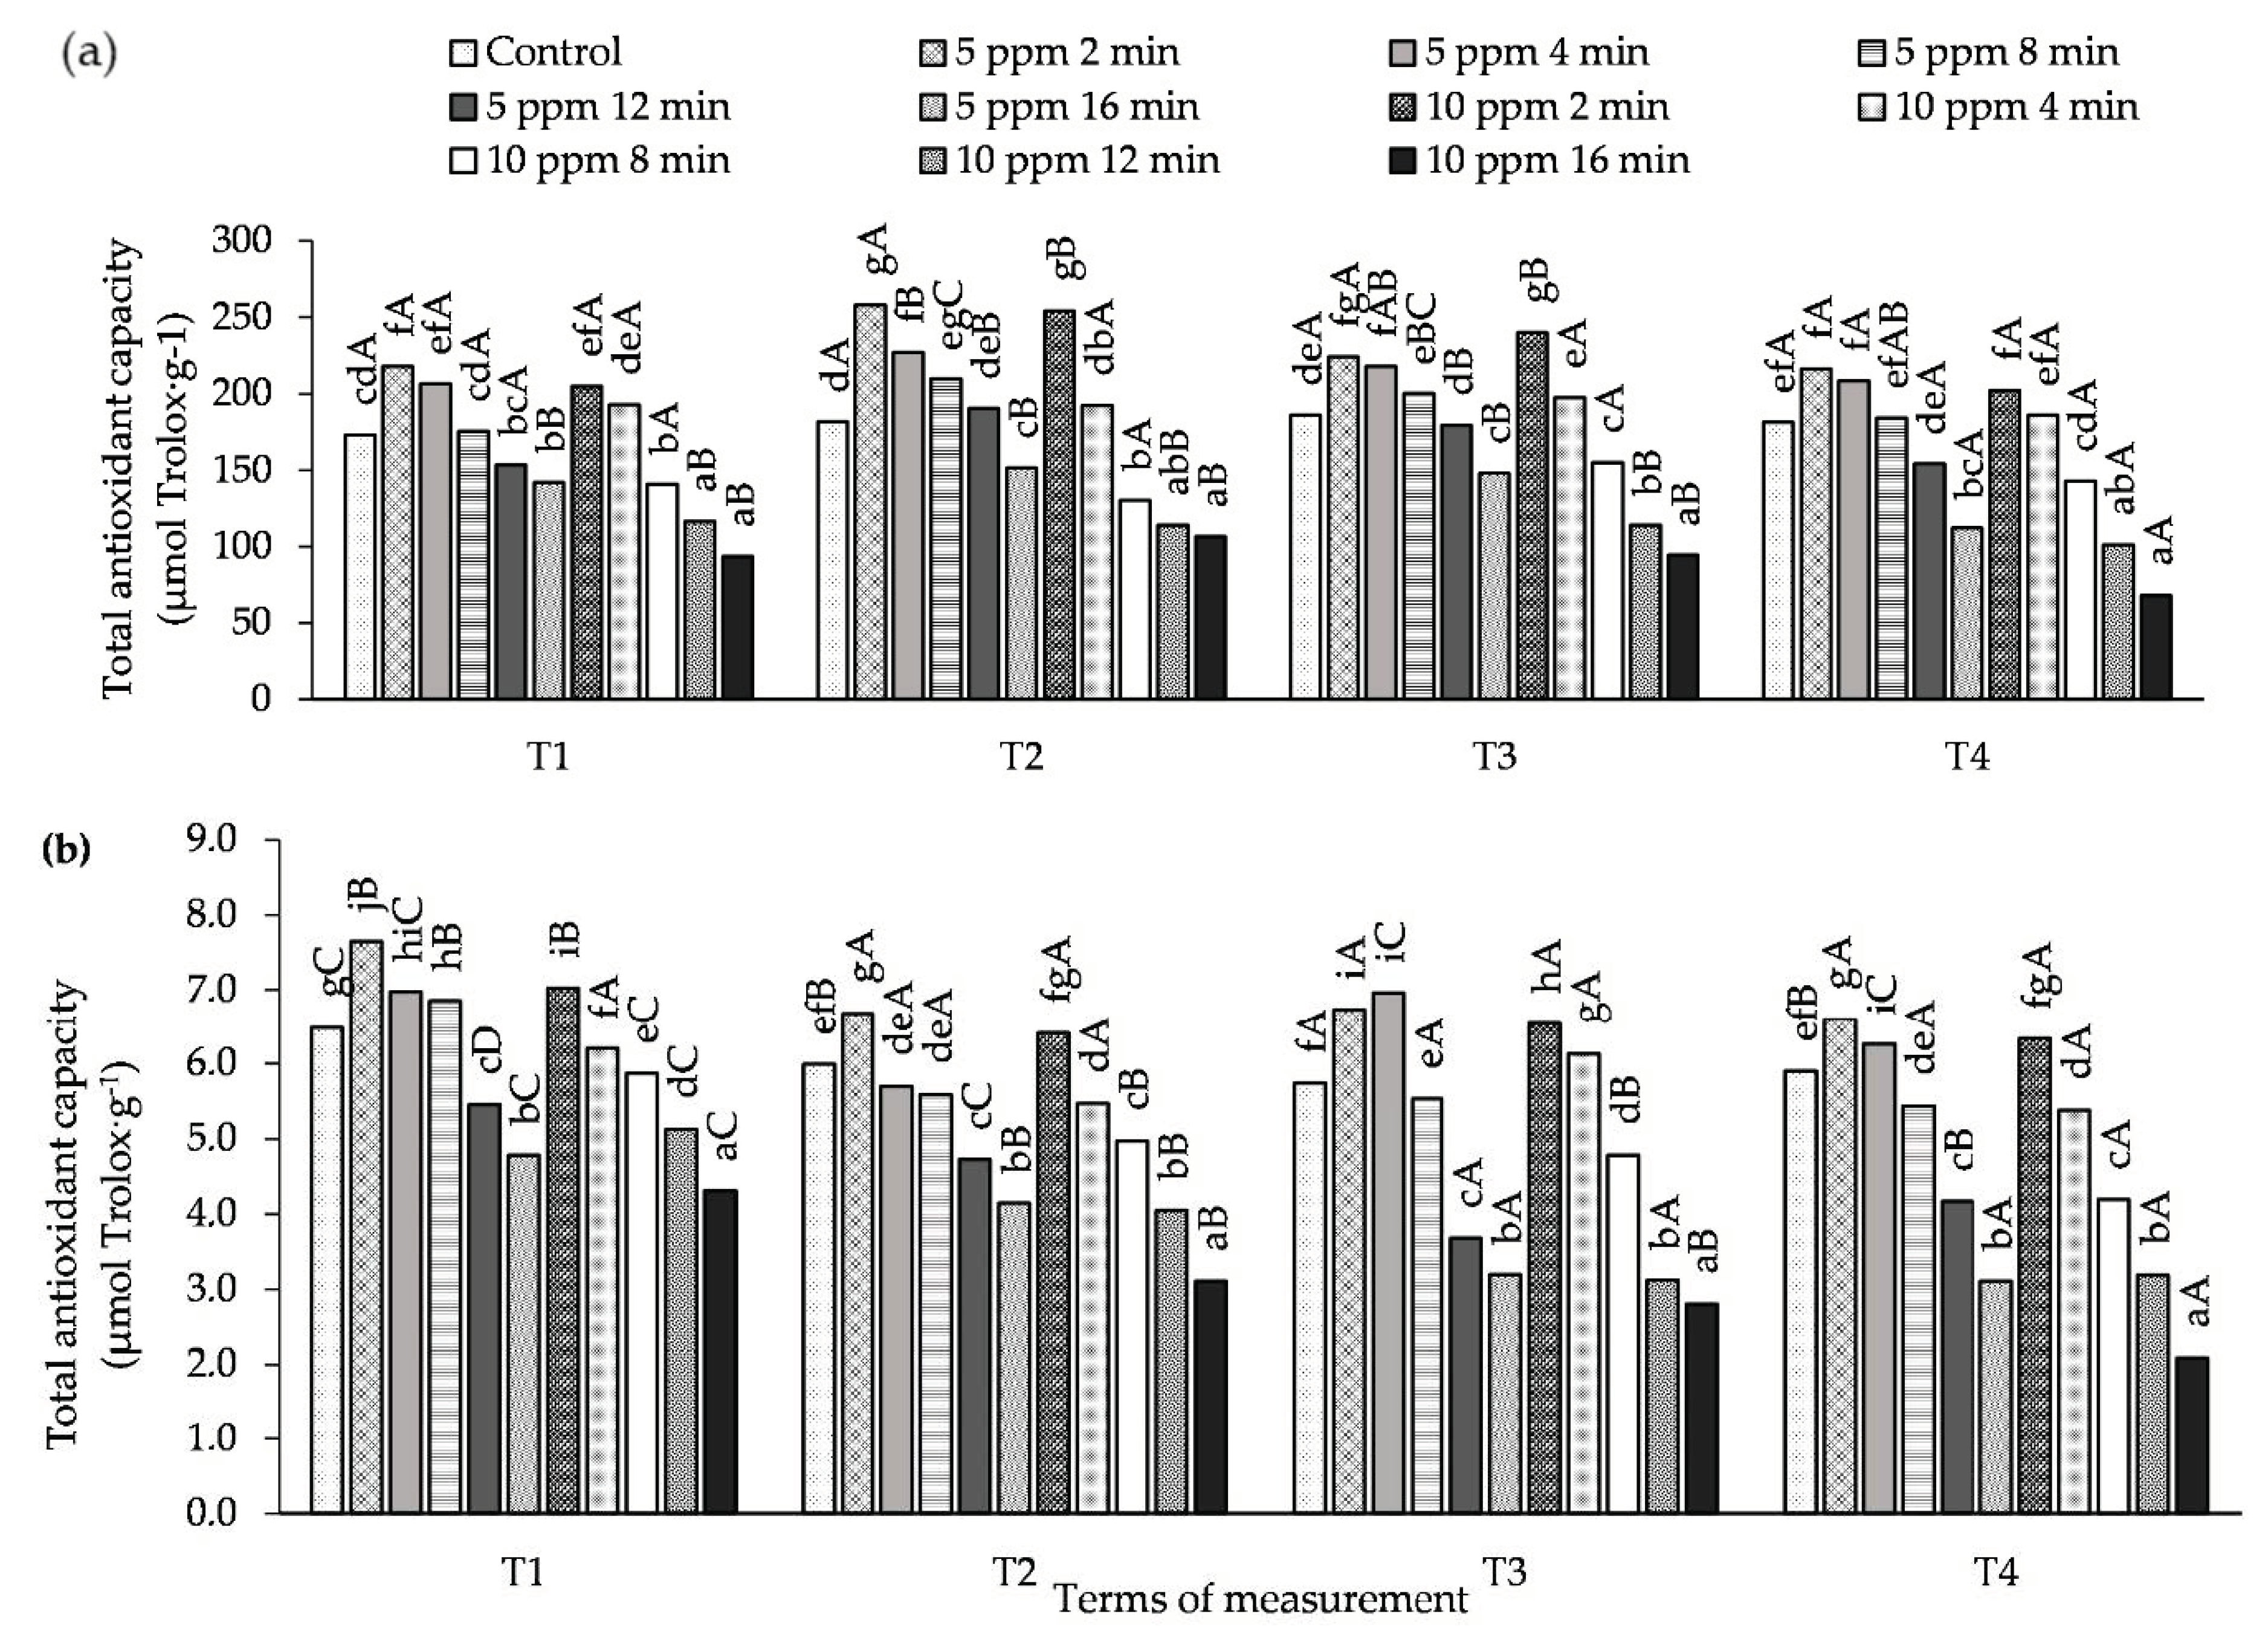
3.4. Influence of O3 Fumigation on Antioxidant Activity

The effect of plant concentration and exposure time to O3 on total antioxidant capacity (AA) in potato leaves is shown in Figure 4 and Table S4. In the experiment that was conducted, the use of a combination of 5 ppm with shorter exposure times (from 2 to 8 min) resulted in a significant increase in AA (both ABTS•+ and DPPH) compared to the control at all measurement times. In the case of the concentration of 10 ppm, a similar relationship was only observed for the exposure times of 2 and 4 min. At both concentrations, the lowest AA, was found in potato leaves treated with O3 at 5 ppm for 16 min, and, in the case of 10 ppm, also for 12 min, both of which are significant results.

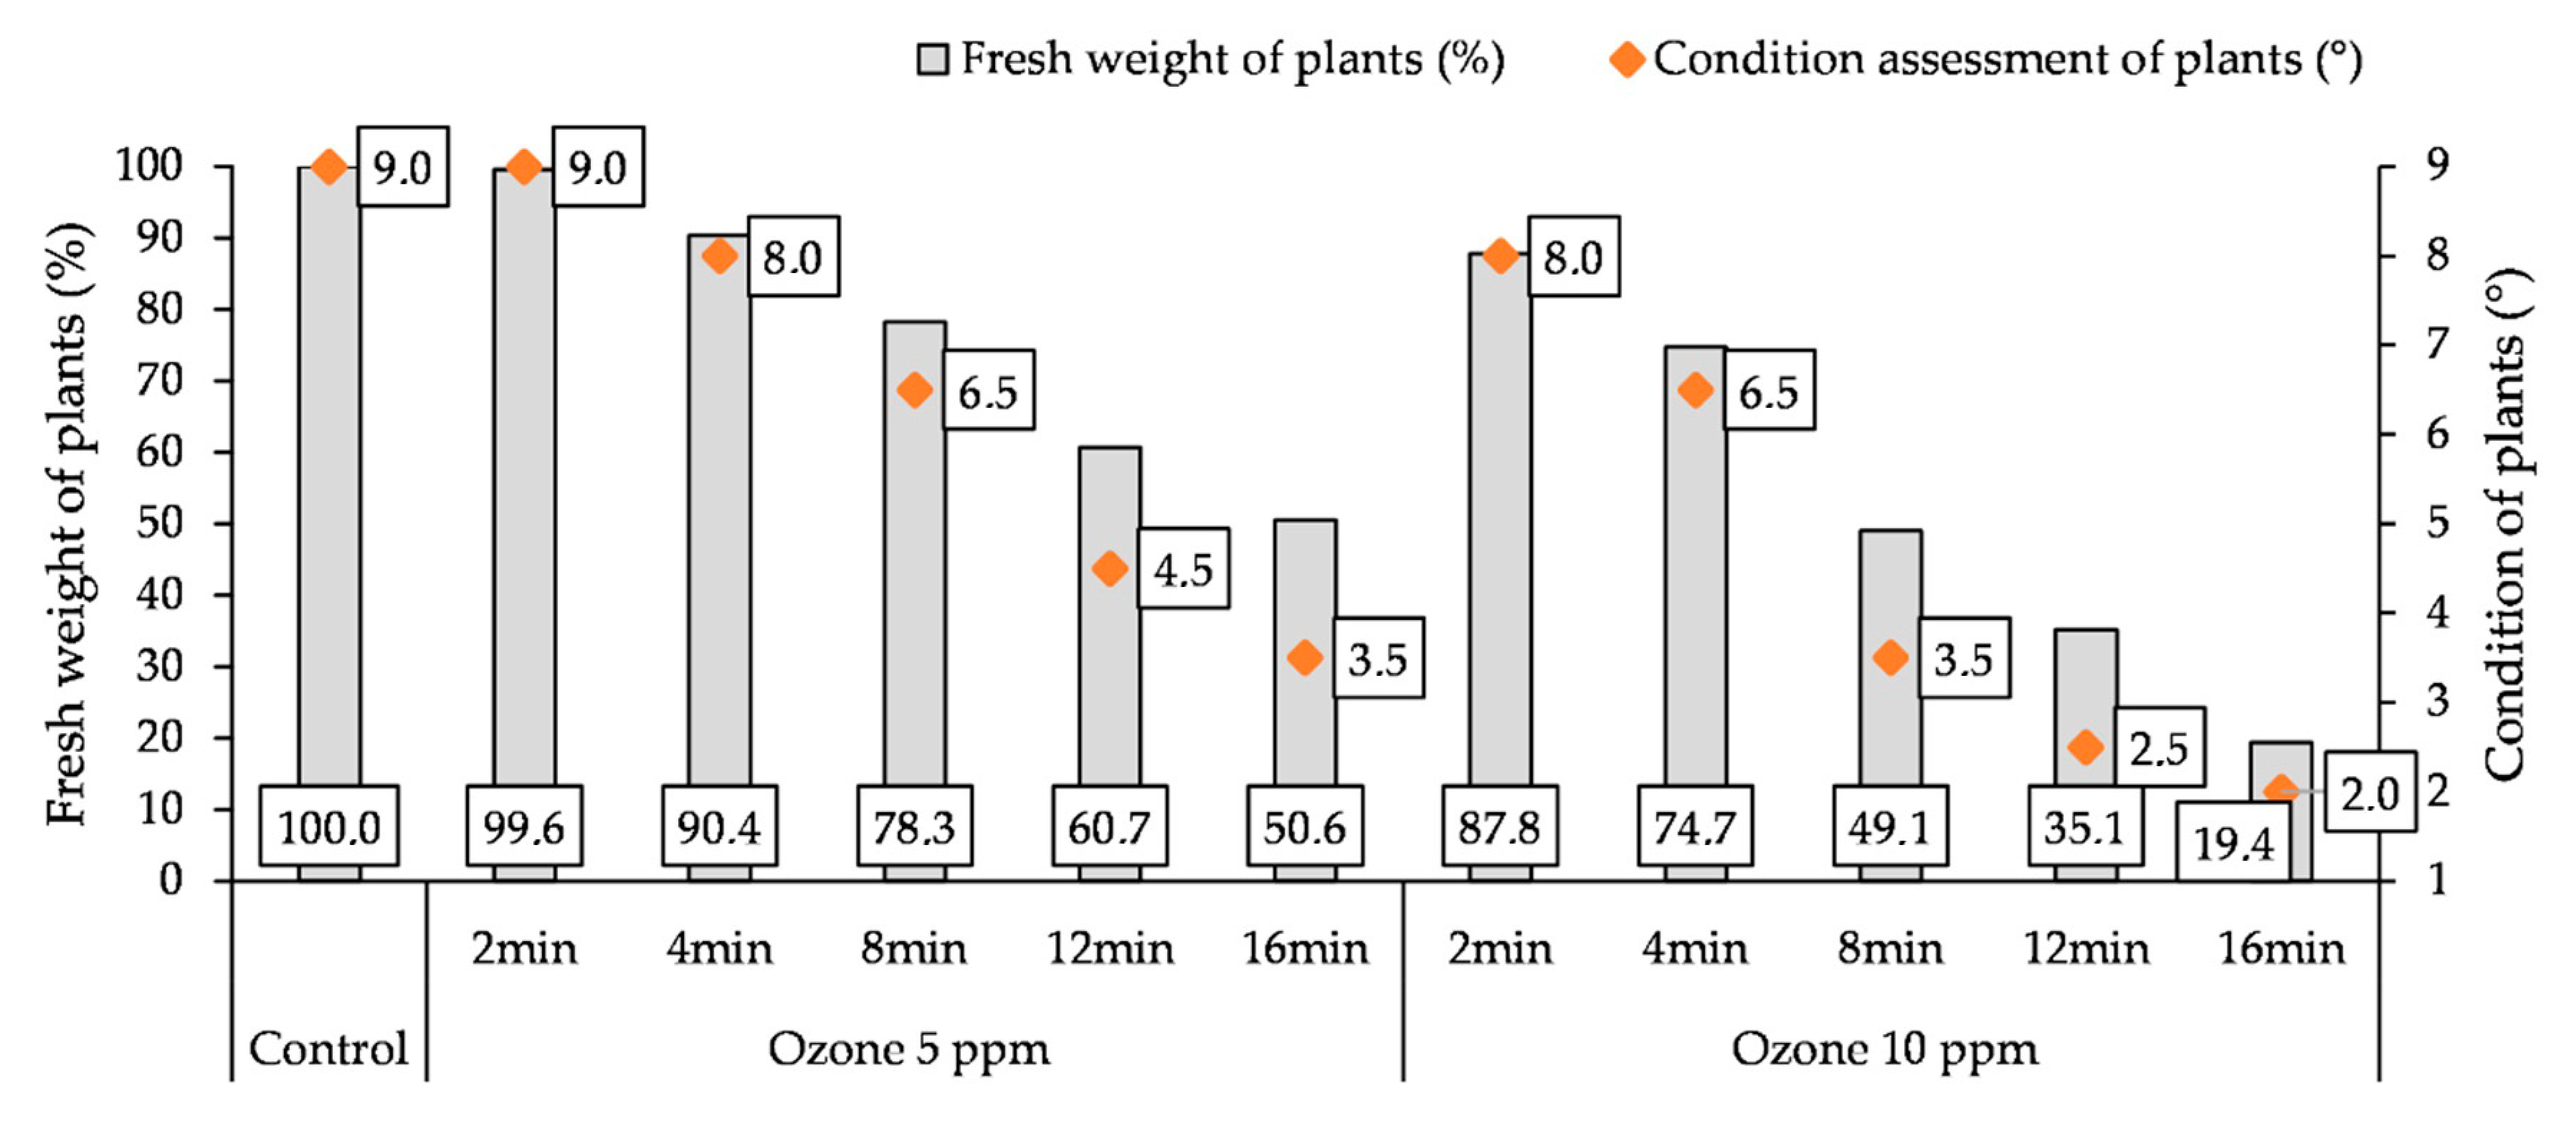
3.5. Influence of O3 Fumigation on the Fresh Weight and Condition of Plants

A doubleO3 fumigation of potato plants caused a reduction in the fresh weight (FW) of the aboveground parts of plants and a deterioration in their condition (Figure 5). The increase of the time of treating plants with O3 resulted in a gradual loss of FW of their aboveground parts and a deterioration in their condition. Only the use of an O3 concentration of 5 ppm for 2 min did not reduce the weight of the plants and did not worsen their condition in relation to the control. A stronger reaction of the plants to fumigation was observed by treating them with a higher O3 concentration (10 ppm). Double fumigation of plants with a concentration of 5 ppm for 16 min resulted in a reduction in the FW of plants (by 40.4%) compared to the control and the condition was rated at 3.5°, while, at a concentration of 10 ppm, there was a loss of FW (by 80.6%) and a decrease in their condition to 2.0°.

4. Discussion

In many European Union countries, treatments that protect potato plants against pathogens, including potato blight, the pathogen which causes the greatest losses, are carried out several times (every 7–10 days). Due to O3 having a short half-life and rapidly decomposing to oxygen [36,37,38], we suppose that the use of O3 for plant protection will also require repeated treatments. Previous reports considered O3 as an abiotic elicitor. O3 activates multiple signal pathways, which are strictly regulated at multiple levels [22].
Closing the stomata is the plant’s first response to O3 [16]. This study reports a decrease in gs was found as a result of the action of O3, which in turn led to an accumulation of intracellular CO2 in the mesophyll and an increase in the value of Ci. This phenomenon was accompanied by a decrease in the intensity of photosynthesis net (PN). The high concentration of O3 in the mesophyll cell apoplast, even before stomatal closure, leads to excessive accumulation of ROS. When a certain level of ROS is reached, extracellular and intracellular signaling pathways are triggered, leading to hormonal, biochemical and transcriptional changes [16,22]. O3 enters the apoplast through the stomata, where it is degraded into ROS, causing an increase in the level of calcium in the cytosol, which in turn leads to the closure of the stomata regulated by the activity of ion channels (ion channel activity), thus limiting its further penetration [39].
Regardless of the O3 concentration, there was a significant decrease in PN, E and gs values on the day following each fumigation due to longer exposure times, however, shorter exposure times (2 and 4 min) even caused a slight increase in the net photosynthetic rate (PN) and transpiration rate (E) compared to the control. The gs increase was only observed for the shortest treatment time (2 min) and lower O3 concentration (5 ppm). In addition, a study conducted by Xu et al. [40] reported an increase in photosynthetic limitation with duration of exposure to O3. Singh et al. [41] indicated that elevated O3 led to reductions in the rate of photosynthesis (8.0–32.8%) and stomatal conductance (10.3–31.5%) in wheat. Dan and Pell [42] reported that one of the reasons for the reduced photosynthetic capacity of plants treated with O3 is a decrease in the content of ribulose-1,5-bisphosphate carboxylase/oxygenase (Rubisco), an important protein involved in foliar storage. The decreases in Rubisco content in potato leaves is one of the reasons for lowered photosynthetic capacity of O3-treated plants and could contribute to premature senescence associated with toxicity of this molecule [42] and it lowers the CO2 binding process in the Calvin-Benson cycle [43]. In the research presented, the increase in time of exposure to O3 resulted in an increase in intercellular CO2 concentrations (Ci), which indicates a decrease in the CO2 connection capacity of the Calvin-Benson cycle. On the 7th day after each application, it was found that PN was restored to control level, but this was only shown for a concentration of 5 ppm and an exposure time of 2 and 4 min after both fumigations and 10 ppm and 2 min after the 1st fumigation. The restoration of PN at the end of O3 exposure is consistent with the observations of other researchers. In addition, Dan and Pell [42], treating potato plants with lower O3 concentrations (0.06 to 0.08 ppm) but for a longer time (from 1000 to 1600 h for 4 days) than in our research, observed an initial decrease in PN values which recovered to near control levels 3 days after the exposure ended. The recovery was related to stomatal reopening after the stress was removed, which was observed in these studies, but only for the shortest exposure time (2 min) and 5 ppm concentration. Increasing the exposure time, regardless of the O3 concentration, resulted in a significant reduction in photosynthetic efficiency compared to the control, which indicates degradation of the photosynthetic apparatus. This is confirmed by other studies [44].
Regardless of the O3 concentration, the short time (2 min) of exposure of the potato plants to O3 also increased the relative Chl content in the leaves in relation to the control at all times when measurement was carried out, which may indicate its stimulating effect as an elicitor. Increasing the exposure time, especially at a higher O3 concentration, caused a decrease in relative Chl content in the leaves, which may be related to oxidation processes in cells under the influence of O3 and increased permeability of the cell membrane [21,45], destruction of the thylakoids in chloroplasts, and ion leakage, which in turn leads to changes in Chl fluorescence.
The measurement of Chl fluorescence is a non-destructive and highly sensitive method of assessing the physiological condition of plants and is used in plants exposed to stress, including exposure to O3, showing its toxic effects on plants at an early stage, before the appearance of visible changes [46]. Chl fluorescence is a good indicator of PSII photoinhibition, showing changes in photosynthetic efficiency under the influence of O3 [39]. Shorter O3 fumigation times (2, 4, and 8 min), regardless of concentration, had no significant effect on the formation of Fv/Fm. On the other hand, the extension of the ozonation time of potato plants resulted in a significant decrease in the Fv/Fm value due to the deterioration in the efficiency of energy conversion in PSII and the reduction of the quinone pool, which is confirmed in the literature [45,47]. Similar relationships were observed for the Fv/Fm, Fv/F0 and PI parameters. In the experiment, the PN parameter was a more sensitive indicator and indicated the effect of the stress of potato plants on the action of O3 more quickly than the chlorophyll fluorescence parameter. It was shown that for longer exposure times (8 and 12 min in the 1st and 7th day after the 1st fumigation and 8 min in the 1st and 7th day after the 2nd fumigation), regardless of the concentration of O3, the values of the Fv/Fm parameter did not differ significantly when compared to the control, while the PN values did not differ. This only occurred after treatment with a concentration of 5 ppm for 2 and 4 min (at all measurement times) and 10 ppm for 2 min (the 1st day and 7th day after 1st fumigation). In addition, Płażek et al. [45], looking at the action of O3 on plants of other species, found a reduction in PN and did not show a decrease in Fv/Fm, while Ismail et al. [39] showed a decrease in both parameters. The fast recovery of the Fv/Fm ratio 24 h after the end of fumigation indicates that chronic photoinhibition did not take place, as Guidi et al. [46] also reported.
Antioxidant activity (AA) is another indicator that can be used to assess the impact of stress on plants.
The use of O3 at a concentration of 5 ppm and shorter exposure times (2 to 8 min) resulted in an increase in antioxidant activity at all measurement times when compared to the control. In the case of a concentration of 10 ppm, a similar relationship was only observed for the exposure times of 2 and 4 min. In these studies, however, a further increase in exposure time resulted in a significant decrease in AA, which indicates an imbalance between ROS and ROS scavengers, an effect that increases oxidative stress and may eventually trigger senescence at O3 concentrations of 5 ppm for 16 min, and in the case of 10 ppm, also for 12 min. Antioxidant enzymes are found in plants, which cause a cascade of biochemical reactions, leading to the production of compounds that protect them from the toxic effects of oxidants [48]. Piechowiak and Balawejder [8] have shown that the O3 process increases the activity of PAL (phenylalanine ammonia-lyase), which plays an important role in the biosynthesis of phenolic compounds in plants. These compounds can act directly in detoxification of ROS in plant cells [49]. In addition, Sarkar at al. [50] reported an increase in the levels of major antioxidant enzymes: ascorbate peroxidase (APX) and glutathione reductase (GR) in two varieties of rice after exposure to elevated levels of O3. Similar relationships concerning APX induction under the influence of O3 induced stress were also noted in different wheat cultivars [51,52], rice [53,54] and maize [55]. In these studies, fumigation of potato plants with higher O3 concentrations than those used by these authors did not adversely affect the potato plants, but this is only true for shorter exposure times. Concentrations of O3 (5 ppm and 10 ppm) which were considered high for plants were used in the experiment. Their use for 2 and 4 min did not cause a decrease in the efficiency of the photosynthetic apparatus, while, when used for a long time, they caused its degradation, which in turn led to a reduction in plant FW and a deterioration of their condition. Płażek et al. [45] showed that the plants were damaged by O3. This manifested itself in senescence and yellowing of the leaves, which was also observed in their own experiment. The induction of accelerated leaf senescence under the influence of O3 has already been described in previous studies [20,23,31,32]. Research by Ong et al. [56] showed that O3 at a concentration of 4 ppm, which was treated with papaya fruit after harvesting, damaged the structure of Colletotrichum gloeosporioides (disintegration of spore structure), causing its disintegration on the surface of the fruit. In addition, Ueda et al. [24] observed damage to rice leaves after O3 fumigation at a concentration of 150 ppb for six h. This situation could have been caused by lipid peroxidation due to formation of the hydroxyl radical (OH), which is the most reactive of oxygen species, formed by the Haber-Weiss/Fenton reaction [24,26], and which leads to cell death. O3 stress caused reduction in potato FW due to the non-availability of enough assimilates. According to Rai et al. [57], plants allocate more carbon towards the production of antioxidants and secondary metabolites for repair processes to overcome the stress induced by O3.

5. Conclusions

This study investigated the changes in the physiological and biochemical properties of potato plants exposed to gradients O3 concentration over time. Among the variants tested, O3 fumigation at a concentration of 5 ppm for 2 and 4 min and 10 ppm for 2 min had the most stimulating effect on the course of physiological processes in the leaves and did not cause a deterioration in the condition of the plants compared to the control. As a result of using these combinations, the highest values of gas exchange parameters (PN, gs, and E), relative chlorophyll content, and chlorophyll fluorescence (Fv/Fm, Fv/F0, and PI) were obtained, and the highest antioxidant activity (ABTS•+ and DPPH) was found. The use of O3 in these concentrations and exposure times could be considered targets for further research into the possibility using O3 as an alternative method of protection of potato plant with a product especially dedicated to sustainable and organic farming.

Supplementary Materials

The following are available online at https://www.mdpi.com/2073-4395/10/11/1745/s1, Table S1: Gas exchange, Table S2: Relative Chl content, Table S3: Chl fluorescence, Table S4: Antioxidant activity.

Author Contributions

E.S.-K. and M.B. have contributed in developing the research ideas, analyzing the data, conducting the research and writing the manuscript; M.J.-P. and D.M. have contributed in analyzing the data and writing the manuscript; K.S., T.P., R.P. have contributed in investigation. All authors have read and agreed to the published version of the manuscript.

Funding

This research was funded by the program of the Minister of Science and Higher Education named “Regional Initiative of Excellence” in the years 2019–2022, project number 026/RID/2018/19, the amount of financing PLN 9,542,500.00.

Conflicts of Interest

The authors declare no conflict of interest.

References

  1. FAOSTAT. Available online: http://www.fao.org/faostat/en/#data/QC (accessed on 24 September 2020).
  2. Birch, P.R.J.; Bryan, G.J.; Fenton, B.; Gilroy, E.M.; Hein, I.; Jones, J.T.; Prashar, A.; Taylor, M.A.; Torrance, L.; Toth, I.K. Crops that feed the world 8: Potato: Are the trends of increased global production sustainable? Food Secur. 2012, 4, 477–508. [Google Scholar] [CrossRef]
  3. Remondino, M.; Valdenassi, L. Different Uses of Ozone: Environmental and Corporate Sustainability. Literature Review and Case Study. Sustainability 2018, 10, 4783. [Google Scholar] [CrossRef] [Green Version]
  4. Carletti, L.; Botondi, R.; Moscetti, R.; Stella, E.; Monacra, D.; Cecchini, M.; Massantini, R. Use of ozone in sanitation and storage of fresh fruits and vegetables. J. Food Agric. Environ. 2013, 11, 585–589. [Google Scholar]
  5. Zhang, X.; Zhang, Z.; Wang, L.; Zhang, Z.; Li, J.; Zhao, C. Impact of ozone on quality of strawberry during cold storage. Front. Agric. China 2011, 5, 356–360. [Google Scholar] [CrossRef]
  6. Selma, M.V.; Ibáñez, A.M.; Cantwell, M.; Suslow, T. Reduction by gaseous ozone of Salmonella and microbial flora associated with fresh-cut cantaloupe. Food Microbiol. 2008, 25, 558–565. [Google Scholar] [CrossRef] [PubMed]
  7. Piechowiak, T.; Antos, P.; Kosowski, P.; Skrobacz, K.; Józefczyk, R.; Balawejder, M. Impact of ozonation process on the microbiological and antioxidant status of raspberry (Rubus ideaeus L.) fruit during storage at room temperature. Agric. Food Sci. 2019, 28, 35–44. [Google Scholar] [CrossRef]
  8. Piechowiak, T.; Balawejder, M. Impact of ozonation process on the level of selected oxidative stress markers in raspberries stored at room temperature. Food Chem. 2019, 298, 125093. [Google Scholar] [CrossRef]
  9. Pandiselvam, R.; Subhashini, S.; Priya, E.B.; Kothakota, A.; Ramesh, S.; Shahir, S. Ozone based food preservation: A promising green technology for enhanced food safety. Ozone Sci. Eng. 2018, 41, 17–34. [Google Scholar] [CrossRef]
  10. Kim, J.-G.; Yousef, A.E.; Khadre, M.A. Ozone and its current and future application in the food industry. Adv. Food Nutr. Res. 2003, 45, 167–218. [Google Scholar] [CrossRef]
  11. Kells, S.A.; Mason, L.J.; Maier, D.E.; Woloshuk, C.P. Efficacy and fumigation characteristics of ozone in stored maize. J. Stored Prod. Res. 2001, 37, 371–382. [Google Scholar] [CrossRef]
  12. Sachadyn-Król, M.; Agriopoulou, S. Ozonation as a Method of Abiotic Elicitation Improving the Health-Promoting Properties of Plant Products—A Review. Molecules 2020, 25, 2416. [Google Scholar] [CrossRef] [PubMed]
  13. Conte, G.; Fontanelli, M.; Galli, F.; Cotrozzi, L.; Pagni, L.; Pellegrini, E. Mycotoxins in Feed and Food and the Role of Ozone in Their Detoxification and Degradation: An Update. Toxins 2020, 12, 486. [Google Scholar] [CrossRef] [PubMed]
  14. Sadło, S.; Szpyrka, E.; Piechowicz, B.; Antos, P.; Józefczyk, R.; Balawejder, M. Reduction of Captan, Boscalid and Pyraclostrobin Residues on Apples Using Water Only, Gaseous Ozone and Ozone Aqueous Solution. Ozone: Sci. Eng. 2016, 39, 97–103. [Google Scholar] [CrossRef]
  15. Zhu, F. Effect of ozone treatment on the quality of grain products. Food Chem. 2018, 264, 358–366. [Google Scholar] [CrossRef] [PubMed]
  16. Ainsworth, E.A. Understanding and improving global crop response to ozone pollution. Plant J. 2016, 90, 886–897. [Google Scholar] [CrossRef]
  17. Mina, U.; Kumar, P.; Varshney, C.K. Effect of ozone stress on different growth stages of potato (Solanum tuberosum). Phyton 2010, 49, 253–266. Available online: https://www.verlag-berger.at/detailview?no=2746 (accessed on 24 September 2020).
  18. Rai, R.; Agrawal, M. Impact of Tropospheric Ozone on Crop Plants. Proc. Natl. Acad. Sci. India Sect. B Boil. Sci. 2012, 82, 241–257. [Google Scholar] [CrossRef]
  19. Asensi-Fabado, A.; García-Breijo, F.; Reig-Armiñana, J. Ozone-induced reductions in below-ground biomass: An anatomical approach in potato. Plant Cell Environ. 2010, 33, 1070–1083. [Google Scholar] [CrossRef]
  20. Fuhrer, J.; Booker, F. Ecological issues related to ozone: Agricultural issues. Environ. Int. 2003, 29, 141–154. [Google Scholar] [CrossRef]
  21. Chernikova, T.; Robinson, J.M.; Lee, E.H.; Mulchi, C.L. Ozone tolerance and antioxidant enzyme activity in soybean cultivars. Photosynth. Res. 2000, 64, 15–26. [Google Scholar] [CrossRef]
  22. Vainonen, J.P.; Kangasjärvi, J. Plant signalling in acute ozone exposure. Plant Cell Environ. 2014, 38, 240–252. [Google Scholar] [CrossRef] [PubMed]
  23. Castagna, A.; Ranieri, A. Detoxification and repair process of ozone injury: From O3 uptake to gene expression adjustment. Environ. Pollut. 2009, 157, 1461–1469. [Google Scholar] [CrossRef] [PubMed]
  24. Ueda, Y.; Uehara, N.; Sasaki, H.; Kobayashi, K.; Yamakawa, T. Impacts of acute ozone stress on superoxide dismutase (SOD) expression and reactive oxygen species (ROS) formation in rice leaves. Plant Physiol. Biochem. 2013, 70, 396–402. [Google Scholar] [CrossRef] [PubMed]
  25. Das, K.; Roychoudhury, A. Reactive oxygen species (ROS) and response of antioxidants as ROS-scavengers during environmental stress in plants. Front. Environ. Sci. 2014, 2, 1–13. [Google Scholar] [CrossRef] [Green Version]
  26. Gill, S.S.; Tuteja, N. Reactive oxygen species and antioxidant machinery in abiotic stress tolerance in crop plants. Plant Physiol. Biochem. 2010, 48, 909–930. [Google Scholar] [CrossRef]
  27. Chen, C.P.; Frank, T.D.; Long, S.P. Is a short, sharp shock equivalent to long-term punishment? Contrasting the spatial pattern of acute and chronic ozone damage to soybean leaves via chlorophyll fluorescence imaging. Plant Cell Environ. 2009, 32, 327–335. [Google Scholar] [CrossRef]
  28. Bandurska, H.; Borowiak, K.; Zielezińska, M. Oxidative stress enzymes in tobacco during a long-term exposure to ambient ozone at two different sites. Arch. Environ. Prot. 2018, 44, 3–11. [Google Scholar] [CrossRef]
  29. Iriti, M.; Faoro, F. Oxidative Stress, the Paradigm of Ozone Toxicity in Plants and Animals. Water Air Soil Pollut. 2007, 187, 285–301. [Google Scholar] [CrossRef]
  30. Rao, M.V.; Koch, J.R.; Davis, K. Ozone: A tool for probing programmed cell death in plants. Plant Mol. Biol. 2000, 44, 345–358. [Google Scholar] [CrossRef]
  31. Krupa, S.V. Joint Effects of Elevated Levels of Ultraviolet-B Radiation, Carbon Dioxide and Ozone on Plants. Photochem. Photobiol. 2003, 78, 535–542. [Google Scholar] [CrossRef]
  32. Sandermann, H.; Ernst, D.; Heller, W.; Langebartels, C. Ozone: An abiotic elicitor of plant defence reactions. Trends Plant Sci. 1998, 3, 47–50. [Google Scholar] [CrossRef]
  33. Directive 2008/50/EC of the European Parliament and of the Council of 21 May 2008 on Ambient Air Quality and Cleaner Air for Europe. Available online: https://eur-lex.europa.eu/legal-content/en/ALL/?uri=CELEX%3A32008L0050 (accessed on 24 September 2020).
  34. Guri, A. Variation in glutathione and ascorbic acid content among selected cultivars of Phaseolus vulgaris prior to and after exposure to ozone. Can J. Plant Sci. 1983, 63, 733–737. [Google Scholar] [CrossRef]
  35. Szpunar-Krok, E.; Jańczak-Pieniążek, M.; Skrobacz, K.; Bobrecka-Jamro, D.; Balawejder, M. Response of Potato (Solanum Tuberosum L.) Plants to Spraying by Hydrogen Peroxide. Sustainability 2020, 12, 2469. [Google Scholar] [CrossRef] [Green Version]
  36. Afsah-Hejri, L.; Hajeb, P.; Ehsani, R.J. Application of ozone for degradation of mycotoxins in food: A review. Compr. Rev. Food Sci. Food Saf. 2020, 19, 1777–1808. [Google Scholar] [CrossRef]
  37. Glowacz, M.; Rees, D. The practicality of using ozone with fruit and vegetables. J. Sci. Food Agric. 2016, 96, 4637–4643. [Google Scholar] [CrossRef]
  38. Gabler, F.M.; Smilanick, J.L.; Mansour, M.F.; Karaca, H. Influence of fumigation with high concentrations of ozone gas on postharvest gray mold and fungicide residues on table grapes. Postharvest Biol. Technol. 2010, 55, 85–90. [Google Scholar] [CrossRef]
  39. Ismail, I.; Basahi, J.; Hassan, I.A. Gas exchange and chlorophyll fluorescence of pea (Pisum sativum L.) plants in response to ambient ozone at a rural site in Egypt. Sci. Total. Environ. 2014, 497, 585–593. [Google Scholar] [CrossRef]
  40. Xu, Y.; Feng, Z.; Shang, B.; Dai, L.; Uddling, J.; Tarvainen, L. Mesophyll conductance limitation of photosynthesis in poplar under elevated ozone. Sci. Total. Environ. 2019, 657, 136–145. [Google Scholar] [CrossRef]
  41. Singh, A.A.; Fatima, A.; Mishra, A.K.; Chaudhary, N.; Mukherjee, A.; Agrawal, M.; Agrawal, S.B. Assessment of ozone toxicity among 14 Indian wheat cultivars under field conditions: Growth and productivity. Environ. Monit. Assess. 2018, 190, 190. [Google Scholar] [CrossRef]
  42. Dann, M.S.; Pell, E.J. Decline of Activity and Quantity of Ribulose Bisphosphate Carboxylase/Oxygenase and Net Photosynthesis in Ozone-Treated Potato Foliage. Plant Physiol. 1989, 91, 427–432. [Google Scholar] [CrossRef]
  43. Degl’Innocenti, E.; Guidi, L.; Soldatini, G. Effect of Chronic O3 Fumigation on the Activity of Some Calvin Cycle Enzymes in Two Poplar Clones. Photosynthetica 2002, 40, 121–126. [Google Scholar] [CrossRef]
  44. Thwe, A.A.; Vercambre, G.; Gautier, H.; Gay, F.; Phattaralerphong, J.; Kasemsap, P. Response of photosynthesis and chlorophyll fluorescence to acute ozone stress in tomato (Solanum lycopersicum Mill.). Photosynthetica 2014, 52, 105–116. [Google Scholar] [CrossRef]
  45. Płażek, A.; Rapacz, M.; Skoczowski, A. Effects of Ozone Fumigation on Photosynthesis and Membrane Permeability in Leaves of Spring Barley, Meadow Fescue, and Winter Rape. Photosynthetica 2000, 38, 409–413. [Google Scholar] [CrossRef]
  46. Guidi, L.; Mori, S.; Degl’Innocenti, E.; Pecchia, S. Effects of ozone exposure or fungal pathogen on white lupin leaves as determined by imaging of chlorophyll a fluorescence. Plant Physiol. Biochem. 2007, 45, 851–857. [Google Scholar] [CrossRef]
  47. Feng, Z.-Z.; Yao, F.-F.; Chen, Z.; Wang, X.; Zheng, Q.-W.; Feng, Z.-W. Response of gas exchange and yield components of field-grown Triticum aestivum L. to elevated ozone in China. Photosynthetica 2007, 45, 441–446. [Google Scholar] [CrossRef]
  48. Zhou, Q.; Ma, C.; Cheng, S.; Wei, B.; Liu, X.; Ji, S. Changes in antioxidative metabolism accompanying pitting development in stored blueberry fruit. Postharvest Biol. Technol. 2014, 88, 88–95. [Google Scholar] [CrossRef]
  49. Choudhury, F.K.; Rivero, R.M.; Blumwald, E.; Mittler, R. Reactive oxygen species, abiotic stress and stress combination. Plant J. 2016, 90, 856–867. [Google Scholar] [CrossRef]
  50. Sarkar, A.; Singh, A.A.; Agrawal, S.B.; Ahmad, A.; Rai, S.P. Cultivar specific variations in antioxidative defense system, genome and proteome of two tropical rice cultivars against ambient and elevated ozone. Ecotoxicol. Environ. Saf. 2015, 115, 101–111. [Google Scholar] [CrossRef]
  51. Sarkar, A.; Rakwal, R.; Agrawal, S.B.; Shibato, J.; Ogawa, Y.; Yoshida, Y.; Agrawal, G.K.; Agrawal, S.B. Investigating the Impact of Elevated Levels of Ozone on Tropical Wheat Using Integrated Phenotypical, Physiological, Biochemical, and Proteomics Approaches. J. Proteome Res. 2010, 9, 4565–4584. [Google Scholar] [CrossRef]
  52. Agrawal, G.K.; Rakwal, R.; Yonekura, M.; Saji, H. Rapid induction of defense/stress related proteins in leaves of rice (Oryza sativa) seedlings exposed to ozone is preceeded by newly phosphorylated proteins and changes in 66 K-Da ERK-type MAPK. J. Plant Physiol. 2002, 159, 361–369. [Google Scholar] [CrossRef]
  53. Rai, R.; Agrawal, S.B. Assessment of competitive ability of two Indian wheat cultivars under ambient O3 at different developmental stages. Environ. Sci. Pollut. Res. 2013, 21, 1039–1053. [Google Scholar] [CrossRef] [PubMed]
  54. Wang, J.; Zeng, Q.; Zhu, J.; Liu, G.; Tang, H. Dissimilarity of ascorbate–glutathione (AsA–GSH) cycle mechanism in two rice (Oryza sativa L.) cultivars under experimental free-air ozone exposure. Agric. Ecosyst. Environ. 2013, 165, 39–49. [Google Scholar] [CrossRef]
  55. Singh, A.A.; Agrawal, S.B.; Shahi, J.P.; Agrawal, S.B. Assessment of growth and yield losses in two Zea mays L. cultivars (quality protein maize and nonquality protein maize) under projected levels of ozone. Environ. Sci. Pollut. Res. 2013, 21, 2628–2641. [Google Scholar] [CrossRef] [PubMed]
  56. Ong, M.K.; Kazi, F.K.; Forney, C.F.; Ali, A. Effect of Gaseous Ozone on Papaya Anthracnose. Food Bioprocess Technol. 2012, 6, 2996–3005. [Google Scholar] [CrossRef]
  57. Rai, R.; Agrawal, S.B.; Agrawal, S.B. Assessment of yield losses in tropical wheat using open top chambers. Atmos. Environ. 2007, 41, 9543–9554. [Google Scholar] [CrossRef]
Figure 1. Changes in gas exchange parameters in potato leaves depending on O3 concentration, exposure time and measurement terms (T1—1st day after the 1st fumigation, T2—7th day after the 1st fumigation, T3—1st day after the 2nd fumigation, T4—7th day after the 2nd fumigation). (a) intensity of photosynthesis net (PN), (b) transpiration rate (E), (c) stomatal conductance (gs), (d) intercellular CO2 concentration (Ci). Lowercase letters indicate significant differences between the means at respective measurement terms, capital letters indicate significant differences between means at the measurement terms for the respective variants of O3 concentration and exposure time (p < 0.05).
Agronomy 10 01745 g001
Figure 2. Changes in relative Chl content in potato leaves depending on O3 concentration, exposure time and measurement terms (T1—1st day after the 1st fumigation, T2—7th day after the 1st fumigation, T3—1st day after the 2nd fumigation, T4—7th day after the 2nd fumigation). Lowercase letters indicate significant differences between the means at respective measurement terms, capital letters indicate significant differences between means at the measurement terms for the respective variants of O3 concentration and exposure time (p < 0.05).
Agronomy 10 01745 g002
Figure 3. Changes in Chl fluorescence parameters in potato leaves depending on O3 concentration, exposure time and measurement terms (T1—1st day after the 1st fumigation, T2—7th day after the 1st fumigation, T3—1st day after the 2nd fumigation, T4—7th day after the 2nd fumigation): (a) Fv/Fm-maximal photochemical efficiency of Photosystem II (PSII), (b) Fv/F0-maximum quantum yield of primary photochemistry, (c) PI-performance index. Lowercase letters indicate significant differences between the means at respective measurement terms, capital letters indicate significant differences between means at the measurement terms for the respective variants of O3 concentration and exposure time (p < 0.05).
Agronomy 10 01745 g003
Figure 4. Changes in the total antioxidant capacity (AA) in potato leaves depending on O3 concentration, exposure time and measurement terms (T1—1st day after the 1st fumigation, T2—7th day after the 1st fumigation, T3—1st day after the 2nd fumigation, T4—7th day after the 2nd fumigation); (a) method with ABTS•+ radical, (b) method with DPPH radical. Lowercase letters indicate significant differences between the means at respective measurement terms, capital letters indicate significant differences between means at the measurement terms for the respective variants of O3 concentration and exposure time (p < 0.05).
Agronomy 10 01745 g004
Figure 5. Changes in fresh weight (FW) of plants and condition assessment of plants (9—most favorable, 1—least favorable) at the end of the experiment (7th day after the 2nd O3 fumigation), depending on O3 concentration, exposure time, and measurement terms.
Agronomy 10 01745 g005
Publisher’s Note: MDPI stays neutral with regard to jurisdictional claims in published maps and institutional affiliations.

