Article

Evaluation of the Light Environment of a Plant Factory with Artificial Light by Using an Optical Simulation

1
Graduate School of Horticulture, Chiba University, Matsudo 648, Matsudo, Chiba 271-8510, Japan
2
Faculty of Agriculture, Takasaki University of Health and Welfare, Takasaki, Gunma 370-0033, Japan
3
Plant Molecular Research Center, Chiba University, Chiba, Chiba 260-0856, Japan
*
Author to whom correspondence should be addressed.
Agronomy 2020, 10(11), 1663; https://doi.org/10.3390/agronomy10111663
Submission received: 30 September 2020 / Revised: 22 October 2020 / Accepted: 23 October 2020 / Published: 28 October 2020
(This article belongs to the Special Issue Role of Vertical Farming in Modern Horticultural Crop Production)

Abstract

:
Good lighting designs can establish suitable light environments in plant factories with artificial light (PFALs). This study used optical simulations to investigate the effects of lighting designs in PFALs on the coefficient of variation of light absorption (Φp; CV) of individual plants and the coefficient of utilization for the lighting system (U). Three-dimensional models of canola plants were constructed using a scanner, and a 3D model of the cultivation shelf was also created. The photosynthetic photon flux density (PPFD) distribution in the cultivation spaces, with or without the canola plants, was estimated first. The PPFD on the canola leaves was then estimated when the lighting design parameters, such as number, distance, height, radiant flux, and light distribution of the light-emitting diode lamps, were modified. The optical simulation showed good accuracy when estimating the PPFD distributions on the cultivation shelf and the leaves of the canola plants. The results showed that while the PPFD distribution across the growing area was uniform, it was not on a plant canopy. By appropriately controlling the layout of the lamps and their directionality, lighting designs that reduce Φp; CV and improve U in PFAL could be possible, and optical simulations could help to develop them.

1. Introduction

The interest in plant factories with artificial light (PFALs) has increased because of global climate change and concerns about food security and food supply [1]. They have also gained recognition from the food industry, as they supply plant products with a uniform quality year-round, that have the characteristics (taste, shape, and safety) desired by food industry users [2].
PFAL could be utilized for the high-speed production of valuable plant products that have high resource-use efficacy, by establishing suitable environments for their growth and development [1]. The cultivation environments in PFAL, including the light, air temperature, humidity, and gas concentrations surrounding the plants, can be controlled regardless of the outdoor environment [2,3]. With open-field and greenhouse agricultural methods, the light source for photosynthesis is mainly sunlight. With PFALs, however, the plants are surrounded by opaque walls, and the only light source is an artificial lamp. Recently, light emitting diodes (LEDs) and fluorescent lamps have been used as artificial light sources. In particular, LEDs have attracted attention because of their higher efficiency for the conversion of electrical energy to radiation and the high level of control that can be exerted over their spectrum and intensity [2].
The light environment in a PFAL is an essential environmental factor for plant growth and development, and has been the focus of many previous investigations [4,5,6,7,8,9]. In recent years, research has been concentrated on the identification of suitable parameters for light environments, such as light intensity, light quality, and photoperiod, by using LEDs. For example, a photosynthetic photon flux density (PPFD) of 250 µmol m−2 s−1, a ratio of red to blue light (R:B ratio) of 11:5, and a photoperiod of 16 h/d, maximized the growth of lettuce and were considered suitable for the production of high-quality lettuce crops [8]. While a PPFD of 100 μmol m−2 s−1, a R:B ratio of 4:1, and a photoperiod of 13 h/d were considered optimal for the growth of spinach, but a PPFD of 150 μmol m−2 s−1, a R:B ratio of 4:1, and a photoperiod of 19 h/d were optimal for the quality of spinach [9]. Thus, the optimal light environments for the growth and quality can vary with plant species and varieties, but these optimal light environments, once identified, can enable high-quality and high-speed plant production. However, it is difficult to establish optimal light environments for the diversity of cultivation spaces in PFALs. Therefore, lighting equipment and lighting designs are key elements for the establishment of an optimal light environment.
Computer simulations enable the estimation of environments in virtual PFALs and are available to evaluate their design and management. Previous studies already analyzed the environmental elements and energy balances of PFAL [10,11,12,13,14,15,16,17,18]. Graamans et al. (2018) simulated the balance of energy, water, and CO2 and lettuce growth in a PFAL and a greenhouse [10]. As a result, although the PFAL consumed more energy than the greenhouse, its resource use efficiency was higher [10]. Furthermore, Graamans et al. (2020) simulated the energy consumption of a PFAL with different factors, such as the building shape and the optical and heat properties of the walls [11]. They indicated that the thermal insulation performance had a significant effect on reducing the energy consumption, and the higher the insulation performance, the less energy the PFAL consumed [11]. Zhang et al. (2018) simulated airflow in a PFAL with air tubes that provide vertical airflow by using the computational fluid dynamics (CFD) model with the aim of providing a dynamic and uniform leaf boundary layer and recommended an air circulation design with two air tubes [12].
Akiyama and Kozai (2016) simulated the light environment in a PFAL using various factors, such as the layout and the light distribution of lamps, the reflectance of the growing surface, and the reflector size [13]. They concluded that not only the characteristics of the LED, but also the design of the cultivation space and the optical properties of the structural objects, affected the light environment in a PFAL [13]. However, in their study, there were no plants in the cultivation space. Hence, the effects of the lighting design on the light absorption of the plants were not clear. Kim (2019) constructed 3D models of lettuce, and used them to estimate the light interception of the lettuce canopy in PFAL with various parameters, such as the output and height of the lamps, plant distance, and reflectance of the growing surface [14]. Subsequently, he estimated the photosynthetic rate from the amount of light interception, based on a photosynthesis model (modified Farquhar, von Caemmerer and Berry model) suggested by Qian et al. (2012) [14,19]. Moreover, he calculated the photosynthetic rate of the canopy, light energy use efficacy, and electric energy use efficacy (EUE) [14]. Thus, the photosynthetic rate was calculated from the estimated amount of light absorption and this makes it possible to evaluate lighting designs based on the photosynthetic rate, its variability, and EUE. In addition to these parameters, there are other evaluation indexes or lighting design elements that should be taken into account, when lighting designs are developed. For example, the layout and light distribution of the lamps are important to ensure that the plants photosynthetic rates are uniform and thus reduce variations in plant growth. Furthermore, the output, layout, and light distribution of the lamps, optical properties of the walls of the cultivation space, and the plant density, are important to increase the EUE, with the aim of efficient plant production.
The objective of this study was to investigate the effects of the lighting design of a PFAL on the variation of each plants light absorption and coefficient of utilization for the lighting system. In this study, PPFD distributions in cultivation spaces with or without plants were estimated using optical simulations. Subsequently, the PPFD on the leaves was estimated using various lighting design parameters, such as number, distance, and light distribution of the lamps. Finally, from the simulation results, the variation in light absorption for each plant and the coefficient of utilization for the lighting system were calculated, and the lighting designs were evaluated using the two these values.

2. Materials and Methods

2.1. Plant Material

The experiments were conducted in a closed plant production system with multi-layer cultivation shelves, at Chiba University, Japan. Canola (Brassica napus L., cv. Kizakino-natane) was used as the plant material for all experiments. We have been cultivating canola plants for our research on growth, gene expression, and accumulation of bioactive compounds under various environmental conditions, such as PPFD, light quality, ultraviolet radiation, and temperature in a PFAL [20]. The growth and leaf forms of canola plants in the vegetative stage are similar to those of lettuce, which is often cultivated in PFAL. Therefore, we considered that the canola plants were appropriate for this investigation. Canola seeds were sown on a wetted paper towel (Nippon Paper Crecia Co., Ltd., Tokyo, Japan) for germination. One day after seeding (DAS), the germinated canola seedlings were transplanted to a polyurethane mat (M urethane, M Hydroponic Research Co., Ltd., Aichi, Japan). At 7 DAS, the seedlings were transplanted again, this time to a cultivation panel for hydroponics (M Hydroponic Research Co., Ltd., Aichi, Japan), and grown using the deep flow technique (DFT) until 19 DAS. The light sources used after the first and second transplanting were natural white fluorescent lamps (FHF32-EX-N-H, Panasonic Corporation, Osaka, Japan) with 5000 K of color temperature, and the PPFD was set at 100 µmol m−2 s−1 and 200 µmol m−2 s−1, respectively. Seedlings were provided with tap water before the second transplanting, and they were provided with the 1/4 OAT house A nutrient (OAT Agrio Co., Ltd., Tokyo, Japan) after the second transplanting. The nutrient solution contained N, P, K Ca, and Mg at 21.6, 13.2, 84.1, 40.1, and 9.1 mg L−1. The air temperature during the light and dark periods was set at 25 °C and 20 °C, and they were 16 h and 8 h, respectively.
At 19 DAS, three seedlings were used for the construction of three-dimensional (3D) models and leaf area measurements. The seedlings had 2 cotyledons and 4 true leaves. The oldest true leaf was defined as the first leaf, and the youngest true leaf was defined as the fourth leaf.

2.2. Construction of the 3D models of the Canola Seedlings

Each canola seedling was scanned using a 3D scanner (DPI-8X, OPT Technologies Co., Ltd., Tokyo, Japan), and the point cloud data of the seedling were acquired. The point cloud of stem and leaf petioles could not be acquired due to the thin shapes, and these shapes were ignored. The point cloud data contain the information of coordinates of points that construct the seedling. The point cloud data were converted to the polygonal model using point cloud processing software (OPT Cloud Survey, OPT Technologies Co., Ltd., Tokyo, Japan), and then three 3D models of the canola plants were constructed.
The 3D models were saved in a standard triangulated language (STL) format. An STL file contained the vertex coordinates information for the triangle polygons, to enable the construction of a 3D model. The areas of the polygons could be calculated from the information of the coordinates. The areas of each leaf were calculated. The area of a triangle polygon (s, cm2) was calculated as follows. See Appendix A for the list of symbols. After three vertices (v1, v2, and v3) were defined, as in Equation (1), s could then be calculated using Equation (2):
v 1   =   ( x 1 ,   y 1 ,   z 1 ) v 2   =   ( x 2 ,   y 2 ,   z 2 ) v 3   =   ( x 3 ,   y 3 ,   z 3 )
s   =   v 2 v 3   ×   v 2 v 1
where x, y, and z are the x, y, and z coordinates (cm) of the vertices, and “×” indicates the operator of the cross product. The areas of all the polygons from the leaf model were calculated. Subsequently, the sum of these areas was defined as the area of the leaf model. Thus, the area of a leaf model with n polygons (S, cm2) could be calculated as follows:
S   =   i   =   1 n s i
The leaf areas of the canola seedlings used for the model construction were measured using a leaf area meter (LI-3100, LI-COR Inc., NE, USA). True leaves less than 1 cm in length and cotyledons were not included in the measurements.
The areas of each leaf model calculated using Equation (3) were compared with the measured areas of each leaf. The values of the mean absolute percentage error (MAPE, %) between the measured leaf areas and the areas of each leaf model were calculated with respect to each canola seedling. The MAPE values of the 3 seedlings were 17%, 18%, and 19%, respectively.
These 3 models were processed using 3D modeling software (Houdini, Side Effects Software Inc., ON, Canada) to reduce the number of polygons to 1%, and then the models were used for simulation (Figure 1).

2.3. Construction of a 3D Model of a Cultivation Shelf

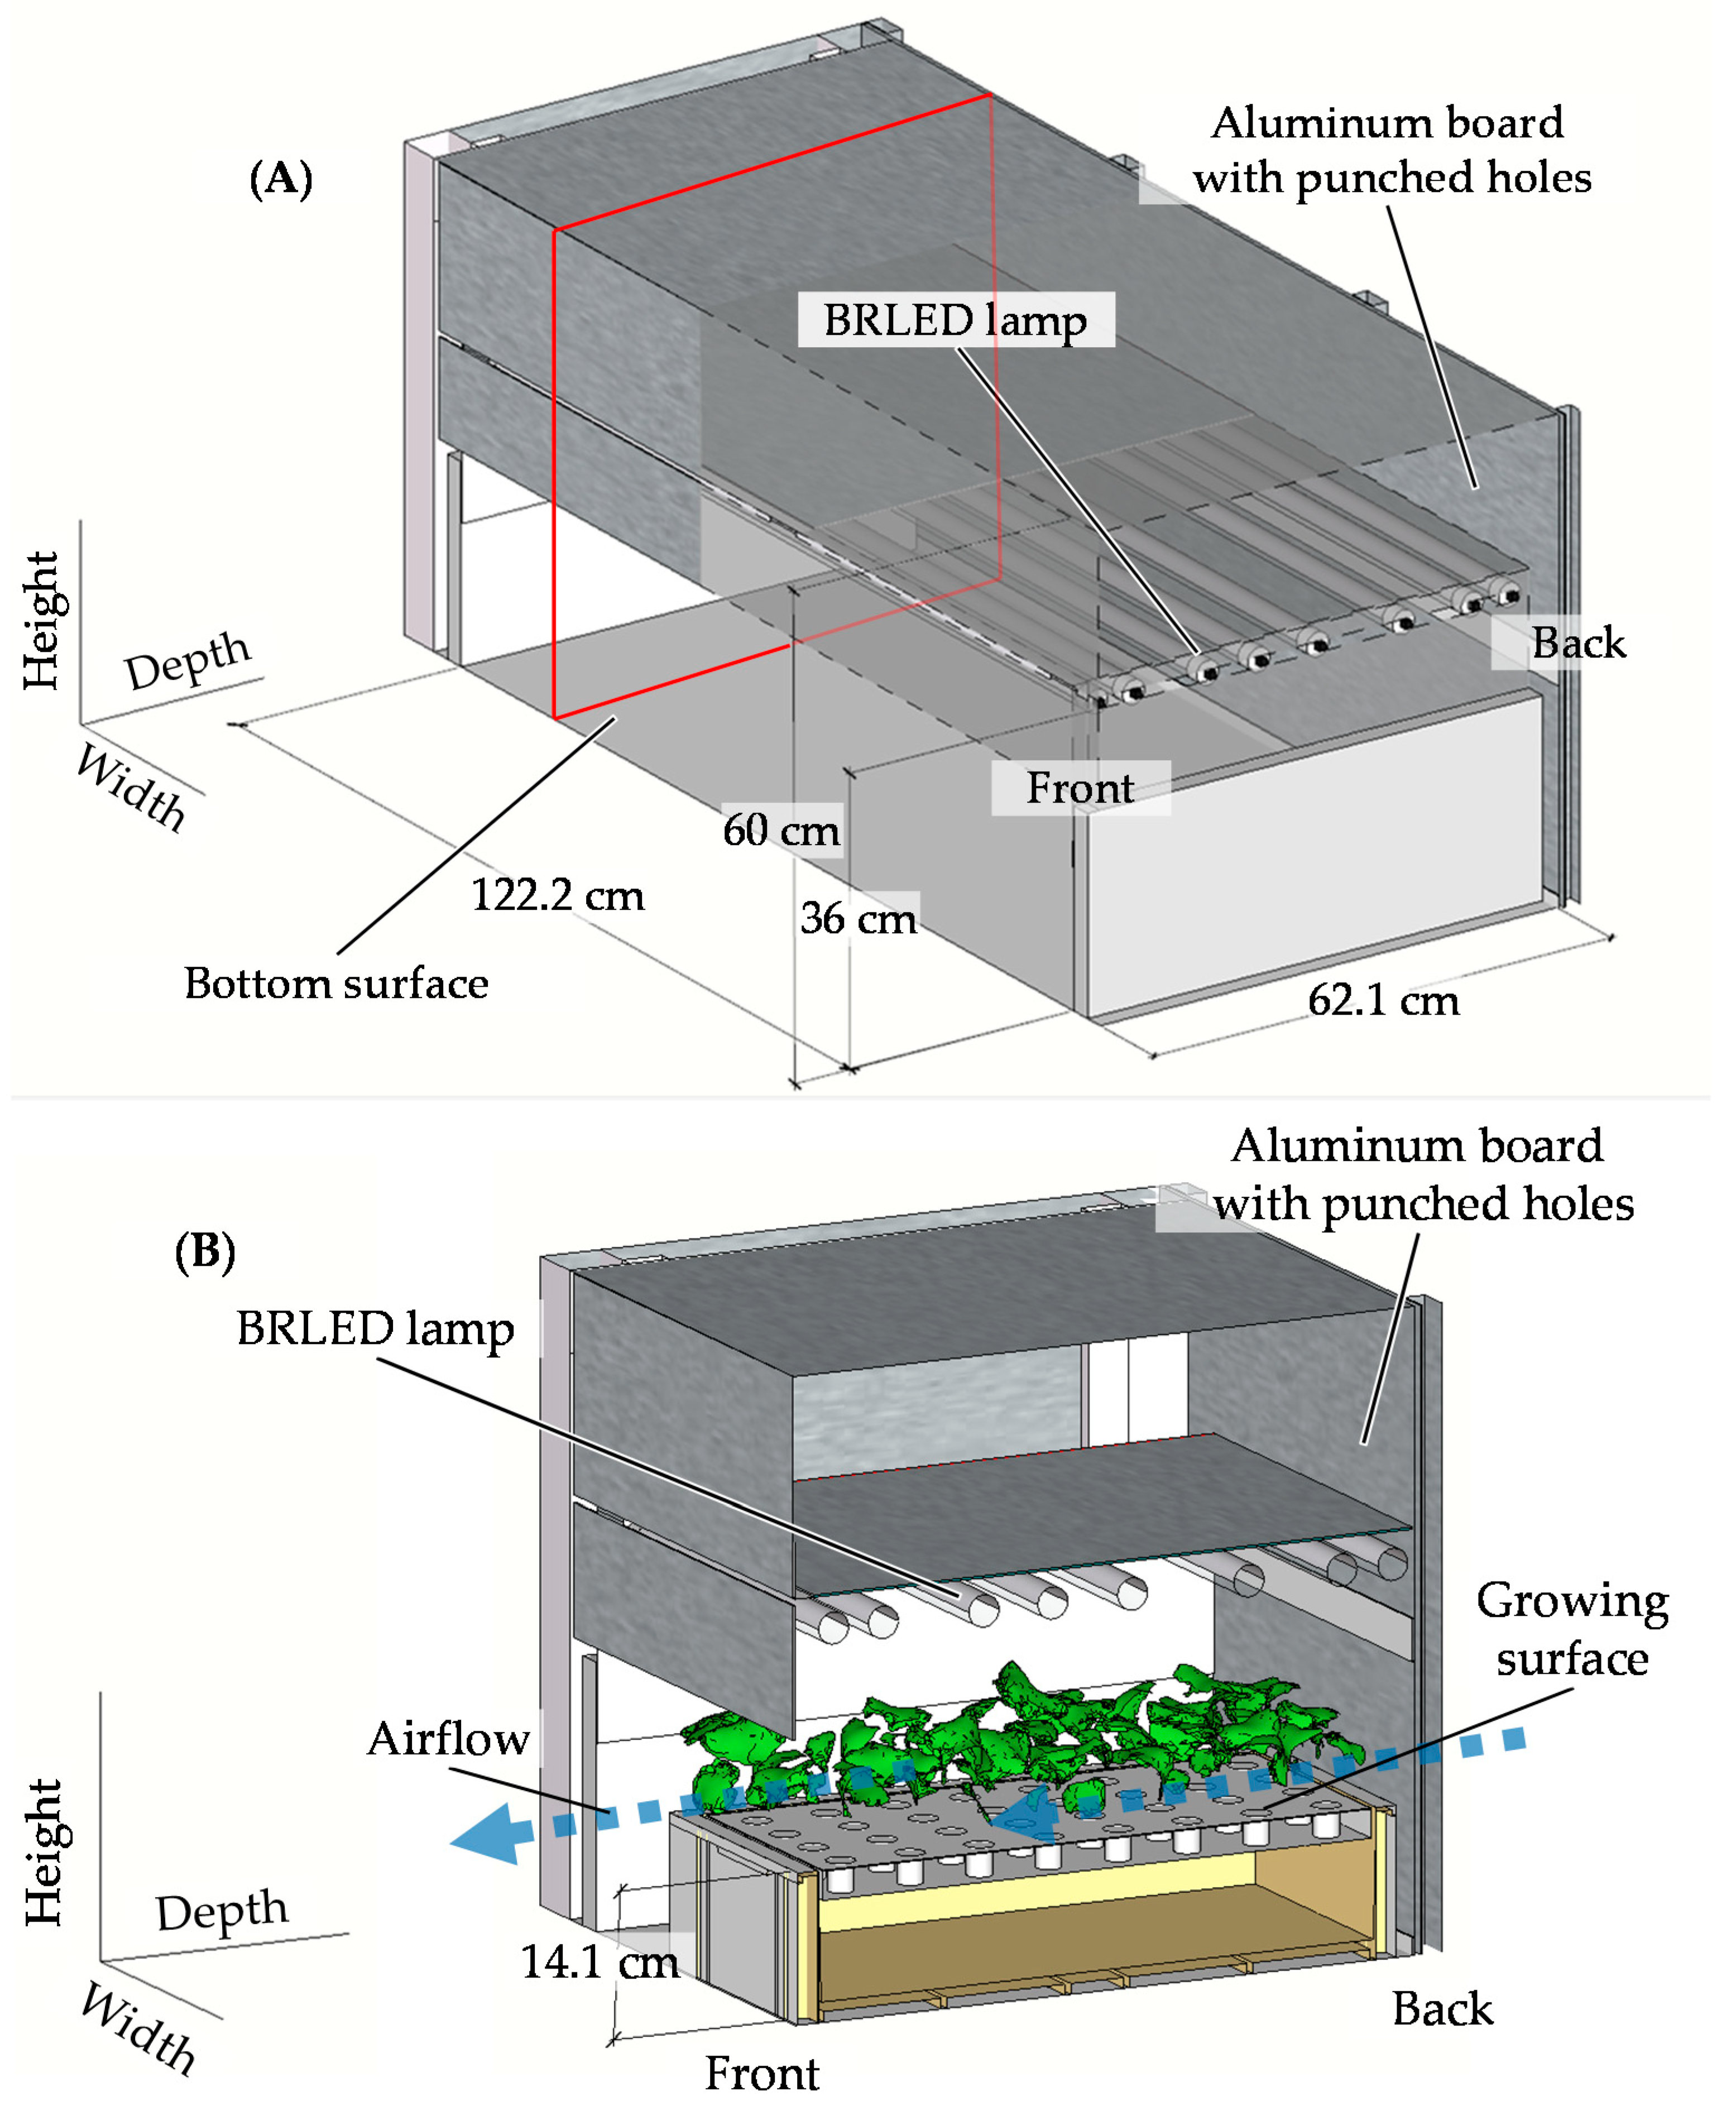
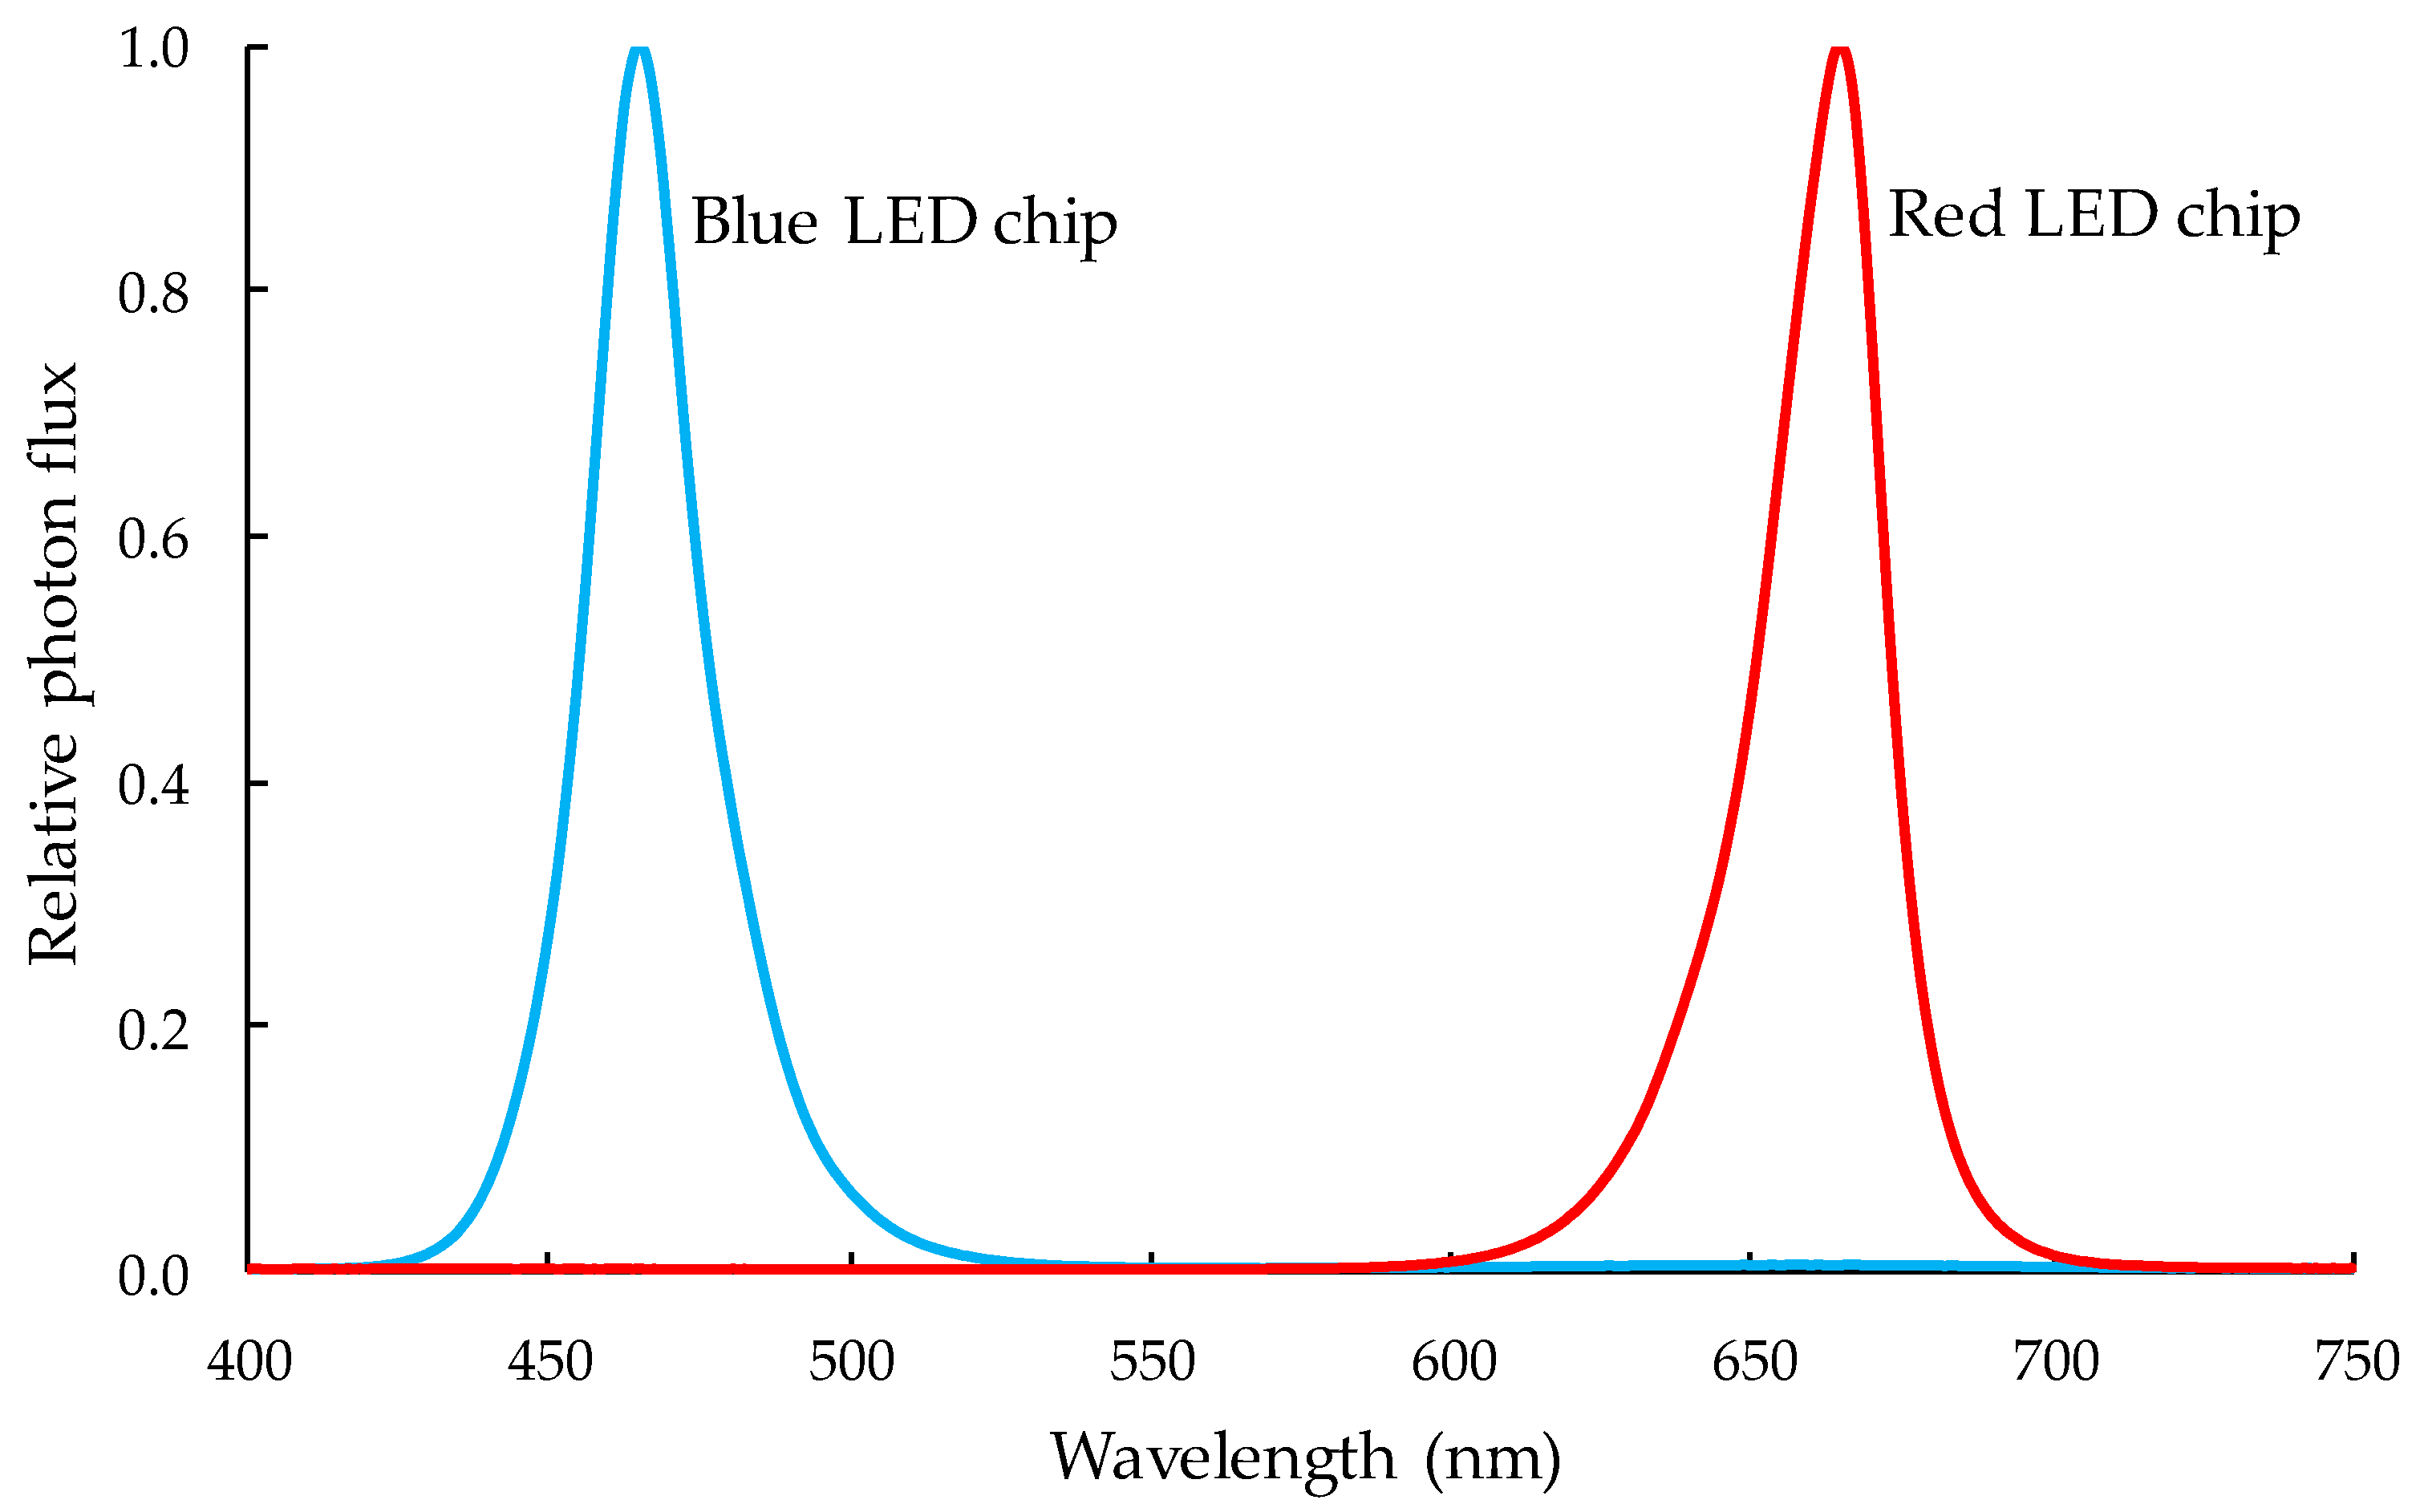
A 3D model of the cultivation shelf (Figure 2) was constructed based on the cultivation shelf in the closed plant production system at Chiba University, by using 3D modeling software (SketchUp 2017, Trimble Inc., CA, USA). The back surface of the cultivation shelf was an aluminum board with numerous punched holes for ventilation. The other surfaces were covered with reflection sheets (FEB#110, Yupo Corporation, Tokyo, Japan) with a reflectance of approximately 91%. LED lamps with blue and red LED chips (Showa Denko K.K., Tokyo, Japan) were used as light sources and referred to as BRLED lamps. The numbers of blue and red LED chips per BRLED lamp were 40 and 80, respectively. The output of blue and red LED chips can be controlled separately, and the maximum values of photosynthetic photon flux (PPF) of blue and red LED chips per BRLED lamp were 13.4 µmol s−1/lamp and 38.9 µmol s−1/lamp, respectively. In the simulations, R:B ratio of the BRLED lamps was set at 38.9:13.4. The radiation spectrum of the blue and red LED chips measured by a spectroradiometer (USR-45DA, USHIO Inc., Tokyo, Japan) is shown in Figure 3. The luminous flux and light distribution information of the BRLED lamp was saved in an Illuminating Engineering Society of North America (IES) file, provided by Showa Denko K.K. (Tokyo, Japan). An IES file contains the information of the lamp geometry, the electricity consumption of the lamp, light distribution of the lamp, etc. A 3D model of the container and a cultivation panel for DFT were also constructed. Various virtual cultivation spaces could be constructed by putting canola seedling models, growing container models, and BRLED lamp models into the cultivation shelf model. The number and positions of the BRLED lamp models could be determined arbitrarily.

2.4. Optical Simulation Software

Radiance (Berkeley Lab., CA, USA) was used for the optical simulation. It simulates the light environment using the ray-tracing method and enables the estimation of the radiant flux density values at arbitrary points by considering the reflectance and transmittance of the materials. Reflection and transmission are simulated, considering the incident angle of light relative to surface orientation. The reflectance and transmittance of the materials can be input into the Radiance simulation. The light distribution and radiant flux of the lamps can be input into the simulation as information of the light sources. By importing the information from the IES file into Radiance, the lamp described in the IES file can be used for simulations, and the output and light distribution of the lamp can be recreated in simulations.
The blue and red LED chips emitted blue and red light, and the reflectance and transmittance of the materials used in the cultivation shelf differed between them. Hence, blue and red light were simulated separately.
The reflection and transmission spectra of the leaf and reflection sheet (Figure 4) were measured using a UV-Visible/NIR spectrophotometer (V-750, JASCO Corporation, Tokyo, Japan), with an integrating sphere unit (ISV-922, JASCO Corporation, Tokyo, Japan). From the measured reflectance and transmission spectra of the materials (Figure 4) and radiation spectrum of the blue and red LED chips (Figure 3), the reflectance and transmittance of the materials were calculated. The reflectance and transmittance for the blue and red light were calculated separately. The reflectance of the aluminum of the cultivation shelf was set at 62%, in accordance with previous research [21]. The ratio of the area of the punched holes on the back surface of the cultivation shelf was approximately 40%, and consequently, the transmission of the back surface was assumed to be 40%. The reflectance of the back surface was calculated by multiplying the residual 60% by 62%, the value identified from previous research, and the product was input into the simulation. The reflectance and transmittance values of each material are shown in Table 1.
In the simulation, the number, radiant flux, light distribution, height, and layout of the BRLED lamps can be set at arbitrary values.
Radiance uses radiant flux (W) for the input of light and calculates the radiant flux density (W m−2) as a result of the simulation. If an IES file is used as the input for the characteristics of a lamp, the light quality of the lamp is ignored, and the spectral radiant distribution is assumed as uniform with respect to wavelength. Therefore, since BRLED lamps that emit the light with non-uniform spectral radiant distribution were used for the simulation, the absolute value of the radiant flux in the simulation converted from the luminous flux in the IES file is not correct. However, there is a proportional relationship between radiant flux, luminous flux, and PPF with respect to a certain light quality. Thus, the conversion coefficient between the measured radiant flux density and measured PPFD (C, µmol J−1) was calculated with respect to the blue and red light.
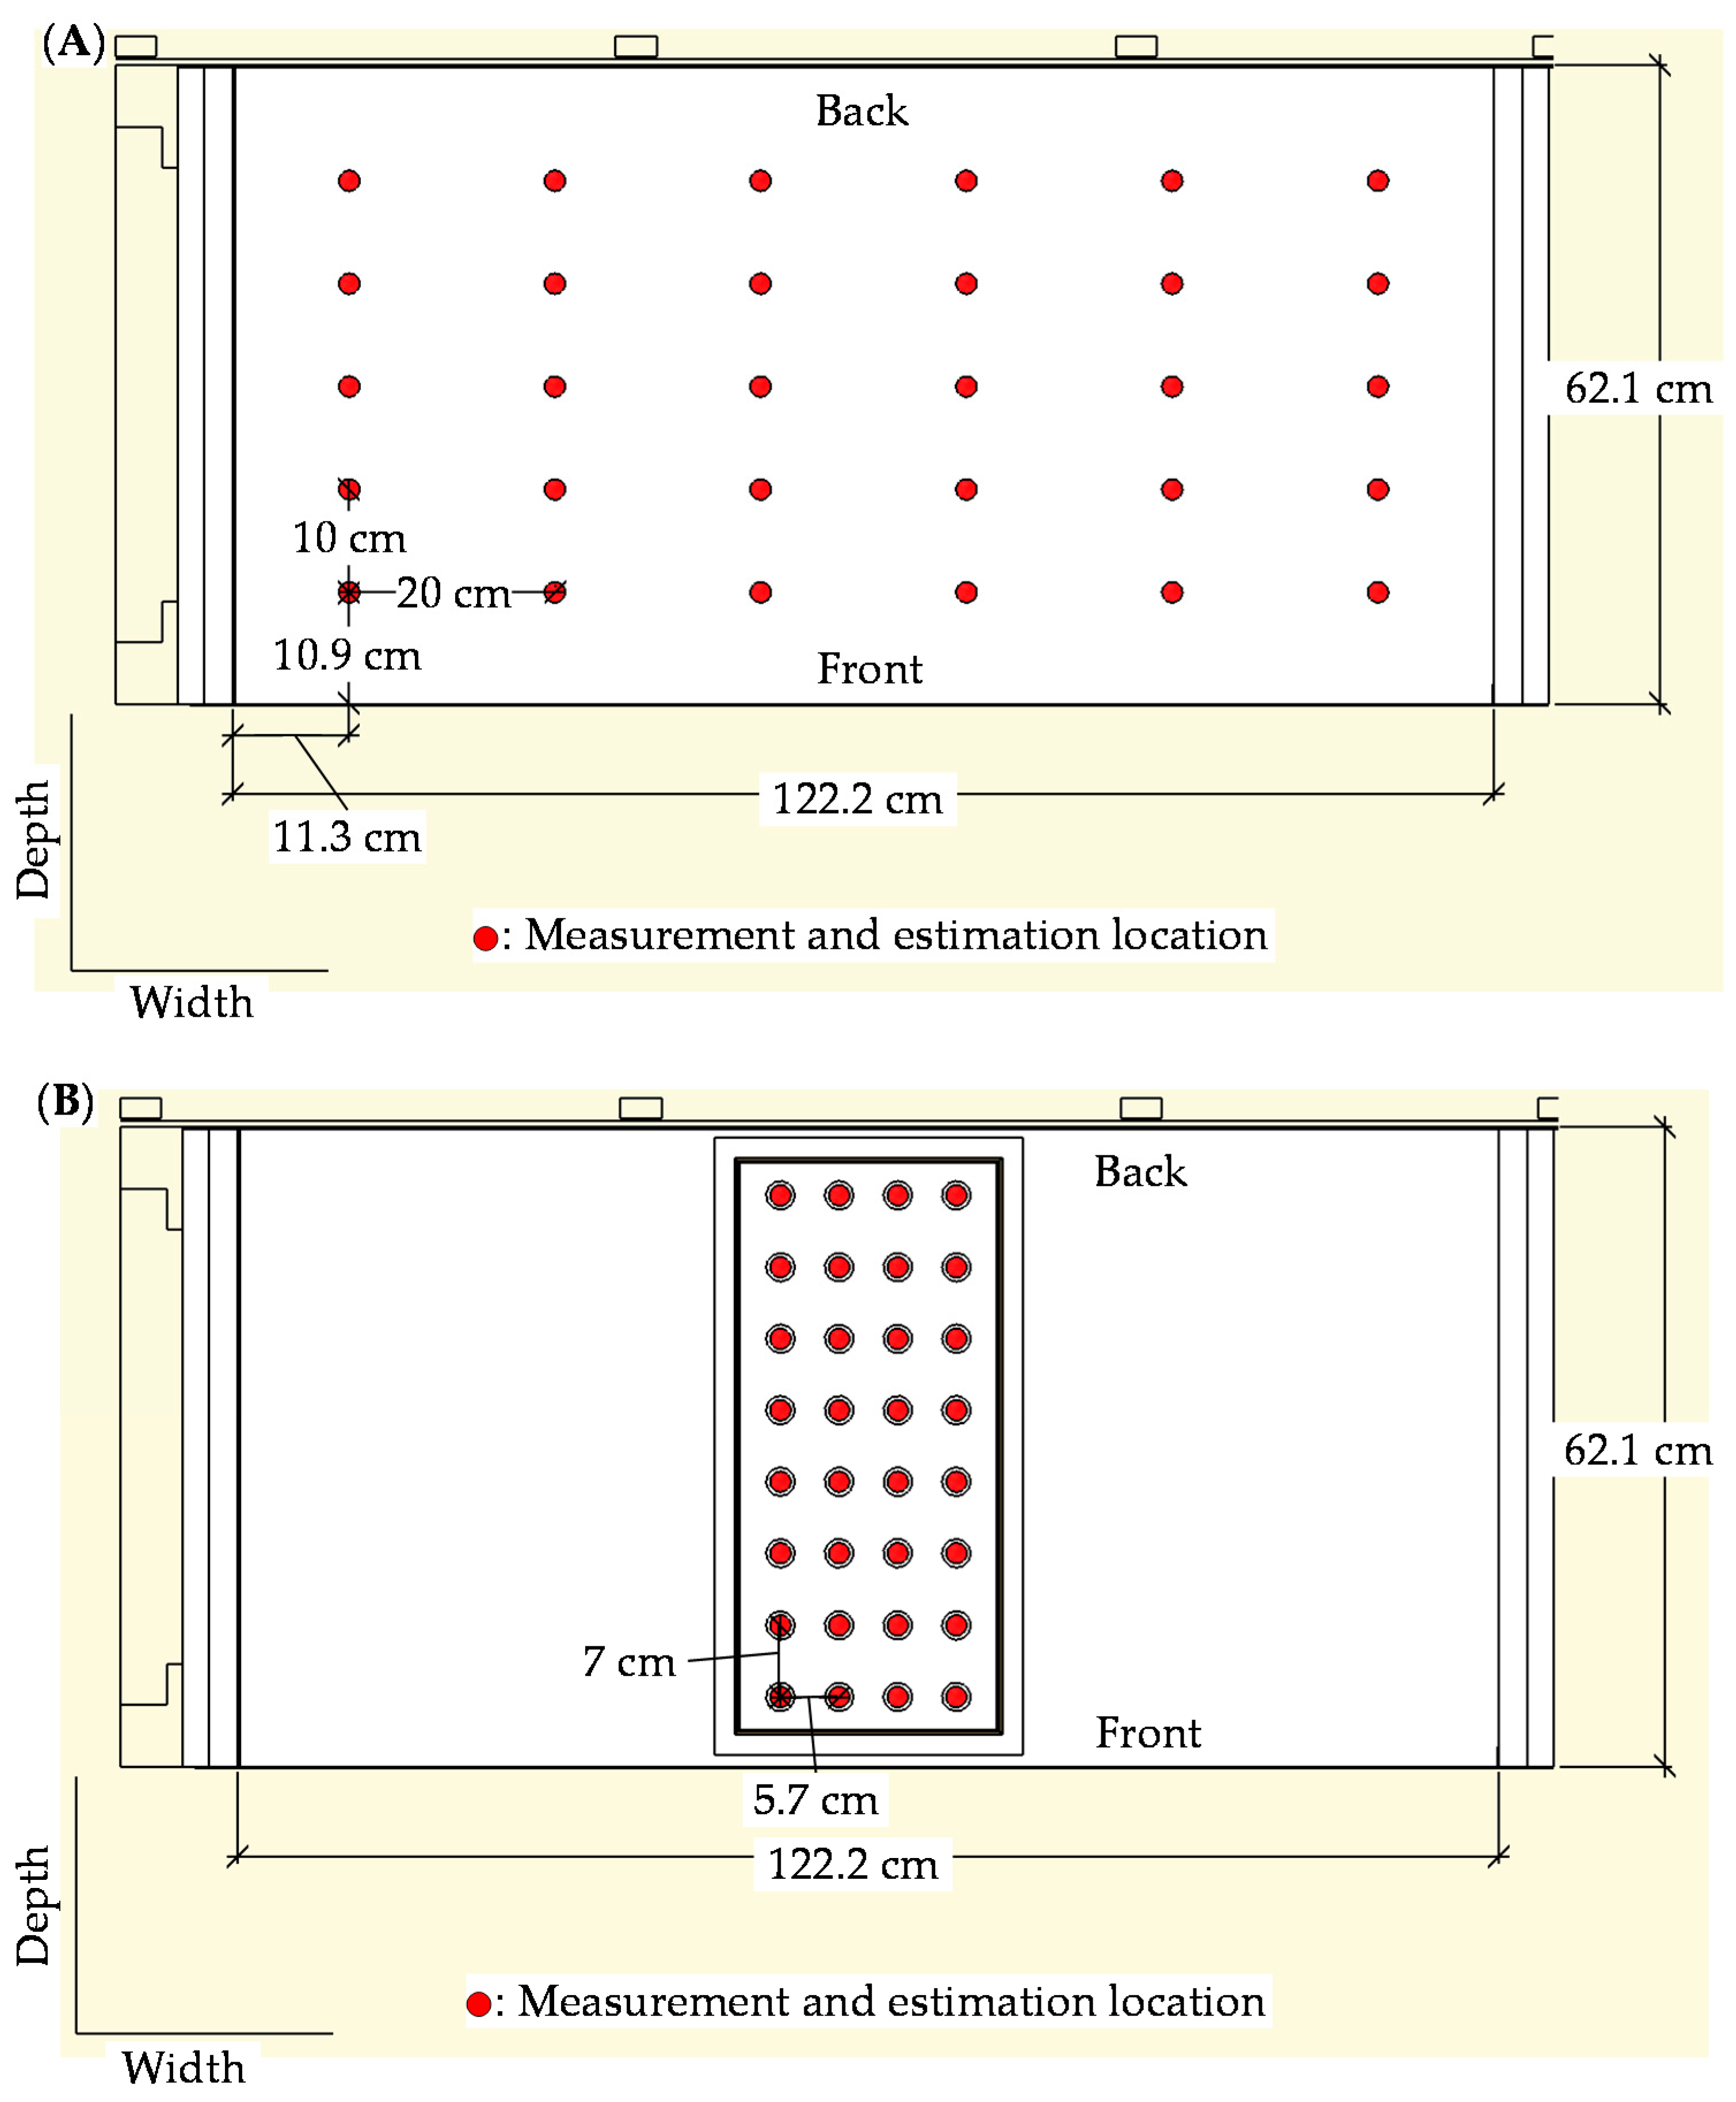
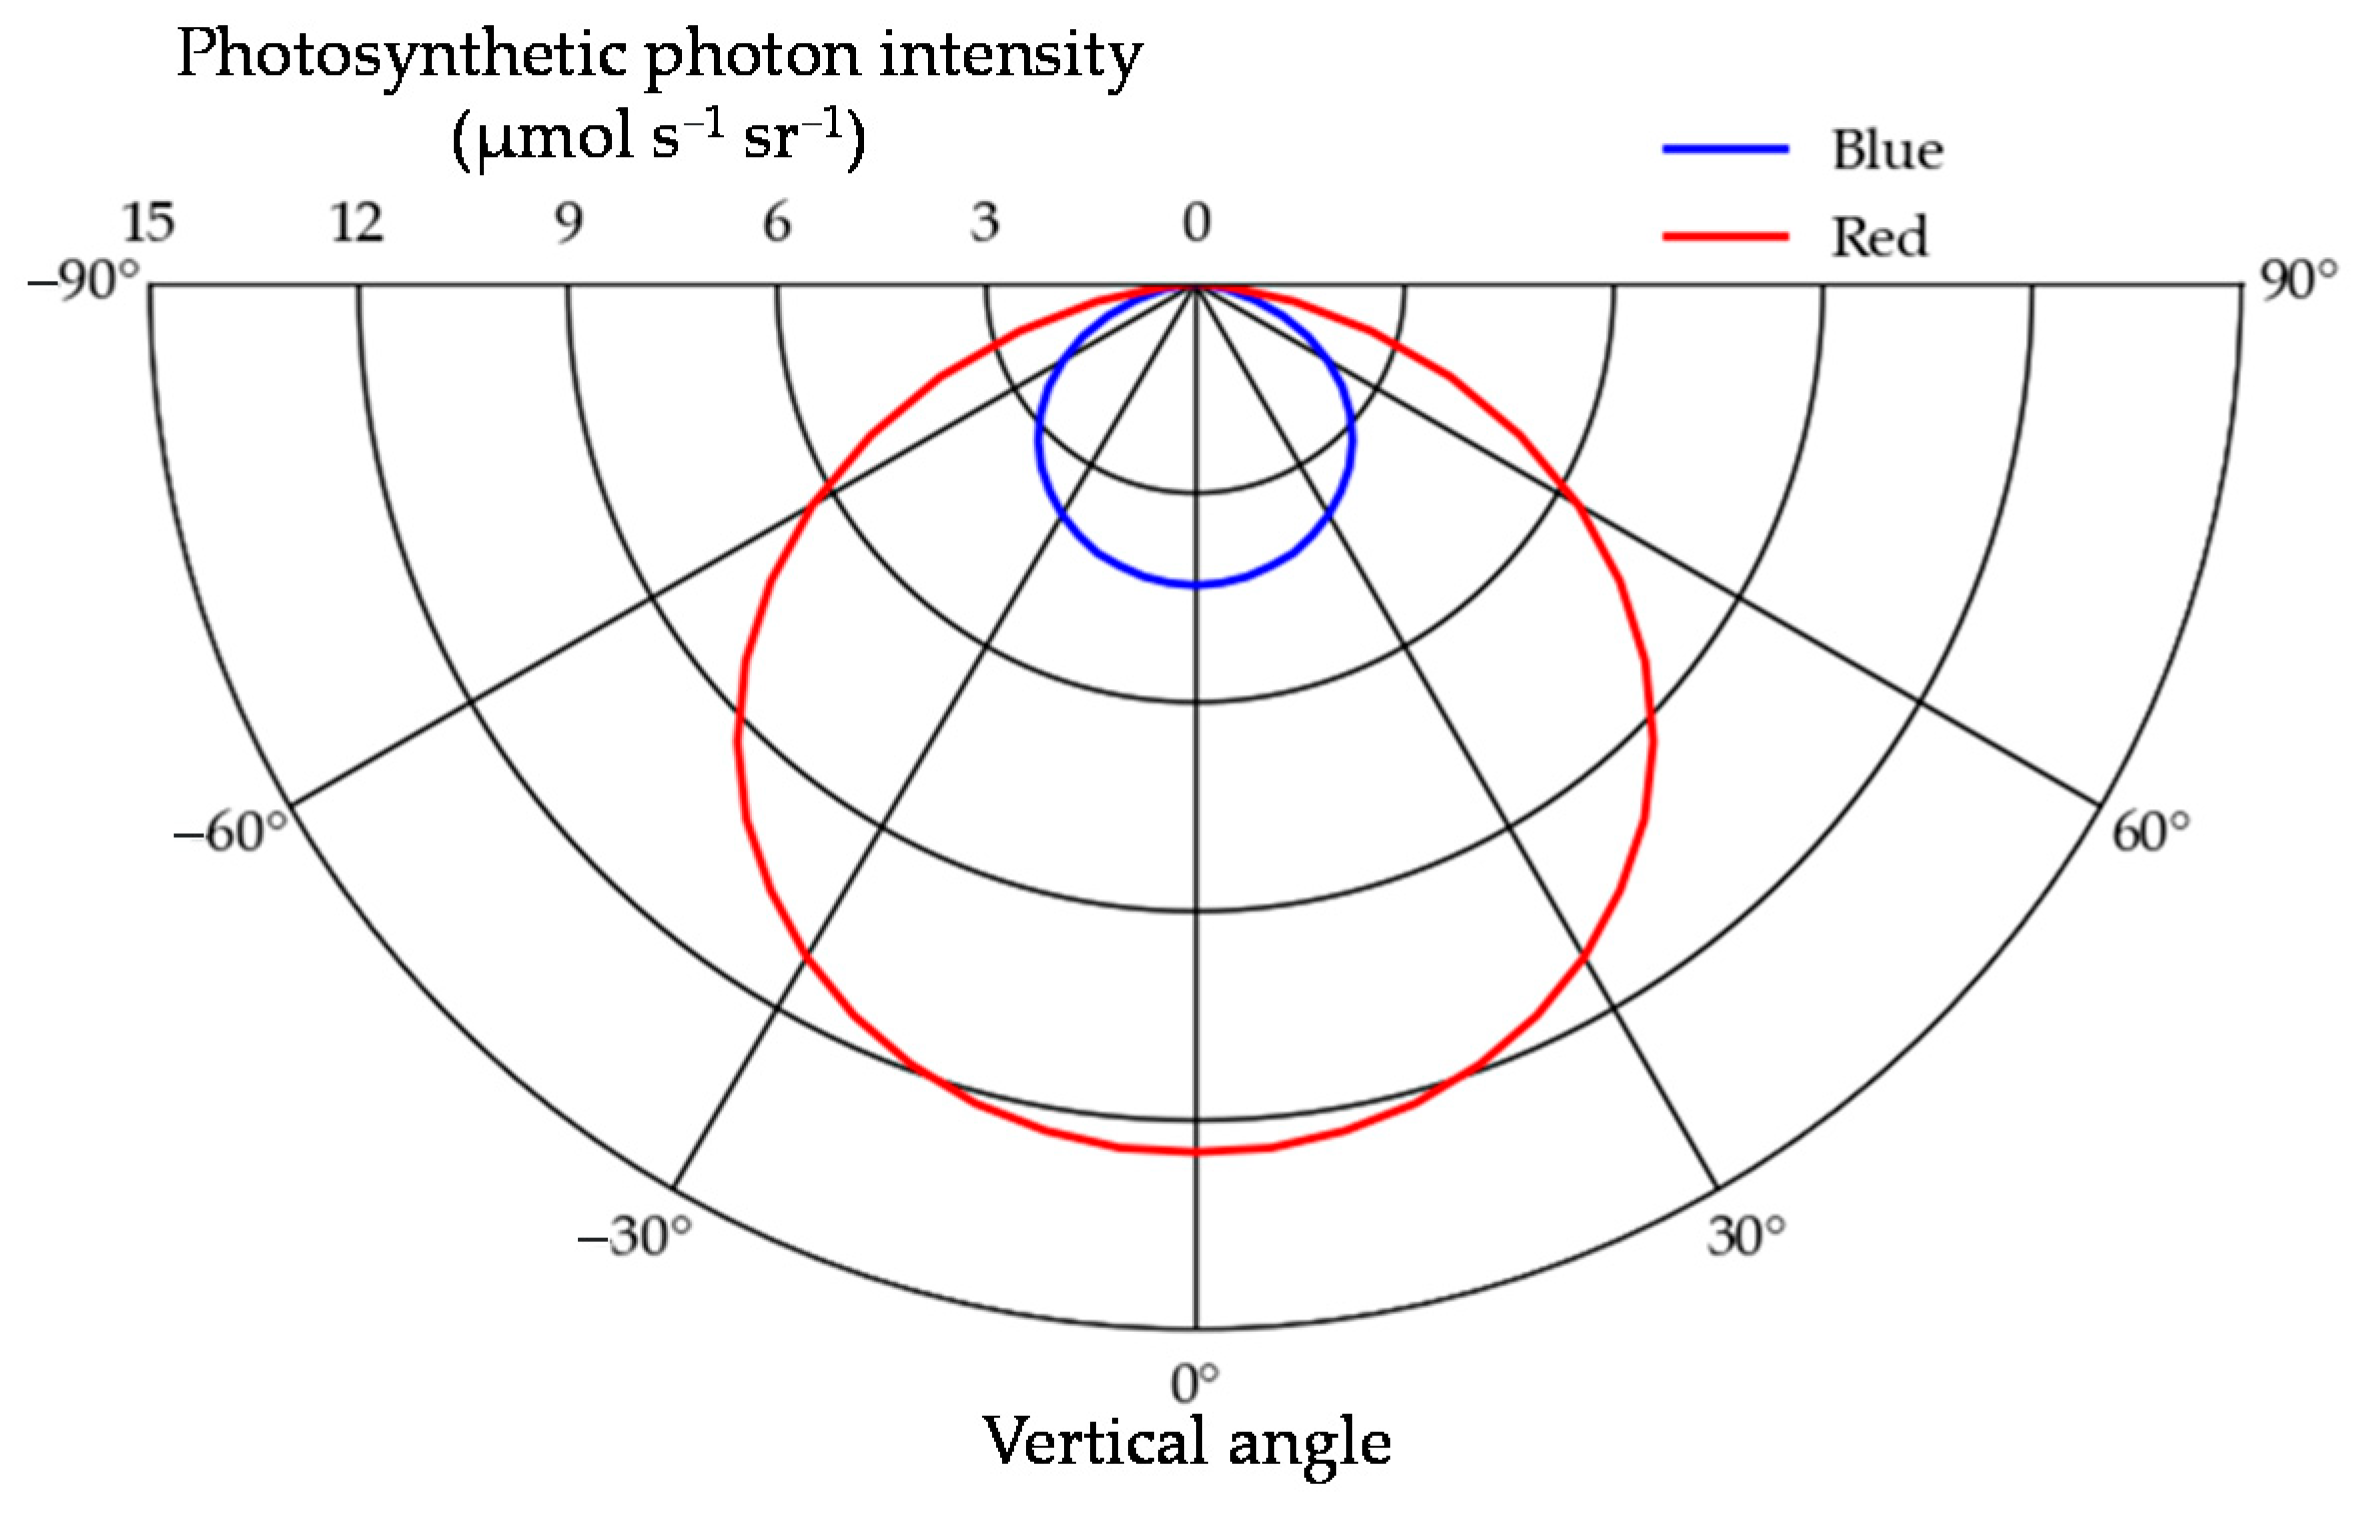
The values of the measured PPFD (PFs, µmol m−2 s−1) and those of the estimated radiant flux (RF’s, W m−2) were acquired at the bottom surface of the cultivation shelf without a container (30 points) and on the growing surface (32 points) (Figure 5). PFs were measured by a quantum sensor (LI-190, LI-COR Inc., Lincoln, NE, USA). The distance between the growing surface and BRLED lamps was set at 21.9 cm. PFs and RF’s for the blue and red light were acquired separately. The radiant flux and light distribution information from the IES file for the BRLED lamp was input into the simulation. The photometric curves of the BRLED lamp are shown in Figure 6. PF and RF’ values were acquired under the conditions that 8 BRLED lamps were arranged at equal intervals at 41 cm in height, and the radiant flux output was set at the maximum and half values.
There were 124 (= (30 + 32) × 2) sets of PF and RF’ values acquired, as the radiant flux of the BRLED lamp was set at the maximum and half values. The values of C for the blue and red light were 5.02 µmol J−1, 7.55 µmol J−1, respectively, and the coefficient of determination (R2) was 0.994. The values of C were used to convert RF’ to the estimated PPFD value (PF’s, µmol m−2 s−1) in the simulations. PF’ was calculated by multiplying RF’ by C.

2.5. Validation of the Optical Simulation

To validate the optical simulation, PF’s were compared with the PFs. The subscripts, “B” and ”R”, indicate blue and red light, respectively, and the subscript, “BR”, indicates the sum of the blue and red light. From the sum values of PF’B and PF’R (PF’sBR, µmol m−2 s−1) and the sum values of each PFB and PFR (PFsBR, µmol m−2 s−1), MAPE between PF’BR and PFBR was calculated as the index of error of PF’BR.

2.6. Set Up for the Lighting Designs

The light environment was simulated using various lighting designs, and the lighting designs were evaluated using the variations of the light absorption for each plant and the coefficient of utilization for the lighting system defined in 2.7., as calculated from the results of the simulation. Three container models were placed on the cultivation shelf model used for the simulation, and 16 canola plant models were placed in each container model. The 3 plant models were reproduced by copying the plant model in SketchUp 2017. The BRLED lamps were placed at a height of 36 cm relative to the bottom surface of the cultivation shelf, and the distance between the BRLED lamps and the top of the plant models was greater than 10 cm, and the average distance between the lamps and plant canopy was approximately 14 cm.
Various lighting designs with 3 variables, such as the number, distance, and light distribution of the BRLED lamps, were constructed.
The output (Φl, µmol s−1) was defined as the sum of PPF for all the BRLED lamps placed on the cultivation shelf. Φl was set at 300 µmol s−1. The output of the light sources must be input into the simulation of Radiance as radiant flux (W). Therefore, the radiant fluxes of the blue and red light per BRLED lamp were calculated by dividing the Φl by C, as described in Section 2.4, and the number of BRLED lamps (N). The values were input into the simulation.
The BRLED lamps could be placed at depths of 3.4–59.4 cm from the front of the cultivation shelf, and the range of movement was 56 cm. The point at a depth of 3.4 cm was defined as Y = 0. Thus, the BRLED lamps could be placed in 0 ≤ Y ≤ 56. As the outside diameter of the BRLED lamp was 3 cm, the distances between the BRLRD lamps were 3 cm or longer. The variable of the distance between the BRLED lamps was D (Figure 7). The position of the i-th BRLED lamp from the front of the cultivation shelf (Yi, cm) is defined as follows:
Y i   =   { 0 Y i 1   +   a   d b   if   i   =   1   otherwise   ( 1     i     N )
b   =     | i     ( N 2   +   1 ) |   +   ( N 2     1 )
where a and d depend on D and N, and a db is the distance between Yi and Yi−1. The range of d varies with N, and consequently, d is normalized to adapt the range of d into 0–1. The normalized d is defined as D, and d is defined by D as follows:
d   =   d min   +   ( d max     d min )   D
where dmax and dmin are the maximum and minimum values of d, respectively, and these values vary with N. When d is less than 1, the BRLRD lamps tend to approach the center of the cultivation shelf (Y = 28 cm). When d is equal to 1, the BRLED lamps are arranged at equal intervals. When d is greater than 1, the BRLRD lamps tend to approach the edges of the cultivation shelf (Y = 0 cm or 56 cm). Because the diameter of the BRLED lamp is 3 cm, a db has to be 3 cm or longer. Thus, the dmin and dmax are equal to the d value, when the minimum value of a db is 3 cm, and meet the following conditions:
a   d max 0   =   3 a   d min b max   =   3  
b max   =   N     ( | N 2 |   +   1 )
Subsequently, from the domain of Y (0 ≤ Y ≤ 56) and the distances between the BRLED lamps (a db), the sum of the distances is 56 cm and a is determined as follows:
i   =   2 N a   d b   =   56   a   =   56 i   =   2 N d b
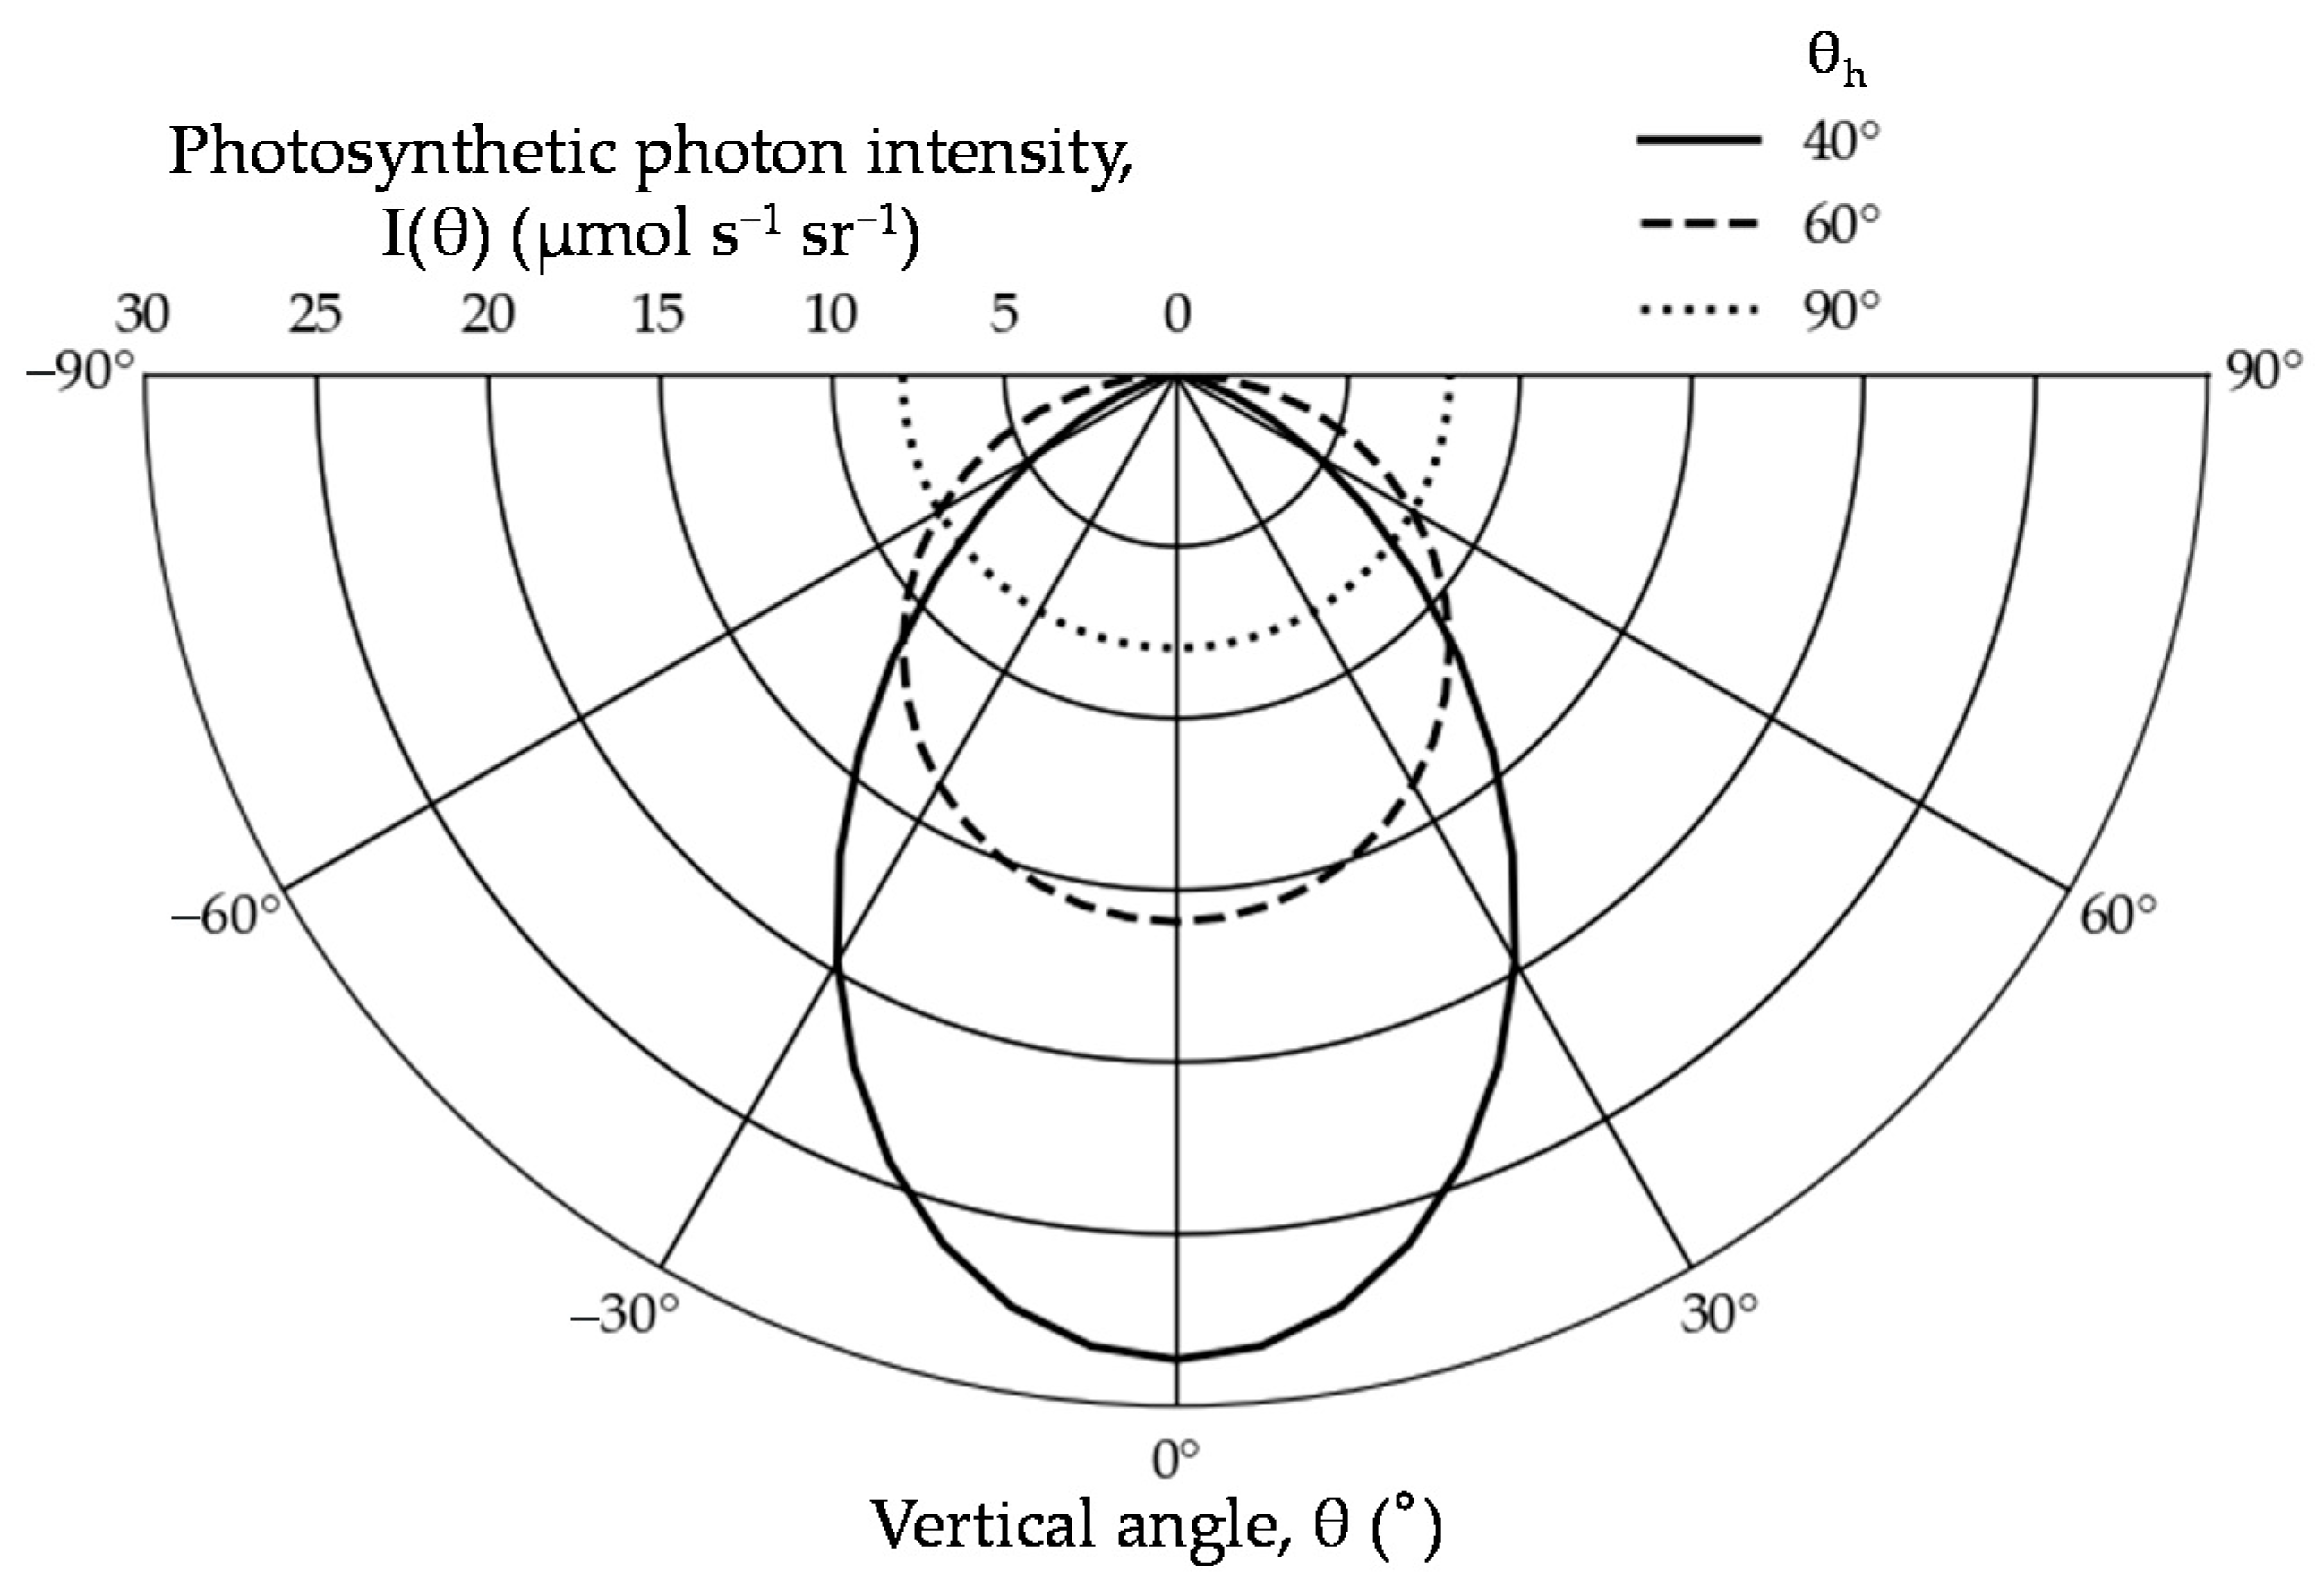
The light distribution of the BRLED lamp was determined using the half-value angle (θh, °). The BRLED lamp does not emit light upward, and the photosynthetic photon intensity (PPI, µmol s−1 sr−1) was constant, regardless of horizontal angle, which is the plane angle on the plane orthogonal to the vertical line. The PPI at θ in the vertical angle (I(θ), µmol s−1 sr−1) is defined as follows:
I ( θ )   =   I max   cos α θ
θh varies with the value of α in Equation (10). Imax varies with the values of N and θh. Based on the condition of Φl = 300 µmol m−2 s−1, as N increases, the PPF per BRLED lamp decreases, and then Imax decreases as θh increases. The photometric curve expressed in Equation (10) was input into the Radiance simulation. Exceptionally, α is 0 when θh is 90°. The photometric curves with the conditions of N = 6 and θh = 40°, 60°, 90° are shown in Figure 8.
The PPFD distributions across the cultivation shelf with or without the plants were estimated using the conditions of N = 4, D = 1, and θh = 90°. This resulted in the variation of the PPFD distribution across the growing surfaces, for the cultivation shelf without plants, being minimized. The distance between the growing surface and BRLED lamps was 21.9 cm.
The lighting designs for the evaluation were made by combining N, D, and θh. The levels of N were 4, 5, 6, 7, and 8. The levels of D were 0, 0.1, 0.2, 0.3, 0.4, 0.5, 0.6, 0.7, 0.8, 0.9, 1, and the calculated value of (1 − dmin)/(dmax − dmin), where d = 1. The levels of θh were 40°, 50°, 60°, 70°, 80°, and 90°. The numbers of levels of N, D, and θh were 5, 12, and 6. Therefore, the number of lighting designs was 360.

2.7. Evaluation Indexes of the Lighting Designs

The evaluation indexes for the lighting designs were the coefficient of variation of the light absorption of each plant (Φp; CV, %) and the coefficient of utilization for the lighting system (U, %). The estimation points were the gravity points of each polygon (i) that constructed the leaf models, and the PPFD on each gravity point was regarded as the PPFD of the light incident on each polygon. The PPFDs on the adaxial and abaxial surfaces of each polygon were estimated, and their sums were defined as PF’both (μmol m−2 s−1).
The light absorption per canola plant (Φp, µmol s−1/plant) was calculated as follows:
Φ p   =   i   =   1 n s i 10 4   PF both ;   i
where n is the number of polygons used to construct 1 canola plant model. Φp; CV is calculated from the Φp values for every simulated plant.
U was defined as the ratio of the total light absorption of 48 canola plants (Φp; total, μmol s−1) to Φl. Φp; the total is defined as follows:
Φ p ;   total   =   i   =   1 48 Φ p ;   i
Therefore, U is given by
U   =   100   Φ p ;   total Φ l

3. Results

3.1. Estimation Accuracy of the PPFD

The relationship between PFBR and PF’BR is shown in Figure 9. From Figure 9, it is clear that it is possible to estimate the PPFD in an artificial light environment using Radiance. The MAPE between PFBR and PF’BR was 4.50%. Since the MAPE of PF’BR was 4.50%, assuming that the PPFD on the leaves was approximately 250 µmol m−2 s−1, the estimated PPFD would be 239–261 µmol m−2 s−1. However, the PPFD on some polygons was overestimated, while for others it was underestimated. Therefore, the relative error of the estimated light absorption for the whole plant or plant canopy would be smaller than 4.50%.

3.2. Differences in the PPFD Distributions with or without Plants

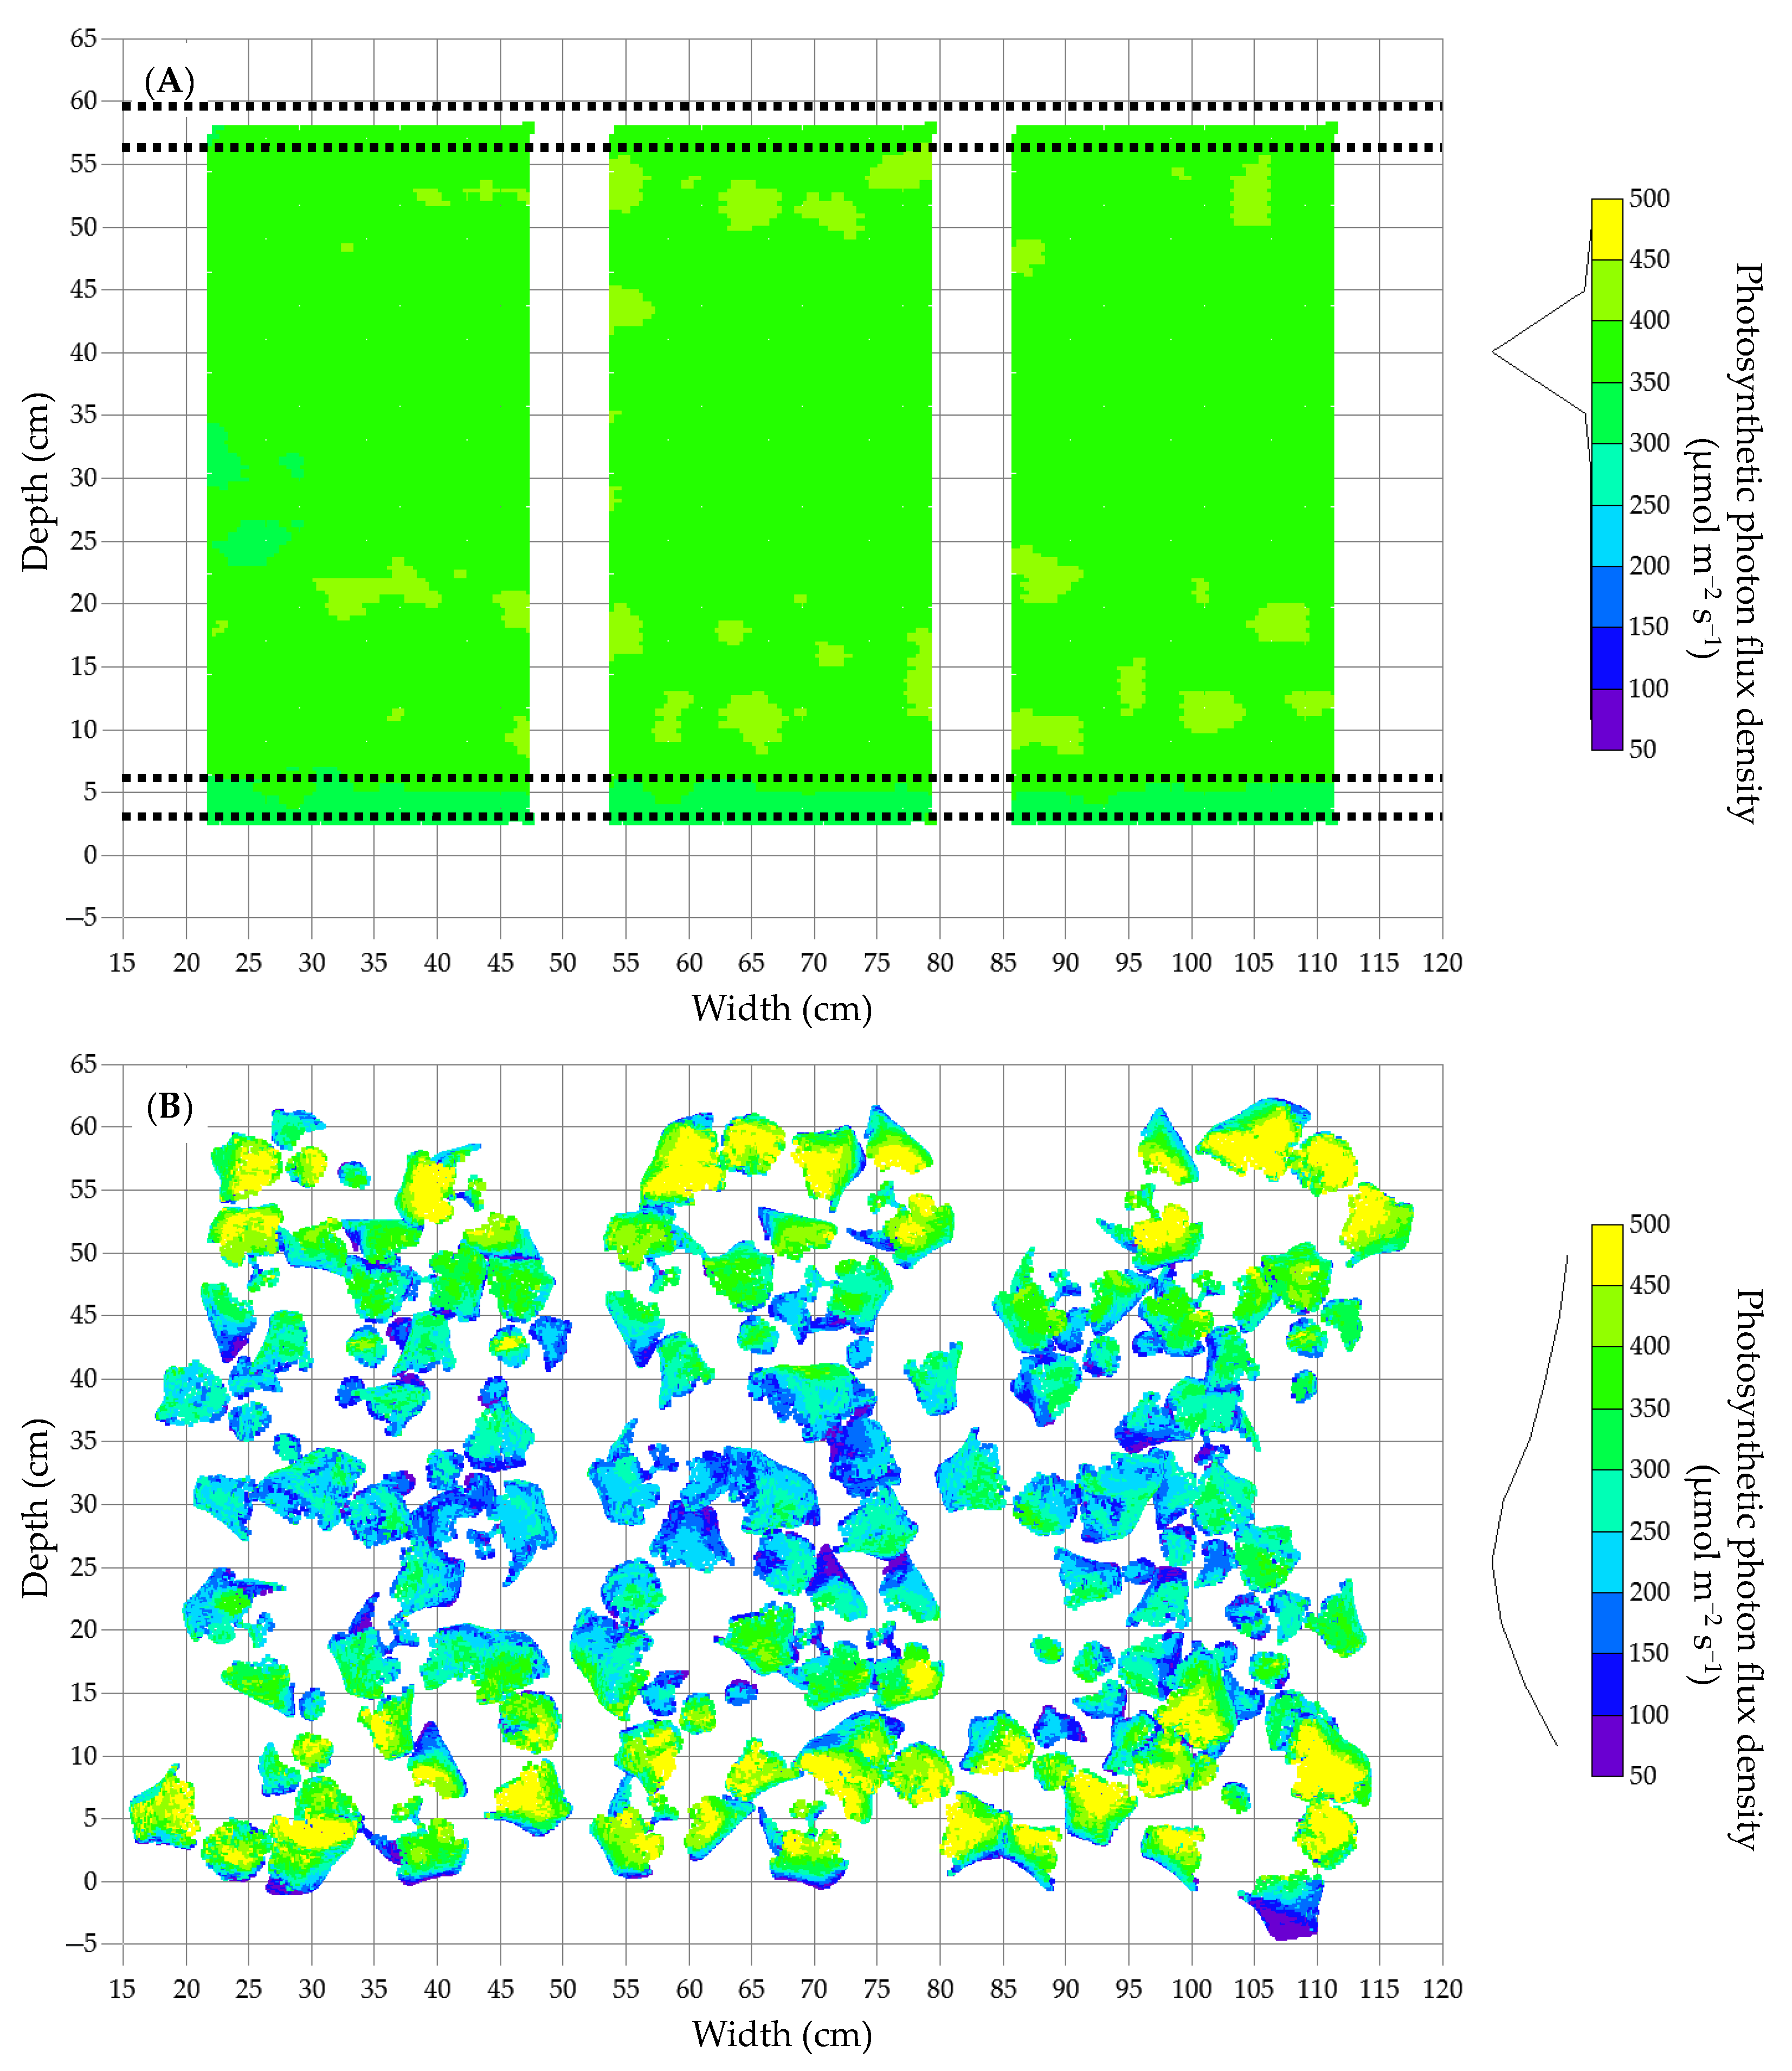
The PPFD distributions on the growing surfaces without canola plants and canola leaves are shown in Figure 10. The variation in the spatial distribution of the PPFD and the variation of the frequency distribution on the growing surfaces were smaller than those on the leaves. The mode value of the frequency distribution of PPFD without the canola plants was larger than that on the leaves. The coefficient of variation of PPFD values on the growing surfaces without canola plants and canola leaves were 4.2% and 44.6%, respectively.

3.3. Relationship between the Variables and the Evaluation Indexes for the Lighting Designs

The relationships between three variables (N, D (d), θh) and two evaluation indexes (Φp; CV and U) for the lighting designs are shown in a scatter plot matrix in Figure 11. The upper triangular matrix of the scatter plot matrix contains the coefficients of correlation for each two element combination. The diagonal matrix of the scatter-plot matrix contains the histograms for each element. The lower triangular matrix of the scatter plot matrix contains the scatter plots for each two element combination. Each plot was color-coded according to N.
For the condition of N = 4, the ranges for the two evaluation indexes were wider than those for the other N conditions. Therefore, the effects of the other variables for the lighting design (D (d), θh) on the evaluation indexes increased. U decreased with increasing D (d). Φp; CV was minimized under the condition of a specific D (d) value with respect to N, and Φp; CV increased as D became smaller or larger than the specific D value. The d values that minimize Φp; CV with respect to N were slightly larger than 1. The range of Φp; CV became narrower with increasing θh. The minimum values of Φp; CV decreased with decreasing θh. If U was larger than 75%, there was a positive correlation between Φp; CV and U, and if U was smaller than 75%, there was a negative correlation between Φp; CV and U.

4. Discussion

4.1. Differences in the Light Environments with or without Plants

From Figure 10, even though the lighting design was created to have a uniform PPFD distribution across the growing surfaces, it was found that it would not be uniform across a plant canopy. If the variable D is 1, the BRLED lamps tend to approach the edges of the cultivation shelf, where they are placed at depths of about 5 cm and 55 cm, as shown in Figure 10. The PPFD on the leaves directly below the BRLED lamps was relatively high, and the PPFD on the leaves in the other regions was relatively low. In cultivation spaces without plants, there are no leaves that have low reflectance, so the effect of the reflected light increases. On the other hand, if the cultivation space has plants, the leaves absorb the light from the BRLED lamps and the reflected light decreases. Hence, the fraction of direct light would increase. Thus, the fractions of direct and reflected light differ, depending on the presence or absence of plants, and the effects of the BRLED lamp layout on the PPFD distribution would change. Additionally, the difference of distances between the growing surface and the BRLED lamps and between the canola canopy and the lamps would cause the PPFD distribution change.
Even though the PPFD distribution for the growing surfaces has been made uniform, that for the plant canopy would not be uniform. However, it is tedious to measure the PPFD at the canopy in detail. For greenhouse research, many researches have simulated the light environment of the plant canopy and the floor in a greenhouse with or without supplemental lighting [22,23,24,25,26,27]. On the contrary, a few researches have simulated the light environment in a PFAL [13,14]. Moreover, fewer researches have used plant 3D models [14]. By using 3D plant models and optical simulations, it is possible to estimate and evaluate a PPFD distribution on a plant canopy. Thus, for the assessment of light absorption by each plant, it is useful to evaluate lighting designs using optical simulations.

4.2. Effects of the Lighting Design Variables on the Evaluation Indexes

4.2.1. The Number of BRLED lamps (N)

The reason why the ranges for the two evaluation indexes (Φp; CV and U) became wider with decreasing N was due to the effect of one lamp on the light environment: N became more significant as its value decreased (Figure 11). When the distributions of the two evaluation indexes were inclined towards preferable directions, more lamps were used in these lighting designs. Therefore, lighting designs in which more lamps were used decreased the probability of failures, such as high variation of light absorption and low coefficient of utilization for the lighting system. However, when N = 4, the evaluation indexes showed that better evaluation indexes depending on the values of D and θh. For example, when N = 4, d = 1, D = 0.054, and θh = 40, the value of Φp; CV was comparable to the minimum values of Φp; CV for the cases of N ≥ 5, and the differences in the values for Φp; CV were smaller than 1%. In general, the initial cost of a PFAL and the renewal costs for the lamps can be reduced by decreasing the number of lamps. Therefore, decreasing the number of lamps is an option for good lighting designs, and has a cost advantage. However, if the number of lamps is small, the effect of one lamp on the light environment becomes large. Hence, the light environment would change drastically if the optical design and the position of a single lamp were altered. Therefore, compared to a lighting design with many lamps, it would be more difficult to make a lighting design with fewer lamps, that results in a desirable light environment. However, using optical simulations to solve this problem can be useful.

4.2.2. Distances of BRLED Lamps (D (d))

U tended to decrease with increasing D (d) (Figure 11). As the BRLED lamps approach the edges of the cultivation shelf with increasing D, the fraction of light incident on the plants via reflection from the wall surfaces relative to the light emitted from the blue and red LED chips and the fraction of light escaping from the cultivation shelf without entering the plants would increase. The reflectance of the back surface of the cultivation shelf was 37% and the reflectance of the other surfaces was approximately 91%. Thus, the fraction of light incident on those surfaces increased, and then, the light use efficiency decreased, as the amount of light absorbed by objects other than plants increased.
Φp; CV was minimized when d was approximately 1.1, depending on N. From the relationship between D and Φp; CV, D values that minimize Φp; CV increased with increasing N. As N increases, the number of BRLED lamps that affect the light environment near the center of the cultivation shelf increases, and the distances between the BRLED lamps, tend to narrow. Therefore, the effects on the light environment near the center of the cultivation shelf increase with increasing N. Thus, the PPFD near the center of the cultivation shelf would tend to increase with increasing N. Preventing the PPFD near the center of the cultivation shelf from being high would result in reducing the Φp; CV. Hence, D values that minimize Φp; CV increase with increasing N. Regardless of the value of N, Φp; CV could be reduced by controlling the D value, and the D values that minimize Φp; CV varied with N. Thus, in a PFAL, it would be possible to reduce the variation of the light absorption of each plant by controlling the distances between the lamps, depending on the number of lamps.

4.2.3. Light Distribution Characteristics (θh)

The range of Φp; CV became narrower with increasing θh. The minimum values of the Φp; CV with respect to θh decreased with decreasing θh. If θh is large, the directionality of the light distribution of the BRLED lamp is low, and then the effect of the layout of the BRLED lamps on Φp; CV, would become small.
A BRLED lamp with low directivity radiates a great amount of light obliquely downward. Therefore, a region in which light from each BRLED lamp overlaps extends, and the light environment under a certain BRLED lamp is susceptible to the light from neighboring BRLED lamps. If θh is small, the directionality of the light distribution of the BRLED lamp is high. Hence, a BRLED lamp with high directionality can radiate light locally, and the light environment under a certain BRLED lamp is less susceptible to the light from its neighbors. Therefore, BRLED lamps with high directionality can control PPFD distribution precisely, when compared to BRLED lamps with low directionality. Hence, the minimum values of Φp; CV with respect to θh would decrease with decreasing θh. Thus, by appropriately controlling the layout of the lamps with high directionality, it would be possible to create lighting designs that reduce Φp; CV.

4.3. Optimization of the Lighting Design Variables

In this study, the number (N), distance (D, d), and light distribution (θh) of the BRLED lamps were used as the variables for the lighting design. Few studies simulate the light environment in a PFAL by altering the variables of the lighting design, such as the distance (D) and light distribution (θh) of lamps, which are defined as continuous values. Φp; CV and U varied with those variables. In this study, the combinations of variables that minimize Φp; CV, or maximize U (Figure 11) were obtained. It would be possible to find the optimal lighting design that establishes a suitable light environment by simulating a light environment with various lighting designs. In this study, blue and red LED chips were used as light sources, and blue and red light was simulated separately. The light quality of the BRLED lamps can be controlled by altering the outputs of the blue and red LED chips. It would then be possible to find a lighting design that improves the spectral light distribution on a cultivation shelf, such as average R:B ratio or red:far-red ratio, and variation of these ratios.
Other than those variables, the output of the lamps, optical properties of the wall surfaces, etc. can be taken into account when making lighting designs in practice. Moreover, it is possible to use several kinds of lamps whose outputs, light qualities, and light distributions differ. Furthermore, the layout of the lamps, determined systematically by Equation (4), could be designed to be more flexible and arbitrary. Akiyama and Kozai (2016) reported that the light intensity in the edge regions could be increased by using a combination of lamps commonly used in a PFAL and lamps with high directionality [13]. In this study, although the light environment was simulated under the conditions of 360 lighting designs, unconsidered variables remained, including the output of lamps, more flexible lamp layout, spectral light distribution, etc.
The greater the number of variables for the lighting design, the larger the number of combinations of said variables becomes. Although it is possible to simulate all the combinations, the actual calculation time is excessive. Moreover, it would be difficult to select a lighting design suitable for practical cultivation with increasing combinations since if the number of evaluation indexes is multiple, there would be trade-off relationships within evaluation indexes.
In the field of architecture, several studies have used a combination of optical simulation and optimization methods to find an optimal lighting design [28,29]. Also in the field of agriculture, Ferentinos and Albright (2005) searched for the optimal supplemental lighting designs considering light uniformity, light integral, shading effects of the supplemental lamps, and operational and investment costs [22]. By using the method for making lighting designs for a PFAL, it would be possible to find an optimal lighting design for plant production in a PFAL.

4.4. Optimization of Lighting Costs in a PFAL via Simulation

It is important to maximize the revenue of products and minimize the cost of practical production in a PFAL. Kozai (2013) reported that a simulation combining the plant growth model, environmental model, and business model was useful for the practical operation of a PFAL [1]. In this study, two evaluation indexes were used. Φp; CV affects the uniformity of plant growth, and U affects the efficiency of lighting in plant production. For vegetables, the amount of photosynthesis is related to the leaf weight and the yield of cultivation. From the estimated PPFD, the amount of photosynthesis can be calculated; subsequently, the yield can be estimated. A large portion of the operating costs in a PFAL is the electric costs for lighting and air conditioning, and both costs have high correlation. By calculating the electricity consumption cost from the lighting design, the yield per electric energy unit can be calculated. Thus, it is possible to correlate the lighting cost and yield based on light system simulation.

5. Conclusions

We have used optical simulation to investigate the effects of lighting designs in plant factories with artificial light (PFALs) on the coefficient of variation for the individual plants light absorption (Φp; CV) and the coefficient of utilization for the lighting system (U). First, we estimated PPFD distributions in cultivation spaces with or without canola plants. Subsequently, we estimated PPFD on canola leaves with various lighting design parameters, such as number, distance, height, radiant flux, and light distribution of the BRLED lamps. The optical simulations showed good accuracy for estimating the PPFD distributions on the cultivation shelf and leaves of the canola plants. The results showed that even though the PPFD distribution on the growing surfaces was uniform, the PPFD distribution on a plant canopy would not be uniform. By appropriately controlling the layout of the lamps with high directionality, lighting designs with fewer Φp; CV could be created. It is possible to evaluate the predetermined lighting designs before constructing cultivation shelf and to improve the present lighting design with non-uniform PPFD distribution or low light use efficiency. It can be concluded that optical simulations can be a useful tool with which to improve lighting designs to decrease Φp; CV and improve U in PFAL.

Author Contributions

Methodology, investigation, analysis, writing—original draft preparation, K.S.; software, validation, Y.I.; conceptualization, writing—review, and editing E.G. All authors have read and agreed to the published version of the manuscript.

Funding

This work was supported by the Ministry of Economy, Trade and Industry of Japan [a Grant-in-Aid from the Development of Fundamental Technologies for the Production of High-Value Materials Using Transgenic Plant project].

Conflicts of Interest

The authors declare no conflict of interest.

Appendix A

Table A1. List of symbols and these descriptions.
SymbolDescriptionUnit
aParameter of BRLED lamp distance-
bParameter of BRLED lamp distance-
CConversion coefficient between radiant flux and photosynthetic photon fluxµmol J−1
CVCoefficient of variation%
dParameter of BRLED lamp distancecm
DNormalized d-
I(θ)Photosynthetic photon intensity at θ in vertical angleµmol s−1 sr−1
ImaxPhotosynthetic photon intensity at 0° in vertical angleµmol s−1 sr−1
NNumber of BRLED lamps-
PFMeasured photosynthetic photon flux densityµmol m−2 s−1
PF‘Estimated photosynthetic photon flux densityµmol m−2 s−1
RF‘Estimated radiant flux densityW m2
sArea of 1 polygoncm2
SArea of 1 leaf 3D modelcm2
UCoefficient of utilization for the lighting system%
YiPosition on Y-axis of the i-th lamp from the front of the cultivation shelfcm
αExpornent of cosθ in Equation (10)-
θVertical angle°
θhHalf-value angle of photometric curve°
ΦPhotosynthetic photon fluxµmol s−1
ΦlPhotosynthetic photon flux emitted from N BRLED lampsµmol s−1
ΦpPhotosynthetic photon flux entering 1 plantµmol s−1/plant
Φp; CVCoefficient of variation of Φp%
Φp; totalTotal photosynthetic photon flux entering a canopyµmol s1

References

  1. Kozai, T. Resource use efficiency of closed plant production system with artificial light: Concept, estimation and application to plant factory. Proc. Japan Acad. Ser. B 2013, 89, 447–461. [Google Scholar] [CrossRef] [PubMed] [Green Version]
  2. Goto, E. Plant production in a closed plant factory with artificial lighting. Acta Hortic. 2012, 956, 37–49. [Google Scholar] [CrossRef]
  3. Kozai, T.; Ohyama, K.; Chun, C. Commercialized closed systems with artificial lighting for plant production. Acta Hortic. 2006, 711, 61–70. [Google Scholar] [CrossRef]
  4. Furuyama, S.; Ishigami, Y.; Hikosaka, S.; Goto, E. Effects of blue/red ratio and light intensity on photomorphogenesis and photosynthesis of red leaf lettuce. Acta Hortic. 2014, 1037, 317–322. [Google Scholar] [CrossRef]
  5. Kim, S.K.; Jeong, M.S.; Park, S.W.; Kim, M.J.; Na, H.Y.; Chun, C. Improvement of runner plant production by increasing photosynthetic photon flux during strawberry transplant propagation in a closed transplant production system. Kor. J. Hort. Sci. Technol. 2010, 28, 535–539. [Google Scholar]
  6. Wheeler, R.M.; Tibbitts, T.W.; Fitzpatrick, A.H. Carbon dioxide effects on potato growth under different photoperiods and irradiance. Crop Sci. 1991, 31, 1209–1213. [Google Scholar] [CrossRef] [PubMed]
  7. Yanagi, T.; Okamoto, K.; Takita, S. Effects of blue, red, and blue/red lights of two different PPF levels on growth and morphogenesis of lettuce plants. Acta Hortic. 1996, 440, 117–122. [Google Scholar] [CrossRef]
  8. Zhang, X.; He, D.; Niu, G.; Yan, Z.; Song, J. Effects of environment lighting on the growth, photosynthesis, and quality of hydroponic lettuce in a plant factory. Int. J. Agric. Biol. Eng. 2018, 11, 33–40. [Google Scholar] [CrossRef]
  9. Zou, T.; Huang, C.; Wu, P.; Ge, L.; Xu, Y. Optimization of artificial light for spinach growth in plant factory based on orthogonal test. Plants 2020, 9, 490. [Google Scholar] [CrossRef]
  10. Graamans, L.; Baeza, E.; van den Dobbelsteen, A.; Tsafaras, I.; Stanghellini, C. Plant factories versus greenhouses: Comparison of resource use efficiency. Agric. Syst. 2018, 160, 31–43. [Google Scholar] [CrossRef]
  11. Graamans, L.; Tenpierik, M.; van den Dobbelsteen, A.; Stanghellini, C. Plant factories: Reducing energy demand at high internal heat loads through façade design. Appl. Energy 2020, 262, 114544. [Google Scholar] [CrossRef]
  12. Zhang, Y.; Kacira, M.; An, L. A CFD study on improving air flow uniformity in indoor plant factory system. Biosyst. Eng. 2016, 147, 193–205. [Google Scholar] [CrossRef]
  13. Akiyama, T.; Kozai, T. Light environment in the cultivation space of plant factory with LEDs. In LED Lighting for Urban Agriculture; Kozai, T., Fujiwara, K., Runkle, E.S., Eds.; Springer Singapore: Singapore, 2016; pp. 91–109. ISBN 978-981-10-1846-6. [Google Scholar]
  14. Kim, J.W. 3D Plant Model-based Estimation of Light Interception and Photosynthetic Rate of Lettuces Grown under LEDs in Plant Factory. Master’s Thesis, College of Agriculture and Life Sciences, Seoul National University, Seoul, Korea, August 2019. [Google Scholar]
  15. Kozai, T. Why LED lighting for urban agriculture? In LED Lighting for Urban Agriculture; Springer Singapore: Singapore, 2016; pp. 3–18. ISBN 978-981-10-1846-6. [Google Scholar]
  16. Takita, S.; Okamoto, K.; Yanagi, T. Computer simulation of PPF distribution under blue and red LED light source for plant growth. Acta Hortic. 1996, 440, 286–291. [Google Scholar] [CrossRef]
  17. Harbick, K.; Albright, L.D. Comparison of energy consumption: Greenhouses and plant factories. Acta Hortic. 2016, 285–292. [Google Scholar] [CrossRef]
  18. Fang, H.; Li, K.; Wu, G.; Cheng, R.; Zhang, Y.; Yang, Q. A CFD analysis on improving lettuce canopy airflow distribution in a plant factory considering the crop resistance and LEDs heat dissipation. Biosyst. Eng. 2020, 200, 1–12. [Google Scholar] [CrossRef]
  19. Qian, T.; Elings, A.; Dieleman, J.A.; Gort, G.; Marcelis, L.F.M. Estimation of photosynthesis parameters for a modified Farquhar–von Caemmerer–Berry model using simultaneous estimation method and nonlinear mixed effects model. Environ. Exp. Bot. 2012, 82, 66–73. [Google Scholar] [CrossRef]
  20. Son, K.-H.; Ide, M.; Goto, E. Growth characteristics and phytochemicals of canola (Brassica napus) grown under UV radiation and low root zone temperature in a controlled environment. Hortic. Environ. Biotechnol. 2020, 61, 267–277. [Google Scholar] [CrossRef]
  21. The Illuminating Engineering Institute of Japan. Illuminating Engineering; 1; Ohmsha, Ltd.: Tokyo, Japan, 2012; ISBN 978-4274212611. [Google Scholar]
  22. Ferentinos, K.P.; Albright, L.D. Optimal design of plant lighting system by genetic algorithms. Eng. Appl. Artif. Intell. 2005, 18, 473–484. [Google Scholar] [CrossRef]
  23. Buck, G.H.; Hemmerling, R.; Vos, J.; de Visser, P.H.B. Modelling of spatial light distribution in the greenhouse: Description of the model. In Proceedings of the 2009 Third International Symposium on Plant Growth Modeling, Simulation, Visualization and Applications, Beijing, China, 3–13 November 2009; IEEE Computer Society: Los Alamitos, CA, USA, 2009; pp. 79–86. [Google Scholar]
  24. Kim, J.H.; Lee, J.W.; Ahn, T.I.; Shin, J.H.; Park, K.S.; Son, J.E. Sweet pepper (Capsicum annuum L.) canopy photosynthesis modeling using 3D plant architecture and light ray-tracing. Front. Plant Sci. 2016, 7, 1321. [Google Scholar] [CrossRef] [Green Version]
  25. Jung, D.; Lee, J.; Kang, W.; Hwang, I.; Son, J. Estimation of whole plant photosynthetic rate of irwin mango under artificial and natural lights using a three-dimensional plant model and ray-tracing. Int. J. Mol. Sci. 2018, 19, 152. [Google Scholar] [CrossRef] [Green Version]
  26. de Visser, P.H.B.; Buck-Sorlin, G.H.; van der Heijden, G.W.A.M. Optimizing illumination in the greenhouse using a 3D model of tomato and a ray tracer. Front. Plant Sci. 2014, 5. [Google Scholar] [CrossRef] [PubMed] [Green Version]
  27. Both, A.; Ciolkosz, D.; Albright, L.D. Evaluation of light uniformity underneath supplemental lighting systems. Acta Hortic. 2002, 183–190. [Google Scholar] [CrossRef]
  28. Shimomura, N.; Imai, S. Optimizing illuminance distribution using genetic algorithm. J. Illum. Eng. Inst. Japan 2006, 90, 90–96. [Google Scholar] [CrossRef] [Green Version]
  29. Yoshida, M.; Yoneda, S.; Fujii, S.; Morita, H.; Sogo, T. Genetic algorithm approach to a lighting design problem for desired illuminance. J. Sci. Technol. Light. 1999, 83, 137–138. [Google Scholar] [CrossRef] [Green Version]
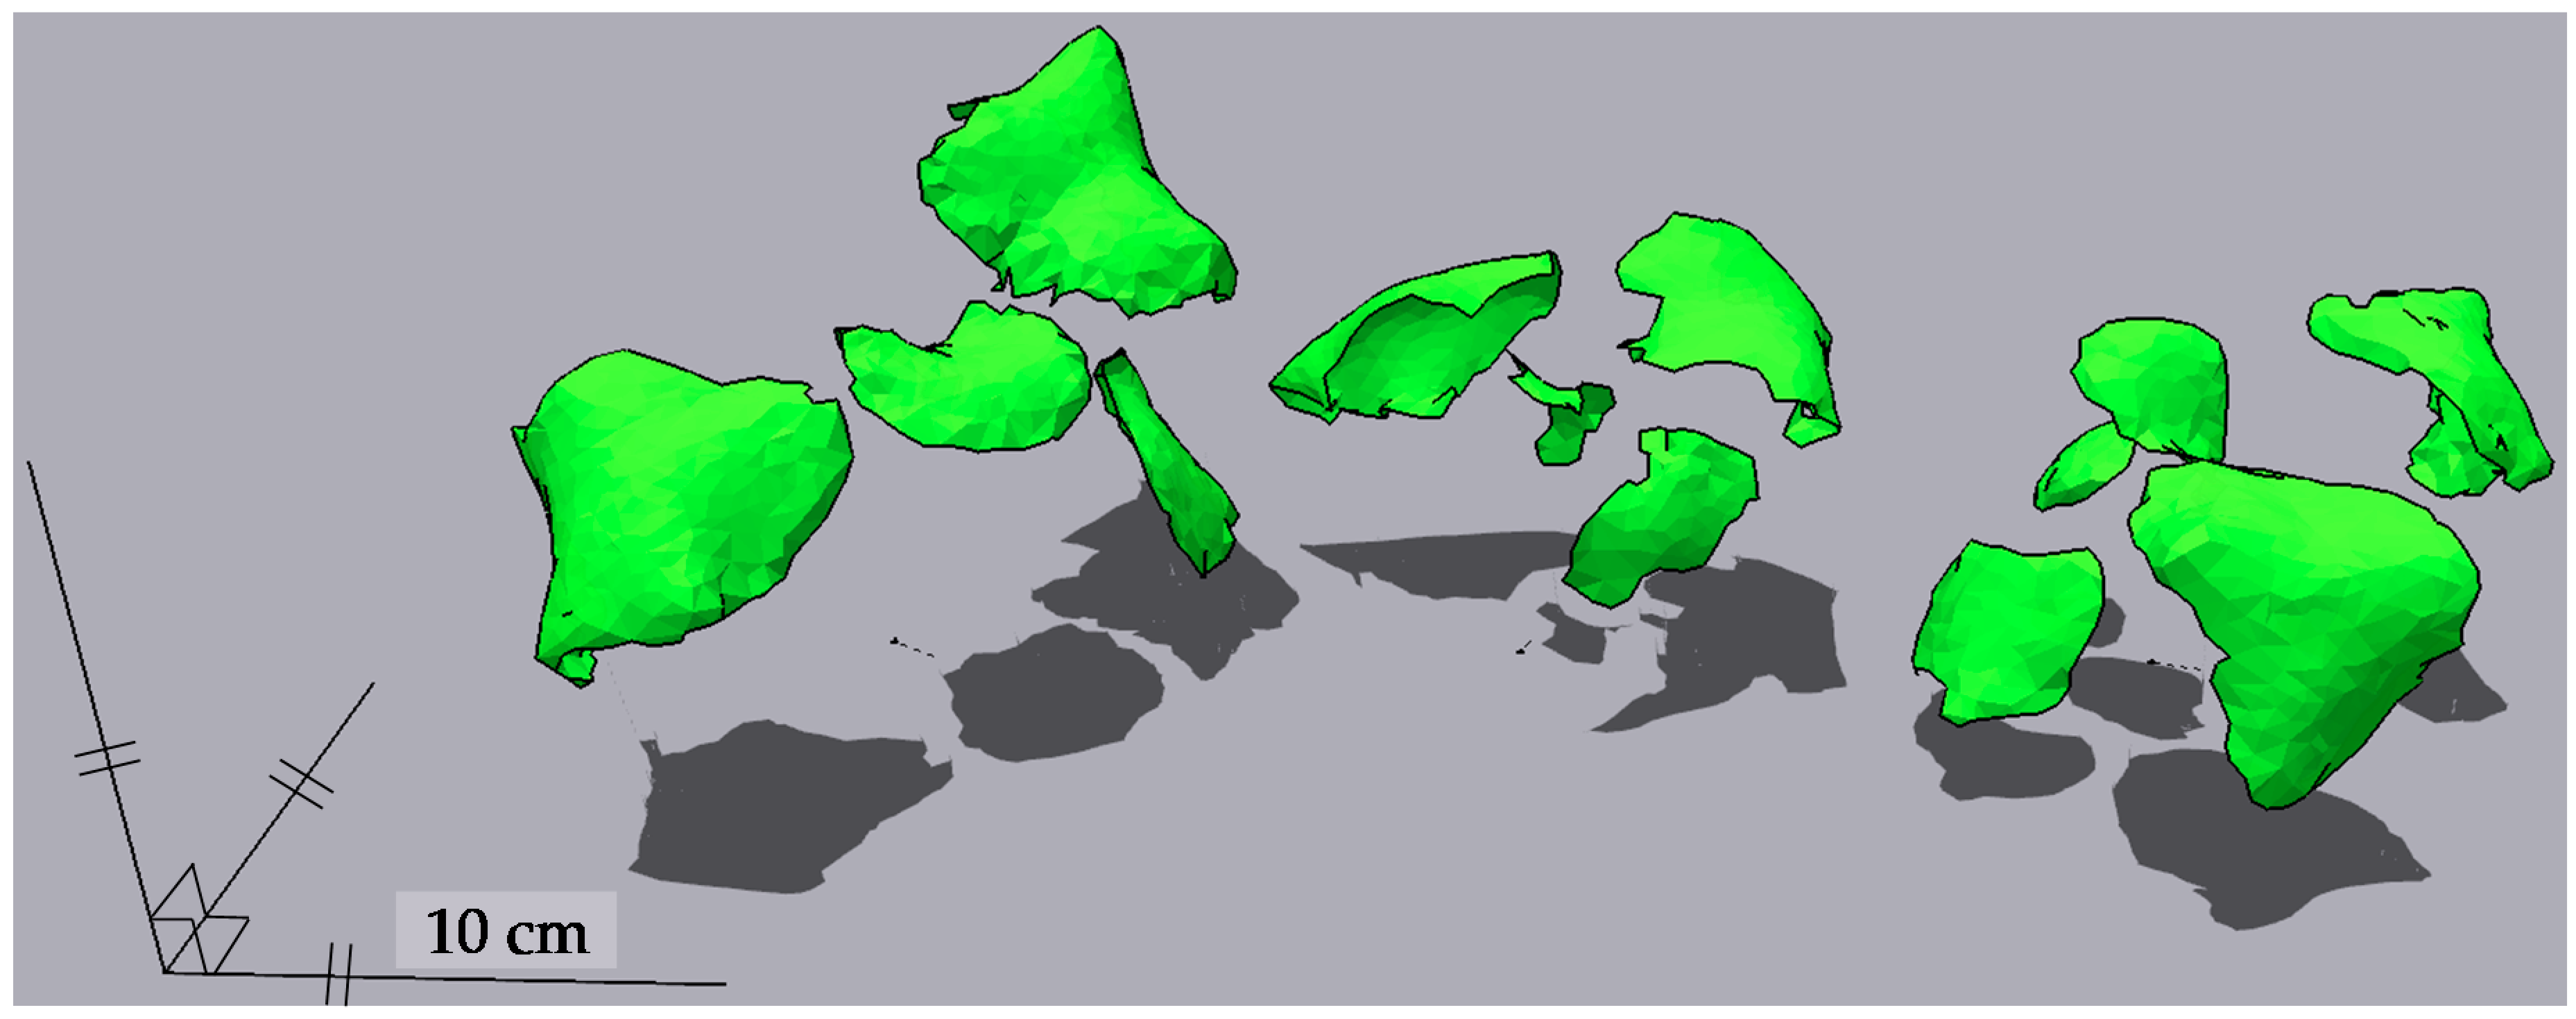
Figure 1. 3D models of the canola seedlings. These models are made by converting point cloud data to the polygonal model using an OPT cloud survey (OPT Technologies Co., Ltd., Tokyo, Japan) and by reducing the number of triangle polygons to 1% using Houdini (Side Effects Software Inc., ON, Canada).
Agronomy 10 01663 g001
Figure 2. The 3D model of a cultivation shelf (A) and the cross-section view (B) along the red lines in (A). This model was made by SketchUp 2017 (Trimble Inc., Sunnyvale, CA, USA). The size of the cultivation shelf is 122.2 cm in width, 62.1 cm in depth, and 60.0 cm in height. In this figure, eight BRLED lamps are placed at 36.0 cm in height. All surfaces except for the back surface were covered with the reflection sheets (FEB#110, Yupo Corporation, Tokyo, Japan) with a reflectance of approximately 91%. The back surface was an aluminum board with numerous punched holes for ventilation.
Agronomy 10 01663 g002
Figure 3. The relative spectral photon distribution of blue and red LED chips (Showa Denko K.K., Tokyo, Japan) measured by a spectroradiometer (USR-45DA, USHIO Inc., Tokyo, Japan). The blue LED chip had a peak wavelength at 466 nm, and the red LED chip had a peak wavelength at 665 nm. The maximum values of blue and red LED chips were converted to 1.0 separately. The maximum photosynthetic photon flux values of blue and red LED chips per lamp were 13.4 µmol s−1/lamp and 38.9 µmol s−1/lamp, respectively. The full widths at half maximum of radiation spectra of blue and red LED chips were 22 and 22 nm, respectively.
Agronomy 10 01663 g003
Figure 4. Measured reflectance and transmittance of the canola leaf (A) and the reflection sheet (FEB#110, Yupo Corporation, Tokyo, Japan) (B). They were measured using a UV-Visible/NIR spectrophotometer (V-750, JASCO Corporation, Tokyo, Japan), with an integrating sphere unit (ISV-922, JASCO Corporation, Tokyo, Japan).
Agronomy 10 01663 g004
Figure 5. The locations of measurement and estimation of photosynthetic photon flux density (PPFD) at the bottom surface of the cultivation shelf without a container (30 points) (A), and on the growing surface (32 points) (B). The height of the growing surface was 14.1 cm. The measured and estimated PPFD values were acquired under the conditions that 8 LED lamps with blue and red LED chips (BRLED) were arranged at equal intervals at 41 cm in height, and the radiant flux output was set at the maximum and half values.
Agronomy 10 01663 g005
Figure 6. The photometric curves of the BRLED lamp. The values of the photosynthetic photon intensity of the blue and red light were written in IES files for the BRLED lamp, respectively. These half-value angles are approximately 60°.
Agronomy 10 01663 g006
Figure 7. The layouts of 6 BRLED lamps in several d and D conditions, shown in the cross-section view. d is the parameter of the distances of neighboring BRLED lamps, and D is normalized d based on the maximum (dmax) and minimum (dmin) values of d. The values of dmin and dmax vary with the number of BRLED lamps.
Agronomy 10 01663 g007
Figure 8. The photometric curves from the conditions of N = 6 and θh = 40°, 60°, and 90°. I(θ), θ, θh, and N are the photosynthetic photon intensity, vertical angle, the half-value angle, and the number of BRLED lamps, respectively.
Agronomy 10 01663 g008
Figure 9. The relationship of the measured photosynthetic photon flux density (PFBR) and the estimated photon flux density (RF’BR) on the cultivation shelf without plants (n = 124). PFBR was measured by a quantum sensor (LI-190, LI-COR Inc., Lincoln, NE, USA). These values were acquired under the conditions that 8 BRLED lamps were arranged at equal intervals at 41 cm in height, and the radiant flux of them was set at the maximum and half values. The dashed line is y = x.
Agronomy 10 01663 g009
Figure 10. PPFD distributions across the growing surfaces (A) and canola leaves (B) with the same lighting design conditions. The distance between the growing surface and lamps was 21.9 cm, and the average distance between the canola canopy and lamps was approximately 14 cm. The color bars indicate the PPFD values and the lines to the left of the color bars are the frequency distribution curves. The dotted lines in (A) indicate the positions of the BRLED lamps.
Agronomy 10 01663 g010
Figure 11. The scatter plot matrix of the 3 lighting design variables, the number (N), distance (D and d), and light distribution (θh, °) of the BRLED lamps, and 2 evaluation indexes, the coefficient of variation of the light absorption of individual plants (Φp; CV, %) and the coefficient of utilization for the lighting system (U, %). The first 4 rows and columns are the lighting design variables, and the last 2 rows and columns are the evaluation indexes. The upper triangular matrix of the scatter plot matrix contains the coefficients of correlation for each two element combination, and the font size is proportional to the coefficients of correlation. The diagonal matrix of the scatter-plot matrix contains the histograms for each element. The lower triangular matrix of the scatter plot matrix contains the scatter plots for each two element combination. The plots were color-coded according to N values.
Agronomy 10 01663 g011
Table 1. Reflectance and transmittance values of different materials.
MaterialReflectance (%)Transmittance (%)
Blue LightRed LightBlue LightRed Light
Young canola leaf6.36.11.74.2
Reflection sheet91.490.28.09.7
Aluminum back surface37.037.040.340.3
Publisher’s Note: MDPI stays neutral with regard to jurisdictional claims in published maps and institutional affiliations.