Article

Oviposition and Development of Tribolium Castaneum Herbst (Coleoptera: Tenebrionidae) on Different Types of Flour

by
Alison R. Gerken
* and
James F. Campbell
Center for Grain and Animal Health Research, Agricultural Research Service, United States Department of Agriculture, Manhattan, KS 66502, USA
*
Author to whom correspondence should be addressed.
Agronomy 2020, 10(10), 1593; https://doi.org/10.3390/agronomy10101593
Submission received: 24 September 2020 / Revised: 13 October 2020 / Accepted: 14 October 2020 / Published: 17 October 2020
(This article belongs to the Special Issue Pest Management for Agro-Food during Storage)

Abstract

:
The commercial availability of low-gluten or gluten-free flours has been increasing due to consumer demands, which raises new challenges for the management of stored product insects since little is known about the susceptibility of these flours to infestation. Here we measured oviposition and development of Tribolium castaneum, the red flour beetle, a major pest of wheat and rice mills, on 18 different commercially available flours (almond, amaranth, barley, buckwheat, cassava, coconut, corn, garbanzo, millet, oat, potato, quinoa, rice, rye, sorghum, spelt, teff, and wheat) to assess the level of risk. The average number of eggs laid was highest for teff flour, with wheat, rice, buckwheat, sorghum, barley, rye, and spelt flour also having high oviposition. The lowest oviposition was for potato, quinoa, amaranth and cassava. Holding the eggs laid in these flours and evaluating the ability to develop to the adult stage demonstrated that the average number of adult progeny was highest for teff and wheat, followed by buckwheat, rye, oat, spelt, and millet. In an experiment where single eggs were placed directly in flour, the highest percentage development was in barley, buckwheat, sorghum, spelt, teff, and wheat. Time for 50% of single eggs to develop to adults was quickest for sorghum, spelt, teff, and wheat, while sorghum, buckwheat, corn, spelt, and barley had the quickest development of 90% of eggs to reach adults. There was substantial variation among the different flours which indicates variation in risk of insect infestation. As consumer interest in these flours continues to grow and these alternative flours become more prevalent in food facilities, understanding what diets insects successfully infest is critical to developing management tools.

Graphical Abstract

1. Introduction

Wheat flour is one of the most common types of flour processed and consumed around the world but there is a growing market for alternatives to wheat flour [1,2]. The market for alternatives to wheat flour is growing substantially as coeliac disease diagnoses increase and consumers demand low gluten and gluten-free options [1,2,3]. In 2007, the gluten-free market in the United Kingdom was valued at GBP 74 million, roughly USD 93 million and in 2006 the market in the United States was valued at USD 696 million (1). In 2019, the gluten-free market was valued at USD 21.61 billion and is expected to grow by 9.2% by 2027 [4]. Alternatives can include other grains such as sorghum or corn but also include an expanding number of flours made from other foods, including coffee, banana, nuts, and root vegetables such as cassava or potato [3]. After the grain is harvested, it is stored and processed and vulnerable to insect pests that can damage or destroy the commodity and can cost producers billions of dollars in lost revenue each year. Traditional cereal grains such as wheat and rice have been studied extensively as to how insects can grow and develop on whole seeds, milled flours, and milling fractions and byproducts [5,6]. However, as the diversity of flour types used by the food industry continues to grow, less is known about the ability of stored product insects to develop on these alternative flours and the potential risks these insects might cause to this rapidly growing industry.
Tribolium castaneum Herbst (Coleoptera: Tenebrionidae) is a major pest of wheat and rice flour [7,8] and a secondary pest feeder of stored products and has been documented to survive on a variety of commodities. These insects have high fecundity on wheat flour and survive well on a variety of wheat strains [9]. A diet rich in folic acid aided in growth and reproduction for T. castaneum [10] and low levels of phosphorus (0.075%) in the diet were insufficient for population growth while high levels (3.075%) were toxic to the related T. confusum Jacquelin du Val (Coleoptera: Tenebrionidae) [11]. Yeast added to wheat flour increased reproduction and survival of T. castaneum [10] and beetles had better fecundity than on plain wheat flour, millet, barley, rice, sorghum, and soybean, with sorghum and soybean flour having the lowest fecundity [12].
T. castaneum is an important pest on wheat flour, but it has a broad host range and has been reported to be associated with diverse commodities such as rice, millet, sorghum, and corn [13,14]. For many of these commodities, the information available on development and fecundity is limited. T. castaneum had high progeny output on millet, sorghum and maize meals [13], high progeny output and low mortality on starch-rich pea flour [15], atta flour, wheat flour, self-rising wheat flour, rice flour [16], whole wheat flour, corn flour, and brown rice flour [17]. In comparison, T. castaneum had poor progeny production on semovita (a brand of semolina or durum wheat), cassava or yam meals [13], protein-rich pea flour [15], soy flour [17], tapioca, and potato starch [16], and poor feeding and development on cowpea flour [18]. In addition, comparisons of wheat or barley varieties and milling fractions showed variable results for T. castaneum. There was a range of fecundity and hatch rates on different varieties of barley [19] and developmental times increased on pelletized frog feed and crumbled poultry feed [20] and larval weight gain was slow on dried distiller’s grain [21]. Rice flour milling fractions had varying progeny output with higher progeny output on rice flour, milled whole rice kernels, brown rice, milled broken kernels and rice bran but lower progeny output on rough rice hulls, paddy rice dust, and milled rice dust [5] suggesting that not only does the commodity matter but also the size and shape of the commodity. In addition, commercial flour products of corn, rice, wheat, and soybean had lower population density but quicker developmental rate than non-commercial flour of the same commodity [22]. These studies indicate that flour type makes a difference in insect reproduction and growth, but few studies have assessed a wide range of flour types under the same experimental conditions.
Understanding how T. castaneum oviposit on different types of flours and how progeny develop over time will provide information on the suitability of different alternative flours. Here we evaluated almond, amaranth, barley, buckwheat, cassava, coconut, corn, garbanzo, millet, oat, potato, quinoa, rice, rye, sorghum, spelt, and teff flours compared to wheat flour (as a control). Where possible we obtained these flours from the same two commercial sources to determine how source impacted suitability. Here we examine how many eggs T. castaneum females lay on the different flours and how successfully these progeny develop to the adult stage. We also assessed development under a more standardized set of conditions by placing single eggs on each flour and measuring the ability to develop to the adult stage. These two tests enable a look at the female’s recognition of each flour as a suitable oviposition substrate and the quality of the resource for progeny development.

2. Materials and Methods

2.1. Insects

The T. castaneum used in this experiment have been in culture in the laboratory at the Center for Grain and Animal Health Research for over 30 years and previously used for development studies. The population has a long history of high fecundity in the laboratory, reduced heterozygosity in dietary needs and physiological traits, and was reared on a standardized diet of wheat flour with 5% brewers yeast. Populations were kept at 27 °C and 65% relative humidity (RH) on a 16-h light and 8-h dark cycle. New subcultures were started with 50–100 mixed-sex adults that were removed after 5–7 days.

2.2. Flours Tested

Flour was obtained from two sources for each flour type to compare consistencies in oviposition and development between sources: Bob’s Red Mill (Milwaukie, OR, USA), further referred to as Source 1, and Barry Farm Enterprises (Wapakoneta, OH, USA), further referred to as Source 2 (Table 1). Flours obtained and tested from both sources were: almond (Prunus dulcis), amaranth (Amaranthus spp.), barley (Hordeum vulgare), buckwheat (Fagopyrum esculentum), cassava (Manihot esculenta), corn (Zea mays), garbanzo (Cicer arietum), millet (Genus Panicum), oat (Avena sativa), potato (Solanum tuberosum), quinoa (Chenopodium quinoa), rice (Oryza sativa), rye (Secale cereale), and sorghum (most likely Sorghum bicolor). Three additional flours were also evaluated but were only available from Source 1: teff (Eragrostis tef), spelt (Triticum spelta), and coconut (Cocos nucifera). Laboratory diet with 5% brewer’s yeast was used as the wheat flour control since that is the standard rearing diet for this population of T. castaneum (Figure 1). For the oviposition study (described below) flours were sieved through an 80-mesh sieve to reduce overall particle size so eggs could be sieved and counted. Some flour was not sieved due to it not being able to pass through the sieves either because it was too powdery or sticky (Table 1).

2.3. Oviposition

The number of eggs laid on different flours was counted to evaluate a female’s recognition and acceptance of the flour as a substrate for progeny. The same volume of flour was placed into 8-dram (29.57 mL) vials. Weights for each flour are listed in Table 1. Females, sexed as adults based on lack of a small patch of short bristles on their forelegs, aged 2–4 weeks were collected from the general population culture and placed on standard diet in a 0.5-pint jar for 2–4 days. Females were then removed, and single females placed in each vial with flour. Vials were capped with cotton balls and placed at 30 °C and 65% RH on a 16-h light and 8-h dark cycle. Females were left on the flour for 1 week and then removed. If a flour was pre-sieved, it was then sieved through a 60-mesh sieve and eggs were collected and counted under a dissecting microscope. To evaluate the ability of these eggs to hatch and develop and provide an estimate of oviposition for flours where eggs could not be directly counted, eggs and flour were then returned to their vials and held at 30 °C and 65% RH. On week 4, progeny were counted and recorded from all flours, regardless if pre-sieved or not. Progeny counts continued weekly for a total of 8 weeks and any remaining larvae were also counted at the 8-week time point. We completed three blocks of seven individual females, for a total of 21 replicates.

2.4. Development

To test the ability of T. castaneum to develop from egg to adult on each flour, without the potential confounding effects associated with differences in population density, we added single eggs to vials with each flour type. No flours were pre-sieved for this study. Flours were placed by volume into 1-dram (3.69 mL) vials. Weights of the flours are included in Table 1. To obtain eggs, 2- to 4-week-old females were collected from population jars and allowed to lay eggs for 48 h on 80-mesh pre-sieved standard diet. Eggs were then sieved out using a 60-mesh sieve and a single egg was placed in each vial with flour which was capped with a small piece of cotton. Vials were then placed at 30 °C and 65% RH under 16-h light and 8-h dark cycle. On week 4, vials were checked for egg hatch and the developmental stage was recorded. We recorded the developmental stage as larva, pupa, or adult if we observed this stage in the vial; if we did not observe larva, pupa, or adult we recorded the life stage as an egg. This was continued weekly for a total of 4 weeks. This assay consisted of three blocks of seven individual eggs, for a total of 21 replicates.

2.5. Analyses

Data were analyzed in R statistical software (R Core Team 2020). The number of eggs laid on each type of flour was analyzed using a generalized linear model with the lmer function with type of flour and source of flour as main effects plus interaction of the two main effects. Block was used as a random effect. An ANOVA model was then run using the car::Anova function from the Car package and ls-means were calculated using the lsmeans function from the lsmeans package. Pairwise comparisons were assessed using the pairs function on the interaction effect with additional Tukey grouping using the CLD function. Specific pairwise contrasts between sources were also assessed using the contrast function with sidak adjustment. Progeny counts for each type of flour were also run in an identical method.
For further analysis without the effect of source, sources were combined if not significantly different and for flours with differences between sources, the source with fewer eggs or progeny was discarded from analyses. Removal of the source with the lowest counts allowed analysis of the highest infestation risk rankings. For egg counts, counts from Source 1 for corn flour were removed and for progeny, counts from Source 1 millet and oat were removed. After removal of the above flours, egg counts were assessed using the same model as above, but with only a main effect of flour. Pairwise comparisons were conducted with only flour as the effect. Progeny counts were analyzed in the same way without source.
The relationship between total numbers of eggs and progeny were also compared to the manufacturer’s nutritional information provided on the packaging for each flour (Supplementary Table S1). All data from all sources were first analyzed, and subsequently, correlations for each source independently were also analyzed. Pearson correlation analyses were performed using the cor.test function in R. Cholesterol was not assessed as it is 0 mg in all flours tested.
Progeny development time for the oviposition experiment was modeled using the curve clustering in the dtwclust package and time-series tsclust function. This function clusters the shape of the curve of progeny output over time and groups curves with similar timing together into clusters. We used a seed = 390 with a dtw distance criteria and ward.D hierarchical control method. We first examined the cluster validity indices for k = 2–15 clusters of all flour and source data, and using the Silhouette index, determined that k = 9 clusters had the best fit. We then examined if flour from the two sources were in differing clusters and determined for further analysis with no source included, the source that had a quicker peak progeny output (sooner risk for emergence) would be used in further analyses. For the analysis with no source, barley, millet, rye, oat, and potato flour data from Source 1 and sorghum and garbanzo flour from Source 2 were removed. Using the same method and tsclust function as above, we determined from our Silhouette index that k = 6 had the best fit for these data. The specific cluster numbers in the results are not in any ranked order.
Progeny development time for the single eggs was analyzed using a generalized linear model with the lmer function with the number of eggs, larvae, pupae, or adults analyzed individually. Each model consisted of flour, source, and week of data collection as main effects and any interactions of these three effects. Block was used as a random variable in the model. The car:Anova function was then used to assess significant effects along with lsmeans on the interaction of flour, source, and week. Pairwise comparisons were analyzed using the pairs function and Tukey-adjusted comparisons were conducted using CLD.
We analyzed development in two ways: egg hatching success and success to the adult life stage. For hatching success, we categorized each egg first as successful hatching and then analyzed the binary success of egg hatching for each flour type and source as main effects and the interaction of the two. As above, car:Anova function, lsmeans function, and the pairs function were used to analyze pairwise comparisons with Tukey adjustment for multiple comparisons. For success to reach the adult life stage, we used a similar method and assigned binary scores to either adults or not adults (egg, larva, or pupa). Pairwise comparisons of the two sources for each flour were assessed and if significant, the source with the lower success rate was removed from the next analyses on time to hatch (corn flour from Source 1) and time to adult success (garbanzo and sorghum flour data from Source 2) models. To provide a proper baseline for developmental timing, the week before data collection started (denoted as week 0) was assigned as egg life stage for all samples. Time to hatch models were analyzed as binary models where an egg moves to the larval, pupal, or adult stage. Time to adult models was analyzed as binary models where a successful egg moved to the adult stage. These data were analyzed using the glm function with the log week as the x-variable and a binomial categorization. Slope and intercept results were assessed using the summary function and the time to adult for 50% and 90% of eggs was calculated using the dose.p function in the MASS package.

3. Results

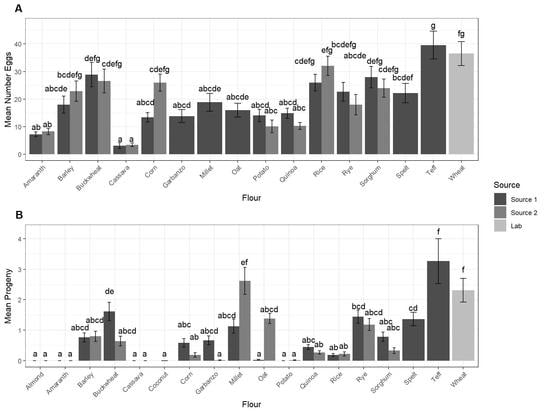
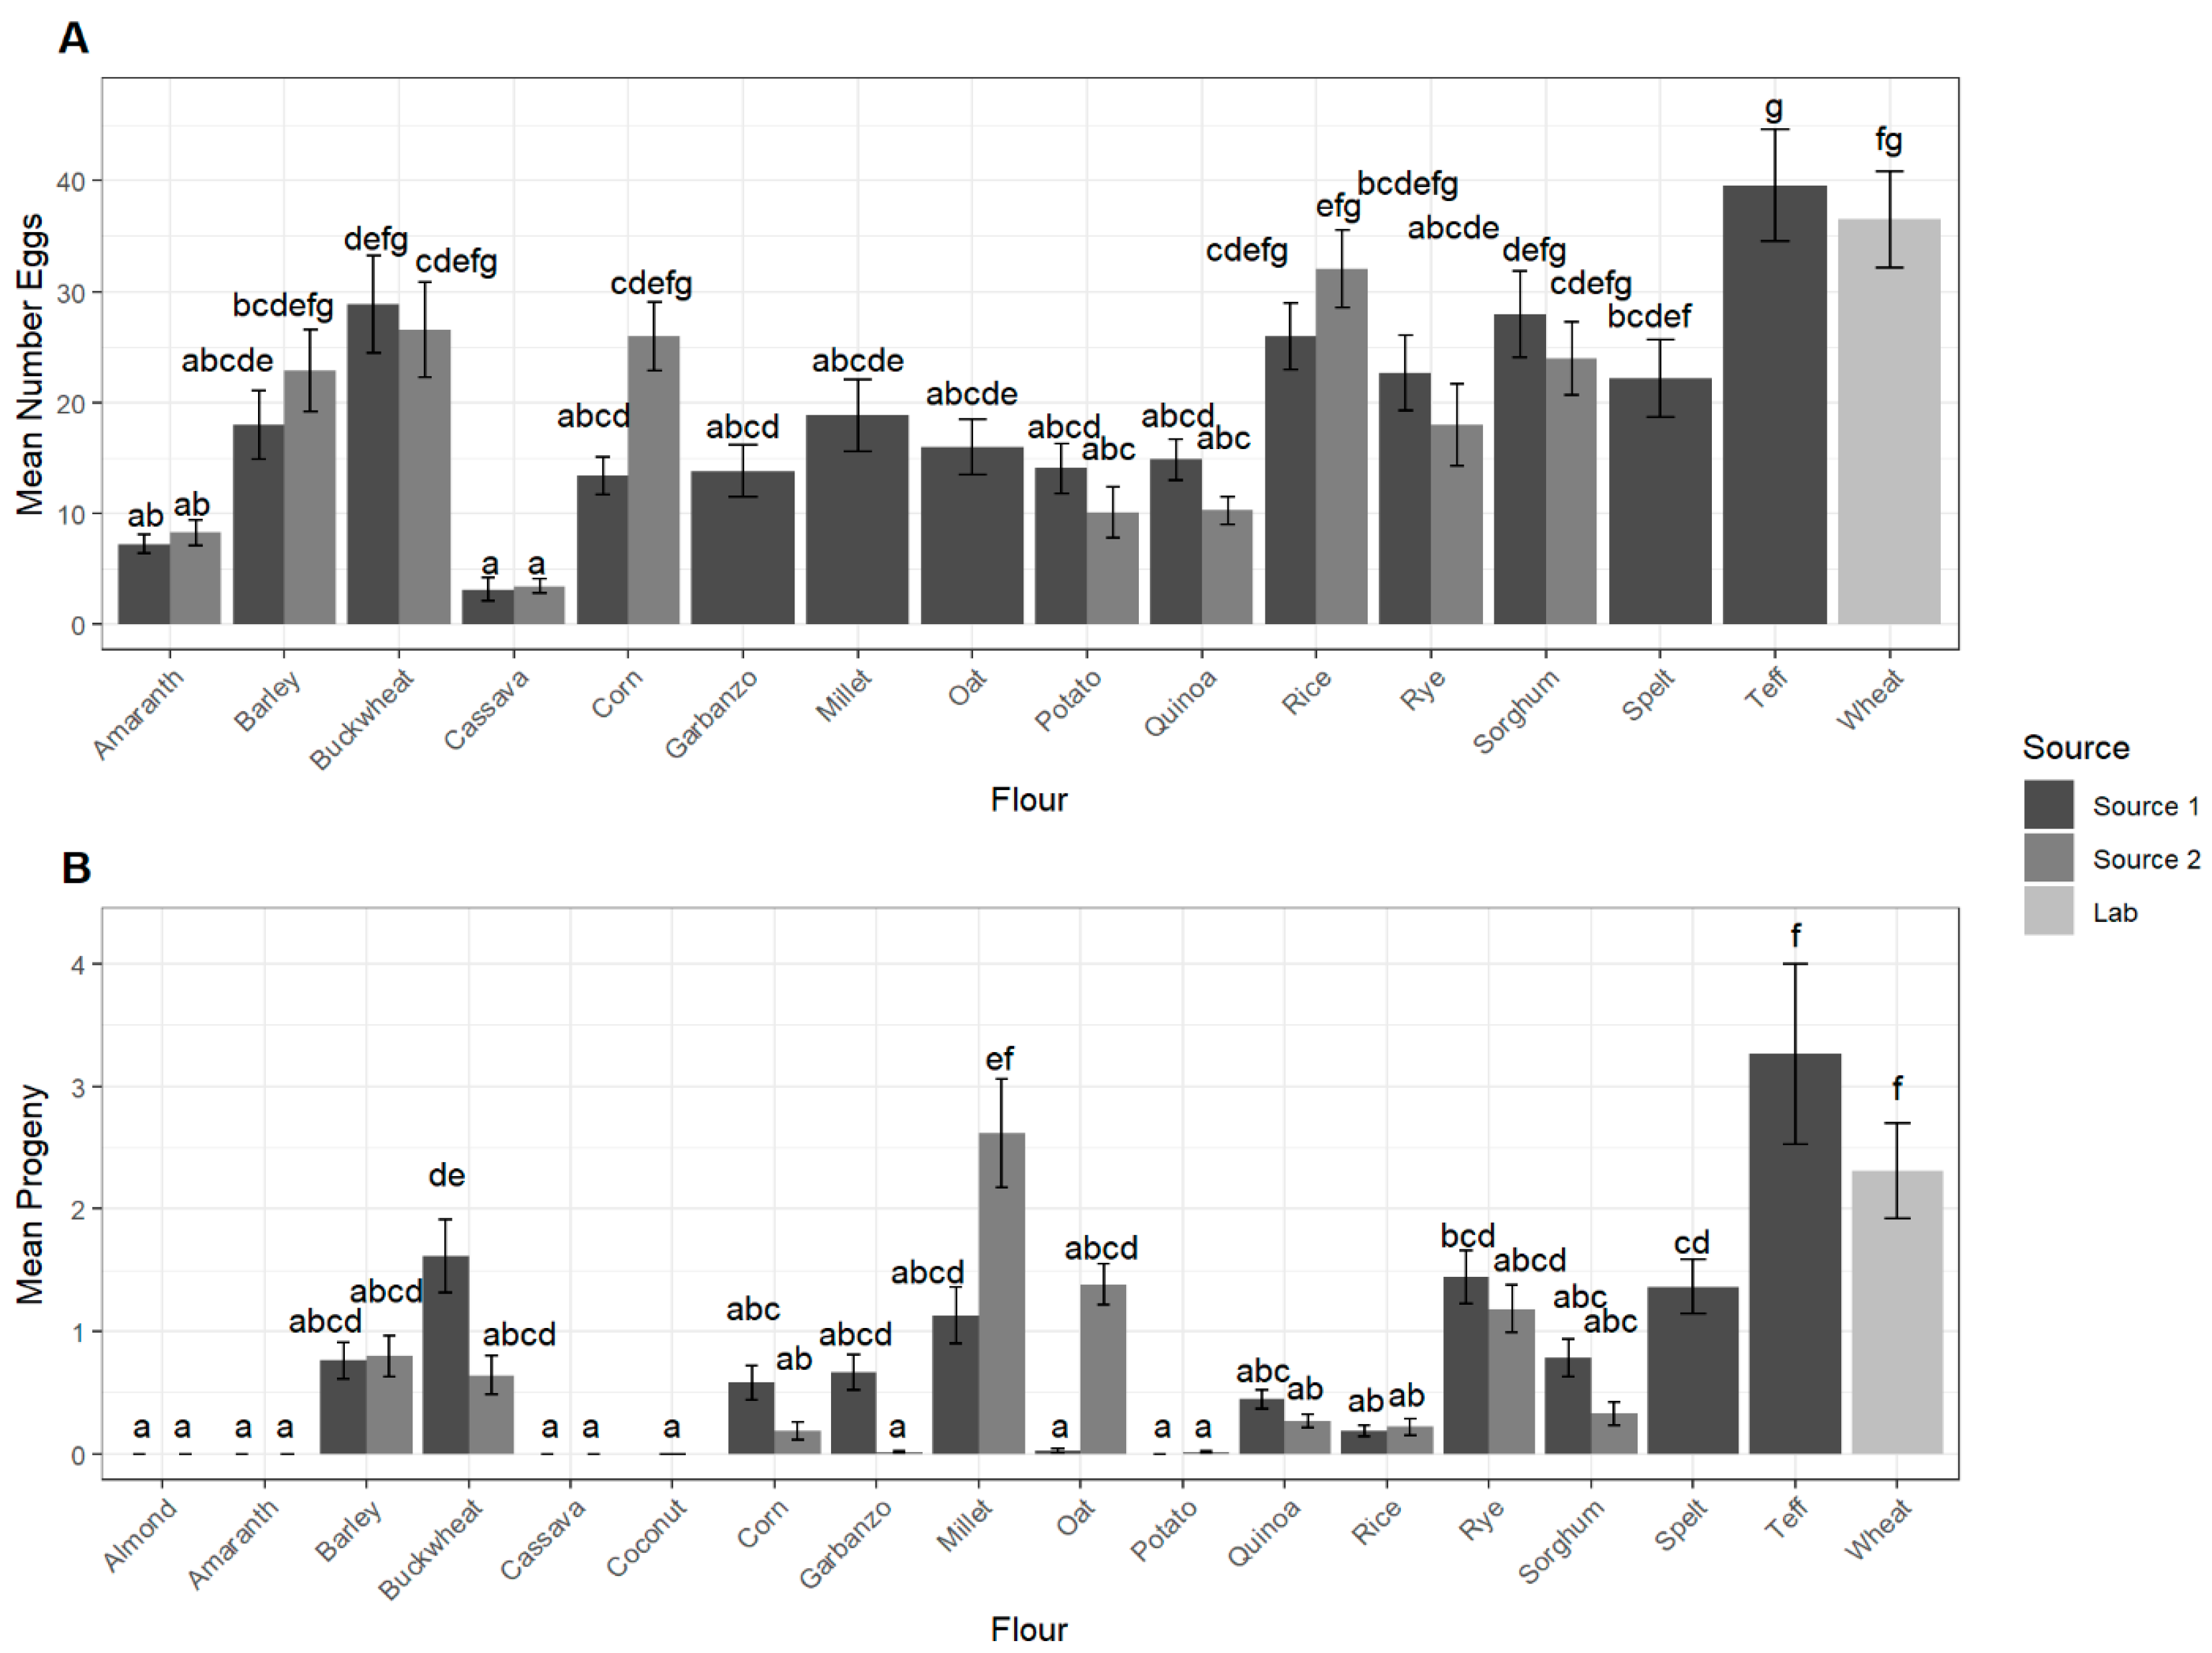
3.1. Oviposition and Development

The main effect of flour (χ2 = 7.76, df = 15, p < 0.0001) was significantly different for the number of eggs laid but source (χ2 = 0.044, df = 1, p = 0.83) was not significantly different. The interaction of flour and source was significant (χ2 = 17.24, df = 9, p = 0.045). The most eggs were laid on teff flour followed by the laboratory wheat flour (Figure 1). Rice flour from Source 2 and buckwheat flour from Source 1 also had high numbers of eggs laid (Supplemental Table S2). Cassava and amaranth from both sources had the least number of eggs laid, followed by potato and quinoa from both sources (Figure 1). Pairwise comparisons between each source for each flour were not significantly different except for the number of eggs laid in corn flour, with Source 2 having a higher number of eggs laid (Table 2).
To assess the highest risk of infestation with no source effects, we removed Source 1 corn data from analysis, since it was the only flour with significant differences between sources, and the main effect of flour was highly significantly different (χ2 = 248.87, df = 15, p < 0.0001). Cassava, amaranth, potato, and quinoa had the lowest number of eggs laid and were significantly different from sorghum, corn, buckwheat, rice, wheat, and teff, which had the highest number of eggs laid (Table 3).
The main effect of flour (χ2 = 523.97, df = 17, p < 0.0001) was highly significant for the number of adult progeny (further referred to as progeny) that emerged. Source was not significantly different (χ2 = 0.00, df = 1, p = 1.00) but the interaction of source and flour was significantly different (χ2 = 34.43, df = 13, p = 0.001). Almond, amaranth, cassava, coconut, and potato had no progeny emerge, while wheat, Source 2 millet, and teff had the most progeny emerge (Table 2). When comparing sources, millet and oat were significantly different with Source 2 having more progeny emerge than Source 1 (Table 3).
If flours were significantly different between sources, we removed the lower progeny count to estimate the highest levels of infestation. After removing Source 1 millet and oat progeny data, the main effect of flour was highly significant (χ2 = 638.34, df = 17, p < 0.0001) for the analysis of sources combined. Almond, coconut, cassava, and amaranth all had no progeny emerge and were significantly different from the number of progeny that emerged from rye, wheat, millet, and teff (Table 3).

3.2. Association between Flour Nutrition and Oviposition and Development

Examination of nutrition information provided for each flour indicated several nutritional parameters such as sodium, saturated fat, fiber and protein that could play a significant role in both oviposition and progeny emergence. When comparing nutrition information with all egg counts (Table 4), sodium was negatively correlated, and fiber and protein content were positively correlated with the number of eggs laid by females. For progeny emergence, calories from fat, saturated fat, and sodium were all negatively associated with the number of progeny and carbohydrate content was positively correlated with the number of progeny. When examining sources independently, the numbers of eggs laid were positively, significantly correlated with calories from fat and negatively, significantly correlated with sodium for Source 2. The number of progeny was significantly negatively correlated with calories from fat, saturated fat, and sodium and positively, significantly correlated with fiber for Source 2. For Source 1 saturated fat was negatively, significantly correlated and calories, fiber, and protein were positively, significantly correlated with the number of eggs laid. For progeny, saturated fat and sodium were significantly, negatively correlated and calories, carbohydrates, fiber, and protein were all positively, significantly correlated for Source 1.

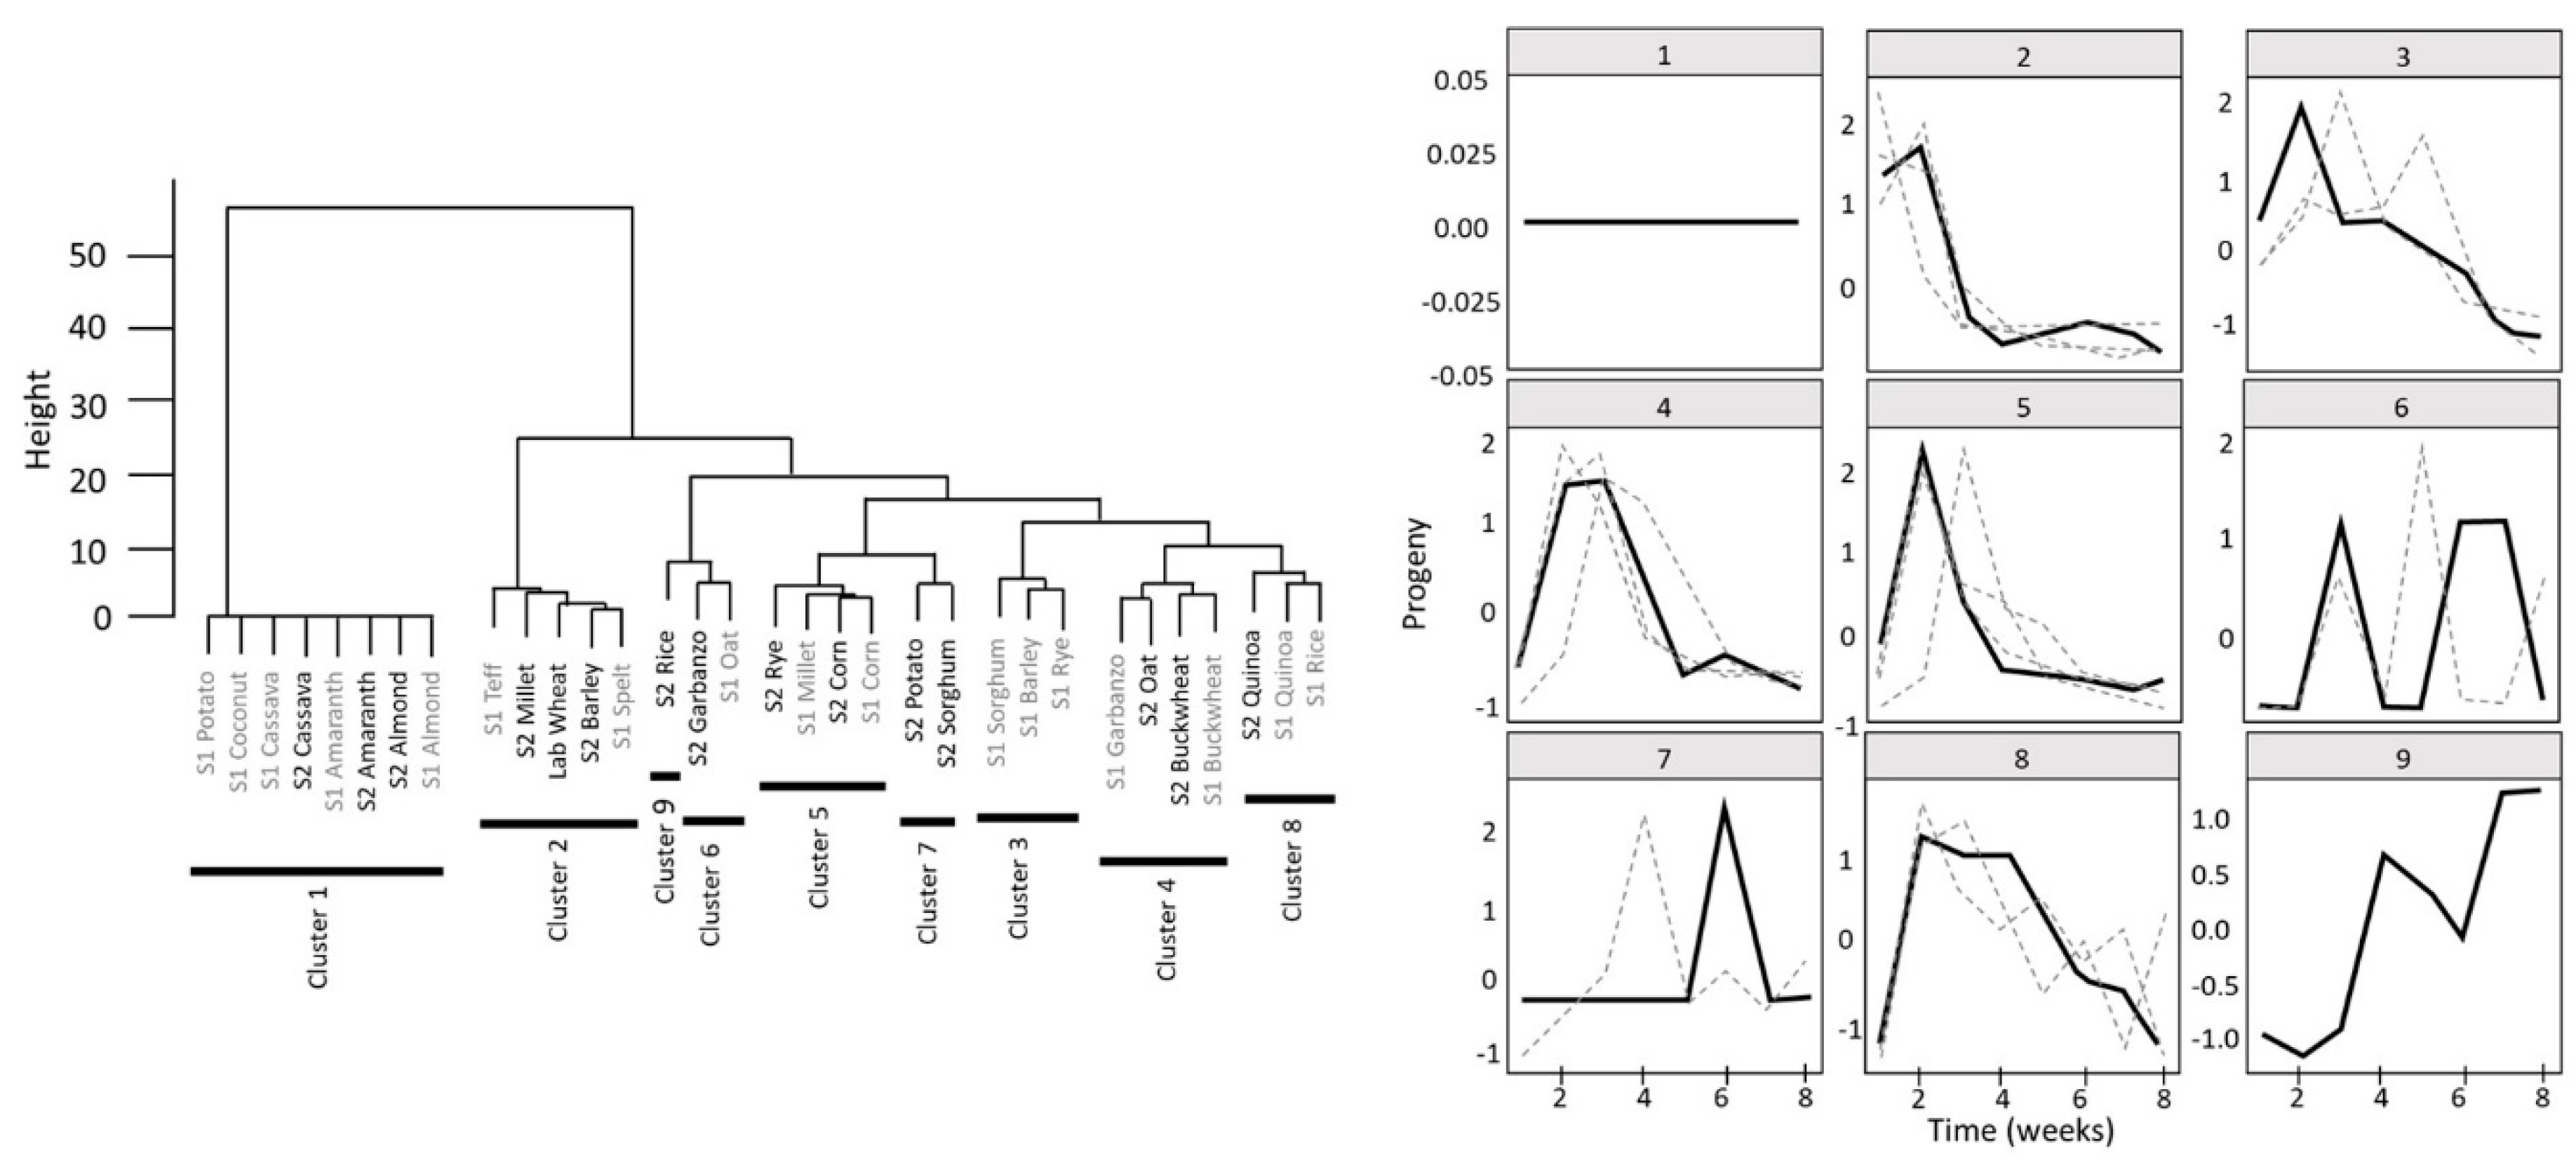
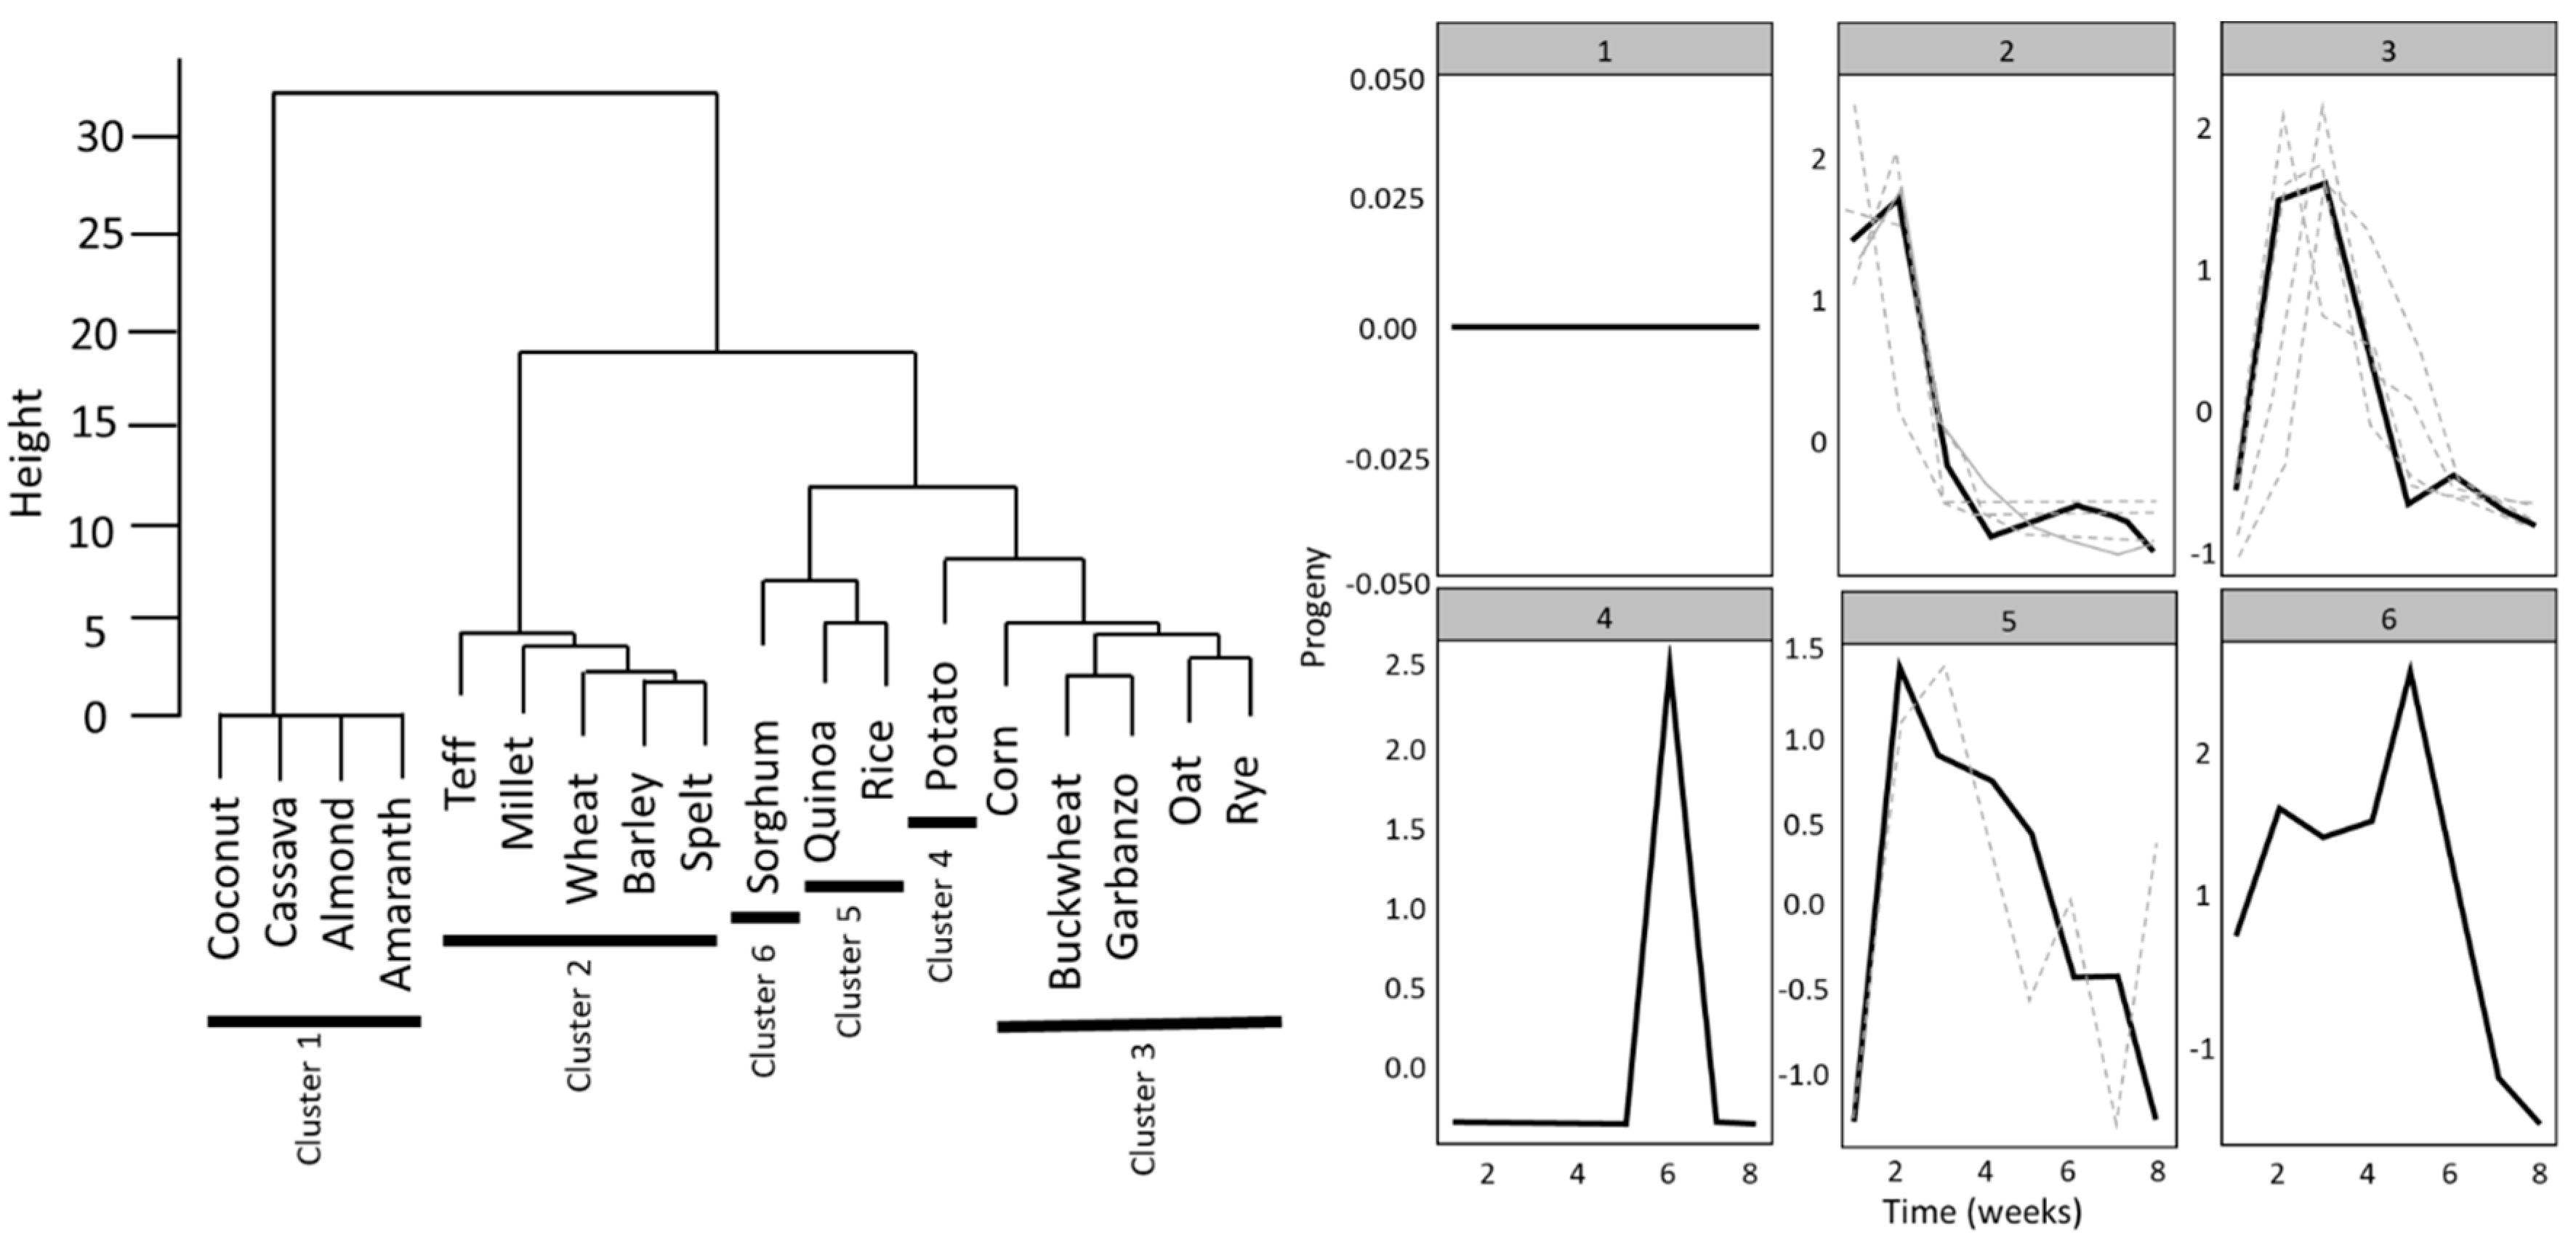
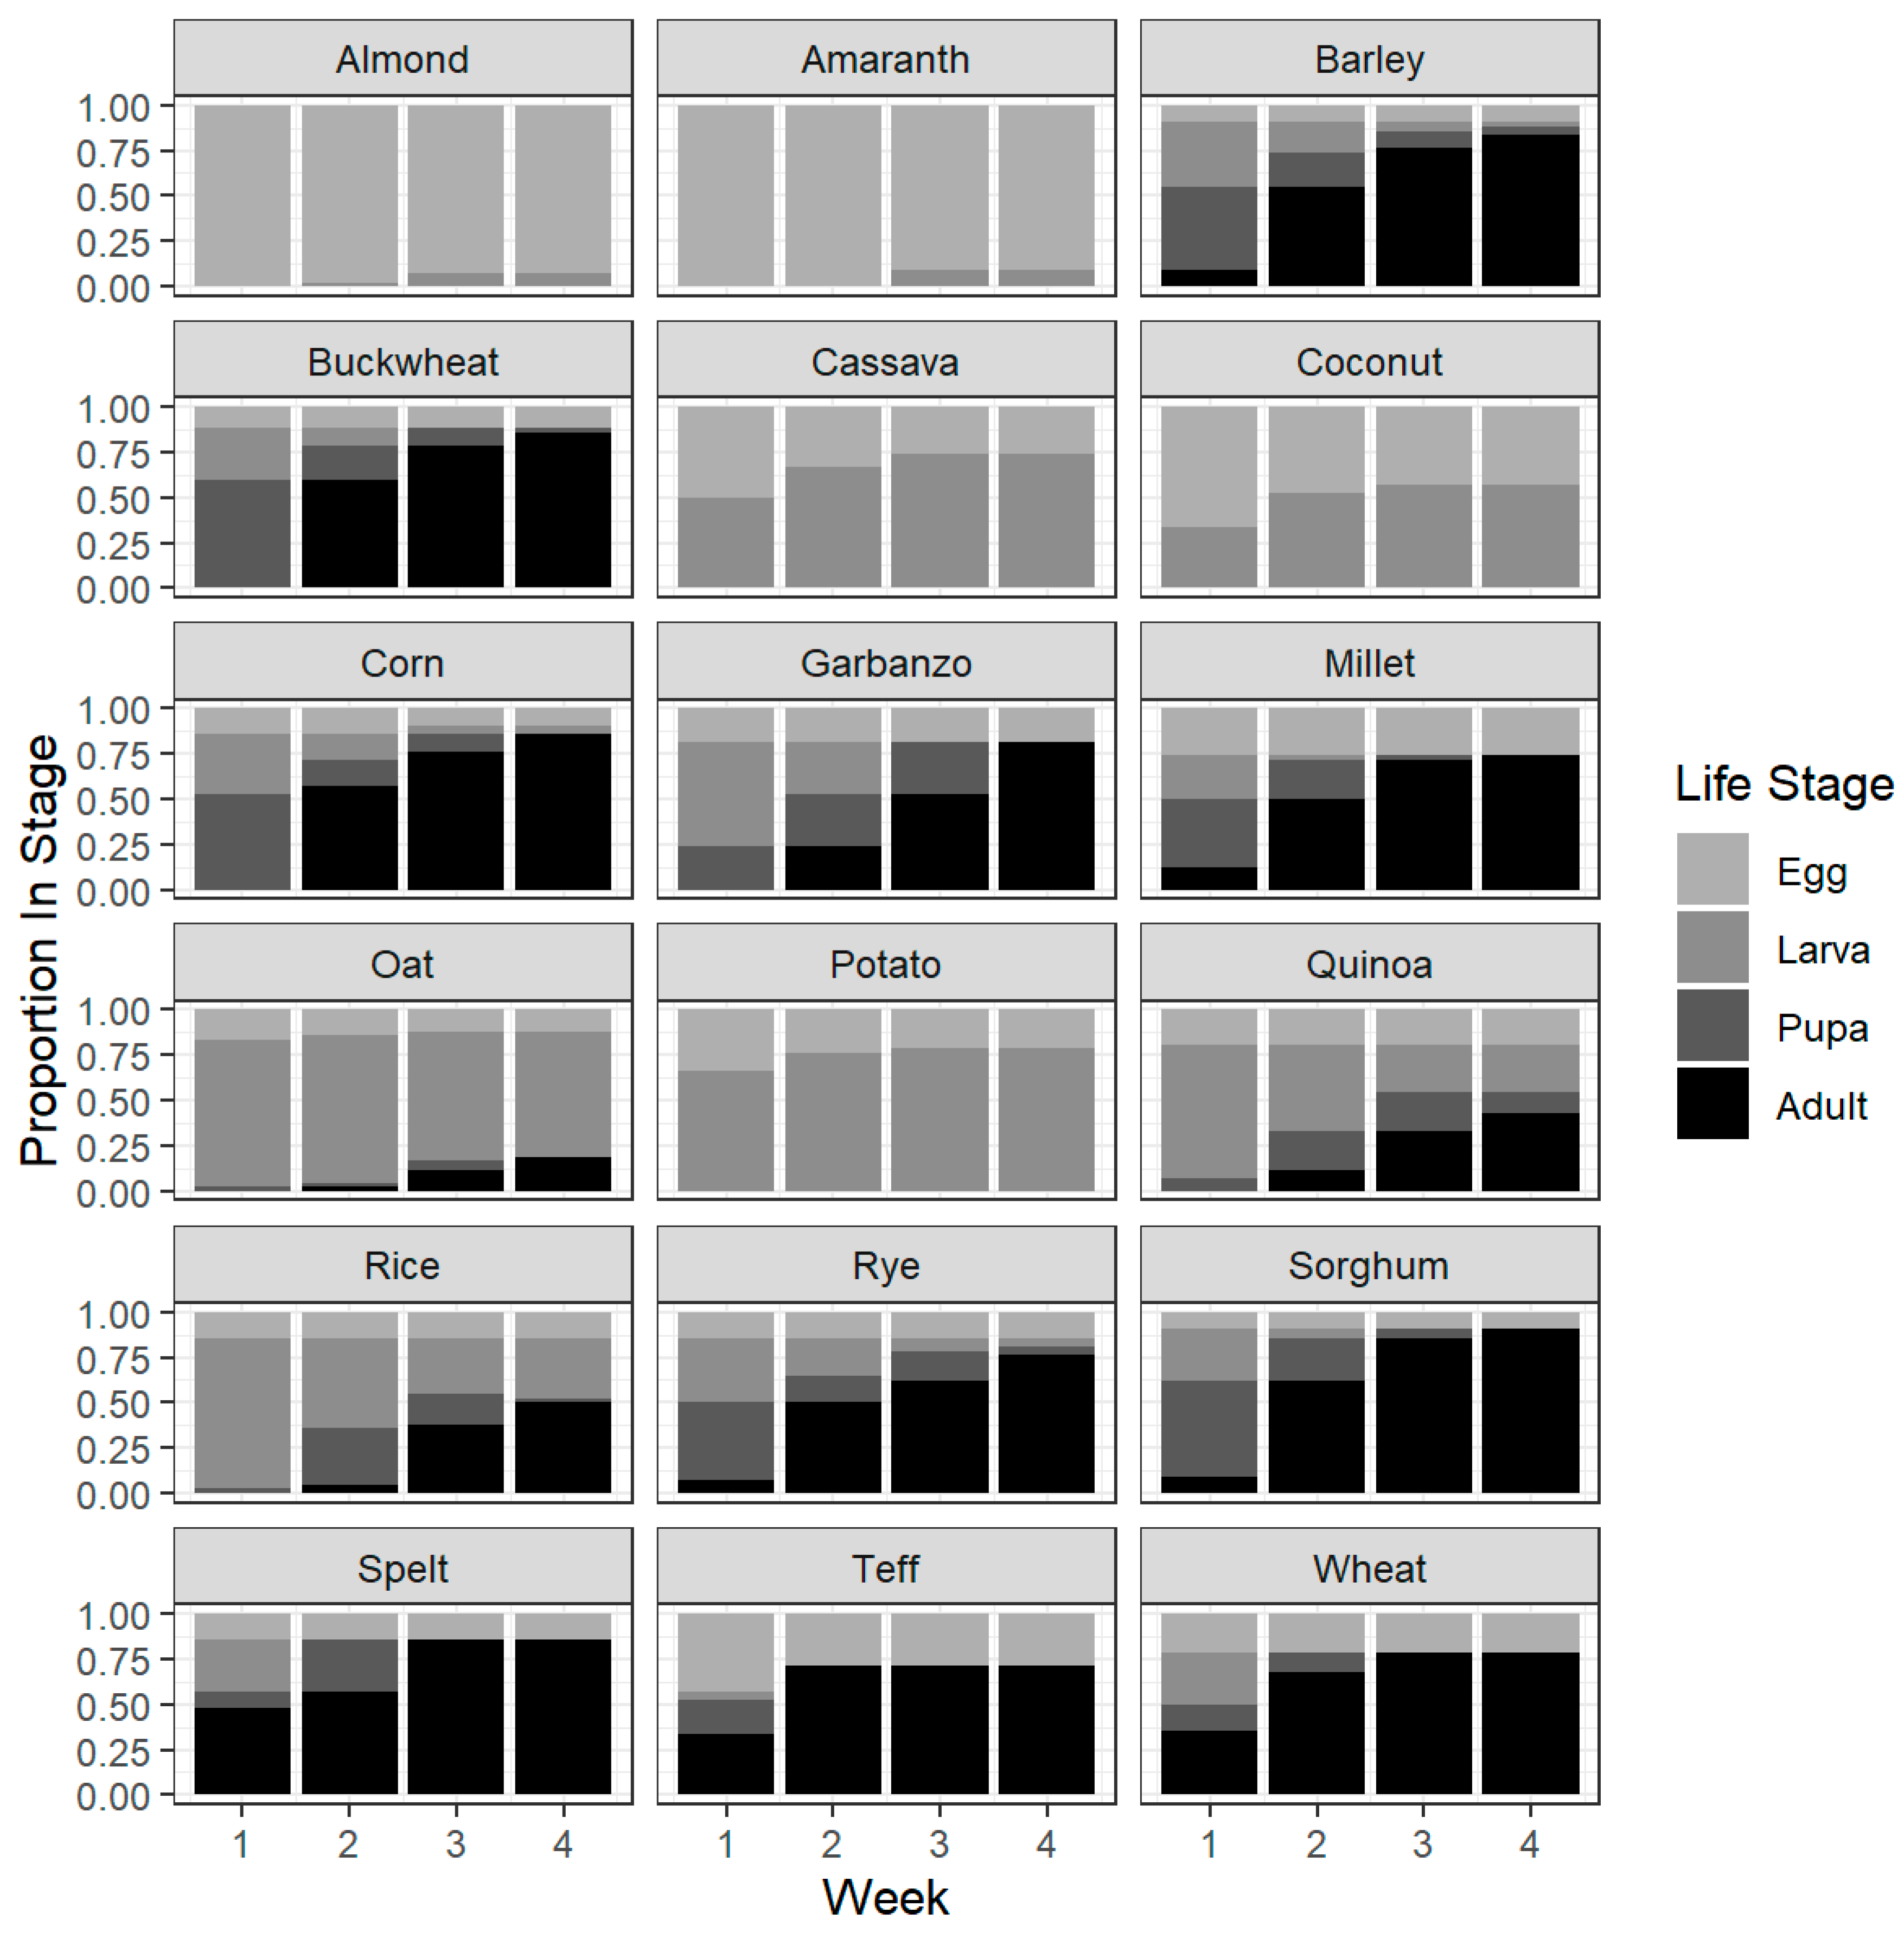
3.3. Adult Progeny Emergence over Time

Clustering generated groups ranging from 1 to 8 flour and source combinations, when we set our clustering parameter to k = 9 total clusters. Flours that had no progeny emergence over time clustered in an unresolved branch, meaning that each of the flours in this branch could not be differentiated from one another, that included potato (Source 1 only), cassava, coconut, amaranth, and almond flours (Figure 2). Cluster number 2 consisted of flours that had early progeny emergence and high numbers of progeny, and other early progeny emergence clusters included clusters 3, 4, 5, and 8. Late progeny emergence clusters were 6, 7, and 9. Flours from different sources that were not in the same cluster were barley, millet, rye, sorghum, garbanzo, oat, potato, and rice. To assess for the quickest risk of infestation, the source that had the quicker progeny emergence was kept for further analyses (barley, millet, rye, oat, and potato from Source 2 and sorghum, garbanzo, and rice from Source 1) without source and is detailed below.
We clustered progeny emergence over time with sources that did not differ combined or with sources that had the quickest progeny emergence to better understand which flours may be the most at risk for infestation (Figure 3). Again, there was an unresolved branch with flours that had no progeny including coconut, cassava, almond, and amaranth. Flours with high progeny and an early peak in progeny emergence were in cluster 2 and included teff, millet, wheat, barley, and spelt. Other early progeny emergence clusters were clusters 3 and 5 and included corn, buckwheat, garbanzo, oat, rye, quinoa, and rice. Finally, clusters that had later peaks in progeny emergence were clusters 4 and 6, which included potato and sorghum flours.

3.4. Development Success

For the development over time for eggs placed on the flour, there was significant variation among flours, with some flours only having a few replicate eggs hatch, while other flours had greater than 75% of eggs develop into adults (Figure 4). When analyzed by each life stage, for eggs, the main effect of flour was significant (χ2 = 230.39, df = 17, p < 0.0001), but source and week (or time) were not significant (Table 5). The interaction between flour and source was also significant (χ2 = 65.03, df = 14, p < 0.0001). No other interactions were significant (Table 5). For larvae, the main effects of flour (χ2 = 42.60, df = 17, p < 0.0001) and source (χ2 = 13.56, df = 1, p = 0.00023) were significant but week was not significant. The interaction of flour and source was also significant (χ2 = 23.13, df = 13, p = 0.04), but no other interactions were significant. For pupae, all main effects and interactions were significantly different (Table 5). For adults, the main effects of flour (χ2 = 55.50, df = 12, p < 0.0001) and source were significant (χ2 = 22.18, df = 3, p < 0.0001). The interaction of flour and source was also significant (χ2 = 41.60, df = 9, p < 0.0001). Upon further examination, only the egg life stage for garbanzo flour for week 1 was significantly different between Source 2 and Source 1 (t-ratio = 4.94, df = 525.9, p = 0.0078; Supplementary Table S3; Supplementary Table S4).
The main effect of flour significantly (χ2 = 258.93, df = 17, p < 0.0001) affected hatch success, moving from egg to either larva, pupa, or adult life stage, but flour source was not significant (χ2 = 1.59, df = 1, p = 0.21). The interaction of flour and source was significant (χ2 = 51.80, df = 13, p < 0.0001). Pairwise comparisons between sources within each flour found that garbanzo was significantly different between Source 1 and Source 2 (t-ratio = −5.33, df = 710, p = 0.0002), with Source 1 having better hatching success (Supplementary Table S5).
The main effect of flour significantly affected the success of the egg moving from egg to the adult stage (χ2 = 432.34, df = 17, p < 0.0001) but source was not significant (χ2 = 0, df = 1, p = 1.0) and the interaction of flour and source was also significant (χ2 = 126.58, df = 13, p < 0.0001). Within pairwise comparisons between sources for each flour, corn was significantly different (t-ratio = 4.84, df = 708, p = 0.002) with Source 2 having better success, garbanzo was significantly different (t-ratio = −7.47, df = 708, p < 0.0001) with Source 1 having better success, and sorghum was significantly different (t-ratio = −5.71, df = 708, p < 0.0001) with Source 1 having better success (Supplementary Table S6). Based on these pairwise comparisons, the source with less success was removed from analyses detailed below describing the time of hatch and development into adults for 50% and 90% of samples.
For most flours, the time for 50% of the population to hatch is predicted to take less than 4 weeks (Table 6). Time to hatch indicates any life stage other than egg. For millet, potato, teff, cassava, coconut, amaranth, and almond the time for 50% of the population to hatch is predicted to take between 4.1 to 12.6 weeks. Barley and sorghum are predicted to take the least time for 90% of the population to hatch at 5.1 weeks while almond is predicted to take 23.9 weeks for 90% of the population to hatch (Table 6). All the other flours tested ranged from 5.3 to 14.9 weeks for 90% of the population to hatch.
Time to 50% of eggs to develop into adults was less than 4.9 weeks for sorghum, spelt, teff, and wheat. The predicted development time for 50% adult emergence ranged between 5.1 and 5.9 weeks for barley, buckwheat, corn, garbanzo, millet, and rye. Oat, rice, and quinoa ranged from 6.8 to 8.7 weeks for 50% of the population to emerge as adults (Table 6). Almond, amaranth, cassava, coconut, and potato are predicted to take well over 500 weeks to reach adulthood for both 50% and 90% of the population (Table 6). It is predicted that sorghum, buckwheat, and corn will take between 6.4 and 6.8 weeks for 90% of the population to reach adults, while spelt, barley, wheat, and garbanzo are predicted to take 7.0 to 7.7 weeks. Millet, rye, teff, and rice are predicted to take 8.1 to 8.4 weeks for 90% of the population to reach adults, and rice, quinoa, and oat are predicted to take 9.1 to 13.1 weeks (Table 6).

4. Discussion

The type of flour had a significant effect on the number of eggs laid and progeny produced. The differences in oviposition are likely driven by volatile olfactory cues, textural cues, or chemical gustatory cues. Flours that had a low risk of infestation had a distinctly different texture than other flours tested which was more powdered and finer or were oily with a semi-flaky texture. In addition, nutritional content such as sodium, fiber, or protein can drive infestation risk. For example, flours with high caloric content had no progeny emergence. Examples of low risk of infestation flours from our study include cassava, amaranth and potato which had a more powdered and finer texture and coconut and almond which were oily with semi-flaky texture compared to the other flours tested. In addition, coconut and almond had high caloric content. In Manduca sexta high-fat diets also led to higher mortality and lower body weights [23].
Chemical and physical properties of these flours have been shown to have a significant impact on the development of insects. For example, both corn and wheat flour supplemented with brewer’s yeast did significantly better in productivity than just corn and wheat flour without yeast [17]. Similar to our results showing a positive association with egg count and protein, Astuti et al. [22] showed that in the flours they tested, flours with low protein content (<5%) were unsuitable for T. castaneum development but also that high protein content in flours like soybean flour (>25%) was also unsuitable for development. Wong and Lee [16] also detailed a trade-off of carbohydrates and proteins within flours for growth and fecundity. Our results suggest that protein also plays a role in successful progeny emergence and oviposition, with increasing risk of infestation with increasing protein content, but the range of protein content tested (0 to 15.5 g) is not a function of the percentage of the diet, and is not a large enough range to make a significant association of a maximum protein level.
Particle size, which we hypothesize to play a role in our series of flours tested, has been shown to play a significant role and can impact the microclimate of the T. castaneum [20,21,22] but was not explicitly tested here. However, flours at high risk for infestation are all types of traditional grains with similar nutritional properties and textures. For progeny emergence, rye, wheat, millet, and teff flours had the highest numbers of progeny emerge while buckwheat had moderately high progeny emergence. Sorghum, corn, and rice had relatively low numbers of progeny emerge and suggests something likely nutritional or chemical within the flour is affecting development to adult stage post-egg laying. However, sorghum and corn had over 75% of single eggs develop into adults 8 weeks after eggs were placed on the given flour. A possible explanation for this difference between progeny laid emergence and single egg development could be that additional nutritional properties that were sieved out for egg counting purposes are needed to fulfill the specific nutritional components for egg development in T. castaneum.
The interaction of flour type and source also had a significant impact, but sources were typically equal in progeny and egg counts, and differences were only detected for the number of eggs laid for corn and in adult progeny counts for oat and millet. The overall similarities between sources suggest that regardless of the source of the flour, the infestation potential of these insects can be considered consistent based on the flour type. The differences in egg counts for corn could be due to the two corn flours being different varieties as Source 2 was snow-white corn and Source 1 was yellow corn. In addition, the differences between progeny counts for millet and oat could be due to Source 2 millet and oat not having eggs counted, thus reducing any damage to eggs laid and increasing progeny emergence. However, eggs laid in laboratory wheat flour had high progeny emergence of over 80% and single egg development to adults was about 75% for wheat flour, so experimental damage is unlikely to reduce progeny emergence significantly. Differences between sources could also be due to source or plant variety differences in nutrition, source of grain as in where it was grown and how it was processed, or potential contaminates.
Flour type in addition to impacting the probability of development to the adult stage, also impacted the time it took to develop. In addition to sorghum and corn having high single egg development to adult, teff, wheat, barley, garbanzo, millet, rye, spelt, and buckwheat also had over 75% of single eggs develop into adults 8 weeks after eggs were placed on a given flour, although the timing of adult emergence was different among these flours. For example, by week 6 after eggs were placed on the flour, teff and wheat both had at least 70% of eggs developed into adults while it took garbanzo 8 weeks to get 75% of eggs to adults and barley and buckwheat 7 weeks to develop 75% to adults. These results suggest that although these flours have high adult emergence success and must contain all nutritional requirements, some flours, such as garbanzo, may have the necessary nutritional components in lower amounts that take a longer time to accumulate to trigger adult emergence. For example, riboflavin has been implicated in the development of T. castaneum [17,22,24] and although not measured or available on package labels here, low riboflavin levels could be a factor in the increased developmental times or lack of adult emergence.
Further, nutritive content likely played a significant role in the overall number of eggs laid and overall progeny emergence. For example, the higher the sodium content, the fewer eggs were likely to be laid in each flour while higher fiber and protein resulted in a greater number of eggs laid. For progeny, higher carbohydrate content resulted in more progeny that emerged, while higher calories from fat, saturated fat, and sodium resulted in lower numbers of eggs laid. Our analyses show that higher sodium tends to lead to lower numbers of eggs and progeny emergence. This could be due to higher sodium levels acting as a deterrent to laying eggs as shown in blowflies [25] or too much sodium resulting in decreased larval development [26]. Higher fiber and protein levels also tended to result in increases in eggs laid and progeny emergence but high protein levels can also act as a deterrent in some species [27] or inhibit progeny emergence [15]. Overall, a more detailed analysis of components of these flours will allow a finer scale analysis of specific nutritive components crucial for T. castaneum growth; interestingly, differences between sources also create further questions as to what is differing in flours from different sources.
Similar to single egg success showing differences in hatching and adult emergence timing, estimates of curves for progeny emergence over time showed clustering of flours with different timing patterns. Again, teff, millet, wheat, spelt, and barley showed patterns consistent with their high numbers of eggs laid and progeny emergence and had progeny emerge early in high numbers. There was a significant splitting of sources again for flours such as garbanzo, oat, and sorghum. For example, garbanzo and sorghum from Source 2 had slower or delayed emergence of progeny compared to garbanzo and sorghum from Source 1. If we remove sources with slower emergence rates, we can model curves that predict the quickest that the flour will be at risk of adult emergence. Teff, millet, wheat, barley, and spelt are at risk earliest for adult emergence, while corn, buckwheat, garbanzo, oat, rye, quinoa, and rice had early progeny emergence but tended to have lower numbers of adults. Gauging infestation potential or risk based on these flours can provide a good estimate of when to potentially stop further generations from infesting the product. Flours with late progeny output such as potato and sorghum would not provide a good predictive estimate of infestation until it may be too late to stop a major infestation, especially if there are other flours stored in the same area.
In addition to the developmental timing, the overall success of egg hatching and timing of this hatching is also impacted by flour type. Estimating when 50% or 90% of eggs hatch or adults emerge is important to predicting the overall success and potential of mating populations within a product. Almond, amaranth, and coconut are predicted to take the longest to hatch to larvae but our models predict years for these beetles to emerge as adults, in which time they would most likely die as larvae. Similarly, amaranth, cassava, and potato are predicted to take years to emerge into adults. Eggs on most flours are predicted to take less than 4 weeks for both 50% or 90% of them to hatch. Sorghum, spelt, teff and wheat were quickest for 50% of adults to emerge and sorghum, buckwheat, corn, spelt, and barley were the quickest for 90% of adults to emerge. These flours with the quickest emergence time could be used as indicators of infestation in a warehouse or storefront setting.
Unconventional flours made from a variety of crops have been receiving attention from a consumer standpoint [1,2,3,4] but the risk of infestation of stored product pests has received limited attention. Main diet staples specific to a given region of the world such as yam, cassava, semovita [13], corn, rice, mung bean, sago, and breadfruit [22] have been studied to determine how insects can grow and infest on these important local commodities. Similarly, major pest species in different areas such as Prostephanus truncatus or Trogoderma granarium have also received specific attention due to their detrimental effects in a given region in the world [28,29]. However, a study with a broad examination of flours like the one detailed in this manuscript can provide a baseline for establishing infestation risk thresholds and monitoring of a cosmopolitan pest on a range of different products. As options for gluten-free or enhanced nutrition flours grow [1,3], risk assessment for insect pests is necessary for developing integrated pest management programs and solutions to protect these high dollar commodity products. This research suggests that there are several factors that may result in a lowered risk of insect infestation such as sodium content and particle size and further research needs to be completed to determine what other nutritional factors and physical characteristics can deter both oviposition and development of insect pests.
In our study, we examined the relative risk of T. castaneum on a variety of different flours, but other stored product pest species may have different patterns in terms of the risk they pose to these flours and patterns of competition among species may also differ on different flour types [30,31]. Other species could have vastly different responses to these flours tested compared to T. castaneum and strain-specific dietary preferences and toxicity effects for a single species could significantly impact infestation risks [32,33]. In addition, understanding how communities of insects interact with local food sources is critical as the abundance and variety of these commodities are changing and shifts in community composition could drive increased risk in product infestation as other minor pests become more problematic.
Our study did not provide the beetles with a choice of flour source to oviposit eggs, but given a choice, females may respond differently to volatile, chemical, or textural cues associated with each flour. These choice studies must be examined in the future to determine how insects survey their environment and make decisions on oviposition and development sites for their offspring. Understanding how insects choose their oviposition sites will also provide management information for mixed storage sites, where, for example, wheat flour and cassava flour are stored near one another. In these scenarios, one might assume that if the wheat flour is infested with insects, the cassava flour must be infested too and therefore, all these flours must be treated for the insect. However, it is likely that the cassava flour will not be infested and does not need to be treated. In addition, it may be valuable to store high dollar flours near high risk of infestation flours and insects may choose to infest the “bait” flour and not the more valuable flour. Future choice experiments will provide further information on the decisions for oviposition in these insects and will provide further information on how to behaviorally manage these pests. In addition, understanding which components of these flours can act to either inhibit or promote oviposition and the development of insects in these flours can be used as a reduced risk tactic.

5. Conclusions

With a wide variety of alternatives to wheat flour emerging in the consumer marketplace, food facility managers must understand the relative risks of these flours to infestation by insect pests. Our study details both oviposition risk and developmental timing of T. castaneum on 18 different types of commercially available flour. We find that there is a range of insect infestation risk among these flours and that flours such as wheat, teff, barley, spelt, and buckwheat are particularly susceptible to T. castaneum infestations while almond, amaranth, coconut, cassava, and potato do not support adult progeny emergence. Targeted treatments towards high-risk flours can now be employed by managers as well as additional tactics to manage insects within these and other post-harvest consumer goods.

Supplementary Materials

The following are available online at https://www.mdpi.com/2073-4395/10/10/1593/s1. Table S1: Nutrition Information for All Flours Tested. Nutrition information from packaging for flours from Source 1 and Source 2. Table S2: LS-means ± standard error (SE) for each flour and source. Letters by LS-means are Tukey groupings adjusted for multiple comparisons at α = 0.05. Table S3: Pairwise comparison for all life stages and each flour, source, and week combination. Comparison represents the Flour, Source, and Week. Estimate is the pairwise estimate. SE is standard error, df is degrees of freedom. t-ratio is t-ratio for the pairwise test. p-value is the significance value. Each life stage is a separate tab. If Estimate is NA, there were no available data for that life stage for that flour, source, and week combination. Table S4: Tukey comparison of the number of each life stage for each flour, source, week combination. Each life stage is a tab. LS mean is the estimate, SE is standard error, df is degrees of freedom, lower CL is lower confidence limit, upper CL is upper confidence limit, and group is the Tukey grouping. Table S5: Pairwise comparison of hatch rate for each flour and source combination. Estimate is the estimate of hatch rate difference, SE is standard error, df is degrees of freedom, t-ratio is the pairwise t-ratio test, and p-value is the significance value. Table S6: Pairwise comparison of hatch rate success and adult development success for each flour and source combination. Estimate is the estimate of hatch rate (or adult success) difference, SE is standard error, df is degrees of freedom, t-ratio is the pairwise t-ratio test, and p-value is the significance value. Adult success and hatch rate are independent tabs.

Author Contributions

Conceptualization: A.R.G. and J.F.C.; Methodology: A.R.G. and J.F.C.; Software: A.R.G.; Validation: A.R.G.; Formal Analysis: A.R.G.; Investigation: A.R.G.; Resources: A.R.G. and J.F.C.; Data Curation: A.R.G.; Writing—Original Draft Preparation: A.R.G.; Writing—Review and Editing: A.R.G. and J.F.C. Visualization: A.R.G.; Supervision: A.R.G. and J.F.C.; Project Administration: J.F.C.; Funding Acquisition: J.F.C. All authors have read and agreed to the published version of the manuscript.

Funding

This research received no external funding.

Acknowledgments

Thank you to Josie Pierce for collecting and organizing data and Rich Hammel for supervising data collection. The authors declare no conflict of interest. Mention of trade names or commercial products in this publication is solely for the purpose of providing specific information and does not imply recommendation or endorsement by the U.S. Department of Agriculture. USDA is an equal opportunity employer.

Conflicts of Interest

The authors declare no conflict of interest.

References

  1. Heller, L. Commercial Aspects of Gluten-Free Products. In Gluten Free Food Science and Technology; Gallagher, E., Ed.; Wiley-Blackwell: Chichester, UK, 2009; pp. 99–106. [Google Scholar]
  2. Cureton, P.; Fasano, A. The Increasing Incidence of Celiac Disease and the Range of Gluten-Free Products in the Marketplace. In Gluten Free Food Science and Technology; Gallagher, E., Ed.; Wiley-Blackwell: Chichester, UK, 2009; pp. 1–15. [Google Scholar]
  3. Bogue, J.; Sorenson, D. The marketing of gluten-free cereal products. In Gluten-Free Cereal Products and Beverages; Arendt, E.K., Dal Bello, F., Eds.; Elsevier: Burlington, MA, USA, 2008; pp. 393–412. [Google Scholar]
  4. Gluten-Free Products Market Size, Share & Trends Analysis Report by Product (Bakery Products, Dairy/Dairy Alternatives), by Distribution Channel (Grocery Stores, Mass Merchandiser), by Region, and Segment Forecasts, 2020–2027. Grand View Research. Available online: https://www.grandviewresearch.com/industry-analysis/gluten-free-products-market (accessed on 6 July 2020).
  5. Arthur, F.H.; Starkus, L.A.; Gerken, A.R.; Campbell, J.F.; McKay, T. Growth and development of Tribolium castaneum (Herbst) on rice flour and brown rice as affected by time and temperature. J. Stored Prod. Res. 2019, 83, 73–77. [Google Scholar] [CrossRef]
  6. Arthur, F.H.; Bean, S.R.; Smolensky, D.; Gerken, A.R.; Siliveru, K.; Scully, E.D.; Baker, N. Development of Tribolium castaneum (Herbst) (Coleoptera: Tenebrionidae) on sorghum milling fractions. J. Stored Prod. Res. 2020, 87, 101606. [Google Scholar] [CrossRef]
  7. Campbell, J.F.; Toews, M.D.; Arthur, F.H.; Arbogast, R.T. Long-term monitoring of Tribolium castaneum in two flour mills: Seasonal patterns and impact of fumigation. J. Econ. Entomol. 2010, 103, 991–1001. [Google Scholar] [CrossRef] [PubMed]
  8. McKay, T.; Bowombe-Toko, M.P.; Starkus, L.A.; Arthur, F.H.; Campbell, J.F. Monitoring of Tribolium castaneum (Coleoptera: Tenebrionidae) in rice mills using pheromone-baited traps. J. Econ. Entomol. 2019, 112, 1454–1462. [Google Scholar] [CrossRef] [PubMed]
  9. Ali, A.; Sarwar, M. Evaluating resistance of wheat germplasms to attack by red flour beetle, Tribolium castaneum (Herbst) (Coleoptera). Pak. J. Zool. 2011, 43, 793–797. [Google Scholar]
  10. Fraenkel, G.; Blewett, M. The importance of folic acid and unidentified members of the vitamin B complex in the nutrition of certain insects. Biochem. J. 1947, 41, 469–475. [Google Scholar] [CrossRef] [Green Version]
  11. Chaudhary, K.D.; Lemonde, A. Phosphorus in the nutrition of Tribolium confusum Duval. Can. J. Zool. 1962, 40, 375–380. [Google Scholar] [CrossRef]
  12. Naseri, B.; Borzoui, E.; Majd, S.; Mozaffar Mansouri, S. Influence of different food commodities on life history, feeding efficiency, and digestive enzymatic activity of Tribolium castaneum (Coleoptera: Tenebrionidae). J. Econ. Entomol. 2017, 110, 2263–2268. [Google Scholar] [CrossRef]
  13. Ajayi, F.A.; Rahman, S.A. Susceptibility of some staple processed meals to red flour beetle, Tribolium castaneum (Herbst) (Coleoptera: Tenebrionidae). Pak. J. Biol. Sci. 2006, 9, 1744–1748. [Google Scholar]
  14. Sokoloff, A.; Franklin, I.R.; Lakhanpal, R.K. Comparative studies with Tribolium (Coleoptera, Tenebrionidae)—II: Productivity of T. castaneum (Herbst) and T. confusum Duv. on natural, semi-synthetic and synthetic diets. J. Stored Prod. Res. 1966, 1, 313–324. [Google Scholar] [CrossRef]
  15. Fields, P.G. Effect of Pisum sativum fractions on the mortality and progeny production of nine stored-grain beetles. J. Stored Prod. Res. 2006, 42, 86–96. [Google Scholar] [CrossRef]
  16. Wong, N.; Lee, C.Y. Relationship between population growth of the red flour beetle Tribolium castaneum and protein and carbohydrate content in flour and starch. J. Econ. Entomol. 2001, 104, 2087–2094. [Google Scholar] [CrossRef] [PubMed]
  17. Sokoloff, A.; Franklin, I.R.; Overton, L.F.; Ho, F.K. Comparative studies with Tribolium (Coleoptera, Tenebrionidae)—I: Productivity of T. castaneum (Herbst) and T. confusum Duv. on several commercially-available diets. J. Stored Prod. Res. 1966, 1, 295–311. [Google Scholar] [CrossRef]
  18. Fabres, A.; da Silva, J.D.C.M.; Fernandes, K.V.; Xavier-Filho, J.; Rezende, G.L.; Oliveira, A.E.A. Comparative performance of the red flour beetle Tribolium castaneum (Coleoptera: Tenebrionidae) on different plant diets. J. Pest Sci. 2014, 87, 495–506. [Google Scholar] [CrossRef]
  19. Namin, F.R.; Naseri, B.; Nouri-Ganbalani, G.; Razmjou, J. Demographic studies of Tribolium castaneum (Coleoptera: Tenebrionidae) on various barley cultivars. J. Stored Prod. Res. 2018, 79, 60–65. [Google Scholar] [CrossRef]
  20. Fardisi, M.; Mason, L.J.; Ileleji, K.E. The susceptibility of animal feed containing Dried Distiller’s Grains with Solubles to Tribolium castaneum (Herbst) infestation. J. Stored Prod. Res. 2017, 72, 59–63. [Google Scholar] [CrossRef]
  21. Fardisi, M.; Mason, L.J.; Ileleji, K.E.; Richmond, D.S. Effect of chemical and physical properties of Dried Distillers Grains with solubles (DDGS) on Tribolium castaneum (Herbst) development. J. Stored Prod. Res. 2019, 80, 57–64. [Google Scholar] [CrossRef]
  22. Astuti, L.P.; Rizali, A.; Firnanda, R.; Widjayanti, T. Physical and chemical properties of flour products affect the development of Tribolium castaneum. J. Stored Prod. Res. 2020, 86, 101555. [Google Scholar] [CrossRef]
  23. Cambron, L.D.; Thapa, G.; Greenlee, K.J. Effects of high-fat diet on feeding and performance in the tobacco hornworm, Manduca sexta. Comp. Biochem. Physiol. Part A Mol. Integr. Physiol. 2019, 236, 110526. [Google Scholar] [CrossRef]
  24. Haemaelaeinen, M.K.; Loschiavo, S.R. Effect of synthetic b-vitamin and natural enrichment of flour on larval development and fecundity of Tribolium confusum and T. castaneum 1. Entomol. Exp. Appl. 1977, 21, 29–37. [Google Scholar] [CrossRef]
  25. Begum, M.; Hasan, M.; Saifullah, A.S.M.; Howlader, M.A. Effects of sodium chloride on oviposition and development of blowfly, Lucilia cuprina, (Wiedmann) (Diptera: Calliphoridae). Dhaka Univ. J. Biol. Sci. 2014, 23, 47–51. [Google Scholar] [CrossRef]
  26. Gitonga, N.K. Use of Salt to Reduce Post-Harvest Losses of Cured Fish Due to Blowfly (Lucilia and Chrysomya spp.) Infestation in KENYA. In Food and Agriculture Organization of the United Nations, Proceedings of the Expert Consultation on Fish Technology in Africa; FAO: Saly-Mbour, Republic of Senegal, 2001. [Google Scholar]
  27. Fields, P.G.; Xie, Y.S.; Hou, X. Repellent effect of pea (Pisum sativum) fractions against stored-product insects. J. Stored Prod. Res. 2001, 37, 359–370. [Google Scholar] [CrossRef]
  28. Athanassiou, C.G.; Kavallieratos, N.G.; Boukouvala, M.C. Population growth of the khapra beetle, Trogoderma granarium Everts (Coleoptera: Dermestidae) on different commodities. J. Stored Prod. Res. 2016, 69, 72–77. [Google Scholar] [CrossRef]
  29. Athanassiou, C.G.; Kavallieratos, N.G.; Boukouvala, M.C.; Nika, E.P. Influence of commodity on the population growth of the larger grain borer, Prostephanus truncatus (Horn) (Coleoptera: Bostrychidae). J. Stored Prod. Res. 2017, 73, 129–134. [Google Scholar] [CrossRef]
  30. Athanassiou, C.G.; Kavallieratos, N.G.; Throne, J.E.; Nakas, C.T. Competition among species of stored-product psocids (Psocoptera) in stored grain. PLoS ONE 2014, 9, e102867. [Google Scholar] [CrossRef]
  31. Quellhorst, H.; Athanassiou, C.G.; Bruce, A.; Scully, E.D.; Morrison III, W.R. Temperature-Mediated Competition Between the Invasive Larger Grain Borer (Coleoptera: Bostrichidae) and the Cosmopolitan Maize Weevil (Coleoptera: Curculionidae). Environ. Entomol. 2020, 49, 255–264. [Google Scholar] [CrossRef]
  32. Gerken, A.R.; Scully, E.D.; Campbell, J.F. Red flour beetle (Coleoptera: Tenebrionidae) response to volatile cues varies with strain and behavioral assay. Environ. Entomol. 2018, 47, 1252–1265. [Google Scholar] [CrossRef] [Green Version]
  33. Holloway, G.J.; Smith, R.H. Inheritance of the ability of Sitophilus oryzae (L.) (Coleoptera: Curculionidae) to feed and breed on yellow split-pea (Pisum sativum). Bull. Entomol. Res. 1985, 75, 367–375. [Google Scholar] [CrossRef]
Figure 1. Egg (A) and progeny (B) counts ± standard error for each flour and source. Some flours are only represented by one source since the other did not have egg counts collected. a, b, c, d, e, f—letters indicate significant differences.
Agronomy 10 01593 g001
Figure 2. Dendrogram and clustered curves for progeny emergence over time for flour and source. Source 1 (S1) is represented by gray text in the dendrogram and Source 2 (S2) is black text. Black curves in the clusters represent the centroid of the curve fitting. Dashed curves represent any other output curves that did not fit directly on the centroid curve but have good fit in the cluster.
Agronomy 10 01593 g002
Figure 3. Dendrogram and Clustered curves for progeny emergence over time for flour. Black curves in the clusters represent the centroid of the curve fitting. Dashed curves represent any other output curves that did not fit directly on the centroid curve but have good fit in the cluster.
Agronomy 10 01593 g003
Figure 4. Egg development over time for each flour. The graphs represent emergence data for all sources except, Source 1 corn and Source 2 garbanzo and sorghum. Darker colors represent later life stages of development.
Agronomy 10 01593 g004
Table 1. Information about flours. Weights are reported in grams, with mean ± standard error. S1 is Source 1 and S2 is Source 2.
FlourPlant FamilyDomesticated, Years AgoGluten LevelFlour FromSpecific Flour DetailPre-sieved for Oviposition WillingnessWeight (Grams) for Oviposition StudyWeight (Grams) for Egg Development Study
S1S2S1S2S1S2S1S2
AlmondRosaceae5000NoneSeed Almond MealNoNo1.34 ± 0.041.23 ± 0.030.22 ± 0.020.25 ± 0.02
AmaranthAmaranthaceae1000NoneSeed YesYes1.36 ± 0.041.58 ± 0.030.29 ± 0.010.32 ± 0.02
BarleyPoaceae9000LowGrain YesYes1.47 ± 0.041.29 ± 0.020.30 ± 0.020.25 ± 0.01
BuckwheatPolygonaceae8000NoneSeedOrganicWholeYesYes1.63 ± 0.021.63 ± 0.030.36 ± 0.020.35 ± 0.02
CassavaEuphorbiaceae10,000NoneVegetable YesYes1.85 ± 0.021.24 ± 0.020.38 ± 0.020.27 ± 0.01
CoconutArecaceae NoneSeedOrganic NoYes1.25 ± 0.021.46 ± 0.030.25 ± 0.020.28 ± 0.02
CornPoaceae9000NoneGrain Snow WhiteYesYes1.34 ± 0.031.30 ± 0.040.28 ± 0.020.29 ± 0.02
GarbanzoFabaceae5500NoneLegume YesNo1.29 ± 0.041.32 ± 0.030.31 ± 0.020.27 ± 0.01
MilletPoaceae10,000NoneSeed YesNo1.46 ± 0.031.38 ± 0.040.31 ± 0.010.28 ± 0.02
OatPoaceae4500NoneGrainWhole Grain YesNo1.37 ± 0.041.80 ± 0.020.25 ± 0.020.34 ± 0.01
PotatoSolanaceae8000NoneVegetable YesYes2.03 ± 0.021.45 ± 0.030.43 ± 0.020.27 ± 0.02
QuinoaAmaranthaceae4000NoneSeedOrganic YesYes1.56 ± 0.041.90 ± 0.040.28 ± 0.020.40 ± 0.02
RicePoaceae9000NoneGrainBrownBrownYesYes1.83 ± 0.051.34 ± 0.030.36 ± 0.010.25 ± 0.02
RyePoaceae10,000LowGrainOrganic Dark YesYes1.41 ± 0.041.46 ± 0.040.31 ± 0.020.30 ± 0.02
SorghumPoaceae6000NoneGrain Yes 1.83 ± 0.03 0.34 ± 0.02
SpeltPoaceae7000HighGrainOrganic Yes 1.70 ± 0.03 0.34 ± 0.02
TeffPoaceae6000NoneSeed Yes 1.54 ± 0.03 0.30 ± 0.02
Wheat (Lab)Poaceae10,000HighGrain Yes (Lab) 1.77 ± 0.04 0.35 ± 0.02
Table 2. Pairwise comparisons between each source for each flour. DF = 573 for eggs. DF = 2485 for progeny. Bolded text within the table represents significant differences between sources.
EggsProgeny
FlourEstimate ± SEt-Ratiop-ValueEstimate ± SEt-Ratiop-Value
AlmondBoth sources not counted0 ± 3.301.00
Amaranth0.9 ± 4.30.201.000 ± 3.301.00
Barley4.9 ± 4.31.150.940.09 ± 3.30.0291.00
Buckwheat−2.3 ± 4.3−0.551.00−7.9 ± 3.3−2.390.21
Cassava0.3 ± 4.30.0671.000 ± 3.301.00
Corn12.6 ± 4.32.960.03−3.3 ± 3.3−1.0150.99
GarbanzoSource 2 not counted−5.1 ± 3.3−1.570.83
MilletSource 2 not counted11.8 ± 3.33.590.0049
OatSource 2 not counted10.6 ± 3.33.220.018
Potato−3.9 ± 4.3−0.930.990.09 ± 3.30.0291.00
Quinoa−4.6 ± 4.3−1.070.96−1.4 ± 3.3−0.441.00
Rice6.1 ± 4.31.440.800.05 ± 3.30.0141.00
Rye−4.7 ± 4.3−1.100.96−2.1 ± 3.3−0.621.00
Sorghum−4.0 ± 4.3−0.940.99−3.3 ± 3.3−1.020.99
Table 3. Egg and progeny count differences between all flours with no source. Letters represent Tukey adjusted significance at α < 0.05 and are unique to either eggs or progeny counts.
Eggs Progeny
FlourLS-mean ± SEDFLS-mean ± SEDF
AlmondNot calculated 0 ± 1.9 a137.4
Amaranth8.8 ± 3.6 ab13.80 ± 1.9 a137.4
Cassava4.2 ± 3.6 a13.50 ± 1.9 a137.4
CoconutNot counted 0 ± 2.5 ab419.1
Corn26.9 ± 4.2 defg28.33.1 ± 1.9 abc137.4
Barley21.4 ± 3.6 cde13.56.1 ± 1.9 abc137.4
Buckwheat28.7 ± 3.6 efg13.59.0 ± 1.9 bc137.4
Garbanzo14.9 ± 4.2 abcd302.7 ± 1.9 abc137.4
Millet19.8 ± 4.2 bcde28.320.9 ± 2.5 de419.1
Oat17.2 ± 4.2 abcde3010.8 ± 2.5 bcd419.1
Potato13.1 ± 3.6 abc13.50.05 ± 1.9 a137.4
Quinoa13.5 ± 3.6 abc13.52.7 ± 1.9 abc137.4
Rice29.9 ± 3.6 efg13.51.7 ± 1.9 ab137.4
Rye21.3 ± 3.6 cde13.510.4 ± 1.9 c137.4
Spelt23.1 ± 4.2 cdef28.311.1 ± 2.5 bcd419.1
Sorghum26.9 ± 3.6 def13.54.5 ± 1.9 abc137.4
Teff40.6 ± 4.2 g28.326.1 ± 2.5 e419.1
Wheat36.7 ± 3.9 fg20.419.7 ± 1.9 e8.42
Table 4. Pearson correlations of nutrition information from flour packaging and egg and progeny counts. Bolded text within the table represents significant correlations between eggs or progeny counts and the nutrition information.
Nutrition Informationt-Valuep-ValueCorrelation Coefficientt-Valuep-ValueCorrelation Coefficientt-Valuep-ValueCorrelation Coefficient
EggsSources CombinedSource 1Source 2
Calories−0.770.44−0.0353.650.00030.21−1.110.27−0.077
Calories from Fat0.700.490.036−1.570.12−0.121.970.050.14
Saturated Fat (g)−0.820.41−0.037−3.310.001−0.191.640.100.11
Sodium (mg)−5.85<0.0001−0.25−1.220.22−0.07−6.63<0.0001−0.42
Carbohydrates (g)−0.890.37−0.041.590.110.093−1.070.28−0.074
Fiber (g)2.650.00830.122.570.010.151.710.088−0.12
Protein (g)2.430.0150.113.550.0050.201.20.230.083
ProgenySources CombinedSource 1Source 2
Calories−0.740.46−0.0296.96<0.00010.36−1.420.16−0.083
Calories from Fat−2.950.0033−0.14−0.550.58−0.04−2.520.012−0.14
Saturated Fat (g)−6.07<0.0001−0.24−4.32<0.0001−0.23−3.870.00013−0.22
Sodium (mg)−5.68<0.0001−0.22−2.050.041−0.11−5.5<0.0001−0.31
Carbohydrates (g)0.170.870.00675.30<0.00010.28−0.640.52−0.037
Fiber (g)4.55<0.00010.185.30<0.00010.282.590.010.15
Protein (g)1.490.140.0594.29<0.00010.230.190.850.011
Table 5. ANOVA results for egg development over 4 weeks for each life stage independently. Bolded text within the table represents significant effects in the model.
Effectχ2DFp-Value
Egg Life Stage
Flour230.3917<0.0001
Source011.00
Week021.00
Flour-by-Source65.0314<0.0001
Flour-by-Week13.34511.00
Source-by-Week1.3430.72
Flour-by-Source-by-Week10.88421.00
Larval Life Stage
Flour42.6017<0.0001
Source13.5610.00023
Week4.8530.18
Flour-by-Source23.13130.04
Flour-by-Week49.40350.05
Source-by-Week6.2830.09
Flour-by-Source-by-Week14.84220.87
Pupal Life Stage
Flour141.2412<0.0001
Source15.341<0.0001
Week30.533<0.0001
Flour-by-Source29.8480.00023
Flour-by-Week222.0125<0.0001
Source-by-Week28.773<0.0001
Flour-by-Source-by-Week62.969<0.0001
Adult Life Stage
Flour55.5012<0.0001
Source0.05910.81
Week22.183<0.0001
Flour-by-Source41.609<0.0001
Flour-by-Week38.67300.13
Source-by-Week1.3430.72
Flour-by-Source-by-Week4.94180.99
Table 6. Time to hatching and time to adult predicted 50% and 90% values for all flours tested. Table 50 and time to 90% values are inverse function adjusted and adjusted for time series. Hatch indicates any life stage other than egg.
Time to HatchTime to Adult Emergence
FlourPredicted Weeks to 50% ± Standard ErrorPredicted Weeks to 90% ± Standard ErrorPredicted Weeks to 50% ± Standard ErrorPredicted Weeks to 90% ± Standard Error
Almond12.6 ± 3.623.9 ± 4.4>500 ± 500>500 ± 500
Amaranth9.8 ± 3.314.9 ± 3.6>500 ± 500>500 ± 500
Barley3.7 ± 3.15.1 ± 3.15.1 ± 3.07.2 ± 3.1
Buckwheat3.7 ± 3.15.4 ± 3.15.1 ± 3.06.7 ± 3.1
Cassava4.5 ± 3.18.4 ± 3.2>500 ± 500>500 ± 500
Coconut5.5 ± 3.112.5 ± 3.4>500 ± 500>500 ± 500
Corn3.7 ± 3.15.3 ± 3.15.2 ± 3.16.8 ± 3.1
Garbanzo3.9 ± 3.16.6 ± 3.25.9 ± 3.17.7 ± 3.1
Millet4.1 ± 3.18.1 ± 3.25.3 ± 3.18.1 ± 3.1
Oat3.8 ± 3.15.6 ± 3.18.7 ± 3.213.1 ± 3.4
Potato4.1 ± 3.17.3 ± 3.1>500 ± 500>500 ± 500
Quinoa3.9 ± 3.16.6 ± 3.17.1 ± 3.110.7 ± 3.2
Rice3.8 ± 3.15.8 ± 3.16.8 ± 3.19.2 ± 3.1
Rye3.8 ± 3.15.8 ± 3.15.4 ± 3.18.1 ± 3.1
Sorghum3.7 ± 3.15.1 ± 3.14.9 ± 3.16.4 ± 3.1
Spelt3.8 ± 3.15.8 ± 3.24.5 ± 3.17.0 ± 3.2
Teff4.4 ± 3.18.7 ± 3.34.8 ± 3.18.4 ± 3.2
Wheat3.9 ± 3.17.0 ± 3.24.6 ± 3.17.5 ± 3.1
Publisher’s Note: MDPI stays neutral with regard to jurisdictional claims in published maps and institutional affiliations.

