Multi-Year Dynamics of Single-Step Genomic Prediction in an Applied Wheat Breeding Program
by
 ,
,
Sebastian Michel
1,* ,
,
Franziska Löschenberger
2,
Ellen Sparry
3,
Christian Ametz
2 and
Hermann Bürstmayr
1 1
Department of Agrobiotechnology, IFA-Tulln, University of Natural Resources and Life Sciences Vienna, Konrad-Lorenz-Str. 20, 3430 Tulln, Austria
2
Saatzucht Donau GesmbH. & CoKG, Saatzuchtstrasse 11, 2301 Probstdorf, Austria
3
C&M Seeds, 6180 5th Line, Palmerston, ON N0G 2P0, Canada
*
Author to whom correspondence should be addressed.
Agronomy 2020, 10(10), 1591; https://doi.org/10.3390/agronomy10101591
Submission received: 19 August 2020
/
Revised: 10 October 2020
/
Accepted: 13 October 2020
/
Published: 17 October 2020
(This article belongs to the Special Issue Wheat Breeding: Procedures and Strategies – Series Ⅱ)
Abstract
:The availability of cost-efficient genotyping technologies has facilitated the implementation of genomic selection into numerous breeding programs. However, some studies reported a superiority of pedigree over genomic selection in line breeding, and as, aside from systematic record keeping, no additional costs are incurring in pedigree-based prediction, the question about the actual benefit of fingerprinting several hundred lines each year might suggest itself. This study aimed thus on shedding some light on this question by comparing pedigree, genomic, and single-step prediction models using phenotypic and genotypic data that has been collected during a time period of ten years in an applied wheat breeding program. The mentioned models were for this purpose empirically tested in a multi-year forward prediction as well as a supporting simulation study. Given the availability of deep pedigree records, pedigree prediction performed similar to genomic prediction for some of the investigated traits if preexisting information of the selection candidates was available. Notwithstanding, blending both information sources increased the prediction accuracy and thus the selection gain substantially, especially for low heritable traits. Nevertheless, the largest advantage of genomic predictions can be seen for breeding scenarios where such preexisting information is not systemically available or difficult and costly to obtain.
1. Introduction
Four prediction scenarios have been of principal interest when implementing genomic selection into breeding programs: The prediction of untested and tested genotypes in tested and untested environments. These combinations have thus been investigated in various studies, which found that the prediction of tested genotypes in already tested environments results in the highest accuracy followed by the prediction of untested genotypes in tested environments [1,2]. The most challenging scenario is though given by predicting untested genotypes in untested environments, which corresponds to, among others, genomic-based prediction across multiple years in applied breeding programs [3,4,5,6]. This prediction problem can however be simplified in some cases to predicting already tested genotypes in untested environments or years by including preexisting information e.g., from preliminary yield trials for the trait of interest or of correlated secondary traits into prediction models [7,8,9].
Such a multi-year prediction is oftentimes for a large extent equivalent with a prediction across multiple breeding cycles or cohorts in cereal breeding [10], giving rise to the further challenge of an increasing genetic distance between the training population and selection candidates, which generally results in lower prediction accuracies in comparison to training populations that are closely related to the selection candidates [11,12]. An additional issue, aside from actual relationships, is given by the several possibilities to address this genetic distance in order to derive accurate performance predictions. Marker-based relationship matrices have been frequently reported to outperform models with pedigree relationship matrices for this purpose [13,14], whereas some studies have reported similar or even superior performance of pedigree in comparison to genomic selection in applied line breeding programs [15,16,17].
Given that no additional direct costs or labour, aside from systematic record keeping, are incurring when exploiting pedigree data for deriving breeding values, the question about the benefit of fingerprinting several hundred of even thousands of lines each year might suggest itself. One possibility to putatively enhance accuracies above pure pedigree and genomic prediction is given by blending both relationship matrices for a so-called single-step prediction [18,19]. The merit of such a single-step prediction is though dependent on the fine-tuning of several scaling factors used for setting-up a combined relationship matrix [20], and on the dynamics of genotype-by-environments interactions when prediction across multiple years. The aims of this study were thus to (i) compare various possibilities for blending pedigree and genomic relationship information, and (ii) to investigate the dynamics of pedigree, genomic, and single-step prediction models across a time period of ten years in an applied wheat (Triticum aestivum L.) breeding program.
2. Materials and Methods
2.1. Plant Material
A population of 4032 recombinant inbred and double haploid breeding lines, developed in an applied winter wheat breeding program, was analysed in this study (Table 1). A subset of 2567 of these lines were phenotyped for grain yield, protein content using near-infrared spectroscopy (NIRS), and protein yield as the product of both traits merely in preliminary yield or observation trials at one location in Austria between 2012 and 2018, where F4:5 generation lines were tested unreplicated alongside replicated checks. Another subset of 1464 of these lines were also investigated for the mentioned traits in a total of 148 Central and Eastern European multi-environment trials in a total of different 38 locations from 2010 to 2019. The latter lines represented selection candidates with superior performance that were advanced to multi-environment testing in several countries ranging from Austria, Serbia and Romania to Turkey, and within each year a different subpopulation of 113–209 lines was tested in 2–24 trials, depending on the year and trait. Trial series within each year were generally unbalanced and partially replicated lines were tested alongside checks in plots of 5–10 m² size within each trial, while each line was on average replicated five times for protein yield and the protein content and eight times for grain yield across all trials. The number of lines from preliminary trials, which were retested in multi-environment trials in the corresponding subsequent year varied finally between 76 and 170. All trials were managed according to good agronomical practice at the given location.
2.2. Statistical Analysis of the Phenotypic Data
Phenotypic data from all 148 multi-environment trials and the seven preliminary yield trials were firstly analysed individually with various models correcting for spatial trends. All 15 possible combinations of random row and/or column effects with/without modelling autoregressive variance–covariance structures between the plots either in row, in column or in both directions [21] were compared with a baseline model without spatial correction (Supplementary Table S1). The best fitting model was chosen by Akaike’s information criterion (AIC) to derive best linear unbiased estimates (BLUE) and compute the heritability by
where designates the genetic variance of the investigated trait, and is the mean variance of a difference between the BLUEs [22]. The derived BLUEs from the 148 multi-environment trials were subsequently used for an across-trial analysis within each year with a linear mixed model of the form
where are the BLUEs from the individual trials for grain yield, protein content and protein yield, respectively; is the grand mean; and is the effect of the j-th line which was modelled fixed to derive year-specific BLUEs and random to estimate the genetic variance. The effect of the kth trial was fixed, while the effect that incorporated both the line-by-trial interaction variance and the residual effect was assumed to be random following a normal distribution with . It should be stressed that the preliminary yield trials were not subject to an across-trial analysis, and each preliminary yield trial was regarded as an individual set in all subsequent analysis. The year-wise heritabilities obtained in this across-trial analysis were again derived using Equation (1). All phenotypic analyses were conducted with ASReml 3 for R 3.6.3 [23].
2.3. Pedigree and Genotypic Data
The 4032 breeding lines could be grouped into 1420 different families with a size of 1–34 lines per family and a genealogy of 1151 ancestors tracing back up to 13 generations. DNA of all investigated breeding lines was extracted with a modified protocol following [24], and each line was genotyped with the genotyping-by-sequencing (GBS) approach from Diversity Array Technologies in Australia [25]. Markers with more than 10% of missing data and a minor allele frequency smaller than 5% were removed, while only one SNP of completely identical markers was retained for all for further analyses. Therefore, a final set of 3137 SNP markers was available after quality control and chromosome-wise imputing missing data points with the missForest algorithm [26]. The part of missing datapoints amounted 5.7% and an imputation accuracy of r = 0.93 was assessed at a 10% missing level by masking another 4.3% of the data points and correlating their observed and imputed marker profiles in a 50 times replicated resampling scheme. Originally missing data points not caused by masking were excluded from this evaluation as suggested by [27]. This marker set was subsequently used to examine the population structure by a principal component analysis (Supplementary Figure S1) and utilized for modelling genomic relationships in all employed prediction models. Phenotypic and genotypic data for a simulated population of wheat lines based on the actual GBS maker data as well as accompanied R Code is furthermore available as supplementary material to illustrate the mentioned prediction models that will be described in the next section.
2.4. Comparison of Phenotypic with Pedigree, Genomic and Single-Step Prediction across Years
The merit of different models for predictive breeding was assessed in a forward prediction of 2013–2019, where a random sample of 50 lines tested in multi-environment trials constituted one validation population for each of these years. Phenotypic prediction was based on the observed line performance in unreplicated preliminary yield trials in the respective preceding year, while pedigree-based and genomic-based prediction was conducted by randomly sampling a unique set of 100 lines tested in multi-environment trials from each of the three years preceding the validation year into a training population (Figure 1A). It should be noticed that none of the lines in the validation population were contained in the mentioned training population to avoid an upward bias of the prediction accuracy, and an assessment of the within-family was not feasible as the validation populations were mostly comprised of families with less than three lines and merely three families contained more than ten lines. The described sampling scheme was repeated 50 times for each year, and the corresponding breeding values were obtained from Best Linear Unbiased Prediction Models for each trait of interest:
where is an Nx1 vector of BLUEs obtained in the year-wise phenotypic analysis with model (2), while the vector designates of residual effects with . is a fixed effect matrix with the corresponding vector modelling the grand mean as well as fixed year effect. Additionally, the potential of combining multi-environment with preliminary yield trial data for a pedigree-assisted and genomic-assisted prediction was assessed by using BLUEs of both multi-environment and preliminary yield trials in model (3), where modelled the grand mean as well as fixed year-by-set effects, i.e., a multi-environment trial series and a preliminary trial tested in the same year had different fixed effects. The prediction models were furthermore extended by an additional fixed group effect, differentiating between multi-environment and preliminary yield trials, while a unique residual variance was assigned to each of these groups.
The relationship information was modelled by the random effects matrix and the corresponding vector of additive line effects with for pedigree best linear unbiased prediction (P-BLUP) and for genomic best linear unbiased prediction (G-BLUP). The necessary pedigree relationship matrix was computed by the recursive method proposed by [28], while the genomic relationship matrix was built following [29]
where is a centered marker matrix of the j lines with and being the allele frequency at the lth locus. Blending the pedigree and genomic relationship matrix was facilitated by the method proposed by [18] as well as [19] for a single-step genomic best linear unbiased prediction (SSG-BLUP), assuming an additive line effect with , where was computed by
with , and as adjusted genomic relationship matrix according to the suggestion by the authors of [30], which was employed to account for the impact of genetic trends across multiple generations by the intercept and models the according reduction in genetic variance from the base population to the population of genotyped lines by . The matrix contains the pedigree relationship between non-genotyped lines, the pedigree relationship between genotyped lines, while and model the pedigree relationship between genotyped and non-genotyped lines. Given that lines are oftentimes genotyped during a stage of preliminary yield trials in applied line breeding programs, a less costly strategy was tested that restricted genotyping to advanced lines tested in multi-environment trials, i.e., contained all lines of the validation population and modelled the relationship between lines in the training population for the single-step genomic predictions tested in the study at hand, while and modelled the relationship between lines in the training and validation population. The inverse of , which is necessary for solving the underlying mixed model equations, was given by [20]
where , , and are scaling factors influencing the mixing proportion between the involved pedigree and genomic relationship matrix. Based on the single-step prediction methodology, the merit of blending the genomic and pedigree relationship matrix was finally tested assuming that a breeding programs budget allows to genotype all early generation lines, i.e., was absent and was equivalent to when deriving by
It should be noticed that in this scenario the full matrix given in (6) is reduced to its lower right quadrant, i.e., the blending aspect of the single-step genomic prediction approach, and this approach will be referred to as pedigree-genomic prediction (PG-BLUP) in the study at hand. The scaling factors in and for both SSG-BLUP and PG-BLUP were subsequently investigated for their merit to increase the prediction accuracy by firstly varying and in the intervals and , excluding the combination and as is indefinite in this case. The scaling factors and were furthermore kept constant at and at first, whereas they were subsequently varied in the grid when the two other scaling factors were kept constant at and .
The above-described models were subsequently tested in another resampling scheme, where a unique set of 100 lines tested in multi-environment trials from one to nine years preceding the validation year were sampled into a training population in order to investigate the effect of its size. Please notice that for predicting 2013 a maximum of three years, i.e., 300 lines were used for model training, while for 2019 the entire range of one to nine years, i.e., 100–900 lines in the training population could be explored. Additional to the resampling schemes, a forward prediction using all available lines from multi-environment trials as well as the specific or all preliminary yield trials preceding a validation year for model training was finally conducted (Figure 1B). The latter scenario combined all data from previous multi-environment and preliminary yield trials for prediction model training and represented thus an option to vastly increase the size of the training population albeit with lines possessing qualitatively lower phenotypic records. The prediction accuracy for all models was obtained from the correlation of the predicted breeding values with the observed genotypic performance divided by the square root of the heritability [31]. The prediction accuracy for phenotypic selection was analogously derived from the correlation of the BLUEs from the preliminary yield trial and the observed genotypic performance in a corresponding validation year divided by the square root of the heritability. The relationship matrices and were generated with the R package AGHmatrix [32], and all models for genomic and pedigree prediction were fitted with sommer [33].
2.5. Prediction Accuracy within and across Families
A simulation study was subsequently conducted to gain further insight into the performance of the empirically tested pedigree, genomic and single-step models particularly regarding the accuracy of predictions within bi-parental families and across family averages, which was not possible in the empirical study due to the above-mentioned small family sizes. For this purpose, a total of 50 families that were actually tested in preliminary yield trials in 2015–2018 were 50 times randomly sampled, and the existing marker information from the according parents were used to simulate progeny populations with 50 recombinant inbred lines per family. These validation populations were generated using the R/qtl package [34], which features a Stahl model [35] that assumes independent crossovers along the chromosomes to simulate recombination breakpoints. The training population was again built by sampling 100 genotypes from the three preceding breeding cycles or cohorts as in the empirical study (Figure 1A).
The underlying causal variants of a quantitatively inherited trait were represented by sampling marker loci, while another set of markers was sampled to represent linked loci for building genomic relationship matrices. The QTL effects were randomly sampled from an identical and independent normal distribution with to obtain the estimated breeding values of all lines by
where is the matrix of marker genotypes of the lines in the training and validation population, and is the vector of QTL effects that were used to derive the vector of true breeding values. The entries for the vector of error effects were randomly sampled from a normal distribution with zero mean and a variance equal to
where is the variance of the true breeding values, and an aspired heritability of , and that was separately determined for lines within each of the breeding cycles or cohorts representing the training population. The corresponding heritability of the validation population was on the other hand set to , and in order to reflect the lower heritability of testing in preliminary yield trials. The accuracy of the respective prediction models was assessed by correlating the predicted with the true breeding values, while the true breeding value of each line was additionally dissected into
where is the true breeding value of the i-th family’s average and is the deviation of the true breeding value of the j-th line from the i-th family´s average. The predicted breeding values were analogously divided into family averages as well as deviations from the average, of which both were used for assessing the prediction accuracy for the respective source of variation.
3. Results
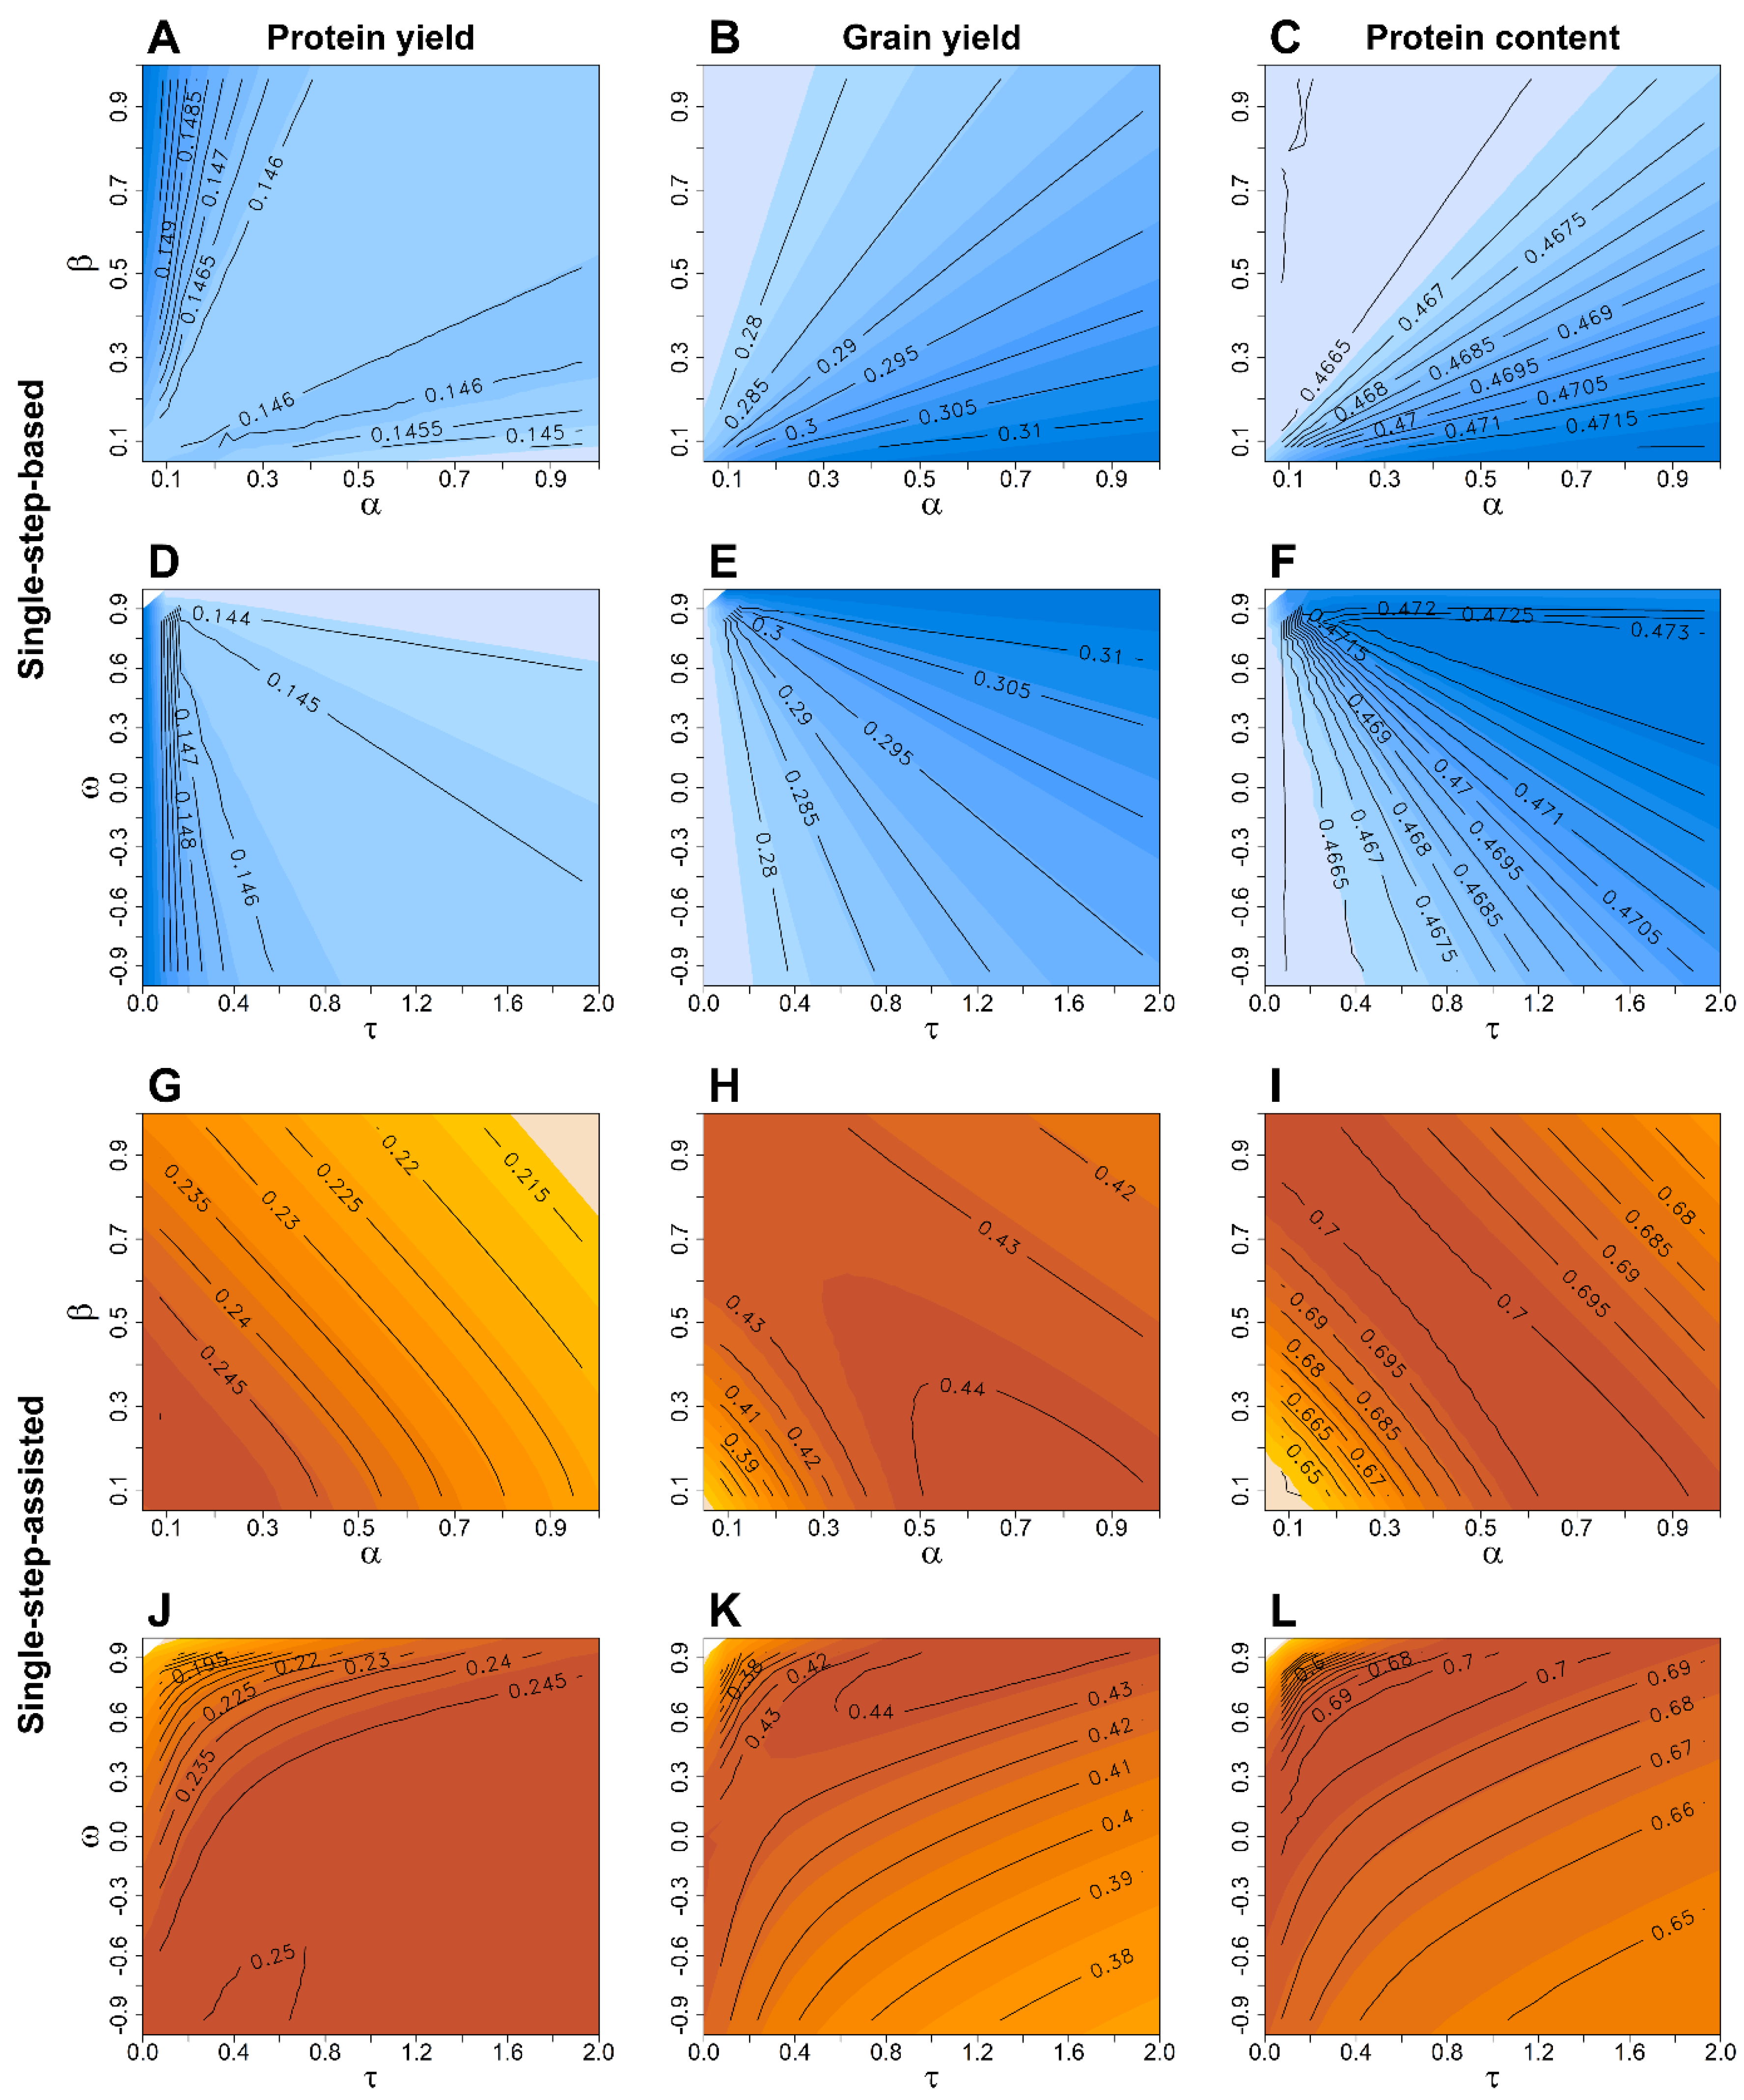
A high average heritability was estimated for the protein content (H² = 0.76), followed by the grain yield (H² = 0.58) and protein yield (H² = 0.43) according to expectations (Supplementary Table S2) [36,37,38]. Grain yield varied between 39.2 and 100.3 dt ha−1 and the protein content between 10.7 and 17.2% across all years, resulting in a protein yield of 6.0–13.6 dt ha−1 in the analysis across trials that were common for both traits. Mixing pedigree and genomic relationship matrices for pedigree-genomic-based prediction (PG-BLUP) gave hardly any benefit over genomic-based selection, i.e., when all lines in the training and validation had genotypic data and as well as in [7], for any of the investigated traits without preexisting information of the selection candidates in the tested resampling scheme with 3-year training populations (Figure 1A and Figure 2A–F). Utilising data from preliminary yield trials for a pedigree-genomic-assisted prediction resulted, however, in a noticeable increase of up to 7.0–19.8% in prediction accuracy over pedigree-assisted () and 2.5–10.9% over genomic-assisted () prediction models, respectively, when conducting a grid-search for the optimal combination of and (Figure 2G–I). Altering and in of the PG-BLUP model in this scenario revealed on the other hand a negligible advantage over the baseline G-BLUP and P-BLUP models except for the protein content (Figure 2J–L).
The more cost-efficient single-step genomic prediction with a non-genotyped validation population (SSG-BLUP) showed an increase in predictive performance for grain yield and protein content when in [6] in comparison to the baseline P-BLUP model (Figure 3 central + right columns), but it resulted generally in lower prediction accuracies than the mentioned pedigree-genomic prediction (PG-BLUP) models. Blending of the pedigree and genomic relationship matrices by appeared not to be favourable in SSG-BLUP as higher prediction accuracies were achieved when and . Noticeable, a larger weight on the pedigree relationship matrix was beneficial for the protein yield (Figure 3 left column) both for the single-step-based and single-step-assisted predictions utilising preexisting information of lines contained in the validation population.
As the difference in prediction accuracy of the optimum and equal weighting of and was less than 2%, the factor combination and was used for pedigree-genomic predictions (PG-BLUP) in this scenario. A similar observation was made, at least for grain yield and the protein content, for the scaling parameters in the single-step genomic predictions (SSG-BLUP), which were thus set to , and . Enlarging the training population size by using an increasing number of years preceding a validation year from model training resulted in many cases in an increase of the prediction accuracy for the pedigree-genomic predictions (PG-BLUP) (Figure 4). Although there was a general trend of an increase in prediction accuracy with an increase of the training population size, employing the largest possible training population size did not always result in the highest prediction accuracy as, e.g., the prediction accuracy for protein yield was larger in 2016 with a training population size of 300 (3 years) than with 600 (6 years) lines (Figure 4A). Similar patterns were also found for the other tested models for predicting grain yield (Supplementary Figure S2), protein content (Supplementary Figure S3) and protein yield (Supplementary Figure S4).
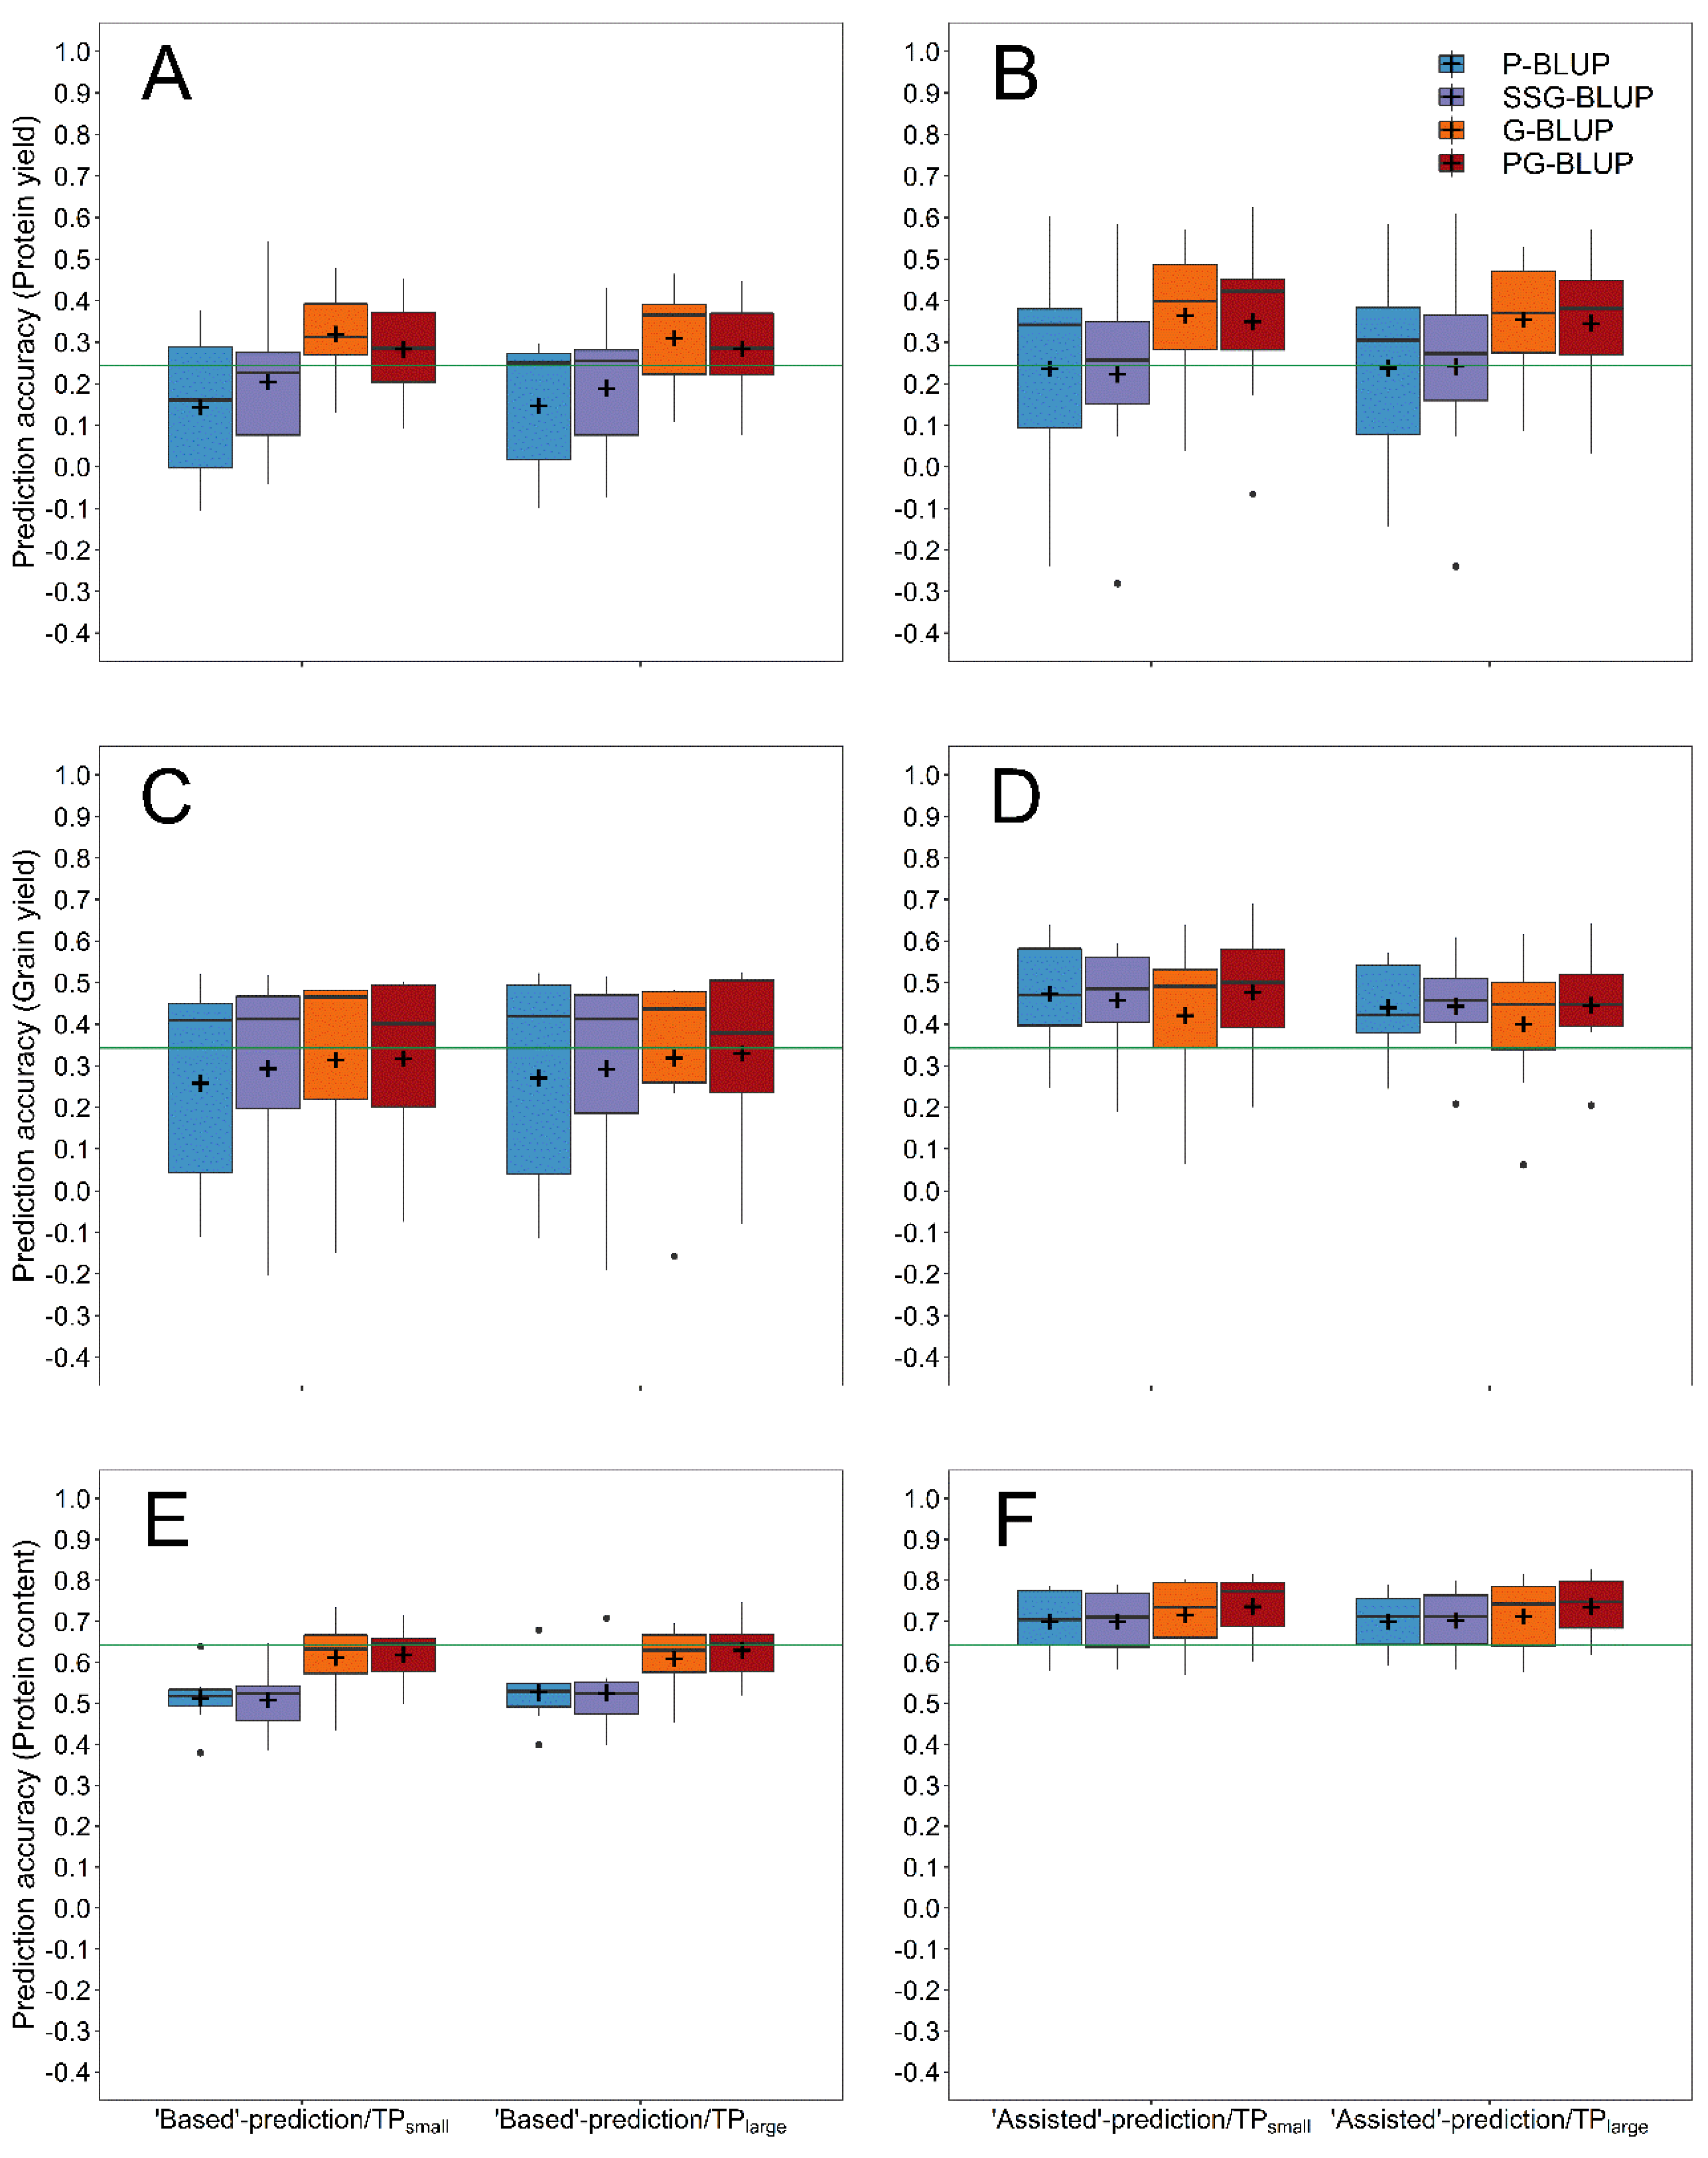
Using the same scaling parameters as described above, the models combining pedigree and genomic information were subsequently compared with the baseline G-BLUP and P-BLUP models in a forward prediction across multiple years with an accumulating training population of all lines tested in the years preceding the validation year (Figure 1B). Genomic-based prediction (G-BLUP) was on average superior to pedigree-based prediction (P-BLUP) for all investigated traits in this forward prediction (Figure 5), while using single-step-based prediction (SSG-BLUP) with a training population of genotyped advanced generation lines led to a notable increase of the prediction accuracy in comparison to the latter model except for the protein content.
Combining data from all previous multi-environment and preliminary yield trials for prediction model training was used to test the merit of vastly increasing the size of the training population for the mentioned models, especially for the more recent years (Figure 6). This augmentation of the training population did not lead to a clear advantage over prediction models that used only preexisting information from one preliminary yield trial for a particular set of selection candidates in combination with a training set comprised of lines tested in multi-environment trials (Figure 7), and the average difference between both methods ranged from r = −0.03 to r = 0.02.
Except for the protein yield, all tested pedigree and genomic models without preexisting information of the selection candidates performed on average worse in comparison to phenotypic selection based on observations from preliminary yield trials, which was, however, dependent on the specific year (Supplementary Figures S5 and S6). Notwithstanding, exploiting phenotypic data from preliminary yield trials for model training resulted in the majority of cases in more accurate predictions than possible by a selection based on phenotypic observations alone. Markedly, pedigree-assisted selection was in this scenario inferior to genomic-assisted selection for protein yield (Figure 5B), but performed similar for the protein content (Figure 5F), and even superior for grain yield (Figure 5D). Nevertheless, making additional use of molecular marker data for a pedigree-genomic-assisted selection (PG-BLUP) resulted in prediction accuracies that were 48.1%, 5.2%, and 0.7% higher in comparison to pedigree-assisted selection (P-BLUP) for each of the aforementioned traits, whereas a single-step-assisted selection (SSG-BLUP) performed worse than each of the mentioned methods.
Similar observations were made in the simulation study, where the prediction accuracy for differentiating lines within families could be increased by including phenotypic data from the validation population into the model (Table 2). Noticeably, within-family prediction was in this case also possible with pedigree relationships, resulting in the same accuracy as phenotypic within-family prediction. Pedigree-assisted prediction performed however still worse than genomic prediction, whereas this difference became smaller with an increase in heritability. Lastly, predicting across family averages was always very accurate and even close to one when utilising preexisting information of the selection candidates for model training.
4. Discussion
Blending vast pedigree records with DNA fingerprints by single-step prediction has been a major topic in animal breeding [20], and several studies in dairy cows, poultry and pigs showed a clear advantage of implementing this method into breeding programs [39]. The application of this approach to enlarge training populations has likewise revealed a slight advantage for predicting fingerprinted genotypes in plant breeding programs for which extensive pedigree records were available [15,40]. Some merit of using a single-step genomic prediction was found in this study when testing a breeding strategy in which only advanced generation lines tested in multi-environment trials are genotyped to improve the prediction of non-genotyped early generation lines tested in preliminary yield trials. The above-mentioned studies employed however fixed values for the scaling factors , , and , whereas a slight advantage was found by [41] when varying the mixing proportion of the pedigree and genomic relationship matrix by altering the ratio with the constraint and . The variation of the scaling factors showed on the other hand a marginal effect on accuracy of the tested single-step genomic prediction approach in the study at hand, making the basic weights of preferable, while setting arbitrary values of and can furthermore ensure that in the lower right quadrant of is invertible and aid in the convergence of the respective prediction models [39] albeit this was not an issue in the study at hand.
Notwithstanding, in case that the budget of a breeding program allows genotyping all early generation lines, the aim of blending relationship matrices in the here tested pedigree-genomic prediction can be seen in targeting genetic variation that could not be explained by markers resulting in a higher heritability in comparison to the G-BLUP model (Supplementary Table S3). Altering and in the multi-year forward prediction in the studied wheat breeding program resulted accordingly in an appreciable increase in prediction accuracy, which was in line with previous reports in small-grain cereals [42,43]. A similar goal was pursued by the authors of [14], who suggested to model two separate kernels for combining pedigree and genomic relationship information in prediction models. This approach gave also promising results for the mentioned prediction across years, with prediction accuracies similar to the presented pedigree-genomic selection models (data not shown). However, fulfilling both goals of targeting genetic variation not explained by marker data as well as enlarging training populations with non-genotyped lines is difficult to realise with such two-kernel models, making single-step prediction with a stronger blending of the genomic and pedigree relationship matrices putatively a more preferable approach. Notwithstanding, the quality of the phenotypic data is in such an approach decisive, which was indicated by a similar or even lower prediction accuracy in the forward prediction of the protein content, grain yield and protein yield when enlarging the training population by more than 2000 lines that were solely tested in unreplicated preliminary yield trials (Figure 5 and Figure 7).
Regarding the comparison of genomic models with genotyped selection candidates and predictions based on pedigree data alone, the latter showed clearly a worse average performance, especially when preexisting information of the selection candidates was not included into the training population. One reason is certainly given by the fact that pedigree-based prediction does not address the Mendelian sampling term, i.e., the variation within progeny families [44,45]. Given the absence of line per se performance, the within-family prediction accuracy is thus zero for pedigree-based selection. The within-family prediction accuracy is, however, also rather low for genomic-based prediction [46,47] in comparison to predictions across a diverse panel of lines and families [11,12] as seen in the simulation study. Including full-sibs and half-sibs as in the genomic-assisted and pedigree-genomic-assisted selection approaches can thus be regarded as one factor that resulted in an approximately twice as high within-family prediction accuracy in the simulation. This strategy showed moreover in most cases a clear benefit in comparison to the reliance on genomic-based, pedigree-genomic-based or phenotypic selection alone in the empirical study. Yet, exploiting this preexisting information of the selection candidates with the tested models did not take the genetic correlation between multi-environment and preliminary yield trials into account, while [9] suggested to regard, e.g., grain yield in multi-environment and preliminary yield trials as two different traits in a bivariate genomic prediction model. Testing the latter approach revealed a genomic correlation of , and between the multi-environment and preliminary yield trials for the protein content, grain yield and protein yield, respectively, but did not result in a higher prediction accuracy in comparison to the univariate models presented in this study (Supplementary Figure S7).
Notwithstanding, it should be mentioned that the pedigree-assisted models including phenotypic observations from preliminary yield trials performed sometimes similar or even superior to the corresponding genomic-assisted selection model. This observation was likewise made by the authors of [15,17] when predicting already tested lines across a multitude of international mega-environments, and might be attributed to the ability to differentiate between lines within families if preexisting information of the selection candidates is exploited for making predictions. Further possible influencing factors include the altering of performance rankings by inducing a shrinkage towards family means when modelling covariances between family members [48] as well as the previous mentioned drawing of performance information from half-sibs and full-sibs [49,50].
Therefore, unless traits for an indirect selection that explain a sufficient proportion of genetic variance of the target trait are available, prediction accuracies within families are zero or rather low [51], and predictions based on pedigree and/or genomic relationships differentiate for the larger part between averages of progeny populations. Although this might seem rather trivial at first glance, as such a differentiation is also feasible by the phenotypic mid-parent value [52], the latter is oftentimes less accurate than predictions containing relationship information [53]. Phenotypic mid-parents are moreover dependent on the magnitude of the parents´ reliability for the traits of interest and both parents have to be tested “in-house” by a breeding program, which is not always the case when germplasm is exchanged and crossed in the framework of the breeders´ exemption. Accurately differentiating between family averages by making use of pedigree and/or marker data can furthermore guide a breeder´s decisions, e.g., in how many genotypes should be advanced to the next generation from each family or even if breeding efforts for some of the conducted crosses should be discontinued, as the population mean is a decisive part in the selection among crosses by criteria such as “usefulness” [52,53].
5. Conclusions
Given the availability of deep pedigree records, pedigree prediction can perform similar to genomic prediction if preexisting information of the selection candidates is available, while blending both information sources can increase the prediction accuracy and thus the selection gain substantially, especially for low heritable traits. Nevertheless, the largest advantage of predictions using genomic data can generally be seen for breeding scenarios and traits were such preexisting information is not systemically available or difficult and costly to obtain.
Supplementary Materials
The following are available online at https://www.mdpi.com/2073-4395/10/10/1591/s1, Figure S1: Principal component analysis of the 4032 recombinant inbred and double haploid breeding lines involved in the study. The lines are coloured according to their membership to the breeding cycles 2010 to 2019 that were designated to the first year of multi-environment testing of a particular cohort; Figure S2: Prediction accuracy for protein yield using pedigree-based (A), single-step-based (B), genomic-based (C), and pedigree-genomic-based; Figure S3: Prediction accuracy for grain yield using pedigree-based (A), single-step-based (B), genomic-based (C), and pedigree-genomic-based (D) forward predictions (blue coloured) as well as pedigree-assisted (E), single-step-assisted (F), genomic-assisted (G), and pedigree-genomic-assisted (H) forward predictions (red coloured) with the latter exploiting pre-existing information from preliminary yield trials. The training population for each prediction model was built by randomly sampling 100 lines from one to nine years preceding the respective validation year. (D) forward predictions (blue coloured) as well as pedigree-assisted (E), single-step-assisted (F), genomic-assisted (G), and pedigree-genomic-assisted (H) forward predictions (red coloured) with the latter exploiting pre-existing information from preliminary yield trials. The training population for each prediction model was built by randomly sampling 100 lines from one to nine years preceding the respective validation year; Figure S4: Prediction accuracy for the protein content using pedigree-based (A), single-step-based (B), genomic-based (C), and pedigree-genomic-based (D) forward predictions (blue coloured) as well as pedigree-assisted (E), single-step-assisted (F), genomic-assisted (G), and pedigree-genomic-assisted (H) forward predictions (red coloured) with the exploiting pre-existing information from preliminary yield trials. The training population for each prediction model was built by randomly sampling 100 lines from one to nine years preceding the respective validation year; Figure S5: Prediction accuracy for protein yield (A–D), grain yield (E–H), and protein content (I–L) using pedigree-based (P-BLUP), single-step-based (SSG-BLUP), genomic-based (G-BLUP), and pedigree-genomic-based (PG-BLUP) forward predictions as well as pedigree-assisted, single-step-assisted, genomic-assisted, and pedigree-genomic-assisted forward predictions exploiting pre-existing information of the validation population from preliminary yield trials. The displayed results were obtained with an accumulating training population of lines tested in multi-environment trials coming from all years preceding the validation years 2013-2019, while only the preliminary yield trial preceding the validation year was used when fitting the prediction models. The average performance of each model (coloured horizontal lines) is compared with the predictive performance of phenotypic selection based on preliminary yield trials (green horizontal dashed line); Figure S6: Prediction accuracy for protein yield (A–D), grain yield (E–H), and protein content (I–L) using pedigree-based (P-BLUP), single-step-based (SSG-BLUP), genomic-based (G-BLUP), and pedigree-genomic-based (PG-BLUP) forward predictions as well as pedigree-assisted, single-step-assisted, genomic-assisted, and pedigree-genomic-assisted forward predictions exploiting pre-existing information of the validation population from preliminary yield trials. The displayed results were obtained with an accumulating training population of lines tested in multi-environment trials coming from all years preceding the validation years 2013-2019, while all preliminary yield trials preceding the validation year were used when fitting the prediction models. The average performance of each model (coloured horizontal lines) is compared with the predictive performance of phenotypic selection based on preliminary yield trials (green horizontal dashed line); Figure S7: Prediction accuracy for protein yield (A), grain yield (B), and protein content (C) using pedigree (P-BLUP), single-step (SSG-BLUP), genomic (G-BLUP), and pedigree-genomic (PG-BLUP) prediction. A random sample of 50 lines tested in multi-environment trials in 2015-2019 constituted one validation population for each of these years, while 100 lines tested in multi-environment trials from each of the three years preceding a respective validation year were sampled into a training population, Table S1: Frequency of the models used for spatial correction as in [1] with random row and/or column effects with/without modelling autoregressive variance–covariance structures (AR1) between the plots either in row, in column or in both directions; Table S2: Mean, range, and heritability (H²) for protein yield, grain yield, and protein yield across the multi-environment trials conducted between 2010 and 2019; Table S3: Estimated heritability for the pedigree (P-BLUP), genomic (G-BLUP), and pedigree-genomic (PG-BLUP) prediction models with a training population of 1464 lines tested in multi-environment trials between 2010 and 2019.
Author Contributions
Conceptualisation, S.M.; methodology, S.M. and C.A.; software, S.M. and C.A.; validation, S.M. and C.A.; formal analysis, S.M.; investigation, S.M.; data curation, F.L. and E.S.; writing—original draft preparation, S.M.; writing—review and editing, S.M., F.L., E.S., C.A. and H.B.; visualisation, S.M.; supervision, H.B.; project administration, H.B. and F.L.; funding acquisition, H.B. and F.L. All authors have read and agreed to the published version of the manuscript.
Funding
This research was funded by the “Beyond Europe” FFG project Canadian Hard Red Winter Wheat breeding by genomic tools, lab and field experiments.
Acknowledgments
We like to thank Maria Bürstmayr and her team for the tremendous work when extracting the DNA of several hundred wheat lines each year. We also like to thank Christian Wagner and Barbara Steiner for many fruitful discussions when conducting this study. We finally like to thank the anonymous reviewers for their valuable comments and suggestions for improving the manuscript.
Conflicts of Interest
The authors declare no conflict of interest.
References
- Jarquin, D.; Lemes da Silva, C.; Gaynor, R.C.; Poland, J.; Fritz, A.; Howard, R.; Battenfield, S.; Crossa, J. Increasing Genomic-Enabled Prediction Accuracy by Modeling Genotype x Environment Interactions in Kansas Wheat. Plant Genome 2017, 10. [Google Scholar] [CrossRef] [PubMed] [Green Version]
- Schulz-Streeck, T.; Ogutu, J.O.; Gordillo, A.; Karaman, Z.; Knaak, C.; Piepho, H.P. Genomic selection allowing for marker-by-environment interaction. Plant Breed. 2013, 132, 532–538. [Google Scholar] [CrossRef]
- Schrag, T.A.; Schipprack, W.; Melchinger, A.E. Across-years prediction of hybrid performance in maize using genomics. Theor. Appl. Genet. 2019, 132, 933–946. [Google Scholar] [CrossRef] [PubMed]
- Bernal-Vasquez, A.-M.; Gordillo, A.; Schmidt, M.; Piepho, H.-P. Genomic prediction in early selection stages using multi-year data in a hybrid rye breeding program. BMC Genet. 2017, 18, 51. [Google Scholar] [CrossRef] [PubMed] [Green Version]
- Dias, K.O.G.; Piepho, H.P.; Guimarães, L.J.M.; Guimarães, P.E.O.; Parentoni, S.N.; Pinto, M.O.; Noda, R.W.; Guimarães, C.T.; Garcia, A.A.F.; Pastina, M.M. Novel strategies for genomic prediction of untested single-cross maize hybrids using unbalanced historical data. Theor. Appl. Genet. 2019, 133, 443–455. [Google Scholar] [CrossRef] [PubMed]
- Haikka, H.; Knürr, T.; Manninen, O.; Pietilä, L.; Isolahti, M.; Teperi, E.; Mäntysaari, E.A.; Strandén, I. Genomic prediction of grain yield in commercial Finnish oat (Avena sativa) and barley (Hordeum vulgare) breeding programmes. Plant Breed. 2020, 139, 550–561. [Google Scholar] [CrossRef]
- Ben-Sadoun, S.; Auzanneau, R.R.J.; Rolland, F.X.O.B.; Ravel, E.H.C. Economical optimization of a breeding scheme by selective phenotyping of the calibration set in a multi-trait context: Application to bread making quality. Theor. Appl. Genet. 2020, 133, 2197–2212. [Google Scholar] [CrossRef] [PubMed]
- Bhatta, M.; Gutierrez, L.; Cammarota, L.; Cardozo, F.; Germán, S.; Gómez-Guerrero, B.; Pardo, M.F.; Lanaro, V.; Sayas, M.; Castro, A.J. Multi-trait Genomic Prediction Model Increased the Predictive Ability for Agronomic and Malting Quality Traits in Barley (Hordeum vulgare L.). G3 Genes Genomes Genet. 2020, 10, g3.400968.2019. [Google Scholar] [CrossRef] [Green Version]
- Tsai, H.; Cericola, F.; Edriss, V.; Andersen, J.R.; Id, J.O.; Jensen, J.D.; Jahoor, A.; Janss, L.; Jensen, J. Use of multiple traits genomic prediction, genotype by environment interactions and spatial effect to improve prediction accuracy in yield data. PLoS ONE 2020, 15. [Google Scholar] [CrossRef]
- Robertsen, C.; Hjortshøj, R.; Janss, L. Genomic Selection in Cereal Breeding. Agronomy 2019, 9, 95. [Google Scholar] [CrossRef] [Green Version]
- Sweeney, D.W.; Rutkoski, J.; Bergstrom, G.C.; Sorrells, M.E. A connected half-sib family training population for genomic prediction in barley. Crop Sci. 2020, 60, 262–281. [Google Scholar] [CrossRef] [Green Version]
- Edwards, S.M.; Buntjer, J.B.; Jackson, R.; Bentley, A.R.; Lage, J.; Byrne, E.; Burt, C.; Jack, P.; Berry, S.; Flatman, E.; et al. The effects of training population design on genomic prediction accuracy in wheat. Theor. Appl. Genet. 2019, 132, 1943–1952. [Google Scholar] [CrossRef] [Green Version]
- Auinger, H.-J.; Schönleben, M.; Lehermeier, C.; Schmidt, M.; Korzun, V.; Geiger, H.H.; Piepho, H.-P.; Gordillo, A.; Wilde, P.; Bauer, E.; et al. Model training across multiple breeding cycles significantly improves genomic prediction accuracy in rye (Secale cereale L.). Theor. Appl. Genet. 2016, 129, 2043–2053. [Google Scholar] [CrossRef] [Green Version]
- Cericola, F.; Jahoor, A.; Orabi, J.; Andersen, J.; Janss, L. Optimizing Training Population Size and Genotyping Strategy for Genomic Prediction Using Association Study Results and Pedigree Information. A Case of Study in Advanced Wheat Breeding Lines. PLoS ONE 2017, 12. [Google Scholar] [CrossRef] [PubMed]
- Pérez-Rodríguez, P.; Crossa, J.; Rutkoski, J.; Poland, J.; Singh, R.; Legarra, A.; Autrique, E.; de los Campos, G.; Burgueño, J.; Dreisigacker, S. Single-Step Genomic and Pedigree Genotype × Environment Interaction Models for Predicting Wheat Lines in International Environments. Plant Genome 2017, 10. [Google Scholar] [CrossRef] [Green Version]
- Burgueño, J.; de los Campos, G.; Weigel, K.; Crossa, J. Genomic prediction of breeding values when modeling genotype × environment interaction using pedigree and dense molecular markers. Crop Sci. 2012, 52, 707–719. [Google Scholar] [CrossRef] [Green Version]
- Ankamah-Yeboah, T.; Janss, L.L.; Jensen, J.D.; Hjortshøj, R.; Rasmussen, S.K. Genomic Selection Using Pedigree and Marker-by-Environment Interaction for Barley Seed Quality Traits from Two Commercial Breeding Programs. Front. Plant Sci. 2020. [Google Scholar] [CrossRef] [PubMed]
- Legarra, A.; Aguilar, I.; Misztal, I. A relationship matrix including full pedigree and genomic information. J. Dairy Sci. 2009, 92, 4656–4663. [Google Scholar] [CrossRef] [Green Version]
- Christensen, O.; Lund, M.S. Genomic relationship matrix when some animals are not genotyped. Genet. Sel. Evol. 2010, 42, 1–8. [Google Scholar] [CrossRef] [Green Version]
- Misztal, I.; Aggrey, S.E.; Muir, W.M. Experiences with a single-step genome evaluation. Poult. Sci. 2013, 92, 2530–2534. [Google Scholar] [CrossRef]
- Burgueño, J.; Cadena, A.; Crossa, J. User’s Guide for Spatial Analysis of Field Variety Trials Using ASREML; CIMMYT: Mexico, Mexico, 2000; ISBN 9706480609. [Google Scholar]
- Schmidt, P.; Hartung, J.; Rath, J.; Piepho, H.P. Estimating broad-sense heritability with unbalanced data from agricultural cultivar trials. Crop Sci. 2019, 59, 525–536. [Google Scholar] [CrossRef]
- R Core Team. R: A Language and Environment for Statistical Computing; R Core Team R: A language and environment for statistical computing; R Foundation for Statistical Computing: Vienna, Austria, 2020. [Google Scholar]
- Saghai-Maroof, M.A.; Soliman, K.M.; Jorgensen, R.A.; Allard, R.W. Ribosomal DNA spacer-length polymorphisms in barley: Mendelian inheritance, chromosomal location, and population dynamics. Proc. Natl. Acad. Sci. USA 1984, 81, 8014–8018. [Google Scholar] [CrossRef] [PubMed] [Green Version]
- Diversity Arrays Technology; DArT P/L Pty Ltd.: Canberra, Australia, 2020.
- Stekhoven, D.J.; Bühlmann, P. Missforest-Non-parametric missing value imputation for mixed-type data. Bioinformatics 2012, 28, 112–118. [Google Scholar] [CrossRef] [Green Version]
- He, S.; Zhao, Y.; Mette, M.F.; Bothe, R.; Ebmeyer, E.; Sharbel, T.F.; Reif, J.C.; Jiang, Y. Prospects and limits of marker imputation in quantitative genetic studies in European elite wheat (Triticum aestivum L.). BMC Genom. 2015, 16, 168. [Google Scholar] [CrossRef] [Green Version]
- Henderson, C. A Simple Method for Computing the Inverse of a Numerator Relationship Matrix Used in Prediction of Breeding Values. Biometrics 1976, 32, 69–83. [Google Scholar] [CrossRef]
- VanRaden, P.M. Efficient methods to compute genomic predictions. J. Dairy Sci. 2008, 91, 4414–4423. [Google Scholar] [CrossRef] [Green Version]
- Christensen, O.; Madsen, P.; Nielsen, B.; Ostersen, T.; Su, G. Single-step methods for genomic evaluation in pigs. Animal 2012, 6, 1565–1571. [Google Scholar] [CrossRef] [Green Version]
- Dekkers, J.C.M. Prediction of response to marker assited and genomic selection using selection index theory. J. Anim. Breed. Genet. 2007, 124, 331–341. [Google Scholar] [CrossRef]
- Amadeu, R.R.; Cellon, C.; Olmstead, J.W.; Garcia, A.A.F.; Resende, M.F.R.; Muñoz, P.R. AGHmatrix: R Package to Construct Relationship Matrices for Autotetraploid and Diploid Species: A Blueberry Example. Plant Genome 2016, 9, 1–10. [Google Scholar] [CrossRef]
- Covarrubias-Pazaran, G. Genome-Assisted prediction of quantitative traits using the r package sommer. PLoS ONE 2016, 11, 1–15. [Google Scholar] [CrossRef] [Green Version]
- Broman, K.W.; Wu, H.; Sen, Ś.; Churchill, G.A. R/qtl: QTL mapping in experimental crosses. Bioinformatics 2003, 19, 889–890. [Google Scholar] [CrossRef] [Green Version]
- Stahl, F.W. Special Sites in Generalized Recombination. Annu. Rev. Genet. 1979, 13, 7–24. [Google Scholar] [CrossRef]
- Piepho, H.P.; Laidig, F.; Drobek, T.; Meyer, U. Dissecting genetic and non-genetic sources of long-term yield trend in German official variety trials. Theor. Appl. Genet. 2014, 127, 1009–1018. [Google Scholar] [CrossRef] [PubMed]
- Laidig, F.; Piepho, H.-P.; Rentel, D.; Drobek, T.; Meyer, U.; Huesken, A. Breeding progress, environmental variation and correlation of winter wheat yield and quality traits in German official variety trials and on-farm during 1983–2014. Theor. Appl. Genet. 2017, 130, 223–245. [Google Scholar] [CrossRef] [PubMed] [Green Version]
- Muellner, A.E.; Mascher, F.; Schneider, D.; Ittu, G.; Toncea, I.; Rolland, B.; Löschenberger, F. Refining breeding methods for organic and low-input agriculture: Analysis of an international winter wheat ring test. Euphytica 2014, 199, 81–95. [Google Scholar] [CrossRef]
- Legarra, A.; Christensen, O.; Aguilar, I.; Misztal, I. Single Step, a general approach for genomic selection. Livest. Sci. 2014, 166, 54–65. [Google Scholar] [CrossRef]
- Cappa, E.P.; de Lima, B.M.; da Silva-Junior, O.B.; Garcia, C.C.; Mansfield, S.D.; Grattapaglia, D. Improving genomic prediction of growth and wood traits in Eucalyptus using phenotypes from non-genotyped trees by single-step GBLUP. Plant Sci. 2019, 284, 9–15. [Google Scholar] [CrossRef]
- Imai, A.; Kuniga, T.; Yoshioka, T.; Nonaka, K.; Mitani, N.; Fukamachi, H.; Hiehata, N.; Yamamoto, M.; Hayashi, T. Single-step genomic prediction of fruit-quality traits using phenotypic records of non-genotyped relatives in citrus. PLoS ONE 2019, 14, 1–14. [Google Scholar] [CrossRef]
- Ashraf, B.; Edriss, V.; Akdemir, D.; Autrique, E.; Bonnett, D.; Crossa, J.; Janss, L.; Singh, R.; Jannink, J.L. Genomic prediction using phenotypes from pedigreed lines with no marker data. Crop Sci. 2016, 56, 957–964. [Google Scholar] [CrossRef] [Green Version]
- Velazco, J.G.; Malosetti, M.; Hunt, C.H.; Mace, E.S.; Jordan, D.R.; van Eeuwijk, F.A. Combining pedigree and genomic information to improve prediction quality: An example in sorghum. Theor. Appl. Genet. 2019, 132, 2055–2067. [Google Scholar] [CrossRef] [Green Version]
- Zapata-Valenzuela, J.; Whetten, R.W.; Neale, D.; McKeand, S.; Isik, F. Genomic estimated breeding values using genomic relationship matrices in a cloned population of loblolly pine. G3 Genes Genomes Genet. 2013, 3, 909–916. [Google Scholar] [CrossRef] [PubMed] [Green Version]
- Albrecht, T.; Wimmer, V.; Auinger, H.J.; Erbe, M.; Knaak, C.; Ouzunova, M.; Simianer, H.; Sch??n, C.C. Genome-based prediction of testcross values in maize. Theor. Appl. Genet. 2011, 123, 339–350. [Google Scholar] [CrossRef] [PubMed]
- Brauner, P.C.; Müller, D.; Molenaar, W.S.; Melchinger, A.E. Genomic prediction with multiple biparental families. Theor. Appl. Genet. 2020, 133, 133–147. [Google Scholar] [CrossRef]
- Schopp, P.; Müller, D.; Wientjes, Y.C.J.; Melchinger, A.E. Genomic Prediction Within and Across Biparental Families: Means and Variances of Prediction Accuracy and Usefulness of Deterministic Equations. G3 Genes Genomes Genet. 2017, 7, 3571–3586. [Google Scholar] [CrossRef] [Green Version]
- Molenaar, H.; Boehm, R.; Piepho, H.-P. Phenotypic Selection in Ornamental Breeding: It’s Better to Have the BLUPs Than to Have the BLUEs. Front. Plant Sci. 2018, 9, 1–14. [Google Scholar] [CrossRef] [PubMed]
- Cellon, C.; Amadeu, R.R.; Olmstead, J.W.; Mattia, M.R.; Ferrao, L.F.V.; Munoz, P.R. Estimation of genetic parameters and prediction of breeding values in an autotetraploid blueberry breeding population with extensive pedigree data. Euphytica 2018, 214, 1–13. [Google Scholar] [CrossRef]
- Slater, A.T.; Wilson, G.M.; Cogan, N.O.I.; Forster, J.W.; Hayes, B.J. Improving the analysis of low heritability complex traits for enhanced genetic gain in potato. Theor. Appl. Genet. 2014, 127, 809–820. [Google Scholar] [CrossRef]
- Watson, A.; Hickey, L.T.; Christopher, J.; Rutkoski, J.; Poland, J.; Hayes, B.J. Multivariate genomic selection and the potential of rapid indirect phenotypic selection with speed breeding to increase genetic gain in spring bread wheat. Crop Sci. 2019, 59, 1945–1959. [Google Scholar] [CrossRef] [Green Version]
- Utz, H.F.; Bohn, M.; Melchinger, A.E. Predicting progeny means and variances of winter wheat crosses from phenotypic values of their parents. Crop Sci. 2001, 41, 1470–1478. [Google Scholar] [CrossRef]
- Zhong, S.; Jannink, J.L. Using quantitative trait loci results to discriminate among crosses on the basis of their progeny mean and variance. Genetics 2007, 177, 567–576. [Google Scholar] [CrossRef] [Green Version]
Figure 1.
Schematic representation of the tested prediction scenarios with 3-year training population of lines tested in multi-environment trials (A) as well as cumulative training population coming from all years preceding a validation year (B). A total of 100 lines from each year were randomly sampled in a training population and 50 lines in a validation population in the first scenario, while in the second scenario all available lines were sampled in the training population and the prediction models were validation with the entire set of lines that was in common between the respective preliminary yield trials and subsequent year of multi-environment trials. Prediction models were either fitted without pre-existing information of the selection candidates in the validation population (blue arrows) or exploiting such information in common models (purple arrows) and compared with phenotypic selection based on observations from preliminary yield trials (red arrows).
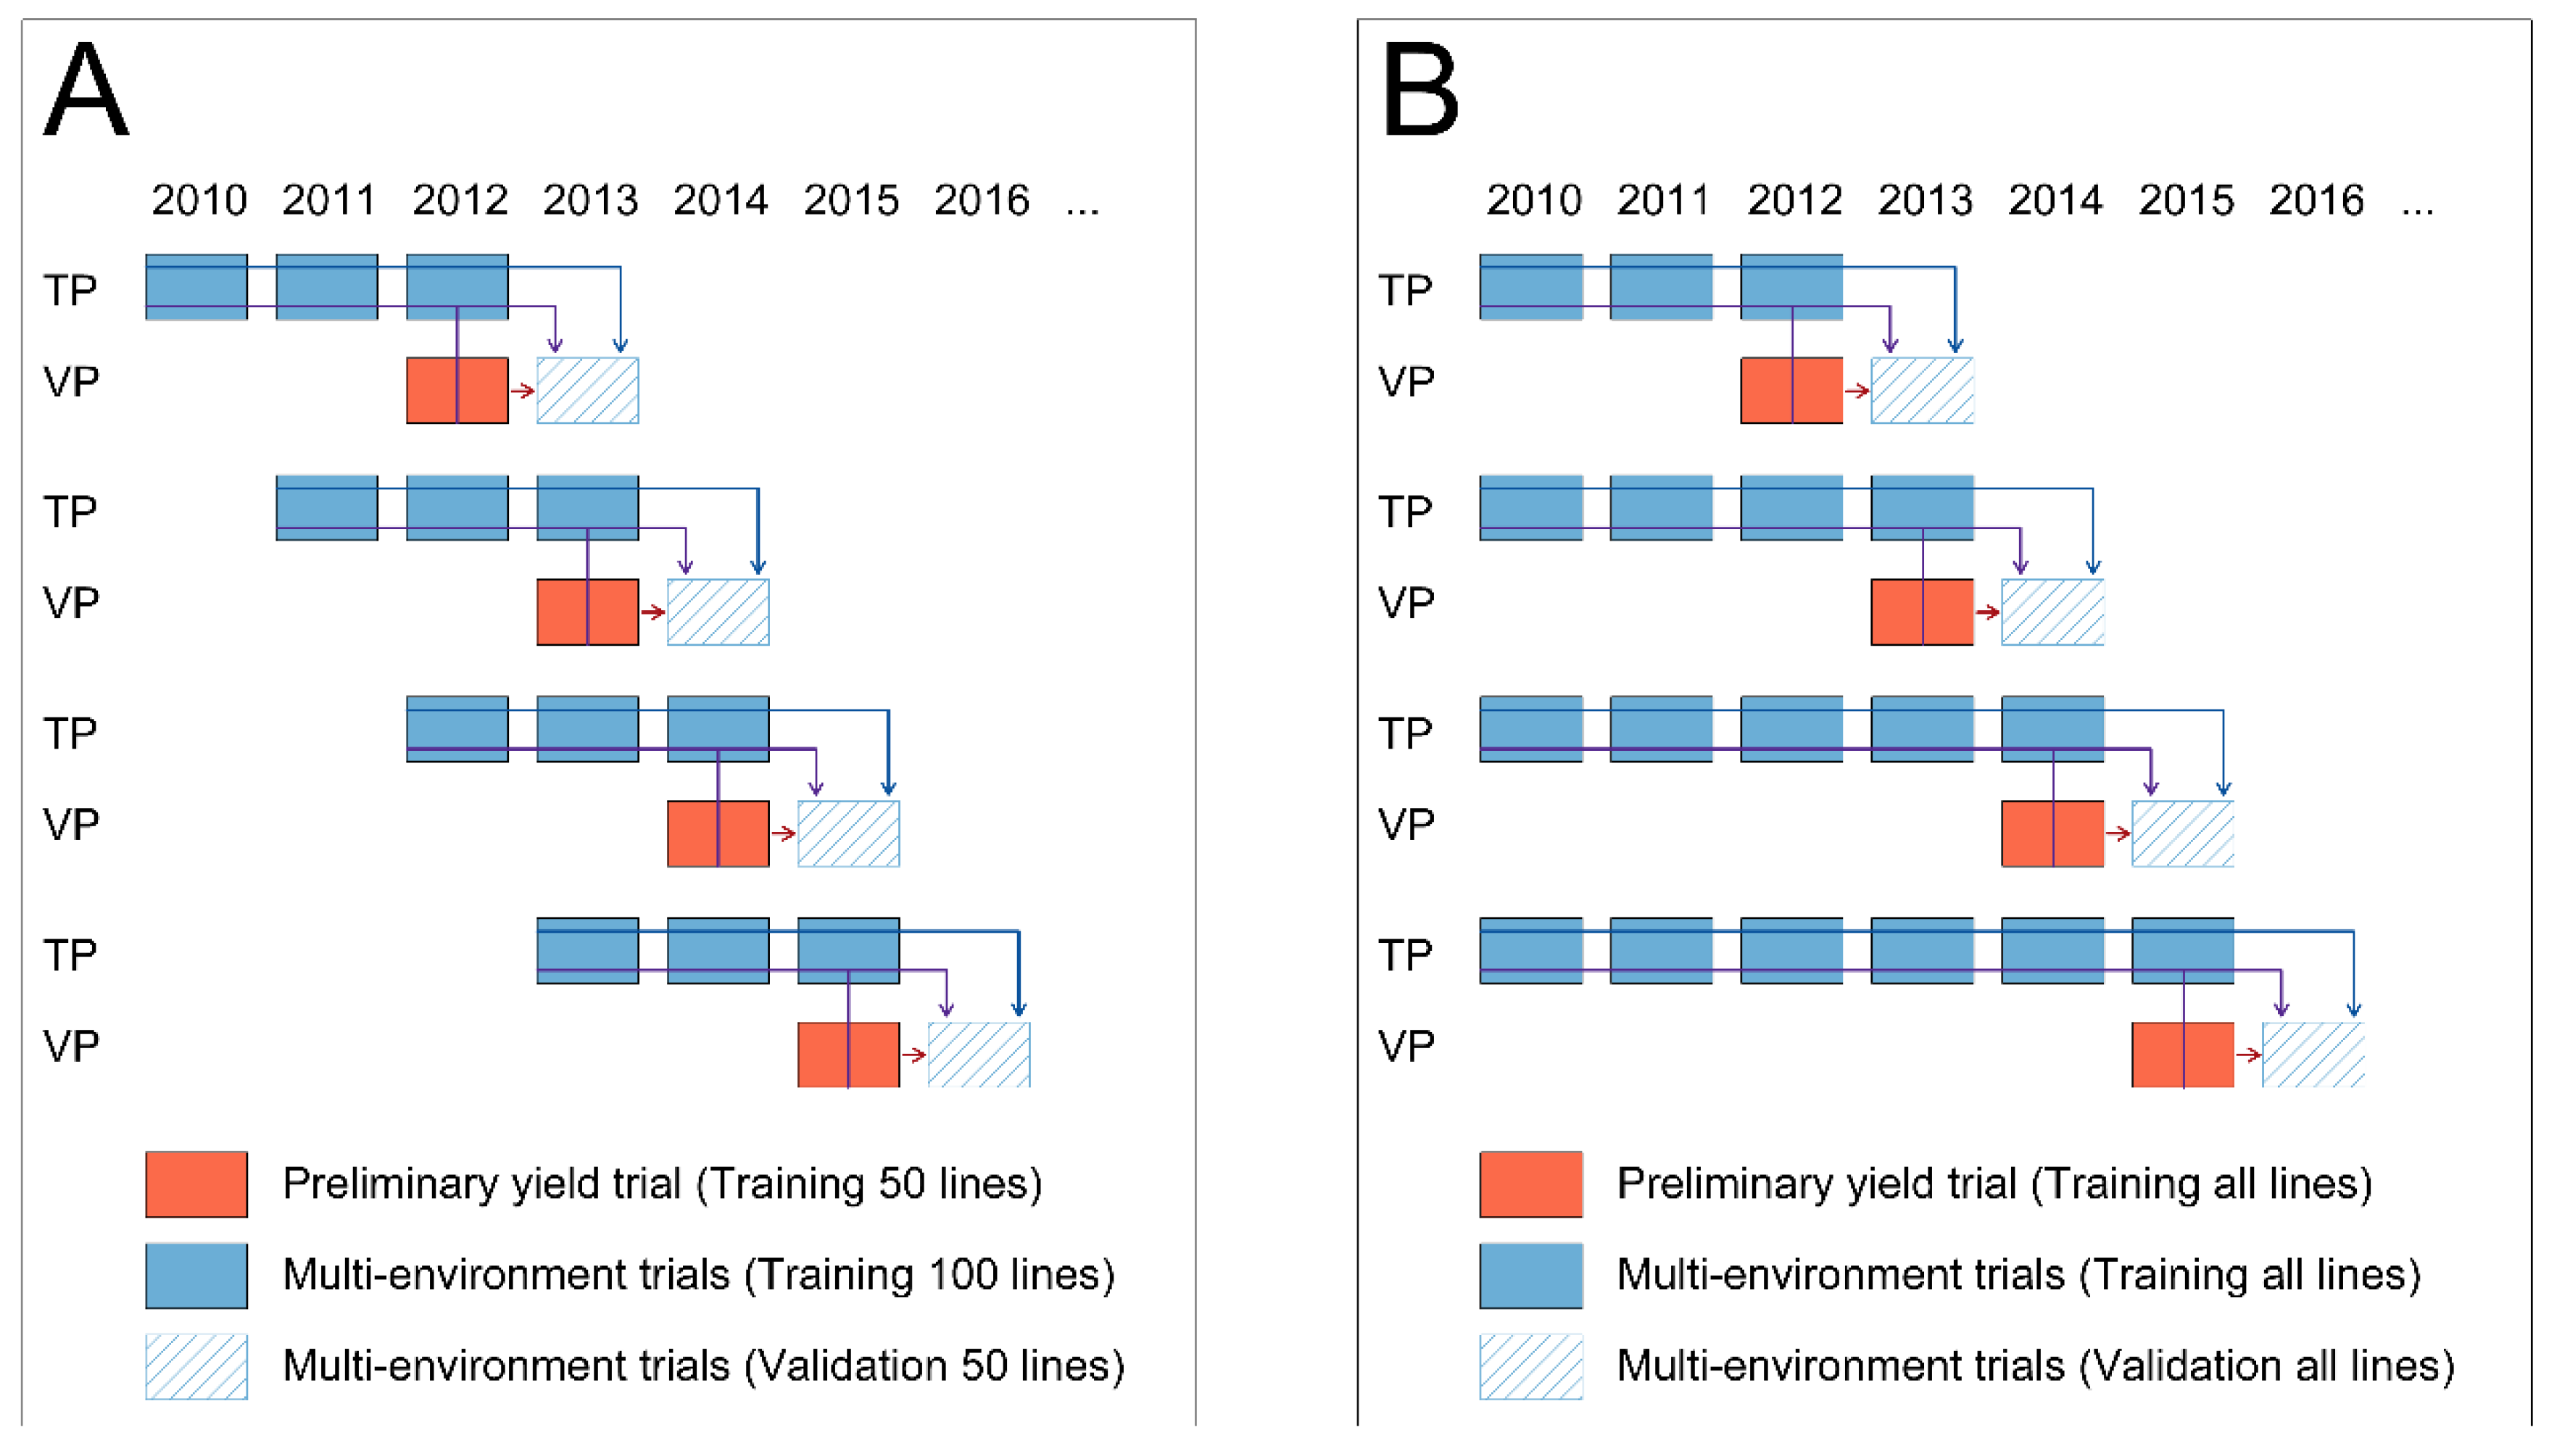
Figure 2.
Average prediction accuracy for protein yield (first columns), grain yield (central column), and protein content (right column) obtained from the 50 times repeated resampling scheme with a 3-year training population and a scenario where all lines in the training and validation population are genotyped to derive pedigree-genomic-based (A–F; blue coloured) and pedigree-genomic-assisted predictions (G–L; red coloured) with the latter exploiting pre-existing information of the validation population from preliminary yield trials. The weight of the scaling factors , , , and to create the relationship matrix (Equation (6)) were altered in a grid search, where the factors and were kept constant at and when varying and , whereas and were kept constant at and when modifying and . Isolines of same prediction accuracy for different combinations of the scaling factors are highlighted in black colour, while a darker colouring within the respective subplots A–L indicates a higher prediction accuracy for the particular model and scaling factor combination.
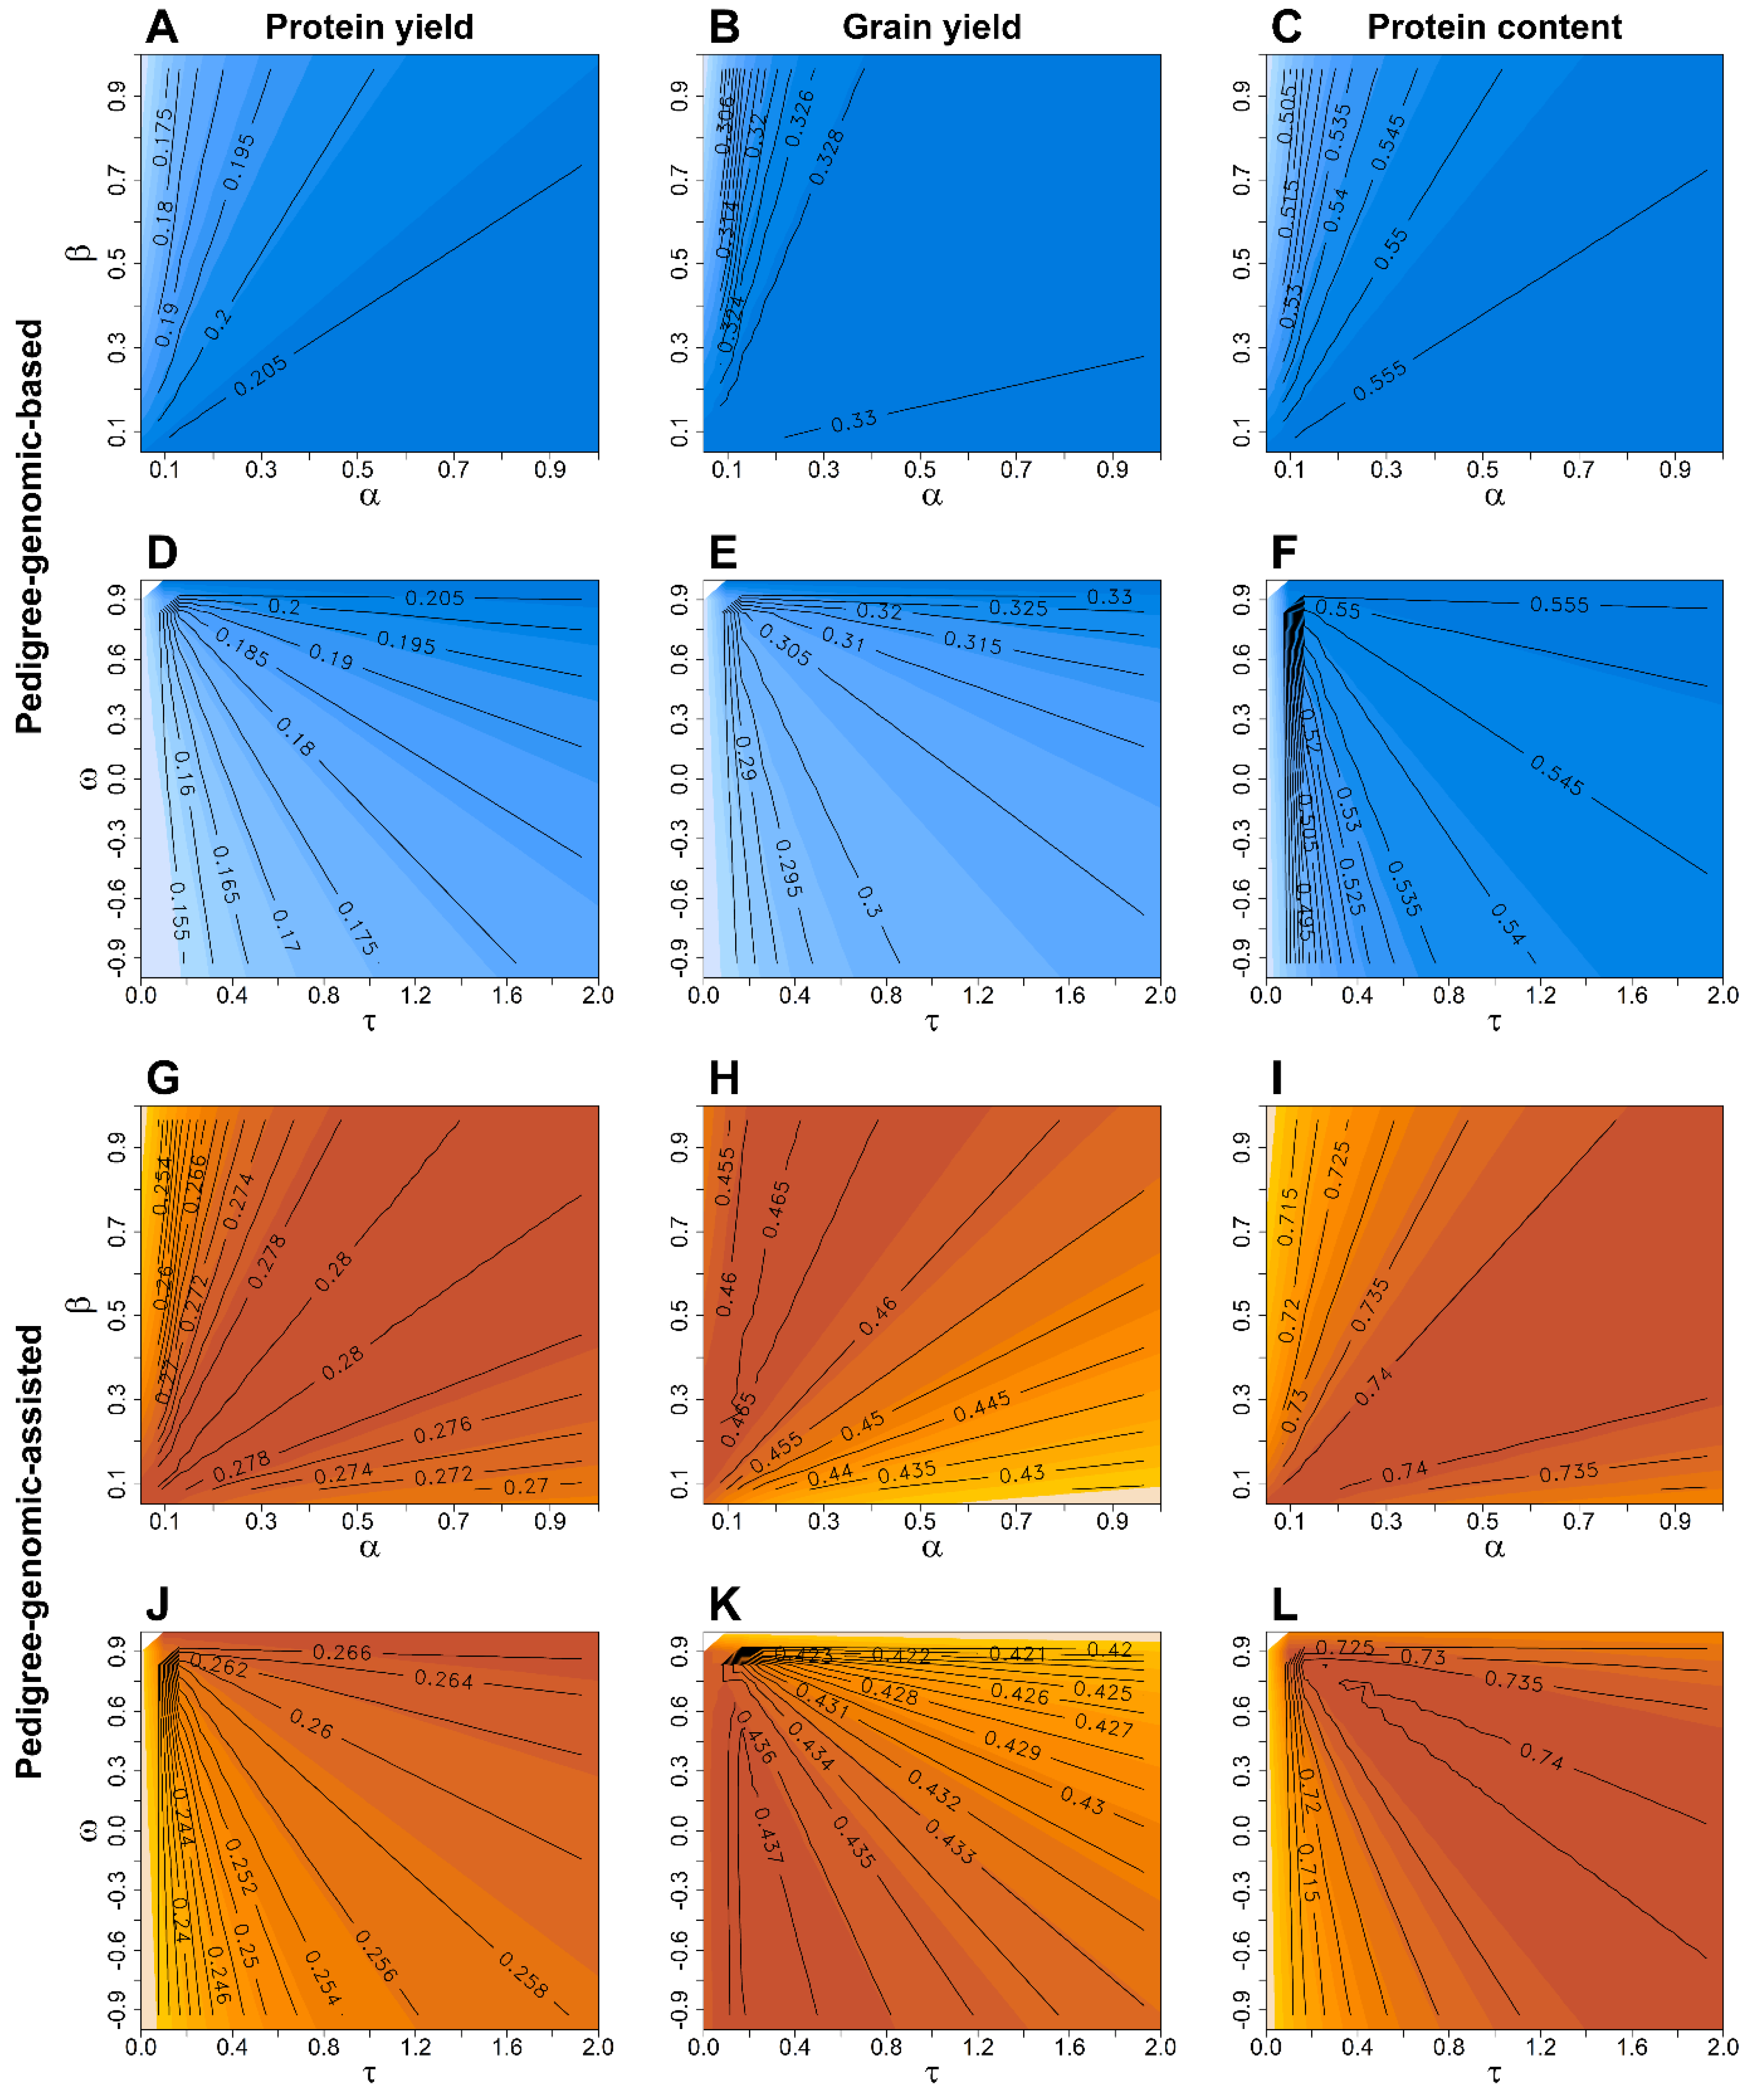
Figure 3.
Average prediction accuracy for protein yield (first columns), grain yield (central column) and protein content (right column) obtained from the 50 times repeated resampling scheme with a 3-year training population in a single-step genomic prediction scenario where only lines in the training population are genotypes to derive single-step-based (A–F; blue coloured) and single-step-assisted predictions (G–L; red coloured) for the non-genotyped lines in the validation population with the latter exploiting preexisting information of the validation population from preliminary yield trials. The weights on the scaling factors , , and to create the relationship matrix (Equation (7)) that blended pedigree and genomic relationship information were varied in a grid search, while the factors and were kept constant at and when varying and , whereas and were kept constant at and when modifying and . Isolines of same prediction accuracy for different combinations of the scaling factors are highlighted in black colour, while a darker colouring within the respective subplots A–L indicates a higher prediction accuracy for the particular model and scaling factor combination.

Figure 4.
Prediction accuracy for protein yield using pedigree-genomic-based (A–C; blue coloured) as well as pedigree-genomic-assisted (D–F; red coloured) forward predictions with the latter exploiting pre-existing information from preliminary yield trials. The training population for each prediction model was built by randomly sampling 100 lines from one to nine years preceding the respective validation year. A darker colouring generally indicates a higher prediction accuracy.
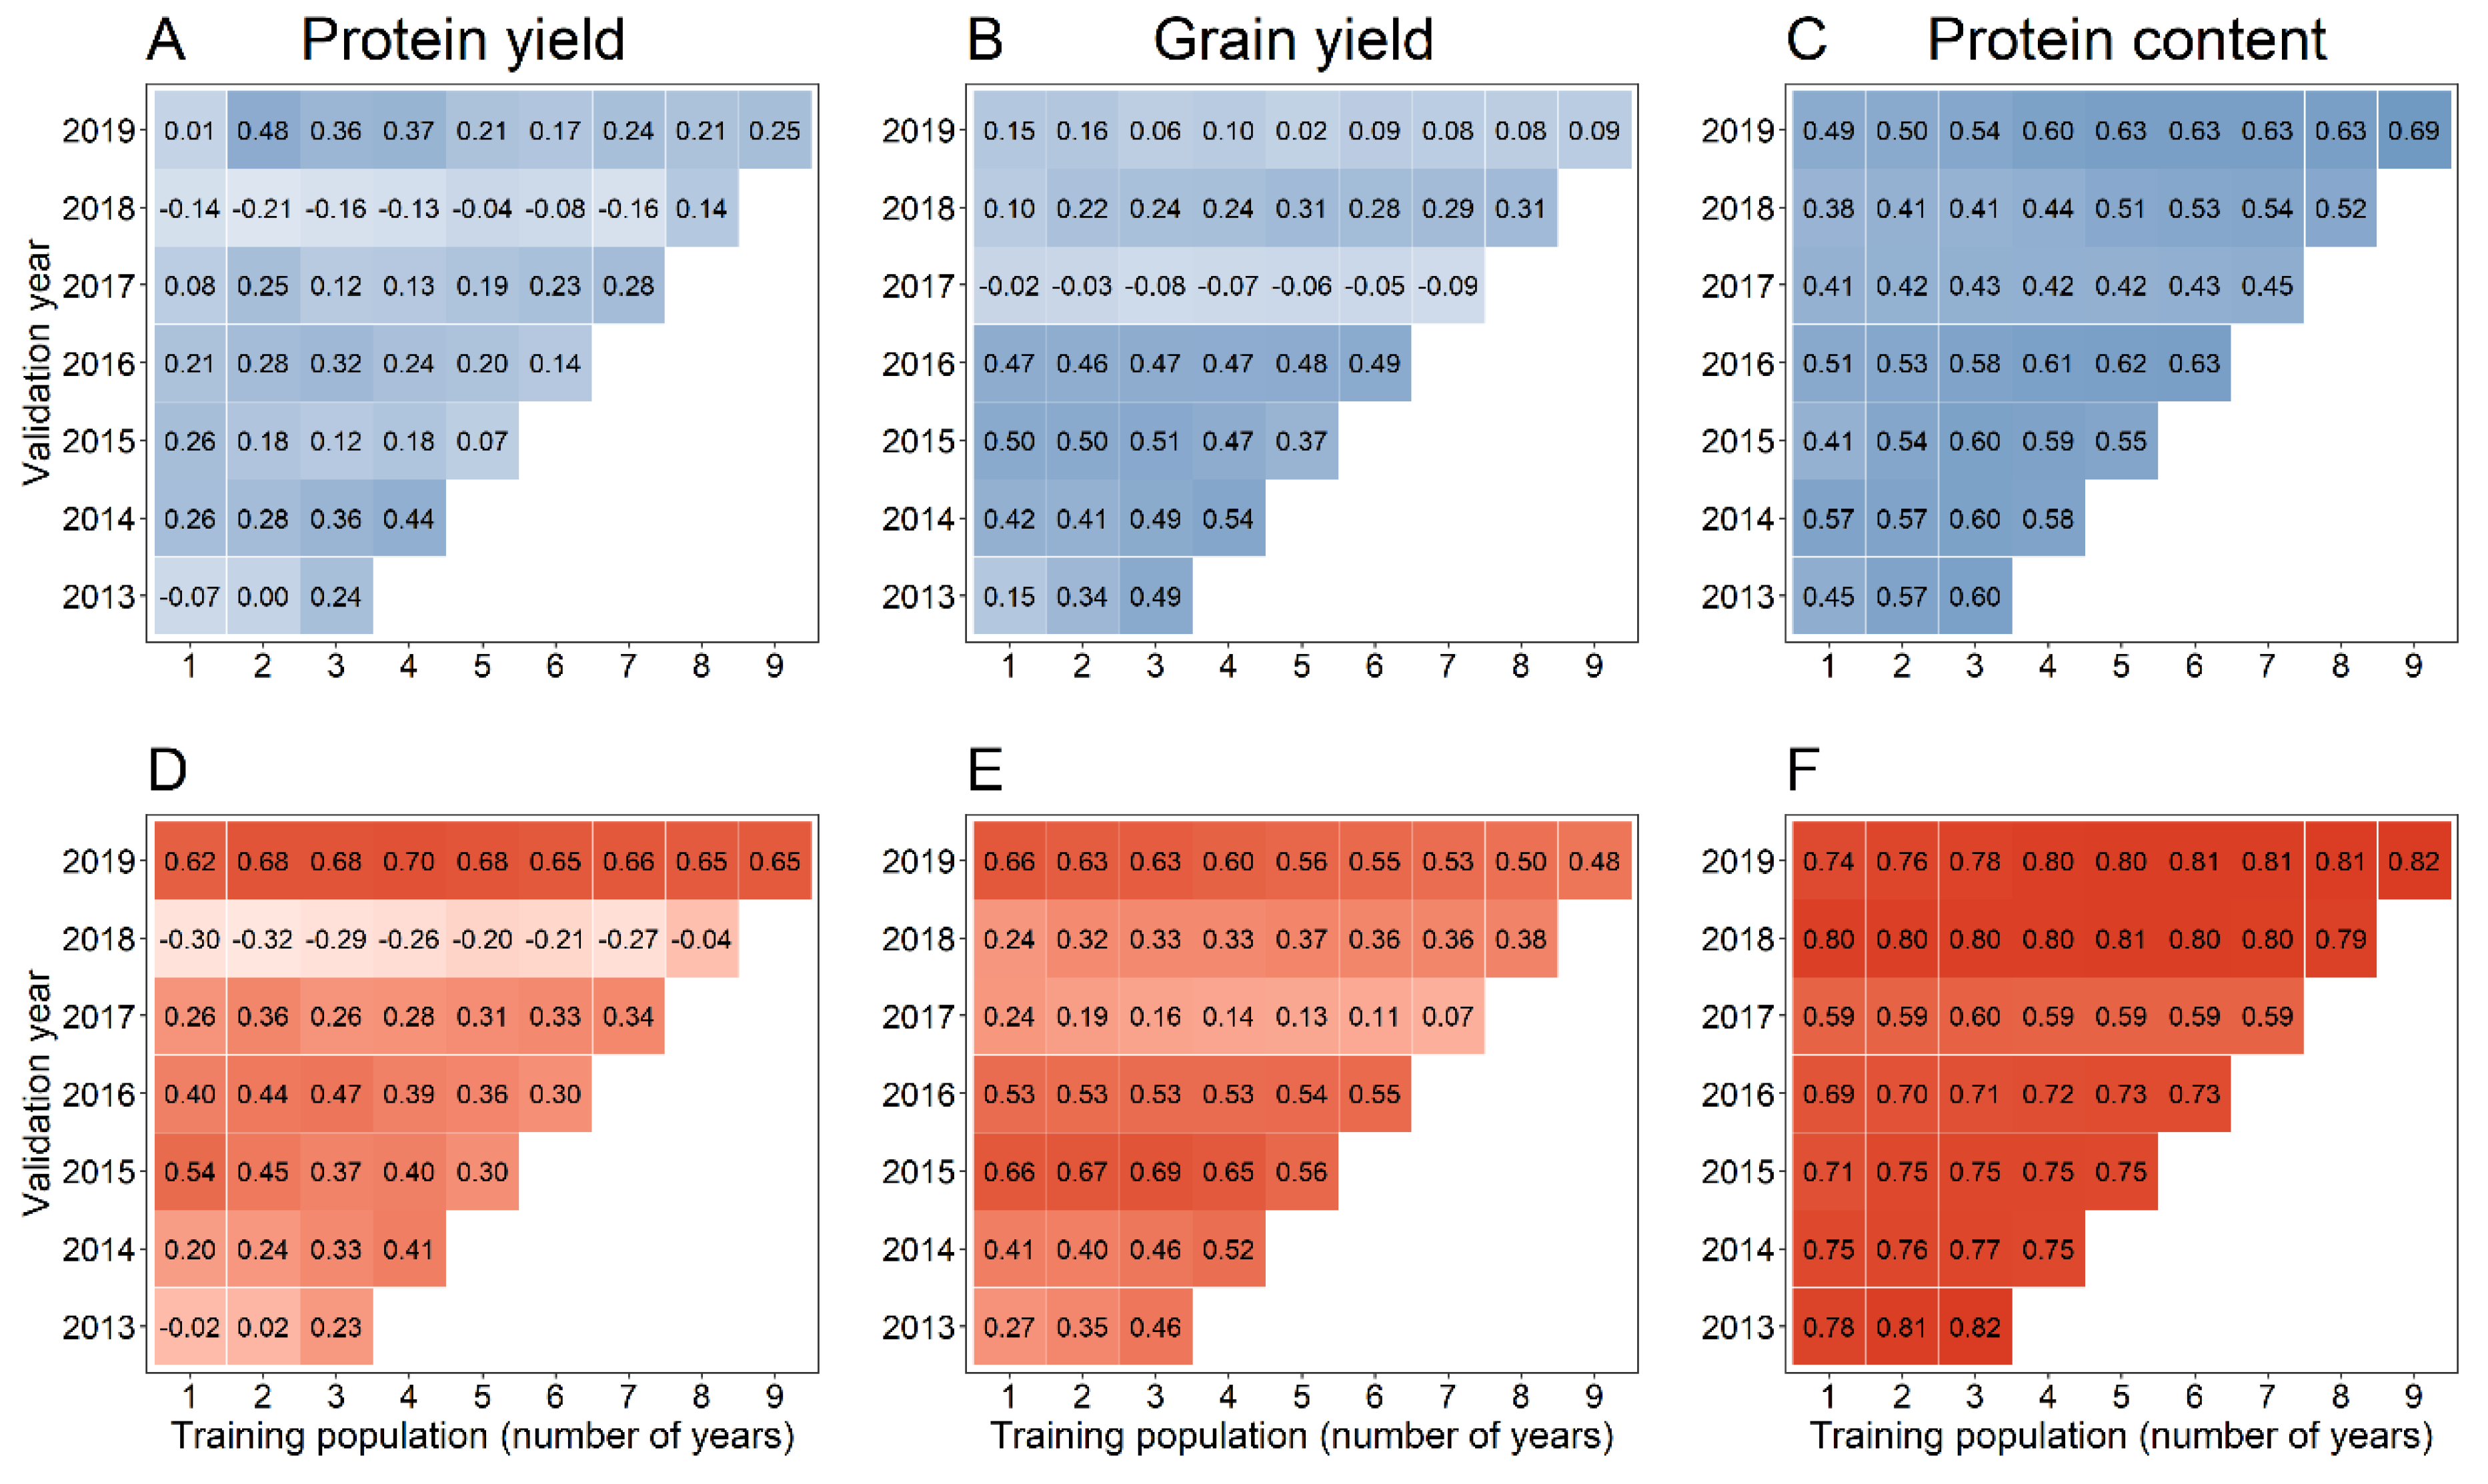
Figure 5.
Prediction accuracy for protein yield (A,B), grain yield (C,D) and protein content (E,F) using pedigree (P-BLUP), single-step (SSG-BLUP), genomic (G-BLUP) and pedigree-genomic (PG-BLUP) forward predictions with an accumulating training population of lines coming from all years preceding the validation years 2013–2019 in comparison with the predictive performance of phenotypic selection based on preliminary yield trials (green horizontal line). The employed training populations included all available lines tested in multi-environment trials preceding a specific validation year, whereas both scenarios without (TPsmall) or with augmenting the training population with lines tested in all preliminary yield trials preceding a validation year (TPlarge) were considered. All prediction models were fitted either without including preexisting information of a specific validation population from the preliminary yield trial preceding the validation year (“Based”-predictions) or with including this source of phenotypic information into the training population (“Assisted”-predictions).

Figure 6.
Number of lines tested in preliminary yield trials (PYT), in the respective validation populations (VP) and training population size without (TPsmall) or with augmentation of lines tested in all preliminary yield trials preceding a validation year (TPlarge) in combination without including pre-existing information of a specific validation population from the preliminary yield trial preceding the validation year (“Based”-predictions) or with including this source of phenotypic information into the training population (“Assisted”-predictions).
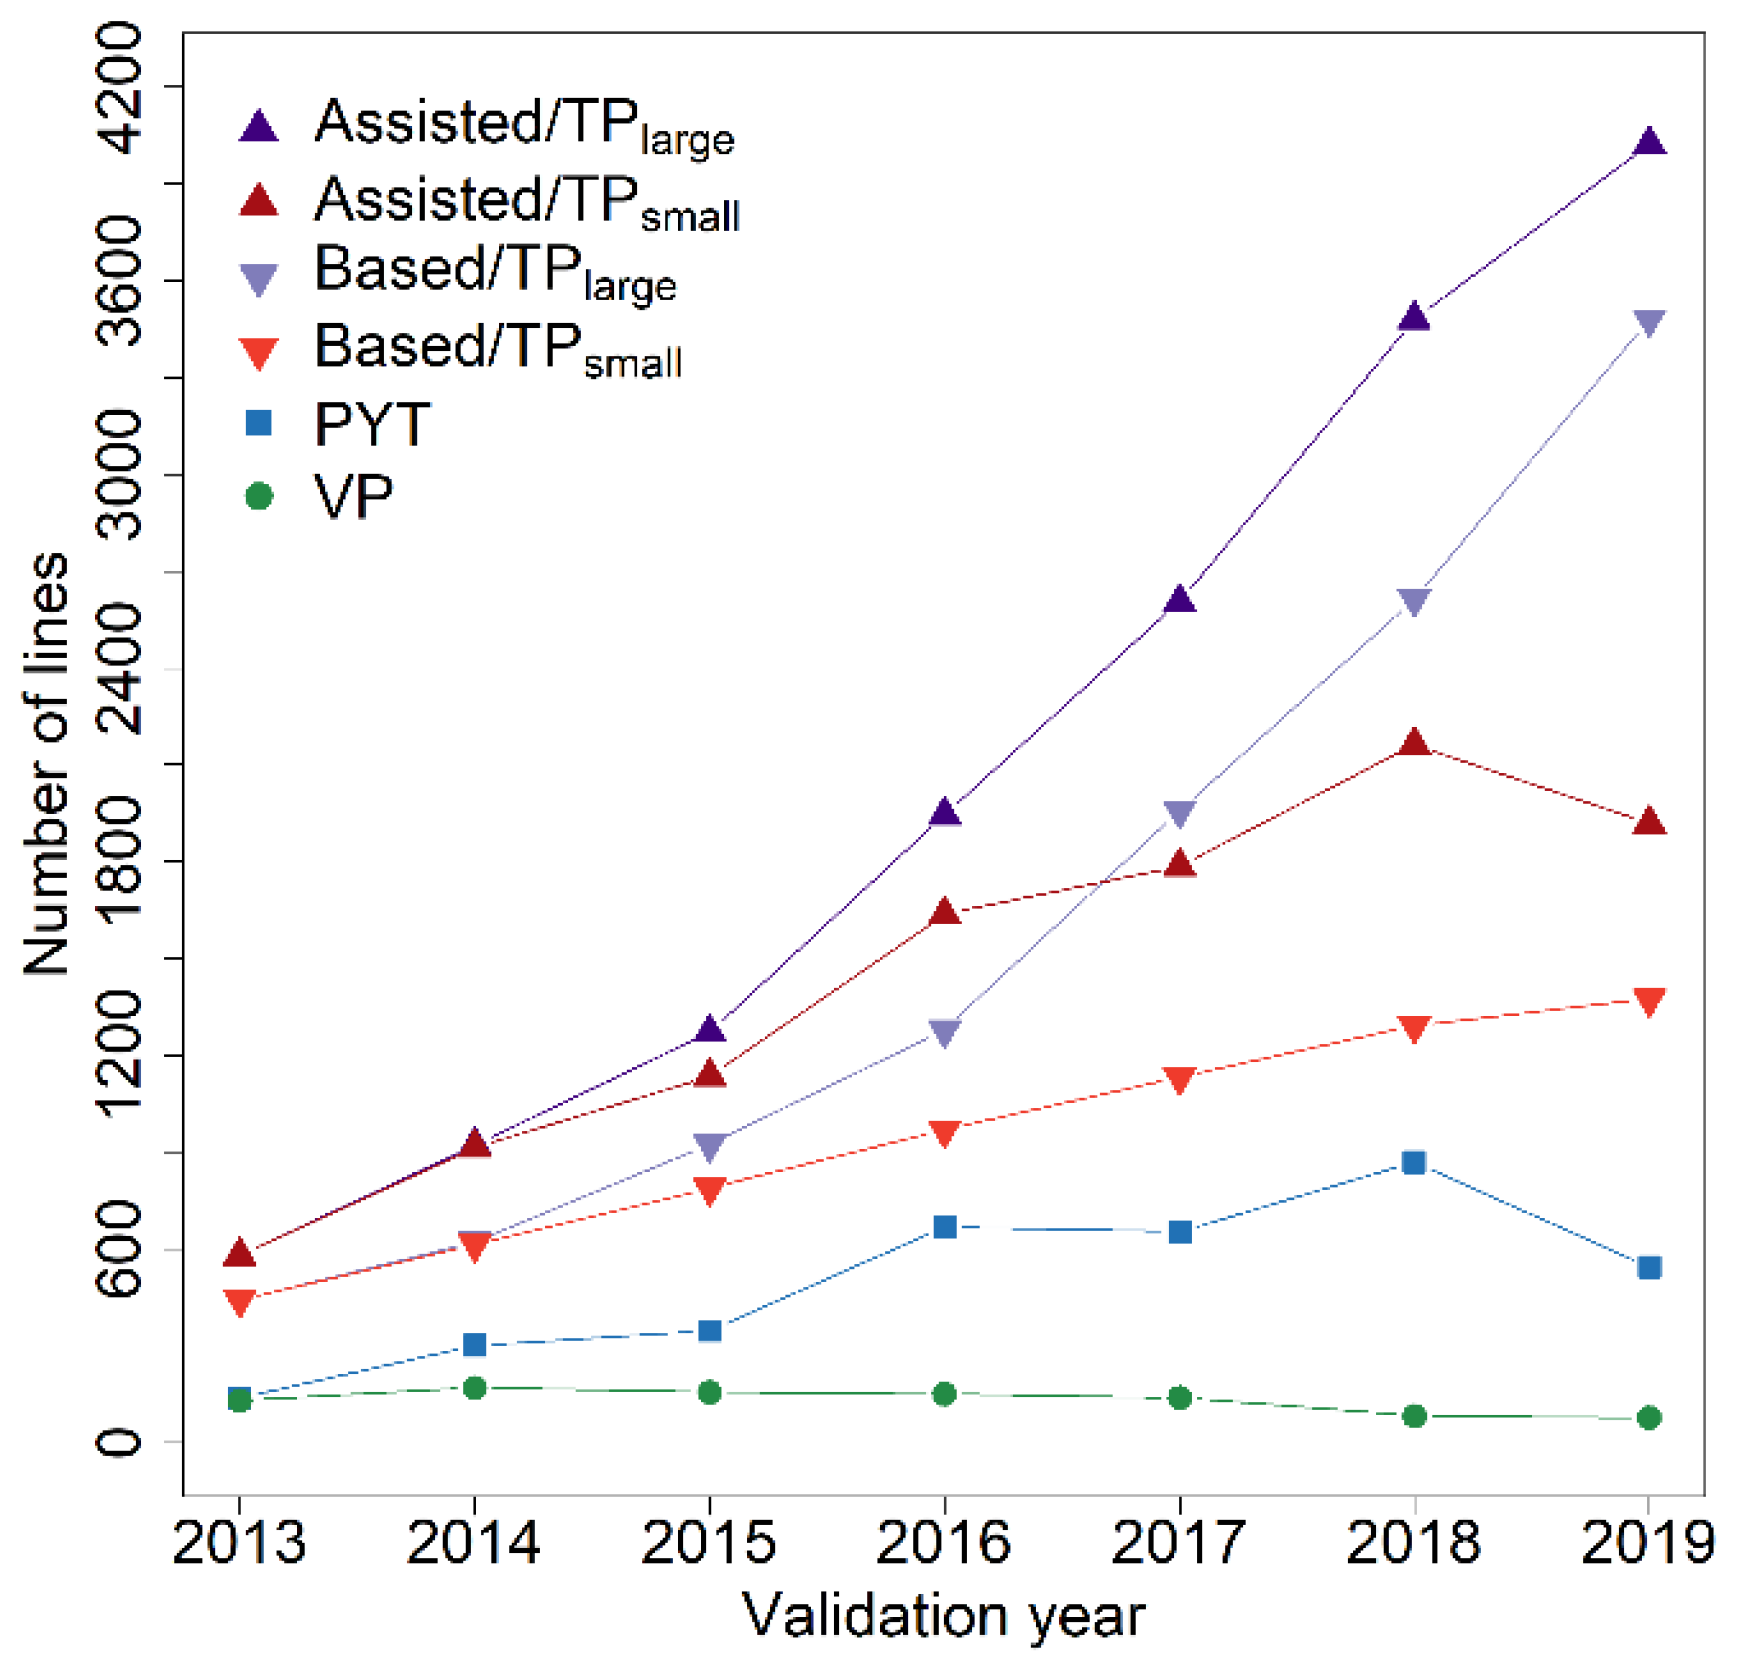
Figure 7.
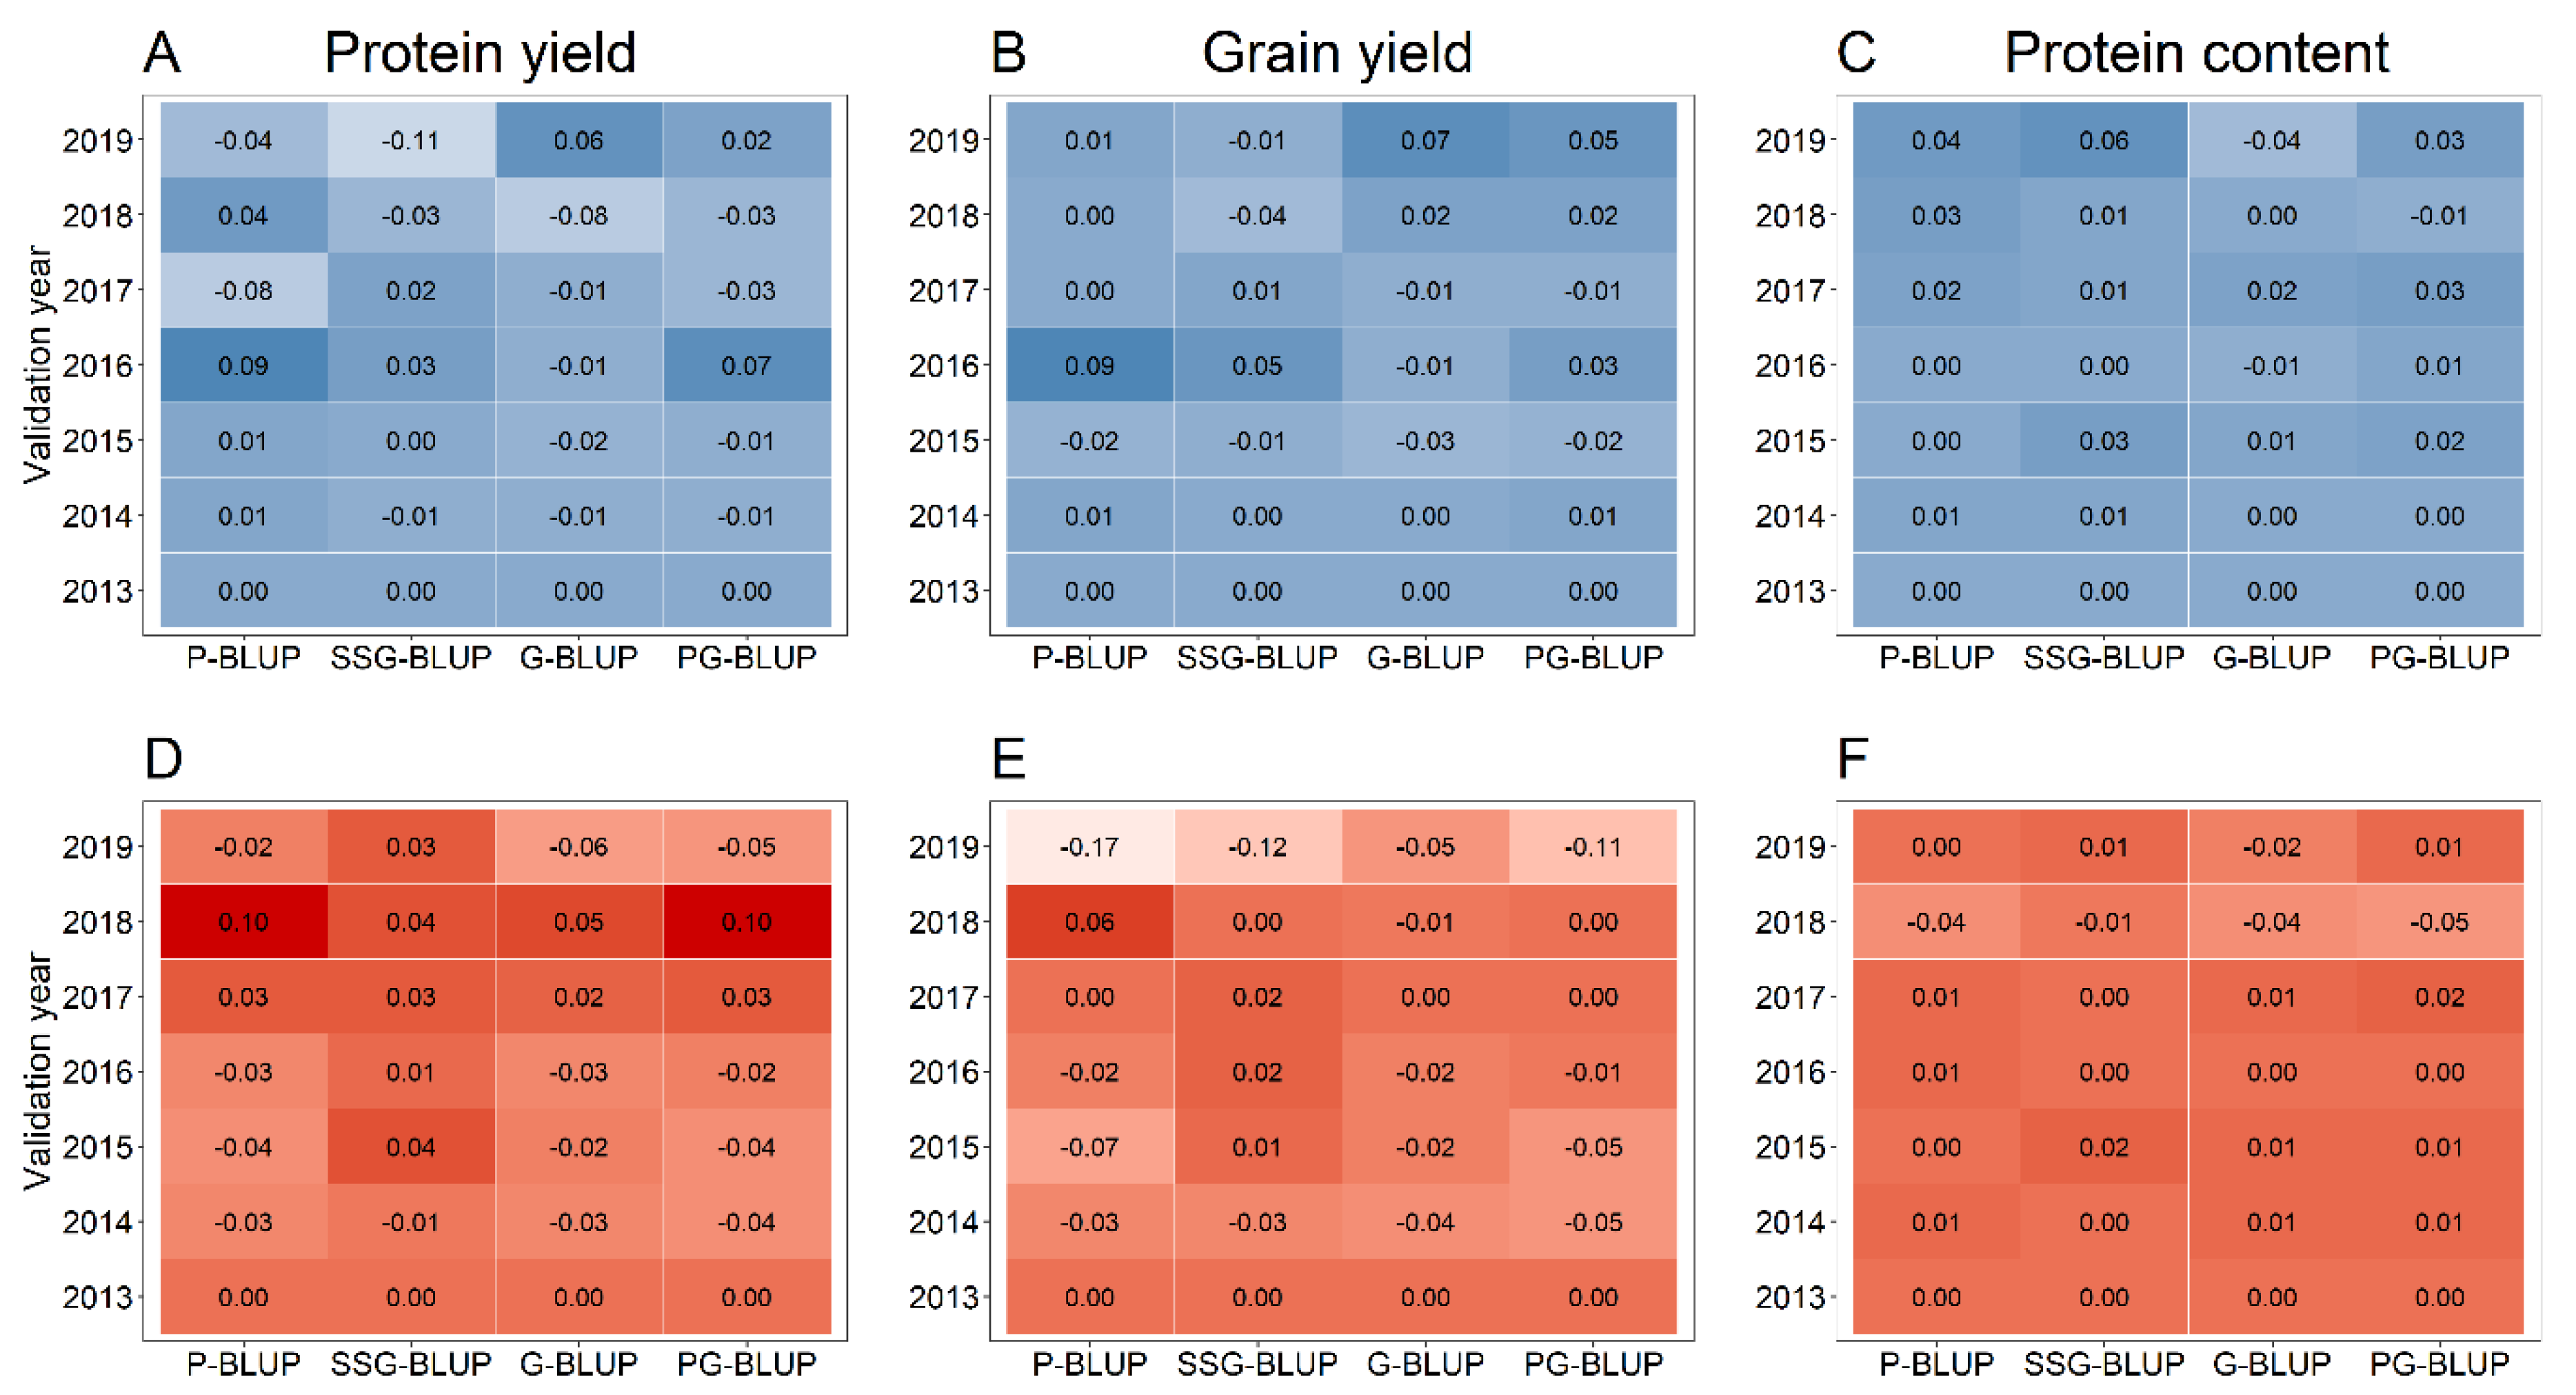
Difference in the prediction accuracy with (TPlarge) or without (TPsmall) augmenting the training population with lines tested in all preliminary yield trials preceding a validation year ( using pedigree-based (P-BLUP), single-step-based (SSG-BLUP), genomic-based (G-BLUP) and pedigree-genomic-based (PG-BLUP) forward predictions (A–C; blue coloured) as well as pedigree-assisted, single-step-assisted, genomic-assisted and pedigree-genomic-assisted forward predictions with the latter exploiting preexisting information of the validation population from preliminary yield trials (D–F; red coloured). A darker colouring generally indicates an advantage for augmenting the training population with lines tested in all preliminary yield trials preceding a validation year.
Figure 7.
Difference in the prediction accuracy with (TPlarge) or without (TPsmall) augmenting the training population with lines tested in all preliminary yield trials preceding a validation year ( using pedigree-based (P-BLUP), single-step-based (SSG-BLUP), genomic-based (G-BLUP) and pedigree-genomic-based (PG-BLUP) forward predictions (A–C; blue coloured) as well as pedigree-assisted, single-step-assisted, genomic-assisted and pedigree-genomic-assisted forward predictions with the latter exploiting preexisting information of the validation population from preliminary yield trials (D–F; red coloured). A darker colouring generally indicates an advantage for augmenting the training population with lines tested in all preliminary yield trials preceding a validation year.

Table 1.
Overview of the plant material tested between 2010 and 2019.
| Year | Number of Lines † | ||
|---|---|---|---|
| Multi-Environment ‡ | Observation Trial (All) § | Observation Trial (Sel.) ¶ | |
| 2010 | 127 | ||
| 2011 | 162 | ||
| 2012 | 208 | 142 | 130 |
| 2013 | 193 | 306 | 170 |
| 2014 | 202 | 361 | 156 |
| 2015 | 206 | 676 | 151 |
| 2016 | 192 | 666 | 139 |
| 2017 | 209 | 875 | 83 |
| 2018 | 113 | 554 | 76 |
| 2019 | 114 | ||
† Including lines that were tested in multiple years of multi-environment trials; ‡ Number of F5:6, F5:7 and doubled haploid lines tested in multi-environment trials; § Number of F4:5 and doubled haploid lines tested in the unreplicated preliminary yield trial; ¶ Number of selected lines that were retested in multi-environment trials in the next year.
Table 2.
Comparison of the prediction accuracies for different validation metrics in the simulation using only phenotypic (OBS), pedigree (P-BLUP), single-step (SSG-BLUP), genomic (G-BLUP) or pedigree-genomic (PG-BLUP) predictions with and without using preexisting information of the selection candidates.
| h² † | Model | With Pre-Existing Information | Without Pre-Existing Information | ||||
|---|---|---|---|---|---|---|---|
| Population ‡ | Across § | Within ¶ | Population ‡ | Across § | Within ¶ | ||
| 0.1 (0.3) | OBS | 0.319 | 0.835 | 0.246 | |||
| P-BLUP | 0.604 | 0.889 | 0.246 | 0.234 | 0.356 | 0.000 | |
| SSG-BLUP | 0.605 | 0.892 | 0.246 | 0.268 | 0.410 | 0.000 | |
| G-BLUP | 0.665 | 0.903 | 0.405 | 0.389 | 0.546 | 0.209 | |
| PG-BLUP | 0.670 | 0.902 | 0.405 | 0.375 | 0.512 | 0.208 | |
| 0.3 (0.5) | OBS | 0.548 | 0.949 | 0.438 | |||
| P-BLUP | 0.704 | 0.961 | 0.438 | 0.275 | 0.421 | 0.000 | |
| SSG-BLUP | 0.705 | 0.962 | 0.438 | 0.299 | 0.459 | 0.000 | |
| G-BLUP | 0.760 | 0.963 | 0.552 | 0.445 | 0.618 | 0.253 | |
| PG-BLUP | 0.772 | 0.965 | 0.576 | 0.440 | 0.598 | 0.253 | |
| 0.5 (0.7) | OBS | 0.707 | 0.977 | 0.595 | |||
| P-BLUP | 0.778 | 0.980 | 0.595 | 0.297 | 0.455 | 0.000 | |
| SSG-BLUP | 0.779 | 0.981 | 0.595 | 0.321 | 0.491 | 0.000 | |
| G-BLUP | 0.810 | 0.980 | 0.643 | 0.480 | 0.660 | 0.284 | |
| PG-BLUP | 0.832 | 0.982 | 0.687 | 0.483 | 0.660 | 0.285 | |
† Simulated heritability of the selection candidates and training population (in brackets); ‡ Prediction accuracy across all lines in the simulated progeny population; § Prediction accuracy across the averages of the simulated families; ¶ Average prediction accuracy for differentiating lines within families.
Publisher’s Note: MDPI stays neutral with regard to jurisdictional claims in published maps and institutional affiliations. |
© 2020 by the authors. Licensee MDPI, Basel, Switzerland. This article is an open access article distributed under the terms and conditions of the Creative Commons Attribution (CC BY) license (http://creativecommons.org/licenses/by/4.0/).
Share and Cite
MDPI and ACS Style
Michel, S.; Löschenberger, F.; Sparry, E.; Ametz, C.; Bürstmayr, H. Multi-Year Dynamics of Single-Step Genomic Prediction in an Applied Wheat Breeding Program. Agronomy 2020, 10, 1591. https://doi.org/10.3390/agronomy10101591
AMA Style
Michel S, Löschenberger F, Sparry E, Ametz C, Bürstmayr H. Multi-Year Dynamics of Single-Step Genomic Prediction in an Applied Wheat Breeding Program. Agronomy. 2020; 10(10):1591. https://doi.org/10.3390/agronomy10101591
Chicago/Turabian StyleMichel, Sebastian, Franziska Löschenberger, Ellen Sparry, Christian Ametz, and Hermann Bürstmayr. 2020. "Multi-Year Dynamics of Single-Step Genomic Prediction in an Applied Wheat Breeding Program" Agronomy 10, no. 10: 1591. https://doi.org/10.3390/agronomy10101591
Note that from the first issue of 2016, this journal uses article numbers instead of page numbers. See further details here.