Review

Implementation of Sustainable Practices to Ornamental Plant Cultivation Worldwide: A Critical Review

by
Anastasios I. Darras
Department of Agriculture, University of Peloponnese, 24100 Kalamata, Greece
Agronomy 2020, 10(10), 1570; https://doi.org/10.3390/agronomy10101570
Submission received: 19 September 2020 / Revised: 12 October 2020 / Accepted: 13 October 2020 / Published: 15 October 2020
(This article belongs to the Special Issue Recent Advances in Research and Production of Ornamental Plants)

Abstract

:
Ornamental production worldwide has changed dramatically in the past 20 years. A globalized scene has shifted production to new countries from Africa, Asia, and South America. Sustainability is the major challenge for ornamental production, and the life cycle assessment (LCA) provides insights on environmental contributions from production to handling and transportation and highlights the problematic issues that need improvement. For example, greenhouse gas (GHG) emissions and the production costs of roses in different parts of the world may vary dramatically between different production processes (e.g., heated or non-heated greenhouses, with or without air transportation, etc.). On the other hand, the production of landscape plants has the lowest environmental impact of all floricultural products. Their long production period offers carbon sequestrations that reduce the total GHG emissions. Sustainability is achieved via critical adjustments on cultivation by minimizing fuel and electricity use, adopting integrated nutrient management (INM) and integrated pest and disease management (IPDM), and using recyclable materials and peat-alternative growing compounds. In this review, two possible scenarios were proposed for ornamental production. Scenario I suggests conventional, protected cultivation under controlled environments (i.e., greenhouses), which can be sustainable after implementing appropriate adjustments to reduce environmental outputs. Scenario II suggests the cultivation of native and specialty ornamental crops, which may serve as eco-friendly alternatives. Combinations between the two scenarios are also possible in view to implement sustainable practices and meet future consumer needs.

1. Global Cut Flower and Pot-Plant Production

Global ornamental production and consumption has overcome serious challenges in the past 20 years. The EU holds the first place in cut flower and ornamental pot-plant sales with 31.0% of the global value, with China and USA in second and third place at 18.6 and 12.5%, respectively [1]. Within the EU, in the year 2016, the Netherlands had the most cut flower and ornamental pot-plant sales, with France and Italy being second and third [1]. Cut flower and ornamental pot-plant sales in the EU from 2006 to 2016 increased by 7% (approximately 1.4 billion euros), indicating a slow but steady increase, which was not dependent on the global economic status [1]. On the contrary, the number of cut flower producers in the USA was reduced significantly during the years from 2007 to 2015. These reductions recorded by the US department of Agriculture (USDA) reached 30% [2], indicating that cut flower production has been shifted to new worldwide players such as China [3]. In 2017, China came second in cut flowers and pot-plant sales. The USA, Japan, Brazil, Colombia, Canada, Ecuador, and Kenya completed the top-10 list of production countries in 2017 [3]. Kenya came first in pot-plant and cut flower imports to the EU, holding a share of 27.5%. Ethiopia, Ecuador, Colombia, Israel, USA, Costa Rica, China, and Uganda complete the top-10 list of countries exporting floricultural products to the EU [3]. Nonetheless, the consumption of cut flowers and pot plants was higher in the EU, USA, and Japan [4].
The world trading system is now based on three marketing channels that connect production with major consumption spots. The three channels are Europe–Africa, South–North America, and Asia–Pacific [4]. Within the Europe–Africa channel, products imported to Europe from Kenya, Ethiopia, and Uganda increased by up to 40% [3]. However, cut flowers from Asia (e.g., Israel and China) and American continents (e.g., USA, Colombia, Ecuador and Costa Rica) were also imported to the EU. The South–North America channel operates via production in South America and import to North America. Although the USA is the third production country in the world, in the past 20 years, cut flower production declined and imports increased [5]. For example, the number of year-round cut flower producers was reduced by 21% from 2013 to 2014 [5]. However, specialty cut flower production in the USA and Canada increased due to a significant increase in consumer demand [6]. This favored imports of the well-known commercial cut flower species such as roses, chrysanthemum, carnations, alstroemeria, etc., from South to North America. The Asia–Pacific channel follows the pattern of production in China, Japan, Thailand, India, and Australia and import to the Japanese and the Chinese markets [4]. The majority of the Chinese and Japanese ornamental production was consumed domestically.
Based on the 2019 figures presented by the largest trader in the world, sales of pot- and garden plants increased by 3.3 and 2.7%, respectively [7]. An interesting fact shows that sales of pot- and garden plants from the traditional auction systems at Floraholland declined by 1.8 and 7.2%, respectively, showing a significant turn of buyers to the direct wholesale channels [7]. Significant increases in direct sales of pot- and garden plants were recorded the last 3 years (e.g., from 2017 to 2019) ranging from 6.4 (2017) to 1.8 (2019) and from 10.4 (2017) to 7.2 (2019), respectively [7,8]. The top-5 pot-plants sold in Floraholland auctions in 2019 were, in ascending order, phalaenopsis, mixed plants, kalanchoe, anthurium, and pot-rose [7]. Likewise, the top-5 garden plants were hellebore, lavandula, hydrangea, other bedding plants, and other trees/shrubs.
The objective of this review was to outline ways to achieve sustainability in commercial floriculture production. Restrictions in CO2 footprints and global warming potential (GWP) on agricultural production have been legislated in the EU and globally since 1995. The differences in CO2 footprints and overall environmental impact is substantial; therefore, the floriculture industry need to seek dynamic modifications for future production and sale. The present review outlines the implementation of sustainable practices and proper adjustments to reduce CO2 footprints and the overall environmental impact of the floricultural products (Figure 1).

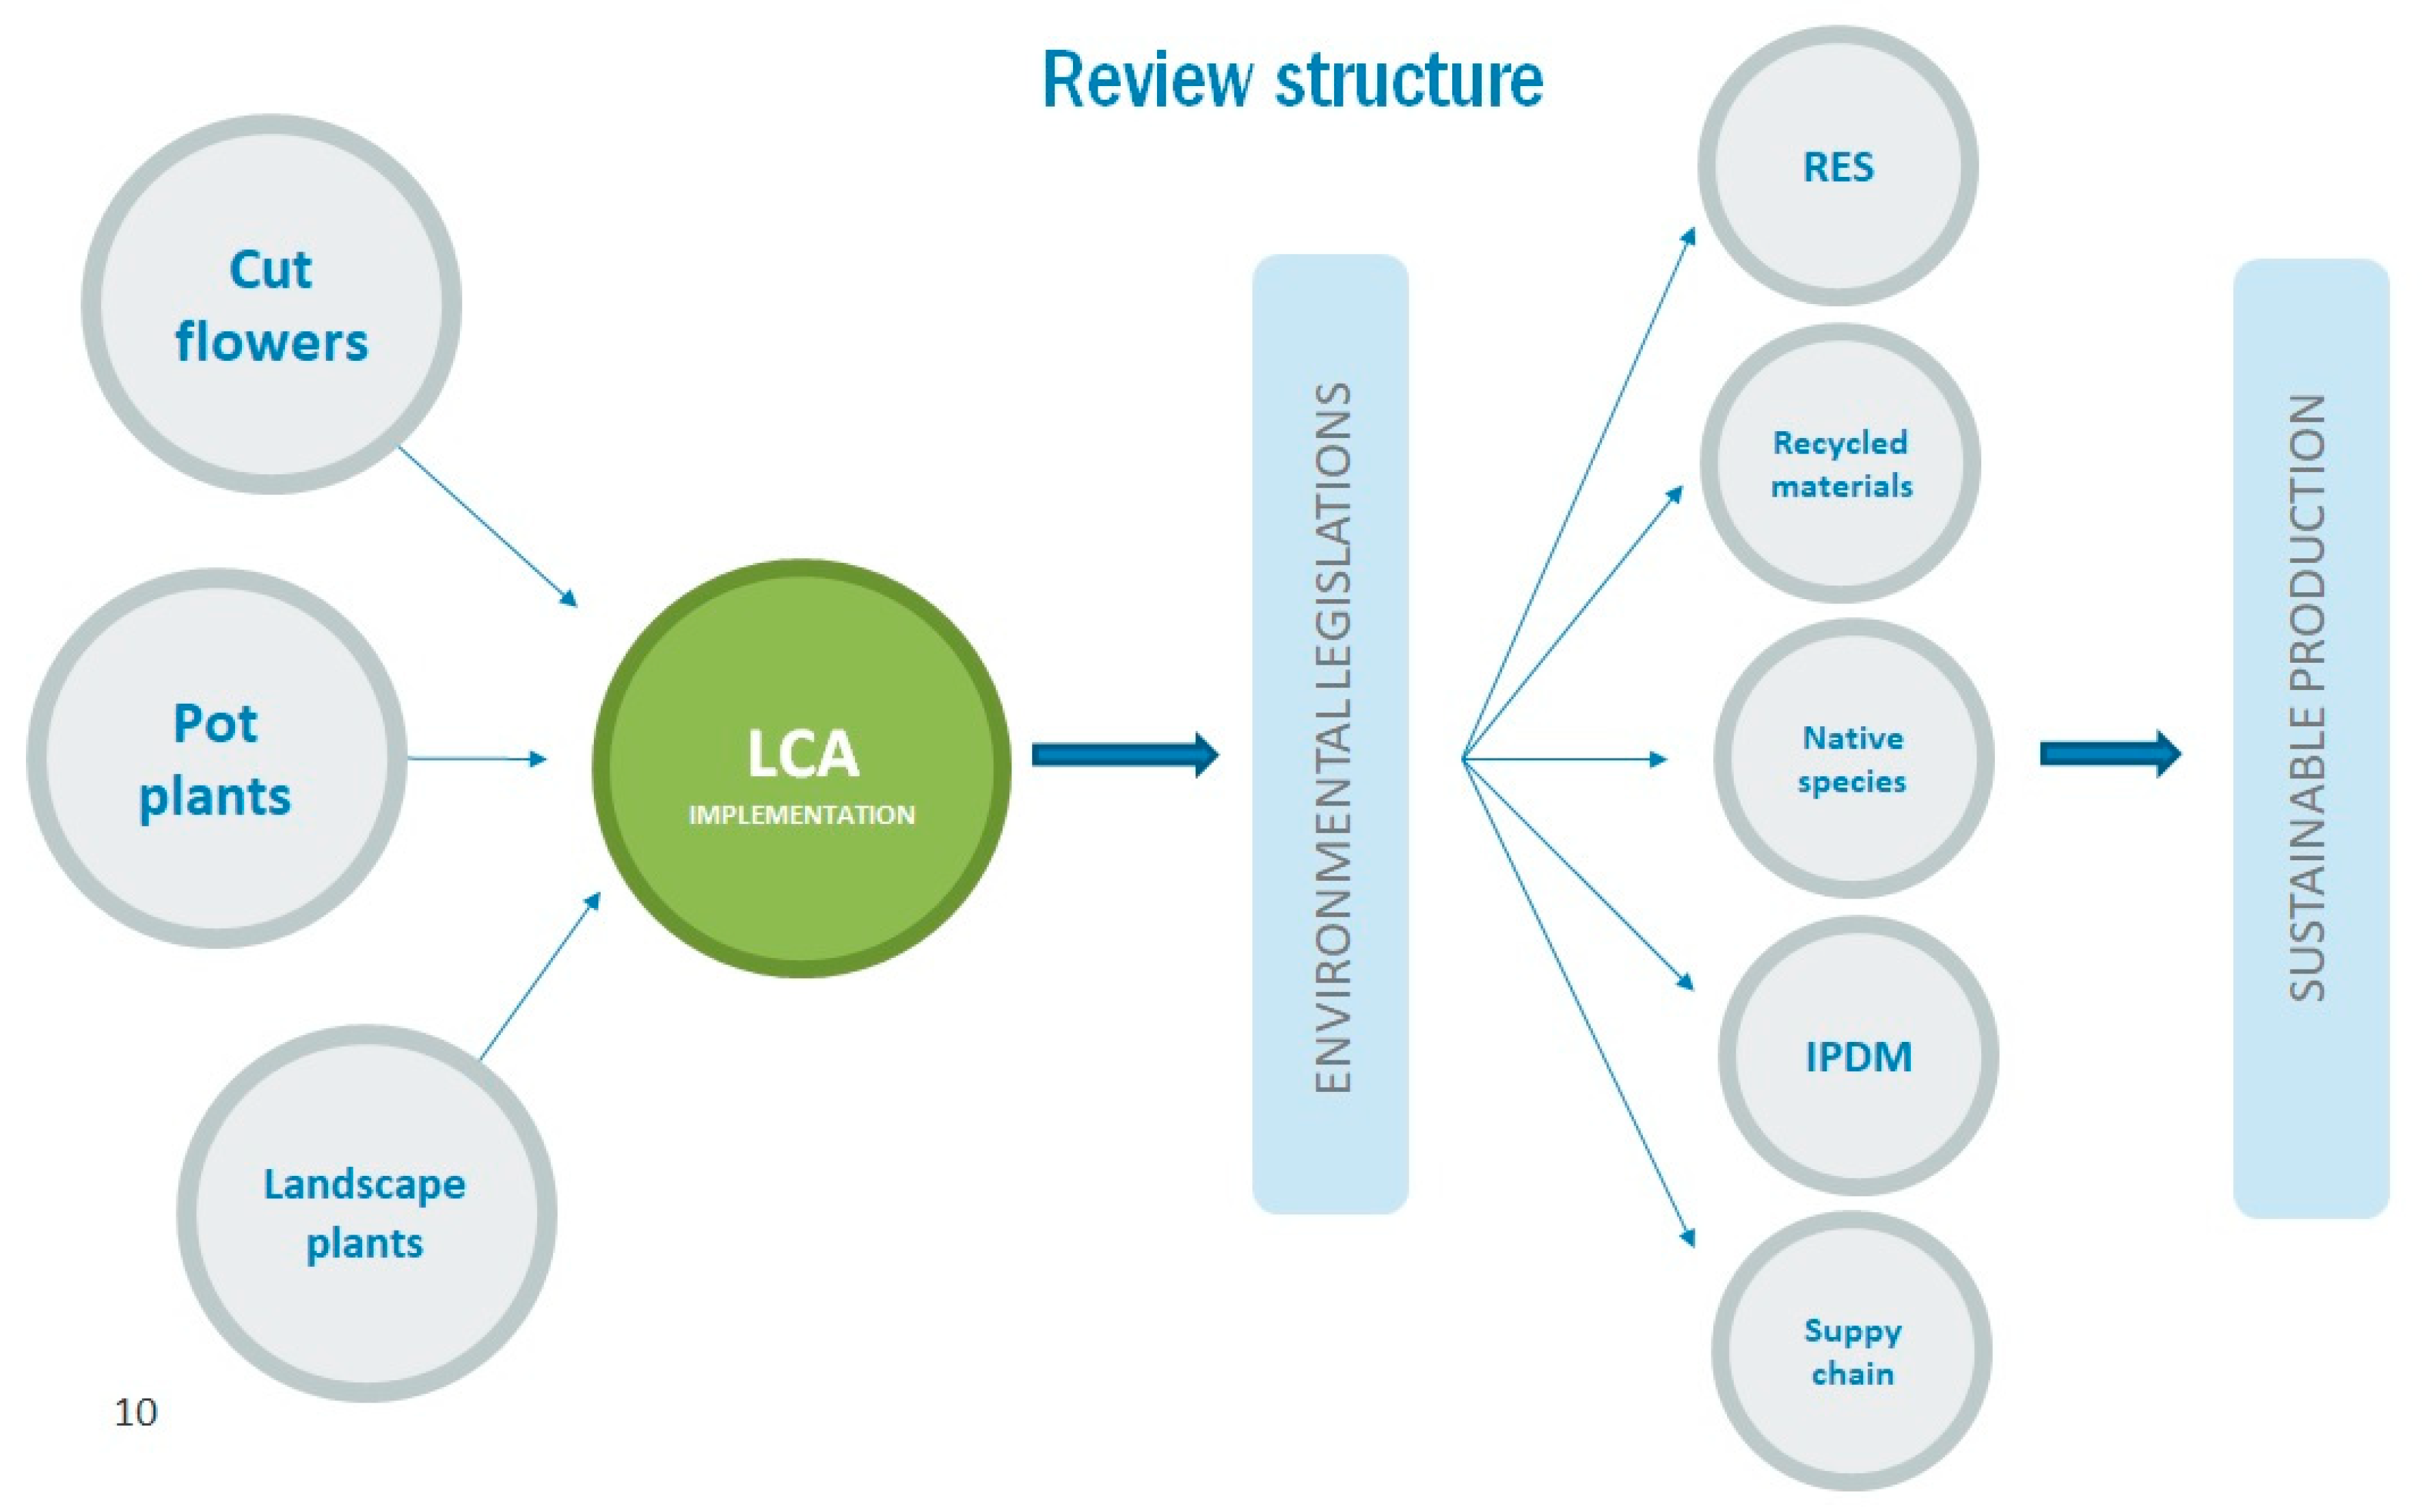
2. Life Cycle Assessment (LCA) of Floricultural Products

Life cycle assessment (LCA) is an important tool for evaluation of the environmental impact of horticultural products from production to handling and transportation. It is based on calculating inputs (energy and materials) and outputs (releases to air, water, soil, etc.) allocated at every step of the production chain (Table 1 and Table 2). It has an international acceptance from the scientific community, it is governed by international standards, and it is applied to many fields, including agriculture [9]. GWP and other environmental impacts such as abiotic depletion (AD), air acidification (AA), eutrophication (EU), photochemical oxidation (PO), ozone depletion (OD), human toxicity (HT), freshwater aquatic ecotoxicity (FAET), marine ecotoxicity (MAET), terrestrial ecotoxicity (TE), CO2 footprint, and water footprint can be estimated by the LCA. The systemic approach of LCA measures the environmental impact of materials and processes giving substantial insights to scientists, managers, producers, and sellers around the world [10].

2.1. LCA of Cut Flowers and Foliage

The LCA of cut flower production was linked to the following categories (Table 2): (a) production and delivery of greenhouse construction materials, chemicals, and fertilizers, compost or hydroponic substrates and propagation material, (b) energy (e.g., fuel, electricity), water (e.g., irrigation, fog systems), pesticides and fertilizers used in cultivation, (c) energy (e.g., water, electricity for cold- and packaging-room operation) and materials consumed at handling and packaging (e.g., cardboard boxes or water buckets), (d) energy (e.g., fuel) used for transportation the wholesale (cradle-to-gate scenario) or to the final destination at retail (florist shop, garden center, supermarket, etc.) or to consumer (extended cradle-to-gate).
Within the production and handling chain of cut flowers, the main outputs were associated with AD, AA, EU, global warming (GW), and PO (Table 2). While the production and delivery of materials and cultivation contribute to all of the above-mentioned categories, postharvest handling and transportation contribute to AD, GW, AA, and PO (Table 2). Published research in LCA of cut flowers present data on output contributions. For example, greenhouse grown carnations in Greece had very low CO2 emissions (e.g., 0.316 kg CO2 eq) and variable contributions in main output categories [11]. The highest contributions ranged between 60.8 and 82.2% and were recorded for flower preservation and handling, whereas the EU was highest (88.3%) at fertilization [11]. On the contrary, greenhouse grown roses in the Netherlands showed a completely different environmental output profile [12]. The climate control system contributed to AD, AA, EU, GW, and PO by up to 93.9–98.6%. An LCA analysis presented by Sahle and Potting [13] for roses produced in Ethiopia showed that the major contributions to AD, AA, EU, GW, OD, HT, FAET, MAET, TE, and PO were recorded at plant growth management and ranged from 75 to 90%. Postharvest handling and transportation had a small to medium contribution to environmental outputs ranging from 1 to 30% [13]. Fertilization contributed the highest emissions (25% for ET to 79% for MAET) during plant growth management followed by the use of pesticides. The work by Sahle and Potting [13] presented the differences in environmental impacts by different inputs for rose flower production in Ethiopia compared to that presented by Torrellas et al. [12] for roses produced in the Netherlands. A comparative environmental analysis for roses cultivated in Ecuador and the Netherlands were presented by Franze and Giroth [14]. The comparison showed that Dutch roses exceeded all environmental outputs when compared to the Ecuadorian, with OD being the only exception. The LCA analysis revealed that energy consumption in the Dutch greenhouses was the main factor for this negative environmental impact [14]. Energy consumption at cultivation dominated the GWP by 98.9%, while the Ecuadorian roses contributed a modest 35%. Roses grown in the Netherlands contributed more than 90% in AD, FAET, MAET, and TE [14].
The differences in environmental outputs (AD, AA, EU, GW, PO, OD, HT, FAET, MAET, and TE) can be dramatic when the same species is cultivated under different conditions (e.g., heated or non-heated greenhouses, with or without air transportation, etc.) [14,15,16,17] (Table 3). For example, energy consumption (e.g., fuel and electricity) during cut rose cultivation in the Netherlands contributed 95% to the total greenhouse gas (GHG) emissions, while in Kenya, it contributed 2% [16]. Roses produced in Ecuador contributed 20% to GW, while those produced in the Netherlands contributed 80% [14]. In Colombia, the total amount of energy needed for cut rose production was 14.51 and 14.38 MJ stem−1 year−1 in non-heated and heated greenhouses, respectively, while in Kenya and the Netherlands, it was 2.4 and 20.2 MJ stem−1 year−1 [17]. The differences were associated to transport (Colombia to England = 12.25 MJ stem−1 year−1, Kenya to England = 0.3 MJ stem−1 year−1) and heating (19.9 MJ stem−1 year−1 for the greenhouses in the Netherlands and 0.51 MJ stem−1 year−1 for the greenhouses in Colombia) [17]. Wandl and Haberl [18] tested 17 floriculture products (pot-plants and cut flowers) on their emissions at different stages of the production chain. Heating energy was, by far, the major influence factor accounting for more than 87% of the total emissions for calla, hyacinth, iris, and amaryllis production [18] (Table 3). A minor contribution for heating was recorded for chrysanthemum and summer cut flower production. The lowest total emissions were recorded for summer and spring flowers, followed by chrysanthemum, freesia, and ranunculus. Total GWP for roses, iris, lillium, and calla ranged from 1.3 to 2.6 kg CO2 eq (Table 3) [18].

2.2. LCA of Ornamental Pot-Plants

LCA of ornamental pot-plant production was associated with the following categories (Table 2): (a) production and delivery of greenhouse construction materials, chemicals, and fertilizers, compost or other growing materials (peat, vermiculite, perlite, etc.), propagation material (seeds, plugs, rooted cuttings, bulbs, etc.), (b) energy (e.g., heat, electricity), water (e.g., irrigation, fog systems), pesticides and fertilizers consumed during cultivation, and (c) packaging materials (e.g., sleeve-packaged), especially for tropical species such as phalaenopsis, anthurium, poinsettias, and energy (e.g., fuel) for transportation to the wholesale, or to the final destination at retail (garden centre, florist shop, supermarket, etc.).
Total GWP associated to materials and equipment used in greenhouse production of Begonia x semperflorens-culturum was measured to be 0.1396 kg CO2 eq [19] (Table 3). The major contribution to the total environmental outputs was 30.8% and 12.3% for container use and electricity, respectively. Similarly, the total GWP of potted chrysanthemums was 0.5552 kg CO2 eq [20] (Table 3). Of this, 44.8% was contributed by the substrate (60/40, peat/wood fiber) and 26.4% was from the containers. The production of potted cyclamen in two different greenhouses in Italy gave similar GWP contributions of 61.5% and 64.2 kg CO2 eq at the propagation and at the plantlet growing stages [15] (Table 3). The second most important contribution factor was farm electricity. Environmental burdens associated with energy consumption such as electricity could be reduced by the use of renewable energy sources (RES) such as solar panels and wind generators [15].
The LCA of poinsettia plants showed that electricity used at the growing stage was the highest contributor in GHG emissions [21]. It was suggested that when woodchips (e.g., a renewable source) were used as a heating source, the output contributions to the GWP were reduced by up to 80%, compared to that of using non-renewable energy sources such as fossil fuels. Managing GHG emissions and GWP associated with heat-demanding cultivations could be achieved by the use of alternative energy sources. For example, poinsettia cultivated with conventional energy sources produced up to 21 kg CO2 eq [16], but only 0.59 kg CO2 eq when woodchips were used as the heating source [21]. By far, phalaenopsis were the most energy demanding pot ornamental plant cultivated in the Netherlands [16]. Nearly all (96.4%) of the CO2 production was associated to energy inputs at cultivation. Ficus plants grown in the Netherlands had a CO2 footprint ranging from 11 to 16 kg CO2 eq depending on the growth stage of the plants [16]. Wandl and Heberl [18] measured the GWP of nine ornamental pot-plants. Cyclamens had the highest CO2 footprint followed by amaryllis, azalea, poinsettia, hyacinths, pelargonium, primula, bedding plants, and viola. Cyclamens produced 5.5 kg CO2 eq, which was well above the average values of the study (e.g. 1.8 kg CO2 eq) [18].

2.3. LCA of Landscape Plants

The LCA of landscape plants depended on the species, on cultivation types (in field or container-based), and on nursery structures and equipment, but generally, it was associated with the following categories (Table 2): (a) the production and delivery of materials (irrigation, construction, etc.), chemicals and fertilizers, soil or other growing material (peat, vermiculite, perlite etc.), and propagation material (seeds, rooted cuttings etc.), (b) the energy (e.g., electricity), water (e.g., irrigation, fog systems), pesticides, and fertilizers consumed at cultivation, and (c) energy (e.g., fuel) for transportation to the wholesale or to the final destination at retail (e.g., garden center).
The production of landscape plants takes place at nurseries in a field or under protected areas (e.g., nettings, greenhouses) in containers or field soil. LCA is an important tool for calculating their production cost and GWP. The knowledge of the CO2 footprint of field-grown trees may help nursery managers understand their system and apply potential modifications to reduce GHG emissions and costs [22]. Furthermore, during their life cycle, shrubs and trees usually have positive contributions in GWP and GHG emissions, as their post-production life (on the landscape) subtracts CO2. For example, the life cycle GWP of the Cercis canadensis tree produced in the Midlands of the USA during production, transport, transplanting, take down, and disposal would be −63 kg CO2 eq [22].
LCA has been used to analyze GHG emissions at the production of landscape plants in the nurseries [23,24]. Several analyses revealed that the total CO2 emissions for container-based cultivation were higher compared to the in-field production. For example, emissions for container-based cultivation ranged between 26.1 and 34.7 Mg ha−1 year−1, while in-field production ranged between 2.3 and 6.6 Mg ha−1 year−1 [23]. Major contribution differences between the two production types were for fertilization, plastic, and peat use. Lazzerini et al. [24] showed that the container-based cultivation of ornamental shrubs and trees produced up to 100-fold higher kg CO2 m−2 year−1, compared to the in-field cultivation. Approximately 92% of this difference was associated with cultivation inputs such as fertilizers and agrochemicals, peat and other potting mixes, plastic pots, and energy consumption [24].
The production of landscape plants has a relatively low GWP and GHG contribution (Table 3). Their long cultivation period offers carbon sequestrations that reduce their total GHG emissions. Unlike all industrial products, plants take up CO2 during their production. The larger the plant (e.g., tree), the larger the sequestration. For example, the total GWP for Viburnum x juddi shrubs grown in nursery fields was 1.621 kg CO2 eq, which was contributed by materials (66%) and equipment use (16%) [25]. An estimate of 0.916 kg CO2 could be subtracted during propagation-to-gate production to a total input of 0.705 kg CO2 eq. The seed-to-landscape CO2 footprint of Picea pungens trees cultivated for 5 years at nurseries in the US was estimated to be 13.558 kg CO2 eq, including the sequestration of 9.14 kg CO2 eq [26].
Table 3. Total CO2 production (kg CO2 eq), contribution in global warming potential (GWP) (%), and CO2 sequestration (kg CO2 eq) at cultivation, handling, and transportation of selected cut flowers, pot-plants, and landscape plants.
Ornamental Species (Production Country)Total CO2 Production (kg CO2 eq)Contribution to GWP (%)CO2 Sequestration (kg CO2 eq)Reference
CultivationHandlingTransportation
1.
Cut flowers
Roses (the Netherlands)249630na[14]
Roses (Austria)1.7100nsnsna[16]
Roses (Ethiopia)ns72226na[11]
Roses (Germany)0.6–2125–92ns7–21na[19]
Chrysanthemum (Austria)0.4100nsnsna[16]
Calla (Austria)2.5100nsnsna[16]
Iris (Austria)1.9100nsnsna[16]
Lilium (Austria)1.6100nsnsna[16]
Spring flowers (Austria)>0.1100nsnsna[16]
Summer flowers (Austria)>0.1100nsnsna[16]
Carnations (Greece)0.31619.465.615.0na[9]
2.
Pot-plants
Phalaenopsis (the Netherlands)32.09541na[14]
Ficus (the Netherlands)11.549492na[14]
Poinsettia (the Netherlands)21.582162na[14]
Poinsetia (Austria)2.8100nsnsna[16]
Cyclamen (Italy)ns100nsnsna[13]
Cycalmen (Austria)5.7100nsnsna[16]
Begonia x seperflorens (USA)0.1498.6ns1.4na[17]
Chrysanthemum (USA)0.5699.9ns>0.1na[17]
Orchids (Germany)4.218–98ns>1na[19]
Azalea (Austria)3.6100nsnsna[16]
3.
Landscape plants
a.
Field production
Acer rubrum “October glory” 8.98 ns901[27]
Cercis canadensis 13.71165[20]
Picea glauca globosa 1.01 nsns[22]
Taxus x media “Densiformis” 0.28 2.4512.55[25]
Viburnum x juddi 1.620.916[23]
Picea pungens 13.569.14[24]
Ilex aquifolium 0.77 nsns[22]
Acer rubrum (Italy) 0.61 nsns[22]
Robinia umbrellifera 0.78 nsns[22]
b.
Container production
Ilex crenata 2.922.14[22]
Quercus fellus 26.49 nsns[22]
Wisteria floribunda 10.40 nsns[22]
Nandina domestica 19.26 nsns[22]
Magnolia stellata 10.26 nsns[22]
Cupressocyparis leylandii 7.44 nsns[22]
Photinia x fraseri “Red robin” 7.52 nsns[22]
Pinus pinea 8.48ns[22]
ns: not shown; na: not applicable.
When P. pungens was cultivated for another year, the added contribution to the total GWP was less than 3%, and the estimated positive impact of carbon sequestration during a 50-year life was 593 kg CO2 eq [24]. The GWP of materials and equipment used for rooting cuttings of Taxus x media ‘Densiformis’ was 0.0097 and 0.2762 kg CO2 eq, respectively [27]. The post-farm to gate stage gave a total GWP of 2.45 kg CO2 eq, but the shrub’s lifetime in the landscape offered a sequestration of 12.55 kg CO2 eq. This left a positive GWP of −8.18 kg CO2 eq [27]. The GHG emissions during production (cutting-to-gate) of the evergreen shrub Ilex crenata ‘Bennett’s Compacta’ was recorded to be 2.918 kg CO2 eq [28]. The major categories contributed to the GHG emissions were fertilization and irrigation during production followed by the container and liner stages (the first 7–9 months of growing).
LCA analysis revealed that a reduction of fertilization by up to 10% could reduce GW by up to 3% [28]. Thus, modifications in cultivation may reduce environmental impacts considerably. LCA for Acer rubrum trees revealed that the CO2 footprint associated with materials and equipment inputs during nursery production was 12.1 kg CO2 eq [29]. The estimated CO2 sequestered by the 4-year field cultivation was 1.32, 2.92, 3.83, and 5.01 kg CO2 eq, respectively for the 1st, 2nd, 3rd, and 4th year, giving a total of 11.88 kg CO2 eq [29]. Among all material and equipment inputs, harvesting had the largest contribution of 7.134 kg CO2 eq (54%). Based on the standard 100-year assessment model of PAS 2050, the sequestered CO2 by A. rubrum was 901 kg during its 60-year potential life [29].

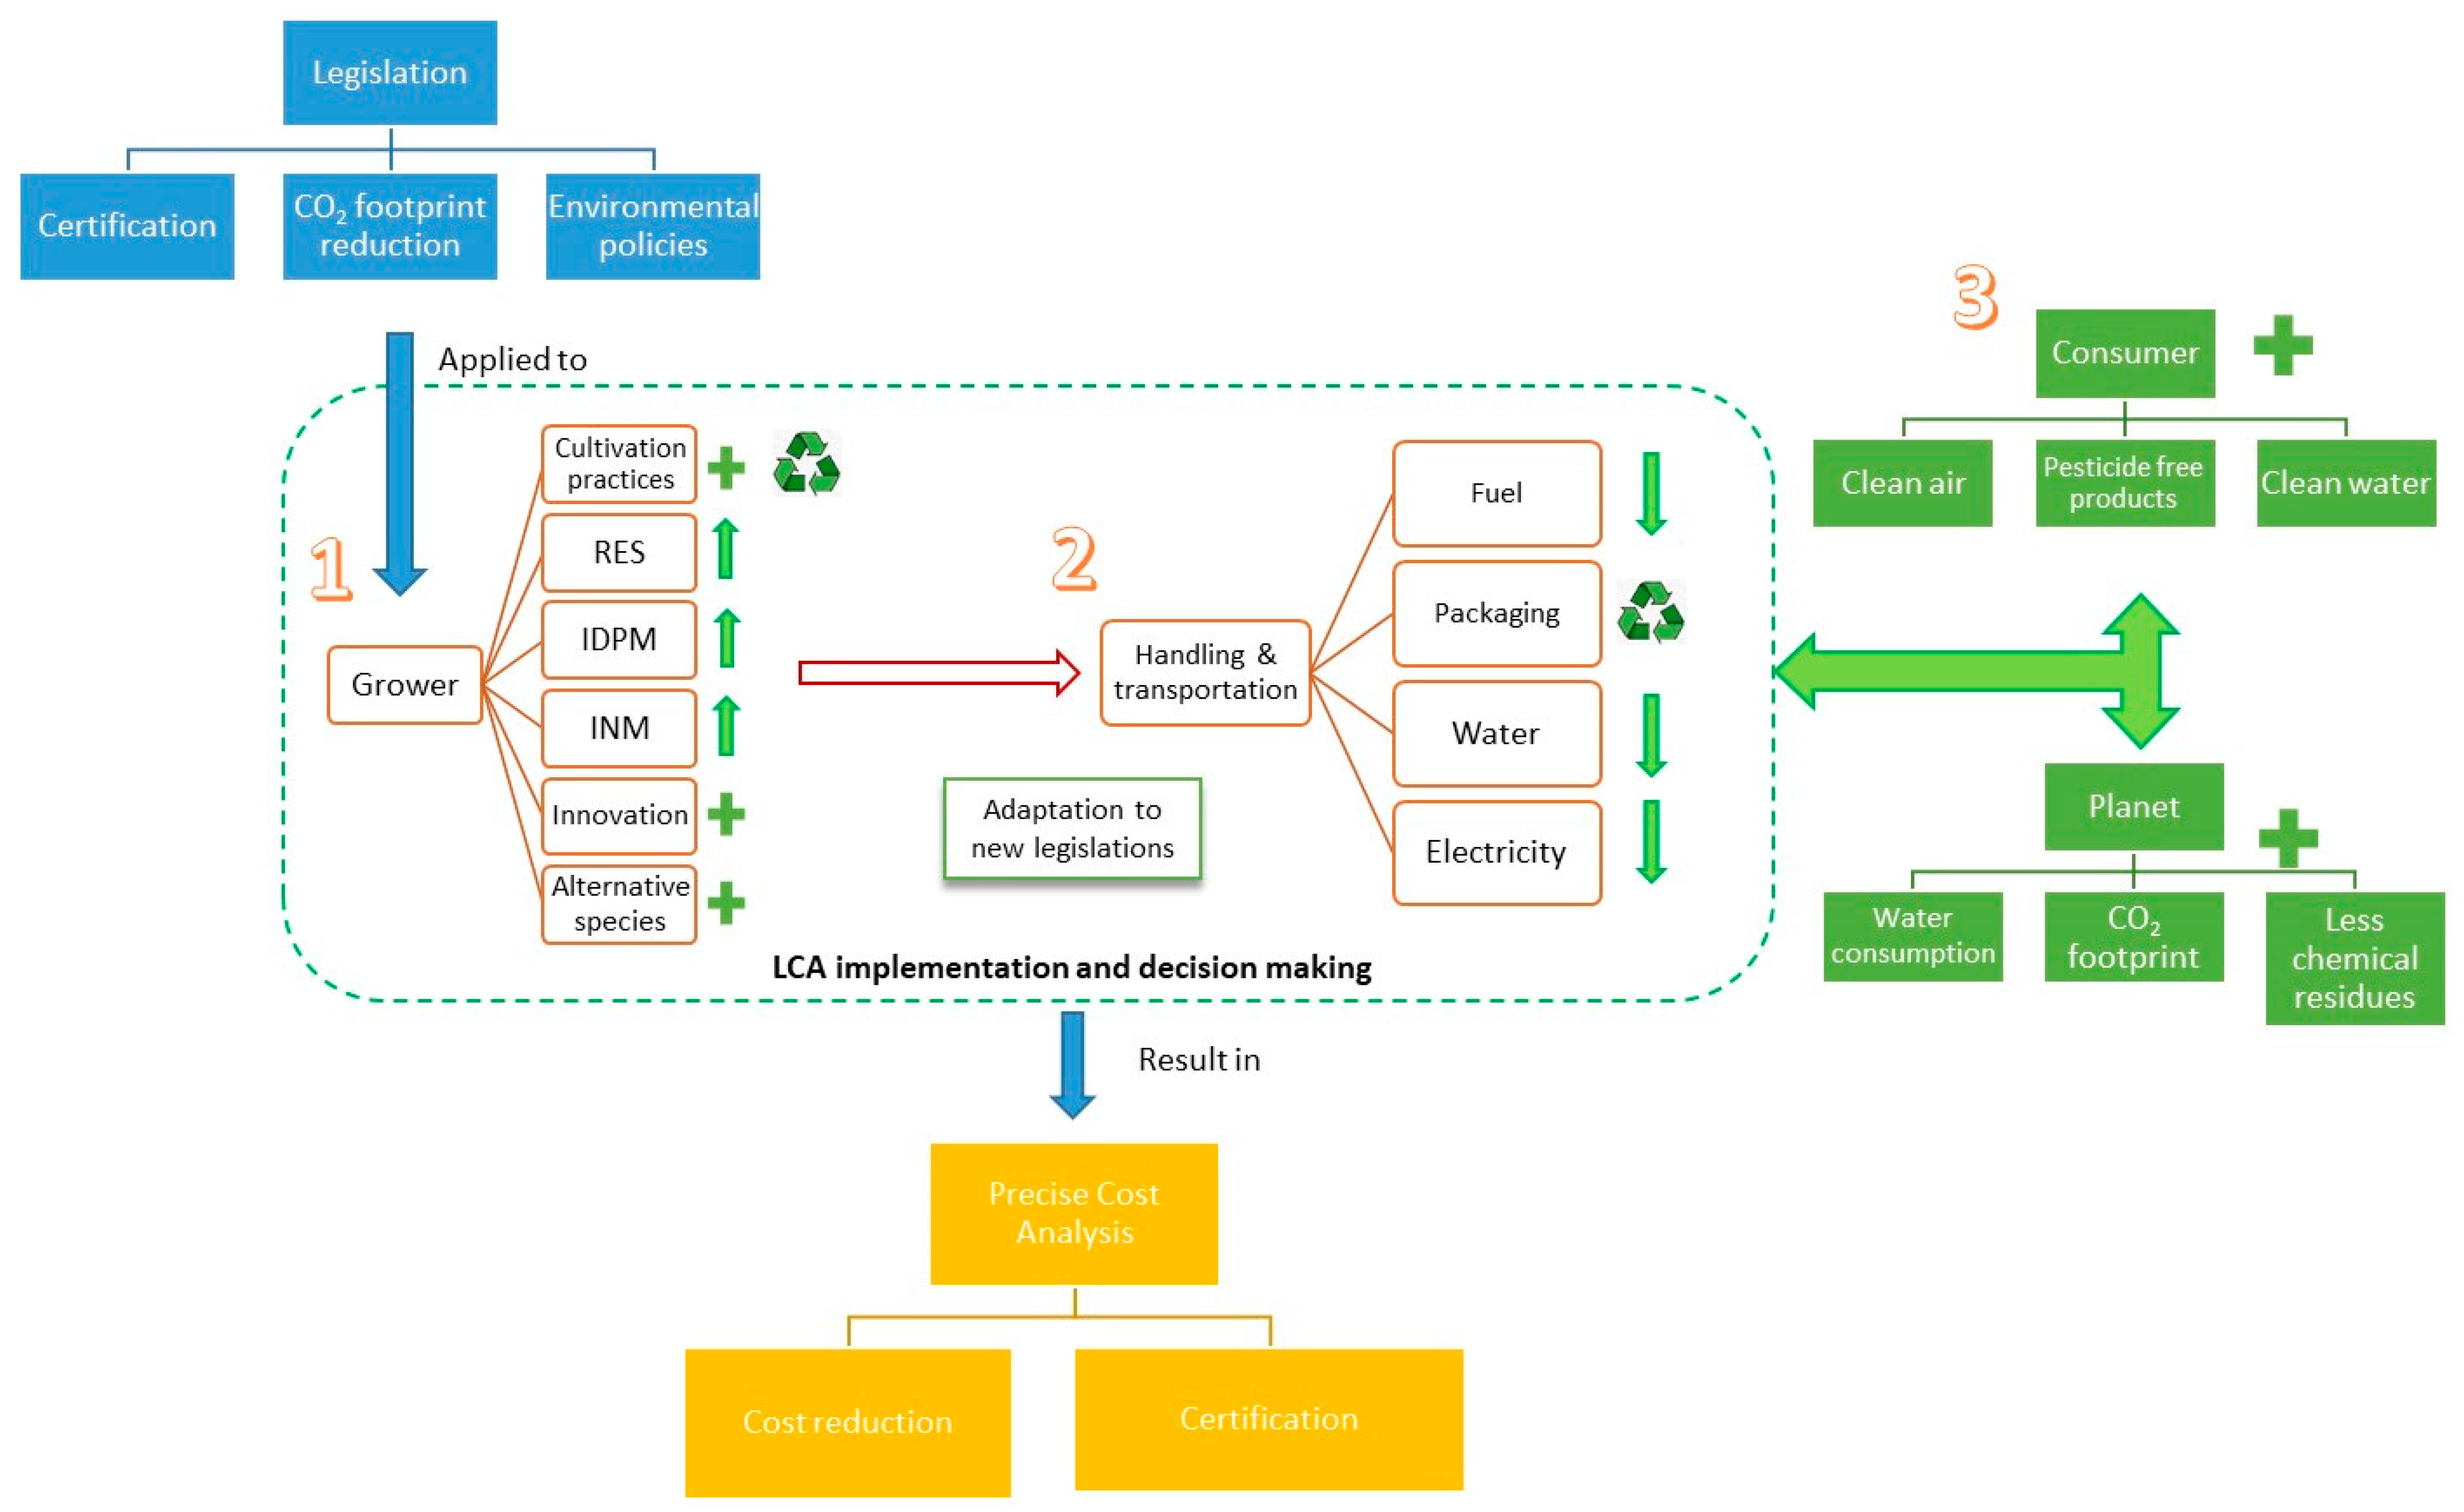
3. Sustainable Ornamental Production and Trade Worldwide

3.1. Current Status in Certification and Legislation

Intensive greenhouse ornamental plant cultivation usually requires high volumes of energy and material inputs resulting in significant environmental outputs associated with the increase in GHG emissions and contributions to the global climate change (CC). CC in particular affects growing conditions by the appearance of extreme meteorological phenomena such as severe heat waves and droughts, storms and hurricanes, fires, floods, etc. Growers deal with these extremes, and, at the same time, they have to implement eco-friendly cultivation strategies. Eco-friendly strategies may include the adoption of RES to cover energy and electricity demands, the use of recycled materials in cultivation, the implementation of integrated pest and disease management (IPDM) and integrated nutrient management (INM), and the introduction of new species or varieties that adapt better to new conditions (Figure 2). Adaptation to new legislation might affect cultivation costs in the short term, but eventually, it will help growers reduce them. LCA has long been used for the evaluation of sustainable practices and calculation of costs in the production chain, helping growers decide on operational and structural modifications (Figure 2).
The recognition of floricultural products as sustainable is complex and demanding. Sustainable production is achieved via the implementation of strict environmental and social protocols as defined by the national and international directives [30]. For example, the GLOBALGAP certification for cut flowers and ornamental plants was released in 2003 by a coalition of British supermarkets. It was a protocol that described strict specifications on good agricultural practices, worker health, safety, and welfare [30]. The Milieu Programma Sierteelt (MPS) was introduced by Dutch growers and auctions in Holland in 1995. It set the standards for environmental management, with social qualifications and good agricultural practices. The Veriflora certification was founded in 2005 by American growers and sellers who set standards to environmental and social issues [30]. In traditional cut flower production countries such as Kenya, Colombia, and Ecuador, there are different certifications established by grower associations, wholesalers, and exporters all related to environmental and social standards and good agricultural practices [30].

3.2. Sustainability and Adaptation to Climate Change (CC)

Changes in global climate have affected considerably open field and protected cultivations [31,32]. In the last 30 years, significant changes have been recorded in atmospheric CO2, in precipitation patterns and in extreme temperature increases. Increases in average temperature levels and summer heat waves in many parts of the southern hemisphere challenge cultivation practices and plants’ adaptation to new conditions [31]. Problematic issues include the introduction of invasive plant species, new pests and diseases, and increases in water, electricity, and agrochemical requirements. The flower association of Queensland (Australia) has made a list of issues associated with CC in their region [33]. The most important issues for the floriculture industry were as follows: the increased risk of soil erosion by temperature extremes and fewer rainfalls, changes in plant growth and productivity, changes in abundance and severity of pests and diseases, changes in the suitability of traditionally grown crops and varieties, changes in the optimum locations for cultivation, and changes in crop selection [33]. Adaptation to new cultivation techniques implemented for CC would probably increase production costs. At the same time, growers would have to follow government legislations and standards for good, environmentally friendly agricultural practices to decrease CO2 footprints and environmental impacts [33].
Furthermore, CC associated with temperature extremes (high or low), drought, and salinity are considered stressful factors for plants [32]. Plants have various adaptation responses to overcome such extremes; however, the level of adaptation is genotype-dependent [34]. The effect of increased temperature on the photosynthetic activity and flowering of ornamental plants is crucial. Increasing temperatures from 20 to 40 °C resulted in significant reductions in photosynthetic activity of Agastache urticifolia, Petunia x hybrida, Capsicum annum, Plumbago auriculata, and Catharanthus roseus plants [35]. Although temperature increases from 14 to 26 °C significantly reduced time to anthesis of the annuals Tagetes erecta, Antirrhinum majus, Nemesia foetans, Heliotropium arborescens, Nicotiana alata, Diascia barberae, Matthiola incana, and Osteorpermum ecklonis [36], elevated night temperatures negatively affected the flower yield of Gypsophila paniculata [37]. The flower production of G. paniculata was hastened at 28 °C, but yield was significantly lower compared to production at 12 °C [37]. The number of flowering buds and flower diameters were significantly decreased in Antirrhinum majus, Calendula officinalis, Impatiens walleriana, Torenia fournieri, and Mimulus x hybridus plants grown at 32 °C compared to those grown at 20 °C [38]. For a large number of annual ornamental species, optimum temperatures ranged from 19.1 to 28 °C [39]. Temperatures during plant growth affect pigment production and, as a result, flower color [40]. Anthocyanins are better regulated at low to medium temperatures, while at extreme highs (>40 °C), their production, and therefore color intensity, is significantly reduced [40]. Precise climate control in greenhouse environments may affect production costs and increase GHG emissions and CO2 footprints. This leads to a compromise between cost, quality, and eco-friendly adaptation.
CC may directly affect the development and survival of pathogens and herbivorous insects, natural enemies, and competitors, and it may also indirectly modify the physiological responses in host plants associated to defense mechanisms [41,42]. Changes in temperature and humidity may affect pathogens’ and pests’ reproductive potential, their ability to disperse, and their interactions with competitors [41]. In a complex micro-environment, plant–disease interactions will favor the species most capable to adapt to new equilibrium states. Future research will have to consider CC as a significant factor affecting plant–pathogen and plant–pest interactions.

3.3. Renewable Energy Sources (RES) and Other Innovative Automation Used in Ornamental Production

Climate control inside the greenhouse is the single most important factor that regulates the growth and development of protected crops. Temperature and humidity management during winter and summer is essential for the production of high-quality ornamental plants and cut flowers. Heating and cooling systems operating in winter and summer consume large amounts of energy by the means of fuel and electricity. In most of cases, energy consumption for heating was by far the most demanding factor in cut flower production in the Northern European countries [15,16,21]. Energy for heating phalaenopsis, roses, and poinsettias contributed >80% of the total CO2 footprint (kg CO2 eq) [15]. In warmer countries such as Colombia, Kenya, Greece, and Ecuador, energy for crop heating was minimum compared to that used in the northern countries such as Austria, Germany, and the Netherlands. The search for alternative energy sources for greenhouse ornamental plant production may be the key to lower CO2 footprints and achieve sustainability [43,44]. For example, the closed greenhouse model proposed by Vadiee and Martin [44] is a system that improves energy efficiency, water conservation, production rate, and pesticide usage, and it also reduces cultivation and handling costs. The closed greenhouse system stores excess heat and humidity in a thermal energy storage (TES) system, a heat pump, and a heat exchanger, and returns it inside the greenhouse in the format of heat or cooling when needed. Such systems may be efficient in appropriate climates with mild temperature fluctuations and adequate solar radiation. As data on the replacement of traditional energy sources are very limited, more research is required to evaluate the efficiency of the RES and the innovative automation systems used in ornamental plant production.
Innovative cultivation practices include cultivation in soilless media [15,45,46]. LCA evaluations have shown that the environmental impact of the soil-grown roses was worse compared to that of the soilless cultivation [45,46]. This was attributed mainly to the lower amounts of fertilizers and pesticides used in hydroponics [45]. When 22 rose farms in Italy were studied, the results showed that soil cultivation contributed more than 40% in AD, GWP, EU, and AA, compared to the hydroponic cultivation [46]. These studies provide a clear indication that new technologies may positively affect cultivation procedures.

3.4. The Use of Recycled or Alternative Materials in Ornamental Production

Agricultural waste such as tobacco dust, cotton gin trash, olive mill and green waste have been used in combination with peat for the cultivation of ornamental plants [47,48,49,50]. Papafotiou et al. [47] showed that olive-mill waste composts (OWC) could partially replace peat for the production of Euphorbia pulcherrima (poinsettia), although, at concentration of >12.5%, it delayed growth compared to plants cultivated in the peat/perlite medium. Tropical potted plants such as Syngonium podophyllum, Ficus benjamina and Codiaeum variegatum could be grown in 75% OWC without showing symptoms of toxicity or other negative effects on growth and development [46]. Cotton gin trash compost and rice hulls were tested as peat replacements for the production of Nerium oleander, Pelargonium zonale, Dedranthema grandiflora, and Lantana camara [51]. The use of green waste and sewage sludge compost at 80%–20% (v:v) as a white peat replacement had positive effects on the growth and flowering of Begonia semperflorens, Mimulus hybridus, Tagetes patula x erecta and Salvia splendens [49]. Tobacco dust is a potent agricultural by-product that could be used in concentrations of 5–10% without any negative effects in the growth and flowering of P. zonale plants [50]. GHG emissions from ornamental production nurseries in Italy were significantly greater for container-based production (26.1–34.7 Mg ha−1 year−1) compared with field cultivation (2.3–6.6 Mg ha−1 year−1) [23]. The use of peat contributed 33.8 to 52.4 kg CO2 eq/m2/year in six different ornamental nurseries in Italy. The reduction of GHG emissions could be achieved by applying alternative compost materials to reduce peat usage [23]. Using peat as a potting substrate resulted in >50% of the total input emissions (kg CO2 eq m−2 year−1) for the container-based cultivation of Quercus fellus, Wisteria floribunda, Nandina domestica, Magnolia stellata, Cupressocyparis leylandii, Photinia x fraseri and Pinus pinea plants [24].
Sewage and recycled water were found to be appropriate for Cyperus alternifolius, Euonymus japonicus, and Cordyline terminalis irrigation providing increased Fe, Cu, and Pb content in roots and leaves [52]. Using recycled water in other water-demanding ornamental plants might minimize environmental inputs. For example, irrigation had a high contribution in CO2 production at the seedling and liner stages of Cercis canadensis cultivation [24]. Irrigation of Euphorbia pulcherrima, Pelargonium x hortorum, and Cyclamen persicum had an increased contribution in GWP [53].

3.5. Integrated Pest and Disease Management (IPDM)

Pesticide residue levels on commercially grown cut flowers such as roses, gerberas, and chrysanthemums highly concern authorities and consumers in the EU. In a study conducted in Belgium, 107 active ingredients were detected on harvested rose, gerbera, and chrysanthemum bunches [54]. Among them, roses were the most contaminated flowers with 14 distinct substances detected per sample and a total concentration of 26 mg kg−1 for a single rose sample. Substances such as acephate, methiocarb, monocrotophos, methomyl, deltamethrin, etc. could generate direct toxic effects to the nervous system of florists and consumers [54].
Decision analysis for the best possible disease management scenario to ornamental plant nurseries in Germany were carried out by Ruett et al. [55]. They found that a reduction of fungicide use without substantial monitoring in the nurseries may result in >76% of product losses. Intensified plant monitoring may benefit production by up to 68% by allowing earlier detection of the diseases and more precise application [55].
In the past 50 years, research on the biological control of pests and diseases has shown that within the complex host–pathogen, host–pest interactions, biological agents may provide alternative solutions for IPDM [56,57,58]. Host–pathogen interactions include antibiosis, antagonism for space and nutrients, induction of the host’s defense responses, and many more [58,59,60]. Microbes that provide antagonism may restrict plant pathogens by up to 100% in vitro. However, application in vivo is more complex and rarely ends up with complete protection against pathogens. This was associated with the environment conditions, which significantly affect both the pathogen and the biological agent. In addition, abiotic elicitor treatments such as acibenzolar-S-methyl (ASM), methyl jasmonate (MeJA), and ultraviolet-C (UV-C) irradiation, as alternatives to fungicides, have been used to induce defense responses in cut flower and pot plant cultivation [58,61].

3.6. Cultivation of Climate-Adopted or Native Ornamental Species

How exactly are native or climate-adopted plants associated with sustainability? In most cases, wild plants can be adopted and successfully cultivated in diverse environments under extreme conditions with minimum energy, water, agrochemical, and nutrient requirements. There are several examples to indicate that using wild species as new ornamental products has been successful [62,63,64,65,66,67]. For example, there is the paradigm of the native South African ornamental species that have been commercially popular worldwide. Freesia, gerbera, gladiolus, protea, nerine, leucadendron, zanthedeschia, agapanthus, strelitzia, kalanchoe, and ornithogalum are some of the most recognized ornamental pot plants and cut flowers sold in the Dutch auctions [66]. Several species native to the Australian continent have been cultivated in different parts of the world with success [65]. Production involved a wide range of native species dominated by the waxflower (Chamelaucium uncinatum), the kangaroo paw (Anigozanthos spp.), the thryptomene (Thryptomene spp.), the acacia (Acacia sp.), and the eucalyptus (Eucalyptus sp.) [68,69]. At least 64 other countries produce endemic Australian cut flowers with the major ones being Israel, the USA (California), South Africa, Ecuador, and Colombia. Wild plants originating from the Mediterranean region have shown great potential for use as ornamental plants in gardens or as cut flowers [64,67,70,71,72,73]. The Mediterranean region is one of the most important spots for plant diversity with over 10% of the world’s species (approximately 25,000) and about half of them being native [67]. There is a big list of potential Mediterranean plants suitable for cut flower and pot-plant production [67]. However, special attention must be given to the introduction of wild species to the commercial floriculture chain [70,71]. Wild species should meet specific criteria of quality. The most important are the propagation and cultivation potential (e.g., regulation of growing and flowering), their ornamental characteristics, and their postharvest life (for cut flowers). Considering sustainability issues, the LCA of ornamental pot plants and cut flowers has shown that wild species and specialty cut flowers differ considerably to traditionally grown commercial ornamental plants such as poinsettias, phalaenopsis, and cut roses [18]. For example, the CO2 footprint at cultivation of phalaenopsis, roses, and poinsettia grown in the Netherlands ranged from 17 to 41 kg CO2 eq/kg of product [16]. On the contrary, cultivating spring and summer cut flowers in Austria had a significantly lower CO2 contribution (e.g., >0.2 kg CO2 eq/kg) [18]. Therefore, sustainability may be achieved via the commercialization of wild, native, or specialty ornamental crops.

3.7. Sustainability within the Handling and Transport Chain

Handling and transportation can sometimes contribute significantly to GHG emissions and GWP. Within different floricultural products (e.g., cut flowers, pot plants, landscape plants), package, handling and transportation differs dramatically. For example, cut flowers and foliage are sleeve- or carton-packaged, held in cold rooms, and transported by land or by air to markets around the world. Pot plants sometimes acquire sleeve packages, no cold rooms, and are mainly transported by land. Landscape plants are not packaged; they are maintained in garden centers for longer periods and are transported by land. The transportation and transplant of landscape plants is a process that significantly contributes to their total GWP when entering the “use” phase (i.e., transplanted to their final site) [29]. The air transportation of cut roses from Colombia to possible markets contributed 84.4% of the total energy used [17]. However, air transportation from Kenya or Ethiopia to England or the Netherlands had a minimum contribution to the total GWP [13,21]. Within the cut flower and cut foliage handling chain, auctions in the Netherlands play a key role in worldwide distribution. FloraHolland auctions in the Netherlands have established a Floriculture Sustainability Initiative (FSI) to help in achieving lower environmental footprints within the sector by applying policy engagements to internal processes, facilities, and employees [73]. A specialized department and an advisory board have been formed to implement these sustainability policies and monitor their impact.

3.8. Sustainability Perception of Growers, Sellers, and Consumers

In the past 20 years, consumers’ perception on sustainable floricultural products has enhanced. This attitude forces growers and sellers to shift to sustainable ornamental production under strict eco-friendly protocols. Growers and sellers may perceive these changes as the development of new, innovative products for the markets. Based on the results of recent surveys, consumers were willing to pay more (≈15% more) for sustainable floricultural products, although clear and precise labeling was necessary for discrimination [74,75,76]. Evaluating the sustainability and the quality criteria for German consumers, it was indicated that both cut rose quality parameters such as blossom uniformity and flower scent were as important as sustainable practices (e.g., choice of packaging) [76]. With so many different types of labeling, consumers might be misled and lose trust in firms and products. By realizing that, growers may turn to sustainable production but need appropriate guidance and training [77]. Examples of sustainable practices include but are not limited to recycling irrigation water and plastic, implementing biological control for pest and diseases, using alternative energy sources and cultivation substrates, supporting local production, etc.

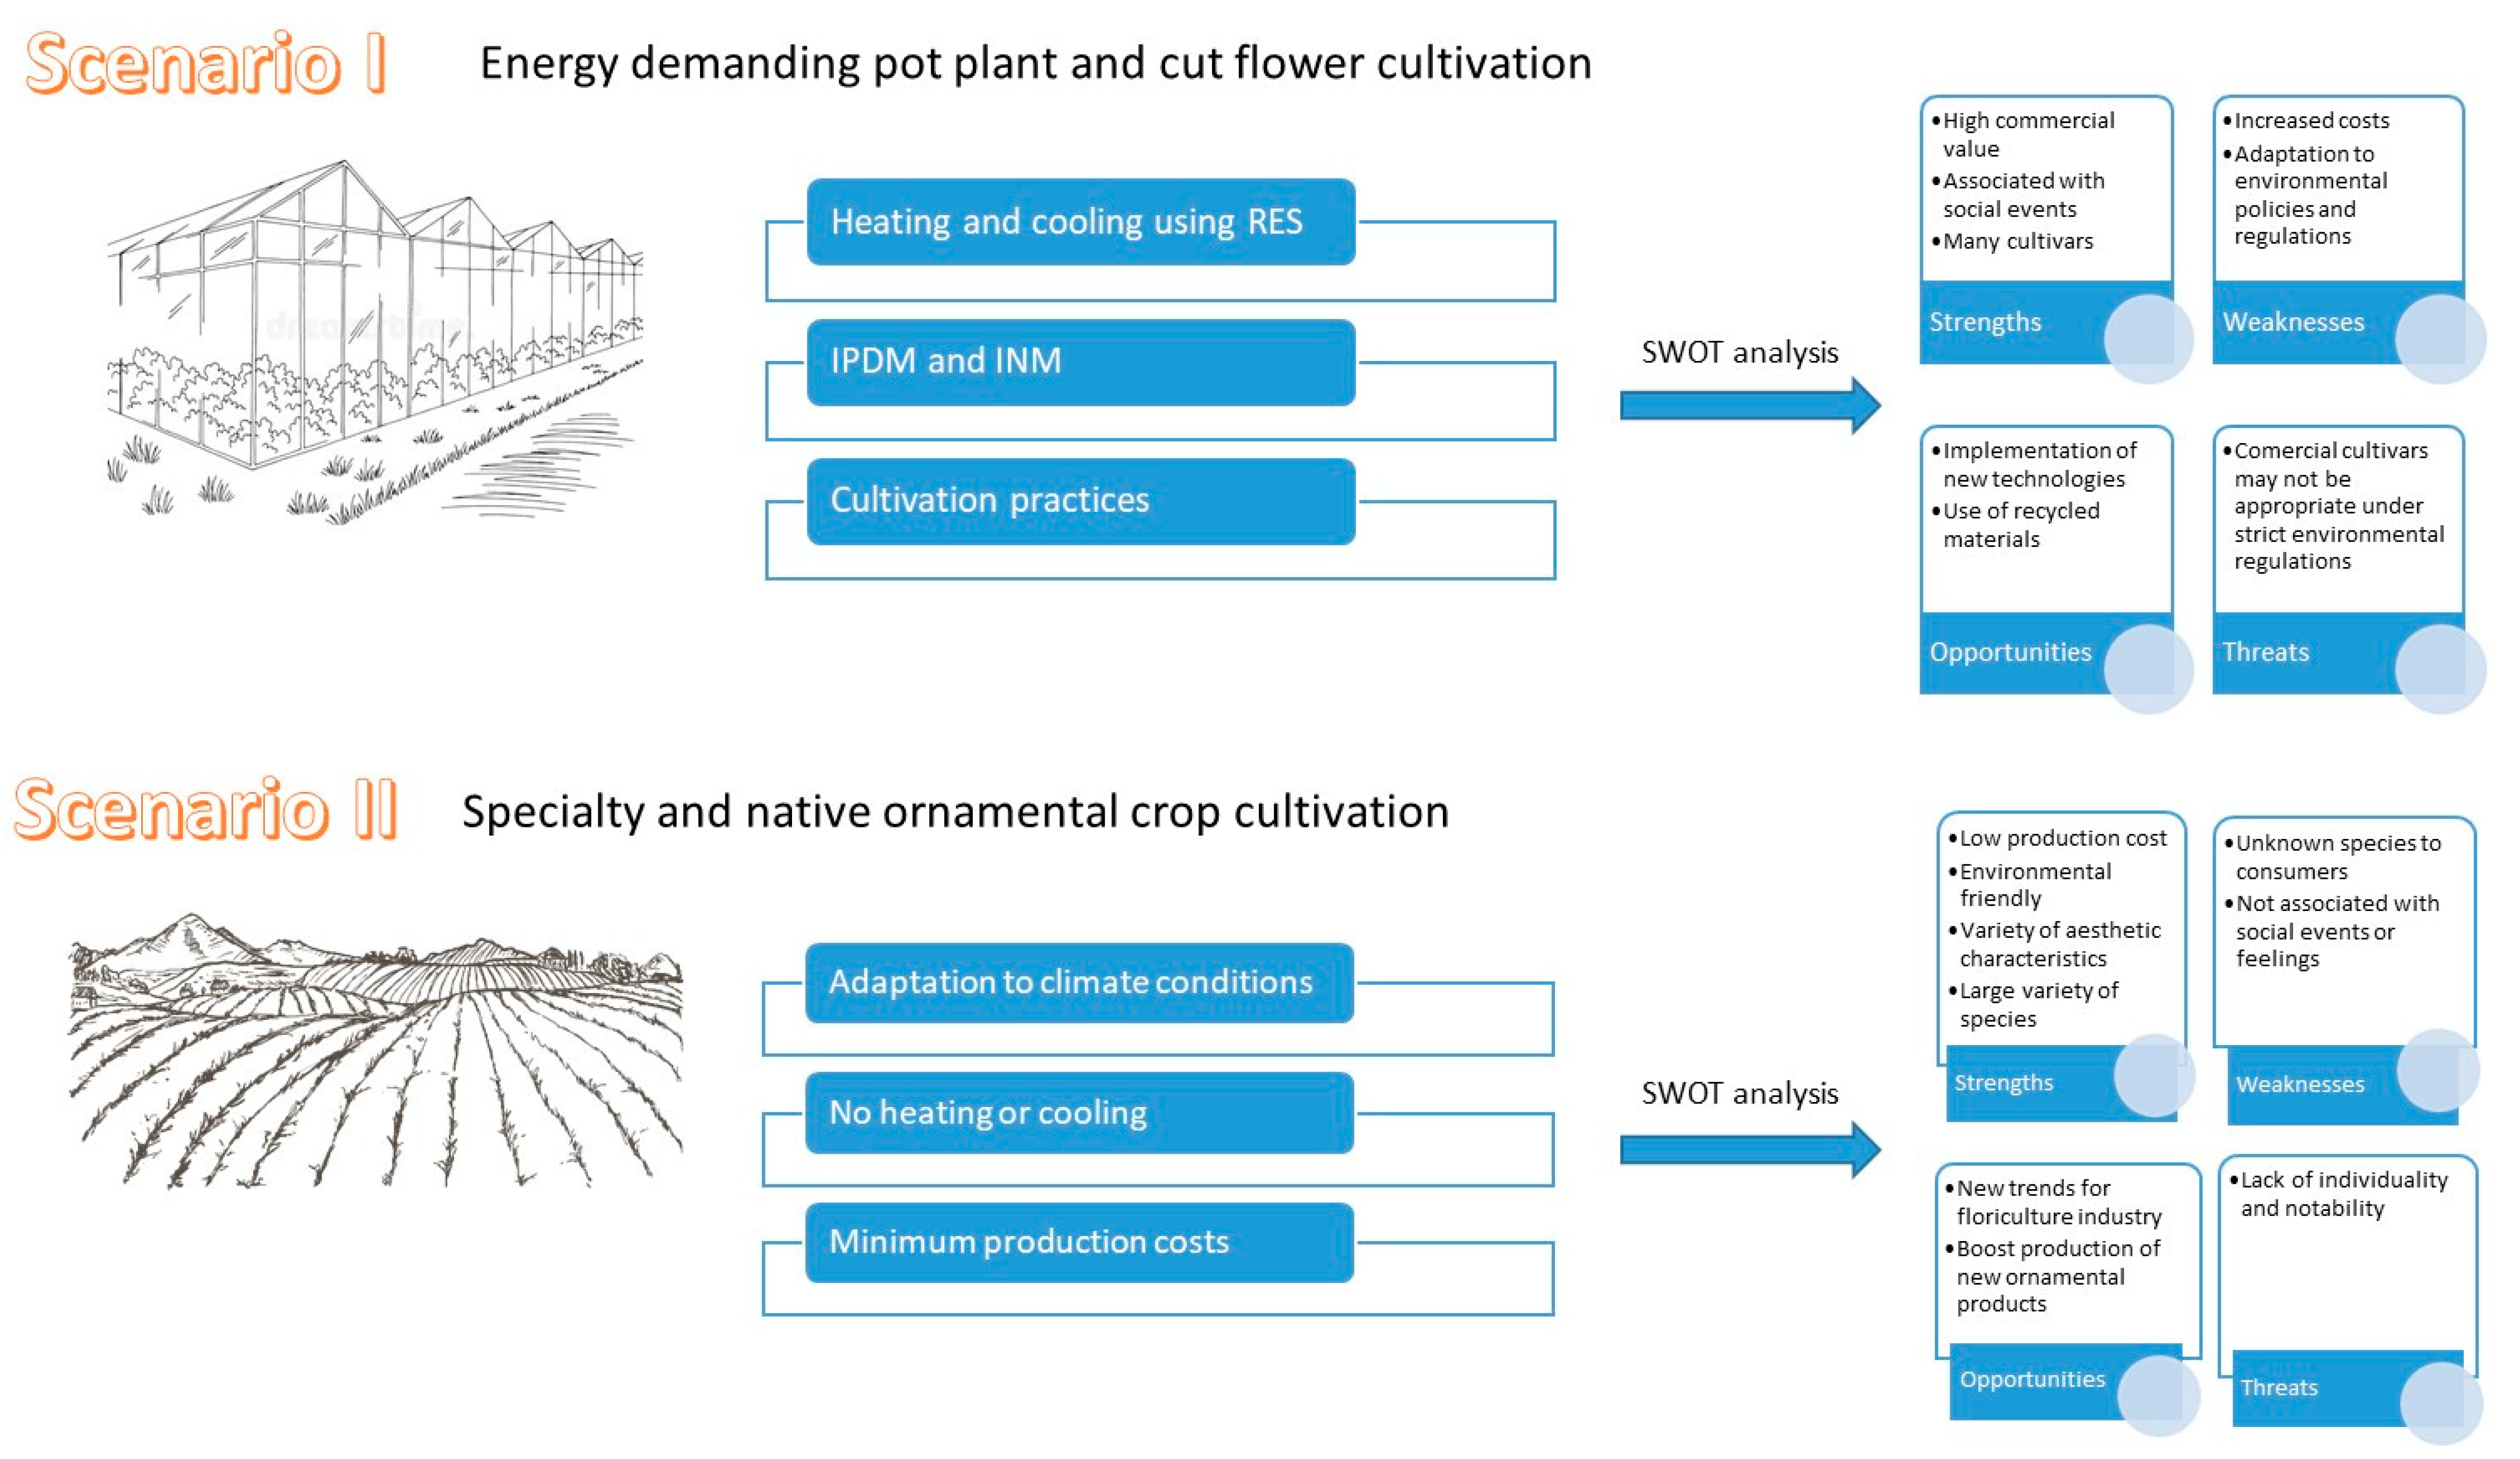
4. Implications for Sustainable Production—Two Possible Scenarios

Data provided by recent research have shown that effective management via the implementation of LCA can aid the sustainable production of floricultural products. Figure 3 shows two possible scenarios to achieve low CO2 footprint and GHG emissions adopting an eco-friendly approach. The first scenario describes a production model for the traditionally grown, commercial but energy-demanding ornamental plants such as roses, poinsettias, and phalaenopsis. The second scenario represents an alternative model of native or specialty ornamental crops cultivated at lower energy demands and, as a result, at lower CO2 footprints. For products such as roses, phalaenopsis, and other tropical indoor plant species, the use of RES, IPDM, and INM is necessary to minimize CO2 footprints. However, increased costs in production in the northern European countries remains an issue [12]. A basic SWOT (strengths, weaknesses, opportunities and threats) analysis indicates the major advantages in cultivating these best-selling ornamental plants (Figure 3). On the other hand, the native plants may provide alternative solutions to producers with new, low-cost products, which can implicate the rise of new trends in the floriculture industry (Figure 3). However, more work needs to be done on the marketing and promotion of these new products to be attractive for consumers [8]. Furthermore, combined practices may offer alternative choices to growers and sellers by adopting environmentally friendly policies from both scenarios to their production systems.

5. Concluding Remarks

This was the first attempt to present a critical review on the factors affecting the sustainable production of ornamental plants and cut flowers. New, strict regulations are applied to the global agricultural systems forcing the floriculture industry to adopt eco-friendly practices. The implementation of LCA will help growers and managers reduce environmental impact and production costs. Analysis of the LCA will lead to the development of appropriate protocols and methodologies to achieve the production of eco-friendly floricultural products.

Funding

This research received no external funding.

Conflicts of Interest

The authors declare no conflict of interest.

Abbreviations

LCA
USDA
life cycle assessment
US department of Agriculture
ADabiotic depletion
AAair acidification
EUeutrophication
GWglobal warming
GWPglobal warming potential
POphotochemical oxidation
GHGgreenhouse gas
ODozone depletion
HThuman toxicity
FAETfreshwater aquatic ecotoxicity
MAETmarine ecotoxicity
TEterrestrial ecotoxicity
RESrenewable energy sources
CCclimate change
INMintegrated nutrient management
IPDMintegrated pest and disease management
TES:thermal energy storage
MPSMilieu Programma Sierteelt
OWColive waste compost
ASMAcibenzolar-S-methyl
MeJA
UV-C
methyl jasmonate
ultraviolet-C
SWOTstrengths–weaknesses–opportunities–threats

References

  1. Eurostat. Horticultural Products. Flowers and Ornamental Plants. Statistics 2006–2016; Eurostat: Luxembourg, 2017. [Google Scholar]
  2. USDA. Floriculture Crops 2015 Summary; USDA National Agricultural Statistics Service: Washington, DC, USA, 2016.
  3. Eurostat. Horticultural Products. Flowers and Ornamental Plants. Statistics 2017; Eurostat: Luxembourg, 2018. [Google Scholar]
  4. Xia, Y.; Deng, X.; Zhou, P.; Shima, K.; Da Silva, J.T. The world floriculture industry: Dynamics of production and markets. Flor. Ornam. Plant Biotech. 2006, 4, 336–347. [Google Scholar]
  5. Zhao, S.; Yue, C.; Meyer, M.H.; Hall, C.R. Factors affecting US consumer expenditures of fresh flowers and potted plants. HortTechnology 2016, 26, 484–492. [Google Scholar] [CrossRef] [Green Version]
  6. Loyola, C.E.; Dole, J.M.; Dunning, R. North American Specialty Cut Flower Production and Postharvest Survey. HortTechnology 2019, 1, 1–22. [Google Scholar] [CrossRef] [Green Version]
  7. Royal Floraholland Annual Report. 2019. Available online: www.floraholland.com (accessed on 5 May 2020).
  8. Royal Floraholland Annual Report. 2017. Available online: www.floraholland.com (accessed on 5 May 2020).
  9. Ingram, D.L.; Hall, C.R.; Knight, J. Understanding carbon footprint in production and use of landscape plants. HortTechnology 2019, 29, 6–10. [Google Scholar] [CrossRef] [Green Version]
  10. Ingram, D.L.; Fernandez, R.T. Life cycle assessment: A tool for determining the environmental impact of horticultural crop production. HortTechnology 2012, 22, 275–279. [Google Scholar] [CrossRef] [Green Version]
  11. Abeliotis, K.; Barla, S.A.; Detsis, V.; Malindretos, G. Life cycle assessment of carnation production in Greece. J. Clean. Prod. 2016, 112, 32–38. [Google Scholar] [CrossRef]
  12. Torrellas, M.; Antón, A.; Ruijs, M.; Victoria, N.G.; Stanghellini, C.; Montero, J.I. Environmental and economic assessment of protected crops in four European scenarios. J. Clean. Prod. 2012, 28, 45–55. [Google Scholar] [CrossRef]
  13. Sahle, A.; Potting, J. Environmental life cycle assessment of Ethiopian rose cultivation. Sci. Total Environ. 2013, 443, 163–172. [Google Scholar] [CrossRef]
  14. Franze, J.; Ciroth, A. A comparison of cut roses from Ecuador and the Netherlands. Int. J. Life Cycle Assessm. 2011, 16, 366–379. [Google Scholar] [CrossRef]
  15. Russo, G.; Buttol, P.; Tarantini, M. LCA (Life Cycle Assessment) of roses and cyclamens in greenhouse cultivation. Acta Hortic. 2008, 801, 359–366. [Google Scholar] [CrossRef]
  16. Blonk, H.; Kool, A.; Luske, B.; Ponsioen, T.; Scholten, J. Methodology for Assessing Carbon Footprints of Horticultural Products; Blonk Milieu Advies: Gouda, The Netherlands, 2010. [Google Scholar]
  17. Parrado, C.A.; Bojacá, C.R.; Schrevens, E. Exploring more sustainable technological alternatives for the greenhouse cut flowers industry in Colombia. Acta Hortic. 2011, 893, 1125–1132. [Google Scholar] [CrossRef]
  18. Wandl, M.T.; Haberl, H. Greenhouse gas emissions of small scale ornamental plant production in Austria—A case study. J. Clean. Prod. 2017, 141, 1123–1133. [Google Scholar] [CrossRef]
  19. Ingram, D.L.; Hall, C.R.; Knight, J. Global warming potential, variable costs, and water use of a model greenhouse production system for 11.4-cm annual plants using life cycle assessment. HortScience 2018, 53, 441–444. [Google Scholar] [CrossRef] [Green Version]
  20. Ingram, D.L.; Hall, C.R.; Knight, J. Analysis of production system components of container-grown chrysanthemum for their impact on carbon footprint and variable costs using life cycle assessment. HortScience 2018, 53, 1139–1142. [Google Scholar] [CrossRef] [Green Version]
  21. Soode, E.; Weber-Blaschke, G.; Richter, K. Comparison of product carbon footprint standards with a case study on poinsettia (Euphorbia pulcherrima). Int. J. Life Cycle Assess. 2013, 18, 1280–1290. [Google Scholar] [CrossRef]
  22. Ingram, D.L.; Hall, C.R. Carbon footprint and related production costs of system components of a field-grown Cercis canadensis L. ‘Forest Pansy’ using life cycle assessment. J. Environ. Hort. 2013, 31, 169–176. [Google Scholar] [CrossRef]
  23. Lazzerini, G.; Lucchetti, S.; Nicese, F.P. Analysis of greenhouse gas emissions from ornamental plant production: A nursery level approach. Urban For. Urban Green. 2014, 13, 517–525. [Google Scholar] [CrossRef]
  24. Lazzerini, G.; Lucchetti, S.; Nicese, F.P. Green House Gases (GHG) emissions from the ornamental plant nursery industry: A Life Cycle Assessment (LCA) approach in a nursery district in central Italy. J. Clean. Prod. 2016, 112, 4022–4030. [Google Scholar] [CrossRef]
  25. Ingram, D.L.; Hall, C.R. Carbon footprint and related production costs of system components for a field-grown Viburnum× juddi using life cycle assessment. J. Env. Hort. 2014, 32, 175–181. [Google Scholar]
  26. Ingram, D.L. Life cycle assessment to study the carbon footprint of system components for Colorado blue spruce field production and use. J. Am. Soc. Hort. Sci. 2013, 138, 3–11. [Google Scholar] [CrossRef] [Green Version]
  27. Hall, C.R.; Ingram, D.L. Carbon footprint and production costs associated with varying the intensity of production practices during field-grown shrub production. HortScience 2015, 50, 402–407. [Google Scholar] [CrossRef] [Green Version]
  28. Ingram, D.L.; Hall, C.R. Comparison of carbon footprint and variable costs of selected nursery production systems for a 5-cm-caliper red maple. HortScience 2016, 51, 383–387. [Google Scholar] [CrossRef] [Green Version]
  29. Ingram, D.L. Life cycle assessment of a field-grown red maple tree to estimate its carbon footprint components. Int. J. Life Cycle Assessm. 2012, 17, 453–462. [Google Scholar] [CrossRef]
  30. Riisgaard, L. How the Market for Standards Shapes Competition in the Market for Goods: Sustainability Standards in the Cut Flower Industry. 2009. DIIS Working Paper. Available online: https://www.econstor.eu/handle/10419/44693 (accessed on 13 July 2020).
  31. Gruda, N.; Bisbis, M.; Tanny, J. Influence of climate change on protected cultivation: Impacts and sustainable adaptation strategies–A review. J. Clean. Prod. 2019, 225, 481–495. [Google Scholar] [CrossRef]
  32. Raza, A.; Ashraf, F.; Zou, X.; Zhang, X.; Tosif, H. Plant Adaptation and Tolerance to Environmental Stresses: Mechanisms and Perspectives. In Plant Ecophysiology and Adaptation under Climate Change: Mechanisms and Perspectives I; Springer: Singapore, 2020; pp. 117–145. [Google Scholar]
  33. Corner, D. Positioning the Queensland Cut Flower Industry to Strategically Respond to the Impact of Climate Change. 2011. Available online: https://knowledge.flowersmagazine.com.au/wp-content/uploads/2018/11/pdf_file_3632.pdf (accessed on 22 June 2020).
  34. Surówka, E.; Rapacz, M.; Janowiak, F. Climate Change Influences the Interactive Effects of Simultaneous Impact of Abiotic and Biotic Stresses on Plants. In Plant Ecophysiology and Adaptation under Climate Change: Mechanisms and Perspectives I; Springer: Singapore, 2020; pp. 1–50. [Google Scholar]
  35. Niu, G.; Rodriguez, D.S.; Wang, Y.T. Impact of drought and temperature on growth and leaf gas exchange of six bedding plant species under greenhouse conditions. HortScience 2006, 41, 1408–1411. [Google Scholar] [CrossRef]
  36. Vaid, T.M.; Runkle, E.S. Developing flowering rate models in response to mean temperature for common annual ornamental crops. Sci. Hort. 2013, 161, 15–23. [Google Scholar] [CrossRef]
  37. Hicklenton, P.R.; Newman, S.M.; Davies, L.J. Night temperature, photosynthetic photon flux, and long days affect Gypsophila paniculata flowering. HortScience 1993, 28, 888–890. [Google Scholar] [CrossRef] [Green Version]
  38. Warner, R.M.; Erwin, J.E. Prolonged high temperature exposure and daily light integral impact growth and flowering of five herbaceous ornamental species. J. Amer. Soc. Hort. Sci. 2005, 130, 319–325. [Google Scholar] [CrossRef]
  39. Blanchard, M.G.; Runkle, E.S. Quantifying the thermal flowering rates of eighteen species of annual bedding plants. Sci. Hort. 2011, 128, 30–37. [Google Scholar] [CrossRef]
  40. Hegde, S.; Umekawa, Y.; Watanabe, E.; Kasajima, I. High-Temperature Tolerance of Flowers. In Plant Ecophysiology and Adaptation under Climate Change: Mechanisms and Perspectives I; Springer: Singapore, 2020; pp. 343–371. [Google Scholar]
  41. Tubby, K.V.; Webber, J.F. Pests and diseases threatening urban trees under a changing climate. For. Int. J. For. Res. 2010, 83, 451–459. [Google Scholar] [CrossRef] [Green Version]
  42. Khanna, K.; Kapoor, D.; Sharma, P.; Bakshi, P.; Sharma, P.; Saini, P.; Ohri, P.; Mir, B.A.; Kaur, R.; Bhardwaj, R. Plant-Microbe Interactions under Adverse Environment. In Plant Ecophysiology and Adaptation under Climate Change: Mechanisms and Perspectives I; Springer: Singapore, 2020; pp. 717–751. [Google Scholar]
  43. Bisaglia, C.; Cutini, M.; Romano, E.; Fedrizzi, M.; Menesatti, P.; Santoro, G.; Frangi, P.; Minuto, G.; Tinivella, F.; Miccolis, V.; et al. Trends and perspectives for the optimal use of energy in ornamental plant production and distribution in Italy. Acta Hortic. 2008, 801, 795–802. [Google Scholar] [CrossRef]
  44. Vadiee, A.; Martin, V. Energy management in horticultural applications through the closed greenhouse concept, state of the art. Renew. Sustain. Energy Rev. 2012, 16, 5087–5100. [Google Scholar] [CrossRef]
  45. Mugnozza, G.S.; Russo, G.; De Lucia Zeller, B. LCA methodology application in flower protected cultivation. Acta Hortic. 2007, 761, 625–632. [Google Scholar] [CrossRef]
  46. Russo, G.; Scarascia Mugnozza, G.; De Lucia Zeller, B. Environmental improvements of greenhouse flower cultivation by means of LCA methodology. Acta Hortic. 2008, 801, 301–308. [Google Scholar] [CrossRef]
  47. Papafotiou, M.; Phsyhalou, M.; Kargas, G.; Chatzipavlidis, I.; Chronopoulos, J. Olive-mill wastes compost as growing medium component for the production of poinsettia. Sci. Hort. 2004, 102, 167–175. [Google Scholar] [CrossRef]
  48. Papafotiou, M.; Kargas, G.; Lytra, I. Olive-mill waste compost as a growth medium component for foliage potted plants. HortScience 2005, 40, 1746–1750. [Google Scholar] [CrossRef] [Green Version]
  49. Grigatti, M.; Giorgioni, M.E.; Ciavatta, C. Compost-based growing media: Influence on growth and nutrient use of bedding plants. Biores. Technol. 2007, 98, 3526–3534. [Google Scholar] [CrossRef]
  50. Tzavara, S.; Darras, A.; Assimakopoulou, A. Tobacco dust waste as an alternative medium to grow geranium (Pelargonium x hortorum) plants. Adv. Hort. Sci. 2019, 33, 295–298. [Google Scholar]
  51. Papafotiou, M.; Chronopoulos, J.; Kargas, G.; Voreakou, M.; Leodaritis, N.; Lagogiani, O.; Gazi, S. Cotton gin trash compost and rice hulls as growing medium components for ornamentals. J. Hort. Sci. Biotech. 2001, 76, 431–435. [Google Scholar] [CrossRef]
  52. Younis, A.; Riaz, A.; Mushtaq, N.; Tahir, Z.; Siddique, M.I. Evaluation of the suitability of sewage and recycled water for irrigation of ornamental plants. Commun. Soil Sci. Plant Anal. 2015, 46, 62–79. [Google Scholar] [CrossRef]
  53. Bonaguro, J.E.; Coletto, L.; Samuele, B.; Zanin, G.; Sambo, P. Environmental impact in floriculture: LCA approach at farm level. Acta Hortic. 2016, 1112, 419–424. [Google Scholar] [CrossRef]
  54. Toumi, K.; Vleminckx, C.; van Loco, J.; Schiffers, B. Pesticide residues on three cut flower species and potential exposure of florists in Belgium. Int. J. Environ. Res. Pub. Health 2016, 13, 943. [Google Scholar] [CrossRef] [Green Version]
  55. Ruett, M.; Whitney, C.; Luedeling, E. Model-based evaluation of management options in ornamental plant nurseries. J. Clean. Prod. 2020, 12, 26–53. [Google Scholar] [CrossRef]
  56. Gardener, B.B.M.; Fravel, D.R. Biological control of plant pathogens: Research, commercialization and application in the USA. Plant Health Prog. 2002, 10, 1094. [Google Scholar] [CrossRef] [Green Version]
  57. Thacker, J.R. An Introduction to Arthropod Pest Control; Cambridge University Press: Cambridge, UK, 2002. [Google Scholar]
  58. Darras, A.I. Postharvest Disease Management. In Handbook of Florists’ Crop Diseases (HFCD); McGovern, R., Elmer, W., Eds.; Springer Publishing: New York, NY, USA, 2018. [Google Scholar]
  59. Cook, R.J. Making greater use of introduced microorganisms for biological control of plant pathogens. Annu. Rev. Phytopathol. 1993, 31, 53–80. [Google Scholar] [CrossRef]
  60. Pal, K.K.; Gardener, B.M. Biological control of plant pathogens. Plant Health Instr. 2006. [Google Scholar] [CrossRef] [Green Version]
  61. Darras, A.Ι. Novel elicitors induce defence responses in cut flowers. In Plant Pathology; Cumagan, C.J.R., Ed.; InTech Publishing: Rijeka, Croatia, 2012. [Google Scholar]
  62. Weiss, D. Introduction of new cut flowers: Domestication of new species and introduction of new traits not found in commercial varieties. In Breeding for Ornamentals: Classical and Molecular Approaches; Springer: Dordrecht, The Netherlands, 2002; pp. 129–137. [Google Scholar]
  63. Heywood, V. Conservation and sustainable use of wild species as sources of new ornamentals. Acta Hortic. 2003, 598, 43–53. [Google Scholar] [CrossRef]
  64. Maloupa, E.; Grigoriadou, K.; Zervaki, D.; Papanastassi, K. Management of the Balkan native flora for sustainable floricultural commercial use. Acta Hortic. 2005, 683, 189–196. [Google Scholar] [CrossRef]
  65. Johnston, M.E.; Joyce, D. The centre for native floriculture: Progress and opportunities. Acta Hortic. 2009, 813, 279–284. [Google Scholar] [CrossRef]
  66. Reinten, E.; van Wyk, B.E. Floriculture industry benefits from southern African floral biodiversity. Acta Hortic. 2018, 1201, 659–664. [Google Scholar] [CrossRef]
  67. De Pascale, S.; Romano, D. Potential use of wild plants in floriculture. Acta Hortic. 2019, 1240, 87–98. [Google Scholar] [CrossRef]
  68. Ratnayake, K.; Joyce, D. Native Australian Acacias: Unrealised ornamental potential. Chron. Hortic. 2010, 50, 19–22. [Google Scholar]
  69. Cunningham, A.B.; Garnett, S.T.; Gorman, J. Policy lessons from practice: Australian bush products for commercial markets. GeoJournal 2009, 74, 429. [Google Scholar] [CrossRef]
  70. Halevy, A.H. Introduction of native Israeli plants as new cut flowers. Acta Hortic. 2000, 541, 79–82. [Google Scholar] [CrossRef]
  71. Chimonidou, D.; Vlahos, J.C.; Odysseos, M.; Georgiou, K.; Della, A. Evaluation of species from Cyprus flora for sustainable use in commercial floriculture. Acta Hortic. 2005, 683, 111–120. [Google Scholar] [CrossRef] [Green Version]
  72. Darras, A.I.; Kargakou, V. Postharvest physiology and handling of cut Spartium junceum inflorescences. Sci. Hort. 2019, 252, 130–137. [Google Scholar] [CrossRef]
  73. Royal Flora Holland. Facts and Figures. Available online: www.floraholland.com (accessed on 22 June 2020).
  74. Behe, B.K.; Campbell, B.L.; Hall, C.R.; Khachatryan, H.; Dennis, J.H.; Yue, C. Consumer preferences for local and sustainable plant production characteristics. HortScience 2013, 48, 200–208. [Google Scholar] [CrossRef] [Green Version]
  75. Campbell, B.; Khachatryan, H.; Behe, B.; Dennis, J.; Hall, C. Consumer perceptions of eco-friendly and sustainable terms. Agric. Res. Econ. Rev. 2015, 44, 21–34. [Google Scholar] [CrossRef]
  76. Berki-Kiss, D.; Menrad, K. Consumer preferences of sustainability labeled cut roses in Germany. Sustainability 2019, 11, 3358. [Google Scholar] [CrossRef] [Green Version]
  77. Dennis, J.H.; Lopez, R.G.; Behe, B.K.; Hall, C.R.; Yue, C.; Campbell, B.L. Sustainable production practices adopted by greenhouse and nursery plant growers. HortScience 2010, 45, 1232–1237. [Google Scholar] [CrossRef] [Green Version]
Publisher’s Note: MDPI stays neutral with regard to jurisdictional claims in published maps and institutional affiliations.
Figure 1. Review structure showing the implementation of life cycle assessment (LCA) to floricultural products (i.e., cut flowers, pot-plants, and landscape plants). LCA aids the application of appropriate adjustments to achieve sustainability, low CO2 footprint, and low cost.
Agronomy 10 01570 g001
Figure 2. Sustainability flow chart from grower to consumer. Implementation of legislation and the role of life cycle assessment (LCA) on the reduction of environmental inputs and production costs. Numbers (1–3) are steps of the production chain. ±: positive or negative impact/effect and ↑↓: increase or decrease levels.
Agronomy 10 01570 g002
Figure 3. Two possible scenarios for low CO2 footprint production of floricultural products based on adopting alternative energy sources, integrated pest and disease management (IPDM) and integrated nutrient management (INM) (Scenario 1) or implementing the “least energy demanding” cultivation of native plants (Scenario 2). SWOT analysis presents the strengths, the weaknesses, the opportunities, and the threats of both scenarios.
Agronomy 10 01570 g003
Table 1. CO2 outputs (kg CO2 eq kg−1) and contribution to CO2 output (%) for different cultivation procedures (i.e., protected or field cultivation) applied to floricultural products (i.e., cut flowers, pot-plants, landscape plants). Contributions were calculated based on processes (heating, cooling, packing, transport, planting) and materials (propagation materials, growing substrates, packing materials, irrigation materials, fertilizers, pesticides) used in the production and supply chain.
Type of Cultivation or Process *CO2 Output (kg CO2 eq kg−1)Contribution to CO2 Output (%)
>20%5–20%<5%
Protected, heated with air transport3–32Energy use in the greenhouse; Peat substrate; Air transportSubstrate materials; Packaging materials; Transport; Cooling and storage; Propagating materialPesticides; Fertilizers
Protected, heated without air transport1–32Energy use in the greenhouse; Peat substrateSubstrate materials (non-peat); packing materials; Transport; cooling and storage; Propagation materialPesticides; Fertilizers
Field with land transport0.1–27Substrate materials (peat and non-peat); Transport; Propagation materialPesticides; FertilizersLiner; irrigation; Preparation and planting
Protected, unheated in soil, with air transport0.1–2.5Peat substrate; Propagation material; Air transport;Packaging; Energy use on farm; Transport; Cooling and storagePesticides; Fertilizers
Protected, unheated in soil, without air transport0.2–2.5Cooling and storage; Peat substrate; Packaging materials; Energy; Transport; Propagation materials; Pesticides; Fertilizers
Field, without air transport, processed0.1–0.3Transport; Energy use on farmPackaging materials; Cooling and storage; Pesticides; Fertilizers
* Protected (greenhouse) or field cultivation of pot-plants, cut flowers, and landscape plants. Transportation was involved in the cultivation process and included in CO2 contribution.
Table 2. Major input and output categories of LCA contributions in every step of the process from production and delivery to cultivation, postharvest handling, and transportation of cut flowers.
Plant MaterialProduction StageInputsOutputs *
1.
Cut flowers
Production and DeliveryConstruction materials, fertilizers, agrochemicals, substrates, propagation materialsAD, AA, EU, GW, PO
CultivationFuel, electricity, water, fertilizers, agrochemicalsAD, AA, EU, GW, PO
Postharvest HandlingWater, electricity, packaging materialsAD, GW, PO
TransportationFuelAA, GW, PO
2.
Pot-plants
Production and DeliveryConstruction materials, fertilizers, agrochemicals, substrates, propagation materialsAD, AA, EU, GW, PO
CultivationFuel, electricity, water, fertilizers, agrochemicalsAD, AA, EU, GW, PO
Packaging and HandlingPackaging materials, fuelAD, GW, PO
TransportationFuelAA, GW, PO
3.
Landscape plants
Production and deliveryConstruction materials, fertilizers, agrochemicals, growing materials, propagation materialsAD, AA, EU, GW, PO
CultivationElectricity, water, fertilizers, agrochemicalsAD, AA, EU, GW, PO
TransportationFuelAA, GW, PO
* AD: abiotic depletion, AA: air acidification, EU: eutrophication, GW: global warming, PO: photochemical oxidation.
Publisher’s Note: MDPI stays neutral with regard to jurisdictional claims in published maps and institutional affiliations.

