Article

Mixed Cropping as Affected by Phosphorus and Water Supply

by
Bettina Eichler-Löbermann
1,*,
Stefanie Busch
1,
Nicolai David Jablonowski
2,3,
Mareike Kavka
1 and
Christine Brandt
4
1
Agronomy and Crop Science, University of Rostock, Justus-von-Liebig-Weg 6, 18059 Rostock, Germany
2
Institute of Bio- and Geosciences, IBG-2: Plant Sciences, Forschungszentrum Jülich GmbH, 52425 Jülich, Germany
3
Bioeconomy Science Center (BioSC), c/o Forschungszentrum Jülich, 52425 Jülich, Germany
4
Leibniz Institute of Plant Genetics and Crop Plant Research (IPK), Genebank Department, Satellite Collections North, Parkweg 3a, 18190 Gross Luesewitz, Germany
*
Author to whom correspondence should be addressed.
Agronomy 2020, 10(10), 1506; https://doi.org/10.3390/agronomy10101506
Submission received: 18 August 2020 / Revised: 26 September 2020 / Accepted: 29 September 2020 / Published: 3 October 2020
(This article belongs to the Special Issue Bioenergy Crops: Current Status and Future Prospects)

Abstract

:
In a future exposed to threats of climate change, sustainable biomass production will be crucial. Maize (Zea mays) and sorghum (Sorghum sp.) are important crops for human and animal nutrition, as well as for bioenergy. The aim of this study was to investigate maize and sorghum in mixed cropping with soybean (Glycine max) and faba bean (Vicia faba) regarding biomass yield, drought tolerance, phosphorus (P) availability, and enzyme activity in soil as affected by the single and combined effects of water and P supply in two outdoor pot trials with rainout shelters. Maize had the highest biomass under sufficient water supply (80% water holding capacity, WHC), but a sharp decrease of its biomass of about 60% was measured when water was limited (30% WHC). In the mixtures, drought induced reduction of biomass was less than 40%. For mixed cropping usually higher contents of labile P fractions in soil than for sole cropped monocots were found. This was especially true for the combined stress of water and P deficit and can be partly explained by a higher activity of the acid phosphatase in the soil of the mixtures. A higher yield stability of the crop mixtures makes them a suitable agronomic alternative to sole cropped maize or sorghum under suboptimal conditions of water and P shortage.

1. Introduction

In the last two decades, energy crops, like maize, have gained importance for biogas production and their plantations increased steadily in Germany within this time, also supported by continuous governmental subsidies to develop the bio-energy sector [1,2]. However, the extension of agricultural land cropped with maize has also raised some concerns regarding landscape aesthetics [3], negative effects on soil quality [4], and agro-biodiversity [5,6]. Consequently, agronomic measures are needed in order to mitigate negative environmental effects for the cultivation of energy crops. The cultivation of crops in mixtures is one promising approach here [7].
Mixing crop species in the same field is an old agricultural practice but is nowadays often limited either to low-input and labor-intensive cropping systems [8], or to organic farming [9]. The advantages of mixed cropping are mainly related to complementarity and facilitation [10,11], whereas complementarity means the resource use and niche differentiation in space and time, and facilitation refers to better availability of resources. Following this, mixtures of crop species may result in higher abiotic stress resistance due to higher functional diversity, as described by Eisenhauer [12]. Combined cultivation of cereals and legumes is often practiced because of the complementary advantages in nitrogen (N) use and following a lower demand of N fertilizer in the mixtures [6,7]. The positive effects of crop mixtures with legumes was even found for grain yield and N uptake of the following crop within a rotation [13]. However, the legume partner not only provide N for the cereals, but was also often found to be the phosphorus (P) mobilizing partner in cereal–legume mixtures and the cereal crop the beneficiary (one-way facilitation) [10,14,15]. The main processes of biochemical P mobilization of plants are based on the exudation of ions and organic acids for the solubilization of inorganic P and the excretion of phosphatases for the hydrolysis of organic P [10,16,17]. Cropping also affects microbial communities and the microbial part of P mobilization, which is usually higher in mixed cropping systems [18,19].
The efficiency of physiological processes, such as N fixation and P mobilization, are strongly dependent on environmental conditions. Here, drought is the major environmental stress and is considered the most limiting abiotic factor on plant growth [20]. Furthermore, reduced stomatal conductance and restricted transpiration rates decrease nutrient transport from roots to the shoots, and nutrient deficiency is one of the earliest effects of drought stress [21,22]. This particularly affects the less mobile nutrients in the soil such as P [23,24].
According to the stress-gradient hypothesis, the interactions among crops are context-dependent and shift from facilitation to competition as environmental stress decreases [25,26]. Consequently, favorable crop interactions were found to be more relevant under drought conditions [27] and nutrient deficiency [16].
Considering these facts, we postulated that, mainly under stress of water and P shortage, the selected mixtures of monocots and legume crops show advantages regarding biomass production and P nutrition during early growth stages. We further assumed that the monocots could profit from the P solubilizing capabilities of the legumes under combined water and P deficiency. In order to prove these hypotheses, we performed a study, subdivided into two experiments with four crop species, in sole and mixed cropping under semi-controlled conditions in rainout shelters. We included maize (Zea mays L.) and sorghum (Sorghum sp. Moench) as monocot crops in our study because of their importance as energy crops. Soybean (Glycine max (L.) Merr.) and faba bean (Vicia faba L.) were chosen as important legume crops and because of their previously positive description as mixing partners of monocots under water or P deficiency [28,29], but according to our knowledge, both crops have not yet been compared as mixing partners for monocots under combined water and P deficiency. In one experiment, we investigated water supply as experimental factor (Water-Trial). In the second experiment the factor water supply was combined with the factor P supply (Water-P-Trial). Beside the above-ground characteristics, we also considered the content of available P in soil and the activity of enzymes. Here, we considered the phosphatases as enzymes involved in the soil P turnover and the dehydrogenase as an indicator for the intracellular activity of all living microorganisms [30], which is also dependent on agronomic management [31,32].

2. Materials and Methods

2.1. Experimental Design

The study comprises two outdoor pot trials employing rainout shelters in order to test the performance of mixed crops during the early growth under stress conditions. In a first experiment, we combined cropping and water supply as experimental factors (hereinafter referred to as Water-Trial). In the second trial, we added P supply as an additional experimental factor (hereinafter referred to as Water-P-Trial).
Cropping consisted of eight treatments and water and P supply consisted of two treatments each. For all treatments, four replications were established and placed in a randomized design.
The cropping treatments consisted of two monocot species: maize (MA) (Zea mays, Fernandez) and sorghum (SO) (Water-Trial: Sorghum bicolor (L.) Moench x sudanense (Piper) Stapf., Freya; Water-P-Trial: Sorghum bicolor, Zerberus) and two legumes: soybean (SB) (Glycine max, ES Mentor) and faba bean (FB) (Vicia faba, Isabell). Each crop species was cultivated as a sole crop and in mixtures: MA + SB, MA + FB, SO + SB, and SO + FB. In the Water-Trial, four plants per pot were grown, either in sole cropping or two + two plants per pot in mixed cropping (ratio 50:50) which corresponds to a replacement design [33]. In the Water-P-Trial for sole cropping, four plants were also cultivated, but for mixed cropping, the seed density was increased to three + three plants per pot (ratio 75:75), which corresponds to an intermediate design. We introduced the intermediate design in order to realize higher competition regarding the water and P sources [33,34]. Before sowing, the legume seeds were inoculated with symbiotic bacteria (Jost Radicin, Jost GmbH, Germany) in order to promote the fixation of N from the air. The plants were cultivated for eight weeks in Mitscherlich pots and harvested at V2 stadium for maize and sorghum and at R3 stadium for faba bean and soybean.
The soil used for the trials was taken from the A-horizon of a long-term field experiment located in Rostock, Northern Germany [35]. The soil texture was classified as loamy sand and the soil type was a Haplic Luvisol according to the FAO nomenclature. In the Water-Trial the Mitscherlich pots (volume about 8800 cm3) were filled with 6 kg sieved and air dried soil. For the investigation of the effects of P supply in the Water-P-Trial, the soil was mixed with commercial sand (4.5 kg soil plus 1.5 kg sand) in order to reduce the soil P content. Plant available P content in soil (double lactate extractable; Pdl) was about 44 mg kg−1 in the Water-Trial and about 39 mg kg−1 in the Water-P-Trial, indicating a suboptimal P supply according to the German soil P classification. The soil pH value (CaCl2) was 5.6 in the Water-Trial and 6.8 in the Water-P-Trial after mixing with the sand (the pH of the sand was 10.7). Before sowing, soil was mixed with fertilizers according to experiences from previous pot experiments [32,36] with 1 g K as 60’s Kali and 0.2 g S as ammonium sulphate per pot. The Mg content of the soil was high with about 100 mg kg−1 (double lactate extractable) and no extra Mg was added. Nitrogen was supplied as calcium ammonium nitrate in an amount of 0.5 g per pot for the monocot crops (MA, SO), of 0.25 g for the mixed cropping treatments, and of 0.1 g for the sole legume crops (SB, FB). The different N supply was chosen in order to allow for a good development of the legumes in symbiosis with the symbiotic bacteria. In the Water-P-Trial, MA and SO as well as the mixed crops received a second N application after 49 days of the experiment with the same amounts of N as in the first application because of the visible N deficit of the plants. Phosphorus was applied in an amount of 0.2 g P per pot as triple-superphosphate (TSP) to all treatments in the Water-Trial, as well as in the TSP-treatment of the Water-P-Trial, whereas no P was added in the P0-treatment of the Water-P-Trial.
The water holding capacity (WHC) of the soil was determined using a gravimetric method modified after Schinner et al. [37]. Here, air dried soil was weighed, filled in pots, and saturated with distilled water. After a draining period of six hours the soil was weighed again. The two water supply treatments were established at a three-leave stadium of the monocot crops with an optimal water supply at 80% WHC and a drought stress treatment at 30% WHC. Pots were weighed daily in order to calculate the amount of water consumed and then replaced with distilled water. To consider the increasing plant biomass during plant growth, reference pots were established, and the plant biomass was weighed regularly. To reduce the evaporation the soil in the pots was covered with air dried quartz gravel (400 g pot−1) after the germination of the plants. The pots were submitted to natural weather conditions but covered by a rainout shelter in order to keep out rain water. The average temperature during the experimental time from mid-July to the beginning of September was 17.7 °C for the Water-Trial and 18.5 °C for the Water-P-Trial.

2.2. Sampling and Analyses

The plants were cut at 0.5 cm above the soil surface and the dry-matter yield was determined after the plant material was oven-dried at 60 °C until reaching a constancy of weight. For the soil analyses, six soil cores (3 cm diameter) per pot were taken and mixed. One part of the sample was stored in a freezer at −18 °C for the enzyme analyses and the other part was air dried for chemical analyses. The root samples originated from three soil cores (3 cm diameter) per pot, which were taken in a random manner.
The plant material was ground with a plant mill (Fritsch GmbH, Idar-Oberstein, Germany). The P concentration of the shoots was determined after dry ashing, applying the vanadate-molybdate method described by Page et al. [38]. The P concentration was measured using a spectral photometer (Specord 40, Analytik Jena, Germany). The total N content was determined using a CNS analyzer (Vario EL Fa. Foss Heraeus, Hanau, Germany). The P and N uptake of the plants was calculated by multiplying the dry weight of harvested biomass by its P and N concentration. The roots in the three soil cores were washed using several sieves and later dried at 60 °C. For the determination of the root length, the root samples were spread thoroughly and scanned. Using an image analyzing software (Image Analyser, GSA German Software development and Analytics GmbH, Germany) the root length per root sample was measured, followed by calculation of the total root length per pot, considering the soil core volume and the pot volume. Root:shoot ratio was determined by dividing root length (m per pot) by shoot dry mass (g per pot). The root characteristics were measured in the Water-Trial only.
For analyses of the soil P concentration, the soil was air-dried and sieved (2 mm). Water-extractable P (Pw) was quantified by the method of Van der Paauw [39] and the phosphormolybdate-blue method was used to measure the P concentrations in the extracts via flow-injection analysis. The bioavailable P was analyzed by extraction with double lactate (Pdl), which is a standard soil P test in Northern Germany (modified according to Riehm [40]). In brief, 12 g soil was extracted with 150 mL of a solution consisting of calcium lactate (0.4 M C6H10CaO6 × 5 H2O) and hydrochloric acid (0.5 M HCl) at pH 3.6 and shaken overhead for 90 min. The P concentration in the solution was measured after the vanadate-molybdate method [38] with the spectral photometer as given above. Oxalate soluble P (Pox) in soil was measured using the ammonium oxalate method [41]. In brief, 2 g of soil were shaken in 100 mL of acid oxalate solution in the dark. Inductively coupled plasma-optical emission spectroscopy (ICP-OES, Optima 8300, Perkin Elmer, Waltham, MA, USA) was used to quantify the concentrations of P in the extracts. The pH value was determined in 0.01 M CaCl2.
The activities of the acid and alkaline phosphatases (acid Pase and alk Pase) were determined by using p-nitrophenylphosphate [42]. The enzyme activity was measured in µg p-Nitrophenol released from p-Nitrophenylphosphate solution in 1 g soil within 1 h at 37 °C (µg p-Nitrophenol g−1h−1). The activity of dehydrogenase (DH) was measured after Thalmann [43]. One gram soil was extracted in 0.8% triphenyltetrazoliumchloride solution and incubated for 24 h at 37 °C. Triphenyltetrazoliumchloride is reduced to triphenylformazan (TPF) by most microorganisms. TPF was extracted with acetone after incubation and measured photometrically with the spectral photometer as named above. The activity was expressed as 1 g TPF per g soil released within 24 h (1 g TPF g−1 24 h−1).

2.3. Statistical Analyses

Both experiments were evaluated separately. Soil and plant data corresponding to four replications were subjected to multi-factorial analysis of variance (ANOVA) using the general linear model (GLM) of PASW Statistics 22 software (SPSS statistics) to test for significant single and combined effects of the experimental factors (crop, water supply, P supply). The p-values and the eta2 values are provided in the Appendix (Table A1 and Table A2). When the effects of the factors were significant (p ≤ 0.05), Duncan’s multiple range test was used to compare the means within the treatment groups.

3. Results

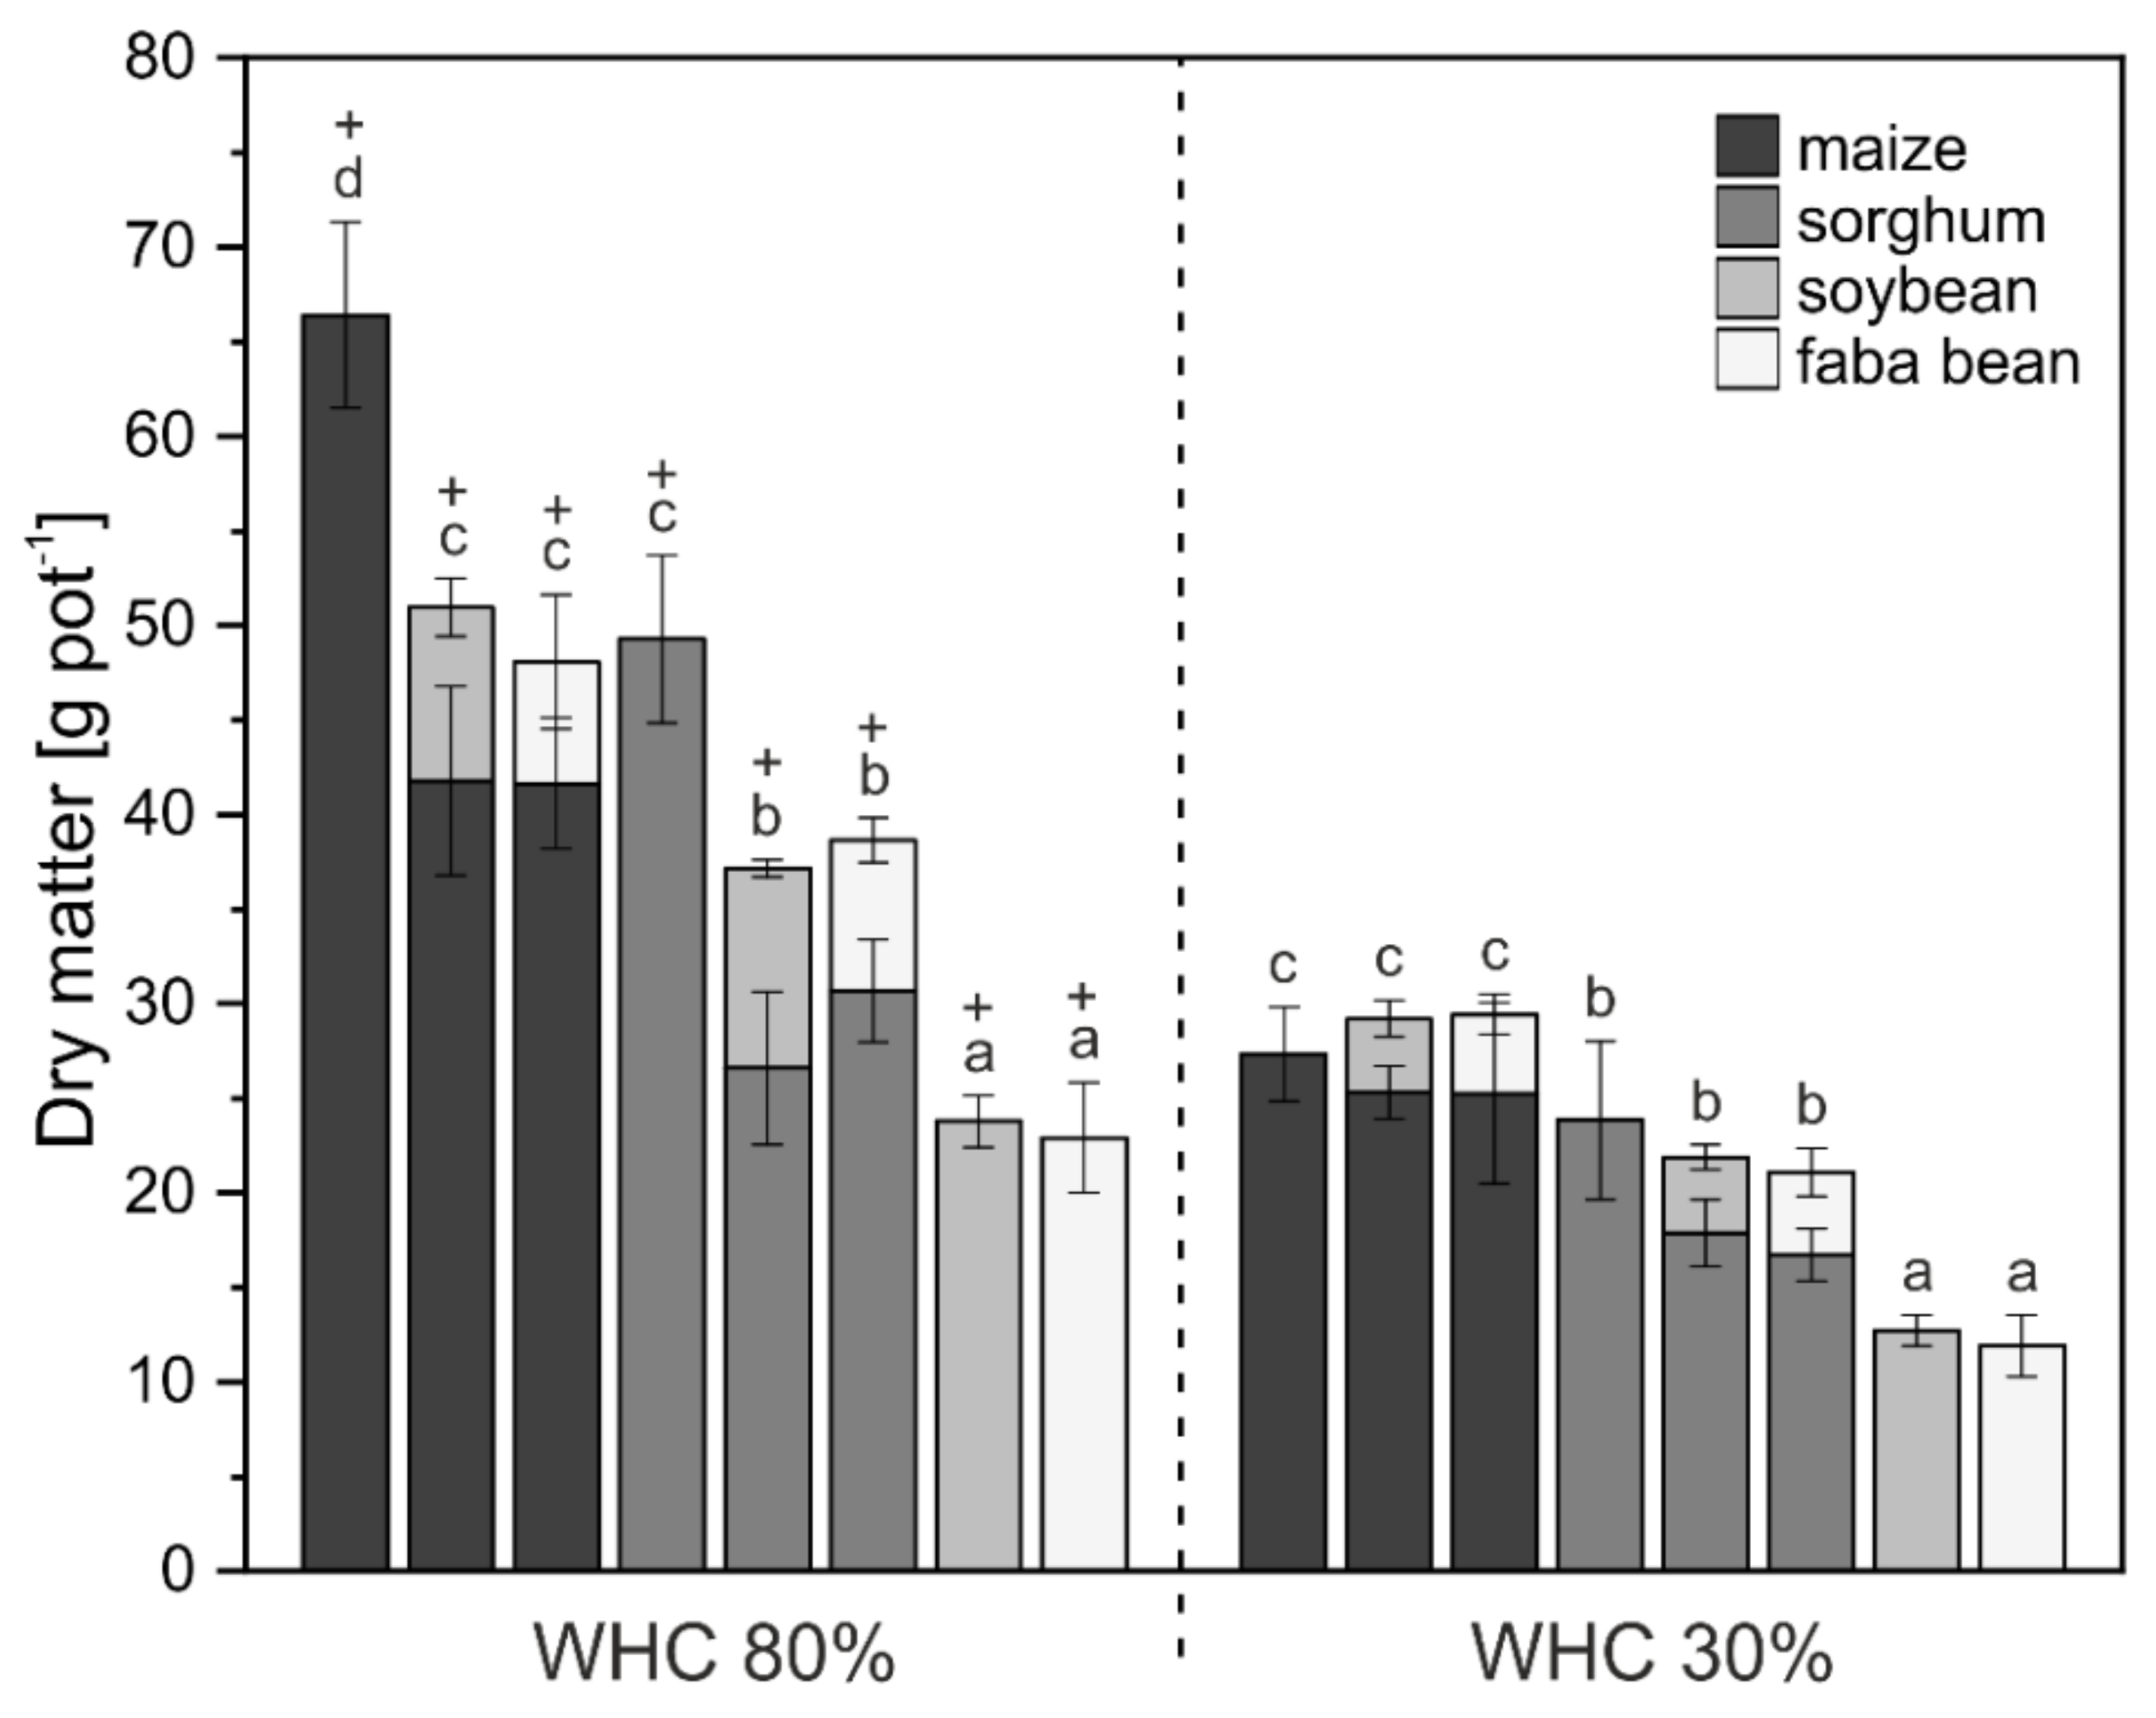
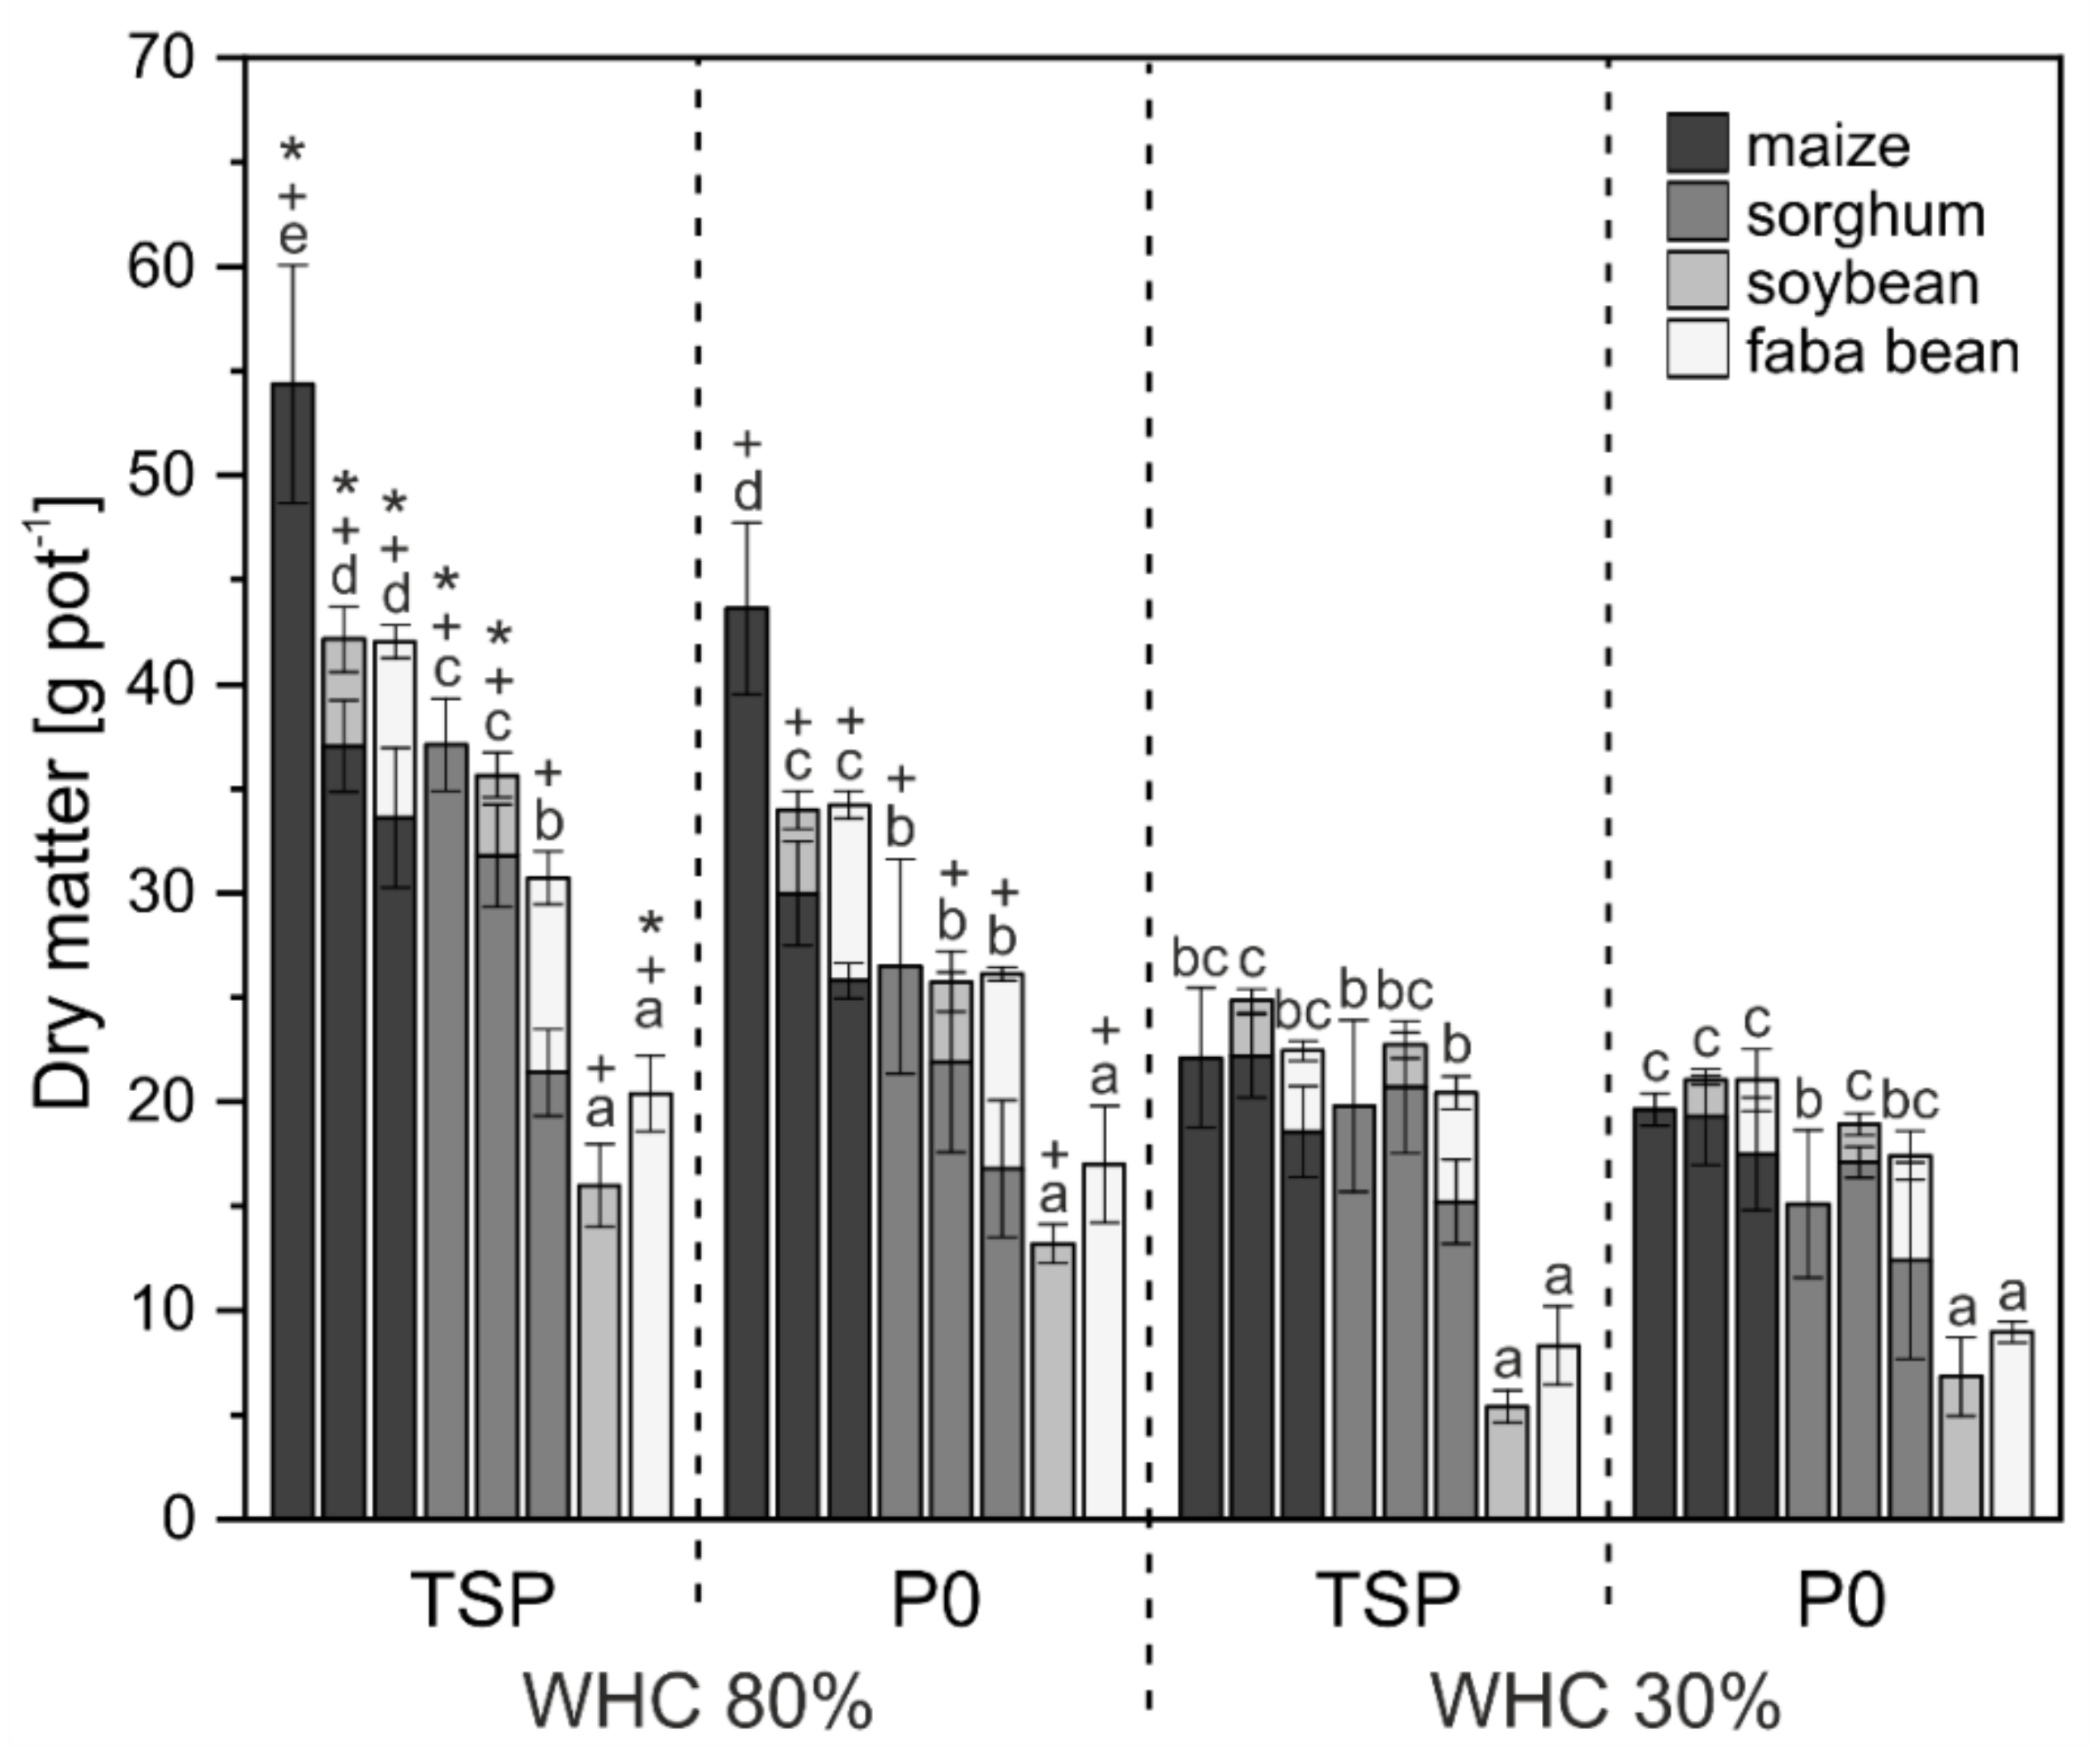
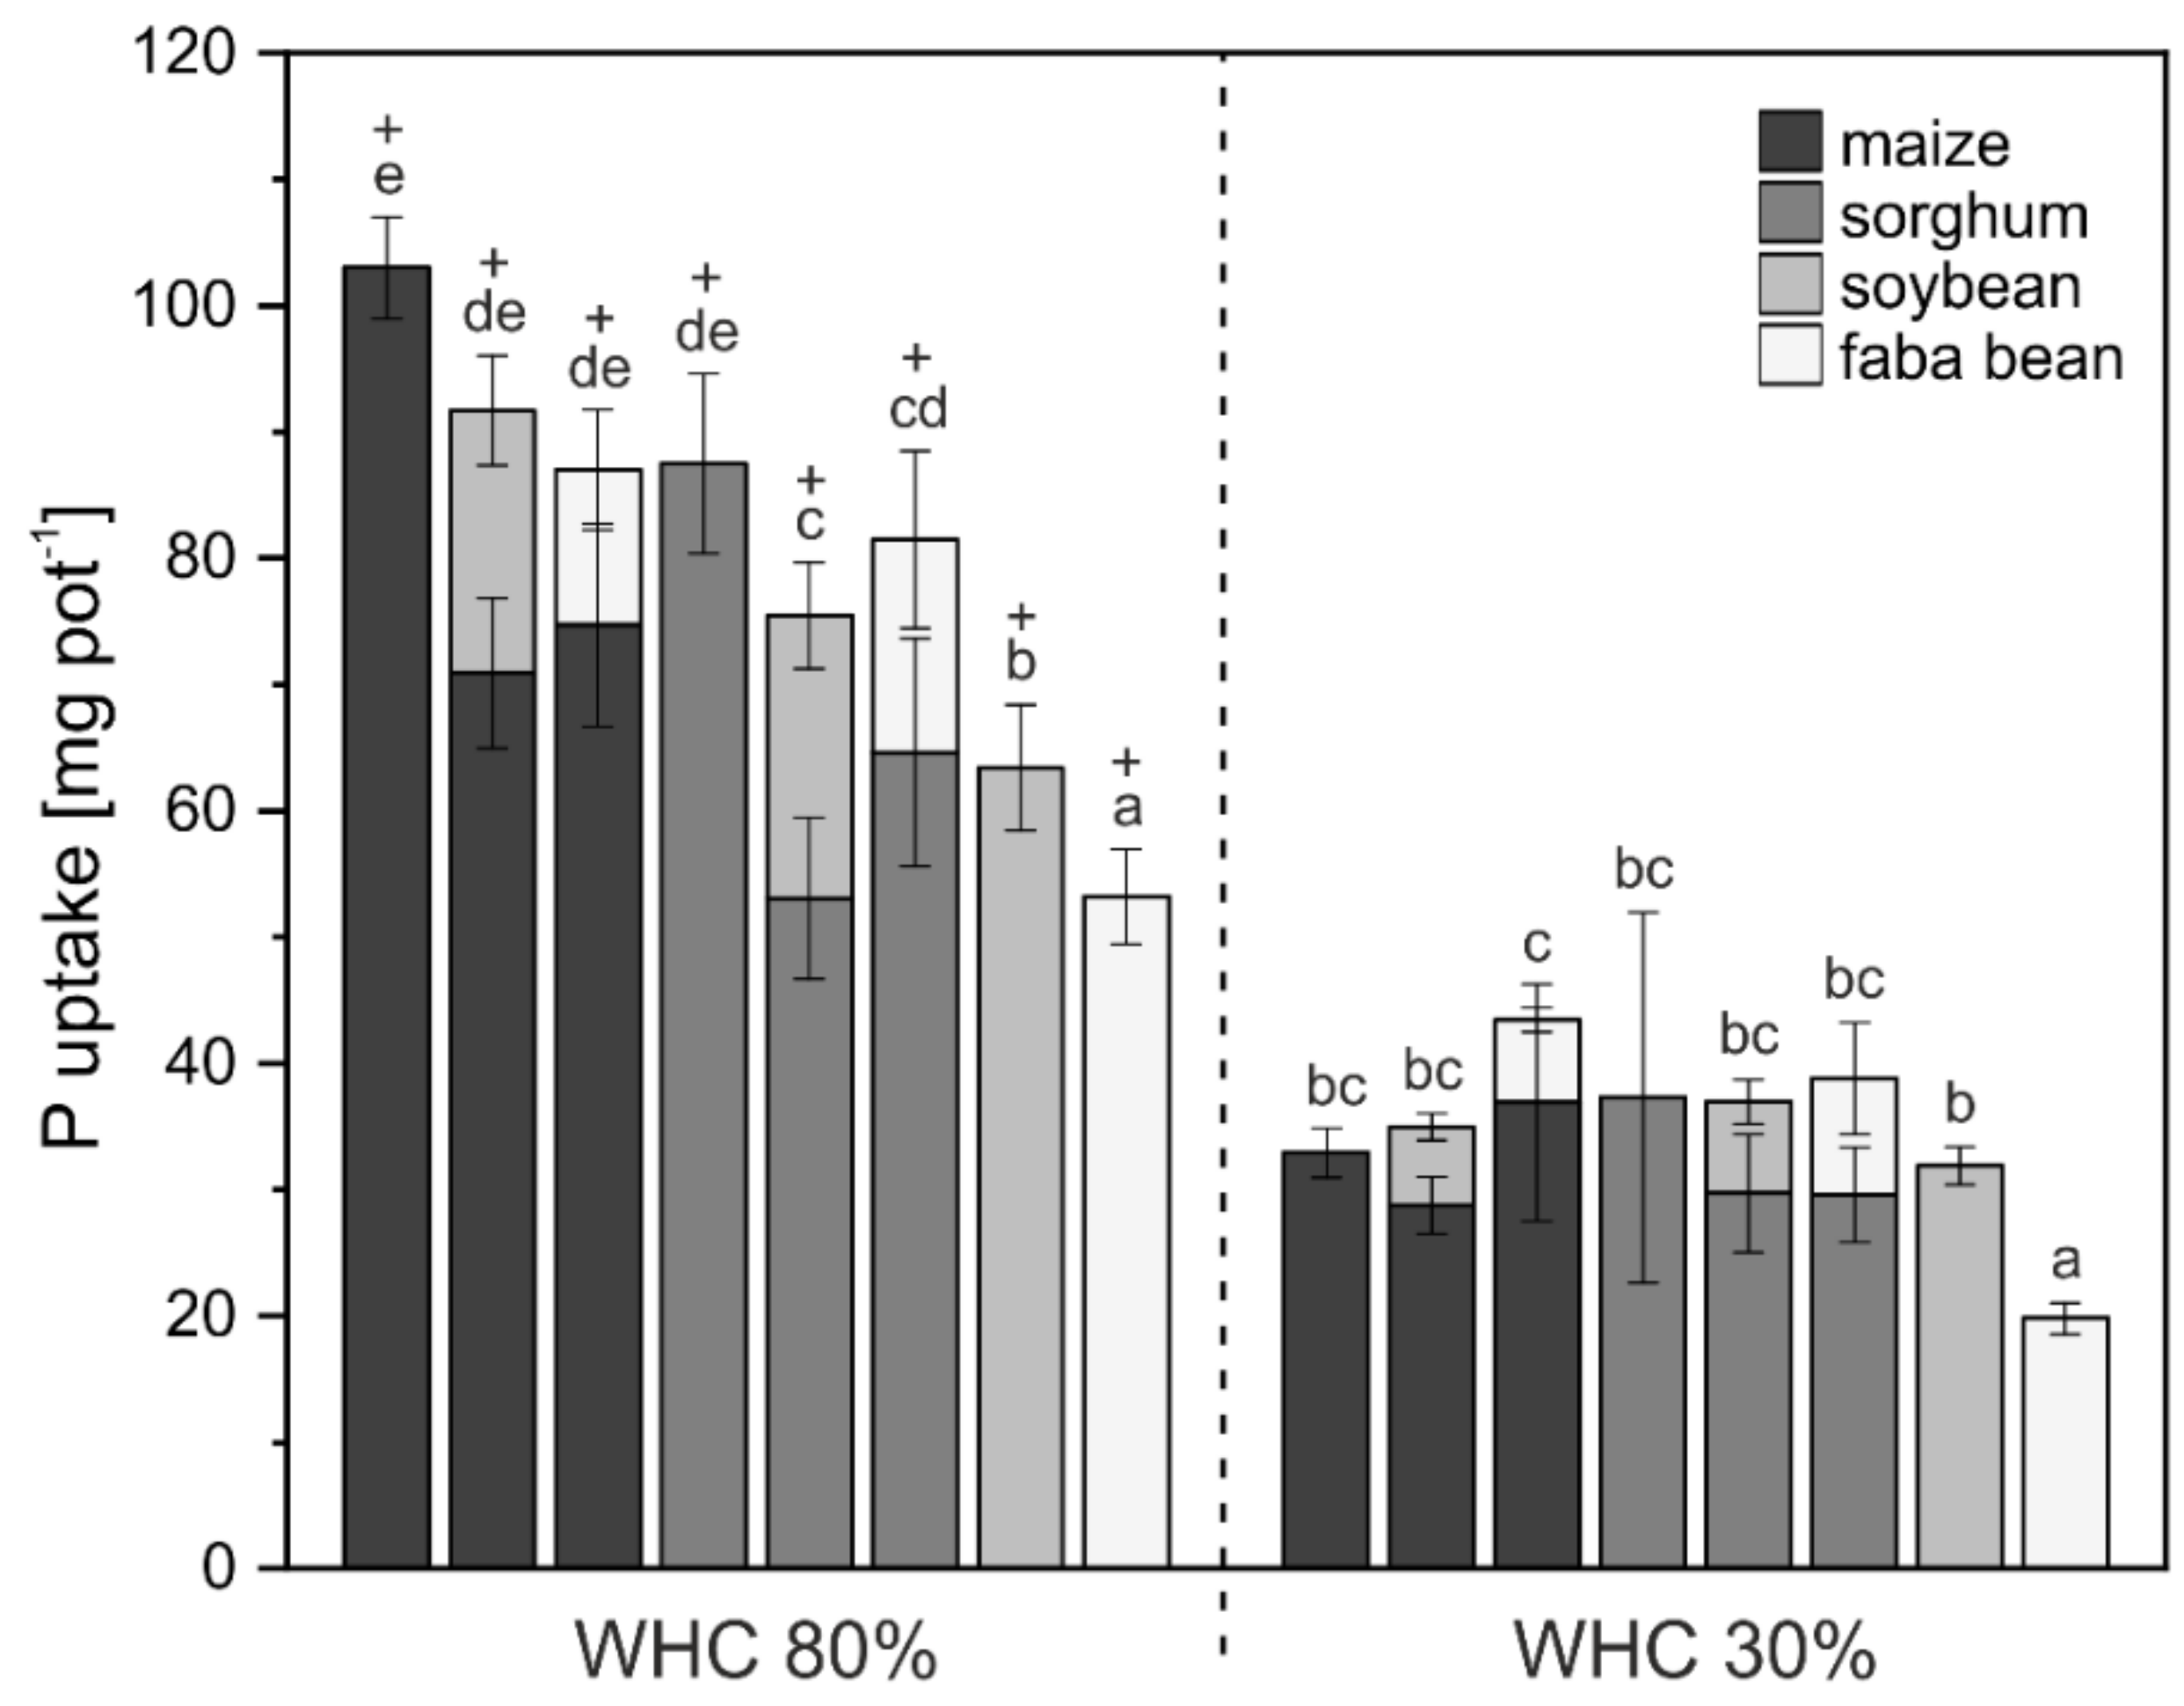
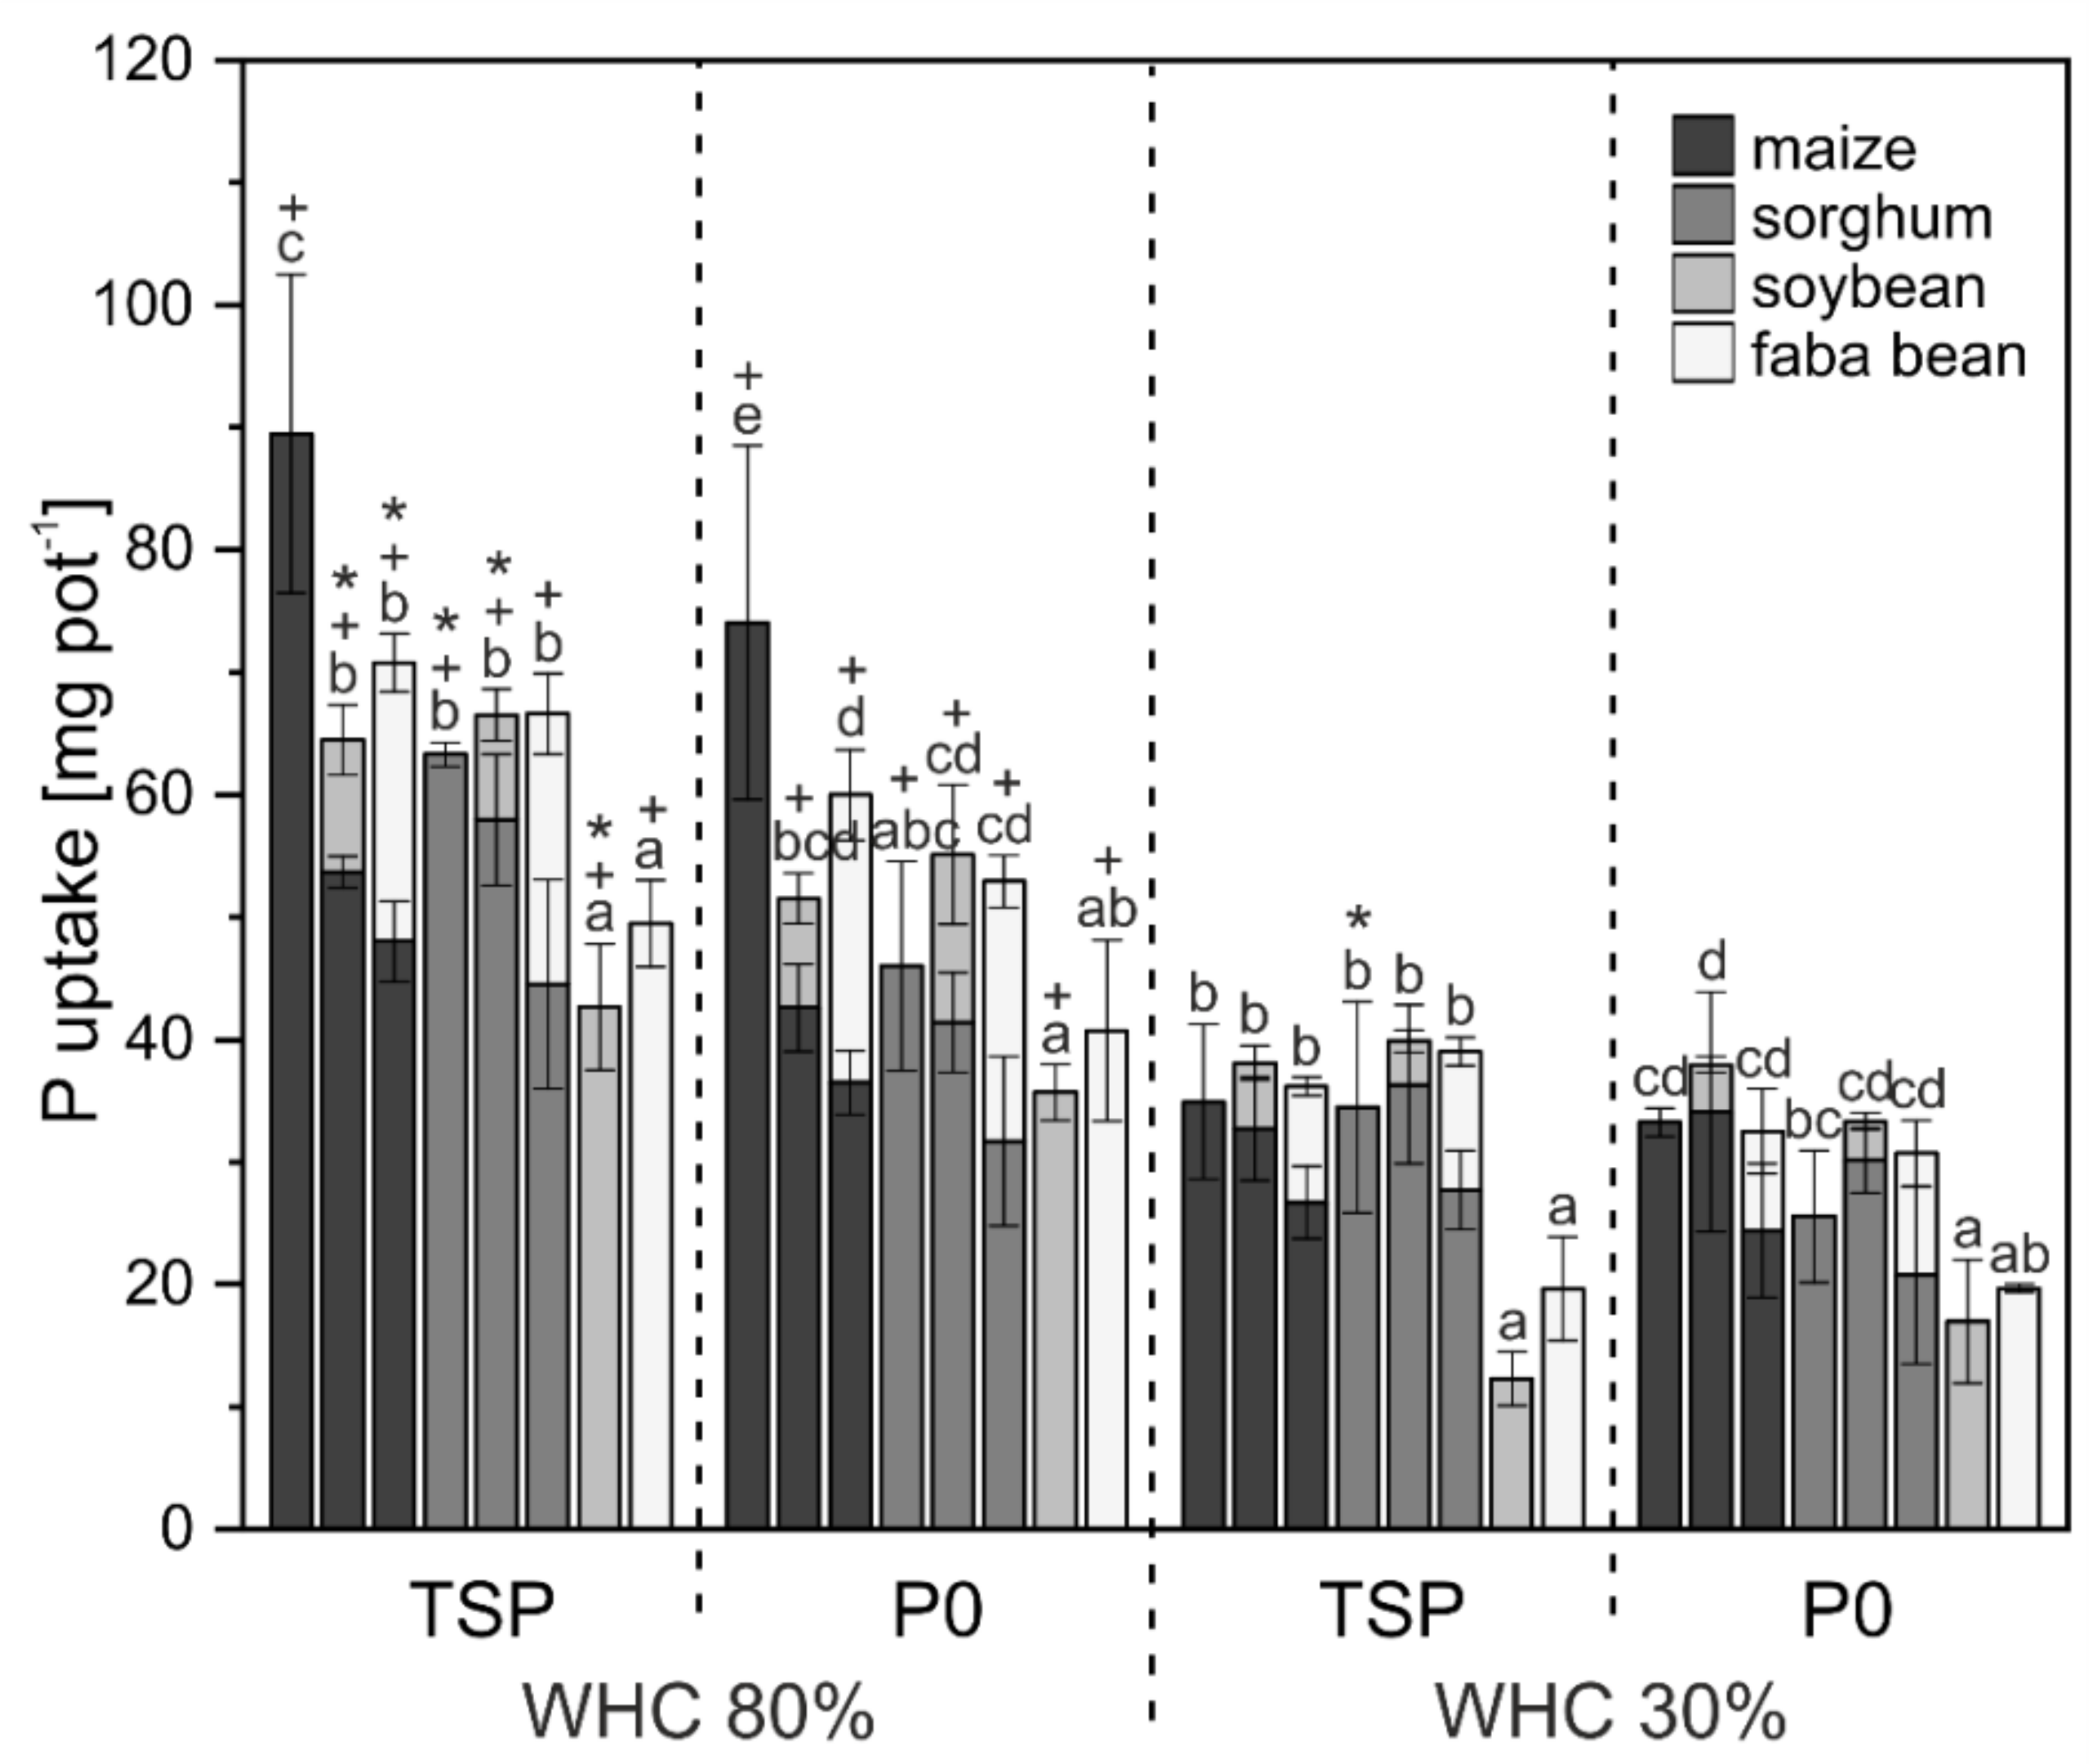
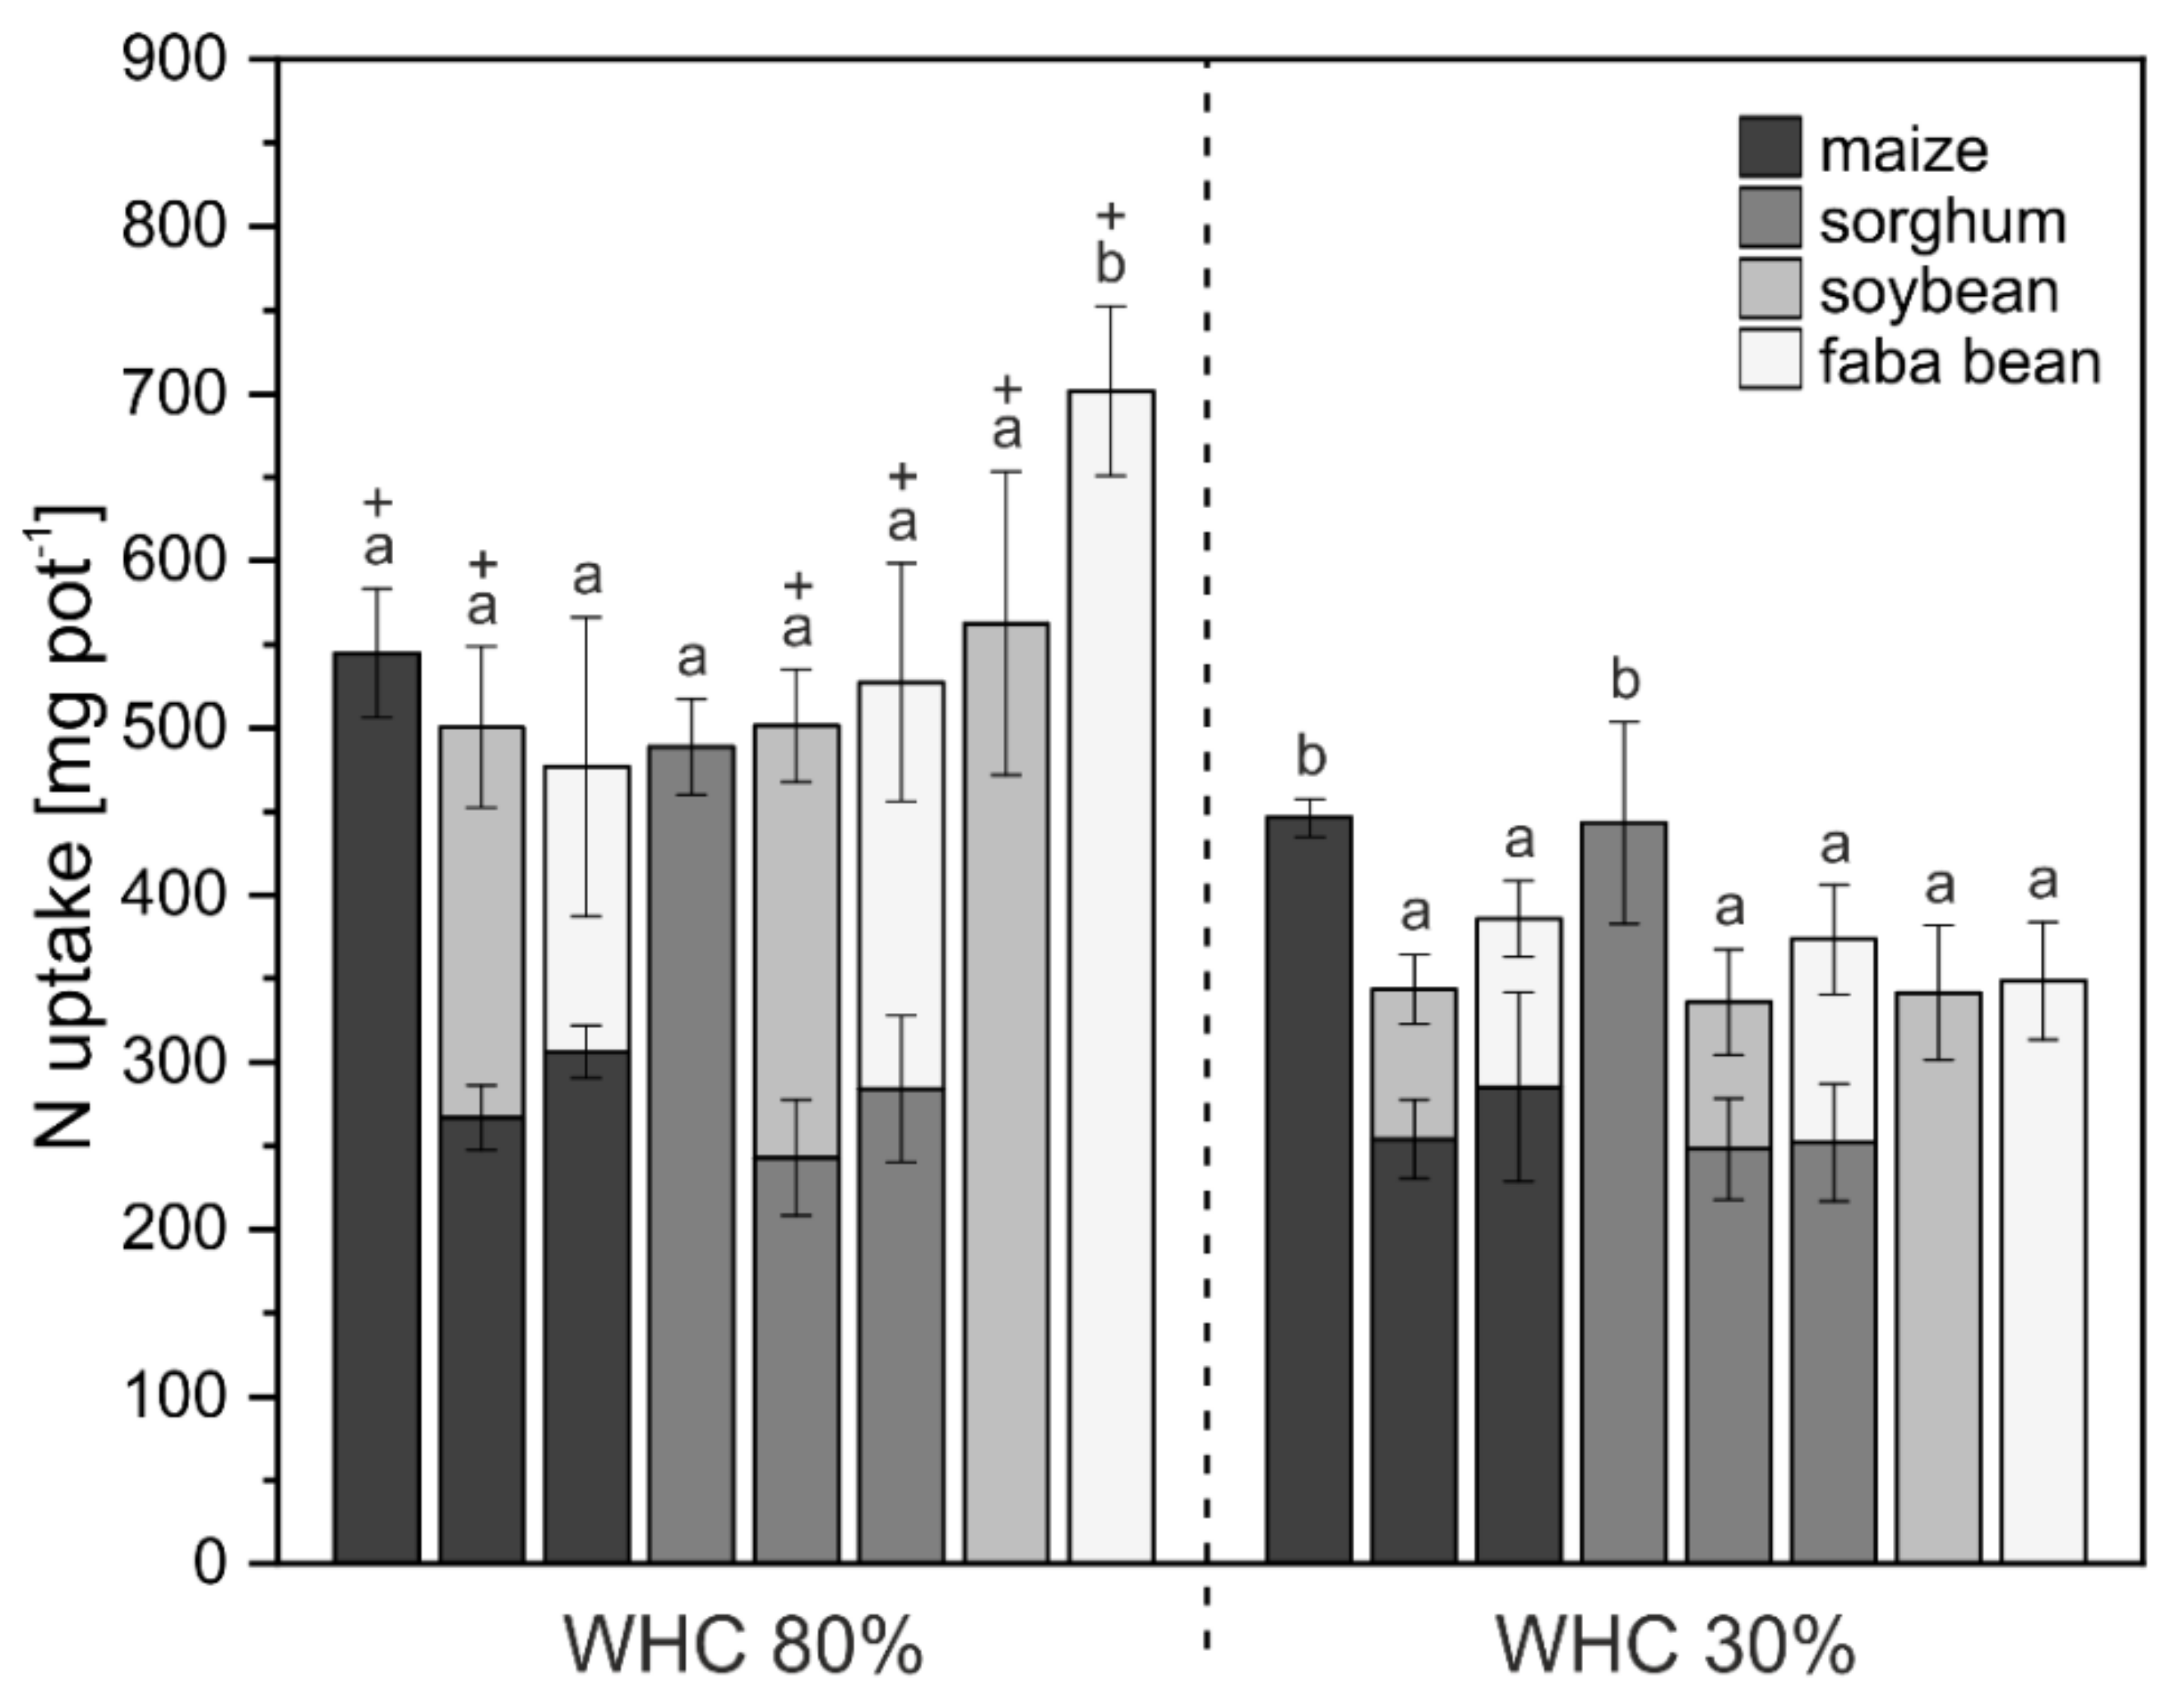
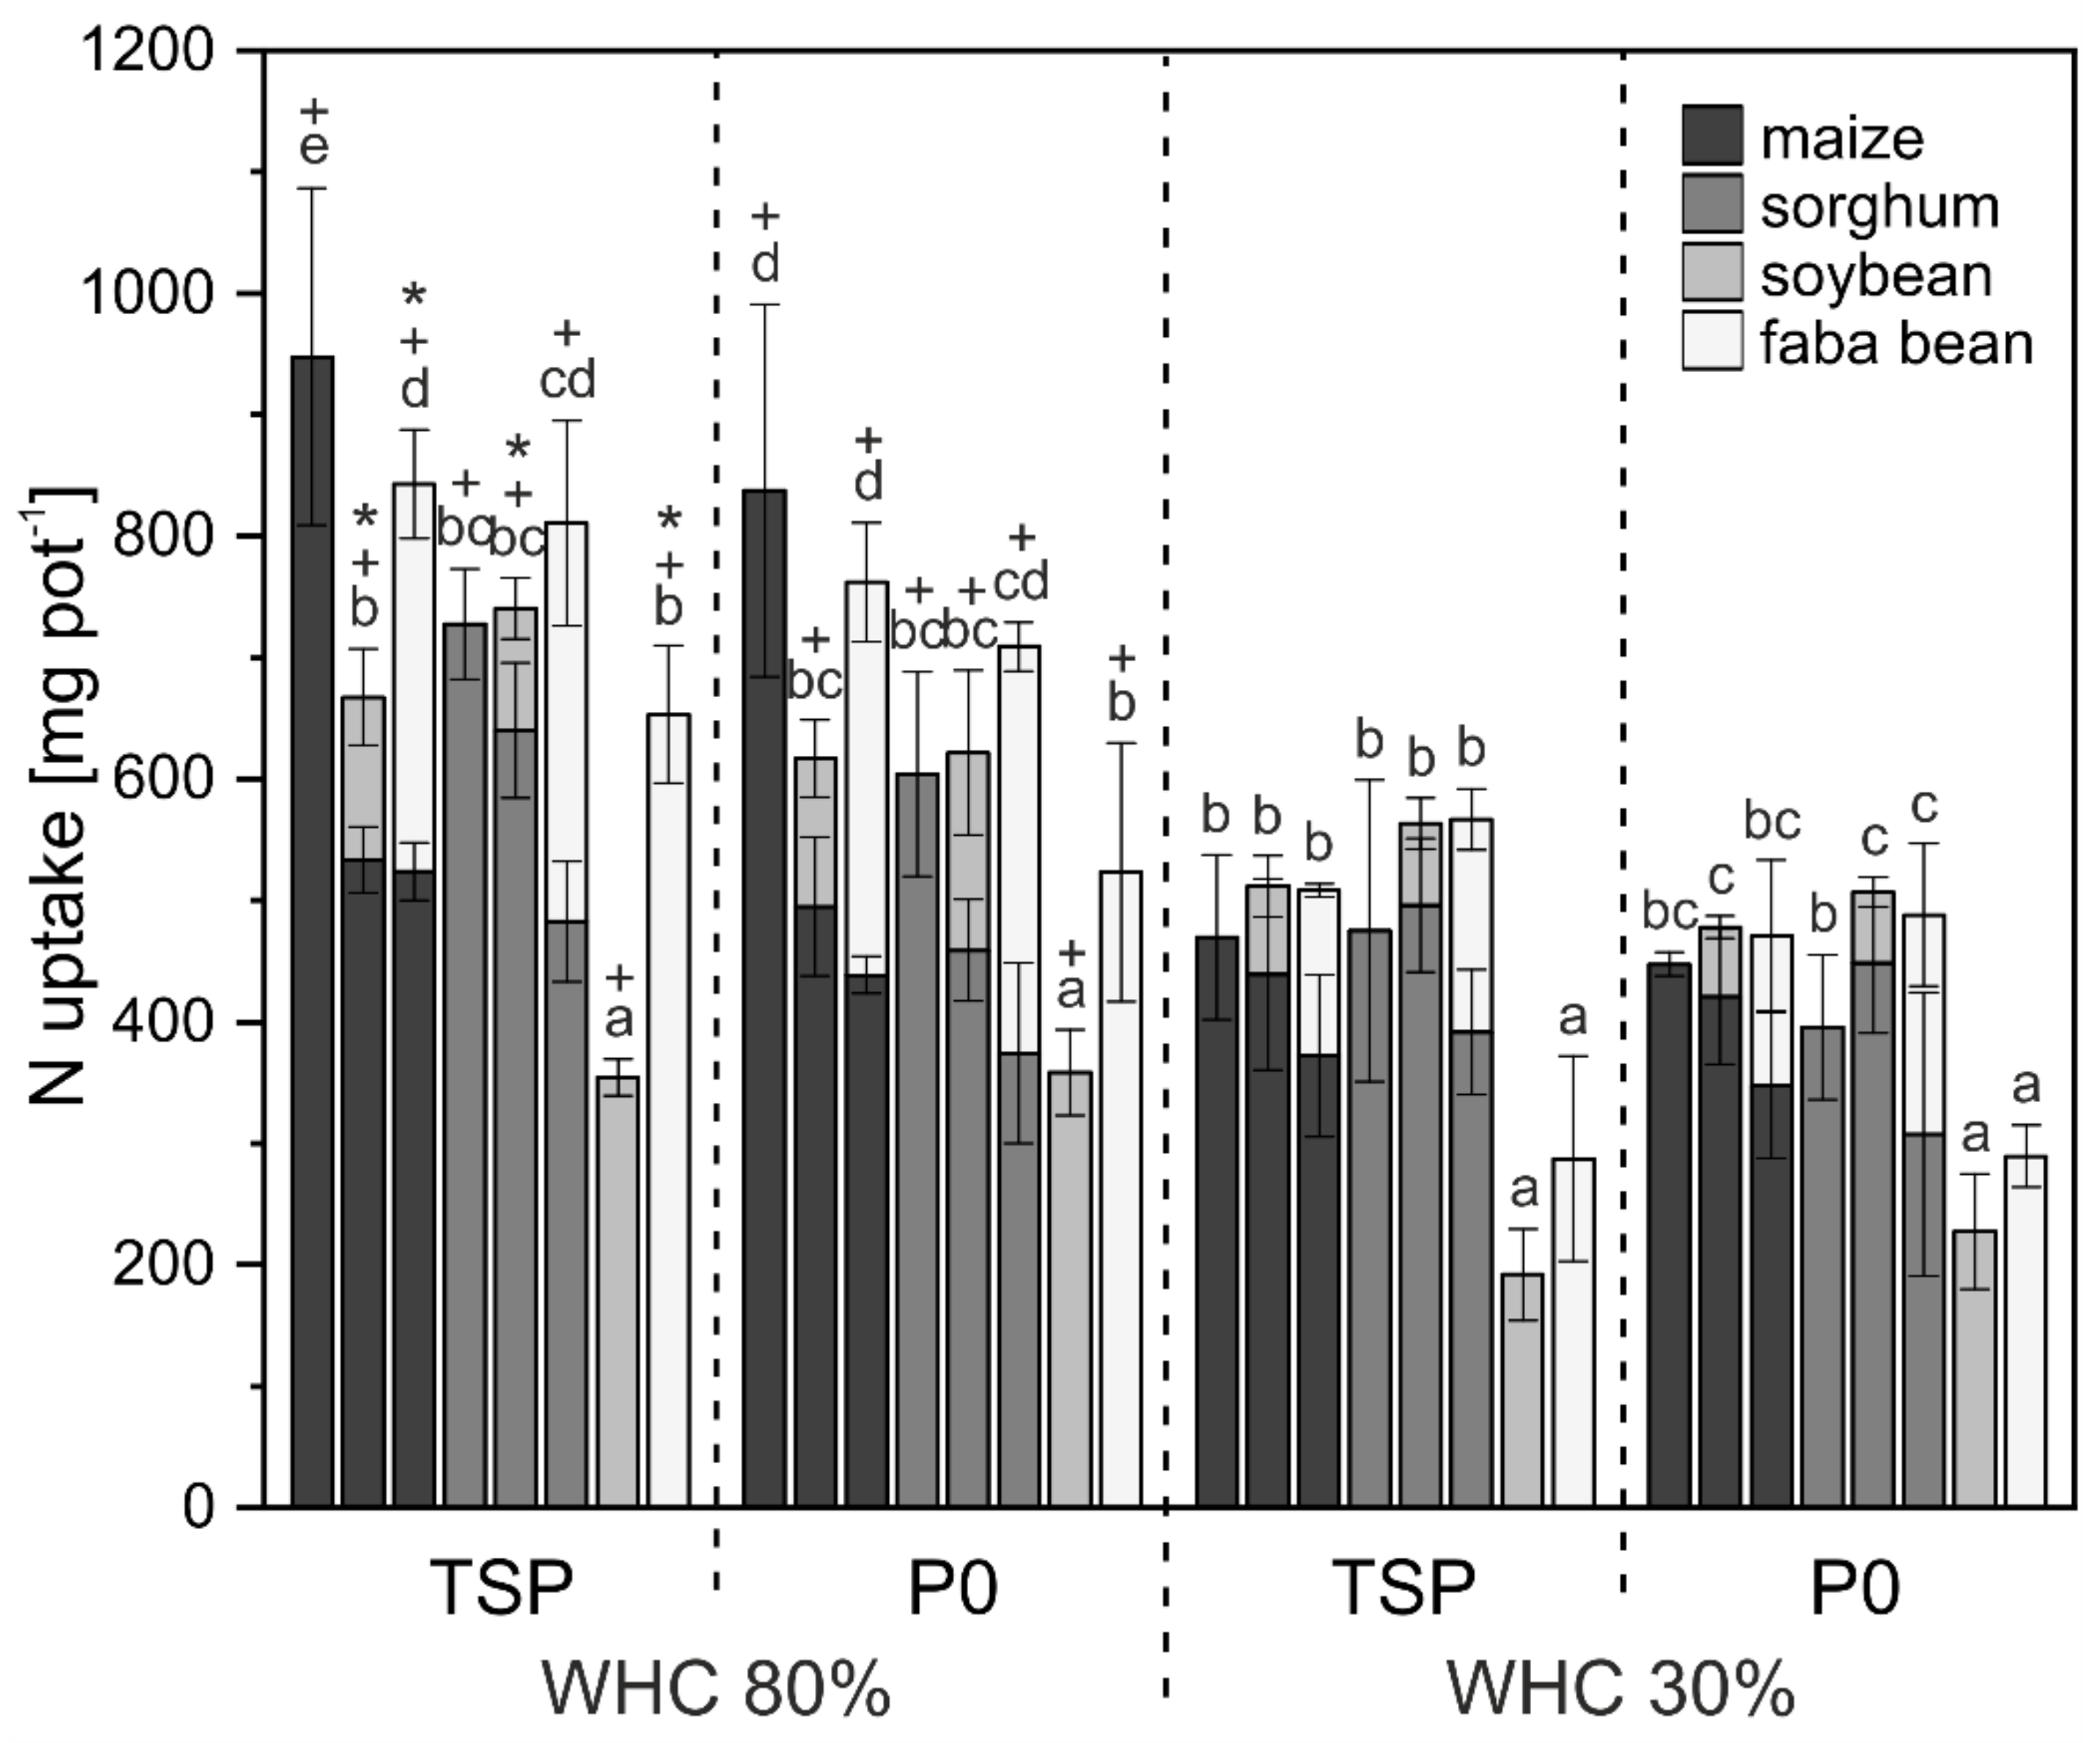
3.1. Crop Biomass and Nutrient Uptake

In sole cultivation, the biomass yields of the monocots (maize and sorghum) were higher than the biomass yields of the legumes (faba bean and soybean). In both trials, the water supply had a significant effect on the shoot biomass (Figure 1 and Figure 2, Appendix Table A1 and Table A2), but also significant interactive effects of crops and water supply were found (p < 0.001). Maize in sole cropping showed especially sharp decreases in biomass production when water supply became limited with an almost 60% reduction of shoot weight in both experiments. For sorghum, this reduction was about 50% in the Water-Trial and 45% in the Water-P-Trial. For the legumes biomass, reductions due to drought were about 47% in the Water-Trial and 55% in the Water-P-Trial, without significant differences between both legume species. In the mixtures, the reduction of biomass due to water limitation was considerably lower than for sole cropped crops, with usually less than 40% (Appendix Table A3 and Table A4).
Under sufficient water supply, sole maize and sole sorghum had higher shoot biomasses than the total biomasses of their mixtures with legumes. Under drought stress however, no significant differences between the biomass of maize and sorghum in sole cultivation and the biomass of the mixtures were found in either experiment.
The biomass of one individual monocot plant was usually higher in the mixtures than in sole cropping, whereas the opposite was true for the biomass of one individual legume plant, which was usually higher in sole cropping. In the Water-P-Trial with higher seed density in the mixtures (six plants per pot), the biomass of the individual plant was lower than in the Water-Trial with only four plants per pot.
In the Water-P-Trial, faba bean in sole cropping had higher biomass yields than soybean in all water and P treatments and faba bean also contributed more to the total weight of the respective mixtures than soybean. However, the proportion of legumes of the total biomass of the mixtures was generally low and varied between 20% and 25% at 80% WHC. With drought stress, the proportion of legumes became even lower (approx. 10–20%).
The water supply also had a significant effect on root length and the ratio of root length to shoot biomass (Appendix Table A6). For 80% WHC, the root length of maize was found to be the highest of all crops (664 m per pot) and that of faba bean the lowest (188 m). When the water supply was deficient, the root length decreased from about 400 m to about 260 m (on average of all crops), whereby the strongest reductions were found for maize and maize + soybean (about 50% reduction).
The P and N concentration in the shoot biomass of the legumes was considerably higher than in the shoot biomass of the monocot plants (data not shown), but because of the low biomass of the legumes, the P uptakes (Figure 3 and Figure 4) and N uptakes (Figure 5 and Figure 6) of the legumes were also usually lower than that of the monocots. Generally, the N uptakes of the monocots and mixtures, but not of the legumes in sole cropping, were higher in the Water-P-Trial than in the Water-Trial, which corresponds to the second N supply given to the monocots and mixtures in the Water-P-Trial. The reduction of the P uptake under drought stress was higher than the yield reduction (highest for sole maize of about 70%), whereas the N uptake only reduced about 10–30% under drought stress (Appendix Table A3 and Table A4).
The effects of P supply on the crop characteristics were relatively low and varied independent of water supply (interactive effects of water and P supply on biomass and P uptake, p < 0.001) (Appendix Table A2). The biomass reduction due to P deficit was about 15% (average of all crops and water treatments). In the 80% WHC treatment, the biomass and the P uptake were usually higher in the TSP treatments than in the P0 treatments. Under drought stress, however, the P supply usually had no significant consequences for the shoot biomass and the P uptake of the crops (exception for sorghum). The sole cultivation of legumes did not show any significant biomass changes in dependence of P supply.

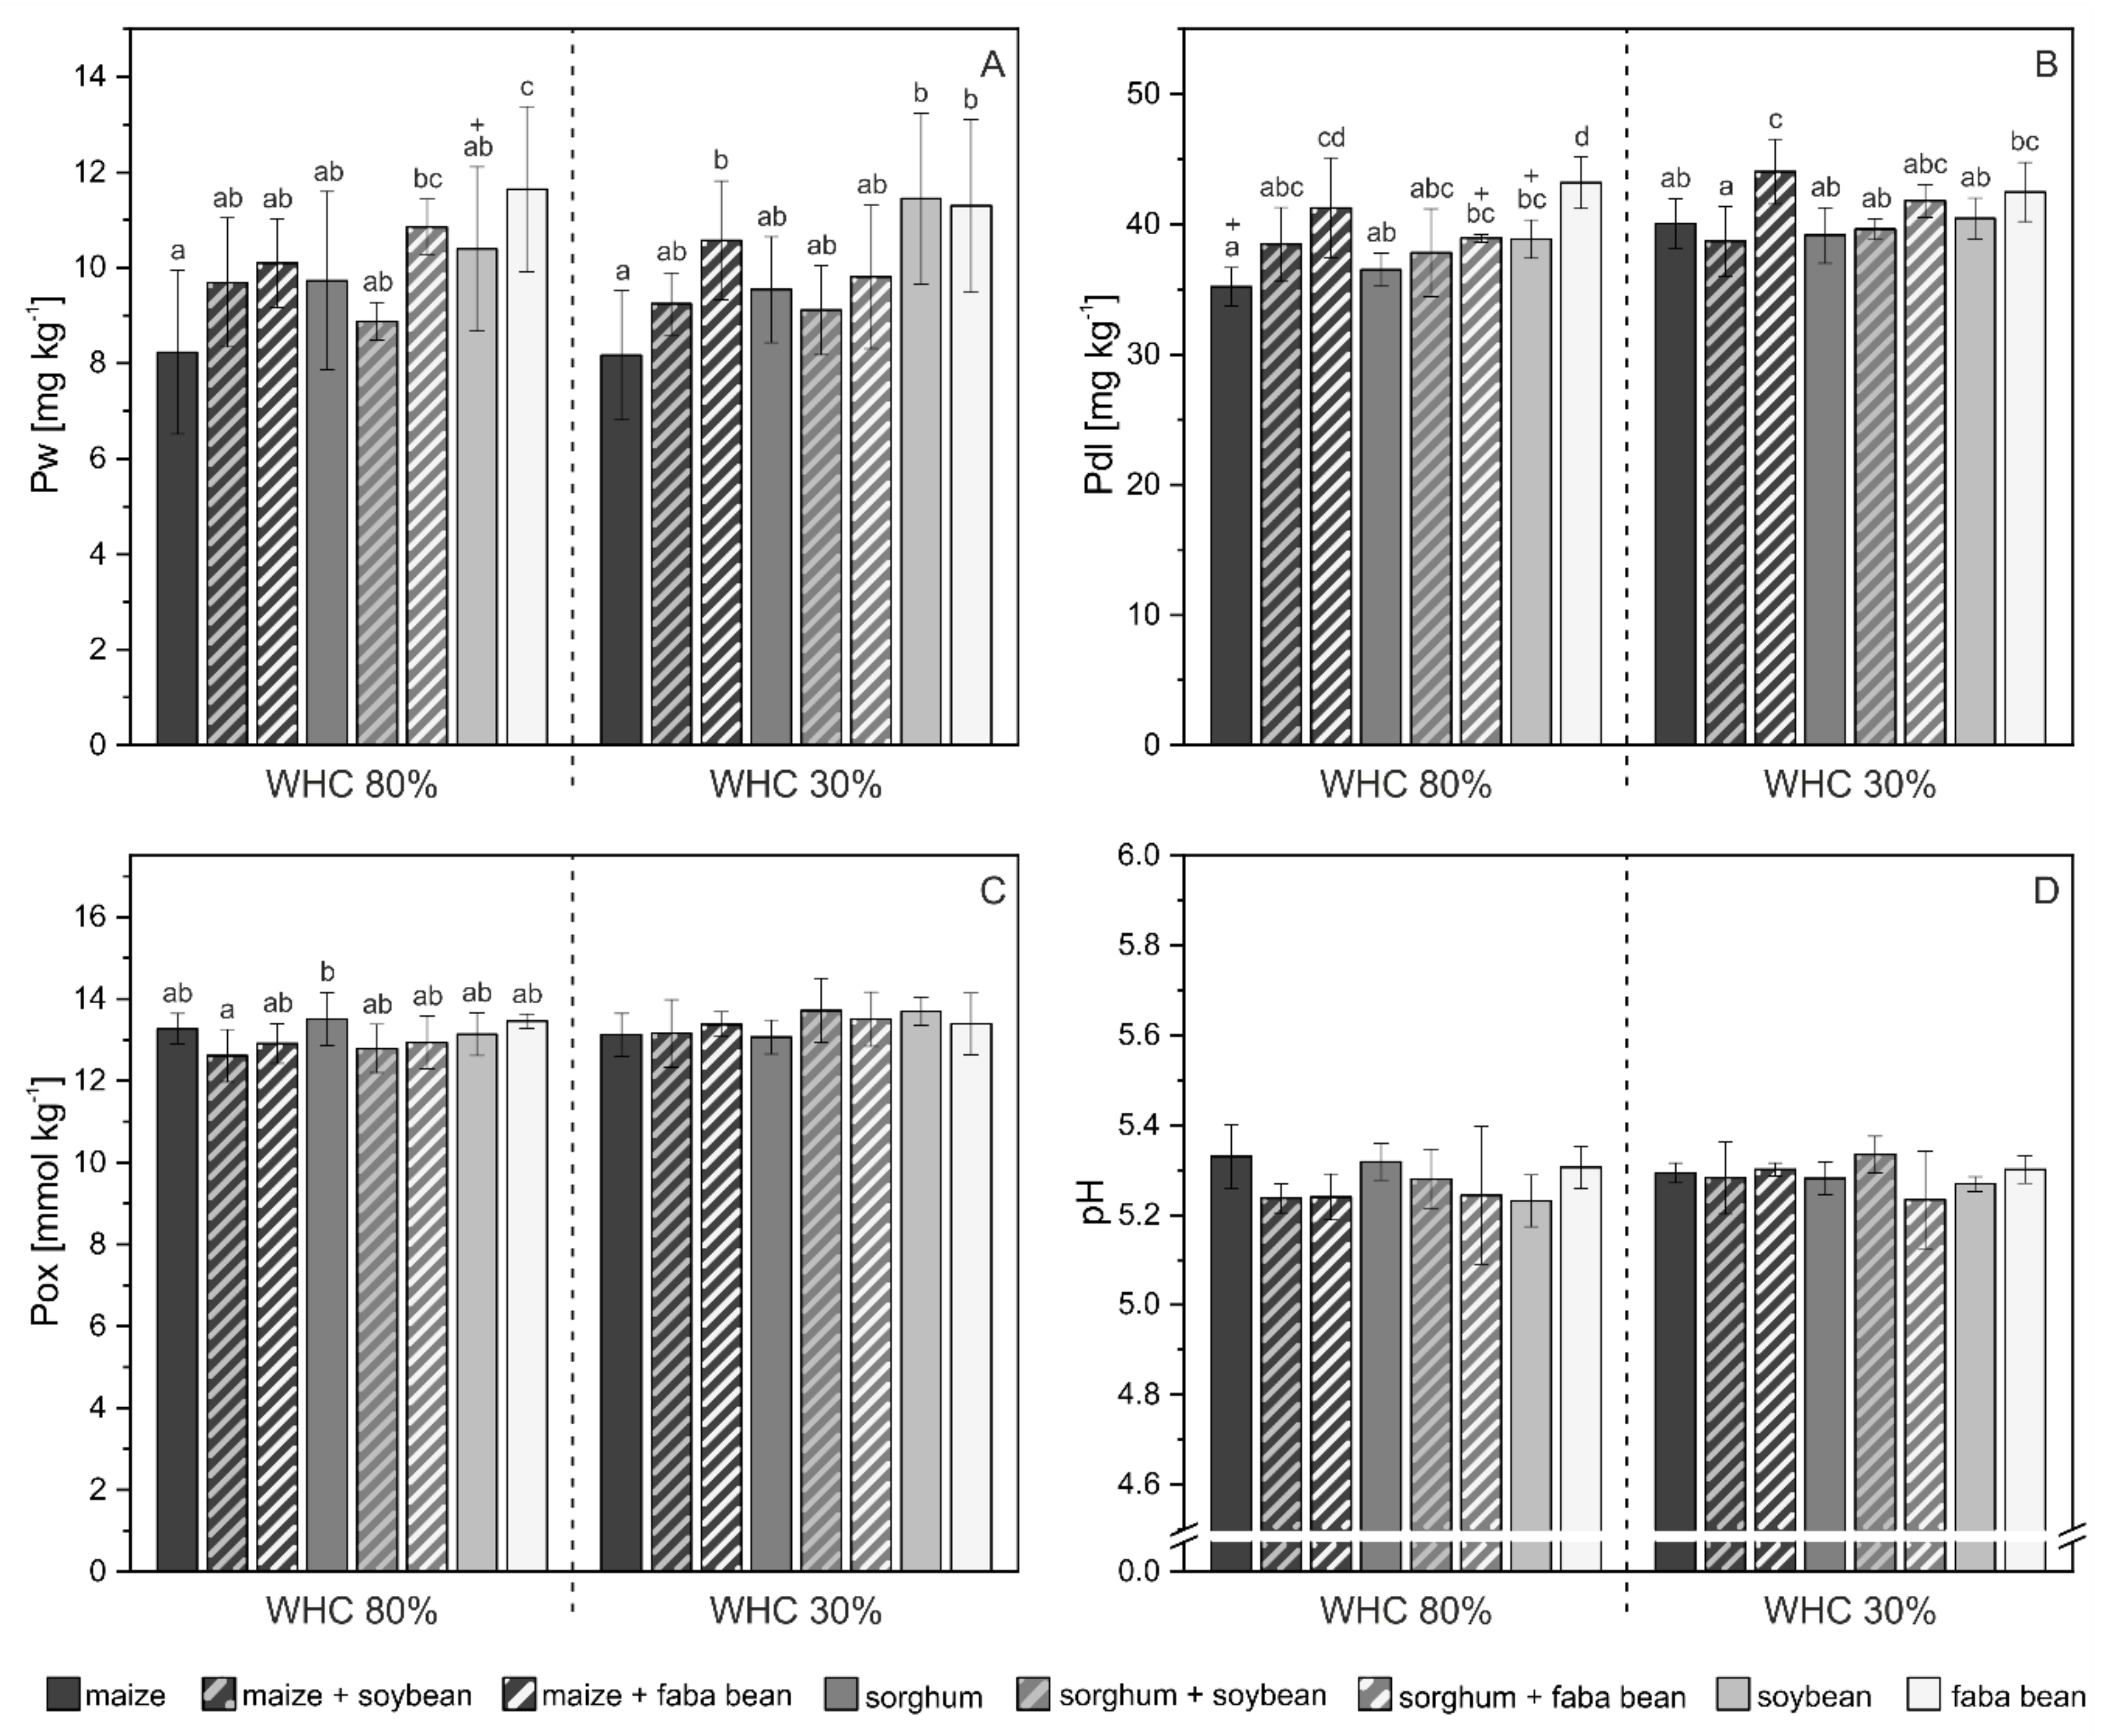
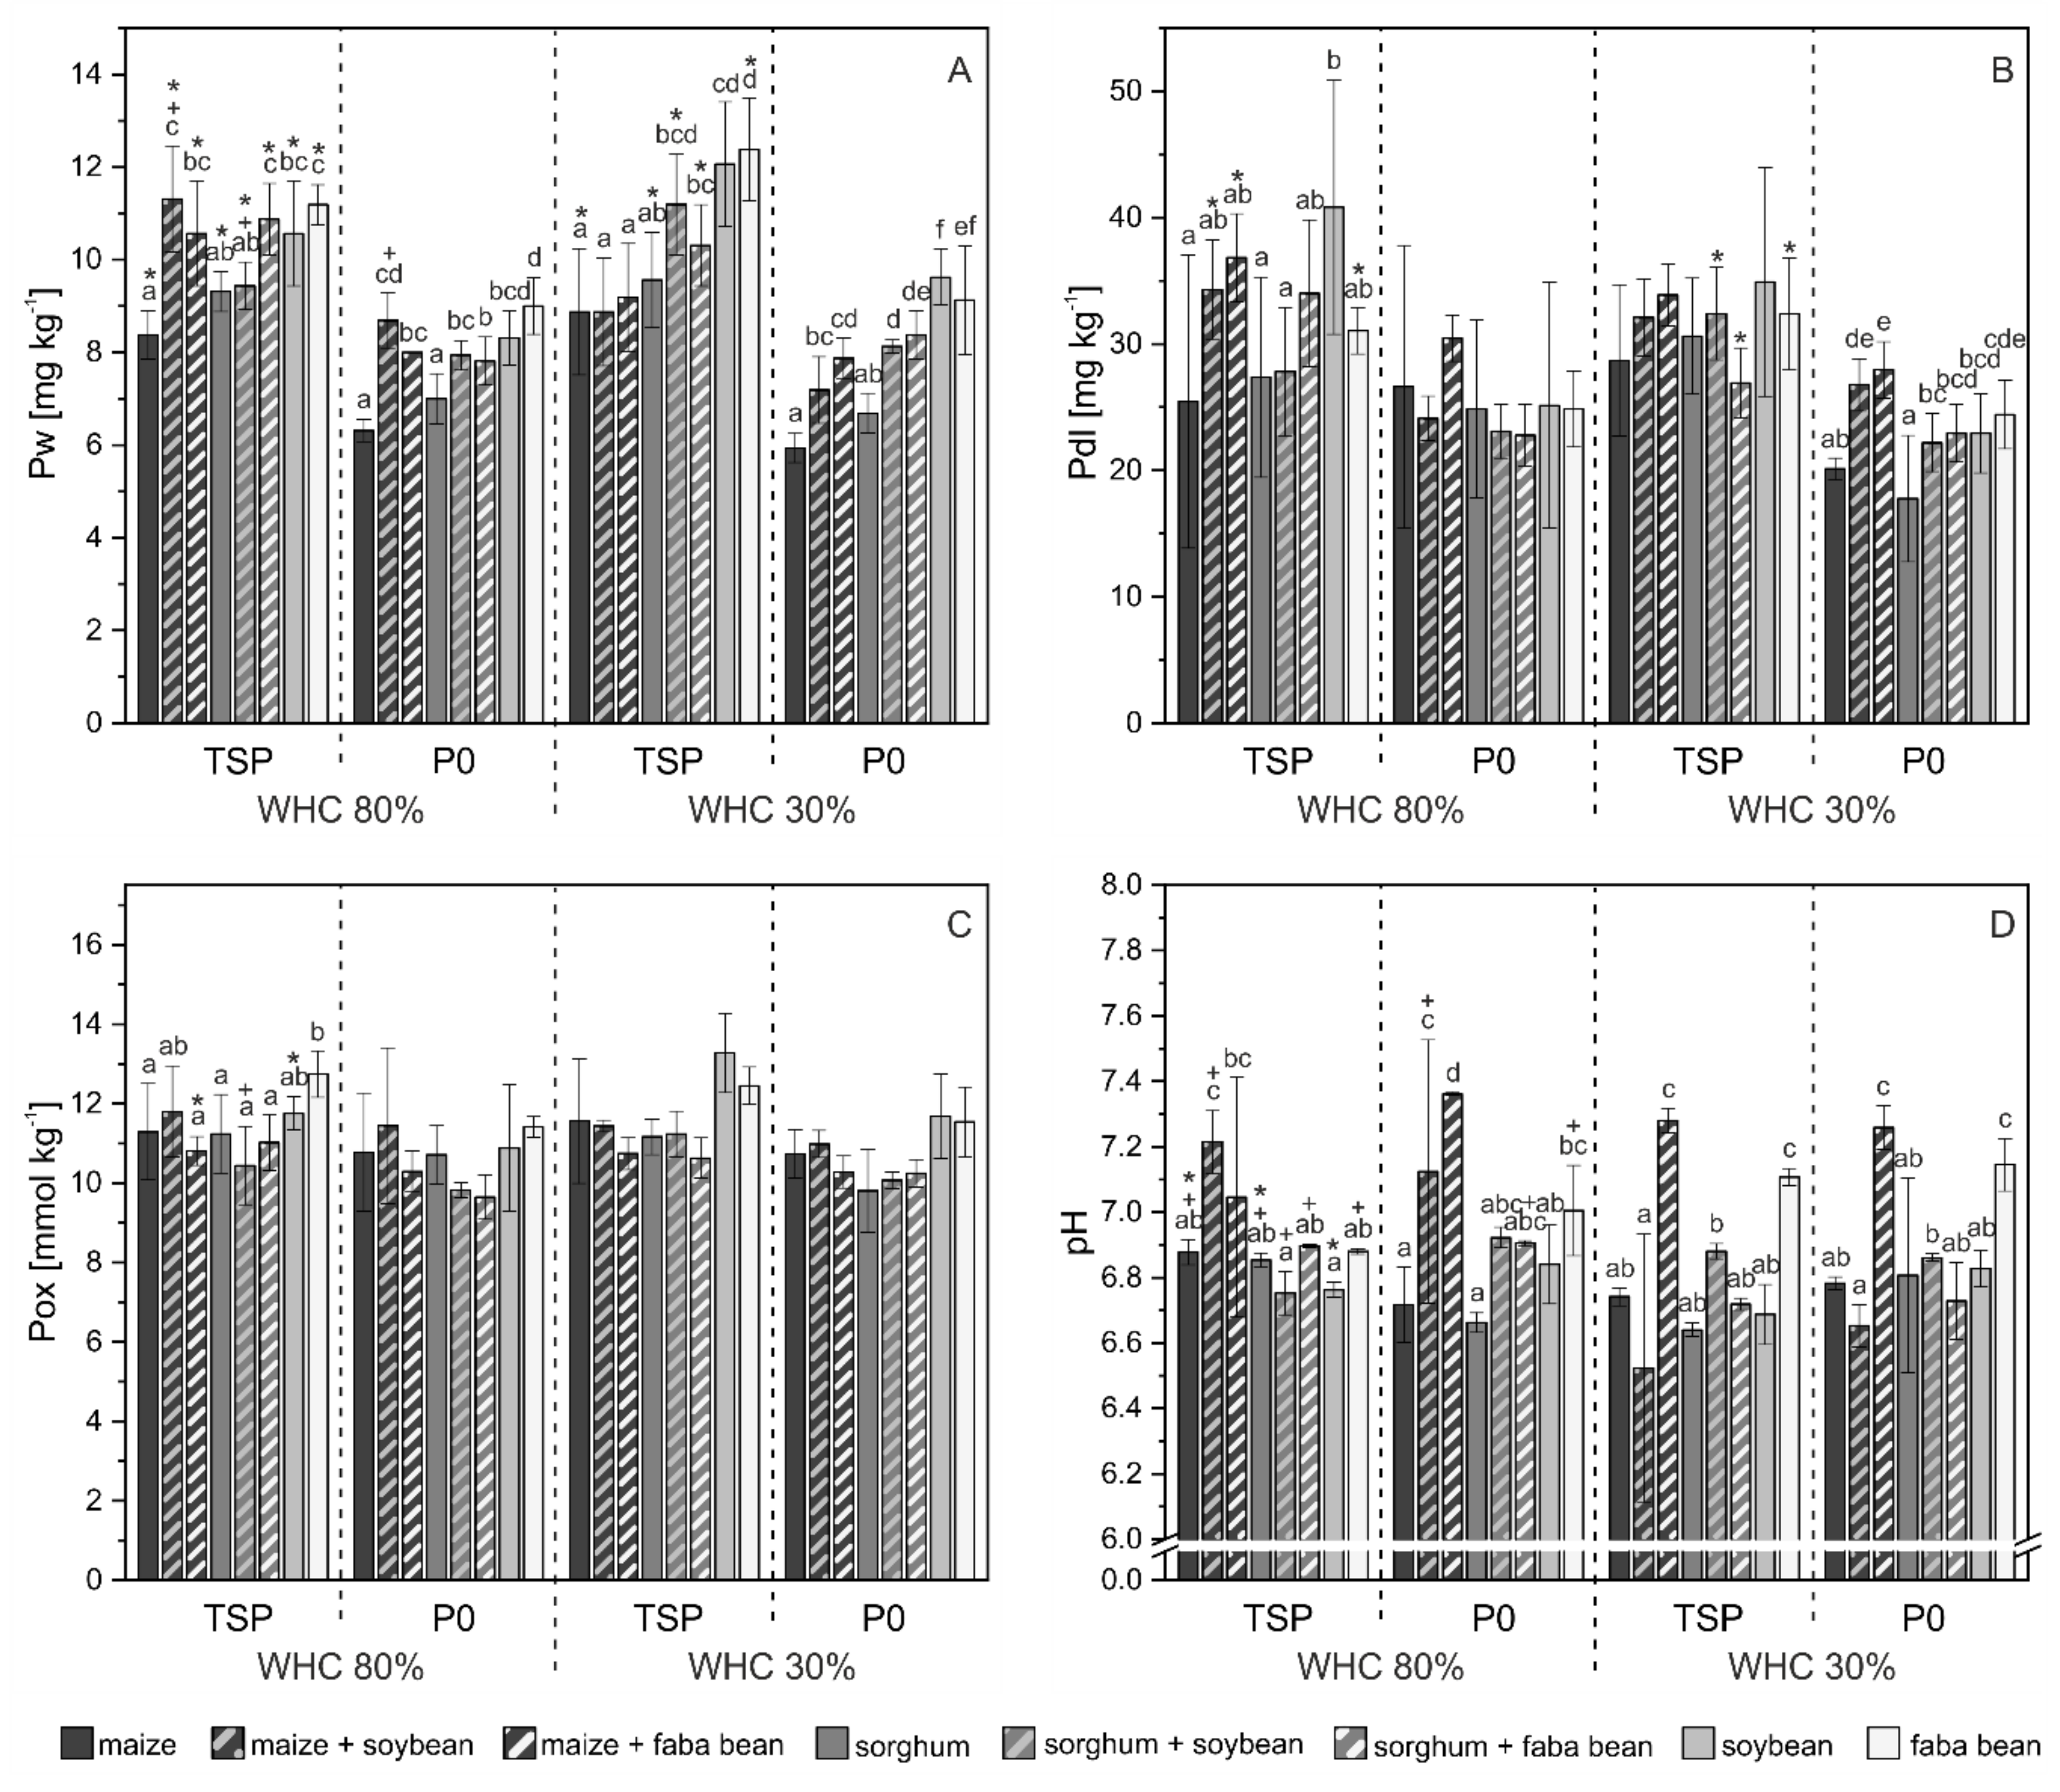
3.2. Phosphorus Pools in Soil

In both experiments the soil P contents in the labile pools (Pw and the Pdl) were affected by the crops and in the Water-P-Trial also by the P supply (Figure 7A,B and Figure 8A,B, Appendix Table A1 and Table A2). Higher Pw and Pdl contents in soil after cultivation of the crop mixtures in comparison to sole cropped monocots were mainly found under the combined stress of water and P deficit in the Water-P-Trial. Both legume partners had similar effects on soil P pools.
The contents in the labile P pools in soil (Pw and Pdl) were negatively correlated with the P uptake of crops (though not always significant). This was especially obvious in the Water-Trial for the Pdl content with a Pearson correlation coefficient of −0.50 (p < 0.01). In the Water-P-Trial, this correlation was only −0.21 (p < 0.05).
A P supply with TSP raised the Pw contents on average from about 8 to 10 mg kg−1 and the Pdl contents from about 24 to 32 mg kg−1 in the Water-P-Trial. The water supply, however, had almost no impacts on the soil P pools. Only in the Water-Trial were the average Pdl contents slightly (but significantly) higher in the 30% WHC than in the 80% WHC treatment (40.8 vs. 38.8 mg kg−1).
Effects on the more stable Pox pool were rarely found (Figure 7C and Figure 8C). Only the P supply affected the Pox values and resulted in slightly, but significantly, higher Pox contents with TSP supply (11.5 mmol vs. 10.6 mmol). Similarly, the pH values in soil were usually not affected by water or P supply (Figure 7D and Figure 8D). In the Water-P-Trial, faba bean in sole cropping and mixtures of maize + faba bean resulted in the highest soil pH values (average of P and water treatments) with about 0.5 pH units more than the other crop treatments.

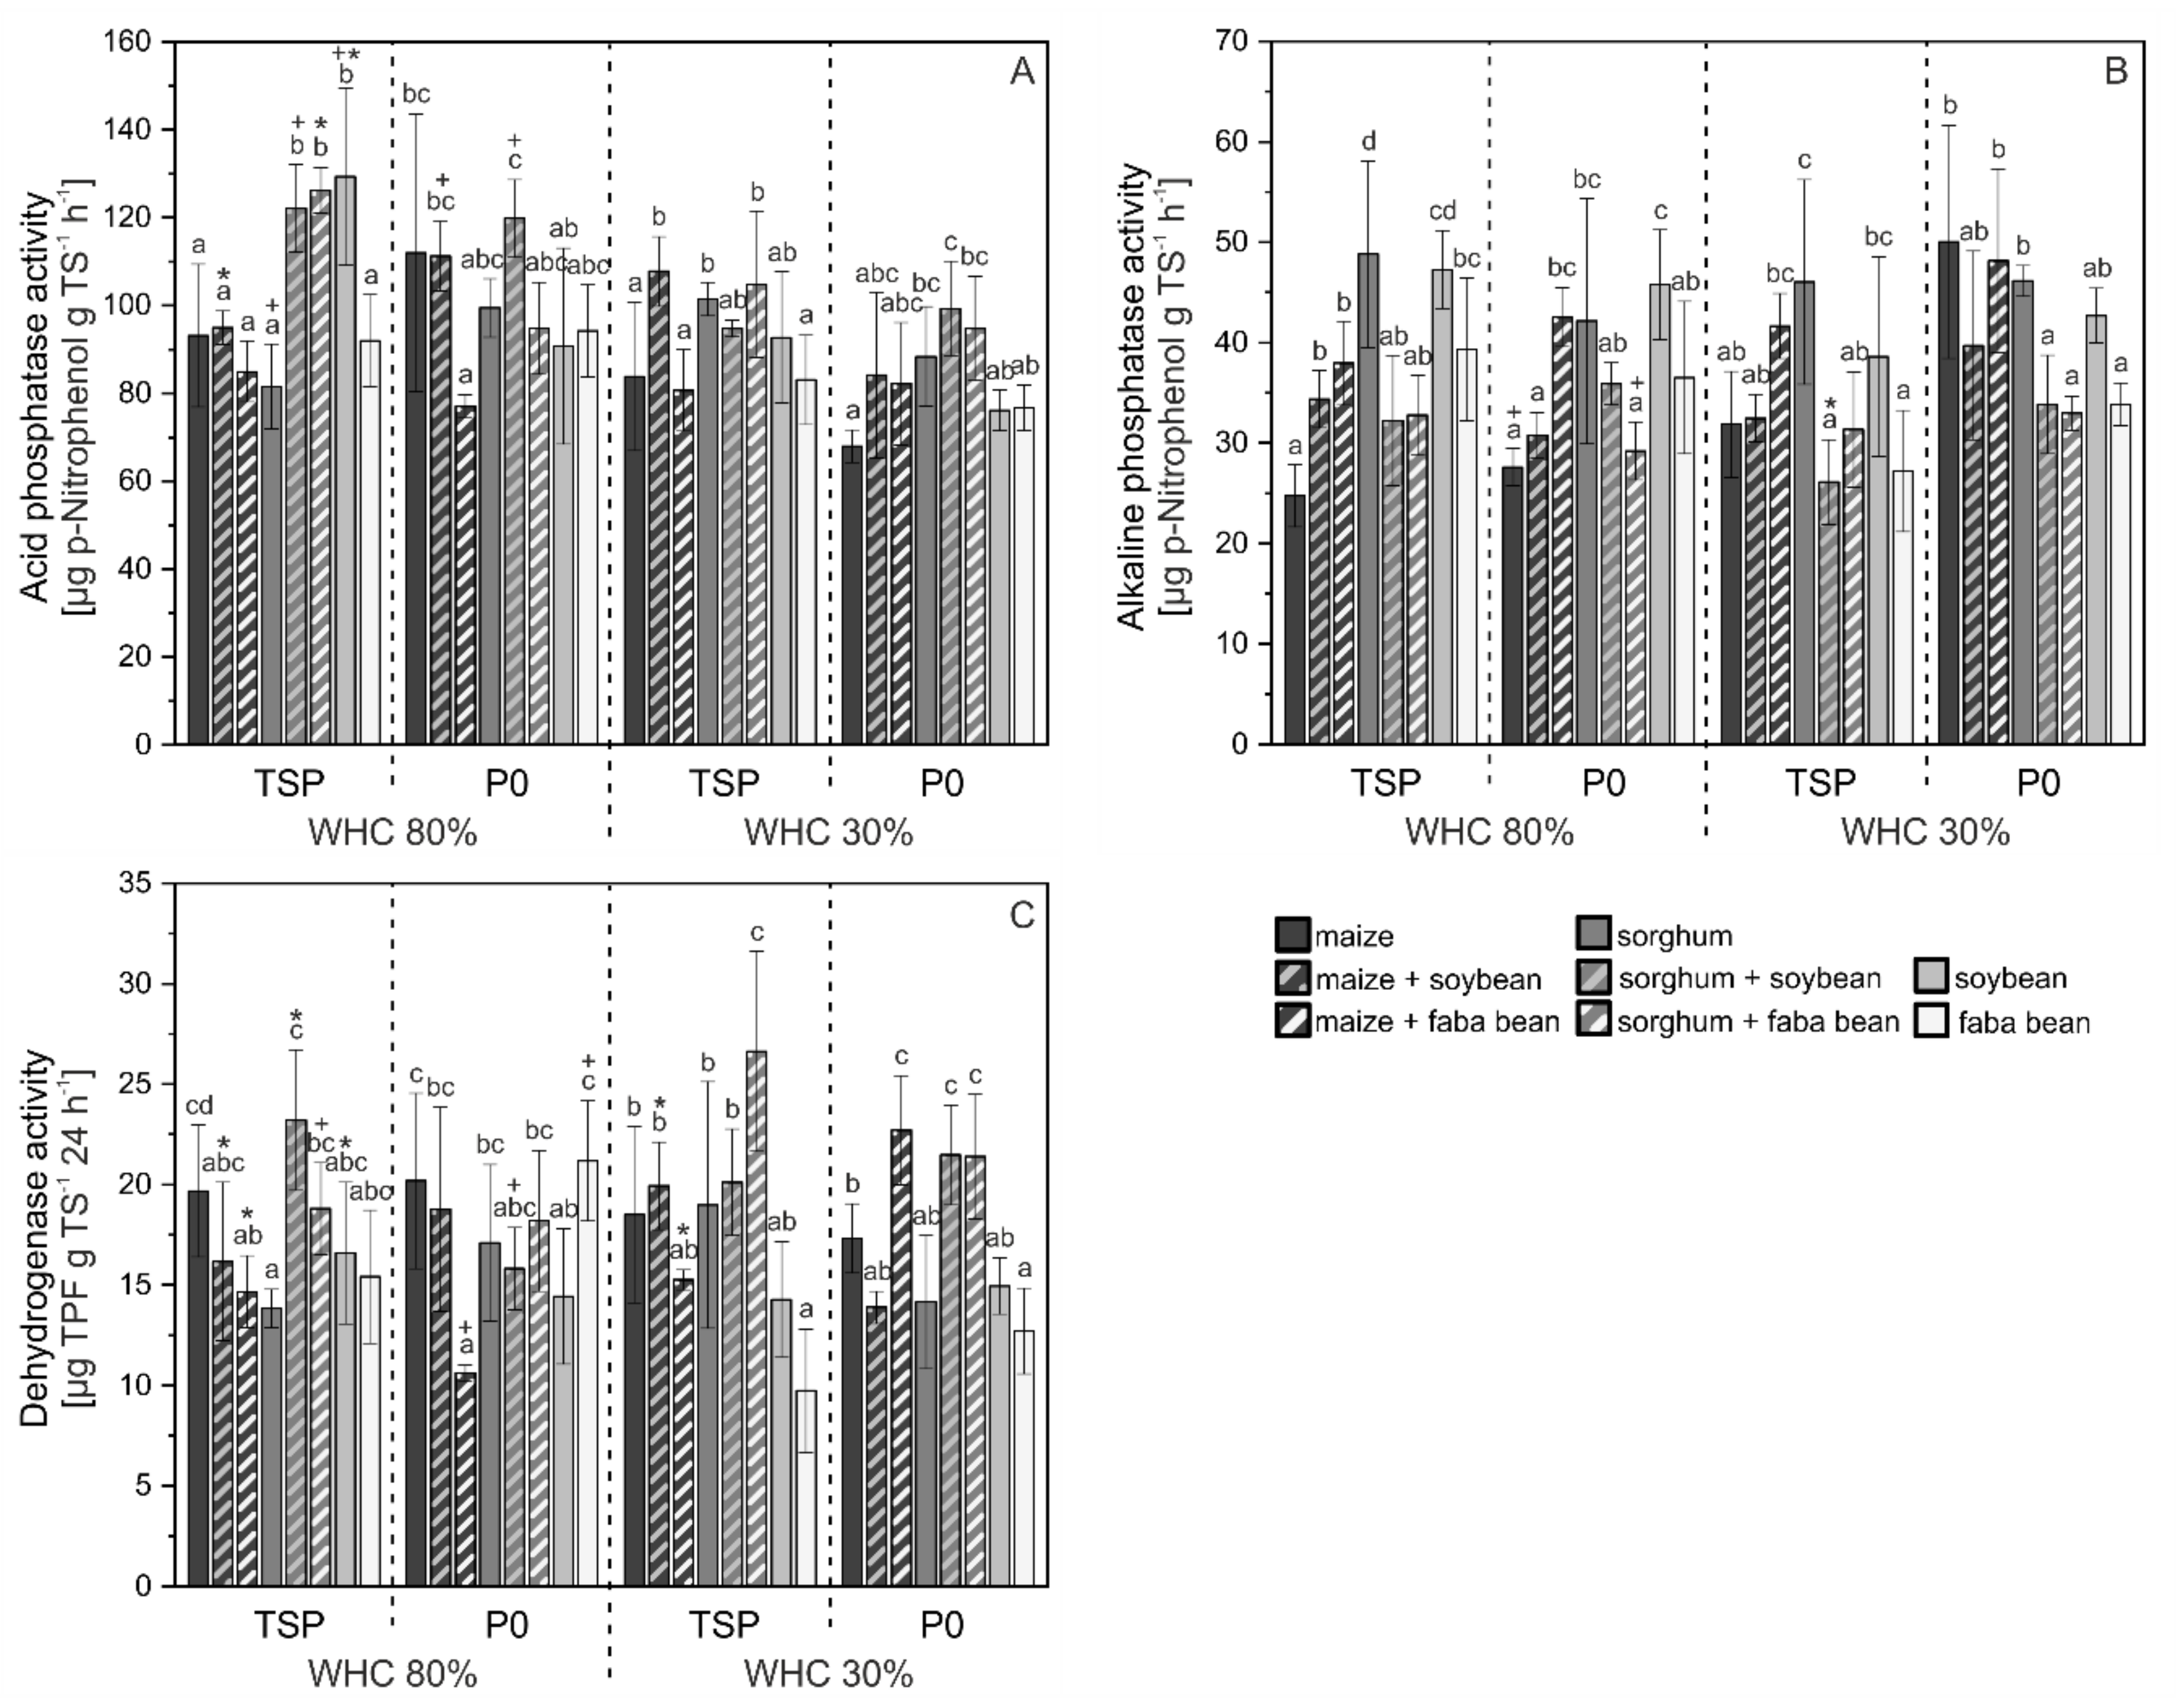
3.3. Activity of Enzymes in Soil

All factors tested affected the activity of enzymes measured (acid and alk Pase, DH) in soil (Figure 9, Appendix Table A2), whereas the highest effect size (Eta2) was found for the crop factor.
The acid Pase was mainly found to be increased in the mixed cropping of sorghum and legumes in comparison to sorghum solo. For the mixtures with maize only the combination with soybean resulted in higher activities of acid Pase (average of all P and water levels). The combination of maize + faba bean had comparably low activities of acid Pase which is in relation to the relatively high pH in this treatment. On average, the deficiency of water decreased the activity of the acid Pase by about 10%, but significant reductions were only found in combination with sole cropped maize and the legumes (average of both P treatments).
The activity of alk Pase was also affected by the crops but with inconsistent results. A positive effect of mixed cropping was only found for the combination of maize + faba bean (average of all water and P treatments). In contrast to the acid Pase, the highest activities of alk Pase were found under combined water and P deficiency.
A clear crop effect was found regarding the activity of DH, and—like for acid Pase—on average, the highest activities were measured in the mixtures of sorghum and legumes. The water and P supply showed only little effects without consistent results.
Under water deficiency, significantly positive correlations between the activity of acid Pase and the yields (r = 0.269, p < 0.05) and the P uptake (r = 0.264, p < 0.05) of the plants were found. Furthermore, the acid Pase was positively correlated with the Pdl values (r = 0.309, p < 0.01) and negatively with the pH values (−0.358, p < 0.01). For the other enzymes, these correlations were more diverse without a clear trend (data not shown).

4. Discussion

4.1. Biomass and Nutrient Uptake Mainly Affected by Water Supply

Maize in sole cropping had the highest shoot biomass and was superior to all other crop treatments when water was not limited. Under water deficiency, however, the biomass production of maize decreased sharply (about 60%) and more than for all other crops. The reduction of the shoot biomass of the crops mixtures due to water shortage was less pronounced, and finally, the crop mixtures produced the same biomass under drought as the sole cropped monocots. This indicates the potential of mixed cropping under unfavorable growing conditions. In this context, mixed cropping was highlighted as suitable option for water deficient sites and for mitigation of climate change effects [44]. As in our experiment, higher yields of mixed cropping in comparison to sole cropped maize were rarely found in previous studies and mainly the yield stability in mixed cropping systems was emphasized [33].
Plant density is an important factor in mixed cropping. Here, one can distinguish between a replacement design (where the density of one sole crop species is proportionally replaced by the other species) and an additive design (where at least one species in the mixtures have the same density as in sole cropping), while intermediate designs are also applied. In our trials, the main outcomes regarding mixed cropping were similar for the replacement design in the Water-Trial and the intermediate design in the Water-P-Trial, although we cannot directly compare the two trials. Missing advantages of higher seed densities could be explained by the limited soil volume in pot trials and increasing crop competition, but also in field experiments, the advantages of mixed cropping were more often found for replacement designs than for additive designs [33,34]. The cereal crop, i.e., maize or sorghum, was the main yield component and the legumes contributed relatively little to the yield, usually accounting for less than 20%. Low shares of legumes in the total biomass of crop mixtures were also shown in a meta-analysis by Yu et al. [9] in 409 out of 552 cases. Despite the low biomass share in the mixtures, legumes were shown to be suitable mixing partners and their development is impaired when the seed density of the dominant crop is increased [45].
In the Water-Trial, the number of plants of each species was reduced to 50% in the mixed cropping treatments in comparison to sole cropping, i.e., from four plants to two plants. However, in mixed cropping, the biomass of maize and sorghum was clearly higher than 50% of the biomass produced in sole cropping and the individual monocot plant gained weight in the mixtures (Appendix Table A5). This finding showed that the monocots got some advantage from the combination with the legumes. There are at least two explanations for this. On the one hand, the monocots have more space in the pots because the above-ground biomass of the legumes is lower than that of the monocots and the legumes have also formed much less root biomass. The importance of complementary root systems is often given as an advantage of mixed cropping under field conditions [28], but may also have importance in pots, despite the limited soil volume. On the other hand, the legumes might have promoted the growth of the monocots directly, for example, by increasing the activity of soil enzymes, which was higher in mixed than in sole cropping (see Section 4.2). This also points to a weaker interspecific competition than the intraspecific competition for plant growth factors and facilitative interactions between the crops [46,47].
The effect of drought on shoot biomass was clearly greater than that of P deficiency in our study. P supply in the Water-P-Trial had rather positive effects on plant biomass and P uptake in the well-watered treatments with 80% WHC, but it was rarely shown that P supply mitigate the negative yield effects of water deficit in the 30% WHC treatments. In contrary, Garg et al. [48] found that application of P emasculated yield reduction induced by drought in moth bean (Vigna acotinifolia (Jacq.) Maréchal) in a loamy sand. This cited study, however, considered the seed yield after the total vegetation time. Thus, the relatively short experimental period in our study and the focus on the total shoot biomass can be reasons for the missing positive effects of P supply under drought stress conditions. Also the level of drought stress can be relevant. Burman et al. [49] documented increased dry matter and seed yield due to P application at moderate drought stress in clusterbean (Cyamopsis tetragonoloba (L.) Taub.), and probably the severe drought stress in our experiment dominated possible P effects.
Legumes have the ability to fix N biologically from the air which can reduce or remove the need to apply N fertilizers [50]. In order to ensure a proper development of the crops in our experiment, we had to modify the N supply in accordance to the crop demand, which is about five times higher for maize than for legumes. Nitrogen application to mixtures of monocots and legumes supports the development of the cereals and may lead to a failure of the legumes [9]. Therefore, we reduced the N supply in the mixtures by 50% compared to maize or sorghum in sole cropping. Different rates of N supply for mixed cropping independent of the mixing partners were also applied in other studies [47,51,52]. The lower N supply to the mixtures can help to save fertilizers, but can also be one reason for the lower yields observed in the mixtures under good water supply, in which case maize and sorghum cannot fully benefit from the N fixation of the legumes.

4.2. P mobilization in Mixed Cropping

The P pools investigated were affected by crop cultivation. Usually, the cultivation of the sole legumes and the mixtures resulted in higher concentrations of the labile soil P pools (Pw and Pdl) than the sole cropped monocots. For the sole cropped legumes, this can partly be explained by low biomass production and low P uptakes, and following that, less exhaustion of the soil P pools. However, for the mixtures, the higher P concentration in the labile soil pools cannot be explained by lower P removals with the crop harvest, as the P uptake of the mixtures was usually in the range than that of sole cropped monocots. Therefore, we suggest a direct P mobilization by the leguminous partners in the mixtures. This was found particularly under combined drought and P deficiency and underlines our postulation that the facilitation in mixed cropping might be greater under sub-optimal conditions.
Legumes were shown to excrete larger amounts of P mobilizing exudates [53], which can also support the P nutrition of other species in the mixtures with less capacities of P mobilization [54]. Examples of the this one-way facilitated P nutrition in crop mixtures were often reasoned with the alteration of carboxylate concentration and proton exudation by the legumes [55,56]. In our study we focused on soil enzymes as P mobilizing compounds and possible explanation for higher available P pools in mixed cropping than in sole cropped cereals. The acid Pase in soil is mainly excreted by plants and we often found higher activities of acid Pases for mixed cropping than for sole cropping. The acid Pase was also positively correlated with the available P contents (Pdl), although with this study we cannot answer to what extent this was caused by the mobilization of organic P. The potential to utilize organic P in soil by high activities of the acid phosphatase were previously shown for wheat in mixtures with chickpea (Cicer arietinum L.) [57] and, more generally, for highly diverse cropping systems [31,58]. As the microbial community structure in the soil also depends on plant species cultivated [55], cropping can also influence the microbial part of enzyme excretion. This can explain the crop effect on the DH and alk Pase, which are mainly produced by soil microorganisms [59].
The size and form of pots affects the plant rooting patterns [60], and although the root distribution in the pots at harvest was dense, we cannot be sure that all soil investigated was rhizosphere soil. In the close vicinity of the roots, the activities of acid Pase could have been higher, as Nurruzzman et al. [16] found elevated activities of acid Pase of legumes mainly at a distance of less than 4 mm from the roots. The release of P mobilizing compounds is also affected by the age of root segments [10] and positive effects of faba bean on P nutrition of maize was rather found for later growing stages [61]. Thus, a longer experimental time may have resulted in more consistent advantages of the mixtures in all treatments of our study.
Increased P availability in the rhizosphere of legumes was often explained by acidification due to proton release during N2 fixation of the legumes [8,25,62]. However, considering the relatively low pH values in our experiments (especially in the Water-Trial), an acidification probably would not have resulted in higher P availability. In contrast, even higher pH values were found after cultivation of faba bean in comparison to the monocots under drought and P deficiency in the Water-P-Trial. Alkalization, mainly related to Ca availability, can also increase rhizosphere P availability, especially in non-calcareous soils [10,63] and positive effects in this regard were found for cereal–legumes mixtures with chickpea and durum wheat [25] and cowpea and maize [56]. This may explain the tendency towards higher available P content (Pdl) in soil when the monocots were combined with faba bean compared to the mixtures with soybean in the Water-P-Trial.
The availability of fewer mobile nutrients such as P is in particular affected by drought [64]. The water supply in our study, however, had almost no impacts on the available P contents in soil. This could be justified by the lower production of biomass due to the lack of water and thus less P uptake. The lower exhaustion of soil P pools may thereby have offset the reduced P availability.

5. Conclusions

This study showed that, under water and P shortage, mixed cultivation of maize or sorghum with faba bean or soybean could compete with the monocots in sole cropping regarding biomass yields. Following this, under sub-optimal growing conditions, crop cultivation in mixtures can be a suitable agronomic solution and represents a contribution to ecological intensification and agro-biodiversity. The general potential of P mobilization of the selected mixtures could be demonstrated, but the concrete benefit for plant P nutrition may vary and should be validated for longer growing periods under differing growing conditions.

Author Contributions

Conceptualization: B.E.-L., N.D.J., C.B., and S.B., methodology: B.E.-L., C.B., and S.B., investigation: B.E.-L., C.B., and S.B.; writing—Original draft preparation, B.E.-L., C.B., and S.B., writing—Review and editing: B.E.-L., M.K., N.D.J., and C.B., visualization: M.K., B.E.-L., and S.B.; supervision: B.E.-L., project administration: B.E.-L., C.B., and S.B.; funding acquisition: B.E.-L. All authors have read and agreed to the published version of the manuscript.

Funding

This research was funded by German Federal Ministry of Food and Agriculture and the FNR (Fachagentur Nachwachsende Rohstoffe e.V.); grant number: FNR-22030111. N.D.J. received funding from the Bioeconomy Science Center (BioSC), supported in the project AP3 Focus Lab. The scientific activities of the Bioeconomy Science Center were financially supported by the Ministry of Innovation, Science and Research within the framework of the NRW Strategieprojekt BioSC (no. 313/323-400-002 13).

Acknowledgments

This research was performed within the scope of the Leibniz ScienceCampus Phosphorus Research Rostock.

Conflicts of Interest

The authors declare no conflict of interest.

Appendix A

Table A1. Single and interactive effects of water supply and cropping (ANOVA, p-values and effect size (eta2 in brackets) in the Water-Trial.
WaterCropWater × Crop
shoot dry mass0.0000.0000.000
(0.950)(0.948)(0.778)
P uptake0.0000.0000.000
(0.945)(0.759)(0.539)
N uptake0.0000.0010.000
(0.778)(0.395)(0.516)
root length0.0000.0000.008
(0.554)(0.713)(0.339)
root-shoot-ratio0.0000.0000.000
(0.607)(0.731)(0.494)
pH0.3970.1470.604
(0.016)(0.204)(0.109)
Pw0.9040.0000.852
(0.000)(0.437)(0.068)
Pdl0.0000.0000.280
(0.241)(0.530)(0.166)
Pox0.0400.6440.259
(0.090)(0.103)(0.171)
Table A2. Single and interactive effects of water supply, phosphorus supply and cropping (ANOVA, p-values and effect size (eta2 in brackets) in the Water-P-Trial.
WaterP SupplyCropCrop × P SupplyCrop × WaterP Supply × WaterCrop × P Supply × Water
shoot dry mass0.0000.0000.0000.0030.0000.0000.761
(0.902)(0.492)(0.920)(0.205)(0.621)(0.216)(0.043)
P uptake0.0000.0000.0000.1740.0000.0000.954
(0.877)(0.349)(0.765)(0.102)(0.373)(0.160)(0.022)
N uptake0.0000.0000.0000.3220.0000.0280.953
(0.806)(0.209)(0.809)(0.082)(0.389)(0.051)(0.022)
pH0.0050.0750.0000.5020.0000.5690.020
(0.081)(0.034)(0.613)(0.064)(0.430)(0.003)(0.160)
Pw0.7610.0000.0000.8990.0000.6790.085
(0.001)(0.754)(0.649)(0.029)(0.345)(0.002)(0.123)
Pdl0.1500.0000.0010.3970.7810.4740.191
(0.022)(0.400)(0.218)(0.074)(0.041)(0.006)(0.099)
Pox0.5060.0000.0000.8700.1990.6870.852
(0.005)(0.234)(0.405)(0.033)(0.098)(0.002)(0.034)
acid Pase0.0000.0050.0000.0050.0020.1340.001
(0.259)(0.083)(0.400)(0.191)(0.209)(0.024)(0.232)
alk Pase0.4000.0110.0000.0680.0000.0010.845
(0.008)(0.067)(0.513)(0.129)(0.285)(0.110)(0.035)
dehydrogenase0.4250.4440.0000.0270.0000.7670.000
(0.007)(0.006)(0.414)(0.152)(0.350)(0.001)(0.291)
Pw = phosphorus soluble in water, Pdl = phosphorus soluble in double-lactate (DL), Pox = phosphorus soluble in oxalate extract, alk Pase = alkaline phosphatase, acid Pase = acid phosphatase.
Table A3. Reduction of yield and nutrient uptake in consequence of drought in the Water-Trial.
MAMA + SBMA + FBSOSO + SBSO + FBSBFB
Change in Shoot Biomass (DM) Due to Drought Stress (%)
−58.9−42.7−38.9−51.7−41.1−45.3−49.2−48.0
Change in P Uptake Due to Drought Stress (%)
−68.1−61.9−50.0−57.4−51.1−52.4−49.7−62.8
Change in N Uptake Due to Drought Stress (%)
−18.2−31.3−19.1−9.41−32.9−29.2−39.3−50.3
MA = maize, SO = sorghum, SB = soybean, FB = faba bean, DM = dry mass.
Table A4. Reduction of yield and nutrient uptake in consequence of drought and P deficit in the Water-P-Trial.
WHC %Fertil.MaMa + SBMa + FBSOSO + SBSO + FBSBFB
Change in Shoot Biomass (DM) Due to Drought Stress (%)
TSP−59.4−41.0−46.6−46.6−36.0−33.8−66.3−59.2
P0−55.0−37.9−35.4−43.0−29.9−34.8−48.3−47.2
mean −57.4−39.6−41.5−45.1−33.3−34.3−58.1−53.7
Change in Shoot Biomass (DM) Due to P Deficit (%)
80−19.9−19.4−18.8−28.6−23.9−13.3−17.5−16.7
30−11.3−15.3−1.78−23.7−16.7−14.7+26.5+7.80
mean −17.4−17.9−12.8−26.9−21.1−13.9+6.40−9.57
Change in P Uptake Due to Drought Stress (%)
TSP−61.0−40.9−48.9−45.5−40.0−41.4−71.2−60.4
P0−55.0−26.2−45.9−44.3−39.6−42.0−52.4−51.6
mean −58.3−34.3−47.4−45.0−39.8−41.6−62.5−56.3
Change in P Uptake Due to P-Deficit (%)
80−17.3−20.2−15.3−27.3−17.1−20.6−16.4−17.8
30−4.58−0.26−10.2−25.8−16.5−21.3+38.2+0.51
mean −13.7−12.8−13.6−26.8−16.9−20.8−4.18−12.6
Change in N Uptake Due to Drought Stress (%)
TSP−50.4−23.2−39.7−34.8−23.9−30.1−45.8−56.1
P0−46.7−22.5−38.2−34.4−18.5−31.2−36.8−44.7
mean −48.6−22.9−39.0−34.5−21.4−30.5−41.0−51.0
Change in N Uptake Due to P-Deficit (%)
80−11.6−7.49−9.61−17.0−15.9−12.6+1.4−19.9
30−4.89−6.64−7.28−16.6−9.95−13.9+18.2+0.70
mean −9.38−7.12−8.73−16.9−13.4−13.1+7.33−13.6
MA = maize, SO = sorghum, SB = soybean, FB = faba bean, DM = dry mass.
Table A5. Biomass of one individual plant in the Water-Trial.
WHC 80% WHC 30% Change Due to Mixed Cropping
SoloMixSoloMixWHC 80%WHC 30%
maize16.620.96.8312.64+25.6+85.0
sorghum12.314.35.968.64+16.3+45.1
soybean5.964.933.171.98−17.2−37.7
faba bean5.733.592.982.14−37.4−28.2
Table A6. Effect of water supply on root length and root:shoot ratio of the crops and mixtures in the Water-Trial (mean ± SD).
WHC %80 30 Mean
Root Length (m pot−1)
MA664 ± 94.2D *381 ± 87.2E522F
MA + SB469 ± 89.1C *221 ± 11.3ABC363D
MA + FB299 ± 16.4B *251 ± 14.6BCD275BC
SO457 ± 83.3C390 ± 11.4E428E
SO + SB485 ± 65.7C302 ± 28.4D378DE
SO + FB360 ± 72.4B281 ± 40.2CD321CD
SB286 ± 23.5B *184 ± 16.9AB235AB
FB188 ± 22.6A175 ± 34.4A181A
mean401b271a
Root: Shoot Ratio (m g−1)
MA10.0 ± 1.28B14.0 ± 3.47B12.0BC
MA + SB9.18 ± 1.39B7.79 ± 0.75A8.59A
MA + FB6.22 ± 0.16A8.71 ± 1.57A7.46A
SO9.23 ± 1.00B *15.3 ± 1.29B11.8BC
SO + SB13.1 ± 1.85C13.8 ± 1.33B13.5C
SO + FB9.32 ± 1.80B *13.4 ± 1.83B11.3B
SB12.0 ± 1.22C14.6 ± 1.87B 13.3C
FB8.37 ± 1.90B *14.7 ± 1.66B11.5B
mean9.6812.9
MA = maize, SO = sorghum, SB = soybean, FB = faba bean, WHC = water holding capacity. Different small letters indicate significant differences between water treatments, different capital letters indicate significant differences between crop species (ANOVA and Duncan’s test, p ≤ 0.05).

References

  1. Fachagentur Nachwachsende Rohstoffe. Basisdaten Bioenergie Deutschland 2019; Fachagentur Nachwachsende Rohstoffe e.V.: Gilcov, Germany, 2019; Volume 17. [Google Scholar]
  2. Gründinger, W. The Renewable Energy Sources Act (EEG). In Energiepolitik und Klimaschutz. Energy Policy and Climate Protection; Gründinger, W., Ed.; Springer: Wiesbaden, Germany, 2017; pp. 257–419. [Google Scholar] [CrossRef]
  3. Huth, E.; Paltrinieri, S.; Thiele, J. Bioenergy and its effects on landscape aesthetics—A survey contrasting conventional and wild crop biomass production. Biomass Bioenergy 2019, 122, 313–321. [Google Scholar] [CrossRef]
  4. Das, A.; Lal, R.; Somireddy, U.; Bonin, C.; Verma, S.; Rimal, B.K. Changes in soil quality and carbon storage under biofuel crops in central Ohio. Soil Res. 2016, 54, 371–382. [Google Scholar] [CrossRef]
  5. Gevers, J.; Høye, T.T.; Topping, C.J.; Glemnitz, M.; Schröder, B. Biodiversity and the mitigation of climate change through bioenergy: Impacts of increased maize cultivation on farmland wildlife. GCB Bioenergy 2011, 3, 472–482. [Google Scholar] [CrossRef]
  6. Seifert, C.; Leuschner, C.; Culmsee, H. Arable plant diversity on conventional cropland—The role of crop species, management and environment. Agric. Ecosyst. Environ. 2015, 213, 151–163. [Google Scholar] [CrossRef]
  7. von Cossel, M.; Wagner, M.; Lask, J.; Magenau, E.; Bauerle, A.; von Cossel, V.; Warrach-Sagi, K.; Elbersen, B.; Staritsky, I.; van Eupen, M.; et al. Prospects of Bioenergy Cropping Systems for A More Social-Ecologically Sound Bioeconomy. Agronomy 2019, 9, 605. [Google Scholar] [CrossRef] [Green Version]
  8. Hauggaard-Nielsen, H.; Jensen, E.S. Facilitative root interactions in intercrops. Plant Soil 2005, 274, 237–250. [Google Scholar] [CrossRef]
  9. Yu, Y.; Stomph, T.-J.; Makowski, D.; Zhang, L.; van der Werf, W. A meta-analysis of relative crop yields in cereal/legume mixtures suggests options for management. Field Crops Res. 2016, 198, 269–279. [Google Scholar] [CrossRef] [Green Version]
  10. Hinsinger, P.; Betencourt, E.; Bernard, L.; Brauman, A.; Plassard, C.; Shen, J.; Tang, X.; Zhang, F. P for two, sharing a scarce resource: Soil phosphorus acquisition in the rhizosphere of intercropped species. Plant Physiol. 2011, 156, 1078–1086. [Google Scholar] [CrossRef] [Green Version]
  11. Zhang, W.-P.; Liu, G.-C.; Sun, J.-H.; Zhang, L.-Z.; Weiner, J.; Li, L. Growth trajectories and interspecific competitive dynamics in wheat/maize and barley/maize intercropping. Plant Soil 2015, 397, 227–238. [Google Scholar] [CrossRef]
  12. Eisenhauer, N. Aboveground–belowground interactions as a source of complementarity effects in biodiversity experiments. Plant Soil 2012, 351, 1–22. [Google Scholar] [CrossRef]
  13. Pappa, V.A.; Rees, R.M.; Walker, R.L.; Baddeley, J.A.; Watson, C.A. Legumes intercropped with spring barley contribute to increased biomass production and carry-over effects. J. Agric. Sci. 2012, 150, 584–594. [Google Scholar] [CrossRef]
  14. Dissanayaka, D.M.S.; Maruyama, H.; Masuda, G.; Wasaki, J. Interspecific facilitation of P acquisition in intercropping of maize with white lupin in two contrasting soils as influenced by different rates and forms of P supply. Plant Soil 2015, 390, 223–236. [Google Scholar] [CrossRef]
  15. Vance, C.P.; Uhde-Stone, C.; Allan, D.L. Phosphorus acquisition and use: Critical adaptations by plants for securing a nonrenewable resource. New Phytol. 2003, 157, 423–447. [Google Scholar] [CrossRef] [Green Version]
  16. Nuruzzaman, M.; Lambers, H.; Bolland, M.D.A.; Veneklaas, E.J. Distribution of carboxylates and acid phosphatase and depletion of different phosphorus fractions in the rhizosphere of a cereal and three grain legumes. Plant Soil 2006, 281, 109–120. [Google Scholar] [CrossRef]
  17. Eichler, B.; Caus, M.; Schnug, E.; Köppen, D. Soil acid and alkaline phosphatase activities in regulation to crop species and fungal treatment, Landbauforsch. Volkenrode 2004, 54, 1–5. [Google Scholar]
  18. Garland, G.M. Phosphorus Cycling in Soil Aggregate Fractions in Maize-Pigeon Pea Intercropping Systems of Malawi. Ph.D. Thesis, ETH Zurich, Zurich, Switzerland, 2017. [Google Scholar] [CrossRef]
  19. He, Y.; Ding, N.; Shi, J.; Wu, M.; Liao, H.; Xu, J. Profiling of microbial PLFAs: Implications for interspecific interactions due to intercropping which increase phosphorus uptake in phosphorus limited acidic soils. Soil Biol. Biochem. 2013, 57, 625–634. [Google Scholar] [CrossRef]
  20. Farooq, M.; Hussain, M.; Wahid, A.; Siddique, K.H.M. Drought Stress in Plants: An Overview. In Plant Responses Drought Stress; Aroca, R., Ed.; Springer: Berlin/Heidelberg, Germany, 2012; pp. 1–33. [Google Scholar] [CrossRef]
  21. Turner, L.B. Changes in the Phosphorus Content of Capsicum annuum Leaves during Water Stress. J. Plant Physiol. 1985, 121, 429–439. [Google Scholar] [CrossRef]
  22. Waraich, E.; Ahmad, A.; Ashraf, R.; Saifullah, M.Y.; Ahmad, M. Improving agricultural water use efficiency by nutrient management in crop plants. Acta Agric. Scand. Sect. B Soil Plant Sci. 2011, 61, 291–304. [Google Scholar] [CrossRef]
  23. Belnap, J. Biological phosphorus cycling in dryland regions. In Phosphorus in Action; Springer: Berlin/Heidelberg, Germany, 2011; pp. 371–406. [Google Scholar] [CrossRef]
  24. Sardans, J.; Peñuelas, J.; Prieto, P.; Estiarte, M. Drought and warming induced changes in P and K concentration and accumulation in plant biomass and soil in a Mediterranean shrubland. Plant Soil 2008, 306, 261–271. [Google Scholar] [CrossRef]
  25. Betencourt, E.; Duputel, M.; Colomb, B.; Desclaux, D.; Hinsinger, P. Intercropping promotes the ability of durum wheat and chickpea to increase rhizosphere phosphorus availability in a low P soil. Soil Biol. Biochem. 2012, 46, 181–190. [Google Scholar] [CrossRef]
  26. Daleo, P.; Iribarne, O. Beyond competition: The stress-gradient hypothesis tested in plant–herbivore interactions. Ecology 2009, 90, 2368–2374. [Google Scholar] [CrossRef] [PubMed]
  27. Jamia, S.; Umar, H. Alleviating Adverse Effects of Water Stress on Yield of Sorghum, Mustard and Groundnut by Potassium Application. Pak. J. Bot. Pak. 2006. Available online: https://agris.fao.org/agris-search/search.do?recordID=PK2008000016 (accessed on 17 June 2020).
  28. Li, L.; Li, S.-M.; Sun, J.-H.; Zhou, L.-L.; Bao, X.-G.; Zhang, H.-G.; Zhang, F.-S. Diversity enhances agricultural productivity via rhizosphere phosphorus facilitation on phosphorus-deficient soils. Proc. Natl. Acad. Sci. USA 2007, 104, 11192–11196. [Google Scholar] [CrossRef] [PubMed] [Green Version]
  29. Ren, Y.; Liu, J.; Wang, Z.; Zhang, S. Planting density and sowing proportions of maize–soybean intercrops affected competitive interactions and water-use efficiencies on the Loess Plateau, China. Eur. J. Agron. 2016, 72, 70–79. [Google Scholar] [CrossRef]
  30. Wolińska, A.; Stępniewska, Z. Dehydrogenase activity in the soil environment. In Dehydrogenases; Canuto, R.A., Ed.; InTech: London, UK, 2012; pp. 183–210. [Google Scholar] [CrossRef] [Green Version]
  31. Ehrmann, J.; Ritz, K. Plant: Soil interactions in temperate multi-cropping production systems. Plant Soil 2014, 376, 1–29. [Google Scholar] [CrossRef] [Green Version]
  32. Hupfauf, S.; Bachmann, S.; Juárez, M.F.; Insam, H.; Eichler-Löbermann, B. Biogas digestates affect crop P uptake and soil microbial community composition. Sci. Total Environ. 2016, 542, 1144–1154. [Google Scholar] [CrossRef]
  33. Raseduzzaman, M.d.; Jensen, E.S. Does intercropping enhance yield stability in arable crop production? A meta-analysis. Eur. J. Agron. 2017, 91, 25–33. [Google Scholar] [CrossRef]
  34. Kiær, L.P.; Weisbach, A.N.; Weiner, J. Root and shoot competition: A meta-analysis. J. Ecol. 2013, 101, 1298–1312. [Google Scholar] [CrossRef]
  35. Zicker, T.; von Tucher, S.; Kavka, M.; Eichler-Löbermann, B. Soil test phosphorus as affected by phosphorus budgets in two long-term field experiments in Germany. Field Crops Res. 2018, 218, 158–170. [Google Scholar] [CrossRef]
  36. Schiemenz, K.; Eichler-Löbermann, B. Biomass ashes and their phosphorus fertilizing effect on different crops. Nutr. Cycl. Agroecosyst. 2010, 87, 471–482. [Google Scholar] [CrossRef] [Green Version]
  37. Schinner, F.; Öhlinger, R.; Kandeler, E.; Margesin, R. (Eds.) Bodenbiologische Arbeitsmethoden, 2nd ed.; Springer: Berlin/Heidelberg, Germany, 1993. [Google Scholar] [CrossRef]
  38. Page, A.L.; Miller, R.H.; Keeney, D.R. Methods of Soil Analysis. Part 2. Chemical and Microbial Properties; American Society of Agronomy: Madison, WI, USA, 1982. [Google Scholar]
  39. van der Paauw, F. An effective water extraction method for the determination of plantavailable soil phosphorus. Plant Soil 1971, 34, 467–481. [Google Scholar] [CrossRef]
  40. Riehm, H. Arbeitsvorschrift zur Bestimmung der Phosphorsäure und des Kaliums nach Lactatverfahren. Zeitschrift Pflanzenernährung Düngung Bodenkunde 1948, 40, 152–156. [Google Scholar]
  41. Schwertmann, U. Differenzierung der Eisenoxide des Bodens durch Extraktion mit Ammoniumoxalat-Lösung. Z. Für Pflanzenernähr. Düng. Bodenkd. 1964, 105, 194–202. [Google Scholar] [CrossRef]
  42. Tabatabai, M.A.; Bremner, J.M. Use of p-nitrophenol phosphate for the assay of soil phosphatase activity. Soil Biol. Biochem. 1969, 1, 301–307. [Google Scholar] [CrossRef]
  43. Thalmann, H. Zur Methodik der Dehydrogenaseaktivität im Boden mittels Triphenyltetrazoliumchlorid (TTC). Landwirtsch. Forsch. 1968, 21, 243–258. [Google Scholar]
  44. Rusinamhodzi, L.; Corbeels, M.; Nyamangara, J.; Giller, K.E. Maize–grain legume intercropping is an attractive option for ecological intensification that reduces climatic risk for smallholder farmers in central Mozambique. Field Crops Res. 2012, 136, 12–22. [Google Scholar] [CrossRef] [Green Version]
  45. Bedoussac, L.; Journet, E.-P.; Hauggaard-Nielsen, H.; Naudin, C.; Corre-Hellou, G.; Jensen, E.S.; Prieur, L.; Justes, E. Ecological principles underlying the increase of productivity achieved by cereal-grain legume intercrops in organic farming. A review. Agron. Sustain. Dev. 2015, 35, 911–935. [Google Scholar] [CrossRef]
  46. Hauggaard-Nielsen, H.; Andersen, M.K.; Jørnsgaard, B.; Jensen, E.S. Density and relative frequency effects on competitive interactions and resource use in pea–barley intercrops. Field Crops Res. 2006, 95, 256–267. [Google Scholar] [CrossRef]
  47. Malézieux, E.; Crozat, Y.; Dupraz, C.; Laurans, M.; Makowski, D.; Ozier-Lafontaine, H.; Rapidel, B.; Tourdonnet, S.; Valantin-Morison, M. Mixing plant species in cropping systems: Concepts, tools and models. A review. Agron. Sustain. Dev. 2009, 29, 43–62. [Google Scholar] [CrossRef] [Green Version]
  48. Garg, B.K.; Burman, U.; Kathju, S. The influence of phosphorus nutrition on the physiological response of moth bean genotypes to drought. J. Plant Nutr. Soil Sci. 2004, 167, 503–508. [Google Scholar] [CrossRef]
  49. Burman, U.; Garg, B.K.; Kathju, S. Effect of Phosphorus Application on Clusterbean under Different Intensities of Water Stress. J. Plant Nutr. 2009, 32, 668–680. [Google Scholar] [CrossRef]
  50. Liu, Y.; Wu, L.; Baddeley, J.A.; Watson, C.A. Models of biological nitrogen fixation of legumes. A review. Agron. Sustain. Dev. 2011, 31, 155–172. [Google Scholar] [CrossRef]
  51. Bedoussac, L.; Justes, E. The efficiency of a durum wheat-winter pea intercrop to improve yield and wheat grain protein concentration depends on N availability during early growth. Plant Soil 2010, 330, 19–35. [Google Scholar] [CrossRef]
  52. Morgado, L.B.; Willey, R.W. Effects of plant population and nitrogen fertilizer on yield and efficiency of maize-bean intercropping. Pesqui. Agropecuária Bras. 2003, 38, 1257–1264. [Google Scholar] [CrossRef] [Green Version]
  53. Li, Z.; Gao, Q.; Liu, Y.; He, C.; Zhang, X.; Zhang, J. Overexpression of transcription factor ZmPTF1 improves low phosphate tolerance of maize by regulating carbon metabolism and root growth. Planta 2011, 233, 1129–1143. [Google Scholar] [CrossRef]
  54. Li, L.; Tilman, D.; Lambers, H.; Zhang, F.-S. Plant diversity and overyielding: Insights from belowground facilitation of intercropping in agriculture. New Phytol. 2014, 203, 63–69. [Google Scholar] [CrossRef] [PubMed]
  55. Li, H.; Shen, J.; Zhang, F.; Marschner, P.; Cawthray, G.; Rengel, Z. Phosphorus uptake and rhizosphere properties of intercropped and monocropped maize, faba bean, and white lupin in acidic soil. Biol. Fertil. Soils 2010, 46, 79–91. [Google Scholar] [CrossRef]
  56. Latati, M.; Blavet, D.; Alkama, N.; Laoufi, H.; Drevon, J.J.; Gérard, F.; Pansu, M.; Ounane, S.M. The intercropping cowpea-maize improves soil phosphorus availability and maize yields in an alkaline soil. Plant Soil 2014, 385, 181–191. [Google Scholar] [CrossRef]
  57. Li, L.; Tang, C.; Rengel, Z.; Zhang, F. Chickpea facilitates phosphorus uptake by intercropped wheat from an organic phosphorus source. Plant Soil 2003, 248, 297–303. [Google Scholar] [CrossRef]
  58. Ohm, M.; Paulsen, H.M.; Moos, J.H.; Eichler-Löbermann, B. Long-term negative phosphorus budgets in organic crop rotations deplete plant-available phosphorus from soil. Agron. Sustain. Dev. 2017, 37, 17. [Google Scholar] [CrossRef] [Green Version]
  59. Albiach, R.; Canet, R.; Pomares, F.; Ingelmo, F. Microbial biomass content and enzymatic activities after the application of organic amendments to a horticultural soil. Bioresour. Technol. 2000, 75, 43–48. [Google Scholar] [CrossRef]
  60. Poorter, H.; Bühler, J.; van Dusschoten, D.; Climent, J.; Postma, J.A. Pot size matters: A meta-analysis of the effects of rooting volume on plant growth. Funct. Plant Biol. 2012, 39, 839. [Google Scholar] [CrossRef] [Green Version]
  61. Li, L.; Zhang, F.; Li, X.; Christie, P.; Sun, J.; Yang, S.; Tang, C. Interspecific facilitation of nutrient uptake by intercropped maize and faba bean. Nutr. Cycl. Agroecosyst. 2003, 65, 61–71. [Google Scholar] [CrossRef]
  62. Li, H.; Shen, J.; Zhang, F.; Clairotte, M.; Drevon, J.J.; le Cadre, E.; Hinsinger, P. Dynamics of phosphorus fractions in the rhizosphere of common bean (Phaseolus vulgaris L.) and durum wheat (Triticum turgidum durum L.) grown in monocropping and intercropping systems. Plant Soil 2008, 312, 139–150. [Google Scholar] [CrossRef]
  63. Devau, N.; Hinsinger, P.; le Cadre, E.; Gerard, F. Root-induced processes controlling phosphate availability in soils with contrasted P-fertilized treatments. Plant Soil 2011, 348, 203–218. [Google Scholar] [CrossRef]
  64. Sardans, J.; Peñuelas, J.; Estiarte, M. Seasonal patterns of root-surface phosphatase activities in a Mediterranean shrubland. Responses to experimental warming and drought. Biol. Fertil. Soils 2007, 43, 779–786. [Google Scholar] [CrossRef]
Figure 1. Effect of water supply on biomass (shoot dry matter) of the crops and mixtures in the Water-Trial (mean ± SD). Different letters indicate significant differences between the crop variants at each water level, + indicates differences between the water levels (ANOVA and Duncan’s test, p ≤ 0.05). WHC = water holding capacity.
Agronomy 10 01506 g001
Figure 2. Effect of water supply and phosphorus supply on biomass (shoot dry matter) of the crops and mixtures in the Water-P-Trial (mean ± SD). Different letters indicate significant differences between the crop variants at each water and P level, + indicates differences between the water levels, * indicates differences between the P levels (ANOVA and Duncan’s test, p ≤ 0.05). WHC = water holding capacity, TSP = triple-super P, P0 = control without P.
Agronomy 10 01506 g002
Figure 3. Effect of water supply on phosphorus uptake of the crops and mixtures in the Water-Trial (mean ± SD). Different letters indicate significant differences between the crop variants at each water level, + indicates differences between the water levels (ANOVA and Duncan’s test, p ≤ 0.05). WHC = water holding capacity.
Agronomy 10 01506 g003
Figure 4. Effect of water supply and phosphorus supply on phosphorus uptake of the crops and mixtures in the Water-P-Trial (mean ± SD). Different letters indicate significant differences between the crop variants at each water and P level, + indicates differences between the water levels, * indicates differences between the P levels (ANOVA and Duncan’s test, p ≤ 0.05). WHC = water holding capacity, TSP = triple-super P, P0 = control without P.
Agronomy 10 01506 g004
Figure 5. Effect of water supply on nitrogen uptake of the crops and mixtures in the Water-Trial (mean ± SD). Different letters indicate significant differences between the crop variants at each water level, + indicates differences between the water levels (ANOVA and Duncan’s test, p ≤ 0.05). WHC = water holding capacity.
Agronomy 10 01506 g005
Figure 6. Effect of water supply and phosphorus supply on nitrogen uptake of the crops and mixtures in the Water-P-Trial (mean ± SD). Different letters indicate significant differences between the crop variants at each water and P level, + indicates differences between the water levels, * indicates differences between the P levels (ANOVA and Duncan’s test, p ≤ 0.05). WHC = water holding capacity, TSP = triple-super P, P0 = control without P.
Agronomy 10 01506 g006
Figure 7. Effect of water supply and crops on water-extractable phosphorus (Pw, A), double lactate-extractable phosphorus (Pdl, B), oxalate-soluble phosphorus (Pox, C) and pH (D) in soil after harvest in the Water-Trial (mean ± SD). Different letters indicate significant differences between the crop variants at each water level, + indicates differences between the water levels (ANOVA and Duncan’s test, p ≤ 0.05). WHC = water holding capacity.
Agronomy 10 01506 g007
Figure 8. Effect of water supply, phosphorus supply and crops on water-extractable phosphorus (Pw, A), double lactate-extractable phosphorus (Pdl, B), oxalate-soluble phosphorus (Pox, C) and pH (D) in soil after harvest in the Water-P-Trial (mean ± SD). Different letters indicate significant differences between the crop variants at each water and P level, + indicates differences between the water levels, * indicates differences between the P levels (ANOVA and Duncan’s test, p ≤ 0.05). WHC = water holding capacity, TSP = triple-super P, P0 = control without P.
Agronomy 10 01506 g008
Figure 9. Effect of water supply, phosphorus supply and crops on the activity of acid (A) and alkaline phosphatase (B) and dehydrogenase (C) in soil after crop harvest in the Water-P-Trial (mean ± SD). Different letters indicate significant differences between the crop variants at each water and P level, + indicates differences between the water levels, * indicates differences between the P levels (ANOVA and Duncan’s test, p ≤ 0.05). WHC = water holding capacity, TSP = triple-super P, P0 = control without P.
Agronomy 10 01506 g009

