Article

Agronomic and Environmental Implications of Substituting Pig Slurry for Synthetic Nitrogen in Mediterranean Wheat Systems

Unidad de Suelos y Riegos (asociada a EEAD-CSIC), Centro de Investigación y Tecnología Agroalimentaria de Aragón (CITA), Avda, Montañana 930, 50059 Zaragoza (España), Spain
*
Author to whom correspondence should be addressed.
Agronomy 2020, 10(10), 1498; https://doi.org/10.3390/agronomy10101498
Submission received: 9 July 2020 / Revised: 28 September 2020 / Accepted: 29 September 2020 / Published: 1 October 2020
(This article belongs to the Section Soil and Plant Nutrition)

Abstract

:
Using slurries as fertilizers is a promising strategy for the reuse of nutrients and striving towards a circular economy. This study aims to assess the agronomic productivity and the environmental effects on Mediterranean sprinkler-irrigated wheat during three consecutive years of (1) the use of pig slurry (PS) as a substitute for a synthetic fertilizer (urea, U) and (2) the addition of a urease inhibitor (monocarbamide dihydrogen sulfate, MCDHS) to pig slurry (PSI). A nitrogen (N) target rate of 120 kg NH4+-N ha−1 as U, PS, or PSI (main factor) was applied at tillering, and it was supplemented with N application at stem elongation (secondary factor). Grain yield, nitrogen use efficiency indexes, and nitrous oxide emissions were not significantly affected by the N source, U, or PS; in contrast to grain protein that was affected by the N source (lower protein content in PS). The higher unaccounted N from soil balance in PS compared to U fertilization could be associated with higher ammonia volatilization, although additional studies should confirm this hypothesis. Our study suggests that, under the considered cropping conditions, PS does not affect productivity or N2O losses compared to U. The addition of MCDHS to pig slurry did not display agronomic or environmental benefits under the evaluated agro-environmental conditions.

1. Introduction

Wheat is one of the main cultivated cereals around the world, with 214.8 million hectares under production [1]. In Spain, wheat production represents 34% of grain cereal production [2], since the Mediterranean climate allows for producing high-quality wheat with adequate management practices [3], especially bread wheat, with more demanding quality standards.
Spain is the European country with the highest porcine livestock population, reaching 30.8 million heads in 2018 [4]. The slurry (PS) produced contains more than 1.3 million tons of nitrogen (N) and is applied as fertilizer to field crops, being the most common recycling method for this product. However, high rates of nutrients on farmland, usually desynchronized with crop demands, increase notably the risk of environmental pollution [5]. Pollution associated with PS application includes nitrate (NO3) leaching, an increase in soil heavy metal concentrations (mainly zinc and copper), and ammonia (NH3) and nitrous oxide (N2O) emissions to the atmosphere [6,7,8,9]. Accordingly, different management practices can be implemented to reduce these environmental risks; e.g., PS applied at adequate rates leads to minimizing N losses by drainage [10] and early slurry incorporation with tillage after its application is recommended to control NH3 volatilization [11].
The emission of N2O from agricultural soils is mainly related to two biological processes, denitrification and nitrification, although some small N2O emissions may be also produced through non-biological processes. Denitrification is the reduction of nitrate to molecular nitrogen (N2) through the mediation of anaerobic denitrifiers; the process can be incomplete and some of the nitrogen is emitted as nitric oxide (NO) and N2O [12]. The main factors affecting denitrification in soils are soil nitrate concentration, temperature, humidity, and labile carbon presence [13]. Denitrification is maximum at high soil nitrate concentrations, with temperatures in the range of 28–36 °C, when the soil water-filled pore space (WFPS) exceeds 60%, although in very wet soils (WFPS >90%) N2 is the prevalent form of denitrification, and it is enhanced in soils with a ready supply of organic carbon, such as manure or crop residues [14]. However, PS has low C content, thus its application would be not expected to have a strong influence on N2O emissions in comparison to synthetic N. Nitrification is the pathway in which ammonium is oxidized to nitrite, and then nitrite is reduced to nitrate; the process is mediated by autotrophic ammonia oxidizers, autotrophic nitrite oxidizers, and heterotrophic nitrifiers [15]. Nitrification needs soil ammonium, and it is optimum at a temperature between 25 and 30 °C, and when WFPS is around 55% for fine-textured soils, and around 40% WFPS for coarse-textured soils [16]. The main pathway of N2O emission in aerobic Mediterranean cultivation is nitrification, with denitrification relevant only on the rare occasions when WFPS > 60%.
The meta-analysis of Aguilera et al. [8] showed that the use of organic fertilizers significantly reduced direct N2O emissions in comparison to synthetic fertilizers, but this reduction depended on the type of product, being more effective in solid manure than in liquid slurry, where no reduction was observed. These authors identified some limitations and knowledge gaps of studies with organic fertilization that should be covered, such as measurements for longer periods or evaluation of yield and yield-scaled emissions with different types of products.
Adjusting N fertilizer rate and splitting the N application are well-known strategies to improve nitrogen use efficiency in wheat and reduce reactive N losses to the environment. Nitrogen application at tillering provides yield increase by increasing the number of ears, and latter application in the period of stem elongation-flowering increases the grain protein content [17]. Pig slurry application at the same nitrogen rate as that used for synthetic fertilizers can result in similar crop yields [18]. Although the traditional PS application to winter cereals is usually before sowing, PS application at the tillering stage expands its application time window and improves its usability [19] as this brings the N application time closer to crop uptake. The application of PS to wheat at tillering needs to be based on information about agronomic performance (yield and grain quality) for efficient recycling. However, there is a lack of information on PS efficiency in comparison to synthetic N in Mediterranean irrigated conditions. This incomplete knowledge is partly due to the high variability in PS compositions and environmental conditions. The yield response to PS application is additionally a key factor for the right assessment of N2O emissions using the concept of yield-scaled emissions.
In the application at tillering, the slurry remains on the surface of the soil [20], increasing the risk of ammonia gaseous N losses. In this situation, practices such as immediately incorporating the slurry after its application or injecting slurries into the soil, which abate NH3 and indirect N2O emissions [21], are unfeasible, except in irrigated areas where PS can be incorporated by irrigation. The acidification of pig slurry is a solution to reduce NH3 emissions during its application to the soil as fertilizer. The pH decrease during acidification reduces the concentration of NH3 relative to NH4+ in the slurry reducing the risk for ammonia volatilization [22]. Monocarbamide dihydrogen sulfate (MCDHS; international patent WO 2007/132032 A1) has been classified as a urease inhibitor. Even when the pig slurry urea has been transformed into ammonium, according to the company that owns the MCDHS patent, the ammonium-N form is protected since the micro-acidification, due to hydrolysis of the MCDHS molecule, could reduce ammonia volatilization and affect soil N dynamic. However, this product has not been widely assessed and no information can be found in the scientific literature about its effects on the soil N dynamics.
In this context, the first objective of this study is to evaluate, in a bread wheat crop under semiarid Mediterranean irrigated conditions, the effect of substituting synthetic N fertilizer for pig slurry on crop productivity, nitrous oxide emissions, emission factors, and yield-scaled emissions during three consecutive years. The second objective is to assess the effect of adding the novel urease inhibitor MCDHS to pig slurry on crop productivity, soil nitrogen dynamics, and nitrous oxide emissions through its acidification potential that protects ammonium-N form from ammonia losses.

2. Materials and Methods

2.1. Site and Experimental Design

The study was conducted in the experimental field “Soto Lezcano” (41°43′49″ N, 0°49′2″ W) in the middle Ebro river basin (Zaragoza, Spain) on a Typic Xerofluvent soil [23]. The physicochemical characteristics of the soil are shown in Table 1. The climate of the region is semiarid Mediterranean-continental (mean annual air temperature of 14.6 °C; mean annual precipitation of 318 mm; mean annual reference evapotranspiration of 1243 mm; period 2004–2019).
Bread wheat (Triticum aestivum L. cv. ‘Rimbaud’) was cultivated under sprinkler irrigation during three growing seasons (2015/16, 2016/17, and 2017/18) following the management practices presented in Table 2. Irrigation requirements were calculated weekly from the reference evapotranspiration (ETo) estimated with the Penman–Monteith equation and the wheat crop coefficients according to the FAO procedure [24].
The experimental design was a split-plot with four replications. The main factor included three different fertilization strategies at tillering (Table S1): (a) urea at the rate of 120 kg N ha−1 (U120); (b) pig slurry at the target rate of 120 kg NH4+-N ha−1 (PS120); and (c) pig slurry mixed with the urease inhibitor monocarbamide dihydrogen sulfate at the target rate of 120 kg NH4+-N ha−1 (PSI120). The second factor of the split-plot consisted in four rates of synthetic N at stem elongation: 0 (AN0), 30 (AN30), 60 (AN60), and 90 (AN90) kg N ha−1 as ammonium nitrate (Table S1). Besides these, four additional treatments were included with four different rates of N in form of urea at tillering: 0 (control), 60 (U60-AN0), 90 (U90-AN0), and 150 (U150-AN0) kg N ha−1, with no N application at stem elongation (Table S1). These treatments allow for calculating the nitrogen fertilizer replacement value of the pig slurry in PS120 and PSI120.
The size of the experimental plots was 6.0 × 7.0 m for pig slurry treatments and 6.0 × 3.5 m for urea treatments. Pig slurry was applied using trail hoses and the dose was calculated according to its ammonium-N content measured in situ using Quantofix N-volumeter [25]. Slurry samples were collected for further analysis in the laboratory (Table 3). The application equipment was calibrated directly in the field to obtain the relationship between speed and dose of PS applied (weighing the tank before and after the application). Despite that, applying appropriate amounts of PS to reach target N rates was a challenge, and the actual N applied is shown in Table 3. The urease inhibitor MCDHS was mixed in the slurry tank according to the rate recommended by the manufacturing company (2.5 L per 1 Mg of fresh pig slurry).
To analyze the effects of MCDHS on the soil N dynamics an additional experiment (hereafter called ‘miniplots’) was installed in the same field with the treatments control, PS120-AN0, and PSI120-AN0 in a randomized block design with four replications. The size of each experimental plot was 3.6 × 2.0 m. Pig slurry was applied manually in the miniplots, on the same day in both experiments (Table 2).
A short irrigation event (2 mm) was applied to incorporate N fertilizers into the soil. At presowing, 70 kg P2O5 ha−1 and 150 kg K2O ha−1 were applied to avoid limitations of these nutrients. One month before presowing, the previous season’s straw was incorporated into the soil using a harrow. The control of weeds, diseases, and pests was performed according to local management practices.

2.2. Measurements and Determinations

2.2.1. Soil Sampling

The soil of each plot was sampled before fertilizer application (15 February 2016; 20 February 2017; and 7 February 2018) and after harvest (14 July 2016; 25 September 2017; and 31 July 2018) at 0–30 cm, 30–60 cm, and 60–90 cm depths.
In the miniplots, the soil was sampled at depths of 0–15 cm and 15–30 cm 39 times from pig slurry application to harvest. The time interval between samplings increased from 24 h in the days that followed the application to 15 days at the end of the season.
Soil samples were sieved through a 3-mm mesh. One subsample was used to determine the soil water content by gravimetry (drying at 105 °C until constant weight). Another subsample (10 g of fresh soil) was extracted with 30 mL of 2 N KCl, shaken for 30 min, and filtered through a cellulose filter. NO3 and NH4+ concentrations in the extracts were determined by colorimetry using a segmented flow analyzer (AutoAnalyzer 3, Bran + Luebbe, Norderstedt, Germany).

2.2.2. Crop Sampling

Two subareas of 0.54 m2 were randomly selected in each plot and hand-harvested to determine the harvest index and obtain the total biomass of the whole plot. An area 1.65 m wide and the length of the experimental plot (3.5 m for U treatment and 7.0 m for PS and PSI treatments) was mechanically harvested with a combine harvester to determine grain yield (reported on the basis of 120 g kg−1 moisture content). Grain and straw N contents were analyzed by dry combustion (TruSpec CN, LECO, St. Joseph, MI, USA) in samples previously dried at 65 °C and ground.

2.2.3. Nitrous Oxide Emissions

Four treatments were selected to measure N2O fluxes to the atmosphere. These treatments were U120-AN30, PS120-AN30, and PSI120-AN30, which were considered a priori the treatments that would theoretically better cover wheat N requirements, and the control treatment that was necessary to calculate N2O emission factors. Fluxes from the soil to the atmosphere were measured using static closed unvented chambers [26] of 18.5-cm height and 30.0-cm inner diameter and made in polyvinyl chloride. They were composed of a collar inserted 10 cm into the soil and an upper part wrapped by a reflective insulation film. Gas samples were taken 0, 20, 40, and 60 min after chamber closure in 2015/16 and 2016/17, and 0 and 60 min after chamber closure in 2017/18. Fifteen milliliters of air from the chamber headspace were injected into a 12-mL borosilicate glass vial (Model 038 W, Labco, Lampeter, UK) using a polypropylene syringe. Air samplings were started roughly at the hour of the day when soil temperature was closer to the mean temperature of the day (between 9:30 h and 11:00 h GMT) [27]. Samples were analyzed by gas chromatography using the same equipment and technique that were described in detail by Mateo-Marín et al. [28]: an Agilent 7890B gas chromatography system with HP-Plot Q column and electron-capture, flame-ionization and methanizer detectors.
Nitrous oxide fluxes were calculated as the linear increment in gas concentration within the chamber corrected by the air temperature and multiplied by the ratio between the chamber headspace and the soil area occupied by the chamber [29].
Samples were taken from 17/02/2016 to 27/11/2018. The frequency of N2O samplings was daily just after fertilization events and then measurements were performed at longer intervals with a total of 18, 32, and 36 samplings for the 2015/16, 2016/17, and 2017/18 seasons, respectively. At each sampling date, soil moisture and soil temperature were measured at 5-cm depth using portable sensors (HH2 Moisture Meter Delta-T ML3 and ML2 ThetaProbe, and TME MM2000 Single Input Thermocouple Thermometer). Soil water-filled pore space was estimated as the quotient between volumetric soil water content and total soil porosity [30]. Soil porosity was calculated considering a particle density of 2.65 Mg m−3 and the soil bulk density was measured in situ using the cylinder method [31].
The cumulative emissions of N2O were calculated for each year, for the period between sowing and sowing the next year, integrating the emissions over time. The average N2O flux between two sampling dates was multiplied by the time interval between them to estimate the cumulative flux during the inter-sampling period and added for each year.

2.3. Data and Statistical Analysis

The grain yield response to N rates in synthetic fertilizer treatments was adjusted using the linear-plateau model [32] for each cropping season (Equation (1)):
If   F   <   C ;   Y   =   a   +   b   ×   F If   F     C   ;   Y   =   Y max =   a   +   b   ×   C  
where Y is the grain yield (t ha−1); F is the applied N rate (kg N ha−1); a (intercept, t ha−1) is the yield at 0 kg N ha−1; b (t kg−1 N) is the increase in yield per unit increase in F; and C (kg N ha−1) is the critical N rate or minimum N rate at which the maximum yield (Ymax) is obtained.
The nitrogen fertilizer replacement value (NFRV) of pig slurry treatments was calculated as the rate of synthetic N that produces the same yield than the PS120-AN0 and PSI120-AN0 treatments, and it was estimated from the response curve to the urea treatments for each season.
The efficiency in the use of nitrogen was evaluated using two indexes. The nitrogen use efficiency was calculated based on: i) the agronomic point of view (NUEb) as the ratio between the total N uptake by the aboveground biomass (kg ha−1), and the N applied by urea fertilization or applied with pig slurry in ammonium-N form (kg ha−1); and ii) the environmental point of view (NUEg) the ratio between the total N uptake by the grain (kg ha−1), and the N applied by urea fertilization or applied with pig slurry in ammonium-N form (kg ha−1). The mineral N contained in the applied slurry (i.e., NH4+-N) was used for the calculations, since it was considered that the contribution of pig slurry organic N and its residual effect was not substantial during the period of the experiment. The apparent recovery efficiency of N applied (REN) in total aboveground biomass is the increment in the aboveground N uptake due to the N application per mineral-N applied rate (Equation (2)):
RE N   =   U T     U 0 F T
where UT (kg N ha−1) is the N uptake by aboveground biomass in the T treatment; U0 (kg N ha−1) is the N uptake by aboveground biomass in the unfertilized control plot; and FT (kg N ha−1) is the applied mineral-N in the T treatment.
The efficiency indicators were calculated and analyzed for two fertilizer strategies: (i) fertilizer treatments that showed the best agronomic response to the N application (120 kg N ha−1 at tillering and 0 kg N ha−1 at stem elongation), and (ii) treatments that, during the experiment design, were considered to better suit crop necessities (120 kg N ha−1 at tillering and 30 kg N ha−1 at stem elongation).
The grain protein content was calculated multiplying the total N content of the grain by the factor 5.7 [33].
The N2O emission factor (EF, %) was calculated as the difference between N2O emissions in fertilized and unfertilized (control) plots, divided by the total N applied in the fertilized plots, and multiplied by 100. The yield-scaled N2O emission (YSN2O; g N kg−1 grain) was determined as the ratio between the N2O emissions and the grain yield of the plot.
A N balance was performed at each plot for soil depths of 0–90 cm, considering the conservation of mass [34], including the three growing seasons (from February 2016 to July 2018). Thus, the mean annual unaccounted N (Nunac O-I; kg N ha−1 yr−1) or surplus N was calculated as the difference between N inputs (kg N ha−1) and N outputs (kg N ha−1) and divided by three years (Equation (3)) [5,19]:
N unac   O - I   =   ( N is   +   N f   +   N i   +   N d )     ( N fs   +   N u   +   N N 2 O )
where Nis (kg N ha−1) is the initial soil mineral N; Nf (kg N ha−1) is the N applied with fertilizers; Ni (kg N ha−1) is the N applied with irrigation water; Nd (kg N ha−1) is the N input for deposition; Nfs (kg N ha−1) is the final soil mineral N; Nu (kg N ha−1) is the N uptake by aboveground biomass; and NN2O (kg N ha−1) is the N2O emission (if applicable). The Nd was estimated as 12.5 kg N ha−1 yr−1, using the value provided by Schwede et al. [35] for cropped land. The main components of unaccounted outputs of N are NH3 volatilization, N oxides (NO, NOx) and N2 emissions, N leaching, and immobilized N (including N in roots). N oxides emissions are very small [36], and N2 emissions were considered unimportant since favorable conditions for its production were not reached during the experimental period (availability of highly enriched organic carbon and higher than 90% WFPS; [37]). The Nunac-O-I provides an indication of net N losses from the soil system when a positive value is obtained and a net input mostly coming from mineralization when a negative value is obtained.
To estimate the risk of nitrate leaching, the drainage was calculated at 0.9-m depth for each season using the simplified one-dimensional daily water balance described in Equation (4):
D   =   P   +   I     ETc   +   SW     FC
where D (mm) is the drainage; P (mm) is the precipitation; I (mm) is the irrigation; ETc (mm) is the estimated crop evapotranspiration using the Penman–Monteith reference evapotranspiration and FAO methodology [24]; SW (mm) is the soil water content measured by soil sampling by gravimetry; and FC (mm) is the soil field capacity, measured using Richards methodology [38]. Drainage is estimated when P   +   I     ETc   +   SW exceeds field capacity. There were no visible signs of surface runoff and it was considered negligible.
Statistical analyses were performed using the SAS software University Edition (SAS Institute, Cary, NC, USA). The normal data distribution and uniformity of variance were verified using Shapiro–Wilk and Levene’s test, respectively. Data were transformed using the Box–Cox transformation when basic model assumptions of normality and homogeneity of variance were not met. Transformed data were subjected to analysis of variance (MIXED procedure) and differences of means were compared with Tukey’s test. A paired t-test was used to compare the soil N concentrations between treatments in the miniplots. A comparison of regression lines across groups was performed using a F-test. Repeated measure analysis along time, according to a first-order autoregressive structure model AR(1), was performed to compare N2O fluxes among treatments for the period between the first fertilizer application and one month after the second application. In all tests, the default level of significance considered was 0.05.

3. Results

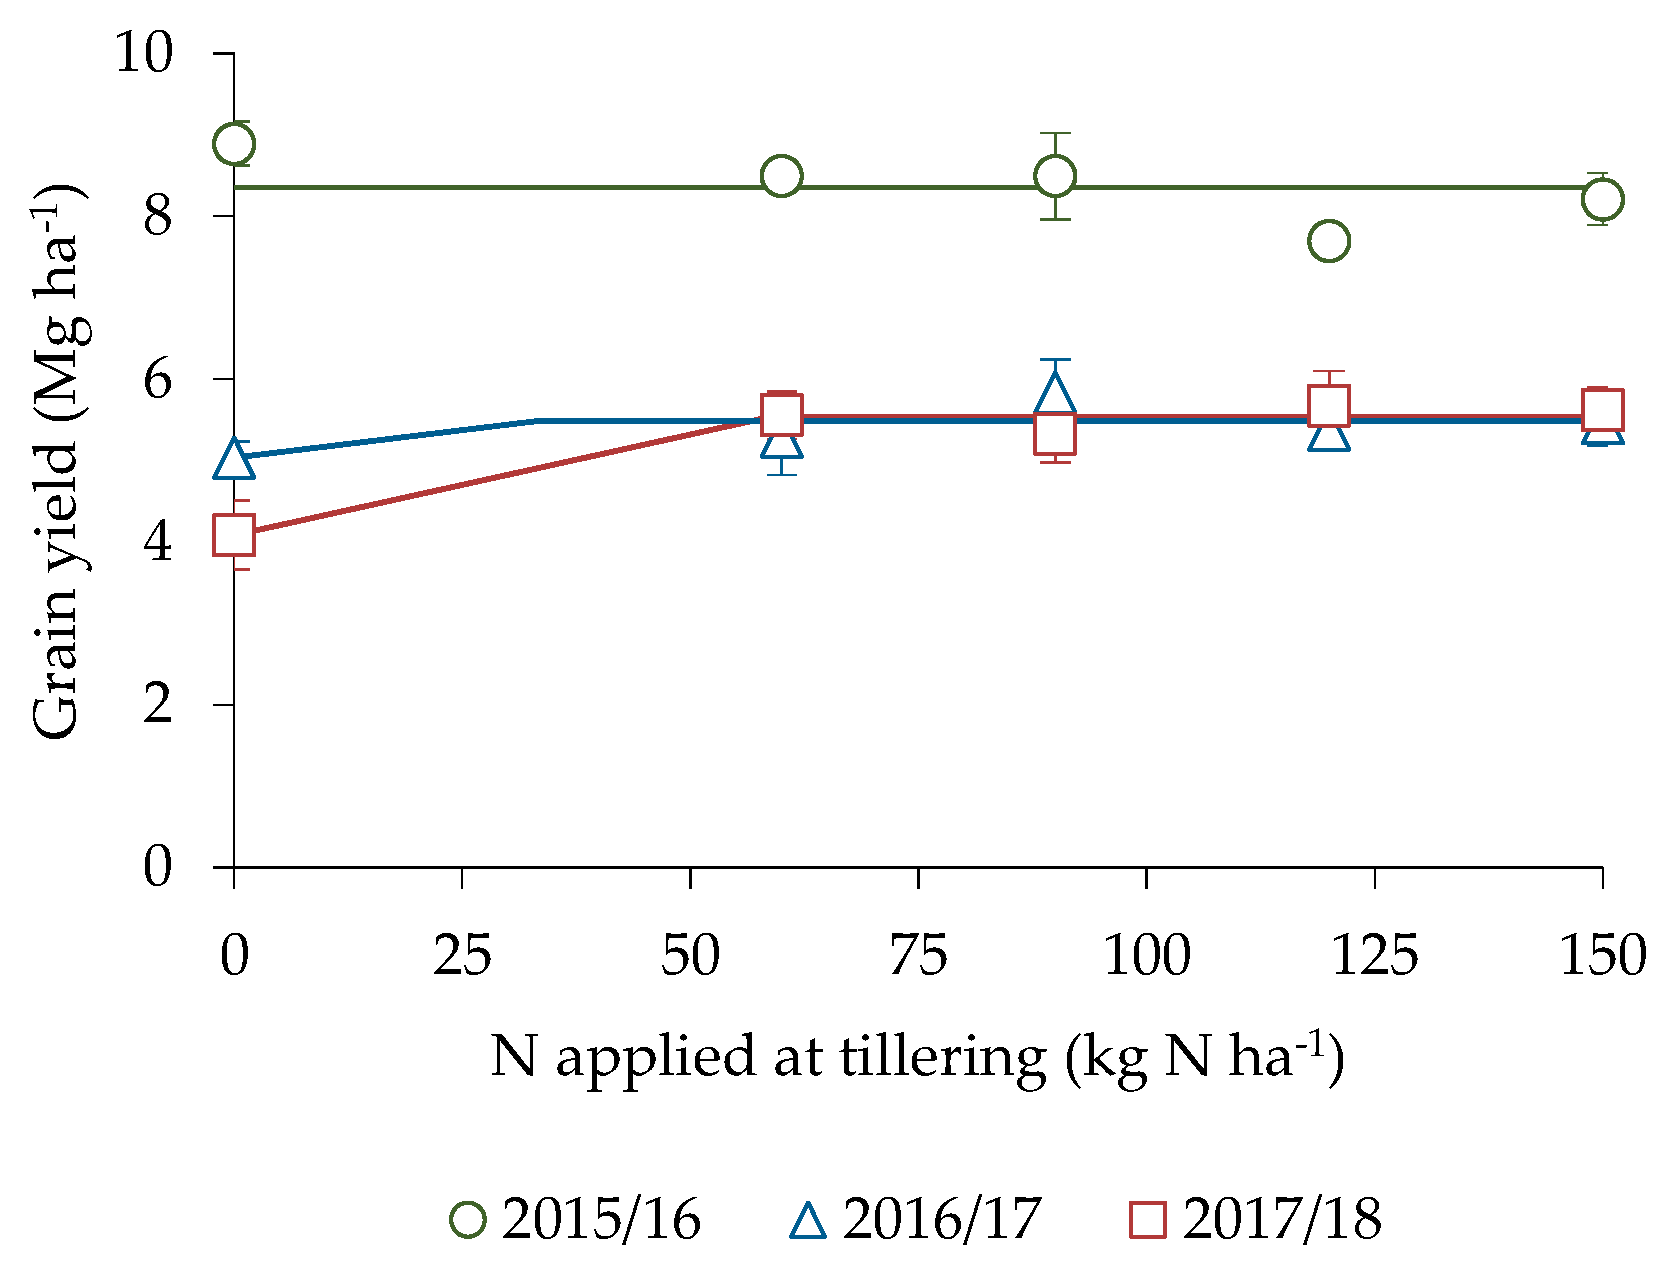
3.1. Productive Parameters

The maximum grain yield (Ymax, Figure 1) was higher in the first season (8357 kg ha−1) than in the second and third seasons (5491 and 5543 kg ha−1, respectively). No response of grain yield to N rates (urea) applied at tillering was observed in the first year (2015/16), while in 2016/17 and 2017/18, there was a positive response, and critical N rates were established at 34 and 59 kg N ha−1, respectively (Figure 1). NFRV could not be quantified due to the low or lack of yield response to N application. The grain yield was affected by the N source (p < 0.01) in the first season (2015/16) since PS120-AN0 showed a 21% higher grain yield than U120-AN0 (Figure S1). In the three years, yield in PS120-AN0 and PSI120-AN0 was not lower than in U120-AN0, indicating that the fertilizer value of PS120 and PSI120 was at least similar to that of U120.
The grain yield was not affected by a second synthetic-N side-dress application at stem elongation in any of the three seasons (Figure S1).
The second N application increased the grain protein content with a linear response as the N applied increases (Figure 2).
For a given N application rate at stem elongation, U treatments presented higher (p < 0.05) grain protein content than treatments with pig slurry (PS and PSI), i.e., N source at tillering application determined differences in grain protein. These differences were also observed when the regression was performed with available N, defined as soil mineral N (SMN) from 0 to 30 cm in February in addition to the mineral-N fertilizer (Figure S2). The difference in available N between U and PS treatments to reach the average grain protein content (12.8%) was estimated at 28.8 kg N ha−1.
There was no effect of treatments without N application at stem elongation on NUEb, NUEg, and REN (Table 4). Moreover, no significant differences in these N efficiency indexes were observed among the treatments for the strategy with the second application of 30 kg N ha−1 (Table S2).

3.2. Nitrous Oxide Emissions

Individual values of nitrous oxide fluxes ranged from −2.3 to 94.6 g N ha−1 day−1 in 2015/16, from −1.5 to 434.16 g N ha−1 day−1 in 2016/17, and from −2.5 to 197.5 g N ha−1 day−1 in 2017/18. Large variability in N2O fluxes was observed among replicated chambers for a given sampling date and treatment. Standard errors ranged from 0.1 to 9.9 g N ha−1 day−1 in the control treatment and from 0.2 to 56.3 g N ha−1 day−1 in the three fertilized treatments.
Remarkable peaks of N2O emissions (Figure 3) were observed mainly immediately after the first side-dress fertilizer application when soil temperature ranged from 12 °C to 21 °C and soil WFPS ranged from 45% to 70%.
On average, 75% of N2O was emitted during the cropping season (from sowing to harvest). The repeated measure analysis of N2O fluxes from the first fertilizer application to one month after the second application did not show significant differences among the three fertilizer treatments in any of the three seasons. Significant differences in N2O emissions were observed for the whole experiment (2015–2018) among the control and the fertilized treatments (Table 5). These differences were also observed in each season, although during the second and third season, the differences between control and U treatment were not significant, due to the high variability between replicates. There were no significant differences related to the substitution of synthetic fertilizer (U120-AN30) for pig slurry (PS120-AN30) or to the addition of the urease inhibitor to the pig slurry (PSI120-AN30).
The N2O EFs ranged between 0.91% and 1.42% (Table 6) and no significant differences among treatments for any of the cropping periods were observed. Averaging over treatments, values were 21% and 27% higher in the second and third season, respectively, compared to the first season EFs. Yield-scaled N2O emissions were lower for the first season (average 0.16 ± 0.03 g N kg−1 grain) than for the other two seasons (Table 6). Mean YSN2O emission in 2016/17 (0.46 ± 0.05 g N kg−1 grain) and in 2017/18 (0.42 ± 0.05 g N kg−1 grain) were 184% and 159% higher than in 2015/16, respectively. Differences among the fertilized treatments were not detected in this parameter for any of the seasons (p > 0.05).

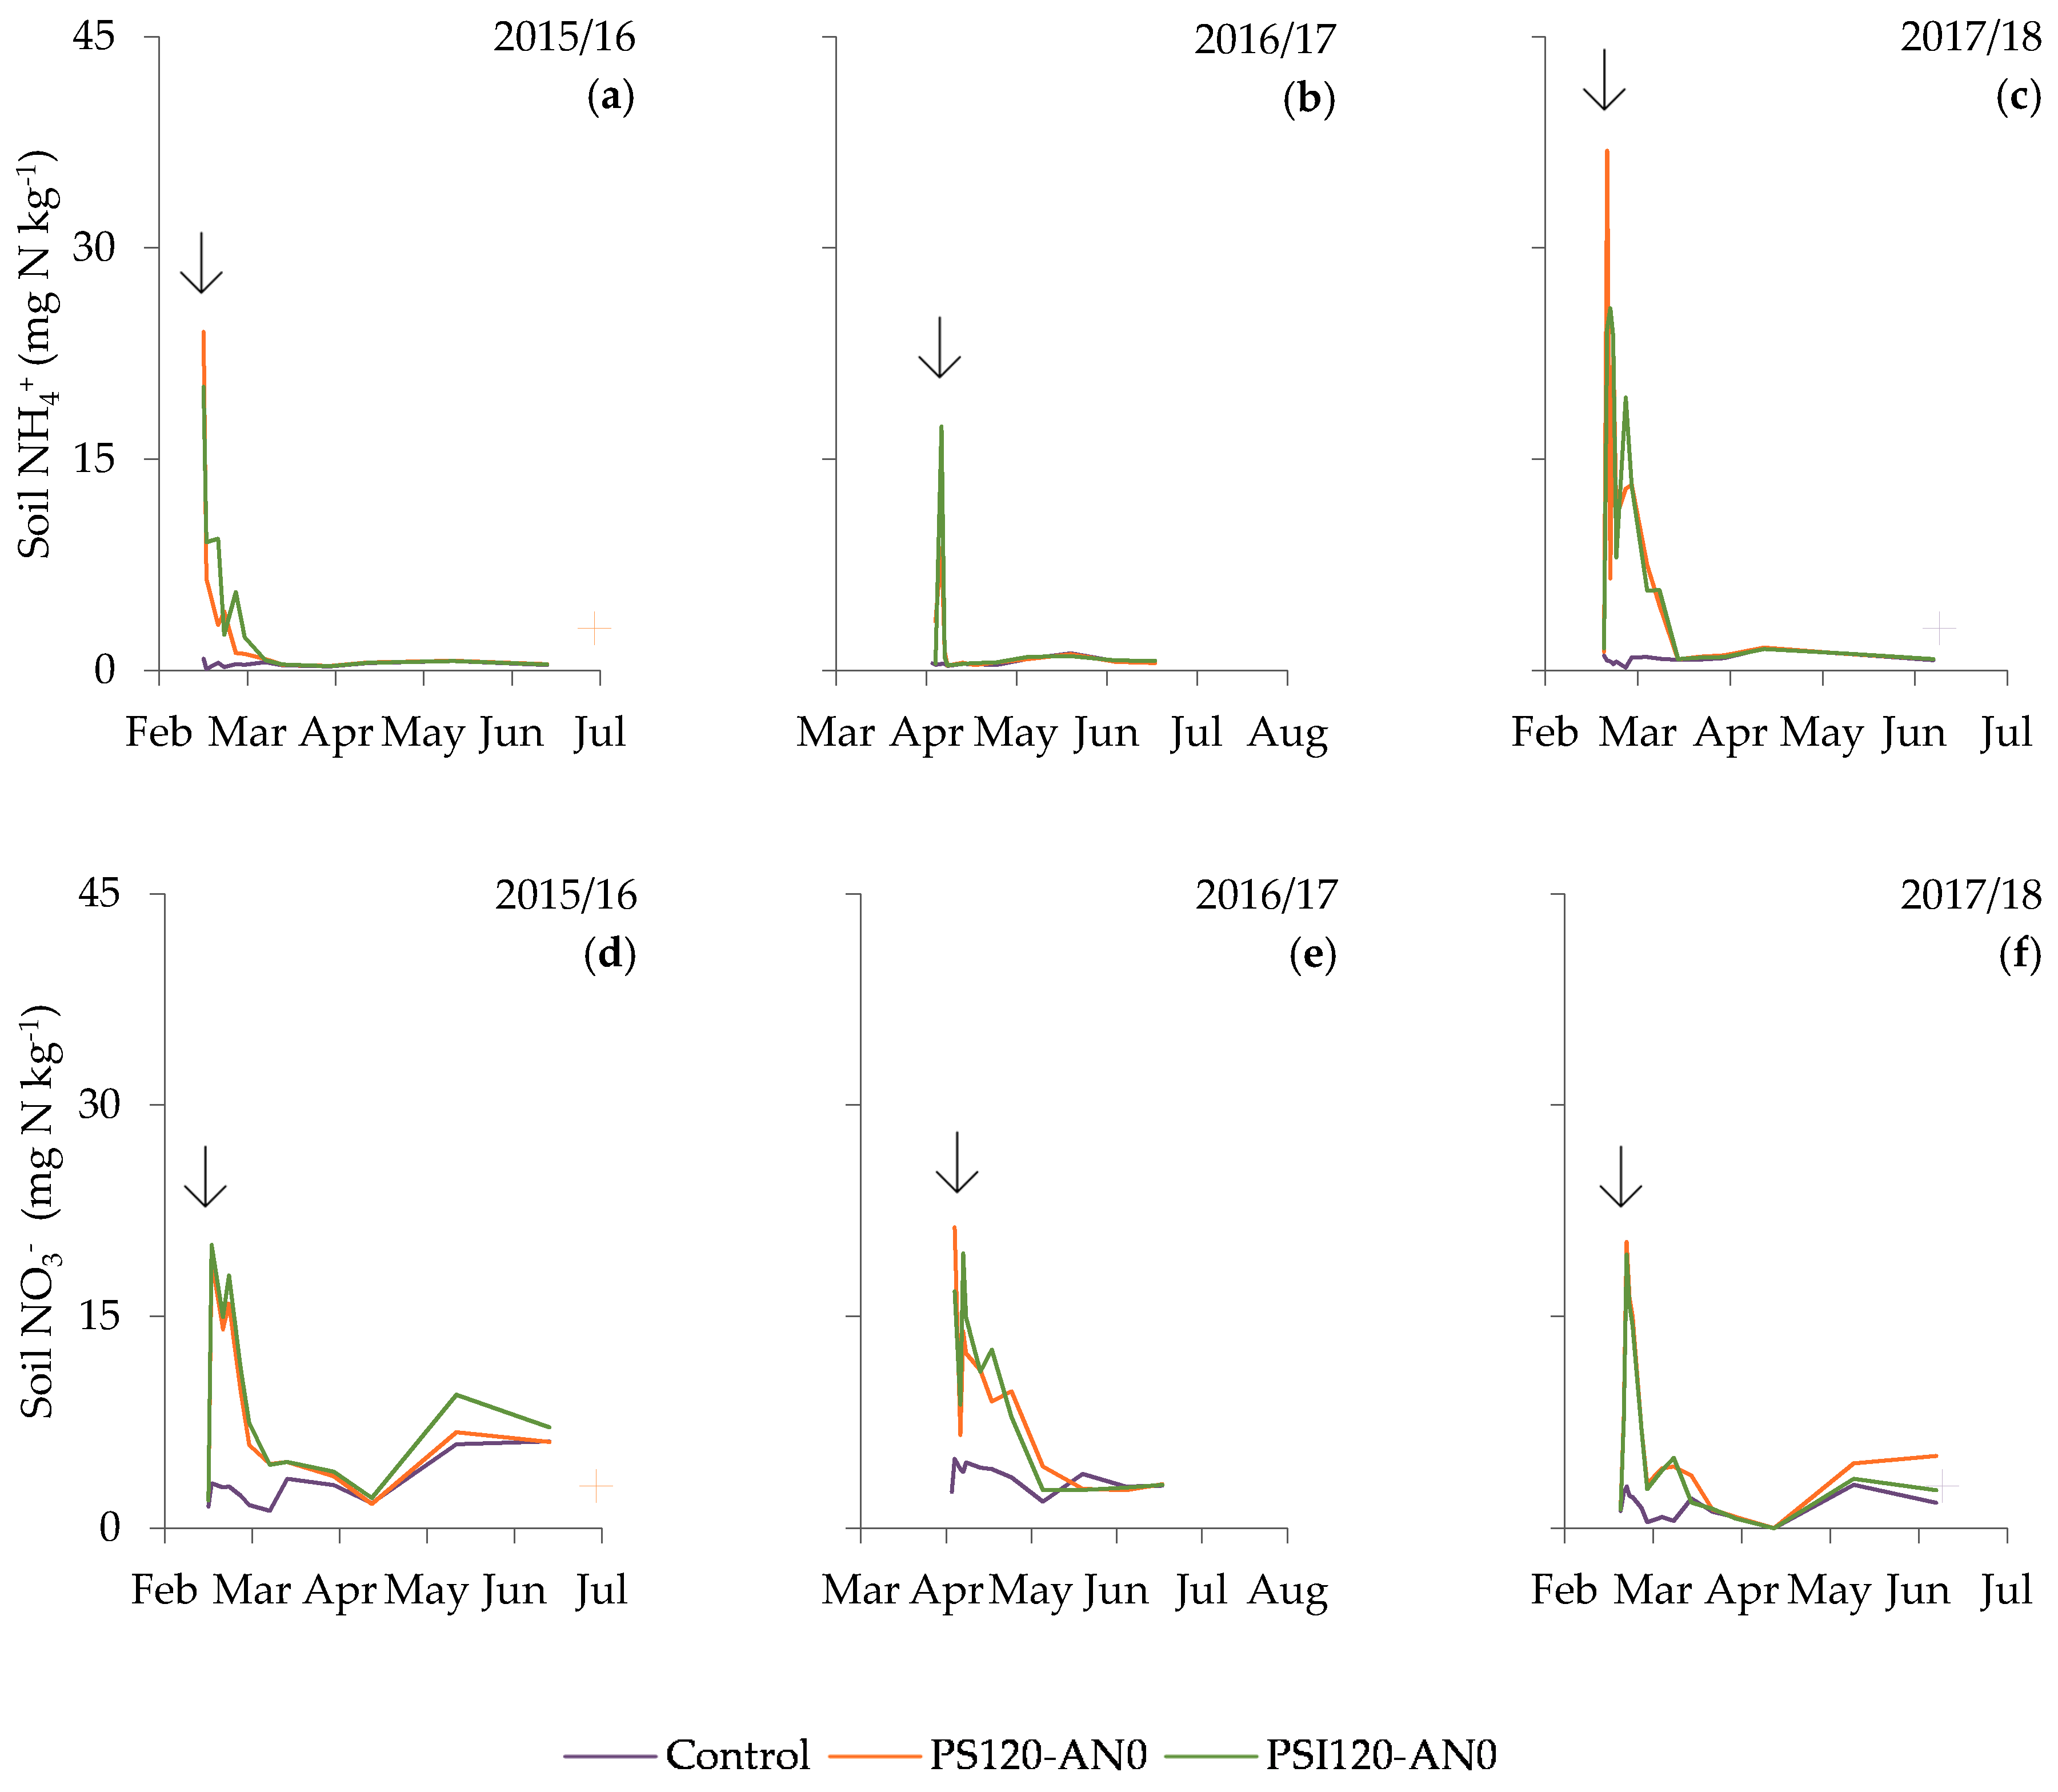
3.3. Dynamic of Soil Mineral Nitrogen

Soil mineral nitrogen responded to N applications, reaching peaks of ~20 mg NO3-N kg−1 soil and 20–35 mg NH4+-N kg−1 soil at 0–15-cm depth the day after the fertilization (Figure 4). These values went down until they reached, in two months, the same values of SMN observed in the control treatment. At the end of the first and third season, soil nitrate rose in the 0–15-cm depth (Figure 4).
In the two months after the fertilization, the dynamic of SMN was similar in the PS and PSI treatments for all seasons, independent of the N form and soil depth (Table S3). The exception was the 2015/16 season when treatment with inhibitor presented 10% higher NO3 concentration than treatment without inhibitor. This difference, although significant, was relatively unimportant since it was detected only in one year and had no effect on total mineral N concentration (Table S3).

3.4. Nitrogen Balance

For the three years of the experiment, unaccounted NO-I (Nunac O-I) was linearly related to the total N applied by fertilization (Figure 5), but the relationship changed depending on the fertilizer source. The inhibitor applied to the slurry did not affect the observed relationship and a pooled regression (PS + PSI) was considered. However, the urea treatments behaved differently (p < 0.05) than the PS treatments, with lower Nunac O-I across the different ranges of applied N. Averaging over the different N rates, Nunac O-I was 41 kg N ha−1 yr−1 lower in urea than in the slurry treatments.
According to the soil water balance, the volume of water drained below 0.9 m depth (from February to July) was zero for the first two seasons, and in the third season (2017/18), the drainage was estimated as 73 mm. In this case, 95% of this volume was concentrated after an unusually high rainfall period (83 mm) occurred between days 07/04/2018 and 11/04/2018, twenty days after the first side-dress N fertilization. Therefore, due to the small volume of drainage below the root zone, the total amount of N lost by leaching was relatively unimportant compared to other potential losses.

4. Discussion

The N source at tillering application did not affect grain yield and, as a consequence, pig slurry application produced yields similar to those obtained by fertilizing with urea. No grain yield reduction associated with the use of pig slurry substituting synthetic fertilizers has been reported in other studies for different crops [39,40,41]. A second N application as ammonium nitrate at stem elongation did not increase grain yield compared to a unique side-dress N application, which is in agreement with the inconsistent response of grain yield to variations in the timing and splitting of N fertilizer reported by López-Bellido et al. [42]. However, the second side-dress N application at stem elongation allowed an increase in grain protein, which corroborates previous studies like that by Debaeke et al. [17] who suggested that the split and late application of N guarantees a better distribution of N in the kernel. This increase in grain protein was observed when the N rates increased in the application at stem elongation even though they exceeded the critical N rate above which the maximum yield was obtained. Under similar irrigated Mediterranean conditions, Lloveras et al. [43] also reported that higher N rates are required to achieve high bread-making quality than to obtain the highest grain yield. Furthermore, grain protein was influenced in this study by the N source applied at tillering. Lower N rates at stem elongation were necessary to reach higher protein content when urea was used in the tillering side-dress application, compared to pig slurry. Even if the slurry was applied using trail hoses to reduce NH3 volatilization—compared to the splash-plate method, for example [11]—the NH3 losses were still expected to be higher in the slurry treatments than in the urea treatments. Therefore, higher N availability should be expected in urea treatments, with a subsequent increase in grain protein content. Under similar environmental conditions, Mateo–Marín et al. [44] measured ammonia losses derived from pig slurry applications comprising up to 28.5% of the N applied.
Unintentionally, the experiment took place under relatively high N availability conditions, associated with large N fertilizer rates relative to crop needs during the previous years, which led to a low grain yield response to N application for the three cropping seasons. Thus, the soil mineral N (0–30 cm depth) in the control treatment was relatively high before the first side-dress application, especially for the first and second year (2015/16: 59 ± 8 kg N ha−1; 2016/17: 52 ± 5 kg N ha−1; 2017/18: 27 ± 3 kg N ha−1). NUEb values during the whole experiment exceeded the threshold of 0.9 proposed as an indicator of soil nutrient removal [45]. However, as only grain was exported from the plots, the depletion of soil N was not expected to be noteworthy. Soil N removal can also be accelerated by high REN [46]; however, in this study, REN values were lower than the mean value of 0.57 in the analysis of Ladha et al. [46]. After three consecutive years of growing wheat, the average REN reached values within the normal range (0.50–0.80) in well-N-managed systems for cereal crops [47]. The lower values obtained for the first season can be explained by the absence of a response to the N application.
In this study, MCDHS did not affect N2O emissions, as would be expected for the application of a urease inhibitor to pig slurry that has already transformed the urea-N to ammonium-N before the addition of the inhibitor. Nonetheless, the experiment allows discarding other potential effects associated with the presence of dihydrogen sulfate in the molecule, such as decreasing soil pH near the soil-fertilizer interphase, with a subsequent effect on N dynamics. Thus, the MCDHS did not reduce the pH of PS compared to the non-treated slurry (data not shown), which is in agreement with the absence of significant differences in soil mineral N content between both treatments (PI vs. PSI). The only difference in soil nitrate concentrations found (2015/16) between PS fertilizers (with and without MCDHS) was not consistent through soil depths and seasons, and the inorganic N forms (ammonium-N and mineral-N) were not affected by the addition of MCDHS. This absence of differences between treatments proves that the effect of the inhibitor on the soil N dynamics is not detectable; in fact, SMN evolution followed the same pattern, in terms of amounts and temporal dynamics, in both fertilizer treatments.
Nitrous oxide emissions responded to fertilizer application independently of the N source and mainly occurred under soil WFPS conditions (40–70%) that promoted nitrification [48], although in 23% of the dates WFPS exceeded 60%, and conditions were also ripe for denitrification. The absence of differences in N2O emissions between urea and pig slurry might be attributed to the similar mineralized nature of the N forms they contain (urea-N in urea fertilizer and ammonium-N in pig slurry). Pig slurry did not promote higher emissions in the moments when denitrification processes were active, probably due to its low carbon content. Noticeable differences in the maximum N2O flux peaks were observed among the three seasons, with a lower peak during the first year. This fact might be attributed to a rainfall event (24.5 L m−2) which happened three days after the first fertilizer application of season 2015/16, displacing the mineral-N to deeper layers compared to the other seasons. The importance of the fertilizer position on N2O emissions was demonstrated by Liu et al. [49], who reported between 40–70% higher fluxes when fertilizer was injected at 0–5-cm depth compared to fertilizer located at 10–15 cm.
Liu and Powers [50] indicated that N2O EF for swine slurry application was similar to the default value (EF1 = 1%) suggested by the IPCC [51]. According to a meta-analysis of Cayuela et al. [52], the organic-liquid fertilizers present the highest EF (0.85% ± 0.30, n = 30), compared to synthetic fertilizers, which presented EFs values generally lower than 1%. However, the 2019 Refinement to the 2006 IPCC Guidelines for National Gas Inventories [53] changed the default EF of “all N inputs in dry climates” to 0.5%. The present study did not show consistent differences in N2O EFs between synthetic urea and slurry treatments, with values close to 1% after two N applications (120 kg N ha−1 and 30 kg N ha−1). Nevertheless, the implications and benefits of rational recycling of nutrients from a growing porcine livestock population have to be considered comprehensively (i.e., life-cycle assessment) when comparing synthetic with organic fertilizers.
According to the water balance, the contribution of nitrate leaching to N losses was relatively low in the whole experiment, although the drainage produced in the third season, twenty days after the first side-dress N application, could have been produced in a critical moment for N leaching [6]. However, the low SMN content (13.6 kg N ha−1 from 0 to 30 cm the day before the rainfall event) rejects the possibility of large nitrate losses by leaching.
The more N applied, the more unaccounted NO-I. The main components of unaccounted NO-I were NH3 volatilization and net mineralization. Since similar yields were obtained among treatments, no differences in N-immobilization due to straw incorporation should be expected. The trend to higher unaccounted NO-I for slurry treatments compared to urea treatments agrees with lower grain N concentrations in pig slurry than in synthetic-N treatments, since more unaccounted NO-I would mean less available N for the crop.

5. Conclusions

Pig slurry can replace the N necessary for bread wheat production under irrigated conditions without yield reductions and with similar nitrogen use efficiency compared to the synthetic urea fertilizer. Besides, the use of pig slurry does not increase the direct N2O losses compared to the use of urea, one of the most popular synthetic fertilizers. However, higher uncertainties, probably associated with NH3 volatilization losses, can jeopardize grain protein when slurry rates are not properly adjusted. Further studies should be performed to clarify the fate of the observed high N unaccounted values and to reduce N losses from irrigated agrosystems.
MCDHS added to pig slurry does not seem to have any agronomic or environmental benefit under the agro-environmental conditions of this study; thus, grain yield, N2O emissions, EF, and YSN2O were not affected by the addition of the inhibitor to pig slurry.

Supplementary Materials

The following are available online at https://www.mdpi.com/2073-4395/10/10/1498/s1, Table S1: Target N rate and splitting of N for the different fertilizer treatments. Table S2: Nitrogen use efficiency indexes (NUE and REN; mean ± standard error; n = 4) for the fertilized treatments U120-AN30, PS120-AN30, and PSI120-AN30 in the three cropping seasons (2015/16, 2016/17, and 2017/18). Table S3: Soil inorganic nitrogen concentrations (mg NO3-N kg−1 soil, mg NH4+-N kg−1 soil, and mg mineral-N kg−1 soil; mean ± standard error; n = 4) for treatments with a single PS application of 120 kg N ha-1 at tillering. Data are shown at different depths (0–15 cm and 15–30 cm) for each cropping season (2015/16, 2016/17, and 2017/18). Each period includes data from a day before fertilization until two months later. Different letters within rows indicate significant differences among treatments (paired t-test, p < 0.05). Figure S1: Grain yield response to total nitrogen application at stem elongation in 2015/16, 2016/17, and 2017/18 seasons depending on the N source at tillering. Vertical bars indicate standard error (n = 4). Figure S2: Relationship between the 3-year average grain protein (%) and available N (soil mineral N from 0 to 30 cm in February plus N applied at stem elongation) (kg N ha-1) for the different fertilizer strategies (U, PS, or PSI). Vertical bars indicate the standard error (n = 4).

Author Contributions

Conceptualization, D.Q.; methodology, D.Q.; formal analysis, N.M.-M.; investigation, N.M.-M. and M.G.; data curation, N.M.-M.; writing—original draft preparation, N.M.-M.; writing—review and editing, N.M.-M., M.G., R.I. and D.Q.; supervision, R.I. and D.Q.; project administration, D.Q.; funding acquisition, D.Q. All authors have read and agreed to the published version of the manuscript.

Funding

This research was funded by the National Institute for Agricultural and Food Research and Technology of Spain (INIA), grant number RTA2013-00057-C05-04 (research project) and CPD-2015-0044 (FPI-INIA predoctoral fellowship).

Acknowledgments

Thanks to the field and laboratory personnel of the Department of Soil and Irrigation of CITA. Thanks to J.M. Mirás-Avalos for the English correction of the manuscript. The MCDHS was supplied by Fertinagro Biotech S.L.

Conflicts of Interest

The authors declare no conflict of interest.

References

  1. Food and Agriculture Organization of the United Nations. FAOSTAT—Wheat Production in 2018. Available online: http://www.fao.org/faostat/en/#data/QC (accessed on 7 May 2020).
  2. Ministerio de Agricultura. Pesca y Alimentación Superficies y Producciones Anuales de Cultivos. Datos Avances de Cereales del Año 2018. Available online: https://www.mapa.gob.es/es/estadistica/temas/estadisticas-agrarias/agricultura/superficies-producciones-anuales-cultivos/ (accessed on 7 May 2020).
  3. Borghi, B.; Corbellini, M.; Minoia, C.; Palumbo, M.; Di Fonzo, N.; Perenzin, M. Effects of Mediterranean climate on wheat bread-making quality. Eur. J. Agron. 1997, 6, 145–154. [Google Scholar] [CrossRef]
  4. European Commission. Pig Population—Annual Data (2018). Available online: https://ec.europa.eu/eurostat/data/database (accessed on 7 May 2020).
  5. Daudén, A.; Quílez, D. Pig slurry versus mineral fertilization on corn yield and nitrate leaching in a Mediterranean irrigated environment. Eur. J. Agron. 2004, 21, 7–19. [Google Scholar] [CrossRef]
  6. Gómez-Garrido, M.; Faz-Cano, Á.; Martínez-Martínez, S.; Carmona-Garcés, D.M.; Büyükkılıç-Yanardag, A. Nitrogen dynamic and leaching in calcareous soils amended with pig slurry. In Soil Management and Climate Change; Elsevier: Amsterdam, The Netherlands, 2018; pp. 171–187. [Google Scholar]
  7. Jensen, J.; Larsen, M.M.; Bak, J. National monitoring study in Denmark finds increased and critical levels of copper and zinc in arable soils fertilized with pig slurry. Environ. Pollut. 2016, 214, 334–340. [Google Scholar] [CrossRef] [PubMed]
  8. Aguilera, E.; Lassaletta, L.; Sanz-Cobena, A.; Garnier, J.; Vallejo, A. The potential of organic fertilizers and water management to reduce N2O emissions in Mediterranean climate cropping systems. A review. Agric. Ecosyst. Environ. 2013, 164, 32–52. [Google Scholar] [CrossRef] [Green Version]
  9. Sanz-Cobena, A.; Misselbrook, T.H.; Hernáiz, P.; Vallejo, A. Impact of rainfall to the effectiveness of pig slurry shallow injection method for NH3 mitigation in a Mediterranean soil. Atmos. Environ. 2019, 216, 116913. [Google Scholar] [CrossRef]
  10. Diez, J.A.; de la Torre, A.I.; Cartagena, M.C.; Carballo, M.; Vallejo, A.; Muñoz, M.J. Evaluation of the Application of Pig Slurry to an Experimental Crop Using Agronomic and Ecotoxicological Approaches. J. Environ. Qual. 2001, 30, 2165–2172. [Google Scholar] [CrossRef]
  11. Yagüe, M.R.; Valdez, A.S.; Bosch-Serra, À.D.; Ortiz, C.; Castellví, F. A short-term study to compare field strategies for ammonia emission mitigation. J. Environ. Qual. 2019, 48, 179–184. [Google Scholar] [CrossRef] [Green Version]
  12. Butterbach-Bahl, K.; Baggs, E.M.; Dannenmann, M.; Kiese, R.; Zechmeister-Boltenstern, S. Nitrous oxide emissions from soils: How well do we understand the processes and their controls? Philos. Trans. R. Soc. B Biol. Sci. 2013, 368, 20130122. [Google Scholar] [CrossRef]
  13. Freney, J.R. Emission of nitrous oxide from soils used for agriculture. Nutr. Cycl. Agroecosyst. 1997, 49, 1–6. [Google Scholar] [CrossRef]
  14. Coyne, M.S. Biological Denitrification. In Nitrogen in Agricultural Systems; Schepers, J.S., Raun, W.R., Eds.; Agronomy Monographs; American Society of Agronomy, Crop Science Society of America, Soil Science Society of America: Madison, WI, USA, 2008; Chapter 7; Volume 49, pp. 201–253. [Google Scholar]
  15. Prosser, J.I. Nitrogen in soil. Nitrification. Encycl. Soils Environ. 2005, 31–39. [Google Scholar] [CrossRef]
  16. Norton, J.; Ouyang, Y. Controls and adaptive management of nitrification in agricultural soils. Front. Microbiol. 2019, 10, 1–18. [Google Scholar] [CrossRef] [Green Version]
  17. Debaeke, P.; Aussenac, T.; Fabre, J.L.; Hilaire, A.; Pujol, B.; Thuries, L. Grain nitrogen content of winter bread wheat (Triticum aestivum L.) as related to crop management and to the previous crop. Eur. J. Agron. 1996, 5, 273–286. [Google Scholar] [CrossRef]
  18. Goss, M.J.; Tubeileh, A.; Goorahoo, D. A Review of the Use of Organic Amendments and the Risk to Human Health. In Advances in Agronomy; Academic Press Inc.: Cambridge, MA, USA, 2013; Volume 120, pp. 275–379. [Google Scholar]
  19. Bosch-Serra, À.D.; Ortiz, C.; Yagüe, M.R.; Boixadera, J. Strategies to optimize nitrogen efficiency when fertilizing with pig slurries in dryland agricultural systems. Eur. J. Agron. 2015, 67, 27–36. [Google Scholar] [CrossRef] [Green Version]
  20. Jiménez-de-Santiago, D.E.; Yagüe, M.R.; Bosch-Serra, À.D. Soil water repellency after slurry fertilization in a dryland agricultural system. Catena 2019, 174, 536–545. [Google Scholar] [CrossRef]
  21. Sanz-Cobena, A.; Lassaletta, L.; Aguilera, E.; del Prado, A.; Garnier, J.; Billen, G.; Iglesias, A.; Sánchez, B.; Guardia, G.; Abalos, D.; et al. Strategies for greenhouse gas emissions mitigation in Mediterranean agriculture: A review. Agric. Ecosyst. Environ. 2017, 238, 5–24. [Google Scholar] [CrossRef] [Green Version]
  22. Fangueiro, D.; Hjorth, M.; Gioelli, F. Acidification of animal slurry—A review. J. Environ. Manage. 2015, 149, 46–56. [Google Scholar] [CrossRef]
  23. Soil Survey Staff. Keys to Soil Taxonomy, 12th ed.; USDA-Natural Resources Conservation Service: Washington, DC, USA, 2014. [Google Scholar]
  24. Allen, R.G.; Pereira, L.S.; Raes, D.; Smith, M. Crop Evapotranspiration: Guidelines for Computing Crop Water Requirements. FAO Irrigation and Drainage Paper 56; Food and Agriculture Organization of the United Nations: Rome, Italy, 1998. [Google Scholar]
  25. Yagüe, M.R.; Quílez, D. On-farm measurement of electrical conductivity for the estimation of ammonium nitrogen concentration in pig slurry. J. Environ. Qual. 2012, 41, 893. [Google Scholar] [CrossRef] [PubMed] [Green Version]
  26. Holland, E.A.; Robertson, G.P.; Greenberg, J.; Groffman, P.M.; Boone, R.D.; Gosz, J.R. Soil CO2, N2O, and CH4 exchange. In Standard Soil Methods for Long-Term Ecological Research; Robertson, G.P., Bledsoe, C.S., Coleman, D.C., Sollins, P., Eds.; Oxford University Press: New York, NY, USA, 1999; pp. 185–201. [Google Scholar]
  27. Alves, B.J.R.; Smith, K.A.; Flores, R.A.; Cardoso, A.S.; Oliveira, W.R.D.; Jantalia, C.P.; Urquiaga, S.; Boddey, R.M. Selection of the most suitable sampling time for static chambers for the estimation of daily mean N2O flux from soils. Soil Biol. Biochem. 2012, 46, 129–135. [Google Scholar] [CrossRef]
  28. Mateo-Marín, N.; Quílez, D.; Guillén, M.; Isla, R. Feasibility of stabilised nitrogen fertilisers decreasing greenhouse gas emissions under optimal management in sprinkler irrigated conditions. Agric. Ecosyst. Environ. 2020, 290, 106725. [Google Scholar] [CrossRef]
  29. MacKenzie, A.F.; Fan, M.X.; Cadrin, F. Nitrous Oxide Emission in Three Years as Affected by Tillage, Corn-Soybean-Alfalfa Rotations, and Nitrogen Fertilization. J. Environ. Qual. 1998, 27, 698. [Google Scholar] [CrossRef]
  30. Linn, D.M.; Doran, J.W. Effect of water-filled pore space on carbon dioxide and nitrous oxide production in tilled and nontilled soils. Soil Sci. Soc. Am. J. 1984, 48, 1267–1272. [Google Scholar] [CrossRef] [Green Version]
  31. Grossman, R.B.; Reinsch, T.G. 2.1 Bulk Density and Linear Extensibility. In Methods of Soil Analysis: Part 4 Physical Methods; Dane, J.H., Topp, C.G., Eds.; Soil Science Society of America, Inc.: Madison, WI, USA, 2002; pp. 201–228. [Google Scholar]
  32. Cerrato, M.E.; Blackmer, A.M. Comparison of models for describing corn yield response to nitrogen fertilizer. Agron. J. 1990, 82, 138–143. [Google Scholar] [CrossRef] [Green Version]
  33. Wrigley, C.W.; Batey, I.L. Assessing grain quality. In Breadmaking; Elsevier: Amsterdam, The Netherlands, 2012; pp. 149–187. [Google Scholar]
  34. Meisinger, J.J.; Randall, G.W. Estimating Nitrogen Budgets for Soil-Crop Systems. In Managing Nitrogen for Groundwater Quality and Farm Profitability; Follett, R.F., Keeney, D.R., Cruse, R.N., Eds.; Soil Science Society of America: Madison, WI, USA, 1991; pp. 85–124. [Google Scholar]
  35. Schwede, D.B.; Simpson, D.; Tan, J.; Fu, J.S.; Dentener, F.; Du, E.; deVries, W. Spatial variation of modelled total, dry and wet nitrogen deposition to forests at global scale. Environ. Pollut. 2018, 243, 1287–1301. [Google Scholar] [CrossRef] [PubMed]
  36. Recio, J.; Alvarez, J.M.; Rodriguez-Quijano, M.; Vallejo, A. Nitrification inhibitor DMPSA mitigated N2O emission and promoted NO sink in rainfed wheat. Environ. Pollut. 2019, 245, 199–207. [Google Scholar] [CrossRef] [PubMed]
  37. Weier, K.L.; Doran, J.W.; Power, J.F.; Walters, D.T. Denitrification and the Dinitrogen/Nitrous Oxide Ratio as Affected by Soil Water, Available Carbon, and Nitrate. Soil Sci. Soc. Am. J. 1993, 57, 66–72. [Google Scholar] [CrossRef] [Green Version]
  38. Richards, L.A.; Weaver, L.R. Moisture retention by some irrigated soils as related to soil-moisture tension. J. Agric. Res. 1944, 69, 215–235. [Google Scholar]
  39. Hernández, D.; Polo, A.; Plaza, C. Long-term effects of pig slurry on barley yield and N use efficiency under semiarid Mediterranean conditions. Eur. J. Agron. 2013, 44, 78–86. [Google Scholar] [CrossRef]
  40. Moreno-García, B.; Guillén, M.; Quílez, D. Response of paddy rice to fertilisation with pig slurry in northeast Spain: Strategies to optimise nitrogen use efficiency. F. Crop. Res. 2017, 208, 44–54. [Google Scholar] [CrossRef]
  41. Plaza-Bonilla, D.; Cantero-Martínez, C.; Bareche, J.; Arrúe, J.L.; Lampurlanés, J.; Álvaro-Fuentes, J. Do no-till and pig slurry application improve barley yield and water and nitrogen use efficiencies in rainfed Mediterranean conditions? F. Crop. Res. 2017, 203, 74–85. [Google Scholar] [CrossRef] [Green Version]
  42. López-Bellido, L.; López-Bellido, R.J.; Redondo, R. Nitrogen efficiency in wheat under rainfed Mediterranean conditions as affected by split nitrogen application. F. Crop. Res. 2005, 94, 86–97. [Google Scholar] [CrossRef]
  43. Lloveras, J.; Lopez, A.; Ferran, J.; Espachs, S.; Solsona, J. Bread-making wheat and soil nitrate as affected by nitrogen fertilization in irrigated Mediterranean conditions. Agron. J. 2001, 93, 1183–1190. [Google Scholar] [CrossRef]
  44. Mateo-Marín, N.; Isla, R.; Guillén, M.; Quílez, D. Efectos de dos aditivos sobre la volatilización de amoniaco en la aplicación agrícola de purín porcino. In Proceedings of the VI Workshop REMEDIA “Mitigación y Adaptación Con-ciencia”, Granada, Spain, 11–12 April 2018. [Google Scholar]
  45. EU Nitrogen Expert Panel. Nitrogen Use Efficiency (NUE)—An Indicator for the Utilization of Nitrogen in Agriculture and Food Systems; EU Nitrogen Expert Panel: Wageningen, The Netherlands, 2015. [Google Scholar]
  46. Ladha, J.K.; Pathak, H.; Krupnik, T.J.; Six, J.; van Kessel, C. Efficiency of fertilizer nitrogen in cereal production: Retrospects and prospects. In Advances in Agronomy; Elsevier: Amsterdam, The Netherlands, 2005; Volume 87, pp. 85–156. [Google Scholar]
  47. Dobermann, A. Nutrient use efficiency—Measurement and management. In Fertilizer Best Management Practies. General Principles, Strategy for Their Adoption and Voluntary Initiatives vs. Regulations; International Fertilizer Industry Association: Paris, France, 2007; pp. 1–28. [Google Scholar]
  48. Dalal, R.C.; Wang, W.; Robertson, G.P.; Parton, W.J. Nitrous oxide emission from Australian agricultural lands and mitigation options: A review. Aust. J. Soil Res. 2003, 41, 165–195. [Google Scholar] [CrossRef]
  49. Liu, X.J.; Mosier, A.R.; Halvorson, A.D.; Zhang, F.S. The impact of nitrogen placement and tillage on NO, N2O, CH4 and CO2 fluxes from a clay loam soil. Plant Soil 2006, 280, 177–188. [Google Scholar] [CrossRef]
  50. Liu, Z.; Powers, W. Meta-analysis of greenhouse gas emissions from swine manure land application. In Proceedings of the 2012 ASABE Annual International Meeting, Dallas, TX, USA, 29 July–1 August 2012; American Society of Agricultural and Biological Engineers: St. Joseph, MI, USA, 2012. [Google Scholar]
  51. Intergovernmental Panel on Climate Change Chapter 11: N2O Emissions from Managed Soils, and CO2 Emissions from Lime and Urea Application. In 2006 IPCC Guidelines for National Greenhouse Gas Inventories Volume 4: Agriculture, Forestry and Other Land Use; Eggleston, H.S.; Buendia, L.; Miwa, K.; Ngara, T.; Tanabe, K. (Eds.) Institute for Global Enviromental Strategies: Kanagawa, Japan, 2006; p. 54. [Google Scholar]
  52. Cayuela, M.L.; Aguilera, E.; Sanz-Cobena, A.; Adams, D.C.; Abalos, D.; Barton, L.; Ryals, R.; Silver, W.L.; Alfaro, M.A.; Pappa, V.A.; et al. Direct nitrous oxide emissions in Mediterranean climate cropping systems: Emission factors based on a meta-analysis of available measurement data. Agric. Ecosyst. Environ. 2017, 238, 25–35. [Google Scholar] [CrossRef] [Green Version]
  53. Intergovernmental Panel on Climate Change Chapter 11: N2O Emissions from Managed Soils, and CO2 Emissions from Lime and Urea Application. In 2019 Refinement to the 2006 IPCC Guidelines for National Greenhouse Gas Inventories. Volume 4: Agriculture, Forestry and Other Land Use; Calvo-Buendia, E.; Tanabe, K.; Kranjc, A.; Baasansuren, J.; Fukuda, M.S.N.; Osako, A.; Pyrozhenko, Y.; Shermanau, P.; Federici, S. (Eds.) Intergovernmental Panel on Climate Change: Geneva, Switzerland, 2019; p. 48. [Google Scholar]
Figure 1. Grain yield response curves (linear-plateau model) to nitrogen application at tillering in the urea treatments in 2015/16, 2016/17, and 2017/18 seasons. Vertical bars indicate the standard error (n = 4).
Agronomy 10 01498 g001
Figure 2. Relationship between the 3-year average grain protein (%) and the rate of synthetic-N applied at stem elongation (kg N ha−1) for the different fertilizer strategies (U, PS, or PSI). Vertical bars indicate the standard error (n = 4).
Agronomy 10 01498 g002
Figure 3. Temporal changes of (a) average N2O fluxes (g N ha−1 day−1; n = 4) for each fertilizer treatment (control, U120-AN30, PS120-AN30, and PSI120-AN30) (b) soil temperature (T, °C) and water-filled pore space (WFPS, %) along the three growing seasons (2015/16, 2016/17, and 2017/18). Shadow areas show the period between presowing and harvest of each season. Arrows show fertilizer applications.
Agronomy 10 01498 g003
Figure 4. Soil ammonium concentration (ac) and soil nitrate concentration (df) from 0 to 15-cm depth of the miniplots experiment. Arrows indicate N applications.
Agronomy 10 01498 g004
Figure 5. Relationship between the unaccounted NO-I (kg N ha−1 yr−1) obtained from the 0–90 cm soil N balance and the total N applied (kg N ha−1 yr−1) for the whole experimental period. Vertical bars indicate the experimental standard error (n = 4).
Agronomy 10 01498 g005
Table 1. Main physicochemical soil characteristics at the beginning of the experiment (2015).
Soil Property0–30 cm30–60 cm60–90 cm
Soil TextureSilty-LoamSilty-LoamLoam
Sand (%)32.531.138.2
Silt (%)50.551.949.5
Clay (%)17.017.012.3
Stoniness (%vol.)111
Equivalent Calcium Carbonate (g kg−1)404139
Total Nitrogen (Kjeldahl) (mg kg−1)1350940620
Phosphorous (Olsen) (mg kg−1)4312.1< 5.0
Potassium (NH4Ac) (mg kg−1)408231101
Organic Matter (%)1.840.920.50
pH (1:2.5H2O)8.368.368.28
Electrical Conductivity (1:5H2O) (dS m−1)0.2650.2610.307
Table 2. General crop management practices of wheat during the three growing seasons.
Crop Management Characteristic2015/162016/172017/18
Sowing Date26/11/201530/12/201616/11/2017
Harvest Date07/07/201604/07/201706/07/2018
Seed Rate (kg ha−1)170200175
Date N Side-Dress at tillering24/02/201621/03/201700/03/2018
Date N Side-Dress at Stem Elongation05/04/201608/04/201724/04/2018
Irrigation + Rain (mm) 1380435428
Crop ET (mm)416429383
1 From sowing to harvest.
Table 3. Physicochemical characteristics of slurry from fattening pigs (mean ± standard error; n = 3) and rates of pig slurry and nitrogen applied each year.
Pig Slurry Characteristic2015/162016/172017/18
Density (kg m−3)1018 ± 21020 ± 11012 ± 0
pH-7.6 ± 0.08.4 ± 0.0
Dry Matter (kg DM m−3)24.1 ± 1.436.4 ± 0.912.7 ± 0.2
Organic Matter (kg OM m−3)10.3 ± 0.721.6 ± 0.96.1 ± 0.2
Ammonium Nitrogen (kg N m−3)2.8 ± 0.13.1 ± 0.12.2 ± 0.1
Organic Nitrogen (kg N m−3)0.8 ± 0.10.8 ± 0.00.9 ± 0.2
Phosphorous (kg P2O5 m−3)0.4 ± 0.10.8 ± 0.00.9 ± 0.5
Potassium (kg K2O m−3)2.8 ± 0.03.7 ± 0.13.4 ± 0.1
PS Rate 1(m3 ha−1)27.237.156.6
PS Rate(kg NH4+-N ha−1)74114118
PSI Rate 2(m3 ha−1)28.634.557.5
PSI Rate(kg NH4+-N ha−1)85110129
1 PS: Pig slurry. 2 PSI: Pig slurry with MCDHS.
Table 4. Nitrogen use efficiency indexes (NUEb, NUEg, and REN; mean ± standard error; n = 4) for the fertilized treatments U120-AN0, PS120-AN0, and PSI120-AN0 in the three cropping seasons.
U120-AN0PS120-AN0PSI120-AN0p-Value
NUEb
2015/162.79 ± 0.294.97 ± 0.944.56 ± 0.610.105
2016/171.85 ± 0.041.71 ± 0.061.91 ± 0.140.345
2017/181.48 ± 0.171.38 ± 0.131.35 ± 0.120.737
NUEg
2015/161.29 ± 0.042.69 ± 0.382.23 ± 0.300.132
2016/170.96 ± 0.030.93 ± 0.041.02 ± 0.080.160
2017/180.90 ± 0.090.96 ± 0.110.89 ± 0.050.688
REN
2015/16−0.05 ± 0.290.12 ± 0.590.31 ± 0.100.836
2016/170.48 ± 0.040.26 ± 0.040.39 ± 0.130.367
2017/180.65 ± 0.170.52 ± 0.090.56 ± 0.090.657
Table 5. Nitrous oxide emission (g N ha−1; mean ± standard error; n = 4) in the four treatments (control, U120-AN30, PS120-AN30, and PSI120-AN30) for the three years (from sowing to the following sowing in 2015/16, 2016/17, and 2017/18) and the whole experiment (2015/18). Different letters in the same row indicate significant differences between treatments (Tukey’s test; p < 0.05).
ControlU120-AN30PS120-AN30PSI120-AN30p-Value
N2O (g N ha−1)
2015/16233 ± 86 b1624 ± 650 a1314 ± 330 a1428 ± 587 a<0.001
2016/17576 ± 167 b2101 ± 321 ab2427 ± 447 a2638 ± 715 a0.009
2017/18519 ± 127 b2129 ± 400 ab3094 ± 817 a2538 ± 770 a0.008
2015/181532 ± 387 b6140 ± 1441 a7262 ± 1390 a7086 ± 2235 a0.007
Table 6. EF (%) and YSN2O emission (g N2O-N kg−1 grain) (mean ± standard error; n = 4) in the different fertilized treatments (U120-AN30, PS120-AN30, and PSI120-AN30) for the three years (2015/16, 2016/17, and 2017/18) and the whole experiment (2015/18). The data include the crop period (sowing to harvest) and the intercrop period (harvest to the following crop sowing).
U120-AN30PS120-AN30PSI120-AN30p-Value
EF (%)
2015/160.93 ± 0.380.91 ± 0.250.92 ± 0.490.999
2016/171.02 ± 0.211.06 ± 0.231.26 ± 0.390.929
2017/181.07 ± 0.201.42 ± 0.561.01 ± 0.370.510
2015/181.02 ± 0.251.18 ± 0.261.12 ± 0.440.469
YSN2O (g N2O-N kg−1 grain)
2015/160.19 ± 0.080.15 ± 0.030.15 ± 0.060.919
2016/170.41 ± 0.050.49 ± 0.110.49 ± 0.120.964
2017/180.38 ± 0.050.48 ± 0.120.41 ± 0.110.763
2015/180.31 ± 0.060.36 ± 0.060.33 ± 0.100.893

