Article

Comparative Performance of Organic Fertilizers in Maize (Zea mays L.) Growth, Yield, and Economic Results

1
Department of Agricultural and Biosystems Engineering, College of Agricultural and Environmental Sciences, Makerere University, Kampala P.O. Box 7062, Uganda
2
School of Agricultural Sciences, College of Agricultural and Environmental Sciences, Makerere University, Kampala P.O. Box 7062, Uganda
3
Institute for Water Quality and Resource Management, TU Wien, Karlsplatz 13/226, A-1040 Vienna, Austria
4
Institute of Chemical, Environmental and Bioscience Engineering, TU Wien, Getreidemarkt 9/166, A-1060 Vienna, Austria
*
Authors to whom correspondence should be addressed.
Agronomy 2020, 10(1), 69; https://doi.org/10.3390/agronomy10010069
Submission received: 2 December 2019 / Revised: 24 December 2019 / Accepted: 31 December 2019 / Published: 3 January 2020
(This article belongs to the Section Innovative Cropping Systems)

Abstract

:
Maize is a major crop grown and consumed in Uganda and it requires a high fertilizer input. However, the existing inorganic fertilizers in the market are often not affordable especially to small scale farmers, which results in decreased maize yields in the country. On the other hand, there is an abundance of unutilized animal manure, which, when treated, can be used to increase maize yields. This study evaluated the response of maize to products of different cattle manure treatment methods as well as inorganic fertilizer. The treatments such as cattle manure stored under shade (T), cattle manure stored in the open (M), cattle manure slurry digestate (S), vermicompost (V), and an inorganic fertilizer, DAP (D) were all applied in completely randomized block plots at an equal application rate of 50 kg N ha−1 with four replications per treatment. Control plots (C) where no fertilizer was applied were also considered. The experiment was done for two planting seasons in 2018. Number of leaves, plant height, cob, and grain yields were used to evaluate the performance of different fertilizer treatments. Economic assessment of all the six treatments was also carried out to determine the economic viability of applying these fertilizers on maize. Maize growth parameters and yields were all significantly increased (p < 0.05) with an application of both organic and inorganic fertilizers when compared with the control. However, there was no significant difference (p > 0.05) in the maize yields under the different fertilizer treatments. Vermicomposting was the most economically viable manure treatment method due to low operating costs and higher returns on investment that are supplemented with the production of chicken fodder (earthworm biomass) and, thus, can be recommended to farmers for production of a fertilizer that increases maize yields with assurance of economic returns.

1. Introduction

Despite having the fastest growing population and the highest soil depletion rates in the world, farmers in Sub Saharan African (SSA) countries have the lowest global fertilizer use of less than 10 kg ha−1 [1]. This is mainly a result of high prices associated with acquiring these fertilizers [2]. It is highly likely that the reduction of the fertilizer prices could increase their usage and, hence, improve the yields of staple food crops like cereals [3].
One of the most important cereals in SSA is maize (Zea mays L.). It is a staple food for over 600 million people in the region [4]. In the case of Uganda, it is the most grown cereal crop in both acreage and production [5] as well as the second largest consumer of mineral fertilizers in the country [6]. However, maize yields across the country remain low when compared to acreage of land under production with a decreasing trend over several years. For instance, in 2013, average maize yields were 2.395 t ha−1 as compared to 2.353 t ha−1 in 2015, which represents a 6% decrease in yield [5]. During the same period, usage of Nitrogen (N) fertilizers on agricultural fields decreased despite a 2% increase in land under maize production [5]. The consequence of these figures is stressed by Masso et al. [7] who reported that more than 80% of agricultural land in East Africa is N deficient due to over mining of soil nutrients especially with crop harvests with insufficient or no replacement for the lost nutrients. The use of fertilizers to increase crop yields is, therefore, inevitable. Ciceri and Allanore [8] indicate that fertilizer usage can lead to an increase in crop yield in SSA of about 30%–50% in the next 30 years.
While there is increased advocacy for use of inorganic fertilizers, their excessive use is associated with soil, water, and air pollution [9,10,11,12]. Furthermore, inorganic fertilizers are expensive and their use may not be economically justifiable especially for the poor smallholder farmers who mainly practice subsistence farming. The use of organic amendments such as cattle manure is an alternative to these detrimental effects of inorganic fertilizers because of its wide-spread availability, its additional value for soil carbon sequestration, and its capacity for storing and releasing nutrients over a longer time period [10]. In Uganda, although a significant number of farmers have adopted the use of cattle manure on their farms, they normally use it untreated and directly from animal barns [13]. This practice poses a threat to human health and crops due to a high prevalence of pathogens in this untreated manure. On the other hand, the manure emits emissions of carbon–dioxide (CO2), methane (CH4), nitrous oxide (N2O), ammonia (NH3), and other volatile substances [14]. Such emissions are detrimental to the environment by contributing to global warming, eutrophication, and acidification of ecosystems [15].
Stocking and treating this manure through various methods such as open or shaded storage, vermicomposting, anaerobic digestion, or composting may improve its management. The treatment method may sometimes influence the quality of the manure derived end products [16] and their potential to increase crop yields [17]. These effects, however, are not clearly known in the Ugandan context. Therefore, the aim of this study was to evaluate the performance of the different products derived from various manure management practices (manure after open and shaded storage, vermicompost, and anaerobic digestion sludge from manure) on maize production. The novelty of the study is represented by the approach used in evaluating the commonly used manure treatment methods in developing countries and the influence of the derived products on maize growth when applied at the same rate. Results can guide farmers and agronomists on the expected nutrient composition of the products from these treatment methods and how these products influence the growth and yield of maize. This can, thus, be a justification on whether to replace the inorganic fertilizers that are somewhat detrimental to the environment with organic amendments in improving soil fertility and, hence, increase crop yields.

2. Materials and Methods

2.1. Study Site

Organic fertilizer trials were carried at Makerere University Agricultural Research Institute Kabanyolo (MUARIK) (00 28′ 06″ N, 320 36′24″ E), located about 20 km north of the Ugandan capital Kampala. The annual rainfall of the area is about 1300 mm and average temperatures vary between 20–28 °C [18]. The field soils, which are oxisols, are often acidic with moderate levels of organic matter [19,20]. The initial soil properties at the site before manure application were obtained from five randomly selected points at a depth of 30 cm. The plot of land where maize was grown had been under fallow for two consecutive growing seasons. The soil samples were analyzed for pH, organic matter (OM), and nitrogen content (TKN) at the Makerere University soil laboratory following the procedures as specified by Okalebo et al. [21]. Emphasis of the soil nutrient analysis was on nitrogen since it is the limiting nutrient for growth of maize in the experiment location [17]. Nitrogen has been reported as the key determinant nutrient for maize grain yields [22]. The economically optimal nitrogen application rate for maize fields in this part of central Uganda is 50 kg N ha−1 as suggested by Kaizzi et al. [23]. This application rate was used to calculate the amount of each organic fertilizer to be applied in the field.

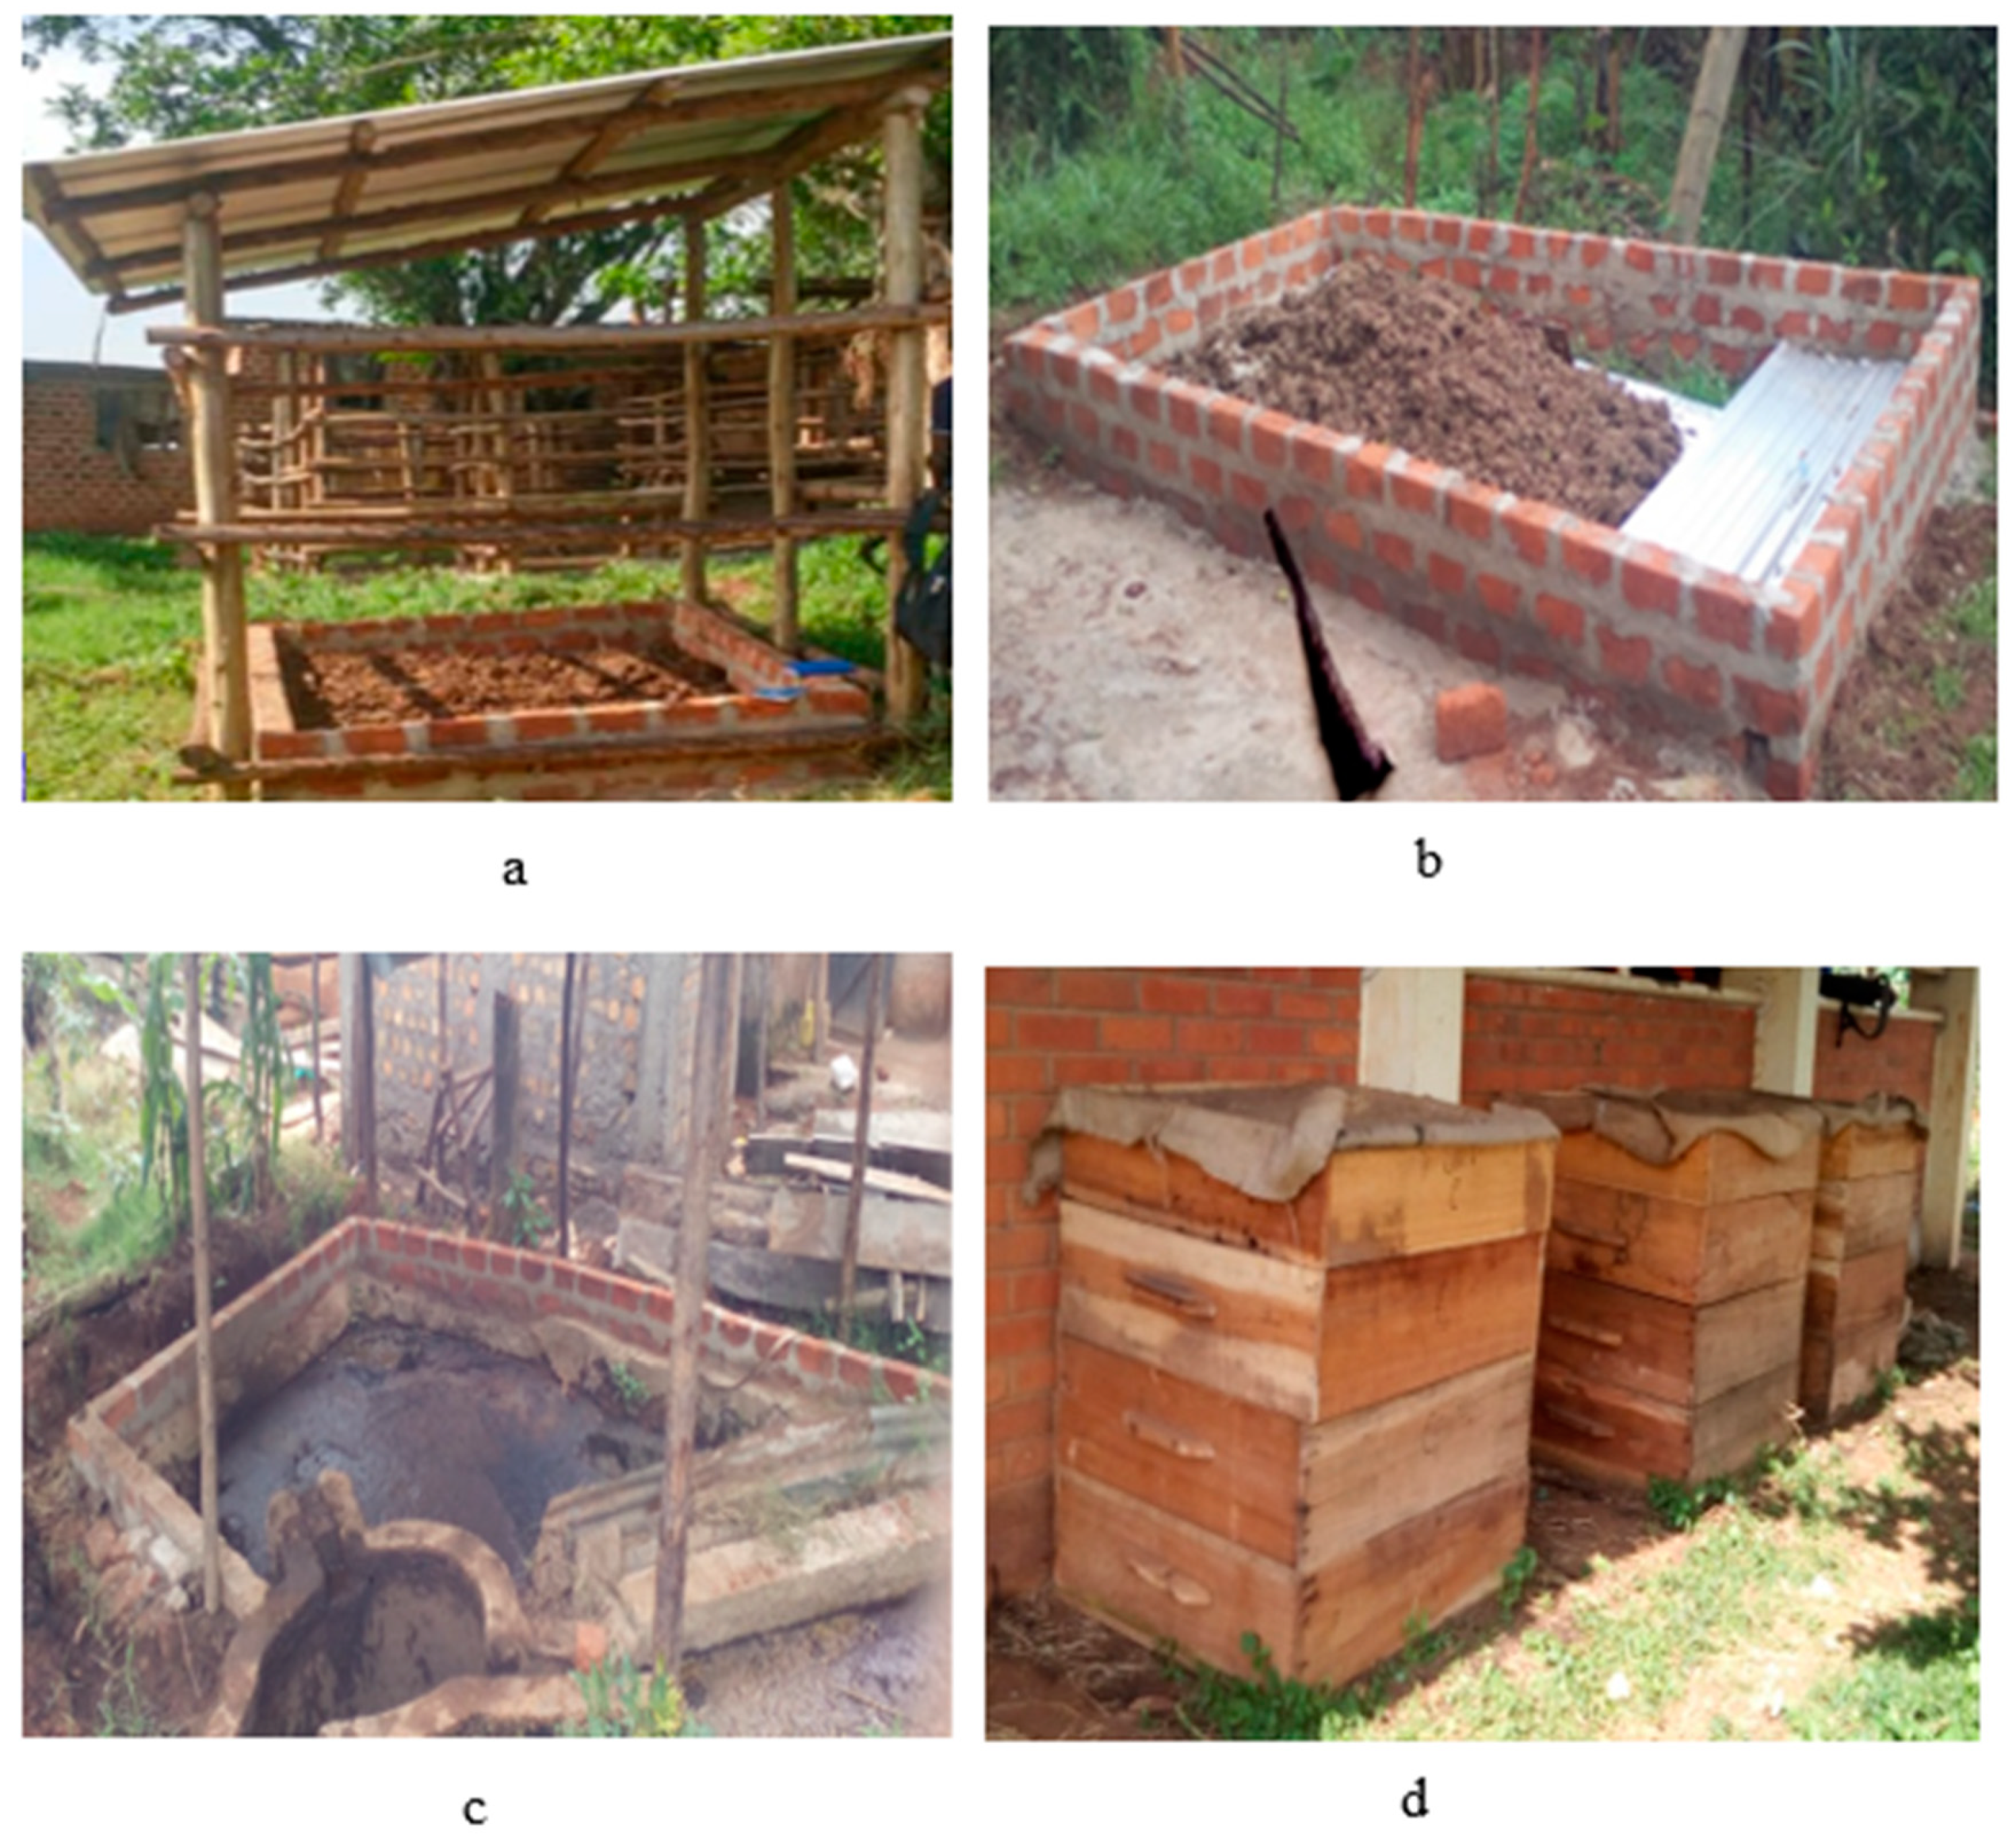
2.2. Manure Treatment Methods and Derived Products

For all manure treatment experiments, the same cattle manure generated by 11 Friesian (Bos Taurus) × Zebu (Bos Indicus) crossbred cattle at the MUARIK dairy farm was used. The cattle were fed on Napier grass (Pennisetum purpureum), Lablab (Lablab purpureus L.) hay, maize bran, and water on a daily basis. The cattle were housed in an open ended roofed barn with a concrete slab floor. The generated manure was collected from the barn on a daily basis and stored under a shade (T), in the open (M), in a biogas digester (S), and in a vermicompost system (V). The structures for manure storage for T and M (Figure 1) are the types commonly used by farmers using these technologies and are both rectangular in shape with dimensions of 2.6 m × 2.4 m and a manure holding depth of 0.2 m. In addition, the T facility was constructed with an iron sheet roof supported with treated poles (to minimize damage by termites) while the M facility was left open. For both storage facilities (T and M), drainage channels were constructed to divert runoff, which would erode cattle manure under storage. The slurry (S) was obtained from a fixed dome bio-digester. The capacity of the digester was 6 m3 with a loading rate of 150 kg of cattle manure and 140 L of water every three days and a retention time of 69 days. Vermicompost (V) was obtained from vermicomposting units that were constructed and maintained as specified by Jjagwe et al. [24]. The units were made from wooden pallet frames from Albizia coriaria tree (local name Mugavu), each unit with a base pallet, two support pallets, and a top pallet (Figure 1) of uniform dimensions (1 m × 1 m × 0.3 m). The feeding frequency of cattle manure into the units was dependent on the consumption rate of the earthworms. The moisture content within the vermicomposting units was maintained between 60%–70% by sprinkling water into the units. For T and M facilities, 720 kg of fresh manure was loaded and stored into each facility for three months from 20 December 2017 to 20 March 2018. For the S facility, 1250 kg of slurry was obtained from the digester after the retention time and stored under a shade for the same period as for T and M. Vermicomposting units also ran for three months [24]. The period of three months is suggested to be enough for stabilization of stored manure/compost [25,26]. At the end of the storage period, 193 kg, 200 kg, and 682 kg of T, M, and S, respectively, were available.
The physio-chemical composition in terms of moisture content (MC), pH, TKN, total phosphorous (TP), total potassium (TK), and total organic carbon (TOC) of fresh cattle manure (FCM) and the derived products of T, M, S, and V after three months was determined according to procedures specified by Okalebo et al. [21]. pH was determined by dissolving and stirring 10 g of a sample in distilled water and using a digital pH meter model HI 96107 (Italy) to indicate the pH of the solution after standing for one hour. TK was determined using a flame photometer after digesting an oven dried sample for 2 h at 360 °C while TP was determined by an Atomic Absorption Spectrophotometer. TOC was determined after adding 5.0 and 7.5 mL of the aqueous potassium dichromate (K2Cr2O7) and sulphuric acid (H2SO4), respectively, to 0.5 g of the prepared sample in a block digester tube. This was subsequently placed in a pre-heated block at 145 °C–155 °C for 0.5 h. After cooling down, the digestate was titrated with ferrous ammonium sulphate solution until a color change from green to brown was attained. The amount of K2Cr2O7 consumed during the chemical reaction indicated the total organic carbon content of the given feedstock. MC was determined as the lost weight after oven heating 10 g of a sample at 105 °C for 16 h [27].

2.3. Experimental Design for Fertilizer Tests

Five fertilizer treatments such as organic fertilizers T, M, S, V, inorganic fertilizer diammonium phosphate (18-46-0) DAP (D), and the control (C) with no fertilizer treatment were applied in a completely randomized block design (RCBD) with four replications. The treatments (T, M, S, V, D, and C) were laid out in individual plots measuring 4 m × 3 m with 1-m alleys in between. The different treatments were applied to the plants when planting at an application rate of 50 kg N ha−1. Seeds of a hybrid variety of maize (Longe 5) were sown manually at a depth of about 3 cm below the soil surface at a spacing of 75 cm × 30 cm, with two seeds sown per hole. Longe 5 is mainly used by Ugandan farmers because of its ease of access, good adaptability, and its high protein content [28]. The experiment was run for two seasons. For season one, planting was done on 29 March 2018 and harvesting was on 20 July 2018. For season two, planting was done on 13 October 2018 and harvesting was on 30 January 2019. Each season was executed from an independent plot that had been under fallowing for the last two consecutive planting seasons. The experimental plots were kept free of weed using a hand hoe. Rainfall data for the two seasons was measured from a manual rain gauge installed at the experimental site.

2.4. Economic Analysis of Different Fertilizer Treatment Systems

The economic analysis of the different fertilizer treatment systems was carried out using three methods such as benefit to cost ratio (B/C), net present value (NPV), and internal rate of return (IRR). B/C of a project is the ratio between the present value of gross profits and the present value of costs. B/C indicates the present profit obtained per unit of the present investment with its applicability dependent upon the existence of at least one flow that is strictly positive and another that is negative [29]. The limitation of B/C is recognized when considering mutually exclusive projects with varying capital investments [30].
NPV involves discounting all the future cash flows resulting from a project at a given discount rate and then summing them together [31]. The strength of using NPV for economic assessments is that it associates a cash value with an opportunity rather than a relative rate, and it also allows the consideration of projects with different risk profiles [31]. IRR is usually used as a supplement to NPV in evaluating the profitability of projects [32]. IRR indicates the value at which the discounted cost of a project is equal to its discounted income [32]. One of the shortcomings of IRR is that it does not tell anything about the size of the project but rather considers cash flows with incorporation of the time value of money, which provides an objective decision [33]. IRR is, thus, a relative measure of an investment as compared to NPV, which is an absolute measure [33].
According to Arshad [33], for mutually exclusive projects with differences in capital out lays, NPV is the best economic evaluation approach. Generally, NPV is considered as the most superior criterion for indicating the economic sense of a project [29,33] since it incorporates variables such as uncertainty in project evaluation [34]. Using a number of assessment criteria such as B/C and IRR in conjunction with NPV is a justification of the desirability of a project between mutually exclusive alternatives [29].
Interest rates above and below the Bank of Uganda (BoU) average rate of 13.9% [35] were used to assess the systems. The interest rates considered for assessment included 5%, 10%, 13.9%, and 24%. The economic analysis was done by considering the initial investment costs, annual operating costs, and estimated annual benefits. The initial investment of the T, M, S, and V facilities included cost of construction materials and labor used in construction. In addition, the cost of installing cooking and lighting equipment of the S facility and buying the initial earthworm stock for the V facility were considered in the initial costs (Supplementary Material). The operating costs for all the systems were categorized into cost labor for mixing, loading, and cleaning around facilities, and maize (Zea mays L.) crop production costs. The cost of water for mixing digester feedstock and maintaining proper moisture content in vermicomposting systems was included among the operating costs of the S and V systems, respectively. The initial cost of purchasing the inorganic fertilizer DAP (D) and maize crop production costs were considered as the initial investment and operating costs, respectively, for D treatment. The costs incurred in the manufacture and transport of the inorganic fertilizer were taken as sunk costs and not used in the economic analysis of the D system.
The annual benefits from all the treatment systems (T, M, S, V, D, and C) were determined by considering the annual revenue obtained by selling the maize. In addition, energy savings attributable to use of biogas and earthworms used as a poultry feed were added to the benefits of using anaerobic digestion and vermicomposting systems, respectively. The economic assessment was conducted for a period of 20 years, which was the design life of a fixed dome digester [36]. The present worth (PW) of costs and benefits over the period of assessment were computed from Equation (1). Using Equation (2), the B/C ratio of the treatments were determined. The NPV for each treatment was calculated from Equation (3). Overall, the fertilizer treatment system, which had higher NPV, B/C, and IRR greater than the economic opportunity cost of capital (EOCK), which was 11% for Uganda [35], was considered most economically viable [37].
P W   o f   b e n e f i t s = A ( i + 1 ) n 1 i ( 1 + i ) n
B / C = P W   o f   b e n e f i t s P W   o f   c o s t s
N P V =   I 0 +   A ( i + 1 ) n 1 i ( 1 + i ) n
where:
NPV is the net present value, A is the annual net cash flow, i is the interest rate, n is the period of investigation in years, and Io is the initial investment of the system.

2.5. Data Collection

Plant height, number of leaves, cob yield (t ha−1), and total grain yield (t ha−1) were used as the indicator parameters of the performance of different treatments. Plant height and number of leaves were measured at 2, 4, 6, and 8 weeks after planting (WAP). The measurement process was as follows. Within each plot, four plants along the two diagonals were randomly selected and their number of leaves and heights measured. The height was measured as the distance from the soil surface to the topmost leaf tip or tassel using a linear tape measure (COLT GERMANY 5m). Cob yield was taken by weighing the dry unhusked maize cobs (85% dry basis) from each plot after harvesting. Grains from the cobs were threshed manually to avoid grain loss after which the grains were weighed to obtain grain yield from each plot. Cob and grain yields were recorded in kilograms with the weight being obtained using a GLOBE digital weighing scale model 821–018 (Adam Equipment Inc., Oxford, UK) and then converted to t ha−1.

2.6. Data Analysis

Results were expressed as mean ± standard deviation. The effects of fertilizer treatments and season of planting on maize growth parameters and yield were analyzed using a two-way ANOVA. The differences of significant treatment means were further analyzed using a Tukey test at a 5% significance level. All of the statistical analysis was done using GenStat software 14th edition. Prior to ANOVA tests, data was tested for normality and homogeneity/equal variance using the GenStat distribution directive through the production of residual plots. The produced residual plots were normally distributed about the mean with variances being homogeneous, which meets the assumptions of ANOVA.

3. Results and Discussions

3.1. Characteristics of Soil, Manure, and Manure-Derived Products

The results from soil analysis from the experimental site indicated that the soil had a pH of 6.25 ± 0.32, organic matter (OM) of 4.25 ± 0.42%, and N of 0.14 ± 0.02%. According to Peng et al. [38], the critical soil nitrogen content in the soil for maximizing maize growth has to be above 0.2%. The results from soil analysis, therefore, indicated a deficiency in nitrogen content, which justifies the application of fertilizers to the field. The physio-chemical compositions of cattle manure and the derived products after its treatment are shown in Table 1. The nutrient concentration (N, P, K) of cattle manure increased when subjected to different manure treatment methods. Among the manure treatment methods, vermicomposting showed the greatest increase in the plant nutrients. Based on these compositions and the restriction to apply 50 kg ha−1 of nitrogen with a consideration that 30% of TKN is available for plant use, the resulting manure derived products’ application rates were 5 t ha−1, 7 t ha−1, 10 t ha−1, and 8 t ha−1 for T, M, S, and V, respectively. These were equivalent to phosphorous application rates of 13 kg ha−1, 10.5 kg ha−1, 10 kg ha−1, and 26.4 kg ha−1, and potassium application rates of 21.5 kg ha−1, 30.8 kg ha−1, 19 kg ha−1, and 40 kg ha−1 for T, M, S, and V, respectively. The fertilizers were applied at planting by incorporating them into the soil to reduce the rate of volatilization.
A fall in pH for all the manure treatment methods may be attributed to mineralization of phosphorous and nitrogen compounds by microorganisms, and earthworms for the case of vermicomposting [39]. This fall in pH could have caused an increase in nitrogen content for all the treatment methods as compared to the fresh cattle manure since nitrogen is easily lost as volatile ammonia at high pH values [40]. For vermicomposting, an increase in total nitrogen content may also be attributed to earthworm activity such as the addition of mucus, growth-stimulating hormones, nitrogenous excretory substances, and microbe-mediated transformations [41]. A reduction in moisture content especially for T, M, and V systems is indicative of the progress in composting [42], which may be attributed to a high consumption rate of cattle manure by microorganisms, earthworms, and bacteria, which makes it friable [43]. The decrease in the amount of carbon may be attributed to its role as an energy source for both earthworms and microorganisms [44]. A fall in C/N is associated with a loss of carbon as well as an increase in TKN. The C/N ratio is an indicator for maturity of compost/vermicompost [45] and usually values < 12 signify compost maturity and stabilization [46]. Hence, it is indicated from the C/N ratios of cattle manure derived products (T, M, V, and S) that they had reached maturity. The increase in TK in all the manure derived products could be attributed to solubilizing of insoluble potassium as a result of acid production by microorganisms [47].
With regard to the different manure treatment methods, vermicomposting has been reported to be the most environmentally-friendly in reducing nutrient losses and greenhouse gas (GHG) emissions to the atmosphere. For instance, vermicomposting of cattle manure was reported to retain more than 75% of the initial nitrogen after three months [24] as compared to 69% and 54% N retention from stockpiling and composting of cattle manure, respectively, for the same storage period [48]. In terms of GHG emissions, vermicomposting of cattle manure had a global warming potential (GWP) of 324 kg CO2 eq t−1 waste after three months of evaluation [24] as compared to GWP of 605 kg CO2 eq t−1 waste, 741 kg CO2 eq t−1 waste, and 605 kg CO2 eq t−1 waste from composting, stockpiling, and anaerobic digestion of cattle manure for the same evaluation period [49]. On the other hand, Komakech et al. [18] reported about 1670–2740 kg CO2 eq t−1 during the production process of DAP.

3.2. Maize Plant Height and Number of Leaves as Influenced by Treatments

The variation in height and number of leaves of the maize crop for the different treatments is shown in Table 2 and Table 3, respectively. Results indicated significant differences (p < 0.05) exist in maize height between treatments, weeks after planting (WAP), and seasons. However, the interaction of these factors was not significant (p > 0.05). Season one exhibited better results for plant height across all treatments compared to season two (Table 2). The mean plant height for all treatments increased with time. DAP (D) gave the greatest mean plant height across weeks of measurement, which is followed by vermicompost (V) while the least mean plant height for the two seasons was from the control plots (C). Shisanya et al. [50] attributed higher maize plant height from inorganic fertilizers to readily available N of inorganic fertilizers as compared to N from organic fertilizers, which must first decompose and mineralize before being available to plants. This causes organic nutrients to be slowly released to crops [51]. The number of leaves increased with time for all treatments. There was no significant difference (p > 0.05) in the number of leaves for the different treatments across seasons. However, between seasons, the number of leaves in week 6 and week 8 were significantly different (p < 0.05).

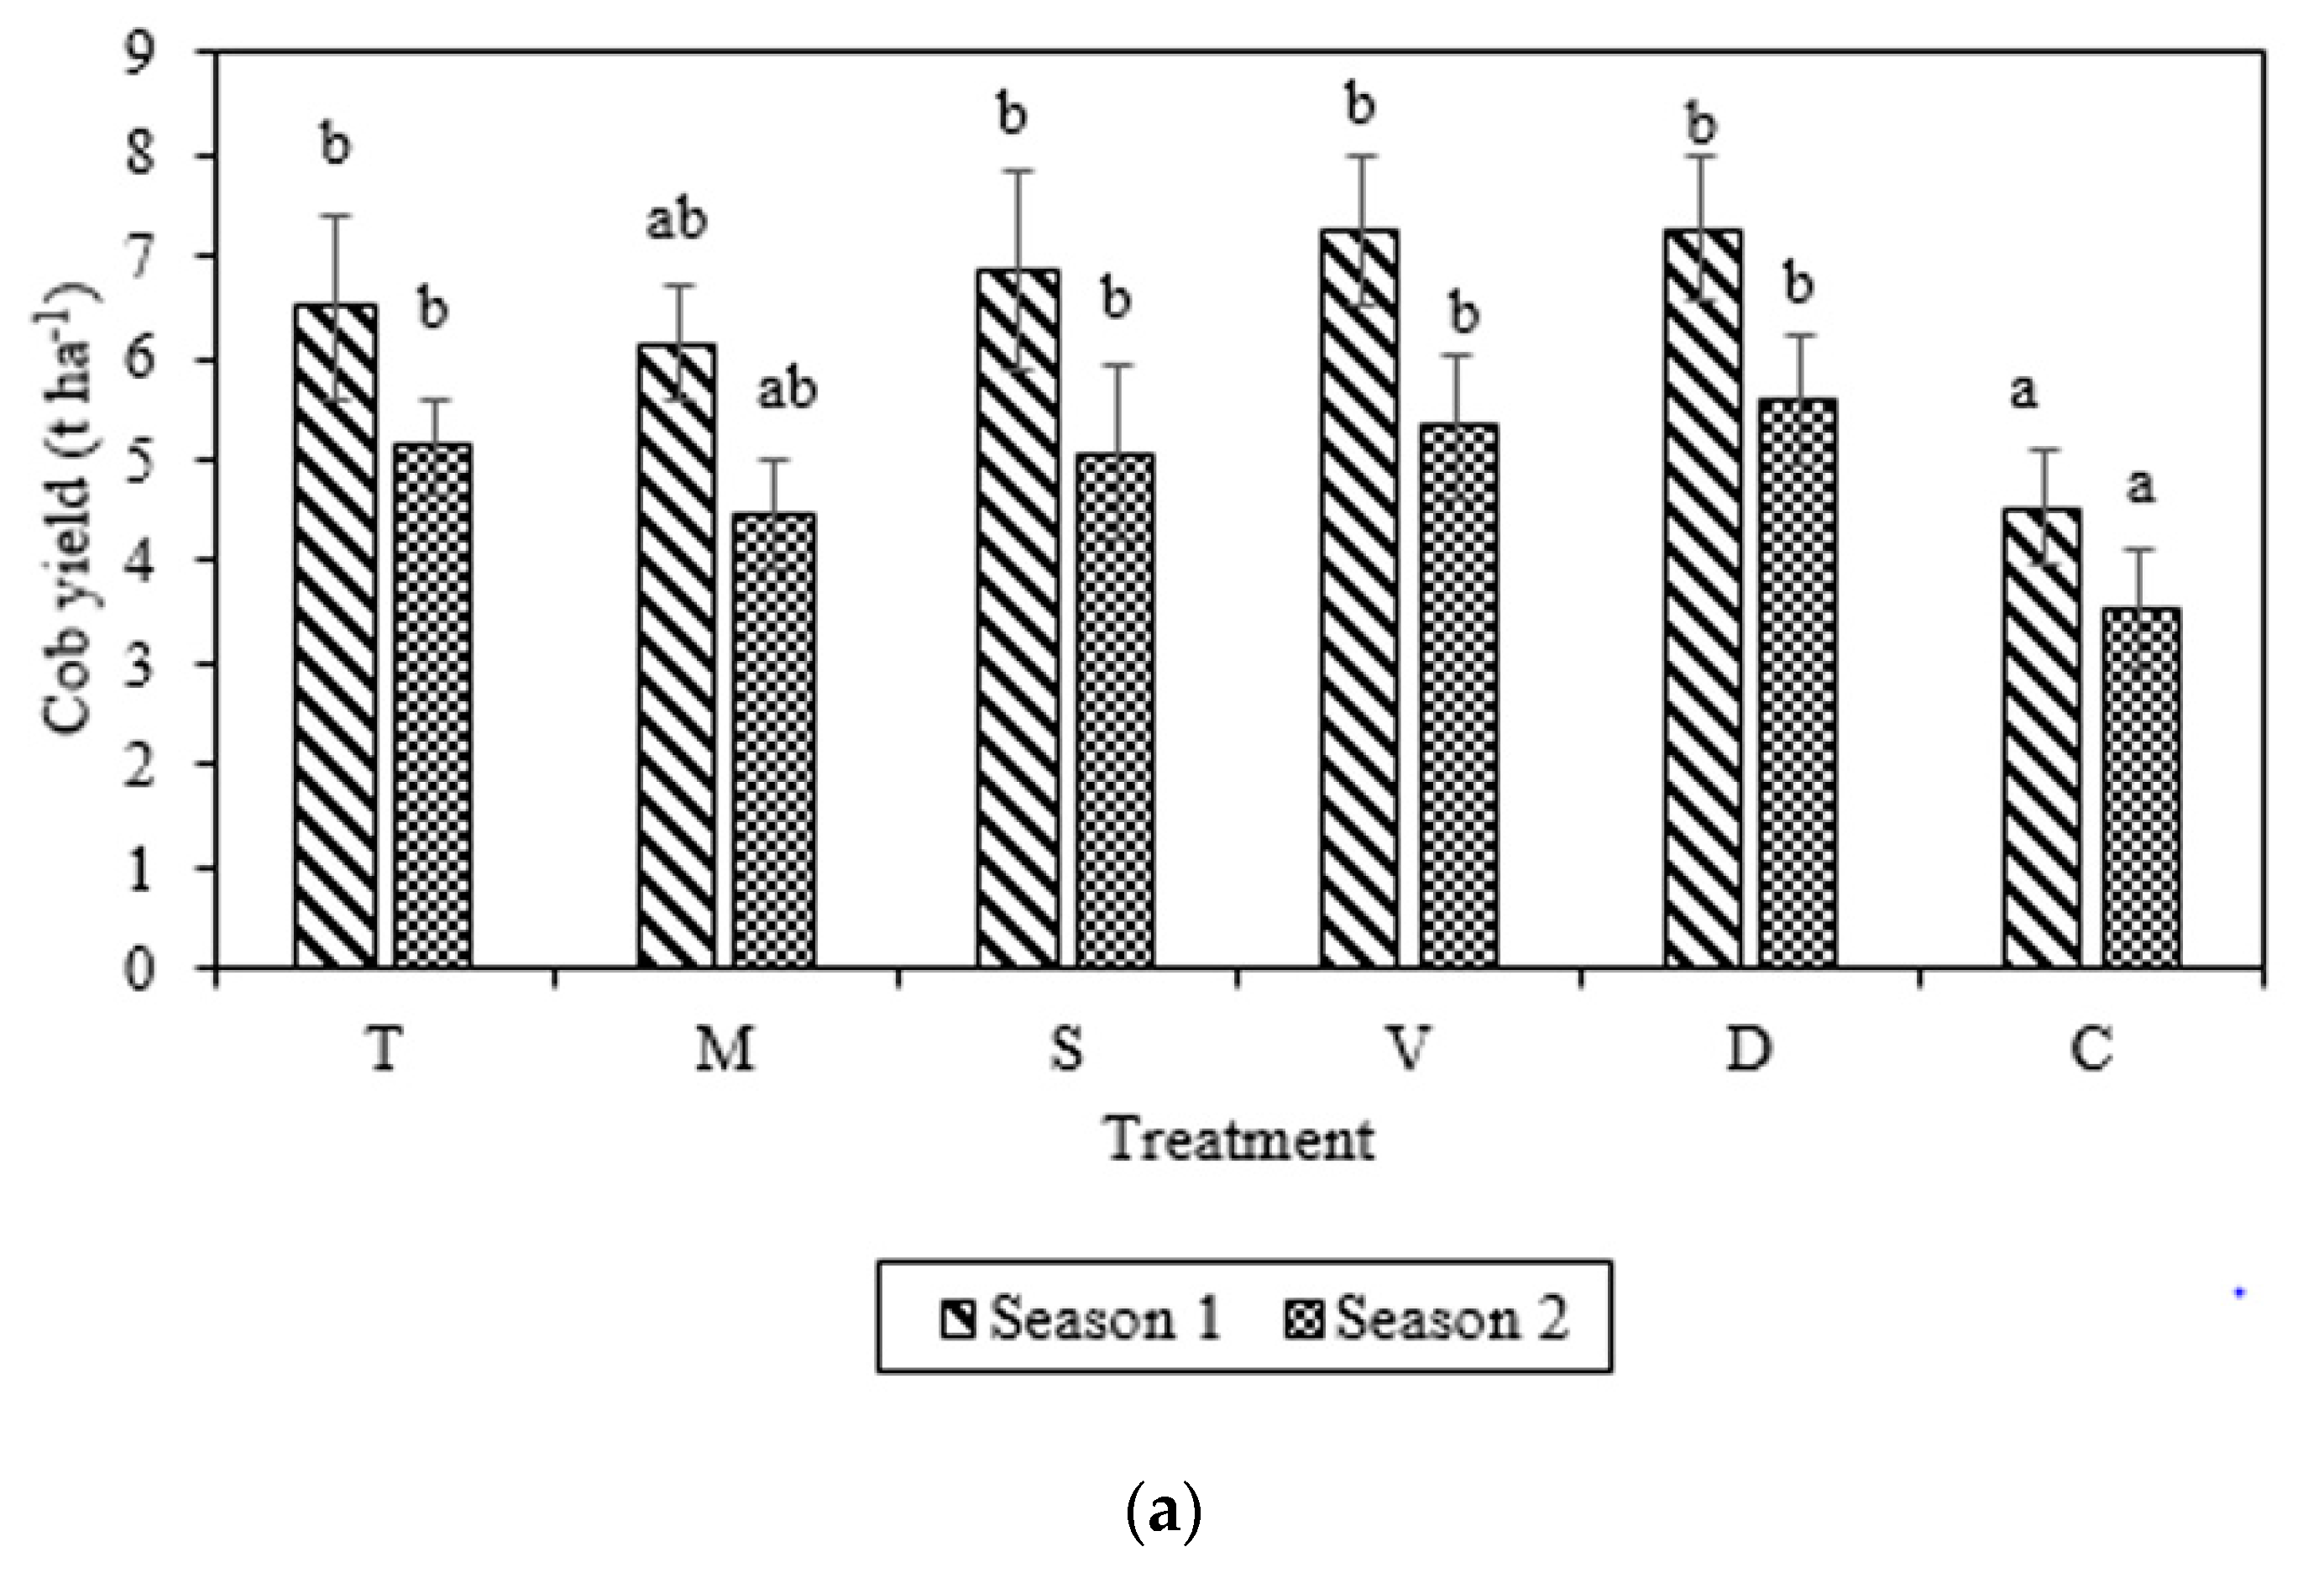
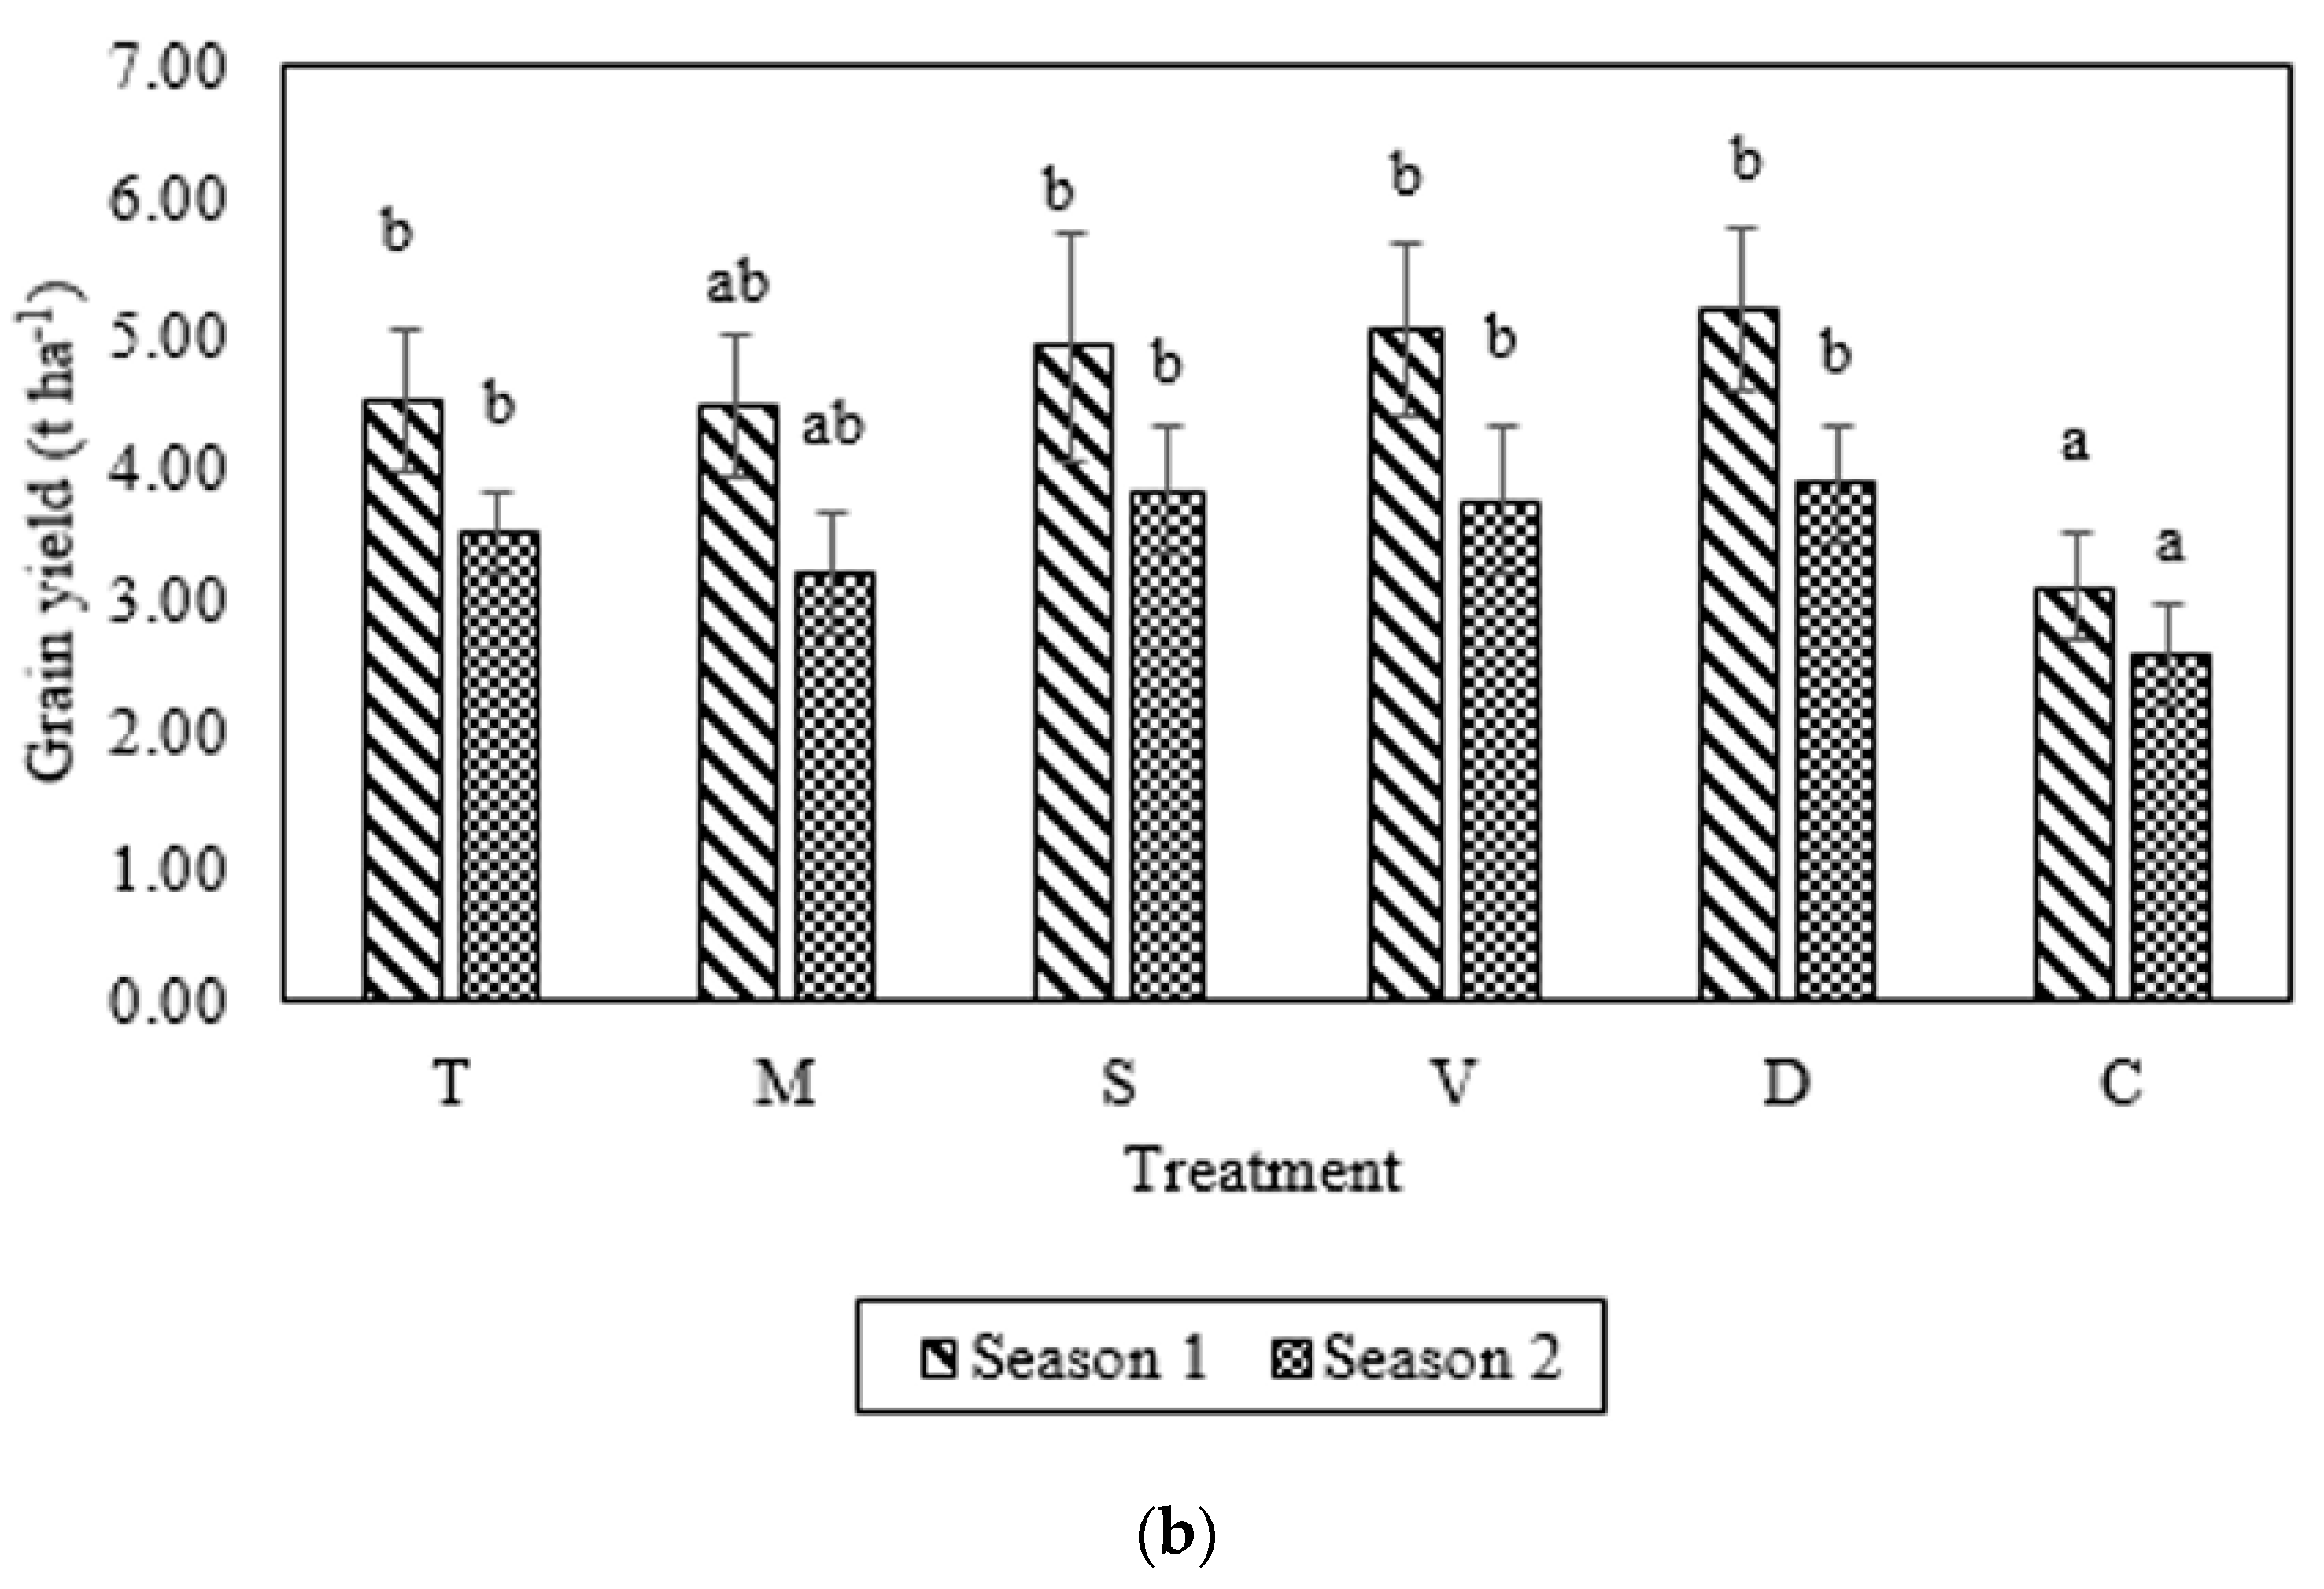
3.3. Cob and Grain Yields

The seasonal variation of cob and grain yields for the different treatments is shown in Figure 2. There was a significant difference (p < 0.05) in cob and grain yields within treatments and seasons, but the interaction between seasons and treatments was not significantly different (p > 0.05). Grain yields for season one increased in the order D > V > S > T > M with increments of 67%, 62%, 45%, 45%, and 44% over the control (C), respectively. For season two, grain yields increased in the order of D > S > V > T > M with increments of 50%, 48%, 45%, 36%, and 24% over the control (C), respectively.
Maize cob yields as obtained in this study ranged between 4.52-7.27 t ha−1 and 3.54-5.58 t ha−1 and grain yields ranged between 3.10–5.17 t ha−1 and 2.50–3.88 t ha−1 for season one and season two, respectively, across all treatments. These results are comparable to those of Glaser et al. [52] who reported 5–8 t ha−1 in maize cob yields in fields treated with compost, digestate, and mineral fertilizer. They further stressed that compost and biogas digestate were both as effective as the mineral fertilizer in maize yield performance. Similar results were reported by Bayite-Kasule [53] in Central Uganda when 90 kg N ha−1 was applied. Doan et al. [54] reported that the maize grain yield from vermicompost (4.7 t ha−1) was better than that of compost (4.1 t ha−1) using buffalo manure as the substrate even though the differences were not significant. Komakech et al. [17] reported cob yields in the range of 6.6–18.5 t ha−1 for the similar organic fertilizer treatments as of this study. An assumption that cob yields represent 63% of the total weight of husked maize for all the experimental plots was used. Hence, this assumption might have caused differences in their results and those of this study. Higher fertilizer application rates (90 kg N ha−1) were used by Komakech et al. [17], which could also be the reason for their higher reported maize yields.
The non-significance in maize yields (cob and grain) between organic amendments and DAP in this study may be attributed to the same Nitrogen fertilizer application rate used (50 kg N ha−1). Studies have shown that, when organic and inorganic fertilizers are applied at the same rates especially in terms of macronutrients (N, P, and K), similar effects in crop yields are obtained [55,56,57]. Since P and K application rates for the fertilizer treatments differed, no significant differences in maize yields were observed. This may be a result of P and K being non-limiting nutrients for growth of maize in the experiment area, as reported by Komakech et al. [17]. According to Doan et al. [54], significant differences in crop yields due to organic amendments can be clearly shown in water stress conditions. However, for the case of this study, rainfall was evenly distributed across the two seasons even though it was greater for season one (538 mm) than season two (415 mm), which likely explains better performance in season one. Some studies [58,59] have reported better performance of organic manures than inorganic fertilizers on maize yield. In these studies, high application rates of organic amendments (>15 t ha−1) were used. However, according to Celestina et al. [55], although high organic amendment rates will eventually ensure high productivity gains, these gains are not necessarily economical. In addition, these high rates can lead to increased greenhouse gas emissions, higher losses to runoff, and reduced nutrient use efficiency.
Though not significantly different, vermicompost (V) showed higher performance attributes than other organic amendments (S, T, and M). This could likely be due to the fact that different organic manures have different decomposition rates [10]. Vermicompost has been reported to have a much finer structure than other composts and organic manures and, hence, availing nutrients in a faster, readily available form for plant uptake [60]. In addition, according to Atiyeh et al. [60], most decomposed organic manures release mineral nitrogen in the form of ammonium ions whereas vermicompost releases it in the form of nitrates, which is a form that is readily utilized by plants. A crop’s response to organic amendments is also dependent on the C/N ratio [61] with the best response attained from low C/N ratio amendments [61,62]. This could, thus, explain why vermicompost (V) with the lowest C/N ratio (Table 1) showed better performance attributes than other organic amendments (S, T, and M) in this study.

3.4. Economic Performance of Different Fertilizer Treatments

The initial investments, annual costs, annual benefits, and the indicator parameters (PW, B/C ratio, and NPV) of the different fertilizer treatments are shown in Table 4. The cost and revenue details for each treatment are shown in the Supplementary Material. Considering the Bank of Uganda interest rate of 13.9%, vermicompost (V) had the highest NPV (USD $15,203) while no fertilizer application (C) had the least NPV (USD $1156). At the same interest rate, the B/C ratios of the five fertilizer treatments (T, M, S, V, and D) were all greater than 1 (Table 4), which implies that applying any of these fertilizers on maize is economically viable. It is worth mentioning that, even with an increase in the interest rate as high as 24% employed by most commercial banks in Uganda, the NPV (USD $9323) of V was the highest and the B/C ratios of all the treatments were greater than one indicating economic viability at this interest rate. The IRRs for the five fertilizer treatments were 2562%, 489%, 45%, 1533%, and 466% for T, M, S, V, and D, respectively, which were all above 11% within the EOCK of BoU. This implies that, at the Bank of Uganda, the interest rate with all the five fertilizer treatments were economically viable.
NPV assumes that cash inflows are reinvested at the required rate of return while IRR assumes reinvestment at the computed IRR [33]. Reinvesting at the required rate of return is more realistic and reliable when comparing mutually exclusive alternatives [33]. On this note, vermicompost with the highest NPV is considered to be the most economically viable treatment method. Results of this study are in agreement with Guo et al. [63] who reported that cattle manure treated by vermicomposting had higher economic returns on maize growth and yield compared to traditional composting. They attributed this to many harvested earthworms that could be used as animal feed in addition to greater maize yields. On the other hand, Choudharya and Kumar [64] also reported vermicompost to be the most economically viable fertilizer treatment on maize when compared to poultry manure, swine manure, cow dung manure, and farmyard manure.

4. Conclusions

In this paper, we investigated how organic fertilizers could be used in place of conventional fertilizers that are somewhat not affordable by most small holder farmers in low to middle income countries on top of causing environmental and health challenges. We, therefore, used cattle manure as a substrate and subjected it to different treatment methods such as vermicomposting, storage in the open, and under a shade as well as anaerobic digestion. This was done by acknowledging the fact that using these organic materials in untreated form may create more health and environmental problems than the inorganic fertilizers. The derived products were used as fertilizers on maize in comparison with an inorganic fertilizer, DAP, at the same nitrogen application rate. From the results, it can be concluded that treating organic materials prior to their use as crop fertilizers improves their quality in terms of the macronutrients (N, P, and K). In addition, organic amendments can perform as good as inorganic fertilizers when the essential crop nutrients (N, P, K) are applied at the same rate. For this study, maize yield was significantly increased with the application of a fertilizer with no significant differences among the fertilizer treatments of DAP, vermicompost, stored manure under shade, stored manure in the open, and cattle manure slurry at the same nitrogen application rate. All the fertilizer application treatments were economically viable much as vermicompost made the most economic sense. Vermicomposting has also been reported to be the most environmentally-friendly technology in terms of reducing gaseous emissions and retaining nutrients within cattle manure. It can, therefore, be concluded that vermicomposting can be adopted as an environmentally safe and economical technology for the production of a fertilizer from organic materials with assurance of increased crop yields. It is worth mentioning that other forms of organic waste management (storage, composting, and anaerobic digestion) can produce products that can replace inorganic fertilizers as long as the right economically optimal quantities are applied.

Supplementary Materials

The following are available online at https://www.mdpi.com/2073-4395/10/1/69/s1, Excel sheet S1: Detailed costs and revenues from different treatment systems.

Author Contributions

Conceptualization, J.L., J.K., A.J.K., and J.J. Methodology, J.J., J.L., K.C., A.J.K., and J.K. Validation, J.L., K.C., A.J.K., and J.K. Formal analysis, J.J. and K.C. Investigation, J.J. Data curation, J.J. Writing—original draft preparation, J.J. Writing—review and editing, A.J.K., J.L., J.K., and K.C. Visualization, J.J. Supervision, A.J.K., J.K., and J.L. Project administration, J.L., J.K., and A.J.K. Funding acquisition, J.L., J.K., and A.J.K. All authors have read and agreed to the published version of the manuscript.

Funding

This research is part of the project “Capacity building on the water-energy-food security Nexus” (CAPNEX), project #158 of the Austrian Partnership Programme in Higher Education and Research for Development (APPEAR), which the Austrian Development Cooperation (ADC) funded. The authors further acknowledge the TU Wien University Library for financial support through its Open Access Funding Programme.

Acknowledgments

We thank Charles Aziz, John Tuwijukye, Emmanuel Nabyama, and Bakka for the technical support rendered during experimentation. Open Access Funding by TU Wien.

Conflicts of Interest

The authors declare no conflict of interest.

References

  1. Bationo, A.; Hartemink, A.; Lungu, O.; Naimi, M.; Okoth, P.; Smaling, E.; Thiombiano, L.; Waswa, B. Knowing the African soils to improve fertilizer recommendations. In Improving Soil Fertility Recommendations in Africa Using the Decision Support System for Agrotechnology Transfer (DSSAT); Al, K.E., Ed.; Springer: Dordrecht, The Netherlands, 2012; pp. 19–42. [Google Scholar] [CrossRef]
  2. Epule, E.T.; Bryant, C.R.; Akkari, C.; Daouda, O. Can organic fertilizers set the pace for a greener arable agricultural revolution in Africa? Analysis, synthesis and way forward. Land Use Policy 2015, 47, 179–187. [Google Scholar] [CrossRef]
  3. McArthur, J.W.; McCord, G.C. Fertilizing growth: Agricultural inputs and their effects in economic development. J. Dev. Econ. 2017, 127, 133–152. [Google Scholar] [CrossRef] [PubMed]
  4. Sekumade, A.B. Economic Effect of Organic and Inorganic Fertilizers on the Yield of Maize in Oyo State, Nigeria. Int. J. Agric. Econ. 2017, 2, 63–68. [Google Scholar] [CrossRef] [Green Version]
  5. FAO. Food and Agriculture Organization of the United Nations. In FAOSTAT Statistical Database; FAO: Rome, Italy, 2017. [Google Scholar]
  6. MAAIF. Fertilizer Consumption and Fertilizer Use by Crop in Uganda. Available online: https://africafertilizer.org/wp-content/uploads/.../FUBC-Uganda-final-report-2015.pdf (accessed on 12 May 2018).
  7. Masso, C.; Baijukya, F.; Ebanyat, P.; Bouaziz, S.; Wendt, J.; Bekunda, M.; Vanlauwe, B. Dilemma of nitrogen management for future food security in sub-Saharan Africa—A review. Soil Res. 2017, 55, 425–434. [Google Scholar] [CrossRef] [Green Version]
  8. Ciceri, D.; Allanore, A. Local fertilizers to achieve food self-sufficiency in Africa. Sci. Total Environ. 2019, 648, 669–680. [Google Scholar] [CrossRef] [PubMed]
  9. Abayomi, A.O.; Adebayo, O.J. Effect of fertilizer types on the growth and yield of Amaranthus caudatus in Ilorin, Southern Guinea, Savanna Zone of Nigeria. Adv. Agric. 2014, 2014, 947062. [Google Scholar] [CrossRef] [Green Version]
  10. Diacono, M.; Montemurro, F. Long-term effects of organic amendments on soil fertility—A review. Agron. Sustain. Dev. 2010, 30, 401–422. [Google Scholar] [CrossRef] [Green Version]
  11. Komakech, A.J.; Sundberg, C.; Jönsson, H.; Vinnerås, B. Life cycle assessment of biodegradable waste treatment systems for sub-Saharan African cities. Resour. Conserv. Recycl. 2015, 99, 100–110. [Google Scholar] [CrossRef]
  12. Savci, S. Investigation of effect of chemical fertilizers on environment. Apcbee Procedia 2012, 1, 287–292. [Google Scholar] [CrossRef] [Green Version]
  13. Komakech, A.J.; Banadda, N.E.; Gebresenbet, G.; Vinnerås, B. Maps of animal urban agriculture in Kampala City. Agron. Sustain. Dev. 2014, 34, 493–500. [Google Scholar] [CrossRef] [Green Version]
  14. Teenstra, E.; Vellinga, T.V.; Aktasaeng, N.; Amatayaku, W.; Ndambi, A.; Pelster, D.; Germer, L.; Jenet, A.; Opio, C.; Andeweg, K. Global Asessment of Manure Management Policies and Practices; Wageningen UR Livestock Research: Wageningen, The Netherlands, 2014. [Google Scholar]
  15. Lim, S.L.; Lee, L.H.; Wu, T.Y. Sustainability of using composting and vermicomposting technologies for organic solid waste biotransformation: Recent overview, greenhouse gases emissions and economic analysis. J. Clean. Prod. 2016, 111, 262–278. [Google Scholar] [CrossRef]
  16. Thomas, C.L.; Acquah, G.E.; Whitmore, A.P.; McGrath, S.P.; Haefele, S.M. The Effect of Different Organic Fertilizers on Yield and Soil and Crop Nutrient Concentrations. Agronomy 2019, 9, 776. [Google Scholar] [CrossRef] [Green Version]
  17. Komakech, A.J.; Zurbrügg, C.; Semakula, D.; Kiggundu, N.; Vinnerås, B. Evaluation of the performance of different organic fertilizers on maize yield: A case study of Kampala, Uganda. J. Agric. Sci. 2015, 7, 28–38. [Google Scholar] [CrossRef] [Green Version]
  18. Komakech, A.; Zurbrügg, C.; Miito, G.; Wanyama, J.; Vinnerås, B. Environmental impact from vermicomposting of organic waste in Kampala, Uganda. J. Environ. Manag. 2016, 181, 395–402. [Google Scholar] [CrossRef] [PubMed]
  19. Kaizzi, K.C.; Nansamba, A.; Kabuye, M.F. Optimizing Fertilizer Use within the context of Integrated Soil Fertility in Uganda. In Fertilizer Use Optimization in Sub-Saharan Africa; Wortmann, C.S., Sones, K., Eds.; CABI: Nairobi, Kenya, 2017; pp. 193–209. [Google Scholar]
  20. Karungi, J.; Kyamanywa, S.; Ekbom, B. Comparison of the effect of market crop wastes and chemical soil fertility amendments on insect pests, natural enemies and yield of Brassica oleracea. Ann. Appl. Biol. 2006, 149, 103–109. [Google Scholar] [CrossRef]
  21. Okalebo, J.; Gathua, K.; Woomer, P. Laboratory methods of plant and soil analysis: A working manual. TSBF-UNESCO Nairobi Kenya 2002, 2, 29–68. [Google Scholar]
  22. Aziiba, E.A.; Qiang, C.; Coulter, J.A. Mechanisms of Nitrogen Use in Maize. Agronomy 2019, 9, 775. [Google Scholar] [CrossRef] [Green Version]
  23. Kaizzi, K.C.; Byalebeka, J.; Semalulu, O.; Alou, I.; Zimwanguyizza, W.; Nansamba, A.; Musinguzi, P.; Ebanyat, P.; Hyuha, T.; Wortmann, C.S. Maize response to fertilizer and nitrogen use efficiency in Uganda. Agron. J. 2012, 104, 73–82. [Google Scholar] [CrossRef]
  24. Jjagwe, J.; Komakech, A.J.; Karungi, J.; Amann, A.; Wanyama, J.; Lederer, J. Assessment of a Cattle Manure Vermicomposting System Using Material Flow Analysis: A Case Study from Uganda. Sustainability 2019, 11, 5173. [Google Scholar] [CrossRef] [Green Version]
  25. Katuromunda, S.; Sabiiti, E.; Bekunda, A.M. Effect of method of storing cattle faeces on the physical and chemical characteristics of the resultant composted cattle manure. Uganda J. Agric. Sci. 2012, 13, 95–106. [Google Scholar]
  26. Yadav, A.; Gupta, R.; Garg, V.K. Organic manure production from cow dung and biogas plant slurry by vermicomposting under field conditions. Int. J. Recycl. Org. Waste Agric. 2013, 2, 1–7. [Google Scholar] [CrossRef] [Green Version]
  27. Sluiter, A.; Hames, B.; Hyman, D.; Payne, C.; Ruiz, R.; Scarlata, C.; Sluiter, J.; Templeton, D.; Wolfe, J. Determination of total solids in biomass and total dissolved solids in liquid process samples. Natl. Renew. Energy Lab. 2008, 1617, 1–6. [Google Scholar]
  28. De Groote, H.; Gunaratna, N.S.; Ergano, K.; Friesen, D. Extension and adoption of biofortified crops: Quality protein maize in East Africa. In Proceedings of the African Agricultural Economics Association Meetings, AAAE Third Conference/AEASA 48th Conference, Cape Town, South Africa, 19–23 September 2010. [Google Scholar]
  29. Pasqual, J.; Padilla, E.; Jadotte, E. Equivalence of different profitability criteria with the net present value. Int. J. Prod. Econ. 2013, 142, 205–210. [Google Scholar] [CrossRef]
  30. Schwab, B.; Lusztig, P. A comparative analysis of the Net Present Value and the benefit-cost ratio as measures of the economic desirability of investments. J. Financ. 1969, 24, 507–516. [Google Scholar] [CrossRef]
  31. Žižlavský, O. Net present value approach: Method for economic assessment of innovation projects. Procedia-Social Behav. Sci. 2014, 156, 506–512. [Google Scholar] [CrossRef]
  32. Keča, L.; Keča, N.; Pantić, D. Net Present Value and Internal Rate of Return as indicators for assessment of cost-efficiency of poplar plantations: A Serbian case study. Int. For. Rev. 2012, 14, 145–156. [Google Scholar] [CrossRef]
  33. Arshad, A. Net present value is better than internal rate of return. Interdiscip. J. Contemp. Res. Bus. 2012, 4, 211–219. [Google Scholar]
  34. De Reyck, B.; Degraeve, Z.; Vandenborre, R. Project options valuation with net present value and decision tree analysis. Eur. J. Oper. Res. 2008, 184, 341–355. [Google Scholar] [CrossRef]
  35. Jenkins, G.P.; Miklyaev, M.; Afra, S.; Kuo, C.Y. National Parameters and Commodity Specific Conversion Factors for Project Evaluation in Uganda. JDI Exec. Programs 2018. Available online: https://cri-world.com/publications/qed_dp_403.pdf (accessed on 12 May 2018).
  36. Kariko-Buhwezi, B.; Mwesigye, A.; Arinaitwe, J.; Colonna, G. Challenges to the sustainability of small scale biogas technologies in Uganda. In Proceedings of the Second International Conference on Advances in Engineering and Technology, Entebbe, Uganda, 31 January–2 February 2011; pp. 499–504. [Google Scholar]
  37. Jiang, Y.; Zhao, G.; Li, S. An economic analysis methodology for project evaluation and programming. Jt. Transp. Res. Program 2013, 1–44. [Google Scholar] [CrossRef] [Green Version]
  38. Peng, Y.; Yu, P.; Li, X.; Li, C. Determination of the critical soil mineral nitrogen concentration for maximizing maize grain yield. Plant Soil 2013, 372, 41–51. [Google Scholar] [CrossRef]
  39. Ndegwa, P.; Thompson, S. Integrating composting and vermicomposting in the treatment and bioconversion of biosolids. Bioresour. Technol. 2001, 76, 107–112. [Google Scholar] [CrossRef]
  40. Elvira, C.; Sampedro, L.; Benitez, E.; Nogales, R. Vermicomposting of sludges from paper mill and dairy industries with Eisenia andrei: A pilot-scale study. Bioresour. Technol. 1998, 63, 205–211. [Google Scholar] [CrossRef]
  41. Bhat, S.A.; Singh, J.; Vig, A.P. Potential utilization of bagasse as feed material for earthworm Eisenia fetida and production of vermicompost. Springerplus 2015, 4, 11. [Google Scholar] [CrossRef] [PubMed] [Green Version]
  42. Tatàno, F.; Pagliaro, G.; Di Giovanni, P.; Floriani, E.; Mangani, F. Biowaste home composting: Experimental process monitoring and quality control. Waste Manag. 2015, 38, 72–85. [Google Scholar] [CrossRef]
  43. Sonowal, P.; Khwairakpam, M.; Kalamdhad, A.S. Vermicomposting of solid pulp and paper mill sludge (SPPMS) using Eudrilus Eugeniae Earthworm. Int. J. Environ. Sci. 2014, 5, 502–514. [Google Scholar] [CrossRef]
  44. Wani, K.; Rao, R. Bioconversion of garden waste, kitchen waste and cow dung into value-added products using earthworm Eisenia fetida. Saudi J. Boil. Sci. 2013, 20, 149–154. [Google Scholar] [CrossRef] [Green Version]
  45. Soobhany, N.; Mohee, R.; Garg, V.K. Recovery of nutrient from Municipal Solid Waste by composting and vermicomposting using earthworm Eudrilus eugeniae. J. Environ. Chem. Eng. 2015, 3, 2931–2942. [Google Scholar] [CrossRef]
  46. Tumuhairwe, J.B.; Tenywa, J.S.; Otabbong, E.; Ledin, S. Comparison of four low-technology composting methods for market crop wastes. Waste Manag. 2009, 29, 2274–2281. [Google Scholar] [CrossRef]
  47. Garg, P.; Gupta, A.; Satya, S. Vermicomposting of different types of waste using Eisenia foetida: A comparative study. Bioresour. Technol. 2006, 97, 391–395. [Google Scholar] [CrossRef]
  48. Shah, G.M.; Groot, J.; Oenema, O.; Lantinga, E. Covered storage reduces losses and improves crop utilisation of nitrogen from solid cattle manure. Nutr. Cycl. Agroecosystems 2012, 94, 299–312. [Google Scholar] [CrossRef]
  49. Pattey, E.; Trzcinski, M.; Desjardins, R. Quantifying the reduction of greenhouse gas emissions as a resultof composting dairy and beef cattle manure. Nutr. Cycl. Agroecosystems 2005, 72, 173–187. [Google Scholar] [CrossRef]
  50. Shisanya, C.A.; Mucheru, M.W.; Mugendi, D.N.; Kung’u, J.B. Effect of organic and inorganic nutrient sources on soil mineral nitrogen and maize yields in central highlands of Kenya. Soil Tillage Res. 2009, 103, 239–246. [Google Scholar] [CrossRef]
  51. Okoroafor, I.; Okelola, E.; Edeh, O.; Nemehute, V.; Onu, C.; Nwaneri, T.; Chinaka, G. Effect of organic manure on the growth and yield performance of Maize in Ishiagu, Ebonyi State, Nigeria. IOSR J. Agric. Vet. Sci. (IOSR-JAVS) 2013, 5, 28–31. [Google Scholar] [CrossRef]
  52. Glaser, B.; Wiedner, K.; Seelig, S.; Schmidt, H.P.; Gerber, H. Biochar organic fertilizers from natural resources as substitute for mineral fertilizers. Agron. Sustain. Dev. 2015, 35, 667–678. [Google Scholar] [CrossRef] [Green Version]
  53. Bayite-kasule, S. Inorganic Fertilizer in Uganda—Knowledge Gaps, Profitability, Subsidy, and Implications of a National Policy. Available online: http://citeseerx.ist.psu.edu/viewdoc/download?doi=10.1.1.225.7493&rep=rep1&type=pdf (accessed on 23 April 2018).
  54. Doan, T.T.; Henry-des-Tureaux, T.; Rumpel, C.; Janeau, J.L.; Jouquet, P. Impact of compost, vermicompost and biochar on soil fertility, maize yield and soil erosion in Northern Vietnam: A three year mesocosm experiment. Sci. Total Environ. 2015, 514, 147–154. [Google Scholar] [CrossRef] [PubMed]
  55. Celestina, C.; Hunt, J.R.; Sale, P.W.; Franks, A.E. Attribution of crop yield responses to application of organic amendments: A critical review. Soil Tillage Res. 2019, 186, 135–145. [Google Scholar] [CrossRef]
  56. Chen, G.; Cao, H.; Liang, J.; Ma, W.; Guo, L.; Zhang, S.; Jiang, R.; Zhang, H.; Goulding, K.; Zhang, F. Factors affecting nitrogen use efficiency and grain yield of summer maize on smallholder farms in the North China Plain. Sustainability 2018, 10, 363. [Google Scholar] [CrossRef] [Green Version]
  57. Hijbeek, R.; van Ittersum, M.K.; ten Berge, H.F.; Gort, G.; Spiegel, H.; Whitmore, A.P. Do organic inputs matter–a meta-analysis of additional yield effects for arable crops in Europe. Plant Soil 2017, 411, 293–303. [Google Scholar] [CrossRef] [Green Version]
  58. Mahmood, F.; Khan, I.; Ashraf, U.; Shahzad, T.; Hussain, S.; Shahid, M.; Abid, M.; Ullah, S. Effects of organic and inorganic manures on maize and their residual impact on soil physico-chemical properties. J. Soil Sci. Plant Nutr. 2017, 17, 22–32. [Google Scholar] [CrossRef] [Green Version]
  59. Mukta, S.; Rahman, M.; Mortuza, M. Yield and Nutrient Content of Tomato as influenced by the Application of Vermicompost and Chemical Fertilizers. J. Environ. Sci. Nat. Res. 2015, 8, 115–122. [Google Scholar] [CrossRef] [Green Version]
  60. Atiyeh, R.; Subler, S.; Edwards, C.; Bachman, G.; Metzger, J.; Shuster, W. Effects of vermicomposts and composts on plant growth in horticultural container media and soil. Pedobiologia 2000, 44, 579–590. [Google Scholar] [CrossRef] [Green Version]
  61. Mohanty, M.; Reddy, K.S.; Probert, M.; Dalal, R.C.; Rao, A.S.; Menzies, N. Modelling N mineralization from green manure and farmyard manure from a laboratory incubation study. Ecol. Model. 2011, 222, 719–726. [Google Scholar] [CrossRef]
  62. Masunga, R.H.; Uzokwe, V.N.; Mlay, P.D.; Odeh, I.; Singh, A.; Buchan, D.; De Neve, S. Nitrogen mineralization dynamics of different valuable organic amendments commonly used in agriculture. Appl. Soil Ecol. 2016, 101, 185–193. [Google Scholar] [CrossRef]
  63. Guo, L.; Wu, G.; Li, C.; Liu, W.; Yu, X.; Cheng, D.; Jiang, G. Vermicomposting with maize increases agricultural benefits by 304%. Agron. Sustain. Dev. 2015, 35, 1149–1155. [Google Scholar] [CrossRef] [Green Version]
  64. Choudhary, V.; Suresh, K. Maize production, economics and soil productivity under different organic source of nutrients in eastern himalayan region, India. Int. J. Plant Prod. 2013, 7, 167–186. [Google Scholar]
Figure 1. Different manure management technologies (a) cattle manure under shade, (b) cattle manure in the open, (c) cattle manure slurry under the shade, and (d) vermicomposting reactors.
Agronomy 10 00069 g001
Figure 2. (a) Cob yield and (b) grain yield for different treatments for the two seasons. Different letters for the bar values across a season indicate significant differences (p < 0.05), T: manure stored under the shade, M: manure stored in the open, S: slurry digestate, V: vermicompost, D: DAP, and C: no fertilizer.
Agronomy 10 00069 g002aAgronomy 10 00069 g002b
Table 1. Physio-chemical composition of cattle manure and derived products.
ParameterManure Specification
FCMTMSV
MC (%)78.48 ± 1.2338.24 ± 0.9248.60 ± 1.3474.32 ± 0.8269.74 ± 0.37
pH8.05 ± 0.147.91 ± 0.127.86 ± 0.067.82 ± 0.246.43 ± 0.11
TKN (%ww)0.31 ± 0.041.02 ± 0.070.71 ± 0.060.48 ± 0.020.64 ± 0.06
TP (%ww)0.11 ± 0.050.26 ± 0.020.15 ± 0.010.16 ± 0.030.33 ± 0.03
TK (%ww)0.24 ± 0.080.43 ± 0.070.44 ± 0.030.19 ± 0.020.50 ± 0.06
TOC (%ww)7.46 ± 0.2111.23 ± 0.3110.11 ± 0.094.73 ± 0.066.13 ± 0.65
C/N ratio24.06 ± 0.3611.01 ±0.0514.24 ± 0.429.85 ± 1.029.58 ± 0.53
Note: FCM—fresh cattle manure, T—stored cattle manure under shade, M—stored cattle manure in the open, S—cattle manure slurry digestate, V—cattle manure vermicompost, MC—moisture content, TKN—total Kjeldahl nitrogen, TP—total phosphorous, TK—total potassium, TOC—total organic carbon, C/N ratio – carbon to nitrogen ratio, and ww—wet weight basis.
Table 2. Variation of maize plant height in different treatments over two seasons.
TreatmentMaize Height (cm)
Season 1 (2018 A)
2WAP4WAP6WAP8WAP
T21.2 ± 5.1b42.9 ± 3.7b63.1 ± 4.6b108.1 ± 24.5ab
M25.1 ± 4.5bc44.2 ± 3.6b64.8 ± 4.4b107.0 ± 19.3ab
S24.9 ± 4.5bc44.2 ± 6.2b66.9 ± 6.2b108.3 ± 24.5ab
V25.3 ± 4.0bc48.2 ± 3.9b69.9 ± 7.5b112.9 ± 19.7ab
D26.8 ± 5.4c58.9 ± 11.6c81.0 ± 8.7c123.5 ± 34.3b
C15.6 ± 4.4a33.0 ± 7.1a54.0 ± 8.5a86.8 ± 8.4a
Grand Mean23.145.366.6110.8
s.e.d1.652.342.429.34
Season 2 (2018 B)
T22.2 ± 4.3ab39.7 ± 3.9bc53.0 ± 8.4ab77.5 ± 8.4a
M22.9 ± 3.2ab38.1 ± 3.4b56.7 ± 8.2bc81.7 ± 9.6a
S22.5 ± 4.3ab38.7 ± 3.5bc53.0 ± 8.3ab82.1 ± 14.6a
V25.6 ± 3.5b40.0 ± 3.7bc58.0 ± 8.1bc81.8 ± 10.2a
D25.8 ± 3.7b42.8 ± 5.0c61.2 ± 5.7c99.5 ± 10.6b
C19.3 ± 4.8a31.3 ± 5.2a46.0 ± 7.1a73.3 ± 6.0a
Grand mean23.138.454.682.2
s.e.d.1.421.472.723.66
Note: Means with different letters within a column indicate significant values (p < 0.05). T: manure stored under the shade. M: manure stored in the open. S: slurry digestate. V: vermicompost. D: DAP. C: no fertilizer. WAP: weeks after planting.
Table 3. Variation of the number of leaves in different treatments over two seasons.
TreatmentNumber of Leaves
Season 1 (2018 A)
2WAP4WAP6WAP8WAP
T4.13 ± 0.965.56 ± 0.818.25 ± 0.6811.88 ± 1.50
P3.94 ± 0.776.06 ± 0.688.38 ± 0.6211.56 ± 1.63
S4.00 ± 0.895.75 ± 0.868.19 ± 0.6611.12 ± 1.71
V4.13 ± 0.965.81 ± 0.918.50 ± 0.6311.56 ± 0.81
D4.00 ± 0.895.56 ± 0.968.50 ± 0.6311.13 ± 1.63
C3.94 ± 0.854.81 ± 1.058.31 ± 0.7910.75 ± 1.44
Grand Mean4.215.598.3511.33
s.e.d.0.32 ns0.32 ns0.24 ns0.49 ns
Season 2 (2018 B)
T4.00 ± 0.895.25 ± 0.687.25 ± 0.869.50 ± 1.03
P3.94 ± 0.855.06 ± 0.777.34 ± 0.629.00 ± 0.89
S3.99 ± 0.805.06 ± 0.777.25 ± 0.869.38 ± 1.41
V4.13 ± 0.895.55 ± 0.897.25 ± 0.689.56 ± 0.73
D4.13 ± 1.035.56 ± 0.817.18 ± 0.669.63 ± 0.89
C3.88 ± 0.895.19 ± 0.657.19 ± 0.839.25 ± 0.93
Grand Mean4.005.277.259.39
s.e.d.0.32 ns0.27 ns0.26 ns0.33 ns
Note: s.e.d.—standard error of difference in means. ns—not significant.
Table 4. Costs and economic indicators of different fertilizer treatments on maize.
TreatmentCosts (USD)
Initial InvestmentAnnual CostsAnnual BenefitsAnnual Net Cash Flow
T2510081637629
M11410081563556
S190510171875858
V150121135162305
D1869891854865
C09891162174
PW of Benefits (USD)
5%10%13.9%24%
T7839535541902585
M6929473437042285
S10,693730557163527
V28,72519,62415,3559474
D10,780736457623555
C216814811159715
B/C Ratio
T314214168103
M61423220
S6432
V19213110263
D58403119
C----
NPV (USD)
T7817533241672562
M6810461635872170
S8792540338131623
V28,57219,47215,2039323
D10,597718055783371
C216314771156713

