1. Introduction
The production and consumption of olive oil has increased and extended from the Mediterranean area to other regions of the world. The growing interest in this product, especially in extra virgin olive oil (EVOO), is based on its beneficial properties for health and on its sensory attributes, since it is rich in monounsaturated fatty acids and antioxidant compounds such as polyphenols and tocopherols.
In this context, EVOO marketing is more demanding in terms of quality assurance. The olive oil sector is subject to compliance with regulations that affect its commercialization [
1,
2,
3]. Regulations establish the categorization of the olive oil according to numerous physico-chemical characteristics that are analyzed in accredited laboratories, as well as to organoleptic evaluation by accredited tasting panels. These analyses are usually laborious, slow and expensive.
Regulation (EEC) No 2568/91 (amended by Regulation (EU) No 1348/2013) establishes a decision tree for verifying whether an olive oil sample is consistent with the category declared. The decision tree requires the hierarchical determination of quality parameters such as acidity, peroxide value, extinction coefficients at 270 nm and 232 nm (K
270, K
232), and ΔK. The respective limit values for EVOO are shown in
Table 1. Such determinations include titration and spectrophotometric analysis in the ultraviolet range, which involves the use of solvents and reagents.
Fluorescence spectroscopy has been successfully used for analysis of EVOO quality [
4,
5], and is less time-consuming and more cost-efficient compared to other analytical procedures. The high sensitivity of fluorescence spectroscopy allows detection of the presence of the fluorescent compounds.
The fluorescent compounds contained in olive oil are directly associated with its beneficial effects on health, as well as oxidation resistance and freshness level. Such compounds are polyphenols and tocopherols, primary and secondary oxidation products, chlorophylls and pheophytins [
6]. Moreover, these compounds are related to the main quality criteria established in regulations. Consequently, procedures for estimating physico-chemical characteristics could be developed based on fluorescence spectroscopic data, as proposed in this work.
Primary oxidation products are related to the regulated parameters peroxide index and K232. These products are not detectable by panels. Early detection of oxidation processes is of paramount importance since it identifies the samples with potential secondary oxidation problems.
Secondary oxidation products (including a variety of low molecular weight aldehydes, ketones, alcohols and short hydrocarbon chains) are related to the regulated parameter K270.
Chlorophyll and its derivatives, not included in the regulations, act as antioxidants under darkness conditions, and as pro-oxidant under light conditions. These compounds are markers of photo-oxidation processes. In addition, oxidation products and chlorophylls are useful for freshness evaluation and fraud detection [
5].
The major interest in polyphenols and tocopherols arises from their antioxidant activity.
Previous studies on fluorescence spectra of olive oil [
5,
6,
7,
8,
9,
10,
11,
12] revealed the characteristic spectral patterns of different oil qualities according to the presence of peaks at certain wavelengths and to their signal intensity. Such patterns allowed the development of multivariate models for discrimination between categories [
9,
10,
11].
Additionally, spectral patterns can be useful for the evaluation of olive oil quality by estimating the physico-chemical characteristics related to fluorescence compounds, which are excited by specific wavelength ranges. Therefore, selection of the optimal wavelengths of excitation is of paramount importance.
During the last decade great effort has been made to develop environmentally friendly methodologies for assessing the authentication of EVOO [
5]. Most of the works that applied fluorescence spectroscopy focused on the assessment of adulterated EVOO (detection and quantification of adulteration). Controlled addition of adulterants consisting of the mix of EVOO with cheaper oils (refined olive oils, pomace olive oils, seed oils, etc.) was studied.
EVOO samples were mixed with increasing quantities of sunflower oil and the excitation wavelength was 350 nm. The emission spectra were acquired from 350–700 nm [
12]. Such spectra presented similar patterns as those showed by previous works [
10,
11]. Chlorophyll produced a dominant peak at 670 nm that decreased with the adulteration level. A broad region of fluorescence with local peaks from 400–600 nm was attributed to oxidation products, tocopherol and carotenoids. High accuracy of the models was obtained when fluorescence spectra were submitted to PCA and PLSR for detection of different concentrations of added sunflower oil.
A methodology based on a neural network (supervised multilayer perceptrons) was developed for the detection of adulteration of EVOO with increasing quantities of expired EVOO, and for the identification of storage conditions (light exposition, type of bottle) [
13]. Results showed high classification accuracy (up to 90%) when the source of excitation light was UV LED or laser diode. The main differences of spectral patterns were derived from the chlorophyll dominant peak, and weak response was found within the range from 400–600 nm.
Synchronous fluorescence measurements were carried out with diluted samples in hexane and different classification methods were developed for discriminating EVOO, expired EVOO, refined, and expired refined olive oil [
14]. Similar trends in the spectra to those in [
13] were found. A band observed in the range of 270–300 nm was ascribed to the emission of tocopherols and tocotrienols. The characteristic peak of the chlorophylls and pheophytins was also obtained from 660–700 nm. The study has shown that non-expired extra virgin, non-expired refined, expired extra virgin, and expired refined olive oil samples exhibit significant differences in their synchronous fluorescence spectral patterns. The tocopherol and chlorophyll band intensity decreases, and simultaneously, a new emission band appears in the 320–380 nm wavelength range.
Mixes of EVOO with lower quality olive oils were evaluated by [
15]. The fluorescence emission signal of vitamin E (tocopherol) appeared within the range from 310–380 nm, with excitation at 290 nm; and the signal from chlorophylls with excitation at 405 nm. Spectral patterns from mixtures were different from EVOO as composition was significantly altered.
Although the results of these recent works highlighted that fluorescence could be used for quantifying specific constituents, few researches have been conducted to estimate quantitatively oil compounds or physico-chemical characteristics. Successful results were found for some physico-chemical characteristics of a set of samples with a wide range of degradation produced by heat treatments [
8].
However, characterization of olive oils that present subtle degradation or early identification of first oxidation stages is still a challenge that the present work aimed to accomplish. The main objective was to evaluate the feasibility of developing multivariate models to estimate compounds and physico-chemical characteristics of extra virgin olive oils showing very little degradation. The selection of the most useful excitation wavelength was a major issue for achieving such purpose.
The new procedure would improve the strategic management plans of EVOO producers as it would immediately provide them with valuable information on the quality of the oil they are producing, which would show a minimum degradation. Other links of the commercial olive oil chain could benefit from such technique.
2. Materials and Methods
2.1. Initial Samples
Eight samples of EVOO were provided by Finca La Pontezuela S.L. oil mill (Designation of Origin Montes de Toledo, Toledo, Spain). Five samples corresponded to the emblematic variety of the Designation of Origen Cornicabra, growing under different agronomical conditions (orchard hedgerows orientation, irrigation, fertilization, etc.). In addition, one sample of each variety: Picual, Hojiblanca and Redondilla was provided (
Table 2).
2.2. Initial Samples Treatments
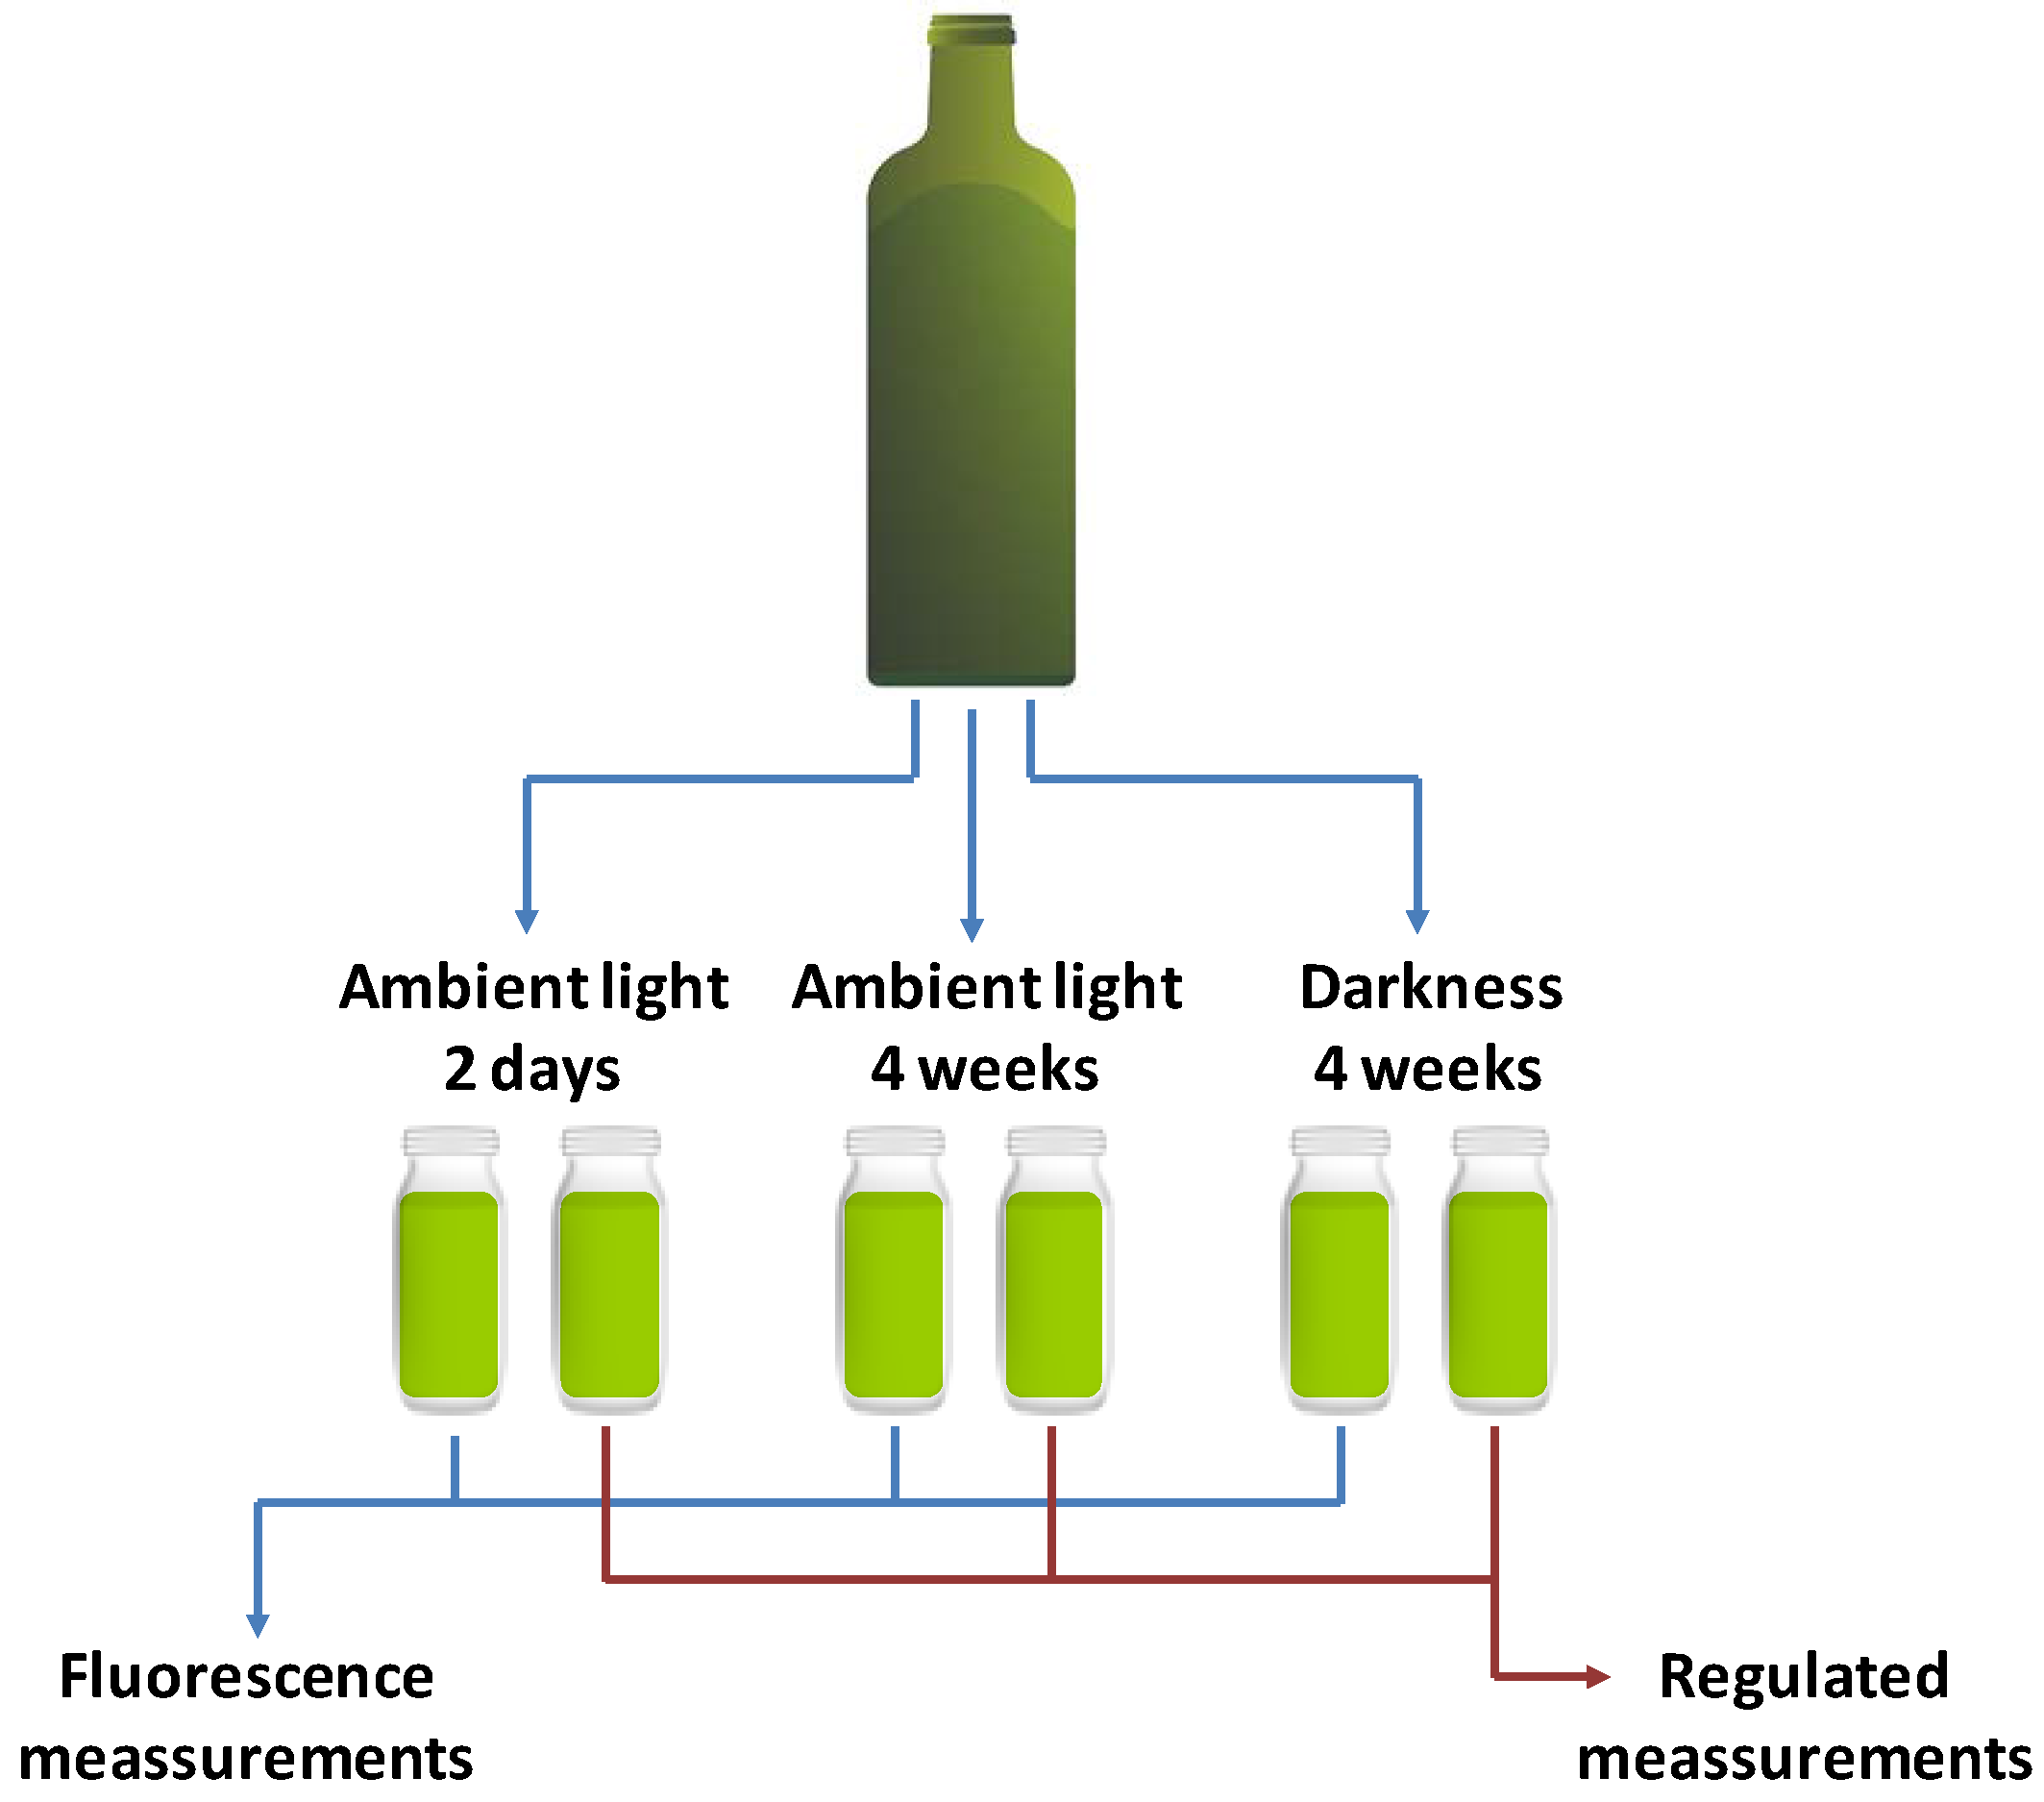
Six aliquots were obtained from each initial sample, and contained in clear glass bottles, 100 mL volume. As illustrated in
Figure 1, paired aliquots were exposed to natural illumination for three different periods in order to generate a final set with high variability in their oxidation state. Bottles were placed on a table at 1 m from a window. The samples received natural indirect sunlight along the period of exposition.
Two out of six aliquots from each initial sample were exposed to natural illumination for two days, two were exposed for four weeks, and two aliquots were maintained under darkness conditions. One bottle of each pair was used for fluorescence measurements. The other bottle was sent to an officially accredited laboratory to obtain physico-chemical characteristics included in Regulation (EEC) No 2568/9 and content of antioxidant compounds (
Figure 1). The experimental design provided a total of 24 paired final samples (8 initial samples × 3 illumination treatments = 24 samples) characterized by fluorescence spectroscopic data and analytical data.
2.3. Selection of the Excitation Wavelengths with 3D Fluorescence Spectroscopy
Three-dimensional front-face fluorescence spectra were obtained from a set of seven EVOO samples including Arbequina, Picual, Hojiblanca and Cornicabra varieties. A spectrofluorometer (LS45, Perkin-Elmer, Wellesley, MA, USA) equipped with a Xenon lamp source, excitation and emission monochromators and a front-face sample-cell holder was used. The excitation wavelengths ranged from 230–646 nm (at 4 nm increments) and the emission wavelengths ranged from 250–698.5 nm (spectral resolution 0.5 nm). Slit widths of excitation and emission monochromators were set at 10 nm. Quartz cuvettes (10 mm × 10 mm × 45 mm) were filled with the oil samples without prior preparation.
For each excitation wavelength the sum of the signal intensities along the emission wavelengths from 250–698.5 nm was computed. Such excitation spectra revealed the wavelengths, appearing as local maxima, that gave rise to emission signal from fluorescent oil compounds and, therefore, potentially provided relevant information on the oil quality.
These local maxima were considered for the selection of the most suitable excitation wavelengths to study the feasibility of developing estimation models for oil quality parameters.
2.4. Fluorescence Spectroscopy
The fluorescence spectra were obtained using the QE Pro spectrometer (Ocean Optics, Inc., Dunedin, FL, USA) with a CCD image sensor and detection wavelengths ranging from 197 nm to 998,763 nm. The intensity of the light emitted by the fluorescent compounds in olive oil is weak. Thus, a slit of 200 μm size was used in order to receive as much light as possible without compromising resolution. Integration time was set to 10,000 ms and 3 repetitions per measurement were averaged.
Measurements were carried out in a right-angle setup using quartz cuvettes (10 mm × 10 mm × 45 mm) filled with the oil samples without prior preparation.
The high-power Xenon light source HPX-2000 (Ocean Optics, Inc., Dunedin, FL, USA), with a compartment to accommodate optical filters, was used to excite the samples. Three different bandpass filters (OptoSigma
®, Santa Ana, CA, USA) centred at 326 nm, 350 nm and 365 nm (10 nm bandwidth) were selected for the acquisition of fluorescence spectra (
Table 3). The maximum transmittance was about 30% for the three filters. In the end, 72 spectra were acquired (24 oil samples × 3 filters = 72 spectra).
Fluorescence spectra were denoised by applying the Savitsky–Golay smoothing algorithm with a window of 5 data, adjusted to a polynomial of degree 2, without application of differentiation. Further analysis was performed on the spectral region corresponding to the emission of the oxidation products and the tocopherols according to [
7,
8]. For excitation around 326 nm (BW 10 nm), the emission wavelength range varied from 340 nm to 550 nm. For excitation around 350 nm (BW 10 nm) the emission range varied from 365 nm to 550 nm. For excitation around 365 nm (BW 10 nm) the emission range varied from 380 nm to 550 nm.
2.5. Physico-Chemical Determinations
An officially accredited laboratory carried out the determination of the oil characteristics summarized in
Table 4, which included physic-chemical characteristics established in Regulation (EU) No 1348/2013 and the content of antioxidant compounds such as tocopherols.
Basic statistical parameters such as minimum, maximum, mean and range were computed for the results of these determinations. Radial plots were used to visualize the dispersion of the data after the exposure of the samples to light treatments of different lengths.
2.6. Estimation Models
Partial Least Square Regression (PLSR) was developed in order to generate estimation models for the oil characteristics determined by the accredited laboratory. Leave-one out cross validation was applied. The selection of the number of latent variables was carried out according to the number at which the values of standard error of calibration (SEC) and the standard error of cross-validation (SECV) diverge. The performance of the regression models was evaluated using the coefficient of determination (R2).
3. Results and Discussion
3.1. Selected Excitation Wavelength
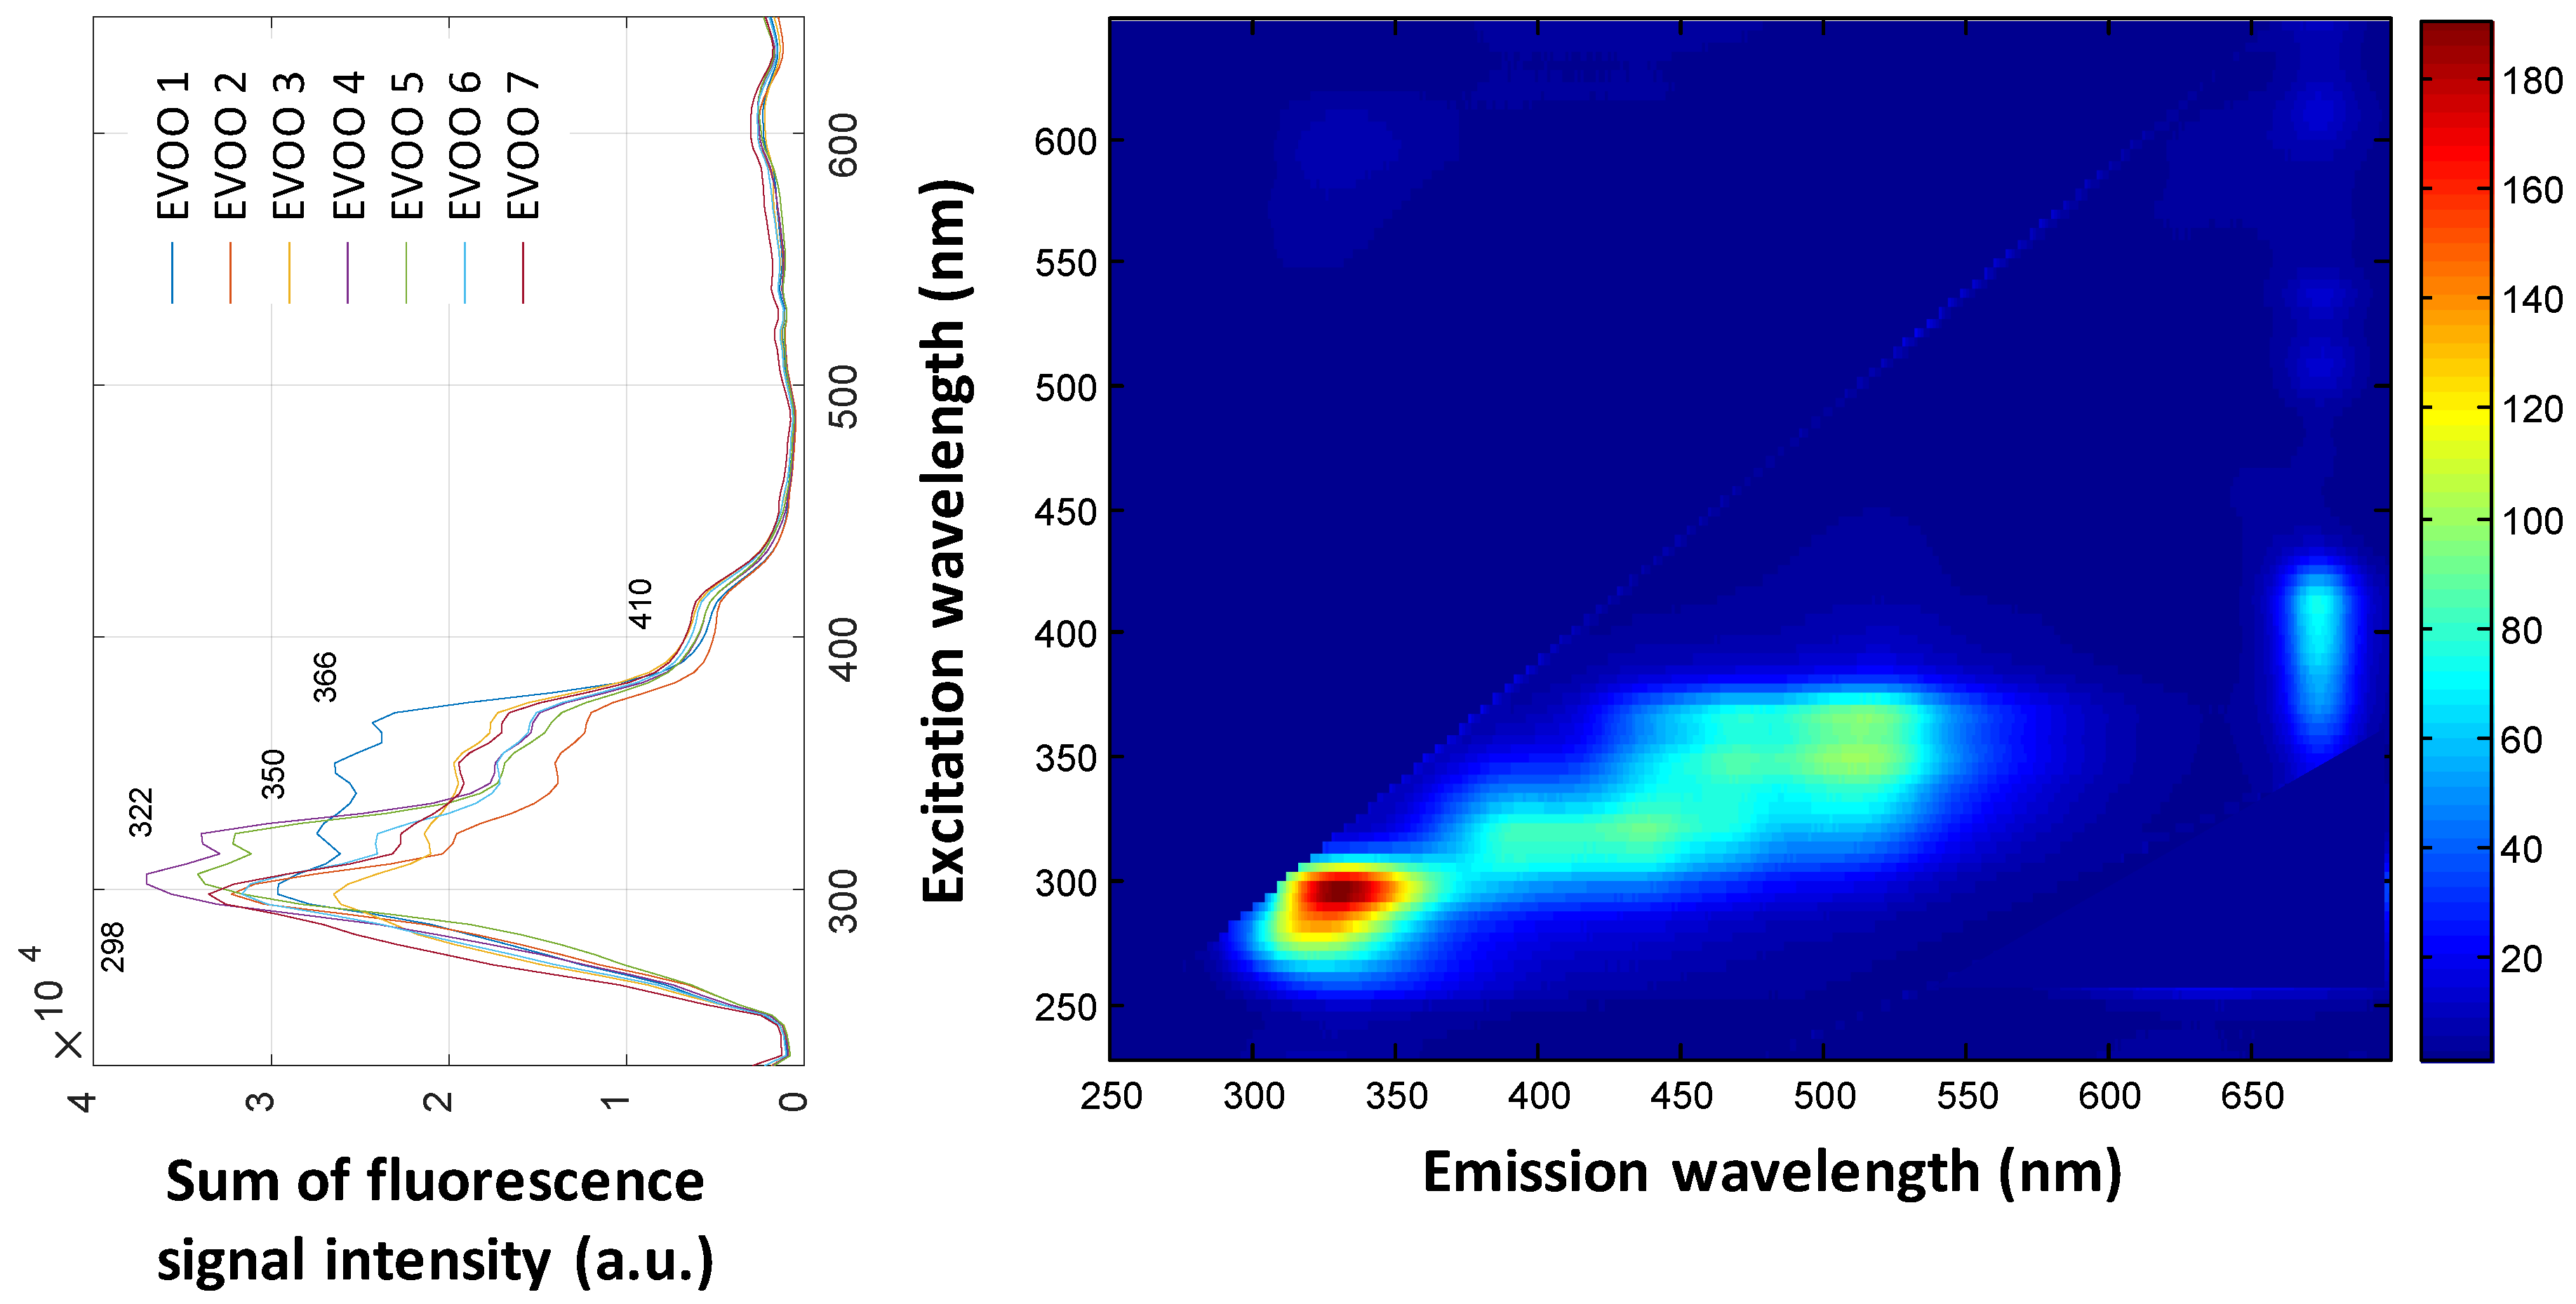
The excitation spectra computed on the three-dimensional front-face fluorescence spectra for the seven EVOO samples considered is shown in
Figure 2. The excitation spectra showed consistent patterns. The position of the local maxima of the spectra was the same independently of the variety and composition of the oil. The variability found in the intensity of these peaks revealed their ability to sense the differences in the content of the compounds giving rise to the signals. Consequently, filters centered on these wavelengths could be useful for estimation of quality parameters related to such compounds.
The spectral band that excited any of the fluorophores contained in olive oil ranged from approximately 250 nm to 450 nm. Local maxima were found at 298, 322, 350, 366 and 410 nm. These findings are in accordance with the literature [
16,
17,
18,
19,
20]. The band ranging from 270–310 nm excites antioxidant compounds such as tocopherol and polyphenols, which emit light from 300–350 nm. The band ranging from 325–425 nm excites chlorophylls and pheophytins, whose emission band is around 680 nm [
18,
19,
20,
21]. A third band of excitation from 274–400 nm corresponds to oxidation products and tocopherols, with a broad emission band from 375–550 nm [
7,
8,
18].
Finally, in view of the literature and present results three bandpass filters centered at 326, 350 and 365 nm, with a bandwidth (BW) of 10 nm, were selected for further analysis. The objective was to develop estimation models for oil quality parameters established in the decision tree illustrated in
Table 1.
3.2. Analysis of the Parameters Obtained in the Laboratory
Table 5 shows basic statistical features computed from the characteristics determined by the accredited laboratory. Despite the exposure to ambient light for four weeks, the values of acidity, K
270 and K
232 remained within the limits established for EVOO quality (
Table 1). As for the peroxide index, only one sample exceeded the limiting value of 20 meq O
2/kg. This response is attributed to the high levels of antioxidant products, i.e., tocopherols and polyphenols (
Table 5), which limited the degradation of the olive oils. In view of the data in
Table 5, α-tocopherol is the predominant form among the total tocopherols.
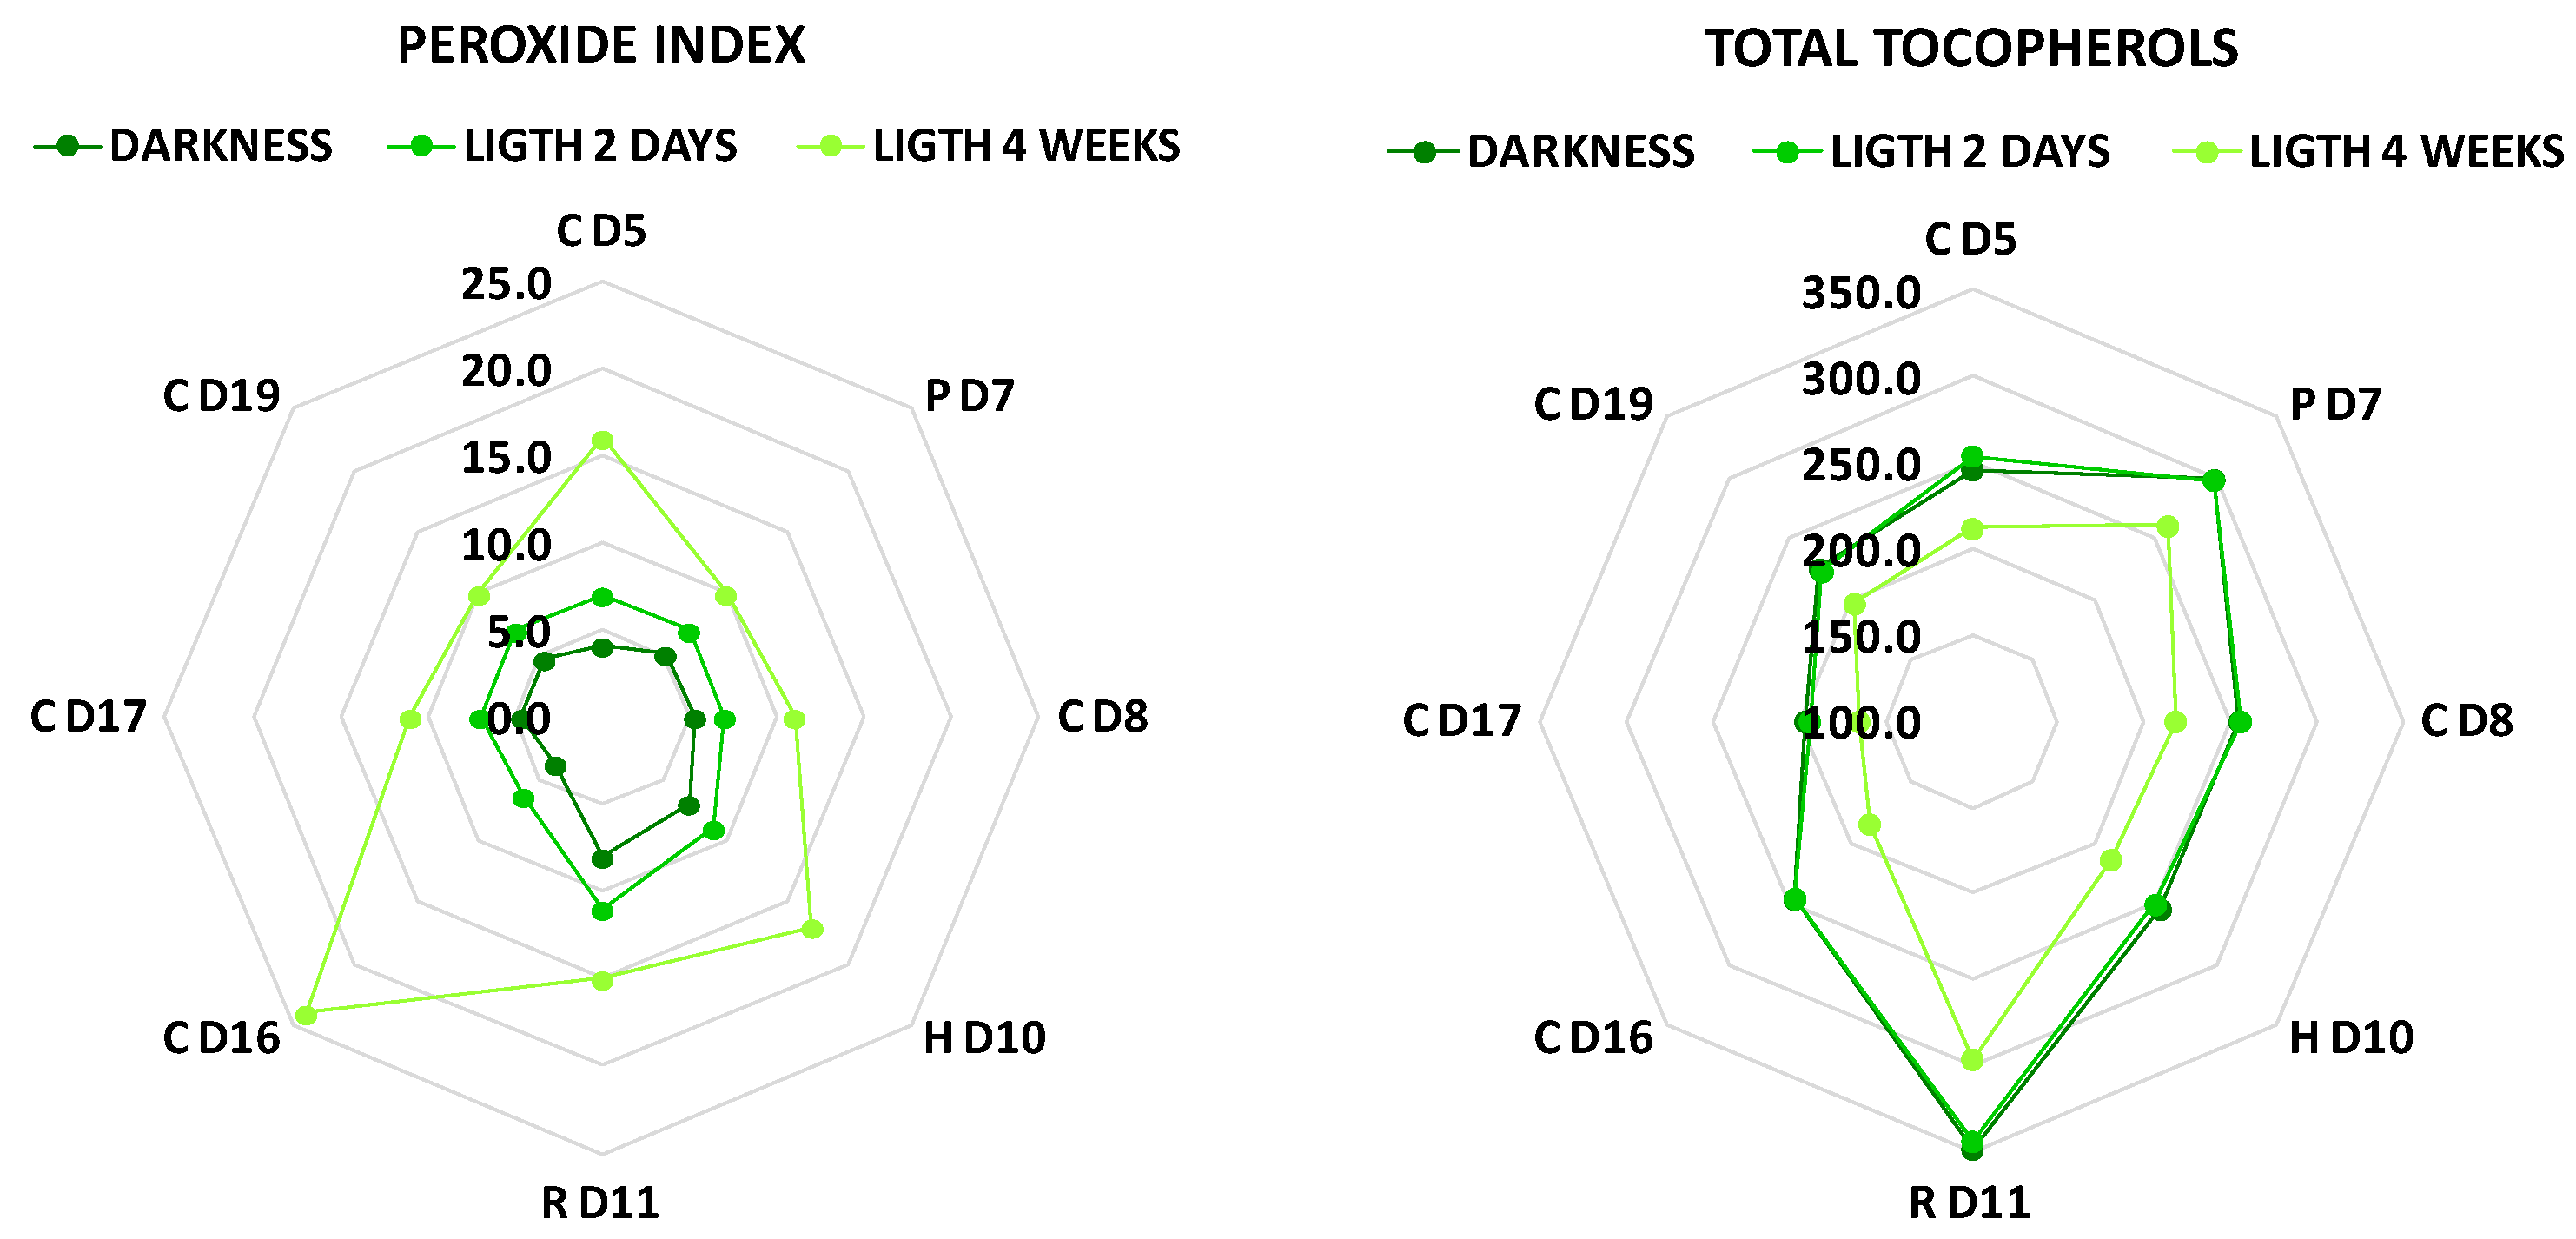
Radial diagrams in
Figure 3 illustrate the evolution of the peroxide index and the total tocopherols content during light exposure. Each spoke of the polygon corresponds to an initial sample. Peroxide index increased with light exposure, as expected, since the appearance of peroxides is a result of oxidation processes. In contrast, the content of total tocopherols decreased as a consequence of their antioxidant activity.
Each sample showed different evolution pattern, which highlighted the importance of the original composition in the strength of the oxidative conditions effect on the olive oil.
3.3. Analysis of the Fluorescence Spectra
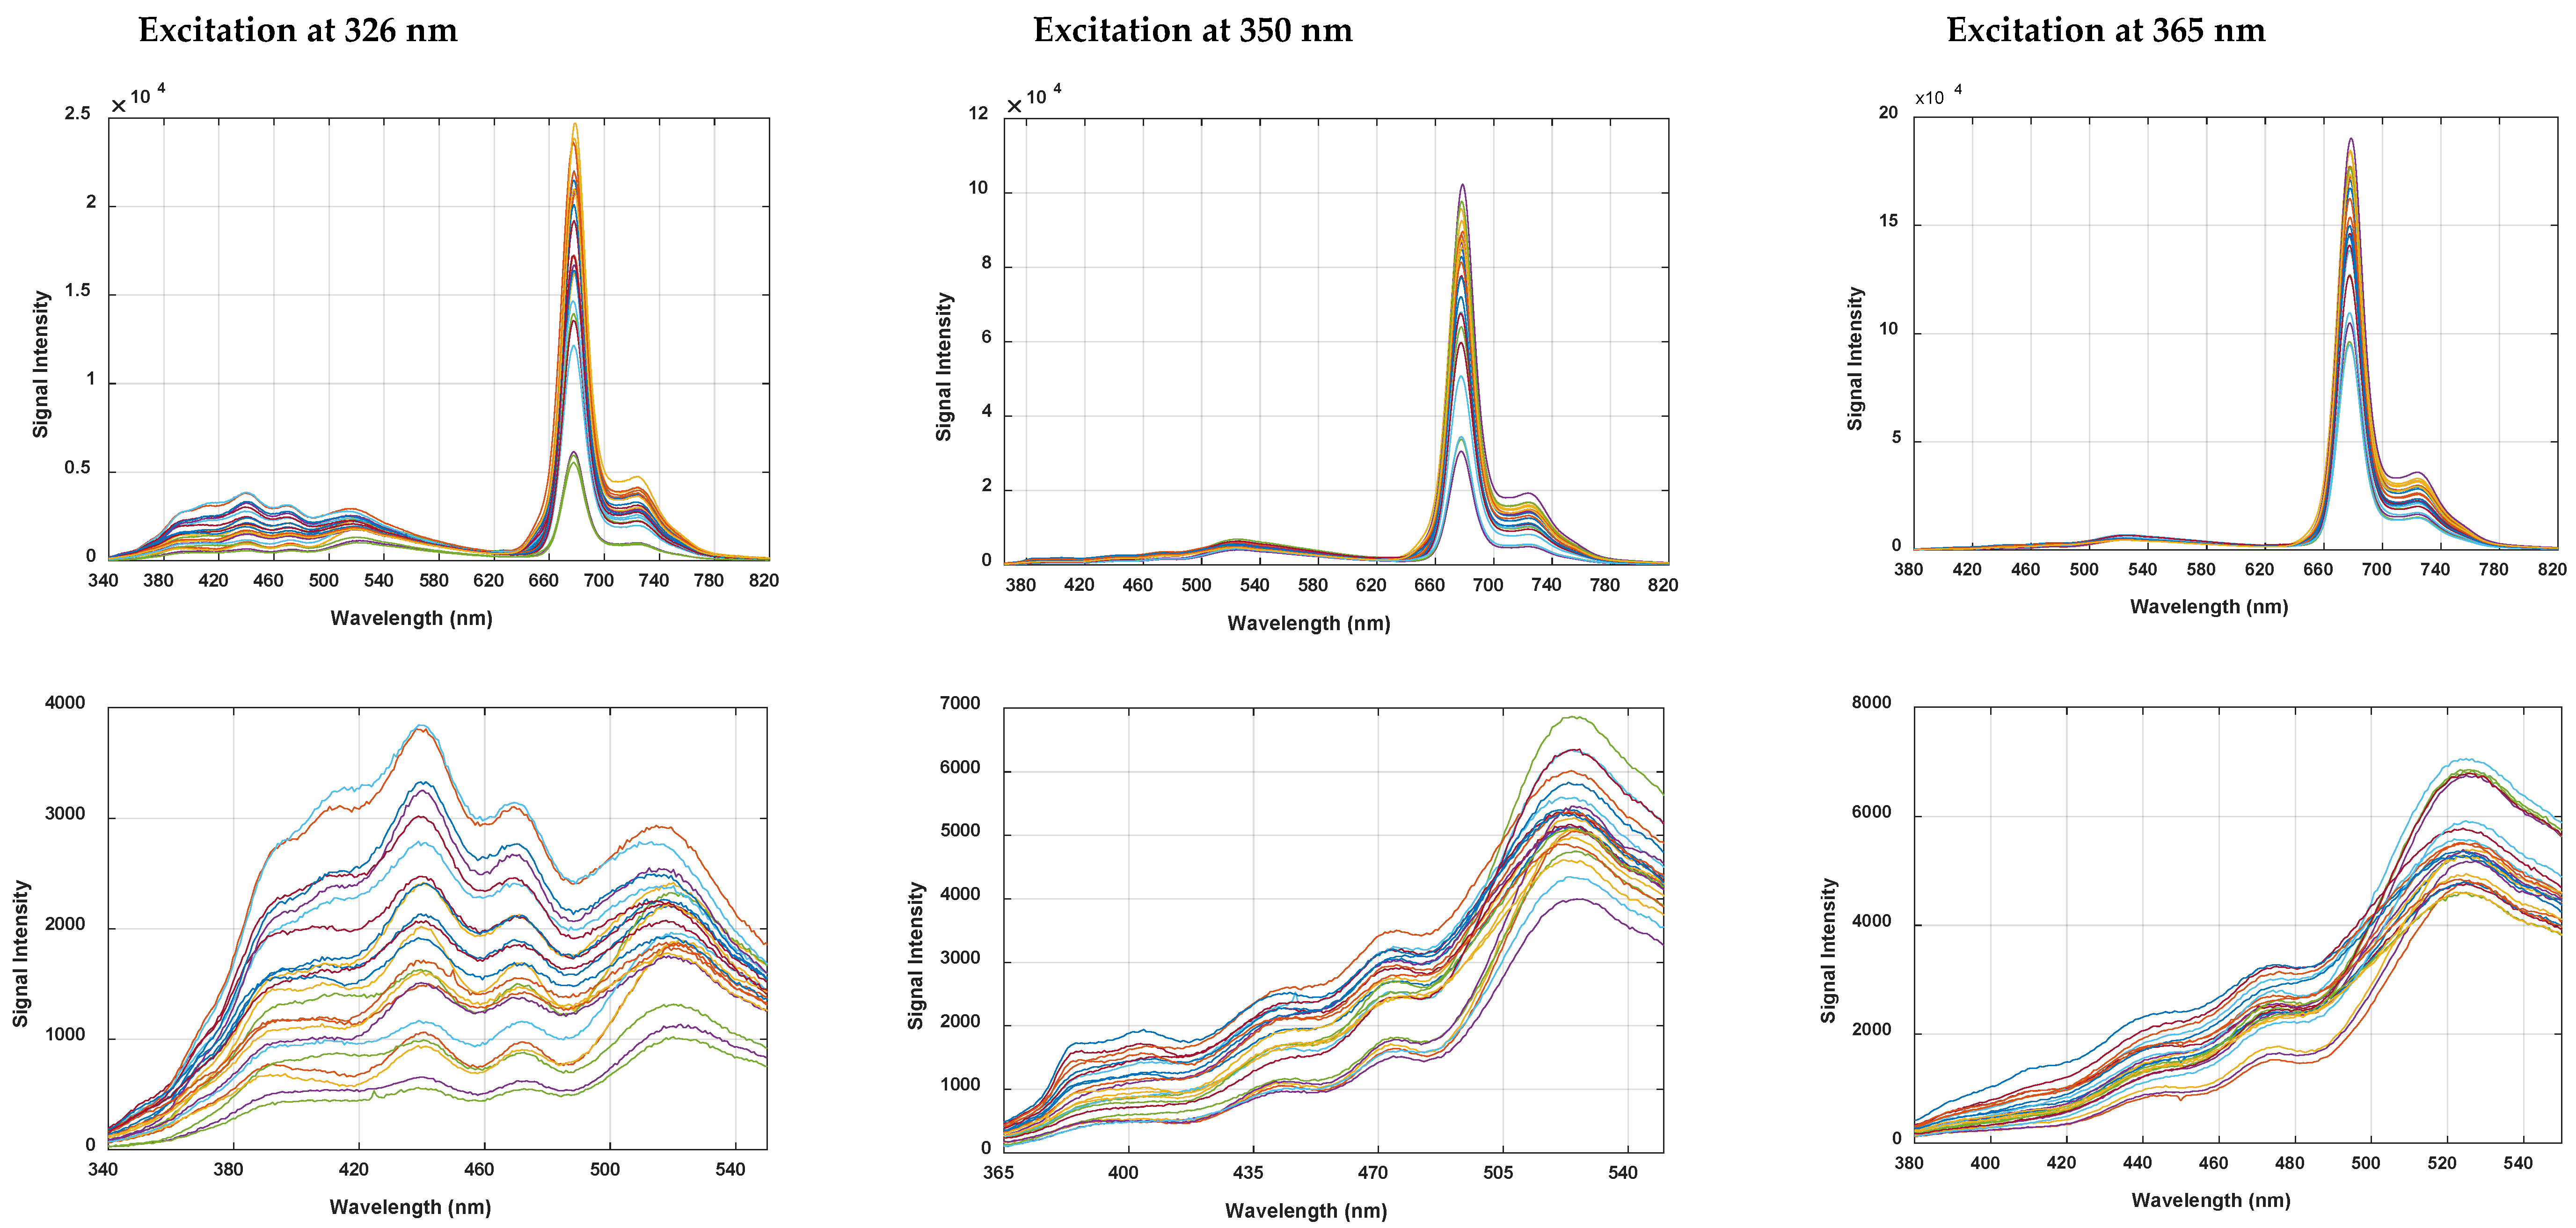
The spectra obtained at the three different excitation wavelengths consistently showed emission peaks within two differentiated regions (
Figure 4). The overall spectral pattern found was similar to that obtained in previous works [
10,
11,
12] with dominant fluorescence peak at 670 from chlorophyll and pheophytins, together with a broad region between 400–600 nm derived from oxidation products and antioxidants.
In our research the region at shorter wavelengths, which corresponded to oxidation products, showed local maxima located around 385 nm, 405 nm, 440 nm, 470 nm and 520 nm. According to literature [
18,
19,
20,
21] the tocopherols also emit around 520 nm. Then, superimposed signals were registered around this wavelength.
Despite these similarities, the intensity of the emission signals showed differences between excitation conditions. Differences were also found in the dominant peaks within the region of the oxidation products and tocopherols (
Figure 4 bottom row).
Excitation at 365 nm achieved the highest emission signals from the chlorophylls. The intensity peak around 520 nm was clearly dominant within the region of oxidation products, whereas peaks at wavelengths lower than 420 nm were very subtle. In contrast, when oil samples were excited at 350 nm the emission spectra showed evident peaks at 385 nm and 405 nm. Under these excitation conditions, a peak at 520 nm was dominant as well. Excitation at 326 nm showed the lowest effectiveness in exciting the fluorescent compounds since the emission intensity was lower along the whole spectra. However, the pattern within the region of oxidation products was noticeably different as peaks at wavelengths shorter than 520 nm were more preponderant than peaks at 520 nm. These results highlighted that the effectiveness in producing fluorescence signal from the different compounds greatly depended on the selected light of excitation, which is in accordance with the basics of fluorescence spectroscopy [
22].
Oxidation products comprise a great variety of compounds. Conjugated and non-conjugated hydroperoxides are products from primary oxidation processes. Secondary oxidation products include low-molecular-weight aldehydes, ketones, alcohols and short-chains hydrocarbons. Therefore, the observed complex fluorescence emission pattern was expected, where signals were produced by a diversity of compounds and were acquired at different wavelengths. Such emissions potentially contained useful information on composition and oxidation status.
For further analysis the emission region below 550 nm was selected in order to develop multivariate models for the estimation of physico-chemical characteristics related to oxidation status and for the estimation of tocopherols content.
3.4. Models for Estimating Physico-Chemical Parameters
Models for the estimation of physico-chemical parameters and tocopherols content were developed for each of the filters considered. The predictive capacity of the models was evaluated through the coefficient of determination
R2. The results obtained from the PLSR models for each parameter are summarized in
Table 6. The number of latent variables ranged from 2 to 5. The highest R
2 values were found for excitation at 350 nm, reaching almost 0.9 in most of the parameters (acidity, peroxide value, K
232, total tocopherols and isomers).
Figure 5 and
Figure 6 illustrate detailed results for K
232 and total tocopherols, both with
R2 values of 0.88.
The high
R2 values achieved was a noticeable result since the estimation models were developed with samples that showed very low degradation and very low variability. Such characteristics involved low emission signals as well as low dispersion of the signals, which may be a hindrance in the development of chemometric models [
23]. This performance highlighted the high capability of the fluorescence for detailed characterization of oil samples, in terms of physico-chemical characteristics and antioxidants content.
Other authors found successful results for some physico-chemical characteristics [
8]. However, the set of samples included olive oils that showed an important degradation due to heat effects.
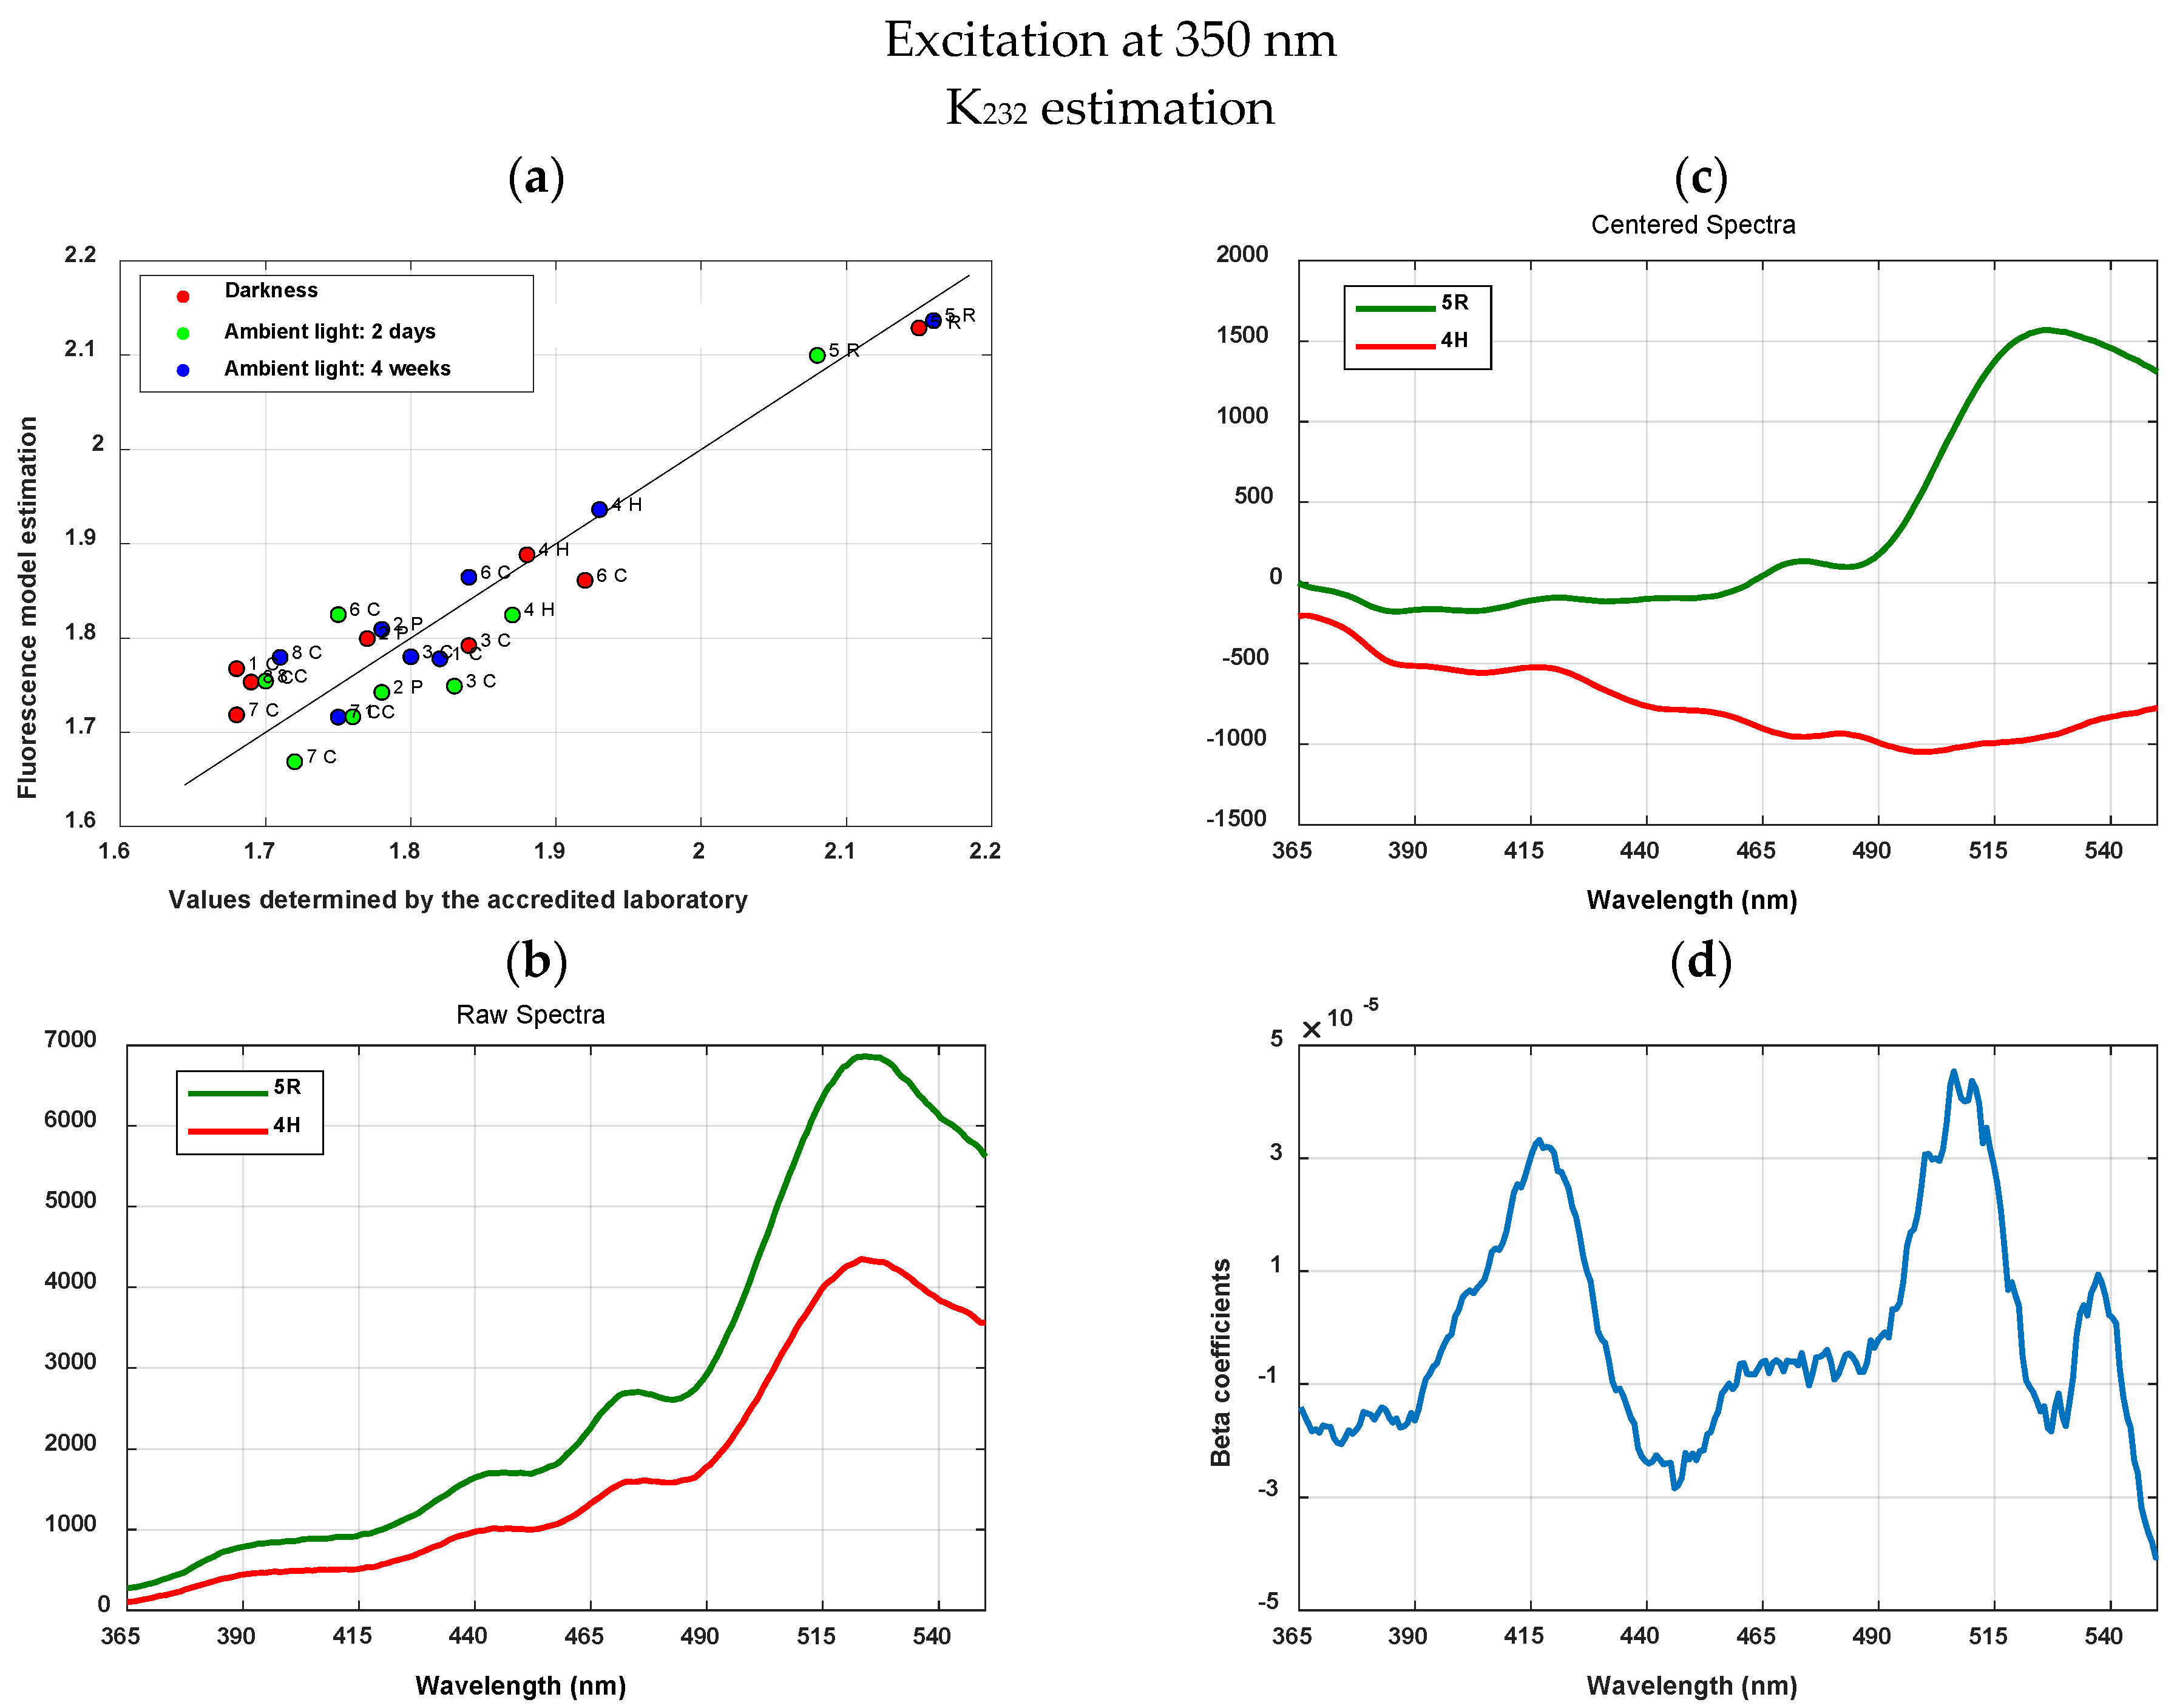
Figure 5a shows on the x axis the values of K
232 determined by the accredited laboratory, versus the values estimated with the partial least squares regression (PLSR) model on the y axis. The scattered data illustrated the importance of the initial composition of the sample in the evolution of the sample characteristics when exposed to oxidation conditions. Some samples exposed to ambient light for four weeks (blue circles) showed lower K
232 values than others maintained under darkness conditions (red circles).
Two samples that were correctly estimated (close to the diagonal in the scatterplot) were selected in order to compare their spectra.
Figure 5b presents the raw spectra of the sample 4H (red circle) and the sample 5R (green circle) with low and high K
232 respectively. The latter presented higher fluorescence emission over the whole wavelengths range, as it can be expected from its probably higher oxidation status.
PLSR estimation models were computed by using the spectra centered with respect to the average of the whole set of samples (
N = 24).
Figure 5c shows the corresponding centered spectra of 4H and 5R samples. 5R centered spectrum presented high and positive values between 500 nm and 560 nm, with a high and positive slope between 500 nm and 520 nm, whereas 4H centred spectrum presented negative values along the whole range.
Figure 5d shows the beta coefficients of the model with relevant wavelengths bands around 420 nm and around 510–520 nm. The last one is coincident with the positive slope found between 510 nm and 520 nm in 5R centered spectrum.
The beta coefficients of the PLSR model are shown in
Figure 5d. For each centered spectrum, the sum of the product of the values at each wavelength multiplied by the corresponding beta coefficient at such wavelength provided the estimation of its K
232 (
Figure 5a). This sum of products generated high value of estimation of K
232 for the 5R sample, since within 500 nm and 520 nm ranges both spectrum and coefficients were positive. Moreover, beta coefficients computed an approximation to the slope between 500 nm and 520 nm, which was positive and high for 5R centered spectrum. On the other hand, the model applied onto the centered spectrum of 4H produced negative values as beta coefficients were positive and the values of the mean centered spectra were negative, which contributed to its low K
232 estimated value.
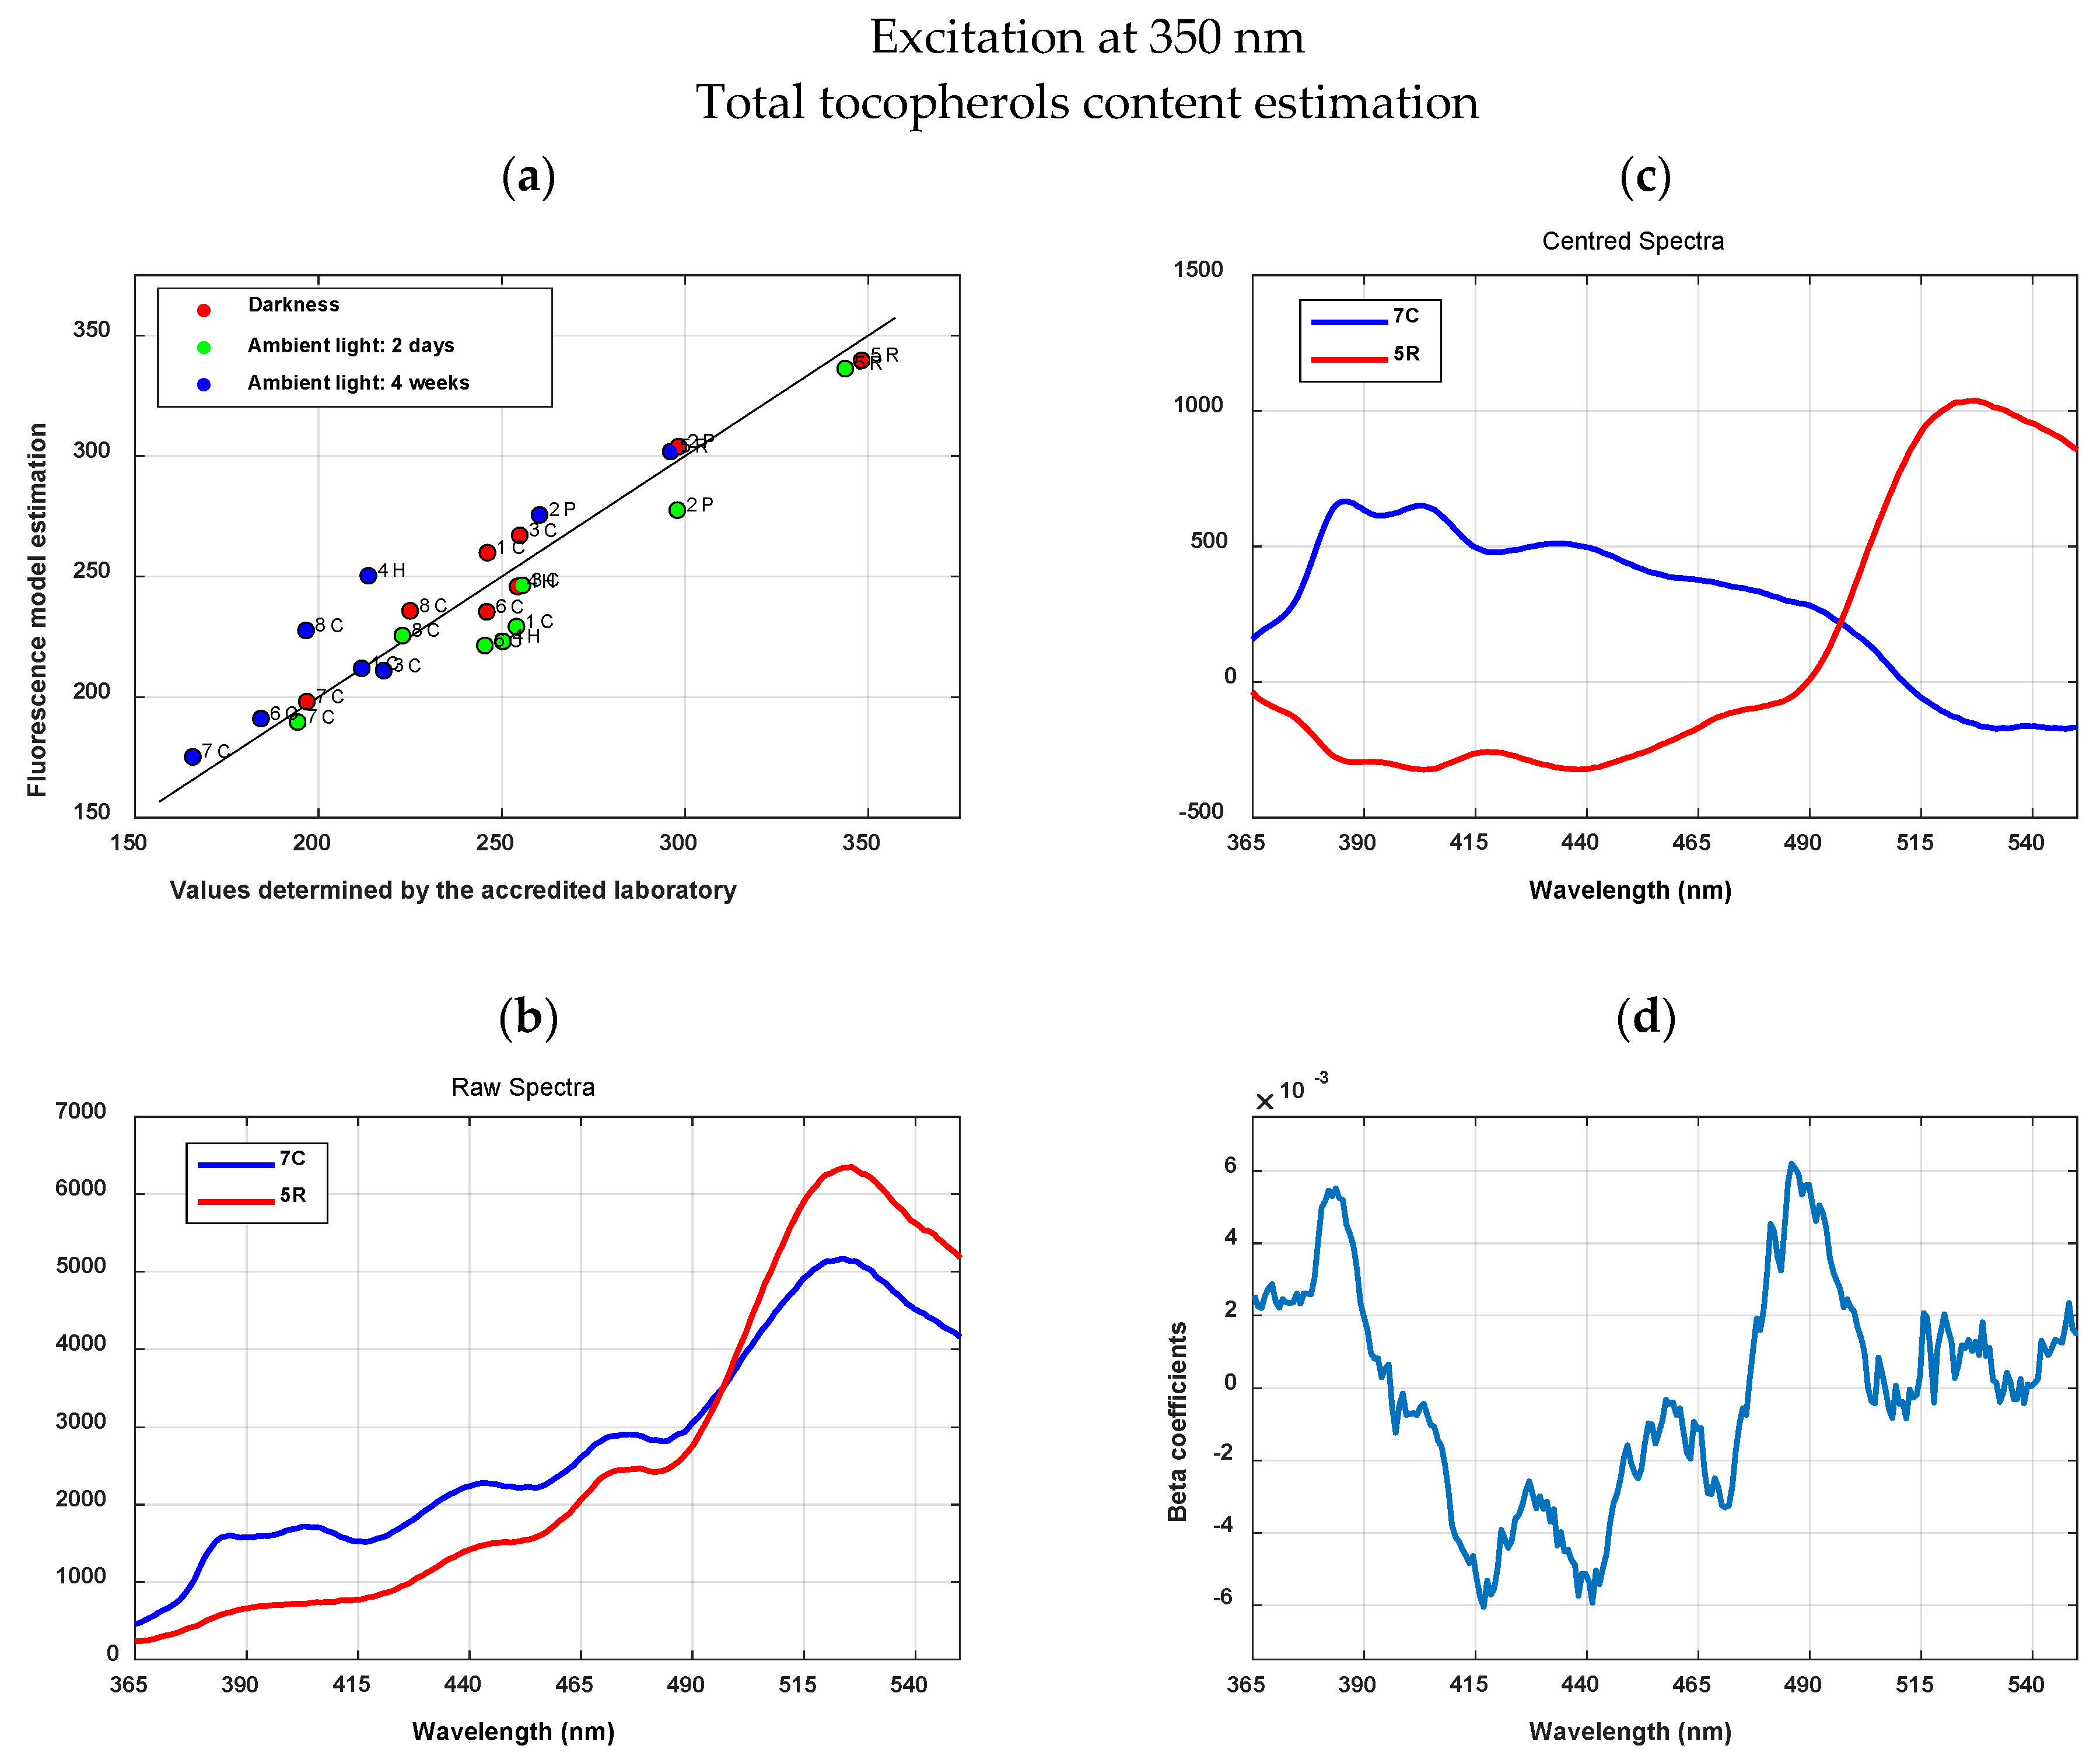
Figure 6 illustrates the results for total tocopherols content.
Figure 6a shows sample 7C (blue circle, one month storage under indirect illumination) and 5R (red circle, darkness storage); both were selected for further description as their predicted and observed values were almost coincident. Their tocopherol values were low and high respectively.
Figure 6b,c shows the two raw spectra and the same spectra but centered with respect to the average of the 24 samples. The 5R raw spectrum presented a very high and dominant peak of fluorescence around 520 nm; within the range from 360 to 500 nm its level of fluorescence was lower than for 7C spectrum. The preponderant emission at 520 nm of 5R spectrum could be derived from its higher level of tocopherol. The lower emission at 360 to 500 nm could be ascribed to lower oxidation status since such sample was stored under darkness conditions.
Figure 6d shows the beta coefficients of the model with very well-defined predominant regions and peaks (positive at 380 nm and between 480 nm and 500 nm; negative at 420 nm and 440 nm approximately). The sum of the products of the spectrum 5R (centered), wavelength by wavelength, by the beta coefficients between 480 nm and 500 nm produced high value on the estimation of tocopherol due to the high slope observed in the spectrum at this region. In addition, the negative and high beta coefficients at 420 nm and 440 nm multiplied by the negative values of the 5R spectrum at 420 nm and 440 nm also produce a high level of tocopherol estimation. The opposite occurred to 7C spectra, where the sum of the products in the range between 480 nm and 500 nm contributed to the low tocopherol estimation (because the sum of the products produces negative values) and in the peaks 420 nm and 440 nm, also produced negative values.
Although further analysis has to be done with a higher number of samples, including higher variability in physico-chemical characteristics and antioxidants content, these are encouraging results since the fluorescence spectroscopy, when a proper wavelength is applied for excitation, has shown great potential to estimate them. At higher oxidation state the signals from the derived products will become more evident, which might involve even better results. As for the estimation of the total tocopherols, the promising results obtained in this study need to be evaluated with samples showing less content.
Most fluorescence research is focused on sensing differences between samples that have undergone drastic conditions of oxidation, or between samples showing significant dissimilarities (as reviewed in the Introduction). Frequently these studies were conducted to identify blended samples prepared in laboratory containing pure EVOO samples and increasing proportions of cheaper oils such as sunflower, seed, or expired olive oils. In contrast, the present research is focused on the quantitative estimation of characteristics and compounds showing slight variation between the samples comprising the analyzed set. Moreover, the present results could be implemented to identify adulterations as well.
In addition, this procedure could be flexible and adaptable to the requirements of the different agents within the value chain of olive oil (producers, distributors, exporters, importers, etc.). Such a method could allow a pre-characterization of samples prior to the application of the battery of regulated analytical determinations. This could facilitate decision-making in the handling of samples and promote the reduction of analytical procedures, which are slow and involve management of chemical residues, with the corresponding reduction of costs.
4. Conclusions
This work revealed the potential of fluorescence spectroscopy to estimate physico-chemical characteristics related to the oxidation state of EVOO and antioxidant content such as tocopherols. Internal changes produced in the composition of olive oil as a result of exposure to light are manifested in changes in the shape of the fluorescence emission spectra within the range from 365 nm to 550 nm.
Despite the minimum oxidation of the samples and the subtle differences between samples, the specificity and sensibility of fluorescence spectroscopy provided useful complex emission patterns. Signals were produced by a diversity of compounds and each specific compound presented an optimal range of excitation wavelengths. The computation of excitation spectra revealed local maxima that allowed identifying the wavelengths bands that were more effective in producing signals with relevant information. Excitation at 350 nm provided the most useful emission spectra since the estimation models provided R2 close to 0.9 for acidity, K232 and total tocopherol content. The R2 was close to 0.7 for the peroxide index.
Further analysis is needed with a higher number of samples, including more varieties, more varied composition and oxidation status in order to validate and to improve the estimation models. This work constitutes the first step for developing a future analytical tool, easy to implement, fast, with a low economic and environmental cost, based on fluorescence spectroscopy.


