Mapping Agronomic and Quality Traits in Elite Durum Wheat Lines under Differing Water Regimes

 ,
,  ,
,  , ,
, , 
Abstract
1. Introduction
2. Material and Methods
2.1. Plant Material, Phenotyping and Genotyping
2.2. Phenotypic Data
2.3. Population Structure and Linkage Disequilibrium
2.4. Association Mapping (AM)
3. Results
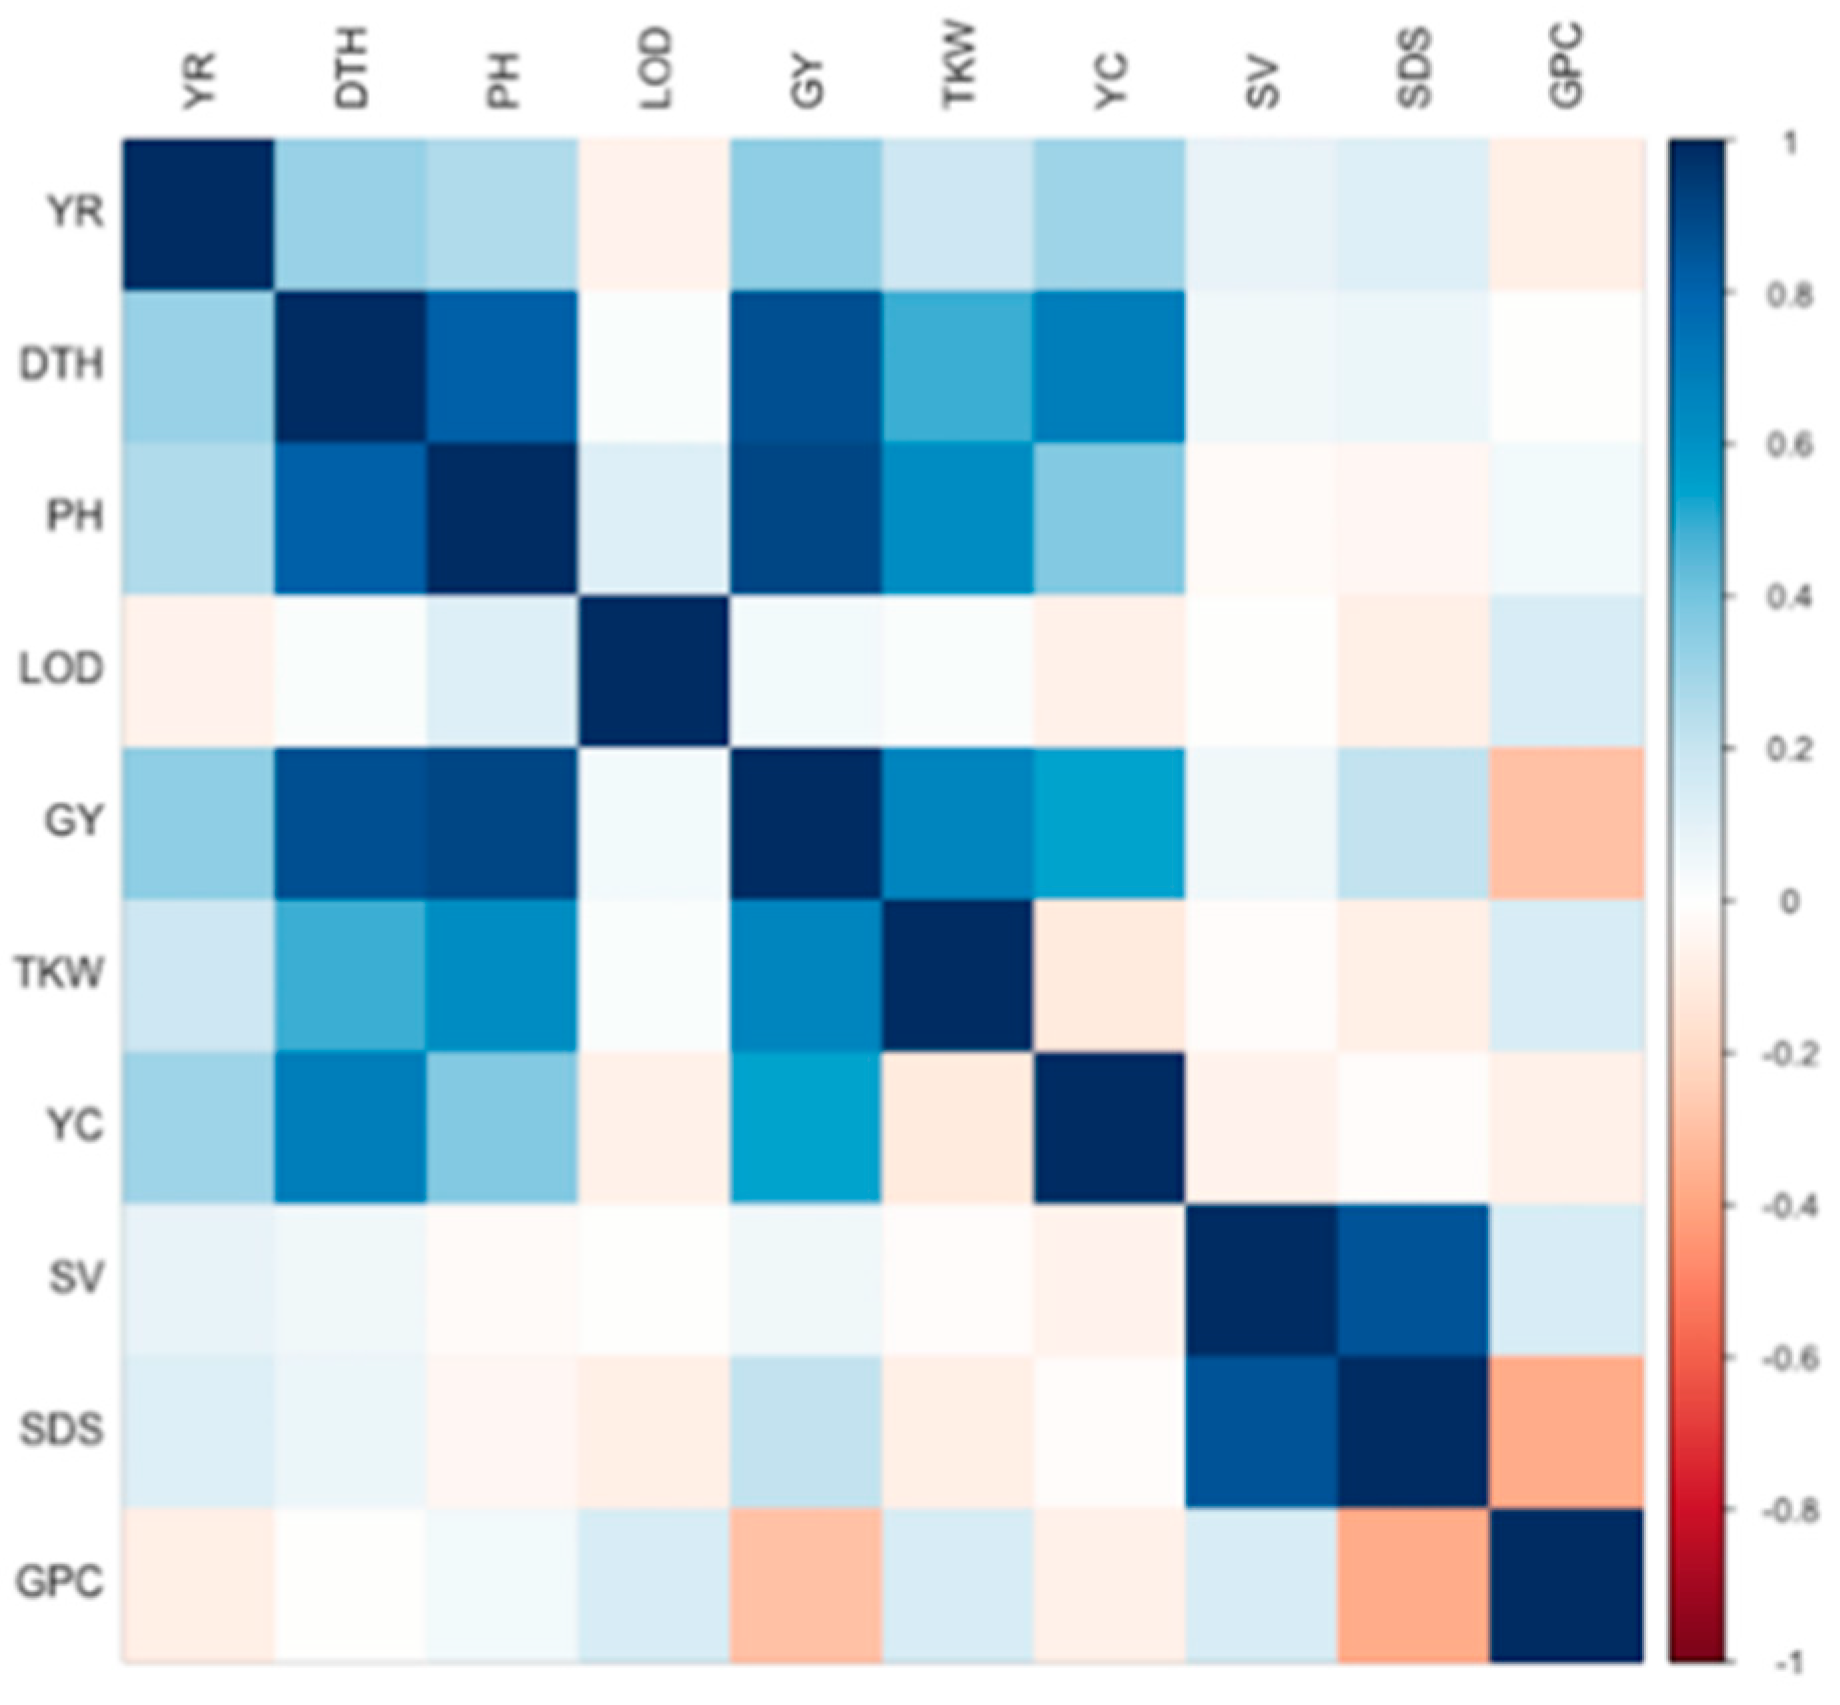
3.1. Phenotypic Assessment
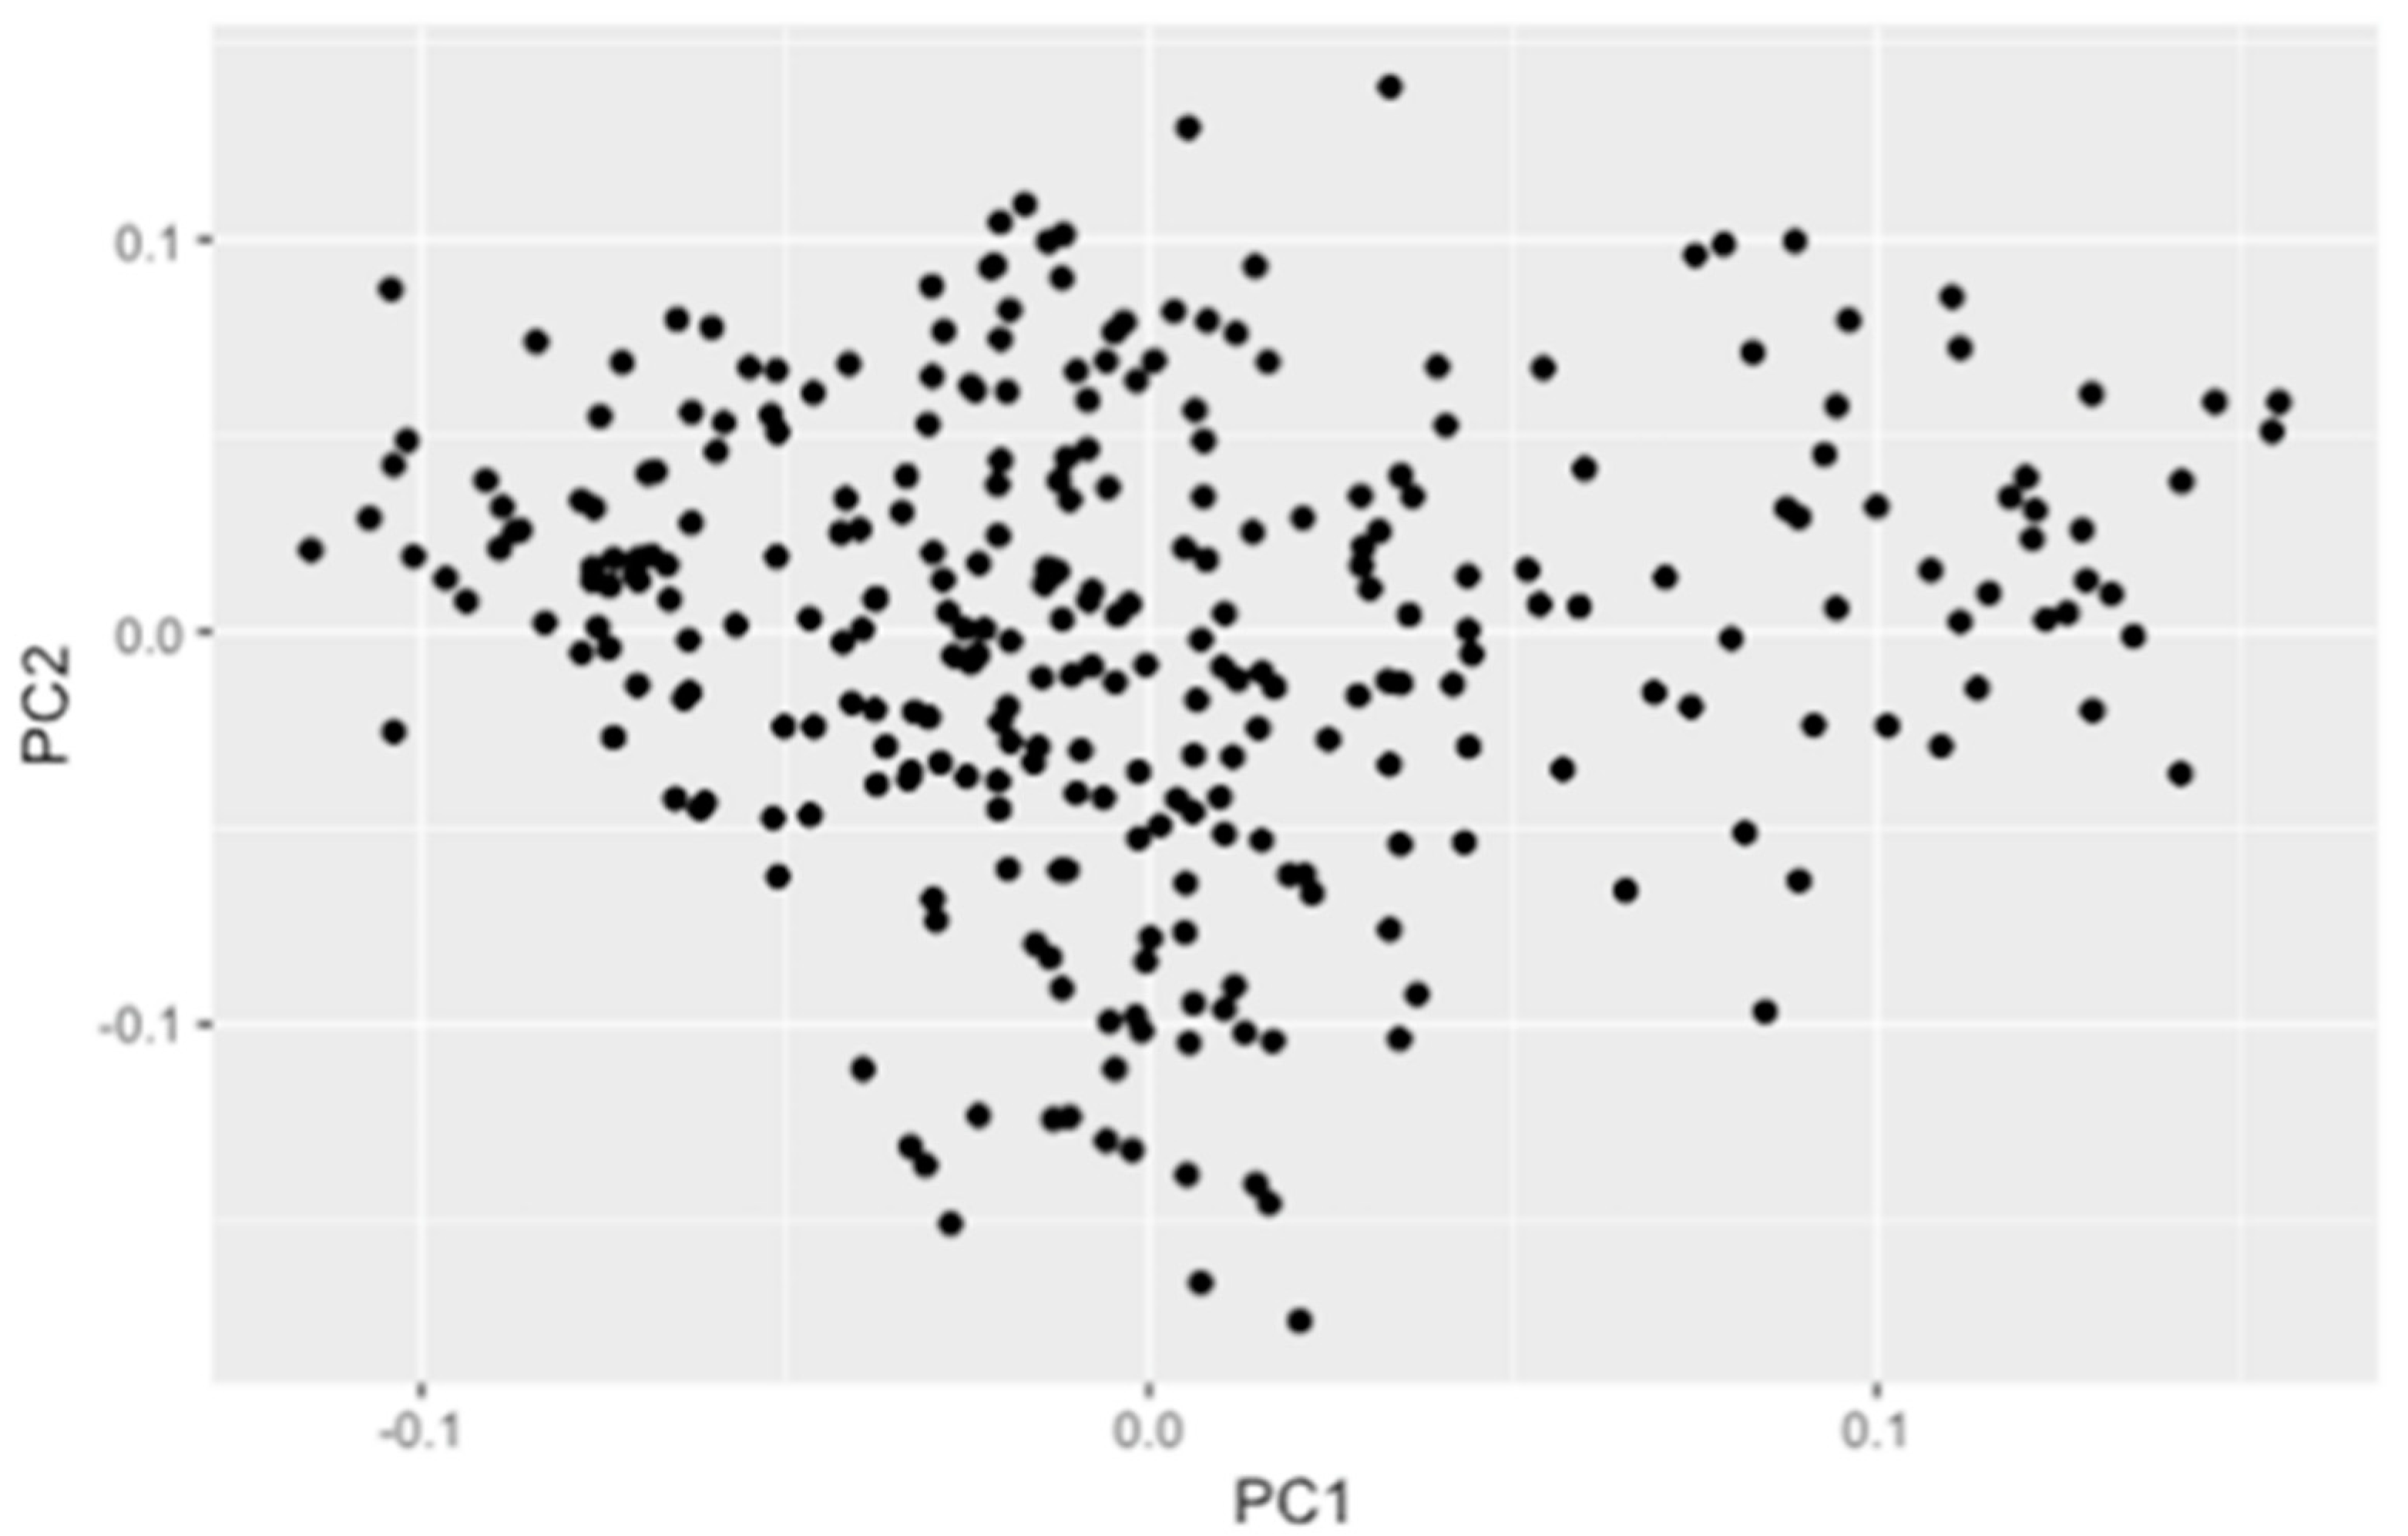
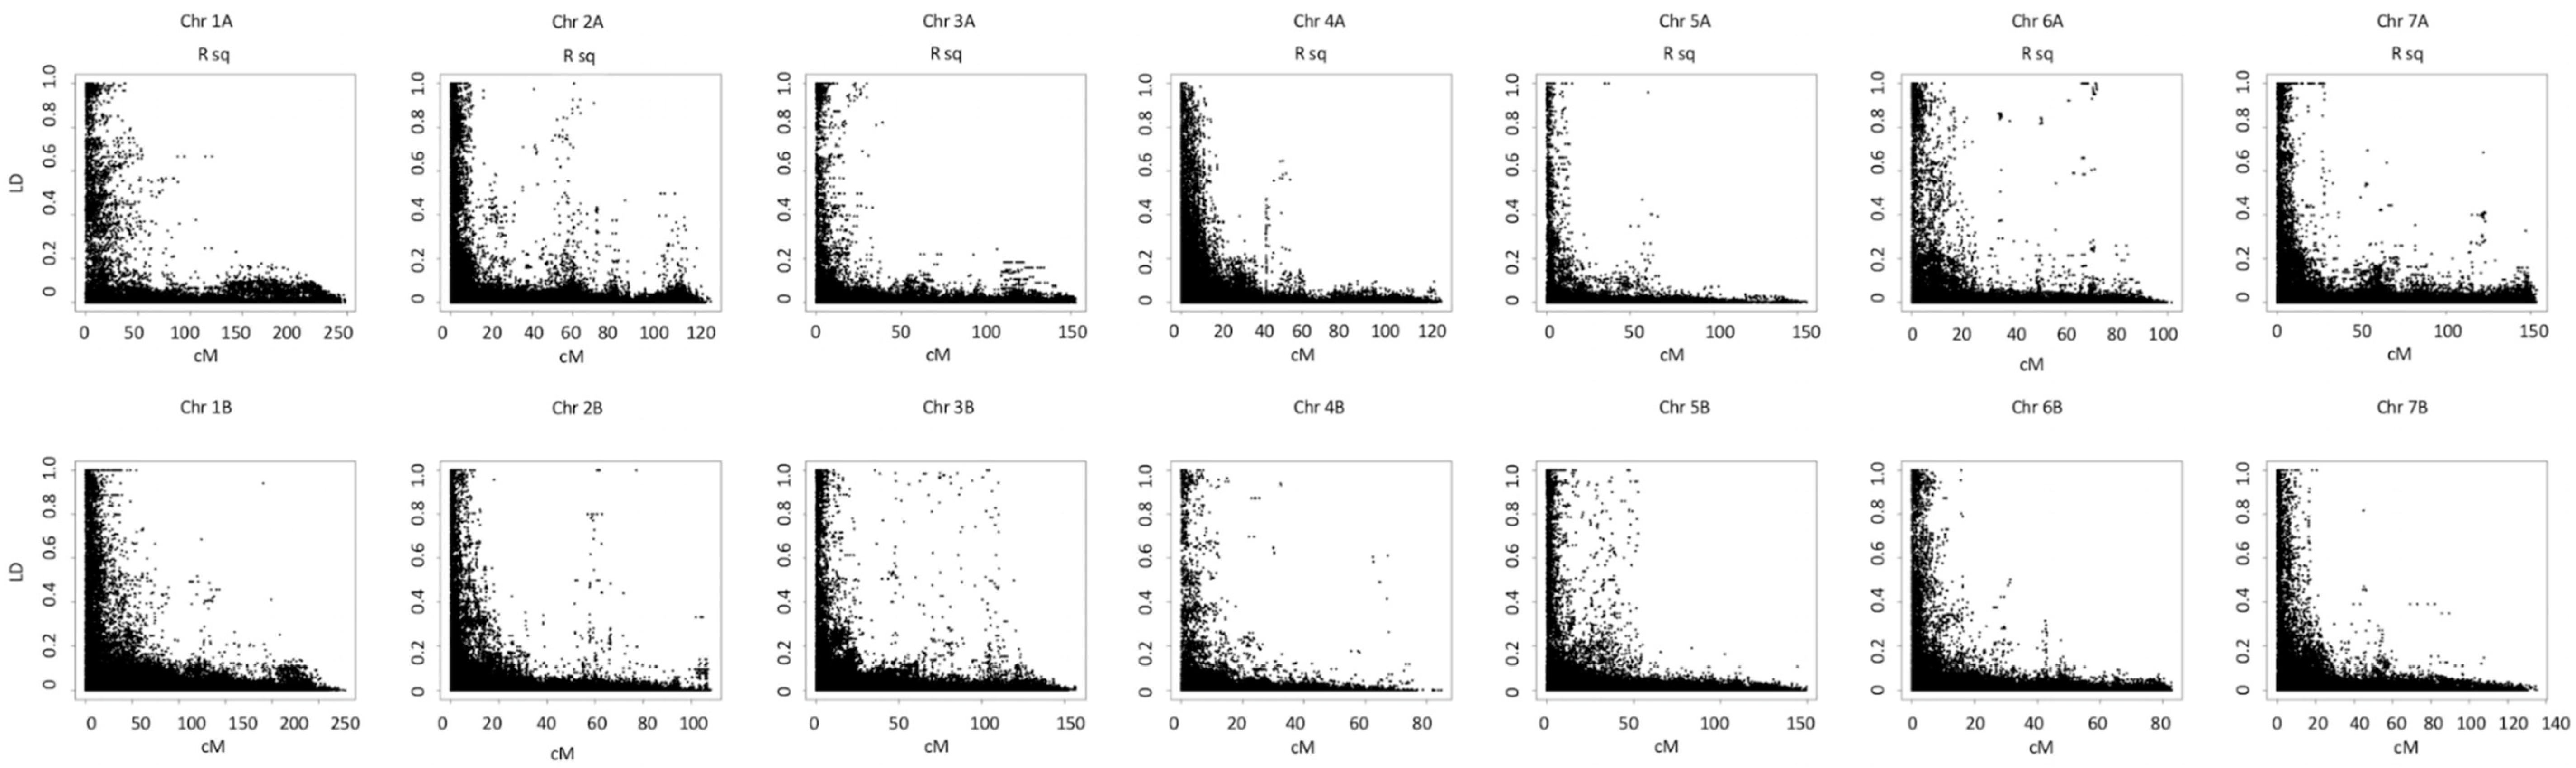
3.2. Population Structure and Linkage Disequilibrium
3.3. AM Analysis
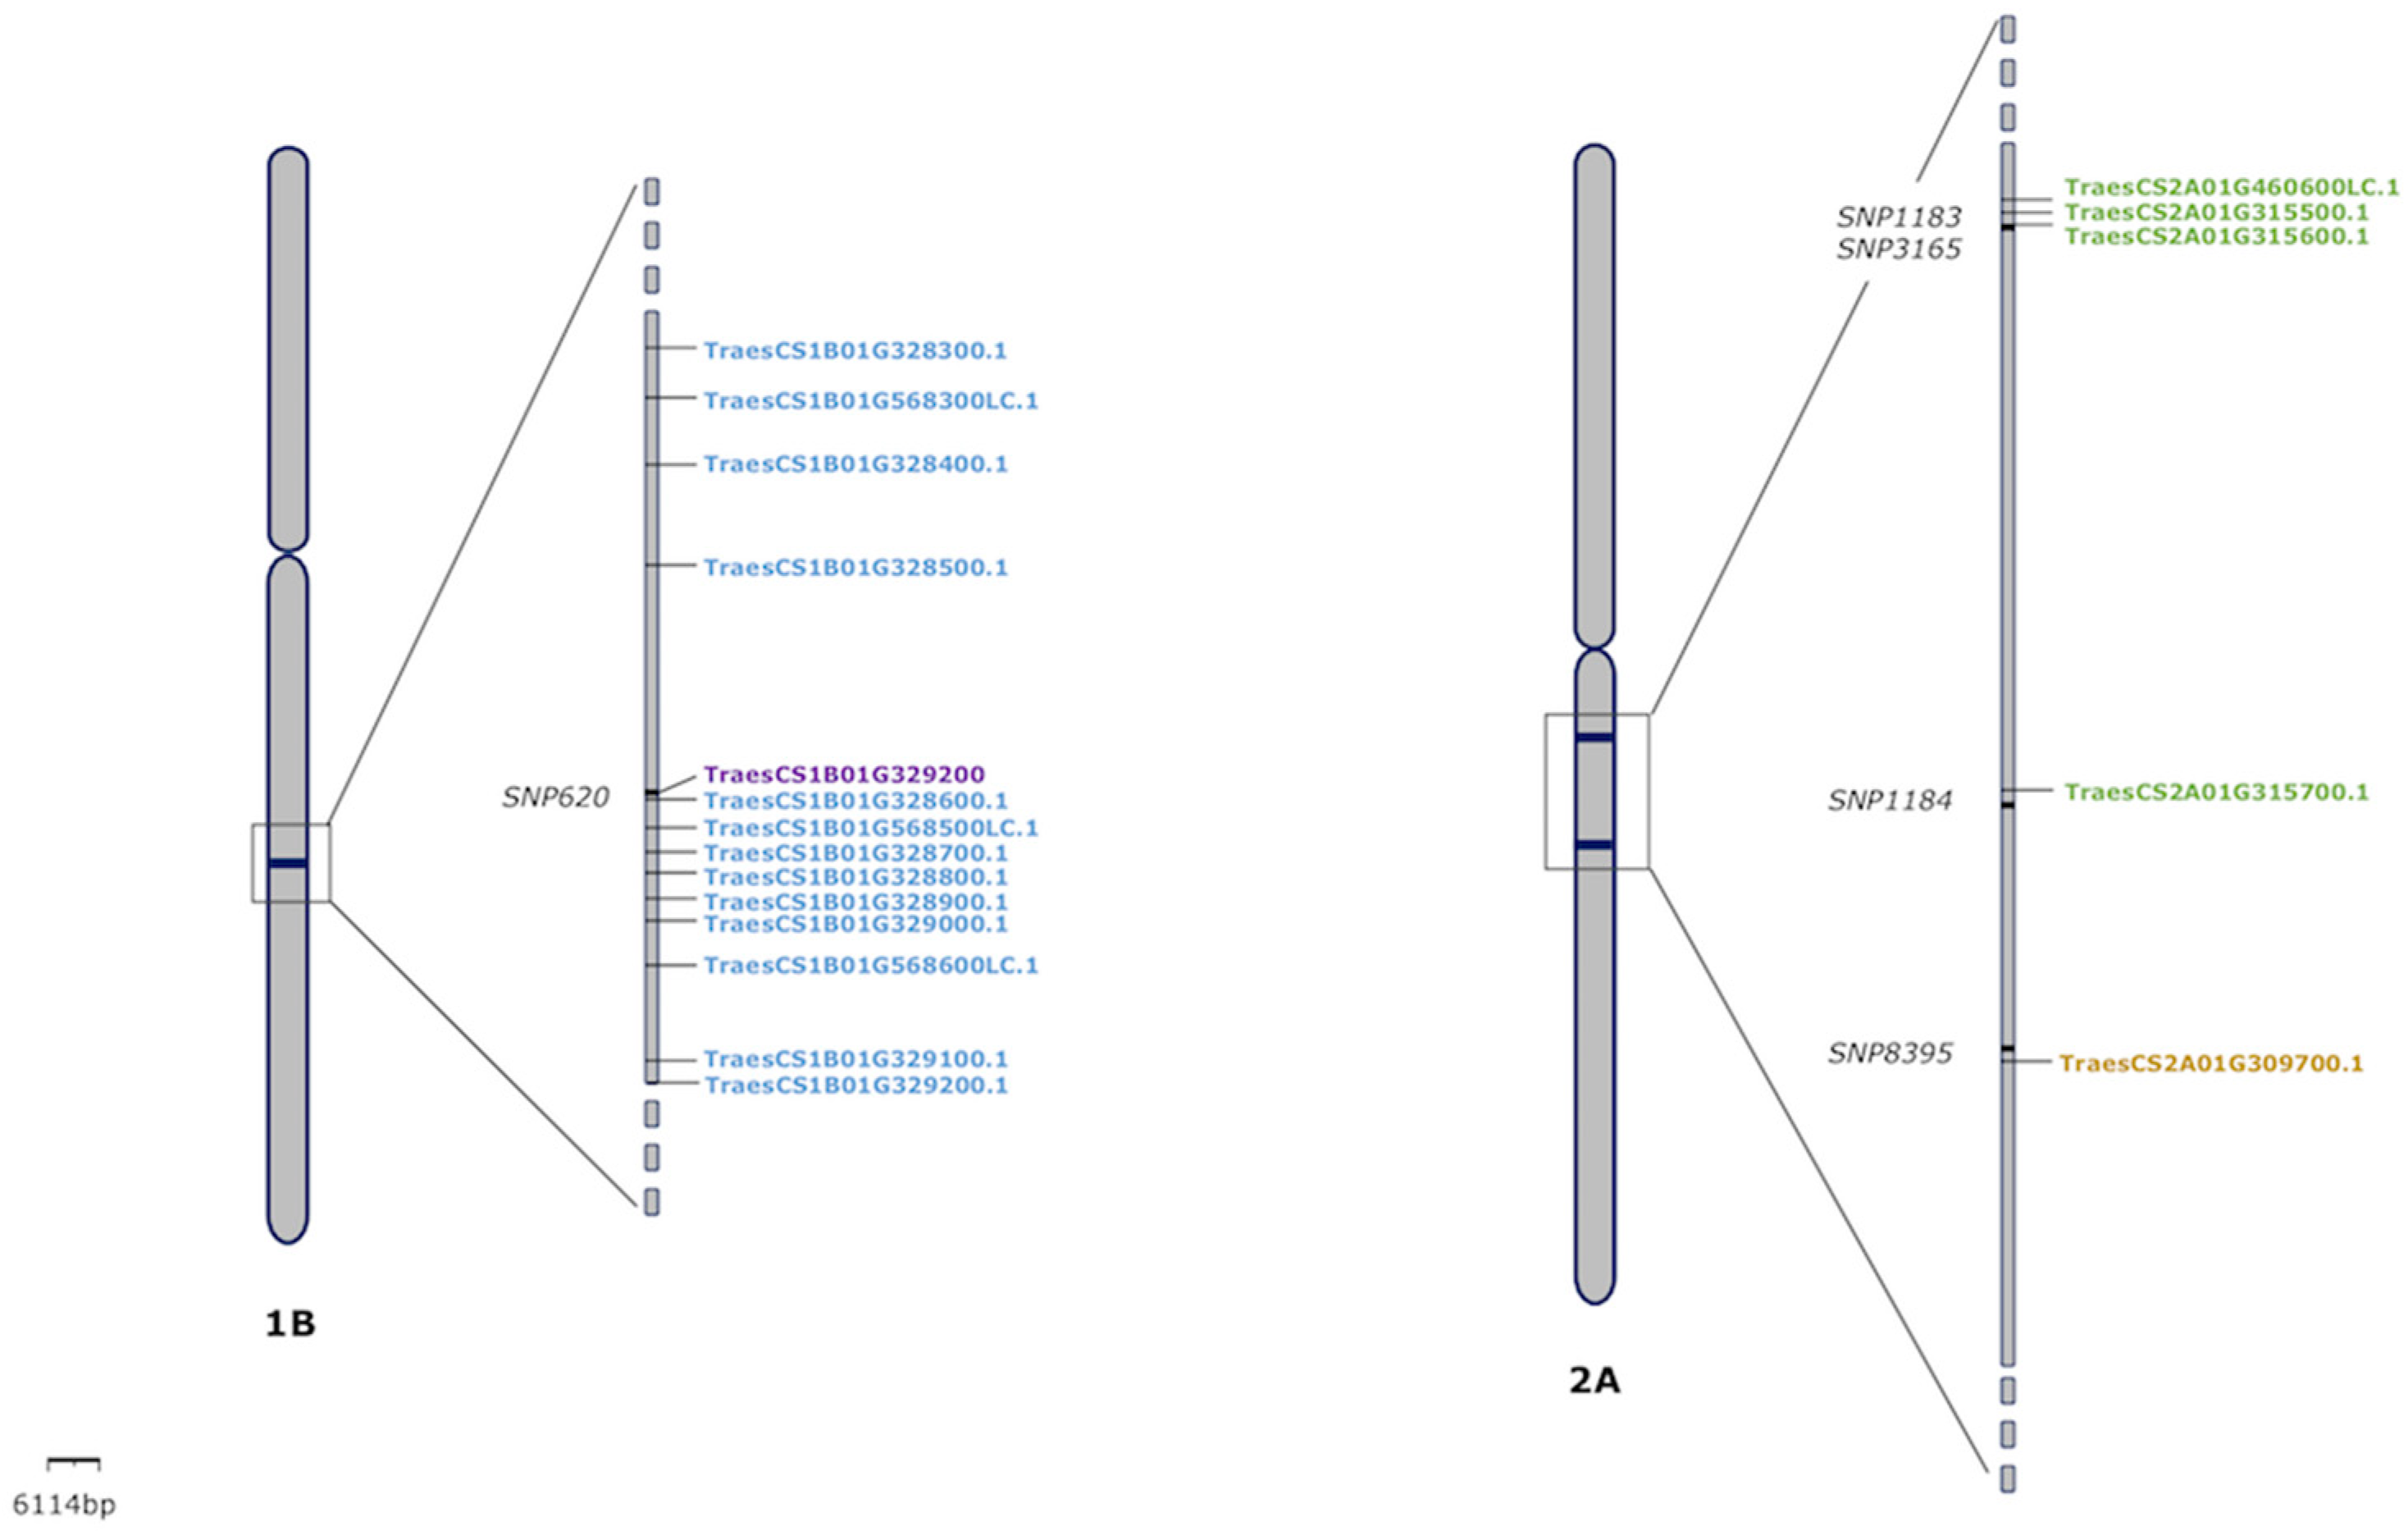
3.4. Candidate Genes Analysis
4. Discussion
Supplementary Materials
Author Contributions
Funding
Conflicts of Interest
References
- Curtis, B.C. Wheat in the world. In Bread Wheat Improvement and Production; Curtis, B.C., Rajaram, S., Gomez Macpherson, H., Eds.; Plant Production and Protection Series; Food and Agriculture Organization of the United Nations: Rome, Italy, 2002; Volume 30, pp. 1–17. [Google Scholar]
- Ranieri, R. Geography of Durum Wheat Crop; Pastaria Open Fields: Collecchio, Italy, 2015. [Google Scholar]
- Bozzini, A.; Fabriani, G.; Lintas, C. Origin, Distribution, and Production of Durum Wheat in the World. In American Associate of Cereal Chemists International, Durum Wheat, 2nd ed.; AACC International Press: Saint Paul, MN, USA, 2012. [Google Scholar] [CrossRef]
- Nachit, M.M. Durum wheat breeding for Mediterranean drylands of north Africa and west Asia. In Durum Wheats: Challenges and Opportunities; Rajaram, S., Saari, E.E., Hettel, G.P., Eds.; Wheat Special Report; CIMMYT: Ciudad Obregón, Mexico, 1992. [Google Scholar]
- Singh, R.P.; Huerta-Espino, J.; Fuentes, G.; Duveiller, E.; Gilchrist, L.; Henry, M.; Nicol, M.J. Resistance to diseases. In Durum Wheat Breeding: Current Approaches and Future Strategies; Royo, C., Nachit, M.M., Fonzo, D., Araus, J.L., Er, W.H.P., Slafer, G.A., Eds.; Food Prod Press: Binghamton, NY, USA, 2005; pp. 291–315. [Google Scholar]
- Maccaferri, M.; Sanguineti, M.C.; Demontis, A.; El-Ahmed, A.; Garcia del Moral, L.; Maalouf, F.; Nachit, M.; Nserallah, N.; Ouabbou, H.; Rhouma, S.; et al. Association mapping in durum wheat grown across a broad range of water regimes. J. Exp. Bot. 2011, 62, 409–438. [Google Scholar] [CrossRef]
- Abdalla, O.; Dieseth, J.A.; Singh, R.P. Breeding durum wheat at CIMMYT. In Durum Wheats: Challenges and Opportunities; Rajaram, S., Saari, E.E., Hettel, G.P., Eds.; Wheat Special Report; CIMMYT: Ciudad Obregón, Mexico, 1992. [Google Scholar]
- Wrigley, C.W. Wheat: An overview of the grain that provides our daily bread. In Encyclopedia of Food Grains; Colin, W., Wrigley, H.C., Koushik, S., Jonathan, F., Eds.; Elsevier: Oxford, UK, 2016; pp. 105–116. [Google Scholar] [CrossRef]
- Triboi, E.; Abad, A.; Michelena, A.; Lloveras, J.; Ollier, J.L.; Daniel, C. Environmental effects on the quality of two wheat genotypes: 1. quantitative and qualitative variation of storage proteins. Eur. J. Agron. 2000, 13, 47–64. [Google Scholar] [CrossRef]
- Halford, N.G.; Curtis, T.Y.; Chen, Z.; Huang, J. Effects of abiotic stress and crop management on cereal grain composition: Implications for food quality and safety. J. Exp. Bot. 2015, 66, 1145–1156. [Google Scholar] [CrossRef]
- Blumenthal, F.; Batey, I.L.; Wrigley, C.W.; Moss, H.J.; Mares, D.J.; Barlow, E.W.C. Interpretation of grain quality results from wheat variety trials with reference to high temperatures stress. Aust. J. Agric. Res. 1991, 42, 325–334. [Google Scholar] [CrossRef]
- Campbell, C.A.; Davidson, H.R.; Winkleman, G.E. Effect of nitrogen, temperature, growth stage and duration of moisture stress on yield components and protein content of manitou spring wheat. Can. J. Plant Sci. 1981, 61, 549–563. [Google Scholar] [CrossRef]
- Uhlen, A.K.; Hafskjold, R.; Kalhovd, A.H.; Sahlström, S.; Longva, Å.; Magnus, E.M. Effects of cultivar and temperature during grain filling on wheat protein content, composition, and dough mixing properties. Cereal Chem. 1998, 75, 460–465. [Google Scholar] [CrossRef]
- Araus, J.L.; Slafer, G.A.; Royo, C.; Serret, M.D. Breeding for Yield Potential and Stress Adaptation in Cereals. Crit. Rev. Plant Sci. 2008, 27, 377–412. [Google Scholar] [CrossRef]
- Curtis, T.; Halford, N.G. Food security: The challenge of increasing wheat yield and the importance of not compromising food safety. Ann. Appl. Biol. 2014, 164, 354–372. [Google Scholar] [CrossRef]
- Steiger, D.K.; Elias, E.M.; Joppa, L.R.; Cantrell, R.G. Quality Evaluation of Lines Derived from Crosses of Langdon (Triticum dicoccoides) Substitution Lines to a Common Durum Wheat. In Durum Wheats: Challenges and Opportunities; Rajaram, S., Saari, E.E., Hettel, G.P., Eds.; Wheat Special Report; CIMMYT: Ciudad Obregón, Mexico, 1992. [Google Scholar]
- Rharrabti, Y.; Villegas, D.; Royo, C.; Martos-Nuñez, V.; Garcia del Moral, L.F. Durum wheat quality in Mediterranean environments II. Influence of climatic variables and relationships between quality parameters. Field Crops Res. 2003, 80, 133–140. [Google Scholar] [CrossRef]
- Falconer, D.S.; Mackay, T.F.C. Introduction to Quantitative Genetics, 4th ed.; Pearson Education Limited: Harlow, UK, 1997; p. 464. [Google Scholar]
- Borghi, B.; Corbellino, M.; Ciuffi, M.; La fiandra, D.; Destefanis, E.; Sgrulletta, D.; Boggini, G.; Di Fonzo, N. Effect of heat-shock during grain filling on grain quality of bread and durum wheats. Aust. J. Agric. Res. 1995, 46, 1365–1380. [Google Scholar] [CrossRef]
- Garrido-Lestache, E.; Lopez-Bellido, R.J.; Lopez-Bellido, L. Durum wheat quality under Mediterranean conditions as affected by N rate, timing and splitting, N form and S fertilization. Eur. J. Agron. 2005, 23, 265–278. [Google Scholar] [CrossRef]
- Holland, J.B. Genetic architecture of complex traits in plants. Plant Biol. 2007, 10, 156–161. [Google Scholar] [CrossRef]
- Jackson, P.; Robertson, M.; Cooper, M.; Hammer, G. The role of physiological understanding in plant breeding; from a breeding perspective. Field Crops Res. 1996, 49, 11–39. [Google Scholar] [CrossRef]
- Taghouti, M.; Gaboun, F.; Nsarellah, N.; Rhrib, R.; El-Haila, M.; Kamar, M.; Abbad-Andaloussi, F.; Udapa, S.M. Genotype x Envitonment interactin for quality traits in durum wheat cultivars adapted to different environments. Afr. J. Biotechnol. 2010, 9, 3054–3062. [Google Scholar]
- Flint-Garcia, S.A.; Thuillet, A.C.; Yu, J.; Pressoir, G.; Romero, S.M.; Mitchell, S.E.; Doebley, J.; Kresovich, S.; Goodman, M.M.; Buckler, E.S. Maize association population: A high-resolution platform for quantitative trait locus dissection. Plant J. 2005, 44, 1054–1064. [Google Scholar] [CrossRef]
- Bodmer, W.F. Human genetics: The molecular challenge. BioEssays: News and Reviews in Molecular. Cell. Dev. Biol. 1987, 7, 41–45. [Google Scholar] [CrossRef]
- Bar-Hen, A.; Charcosset, A.; Bourgoin, M.; Guiard, J. Relationship between genetic markers and morphological traits in a Maize inbred lines collection. Euphytica 1995, 84, 145–154. [Google Scholar] [CrossRef]
- Virk, P.S.; Ford-Lloyd, B.V.; Jackson, M.T.; Pooni, H.S.; Clemeno, T.P. Predicting quantitative variation within rice germplasm using molecular markers. Heredity 1996, 76, 296–304. [Google Scholar] [CrossRef]
- Beer, M.U.; Wood, P.J.; Weisz, J.; Fillion, N. Effect of cooking and storage on the amount and molecular weight of (1→3) (1→4)-d-glucan extracted from oat products by an in vitro digestion system. Cereal Chem. 1997, 74, 705–709. [Google Scholar] [CrossRef]
- Zondervan, K.T.; Cardon, L.R. The complex interplay among factors that influence allelic association. Nat. Rev. Genet. 2004, 5, 89–100. [Google Scholar] [CrossRef]
- Breseghello, F.; Sorrells, M.E. Association mapping of kernel size and milling quality in wheat (Triticum aestivum L.) cultivars. Genetics 2006, 172, 1165–1177. [Google Scholar] [CrossRef]
- Maccaferri, M.; Sanguineti, M.C.; Mantovani, P.; Demontis, A.; Massi, A.; Ammar, K.; Kolmer, J.A.; Czembor, J.H.; Ezrati, S.; Tuberosa, R. Association mapping of leaf rust response in durum wheat. Mol. Breed. 2010, 26, 189–228. [Google Scholar] [CrossRef]
- Marcotuli, I.; Gadaleta, A.; Mangini, G.; Signorile, A.M.; Zacheo, S.A.; Blanco, A.; Simeone, R.; Colasuonno, P. Development of a High-Density SNP-Based Linkage Map and Detection of QTL for beta-Glucans, Protein Content, Grain Yield per Spike and Heading Time in Durum Wheat. Int. J. Mol. Sci. 2017, 18, 1329. [Google Scholar] [CrossRef]
- Liu, J.; Luo, W.; Qin, N.; Ding, P.; Zhang, H.; Yang, C.; Mu, Y.; Tang, H.; Liu, Y.; Li, W.; et al. A 55 K SNP array-based genetic map and its utilization in QTL mapping for productive tiller number in common wheat. Theor. Appl. Genet. 2018, 131, 2439–2450. [Google Scholar] [CrossRef]
- Marcotuli, I.; Houston, K.; Schwerdt, J.G.; Waugh, R.; Fincher, G.B.; Burton, R.A.; Blanco, A.; Gadalena, A. Genetic Diversity and Genome Wide Association Study of beta-Glucan Content in Tetraploid Wheat Grains. PLoS ONE 2016, 11, e0152590. [Google Scholar] [CrossRef]
- Poland, J.A.; Brown, P.J.; Sorrells, M.E.; Jannink, J.L. Development of high-density genetic maps for barley and wheat using a novel two-enzyme genotyping-by-sequencing approach. PLoS ONE 2012, 7, e32253. [Google Scholar] [CrossRef]
- Somers, D.J.; Banks, T.; Depauw, R.; Fox, S.; Clarke, J.; Pozniak, C.; McCartney, C. Genome-wide linkage disequilibrium analysis in bread wheat and durum wheat. Genome 2007, 50, 557–567. [Google Scholar] [CrossRef]
- Wang, S.X.; Zhu, Y.L.; Zhang, D.X.; Shao, H.; Liu, P.; Hu, J.B.; Zhang, H.; Zhang, H.P.; Chang, C.; Lu, J.; et al. Genome-wide association study for grain yield and related traits in elite wheat varieties and advanced lines using SNP markers. PLoS ONE 2017, 12, e0188662. [Google Scholar] [CrossRef]
- Yao, J.; Wang, L.; Liu, L.; Zhao, C.; Zheng, Y. Association mapping of agronomic traits on chromosome 2A of wheat. Genetica 2009, 137, 67–75. [Google Scholar] [CrossRef]
- Li, H.; Vikram, P.; Singh, R.P.; Kilian, A.; Carling, J.; Song, J.; Burgueno-Ferreira, J.A.; Bhavani, S.; Huerta-Espino, J.; Payne, T.; et al. A high density GBS map of bread wheat and its application for dissecting complex disease resistance traits. BMC Genom. 2015, 16, 216. [Google Scholar] [CrossRef]
- Ren, R.; Ray, R.; Li, P.; Xu, J.; Zhang, M.; Liu, G.; Yao, X.; Kilian, A.; Yang, X. Construction of a high-density DArTseq SNP-based genetic map and identification of genomic regions with segregation distortion in a genetic population derived from a cross between feral and cultivated-type watermelon. Mol. Genet. Genom. 2015, 290, 1457–1470. [Google Scholar] [CrossRef] [PubMed]
- Sanchez-Sevilla, J.F.; Horvath, A.; Botella, M.A.; Gaston, A.; Folta, K.; Kilian, A.; Denoyes, B.; Amaya, I. Diversity Arrays Technology (DArT) Marker Platforms for Diversity Analysis and Linkage Mapping in a Complex Crop, the Octoploid Cultivated Strawberry (Fragaria x ananassa). PLoS ONE 2015, 10, e0144960. [Google Scholar] [CrossRef] [PubMed]
- Kilian, A.; Huttner, E.; Wenzl, P.; Jaccoud, D.; Carling, J.; Caig, V.; Evers, M.; Heller-Uszynska, K.; Cayla, C.; Patarapuwadol, S.; et al. The fast and the cheap, SNP and DArT-based whole genome profiling for crop improvement. In The Wake of the Double Helix: From the Green Revolution to the Gene Revolution, Proceedings of the International Congress Avenue Media, Bologna, Italy, 27–31 May 2005; Tuberosa, R., Phillips, R.L., Gale, M., Eds.; Avenue Media: Bologna, Italy, 2005; pp. 443–461. [Google Scholar]
- Sukumaran, S.; Reynolds, M.P.; Sansaloni, C. Genome-Wide Association Analyses Identify QTL Hotspots for Yield and Component Traits in Durum Wheat Grown under Yield Potential, Drought, and Heat Stress Environments. Front. Plant Sci. 2018, 9, 81. [Google Scholar] [CrossRef]
- Turuspekov, Y.; Baibulatova, A.; Yermekbayev, K.; Tokhetova, L.; Chudinov, V.; Sereda, G.; Ganal, M.; Griffiths, S.; Abugalieva, S. GWAS for plant growth stages and yield components in spring wheat (Triticum aestivum L.) harvested in three regions of Kazakhstan. BMC Plant Biol. 2017, 17 (Suppl. 1), 190. [Google Scholar] [CrossRef]
- Johnson, M.; Kumar, A.; Oladzad-Abbasabadi, A.; Salsman, E.; Aoun, M.; Manthey, F.A.; Elias, E.M. Association Mapping for 24 Traits Related to Protein Content, Gluten Strength, Color, Cooking, and Milling Quality Using Balanced and Unbalanced Data in Durum Wheat [Triticum turgidum L. var. durum (Desf)]. Front. Genet. 2019, 10. [Google Scholar] [CrossRef]
- Mangini, G.; Gadaleta, A.; Colasuonno, P.; Marcotuli, I.; Signorile, A.M.; Simeone, R.; De Vita, P.; Mastrangelo, A.M.; Laido, G.; Pecchioni, N.; et al. Genetic dissection of the relationships between grain yield components by genome-wide association mapping in a collection of tetraploid wheats. PLoS ONE 2018, 13, e0190162. [Google Scholar] [CrossRef]
- Mengistu, D.K.; Kidane, Y.G.; Catellani, M.; Frascaroli, E.; Fadda, C.; Pe, M.E.; Dell’Acua, M. High-density molecular characterization and association mapping in Ethiopian durum wheat landraces reveals high diversity and potential for wheat breeding. Plant Biotechnol. J. 2016, 14, 1800–1812. [Google Scholar] [CrossRef]
- Pozniak, C.J.; Knox, R.E.; Clarke, F.R.; Clarke, J.M. Identification of QTL and association of a phytoene synthase gene with endosperm colour in durum wheat. Theor. Appl. Genet. 2007, 114, 525–537. [Google Scholar] [CrossRef]
- Reimer, S.; Pozniak, C.J.; Clarke, F.R.; Clarke, J.M.; Somers, D.J.; Knox, R.E.; Singh, A.K. Association mapping of yellow pigment in an elite collection of durum wheat cultivars and breeding lines. Genome 2008, 51, 1016–1025. [Google Scholar] [CrossRef]
- Van Ginkel, M.R.; Trethowan, R.; Cukadar, B. A Guide to the CIMMY Bread Wheat Program; Wheat Special Report No 5; CIMMYT: Ciudad Obregón, Mexico, 1998. [Google Scholar]
- Zadoks, J.C.; Chang, T.T.; Konzak, C.F. A decimal code for the growth stages of cereals. Weed Res. 1974, 14, 415–421. [Google Scholar] [CrossRef]
- Henstchel, V.; Kranl, K.; Hollmann, J.; Lindhauer, M.G.; Bohm, V.; Bitsch, R. Spectrophotometric determination of yellow pigment content and evaluation of carotenoids by high-performance liquid chromatography in durum wheat grain. J. Agric. Food Chem. 2002, 50, 6663–6668. [Google Scholar]
- Martinez, C.S.; Ribotta, P.D.; León, A.E.; Añon, M.C. Colour assessment on bread wheat and triticale fresh pasta. Int. J. Food Prop. 2010, 15. [Google Scholar] [CrossRef]
- Beleggia, R.; Platani, C.; Nigro, F.; Papa, R. Yellow pigment determination for single kernels of durum wheat (Triticum durum Desf.). Cereal Chem. 2011, 88, 504–508. [Google Scholar] [CrossRef]
- Axford, D.W.E.; McDermott, E.E.; Redman, D.G. Small-scale test for breadmaking quality of wheat. Cereal Foods World 1978, 23, 477–478. [Google Scholar]
- Seabourn, B.W.; Xiao, Z.S.; Tilley, T.; Herald, T.J.; Park, S.H. A rapid, small-scale sedimentation method to predict bread-making quality of hard winter wheat. Crop Sci. 2012, 52, 1306–1315. [Google Scholar] [CrossRef]
- Williams, P.C.; Norris, K. Near Infrared Technology in the Agricultural and Food Industries, 2nd ed.; American Association of Cereal Chemistry, Inc.: St Paul, MN, USA, 2001. [Google Scholar]
- Becker, R.A.; Chambers, J.M.; Wilks, A.R. The New S Language: A Programming Environment for Data Analysis and Graphics; Wadsworth & Brooks/Cole: Pacific Grove, CA, USA, 1988. [Google Scholar]
- Kendall, M.G. A new measure of rank correlation. Biometrika 1938, 30, 81–93. [Google Scholar] [CrossRef]
- Kendall, M.G. The treatment of ties in rank problems. Biometrika 1945, 33, 239–251. [Google Scholar] [CrossRef]
- Chambers, J.M.; Freeny, A.; Heiberger, R.M. Chapter 5: Analysis of Variance; Designed Experiment. In Statistical Models in S; Chambers, J.M., Hastie, T.J., Eds.; Wadsworth & Brooks/Cole: Pacific Grove, CA, USA, 1992; pp. 145–193. [Google Scholar]
- Yu, J.; Pressoir, G.; Briggs, W.H.; Vroh Bi, I.; Yamasaki, M.; Doebley, J.F.; McMullen, M.D.; Gaut, B.S.; Nielsen, D.M.; Holland, J.B.; et al. A unified mixed-model method for association mapping that accounts for multiple levels of relatedness. Nat. Genet. 2006, 38, 203–208. [Google Scholar] [CrossRef]
- Kang, H.M.; Zaitlen, N.A.; Wade, C.M.; Kirby, A.; Heckerman, D.; Daly, M.J.; Eskin, E. Efficient control of population structure in model organism association mapping. Genetics 2008, 178, 1709–1723. [Google Scholar] [CrossRef]
- Horikoshi, M.; Tang, Y. ggfortify: Data Visualization Tools for Statistical Analysis Results. R J. 2016, 8, 474–489. [Google Scholar]
- Wickham, H. Ggplot2: Elegant Graphics for Data Analysis; Springer: New York, NY, USA, 2009. [Google Scholar]
- Marchini, J.L. Popgen: Statistical and Population Genetics. R Package Version 1.0-3. 2013. Available online: http://CRANR-projectorg/package=popgen/ (accessed on 14 January 2020).
- Endelman, J.B. Ridge regression and other kernels for genomic selection with R package rrBLUP. Plant Genome 2011, 4, 250–255. [Google Scholar] [CrossRef]
- Rosyara, U.R.; De Jong, W.S.; Douches, D.S.; Endelman, J.B. Software for Genome-Wide Association Studies in Autopolyploids and Its Application to Potato. Plant Genome 2016, 9. [Google Scholar] [CrossRef] [PubMed]
- Appels, R.; Eversole, K.; Feuillet, C.; Keller, B.; Rogers, J.; Stein, N.; Pozniak, C.J.; Choulet, F.; Distelfeld, A.; Poland, J.; et al. Shifting the limits in wheat research and breeding using a fully annotated reference genome. Science 2018, 361, eaar7191. [Google Scholar]
- Maccaferri, M.; Sanguineti, M.C.; Noli, E.; Tuberosa, R. Population structure and long-range linkage disequilibrium in a durum wheat elite collection. Mol. Breed. 2005, 15, 271–290. [Google Scholar] [CrossRef]
- Maccaferri, M.; Harris, N.S.; Twardziok, S.O.; Pasam, R.K.; Gundlach, H.; Spannagl, M.; Ormanbekova, D.; Lux, T.; Prade, V.M.; Milner, S.G.; et al. Durum wheat genome highlights past domestication signatures and future improvement targets. Nat. Genet. 2019, 51, 885–895. [Google Scholar] [CrossRef]
- Galvez, S.; Merida-Garcia, R.; Camino, C.; Borrill, P.; Abrouk, M.; Ramirez-Gonzalez, R.H.; Biyiklioglu, S.; Amil-Ruiz, F.; Dorado, G.; Budak, H.; et al. Hotspots in the genomic architecture of field drought responses in wheat as breeding targets. Funct. Integr. Genom. 2019. [Google Scholar] [CrossRef]
- Mérida-García, R.; Guozheng, L.; He, S.; González-Dugo, V.; Dorado, G.; Gálvez, S.; Solís, I.; Zarco-Tejada, P.; Reif, J.C.; Hernández, P. Genetic dissection of agronomic and quality traits based on association mapping and genomic selection approaches in durum wheat grown in Southern Spain. PLoS ONE 2019. [Google Scholar] [CrossRef]
- Ikeda, T.; Laporte, D.C. Isocitrate Dehydrogenase Kinase/Phospatase: AceK alleles that express kinase but not phosphatase activity. J. Bacteriol. 1991, 1801–1806. [Google Scholar] [CrossRef]
- Liu, P.L.; Du, L.; Huang, Y.; Gao, S.M.; Yu, M. Origin and diversification of leucine-rich repeat receptor-like protein kinase (LRR-RLK) genes in plants. BMC Evol. Biol. 2017, 17, 47. [Google Scholar] [CrossRef]
- Cassman, K.G.; Dobermann, A.; Walters, D.T.; Yang, H. Meeting cereal demand while protecting natural resources and improving environmental quality. Annu. Rev. Environ. Resour. 2003, 28, 315–358. [Google Scholar] [CrossRef]
- Araus, J.L.; Slafer, G.A.; Reynolds, M.P.; Royo, C. Plant Breeding and Drought in C3 Cereals: What Should We Breed For? Ann. Bot. 2002, 89, 925–940. [Google Scholar] [CrossRef] [PubMed]
- Ortiz, R.; Sayre, K.D.; Govaerts, B.; Gupta, R.K.; Subbarao, G.V.; Ban, T.; Hodson, D.; Dixon, J.; Ortiz-Monasterio, I.; Reynolds, M. Climate change: Can wheat beat the heat? Agric. Ecosyst. Environ. 2008, 126, 46–58. [Google Scholar] [CrossRef]
- Alonso-Blanco, C.; Aarts, M.G.; Bentsink, L.; Keurentjes, J.J.; Reymond, M.; Vreugdenhil, D.; Koornneef, M. What has natural variation taught us about plant development, physiology, and adaptation? Plant Cell 2009, 21, 1877–1896. [Google Scholar] [CrossRef] [PubMed]
- Amaya, A.; Peña, R.J. Utilization and quality of durum wheat. In Durum Wheats: Challenges and Opportunities; Rajaram, S., Saari, E.E., Hettel, G.P., Eds.; Wheat Special Report; CIMMYT: Ciudad Obregón, Mexico, 1992. [Google Scholar]
- Maccaferri, M.; Sanguineti, M.C.; Corneti, S.; Ortega, J.L.A.; Salem, M.B.; Bort, J.; DeAmbrogio, E.; García del Moral, L.F.; Demontis, A.; El-Ahmed, A.; et al. Quantitative trait loci for grain yield and adaptation of durum wheat (Triticum durum Desf.) across a wide range of water availability. Genetics 2008, 178, 489–511. [Google Scholar] [CrossRef]
- Groos, C.; Robert, N.; Bervas, E.; Charmet, G. Genetic analysis of grain protein-content, grain yield and thousand-kernel weight in bread wheat. Theor. Appl. Genet. 2003, 106, 1032–1040. [Google Scholar] [CrossRef]
- Sen, C.; Toms, B. Character association and component analysis in wheat (Triticum aestivum L.). Crop. Res. 2007, 34, 166–170. [Google Scholar]
- Shamsi, K.; Petrosyan, M.; Noor-mohammadi, G.; Haghparast, A.; Kobrace, S.; Rasekhi, B. Differential agronomic responses of bread wheat cultivars to drought stress in the west of Iran. Afr. J. Biotechnol. 2011, 10, 2708–2715. [Google Scholar]
- Blanco, A.; de Giovanni, C.; Laddomada, B.; Sciancalepore, A.; Simeone, R.; Devos, K.M.; Gale, M.D. Quantitative trait loci influencing grain protein content in tetraploid wheats. Plant Breed. 1996, 115, 310–316. [Google Scholar] [CrossRef]
- Blanco, A.; Bellomo, M.P.; Cenci, A.; De Giovanni, C.; D’Ovidio, R.; Iacono, E.; Laddomada, B.; Pagnotta, M.A.; Porceddu, E.; Sciancalepore, A.; et al. A genetic linkage map of durum wheat. Theor. Appl. Genet. 1998, 97, 721–728. [Google Scholar] [CrossRef]
- Pasha, I.; Anjum, F.M.; Butt, M.S.; Sultan, J.I. Gluten quality prediction and correlation studies in spring wheats. J. Food Qual. 2007, 30, 438–449. [Google Scholar] [CrossRef]
- Shewry, P.R.; Tatham, A.S. Wheat. In The Royal Society of Chemistry; Elsevier Science B.V.: Amsterdam, The Netherlands, 2000; pp. 335–339. [Google Scholar]
- Oelofse, R.M.; Labuschagne, M.T.; van Deventer, C.S. Influencing factors of sodium dodecyl sulfate sedimentation in bread wheat. J. Cereal Sci. 2010, 52, 96–99. [Google Scholar] [CrossRef]
- Cubadda, R.E.; Carcea, M.; Marconi, E.; Trivisonno, M.C. Influence of protein content on durum wheat gluten strength determined by the SDS sedimentation test and by other methods. Cereal Foods World 2007, 52, 273–277. [Google Scholar] [CrossRef]
- Carter, B.P.; Morris, C.F.; Anderson, J.A. Optimizing the SDS sedimentation test for end-use quality selection in a soft white and club wheat-breeding program. Cereal Chem. 1999, 76, 907–911. [Google Scholar] [CrossRef]
- De Villiers, O.T.; Laubscher, E.W. Use of the SDSS test to predict the protein content and bread volume of wheat cultivars. S. Afr. J. Plant Soil 1995, 12, 140–142. [Google Scholar] [CrossRef]
- Pogna, N.E.; Autran, J.C.; Mellini, F.; Lafiandra, D.; Feillet, P. Chromosome 1B-encoded gliadins and glutenins subunits. J. Cereal Sci. 1990, 11, 15–34. [Google Scholar] [CrossRef]
- Reif, J.C.; Gowda, M.; Maurer, H.P.; Longin, C.F.; Korzun, V.; Ebmeyer, E.; Bothe, R.; Pietsch, C.; Wurschum, T. Association mapping for quality traits in soft winter wheat. Theor. Appl. Genet. 2010, 122, 961–970. [Google Scholar] [CrossRef]
- Fiedler, J.D.; Salsman, E.; Liu, Y.; Michalak de Jimenez, M.; Hegstad, J.B.; Chen, B.; Manthey, F.A.; Chao, S.; Xu, S.; Elias, E.M.; et al. Genome-Wide Association and Prediction of Grain and Semolina Quality Traits in Durum Wheat Breeding Populations. Plant Genome 2017, 10. [Google Scholar] [CrossRef]
- Sykes, A.G. Plastocyanin and the Blue Copper Proteins. In Long-Range Electron Transfer in Biology. Structure and Bonding; Springer: Berlin/Heidelberg, Germany, 1990; pp. 175–224. [Google Scholar] [CrossRef]
- Feng, H.; Zhang, Q.; Wang, Q.; Wang, X.; Liu, J.; Li, M.; Huang, L.; Kang, Z. Target of tae-miR408, a chemocyanin-like protein gene (TaCLP1), plays positive roles in wheat response to high-salinity, heavy cupric stress and stripe rust. Plant Mol. Biol. 2013, 83, 433–443. [Google Scholar] [CrossRef]
- Yao, Z.J.; Lin, R.M.; Xu, S.C.; Li, Z.F.; Wan, A.M.; Ma, Z.Y. The molecular tagging of the yellow rust resistance gene Yr7 in wheat transferred from differential host Lee using microsatellite markers. Sci. Agric. Sin. 2006, 39, 1146–1152. [Google Scholar]
- Zhao, X.Y.; Hong, P.; Wu, J.Y.; Chen, X.B.; Ye, X.G.; Pan, Y.Y.; Wang, J.; Zhang, X.S. The tae-miR408-Mediated Control of TaTOC1 Genes Transcription Is Required for the Regulation of Heading Time in Wheat. Plant Physiol. 2016, 170, 1578–1594. [Google Scholar] [CrossRef]
- Liu, G.; Zhao, Y.; Gowda, M.; Longin, C.F.H.; Reif, J.C.; Mette, M.F. Predicting hybrid performances for quality traits through genomic-assisted approaches in central European wheat. PLoS ONE 2016, 11, e0158635. [Google Scholar] [CrossRef] [PubMed]
- Maccaferri, M.; Zhang, J.; Bulli, P.; Abate, Z.; Chao, S.; Cantu, D.; Bossolini, E.; Chen, X.; Pumphrey, M.; Dubcovsky, J. A genome-wide association study of resistance to stripe rust (Puccinia striiformis f. sp. tritici) in a worldwide collection of hexaploid spring wheat (Triticum aestivum L.). G3 Genes Genomes Genet. 2015, 5, 449–465. [Google Scholar] [CrossRef]
- Liu, W.; Maccaferri, M.; Rynearson, S.; Letta, T.; Zegeye, H.; Tuberosa, R.; Chen, X.; Pumphrey, M. Novel Sources of Stripe Rust Resistance Identified by Genome-Wide Association Mapping in Ethiopian Durum Wheat (Triticum turgidum ssp. durum). Front. Plant Sci. 2017, 8, 774. [Google Scholar] [CrossRef] [PubMed]
- Godoy, J.G.; Rynearson, S.; Chen, X.; Pumphrey, M. Genome-Wide Association Mapping of Loci for Resistance to Stripe Rust in North American Elite Spring Wheat Germplasm. Phytopathology 2018, 108, 234–245. [Google Scholar] [CrossRef]
- Liu, W.; Naruoka, Y.; Miller, K.; Garland-Campbell, K.A.; Carter, A.H. Characterizing and Validating Stripe Rust Resistance Loci in US Pacific Northwest Winter Wheat Accessions (Triticum aestivum L.) by Genome-wide Association and Linkage Mapping. Plant Genome 2018, 11. [Google Scholar] [CrossRef]
- Lemoine, R. Sucrose transporters in plants: Update on function and structure. Biochim. Biophys. Acta 1999, 1465, 246–262. [Google Scholar] [CrossRef]
- Koch, K.E. Carbohydrate-modulated gene expression in plants. Annu. Rev. Plant Physiol. Plant Mole Biol. 1996, 47, 509–540. [Google Scholar] [CrossRef]
- Smeekens, S.; Rook, F. Sugar sensing and sugar-mediated signal transduction in plants. Plant Physiol 1997, 115, 7–13. [Google Scholar] [CrossRef]
- Sun, X.-Y.; Wu, K.; Zhao, Y.; Kong, F.-M.; Han, G.-Z.; Jiang, H.-M.; Huang, X.-J.; Li, R.-J.; Wang, H.-G.; Li, S.-S. QTL analysis of kernel shape and weight using recombinant inbred lines in wheat. Euphytica 2008, 165, 615–624. [Google Scholar] [CrossRef]
- Patil, R.M.; Tamhankar, S.A.; Oak, M.D.; Raut, A.L.; Honrao, B.K.; Rao, V.S.; Misra, S.C. Mapping of QTL for agronomic traits and kernel characters in durum wheat (Triticum durum Desf.). Euphytica 2013, 190, 117–129. [Google Scholar] [CrossRef]
- Cui, F.; Fan, X.; Chen, M.; Zhang, N.; Zhao, C.; Zhang, W.; Han, J.; Ji, J.; Zhao, X.; Yang, L.; et al. QTL detection for wheat kernel size and quality and the responses of these traits to low nitrogen stress. Theor. Appl. Genet. 2016, 129, 469–484. [Google Scholar] [CrossRef] [PubMed]
- Juliana, P.; Poland, J.A.; Huerta-Espino, J.; Shrestha, S.; Crossa, J.; Crespo-Herrera, L.; Henrique Toledo, F.; Govidan, V.; Mondal, S.; Kumar, U.; et al. Improving grain yield, stress resilience and quality of bread wheat using large-scale genomics. Nat. Genet. 2019. [Google Scholar] [CrossRef] [PubMed]
- Hu, C.H.; Wei, X.Y.; Yuan, B.; Yao, L.B.; Ma, T.T.; Zhang, P.P.; Wang, X.; Wang, P.Q.; Liu, W.T.; Li, W.Q.; et al. Genome-Wide Identification and Functional Analysis of NADPH Oxidase Family Genes in Wheat During Development and Environmental Stress Responses. Front. Plant Sci. 2018, 9, 906. [Google Scholar] [CrossRef] [PubMed]
- Kaya, H.; Nakajima, R.; Iwano, M.; Kanaoka, M.M.; Kimura, S.; Takeda, S.; Kawarazaki, T.; Senzaki, E.; Hamamura, Y.; Higashiyama, T.; et al. Ca2+-activated reactive oxygen species production by Arabidopsis RbohH and RbohJ is essential for proper pollen tube tip growth. Plant Cell 2014, 26, 1069–1080. [Google Scholar] [CrossRef]
- Gupta, D.K.; Pena, L.B.; Romero-Puertas, M.C.; Hernández, A.; Inouhe, M.; Sandalio, L.M. NADPH oxidases differentially regulate ROS metabolism and nutrient uptake under cadmium toxicity. Plant Cell Environ. 2017, 40, 509–526. [Google Scholar] [CrossRef]
- Fu, W.; Shen, Y.; Hao, J.; Wu, J.; Ke, L.; Wu, C.; Huang, K.; Luo, B.; Xu, M.; Cheng, X.; et al. Acyl-CoA N-acyltransferase influences fertility by regulating lipid metabolism and jasmonic acid biogenesis in cotton. Sci. Rep. 2015, 5, 11790. [Google Scholar] [CrossRef]
- Sui, N.; Li, M.; Meng, Q.-W.; Tian, J.-C.; Zhao, S.-J. Photosynthetic Characteristics of a Super High Yield Cultivar of Winter Wheat During Late Growth Period. Agric. Sci. China 2010, 9, 346–354. [Google Scholar] [CrossRef]


| Wheat Panel | No. of Assessed Lines | Field Season | |||
|---|---|---|---|---|---|
| 2012 | 2013 | 2014 | 2015 | ||
| 1 | 98 | YAQ-FI | |||
| 2 | 97 | YAQ-FI | YAQ-FI | ||
| YAQ-RI | |||||
| 3 | 98 | YAQ-FI | YAQ-FI | YAQ-FI | |
| YAQ-RI | YAQ-RI | ||||
| DArT Markers | SNP Markers | |||||||
|---|---|---|---|---|---|---|---|---|
| Chr | A | B | Un | Total 1 | A | B | Un | Total 1 |
| 1 | 377 | 866 | 37 | 1280 | 193 | 444 | 16 | 653 |
| 2 | 563 | 791 | 69 | 1423 | 320 | 375 | 19 | 714 |
| 3 | 496 | 818 | 33 | 1347 | 250 | 352 | 11 | 613 |
| 4 | 585 | 325 | 10 | 920 | 283 | 171 | 4 | 458 |
| 5 | 312 | 725 | 13 | 1050 | 162 | 376 | 2 | 540 |
| 6 | 449 | 690 | 21 | 1160 | 262 | 308 | 5 | 575 |
| 7 | 623 | 573 | 35 | 1231 | 293 | 287 | 9 | 589 |
| Total 2 | 3405 | 4788 | 218 | 8411 | 1763 | 2313 | 66 | 4142 |
| Un | 6177 | 1574 | ||||||
| Total | 14,588 | 5716 | ||||||
| ANOVA | |||||||||||||||
|---|---|---|---|---|---|---|---|---|---|---|---|---|---|---|---|
| Min 1 | Mean 2 | Max 3 | Df | Sum Sq | Mean Sq | F Value | Pr (>F) | Significance | h2 | Mean Across Years | |||||
| Panel | 1 | 2 | 2 | 3 | 3 | ||||||||||
| Water regimes | FI | FI | RI | FI | RI | ||||||||||
| DTH (days) | 63 | 79.38 | 94 | 1 | 1.8 | 1.768 | 0.24 | 0.626 | *** | 0.14 | 87.55 | 83.73 | 72.54 | 81.95 | 70.51 |
| PH (cm) | 39 | 81.97 | 110 | 1 | 167.5 | 167.51 | 8.025 | 6.59 × 10−03 | ** | 0.16 | 92.98 | 93.31 | 62.58 | 89.32 | 63.74 |
| GY (ton/ha) | 1.35 | 5.68 | 10.63 | 1 | 24.52 | 24.516 | 121.6 | 4.16 × 10⁻¹⁵ | *** | 0.44 | 10 | 7 | 2.03 | 6 | 2.33 |
| TKW (g) | 29.6 | 44.69 | 63.2 | 1 | 38.6 | 38.65 | 2.064 | 1.57 × 10−01 | 0.41 | 49.25 | 47.58 | 37.29 | 47.06 | 40.22 | |
| YR | 0 | 2.286 | 40 | 1 | 358.5 | 358.5 | 6.702 | 1.25 × 10−02 | * | 0.00 | 4.77 | 3.98 | 0 | 0 | 0 |
| LOD (%) | 0 | 2.142 | 90 | 1 | 0 | 0 | - | - | - | 0.01 | 0.1 | 0 | 0 | 9.25 | 0 |
| YC | 14.6 | 16.59 | 20 | 1 | 0.008 | 0.0085 | 0.02 | 8.89 × 10−01 | 0.59 | 17.21 | 17.09 | - | 16.35 | - | |
| SV (ml) | 7 | 10.51 | 14.5 | 1 | 2.54 | 2.536 | 2.388 | 0.128 | 0.57 | 10.87 | 10.14 | - | 10.36 | - | |
| SDS | 0.54 | 0.854 | 1.19 | 1 | 0.0927 | 0.09268 | 14.86 | 3.25 × 10−04 | *** | 0.55 | 1 | 1 | - | 1 | - |
| GPC (%) | 10.4 | 12.33 | 14.9 | 1 | 5.965 | 5.965 | 16.41 | 1.74 × 10−04 | *** | 0.31 | 11.67 | 12.38 | - | 12.12 | - |
| Trait | Threshold | Marker | Chromosome | Pos (cM) | −log10 (p-Value) | Marker Effect | Mapping in Pseudomolecule | Physical Pos (bp) 1 | Mapping in Durum | Physical Pos (bp) 2 |
|---|---|---|---|---|---|---|---|---|---|---|
| SV | 5.09 | SNP620 | 1B | 139.21 | 5.5 | 1.26 | 1B | 555,056,387 | 1B | 547,593,323 |
| TKW | 5.71 | DArT3154 | 2A | 60.5 | 6.42 | 3.21 | 2A | 533,610,520 | 2A | 527,494,277 |
| TKW | 5.71 | DArT3155 | 2A | 60.5 | 6.11 | −3.1 | 2A | 174,036,184 | 2A | 171,903,830 |
| TKW | 5.71 | DArT3156 | 2A | 60.5 | 7.28 | −3.41 | 1B | 134,638,820 | 1B | 127,479,665 |
| TKW | 5.09 | SNP1153 | 2A | 68.47 | 5.38 | −2.84 | 2A | 582,636,674 | 2A | 480,204,288 |
| TKW | 5.71 | DArT3119 | 2A | 68.91 | 6.77 | −3.29 | 2A | 536,825,718 | 2A | 530,570,836 |
| TKW | 5.71 | DArT3145 | 2A | 69.27 | 7.1 | 3.43 | 2A | 581,794,741 | 2A | 550,694,987 |
| TKW | 5.71 | DArT3146 | 2A | 69.27 | 6.99 | 3.43 | 2A | 566,208,089 | 2A | 559,043,176 |
| TKW | 5.71 | DArT3150 | 2A | 69.42 | 7.23 | 3.4 | 2A | 541,302,108 | 2A | 535,046,952 |
| TKW | 5.71 | DArT3162 | 2A | 70.06 | 6.71 | 3.31 | 2A | 535,235,854 | 2A | 529,032,623 |
| TKW | 5.09 | SNP1183 | 2A | 70.31 | 6.45 | −3.15 | 2A | 541,200,911 | 2A | 534,959,463 |
| TKW | 5.09 | SNP1184 | 2A | 70.31 | 6.79 | −3.19 | 2A | 541,391,854 | 2A | 535,114,521 |
| TKW | 5.09 | SNP1185 | 2A | 70.31 | 5.45 | −2.86 | 2A | 532,153,681 | 2A | 526,046,873 |
| TKW | 5.71 | DArT3165 | 2A | 70.31 | 7.17 | 3.46 | 2A | 541,391,851 | 2A | 534,959,463 |
| TKW | 5.71 | DArT3169 | 2A | 70.53 | 7 | 3.42 | 2B | 477,405,138 | 2A | 534,564,999 |
| TKW | 5.09 | SNP1189 | 2A | 70.84 | 6.46 | −3.16 | 2A | 542,687,204 | 2A | 536,453,217 |
| TKW | 5.71 | DArT3172 | 2A | 70.96 | 5.91 | 3.13 | 2A | 567,734,347 | 2A | 557,502,938 |
| TKW | 5.71 | DArT3174 | 2A | 71.04 | 6.7 | 3.37 | 2A | 566,457,122 | 2A | 558,803,456 |
| TKW | 5.71 | DArT3175 | 2A | 71.14 | 6.13 | 3.2 | 2A | 544,391,768 | 2A | 538,104,252 |
| TKW | 5.71 | DArT3176 | 2A | 71.14 | 6.07 | −3.17 | 2A | 546,445,797 | 2A | 540,140,599 |
| TKW | 5.71 | DArT3180 | 2A | 71.38 | 7.03 | 3.43 | 2A | 567,736,123 | 2A | 557,501,162 |
| TKW | 5.71 | DArT3181 | 2A | 71.38 | 6.2 | 3.2 | 2A | 582,287,689 | 2A | 551,184,512 |
| TKW | 5.71 | DArT3182 | 2A | 71.38 | 6.41 | 3.27 | 2A | 569,404,524 | 2A | 555,838,382 |
| TKW | 5.09 | SNP1198 | 2A | 71.64 | 6.39 | 3.09 | 2A | 572,356,489 | 2A | 552,887,972 |
| TKW | 5.09 | SNP1199 | 2A | 71.75 | 5.75 | 2.97 | 2A | 567,787,911 | 2A | 557,449,430 |
| TKW | 5.71 | DArT3187 | 2A | 71.94 | 7.07 | 3.35 | 2A | 541,302,102 | 2A | 535,046,946 |
| TKW | 5.71 | DArT3198 | 2A | 72.36 | 6.47 | 3.24 | 2A | 535,235,860 | 2A | 529,032,620 |
| TKW | 5.71 | DArT3201 | 2A | 72.56 | 6.19 | 3.12 | 2A | 569,404,462 | 2A | 555,838,444 |
| TKW | 5.71 | DArT10906 | - | - | 6.16 | −3.16 | 2A | 566,964,200 | 2A | 558,292,372 |
| TKW | 5.09 | SNP8395 | - | - | 6.41 | −2.85 | 2A | 532,853,960 | 2A | 526,751,856 |
| TKW | 5.71 | DArT20759 | - | - | 7.23 | 3.4 | 2A | 541,302,217 | 2A | 535,047,061 |
| TKW | 5.71 | DArT20961 | - | - | 7.17 | 3.46 | 2A | 532,080,607 | 2A | 525,972,283 |
| TKW | 5.71 | DArT21317 | - | - | 6.06 | 3.18 | 2A | 568,431,288 | 2A | 556,806,491 |
| TKW | 5.71 | DArT21609 | - | - | 7.04 | −3.36 | - | - | - | - |
| TKW | 5.71 | DArT21773 | - | - | 6.34 | −3.17 | - | - | - | - |
| TKW | 5.71 | DArT21834 | - | - | 6.35 | −3.28 | 2A | 546,445,800 | 2A | 540,140,602 |
| TKW | 5.71 | DArT22064 | - | - | 6.75 | −3.39 | - | - | 2A | 549,657,924 |
| Marker | Identity | Transcript | Chr | Physical Position | Distance | Description |
|---|---|---|---|---|---|---|
| DArT3156 | 88.525 | TraesCS1B01G193400LC.1 | 1B | 134,604,832 | −33,988 | LINE-1 reverse transcriptase-like protein |
| TraesCS1B01G193500LC.1 | 1B | 134,605,786 | −33,034 | Retrotransposon protein. putative. unclassified | ||
| TraesCS1B01G193600LC.1 | 1B | 134,607,645 | −31,175 | Retrotransposon protein. putative. unclassified | ||
| TraesCS1B01G193700LC.1 | 1B | 134,621,105 | −17,715 | Retrotransposon protein. putative. unclassified | ||
| TraesCS1B01G193800LC.1 | 1B | 134,622,150 | −16,670 | Solute carrier organic anion transporter family member 2B1 | ||
| TraesCS1B01G193900LC.1 | 1B | 134,622,613 | −16,207 | Tetratricopeptide repeat (TPR)-like superfamily protein | ||
| TraesCS1B01G194000LC.1 | 1B | 134,632,362 | −6458 | RNA-directed DNA polymerase (reverse transcriptase)-related family protein | ||
| TraesCS1B01G194100LC.1 | 1B | 134,633,505 | −5315 | LINE-1 reverse transcriptase like | ||
| TraesCS1B01G194200LC.1 | 1B | 134,639,730 | 910 | Transposon Ty3-G Gag-Pol polyprotein | ||
| TraesCS1B01G114900.1 | 1B | 134,645,780 | 6960 | F-box protein | ||
| TraesCS1B01G194300LC.1 | 1B | 134,648,368 | 9548 | Sister chromatid cohesion protein PDS5 homolog B-B | ||
| TraesCS1B01G194400LC.1 | 1B | 134,649,000 | 10,180 | BTB/POZ domain containing protein. expressed | ||
| DArT21834 | 100 | TraesCS1B01G231000LC.1 | 1B | 176,756,965 | −3171 | Retrotransposon protein. putative. LINE subclass |
| TraesCS1B01G137700.1 | 1B | 176,783,830 | 23,694 | Phototropic-responsive NPH3 family protein | ||
| TraesCS1B01G137700.2 | 1B | 176,783,926 | 23,790 | Phototropic-responsive NPH3 family protein | ||
| TraesCS1B01G231100LC.1 | 1B | 176,788,566 | 28,430 | Disease resistance protein (TIR-NBS-LRR class) family | ||
| TraesCS1B01G231200LC.1 | 1B | 176,790,108 | 29,972 | Transposon protein. putative. Mutator sub-class | ||
| TraesCS1B01G231300LC.1 | 1B | 176,790,698 | 30,562 | Transposon protein. putative. mutator sub-class | ||
| TraesCS1B01G231400LC.1 | 1B | 176,791,607 | 31,471 | Sterile alpha motif (SAM) domain-containing protein | ||
| TraesCS1B01G137800.1 | 1B | 176,793,792 | 33,656 | GRF zinc finger family protein. expressed | ||
| TraesCS1B01G231500LC.1 | 1B | 176,803,822 | 43,686 | Retrotransposon protein. putative. unclassified | ||
| SNP620 | 100 | TraesCS1B01G568300LC.1 | 1B | 555,010,255 | −46,132 | Blue copper protein |
| TraesCS1B01G328400.1 | 1B | 555,018,059 | −38,328 | Blue copper protein | ||
| TraesCS1B01G328500.1 | 1B | 555,029,816 | −26,571 | Blue copper protein | ||
| TraesCS1B01G568400LC.1 | 1B | 555,056,445 | 58 | Ubiquinone biosynthesis O-methyltransferase | ||
| TraesCS1B01G328600.1 | 1B | 555,057,325 | 938 | Blue copper protein | ||
| TraesCS1B01G568500LC.1 | 1B | 555,060,627 | 4240 | Blue copper protein | ||
| TraesCS1B01G328700.1 | 1B | 555,063,537 | 7150 | Blue copper protein | ||
| TraesCS1B01G328800.1 | 1B | 555,065,987 | 9600 | Blue copper protein | ||
| TraesCS1B01G328900.1 | 1B | 555,068,889 | 12,502 | Blue copper protein | ||
| TraesCS1B01G329000.1 | 1B | 555,071,391 | 15,004 | Blue copper protein | ||
| TraesCS1B01G568600LC.1 | 1B | 555,076,734 | 20,347 | Blue copper protein | ||
| TraesCS1B01G329100.1 | 1B | 555,088,083 | 31,696 | Blue copper protein | ||
| TraesCS1B01G329200.1 | 1B | 555,090,695 | 34,308 | Blue copper protein | ||
| TraesCS1B01G568700LC.1 | 1B | 555,095,491 | 39,104 | purple acid phosphatase 23 | ||
| TraesCS1B01G568800LC.1 | 1B | 555,096,179 | 39,792 | Disease resistance protein (TIR-NBS-LRR class) family | ||
| TraesCS1B01G568900LC.1 | 1B | 555,097,247 | 40,860 | Retrotransposon protein. putative. Ty3-gypsy subclass | ||
| TraesCS1B01G569000LC.1 | 1B | 555,098,272 | 41,885 | Retrotransposon protein. putative. Ty3-gypsy subclass | ||
| TraesCS1B01G569100LC.1 | 1B | 555,101,471 | 45,084 | 50S ribosomal protein L2 | ||
| TraesCS1B01G569200LC.1 | 1B | 555,103,053 | 46,666 | LINE-1 reverse transcriptase like | ||
| DArT3155 | 93.939 | TraesCS2A01G213400LC.1 | 2A | 174,011,203 | −24,981 | Retrotransposon protein. putative. unclassified. expressed |
| TraesCS2A01G213500LC.1 | 2A | 174,024,497 | −11,687 | APOLLO | ||
| TraesCS2A01G201000.1 | 2A | 174,026,194 | −9990 | Cytochrome P450-like | ||
| TraesCS2A01G213600LC.1 | 2A | 174,034,039 | −2145 | Retrotransposon protein. putative. unclassified. expressed | ||
| TraesCS2A01G213700LC.1 | 2A | 174,039,127 | 2943 | Cytochrome P450 | ||
| SNP1153 | 98.551 | TraesCS2A01G493000LC.1 | 2A | 582,628,952 | −7722 | Retrotransposon protein. putative. Ty3-gypsy subclass |
| TraesCS2A01G493100LC.1 | 2A | 582,629,900 | −6774 | Retrovirus-related Pol polyprotein from transposon gypsy | ||
| TraesCS2A01G493200LC.1 | 2A | 582,630,406 | −6268 | Retrotransposon protein. putative. unclassified | ||
| TraesCS2A01G493300LC.1 | 2A | 582,630,979 | −5695 | Retrotransposon protein. putative. Ty3-gypsy subclass | ||
| TraesCS2A01G344800.1 | 2A | 582,634,003 | −2671 | RAN guanine nucleotide release factor | ||
| TraesCS2A01G344900.1 | 2A | 582,637,903 | 1229 | Nucleosome assembly protein 1-like 1 | ||
| DArT3119 | 95.652 | TraesCS2A01G457700LC.1 | 2A | 536,796,624 | −29,094 | Retrovirus-related Pol polyprotein LINE-1 |
| DArT3146 | 100 | TraesCS2A01G333200.1 | 2A | 566,207,430 | −659 | Kinesin-like protein |
| TraesCS2A01G333200.2 | 2A | 566,209,291 | 1202 | Kinesin-like protein | ||
| DArT3150 | 100 | TraesCS2A01G460800LC.1 | 2A | 541,301,644 | −464 | 1-phosphatidylinositol-3-phosphate 5-kinase FAB1A |
| DArT3162 | 100 | TraesCS2A01G457200LC.1 | 2A | 535,217,367 | −18,487 | Acetylglutamate kinase-like protein |
| TraesCS2A01G457300LC.1 | 2A | 535,221,879 | −13,975 | LINE-1 reverse transcriptase like | ||
| TraesCS2A01G457400LC.1 | 2A | 535,222,237 | −13,617 | LINE-1 reverse transcriptase | ||
| TraesCS2A01G311500.1 | 2A | 535,240,748 | 4894 | NAC domain protein. | ||
| SNP1183 | 100 | TraesCS2A01G460600LC.1 | 2A | 541,195,856 | −5055 | Reductase 1 |
| TraesCS2A01G315500.1 | 2A | 541,197,465 | −3446 | Reductase 1 | ||
| TraesCS2A01G460700LC.1 | 2A | 541,198,542 | −2369 | NADH dehydrogenase [ubiquinone] iron-sulfur protein 3. mitochondrial | ||
| TraesCS2A01G315600.1 | 2A | 541,200,447 | −464 | Reductase 1 | ||
| SNP1184 | 100 | TraesCS2A01G460900LC.1 | 2A | 541,386,879 | −4975 | Serine-type endopeptidase inhibitor. putative |
| TraesCS2A01G461000LC.1 | 2A | 541,387,542 | −4312 | Aldose reductase | ||
| TraesCS2A01G315700.1 | 2A | 541,391,385 | −469 | Reductase 1 | ||
| DArT3165 | 98.246 | TraesCS2A01G460600LC.1 | 2A | 541,195,856 | −5055 | Reductase 1 |
| TraesCS2A01G315500.1 | 2A | 541,197,465 | −3446 | Reductase 1 | ||
| TraesCS2A01G460700LC.1 | 2A | 541,198,542 | −2369 | NADH dehydrogenase [ubiquinone] iron-sulfur protein 3. mitochondrial | ||
| TraesCS2A01G315600.1 | 2A | 541,200,447 | −464 | Reductase 1 | ||
| TraesCS2A01G460900LC.1 | 2A | 541,386,879 | −4972 | Serine-type endopeptidase inhibitor. putative | ||
| TraesCS2A01G461000LC.1 | 2A | 541,387,542 | −4309 | Aldose reductase | ||
| TraesCS2A01G315700.1 | 2A | 541,391,385 | −466 | Reductase 1 | ||
| SNP1189 | 100 | TraesCS2A01G316900.1 | 2A | 542,642,276 | −44,928 | Phosphate carrier protein. mitochondrial |
| TraesCS2A01G317000.1 | 2A | 542,648,355 | −38,849 | Zeaxanthin epoxidase. chloroplastic | ||
| TraesCS2A01G317000.2 | 2A | 542,649,684 | −37,520 | Zeaxanthin epoxidase. chloroplastic | ||
| TraesCS2A01G317000.3 | 2A | 542,650,147 | −37,057 | Zeaxanthin epoxidase. chloroplastic | ||
| TraesCS2A01G462000LC.1 | 2A | 542,652,662 | −34,542 | AUGMIN subunit 6 | ||
| TraesCS2A01G317100.1 | 2A | 542,654,847 | −32,357 | Mitochondrial carrier protein | ||
| TraesCS2A01G317200.1 | 2A | 542,658,154 | −29,050 | Phosphatase 2C family protein | ||
| TraesCS2A01G317300.1 | 2A | 542,686,655 | −549 | transmembrane protein | ||
| DArT3172 | 100 | TraesCS2A01G333900.1 | 2A | 567,725,771 | −8576 | RNA-dependent RNA polymerase |
| TraesCS2A01G334000.1 | 2A | 567,735,196 | 849 | MLP protein | ||
| DArT3174 | 100 | TraesCS2A01G333300.1 | 2A | 566,454,172 | −2950 | F-box/RNI-like superfamily protein |
| TraesCS2A01G481800LC.1 | 2A | 566,461,411 | 4289 | Transposon Ty3-G Gag-Pol polyprotein | ||
| TraesCS2A01G481900LC.1 | 2A | 566,462,897 | 5775 | Craniofacial development protein 2 | ||
| TraesCS2A01G482000LC.1 | 2A | 566,478,234 | 21,112 | Retrotransposon protein. putative. unclassified | ||
| DArT3175 | 100 | TraesCS2A01G319300.1 | 2A | 544,359,272 | −32,496 | target of AVRB operation1 |
| TraesCS2A01G464000LC.1 | 2A | 544,395,881 | 4113 | Retrotransposon protein. putative. unclassified | ||
| DArT3176 | 98.182 | TraesCS2A01G464500LC.1 | 2A | 546,477,078 | 31,281 | Transposon Ty3-I Gag-Pol polyprotein |
| TraesCS2A01G464600LC.1 | 2A | 546,478,437 | 32,640 | Transposon Ty3-I Gag-Pol polyprotein | ||
| TraesCS2A01G464700LC.1 | 2A | 546,479,163 | 33,366 | Transposon Ty3-I Gag-Pol polyprotein | ||
| DArT3180 | 100 | TraesCS2A01G333900.1 | 2A | 567,725,771 | −10,352 | RNA-dependent RNA polymerase |
| TraesCS2A01G334000.1 | 2A | 567,735,196 | −927 | MLP protein | ||
| DArT3182 | 100 | TraesCS2A01G483800LC.1 | 2A | 569,357,751 | −46,773 | autoinhibited Ca(2+)-ATPase. isoform 4 |
| TraesCS2A01G335600.1 | 2A | 569,363,189 | −41,335 | Zinc finger family protein | ||
| DArT3187 | 98.551 | TraesCS2A01G460800LC.1 | 2A | 541,301,644 | −458 | 1-phosphatidylinositol-3-phosphate 5-kinase FAB1A |
| DArT3198 | 98.305 | TraesCS2A01G457200LC.1 | 2A | 535,217,367 | −18,493 | Acetylglutamate kinase-like protein |
| TraesCS2A01G457300LC.1 | 2A | 535,221,879 | −13,981 | LINE-1 reverse transcriptase like | ||
| TraesCS2A01G457400LC.1 | 2A | 535,222,237 | −13,623 | LINE-1 reverse transcriptase | ||
| TraesCS2A01G311500.1 | 2A | 535,240,748 | 4888 | NAC domain protein. | ||
| DArT3201 | 100 | TraesCS2A01G483800LC.1 | 2A | 569,357,751 | −46,711 | autoinhibited Ca(2+)-ATPase. isoform 4 |
| TraesCS2A01G335600.1 | 2A | 569,363,189 | −41,273 | Zinc finger family protein | ||
| DArT10906 | 98.551 | TraesCS2A01G482500LC.1 | 2A | 566,976,225 | 12,025 | RNA-directed DNA polymerase (Reverse transcriptase) |
| TraesCS2A01G333600.1 | 2A | 566,986,482 | 22,282 | Gibberellin-regulated protein 2 | ||
| SNP8395 | 96.296 | TraesCS2A01G309400.1 | 2A | 532,849,120 | −4840 | Pentatricopeptide repeat-containing protein |
| TraesCS2A01G309500.1 | 2A | 532,854,936 | 976 | Smr domain containing protein | ||
| TraesCS2A01G309600.1 | 2A | 532,859,077 | 5117 | Acyl-CoA N-acyltransferase isoform 2 | ||
| TraesCS2A01G309600.2 | 2A | 532,859,077 | 5117 | Acyl-CoA N-acyltransferase isoform 2 | ||
| TraesCS2A01G309700.1 | 2A | 532,865,797 | 11,837 | Response regulator | ||
| DArT20759 | 97.619 | TraesCS2A01G460800LC.1 | 2A | 541,301,644 | −573 | 1-phosphatidylinositol-3-phosphate 5-kinase FAB1A |
| DArT20961 | 100 | TraesCS2A01G308900.1 | 2A | 532,040,483 | −40,124 | Translocase of chloroplast |
| TraesCS2A01G309000.1 | 2A | 532,077,143 | −3464 | GTPase Der | ||
| TraesCS2A01G309100.1 | 2A | 532,085,578 | 4971 | Protein NRT1/PTR FAMILY 1.1 | ||
| TraesCS2A01G309100.2 | 2A | 532,085,909 | 5302 | Protein NRT1/PTR FAMILY 1.1 |
© 2020 by the authors. Licensee MDPI, Basel, Switzerland. This article is an open access article distributed under the terms and conditions of the Creative Commons Attribution (CC BY) license (http://creativecommons.org/licenses/by/4.0/).
Share and Cite
Mérida-García, R.; Bentley, A.R.; Gálvez, S.; Dorado, G.; Solís, I.; Ammar, K.; Hernandez, P. Mapping Agronomic and Quality Traits in Elite Durum Wheat Lines under Differing Water Regimes. Agronomy 2020, 10, 144. https://doi.org/10.3390/agronomy10010144
Mérida-García R, Bentley AR, Gálvez S, Dorado G, Solís I, Ammar K, Hernandez P. Mapping Agronomic and Quality Traits in Elite Durum Wheat Lines under Differing Water Regimes. Agronomy. 2020; 10(1):144. https://doi.org/10.3390/agronomy10010144
Chicago/Turabian StyleMérida-García, Rosa, Alison R. Bentley, Sergio Gálvez, Gabriel Dorado, Ignacio Solís, Karim Ammar, and Pilar Hernandez. 2020. "Mapping Agronomic and Quality Traits in Elite Durum Wheat Lines under Differing Water Regimes" Agronomy 10, no. 1: 144. https://doi.org/10.3390/agronomy10010144
APA StyleMérida-García, R., Bentley, A. R., Gálvez, S., Dorado, G., Solís, I., Ammar, K., & Hernandez, P. (2020). Mapping Agronomic and Quality Traits in Elite Durum Wheat Lines under Differing Water Regimes. Agronomy, 10(1), 144. https://doi.org/10.3390/agronomy10010144