Article

Analysis of Grain Yield Differences Among Soybean Cultivars under Maize–Soybean Intercropping

1
College of Agronomy, Sichuan Agricultural University, Chengdu 611130, China
2
Key Laboratory of Crop Ecophysiology and Farming System in Southwest, Ministry of Agriculture, Chengdu 611130, China
*
Author to whom correspondence should be addressed.
Agronomy 2020, 10(1), 110; https://doi.org/10.3390/agronomy10010110
Submission received: 25 November 2019 / Revised: 8 January 2020 / Accepted: 9 January 2020 / Published: 11 January 2020
(This article belongs to the Section Innovative Cropping Systems)

Abstract

:
Shading created by intercropping reduces the photosynthetic capacity of soybean plants but also directly affects the pod setting process of soybean. However, which of the changed aspects induce the yield differences in intercropped soybean cultivars is still unknown. Four soybean cultivars with similar yield and growth and development processes in monoculture were selected by a pre-experiment. Field experiments were carried out from 2015 to 2017 to investigate the leaf photosynthetic parameters, total biomass, reproductive characteristics, yield and yield components of soybean. The yield of soybean cultivars was significantly decreased in intercropping systems and the yield of cultivars (cvs.) ZH39 and QH34 were considerably higher than those of cvs. HD19 and HD20. Besides, the pod and seed number and harvest index were also reduced by intercropping and the yield components of cvs. ZH39 and QH34 in intercropping were significantly higher than those of cvs. HD19 and HD20, other than the seed size. Although the parameters of leaf photosynthetic capacity (leaf area index, net photosynthetic rate, and chlorophyll content) of soybean were changed by intercropping, there was no significant difference among cultivars. Additionally, the CGRR1–R5 (crop growth rate between R1 and R5) of intercropped soybean was lower than that of monoculture, while no significant differences were observed in different cultivars. The reproductive biomass at R5 was significantly different among soybean cultivars, and the reproductive partitioning and seed set efficiency of different cultivars were varied by the reproductive biomass at R5. Therefore, high-yielding cultivars in intercropping can achieve higher yield due to more reproductive structures survived at R5.

1. Introduction

Intercropping is an ecological planting pattern which can use land and environmental resources more efficiently as compared to monoculture, so as to realize sustainable development of agriculture and guarantee food security [1,2,3]. Soybean intercropped with maize, producing more grain yield and protein, are considered as a preferred combination in the intercropping systems [4,5,6]. The maize–soybean strip intercropping, which has a row ratio of 2:2 for maize-to-soybean, keeps the plant density of the two-component crops consistent with monoculture by reducing the plant spacing achieved a land equivalent ratio higher than 1.4 in China [7,8,9]. However, due to the temporal niche differentiation of crops in intercropping, it is complementary and competitive for light resource utilization of the two-component crops [6,7,10]. Soybean plant growth is affected by the shade of maize plants at the seedling stage in relay intercropping and at the reproductive stage in intercropping, which results in a significant reduction in grain yield [7,9]. Andrade et al. [11] and Yang et al. [12] demonstrated that the optimization of the sowing dates and planting geometries of the combined crops could promote the performance of intercropped soybean yields, and further increase the total yield of the intercropping system. Those practices mainly alleviate the interspecific competition and increase the light interception and utilization of lower crops by separating the critical growth period of the combined crops.
Light fluctuations are ubiquitous in nature, so plants are affected by some degree of shading during the growth period. Therefore, plants have evolved two strategies in response to shade: avoidance and tolerance [13,14]. Crops with strong shade tolerance can not only better capture and utilize light energy under low light conditions, but also generate more reproductive structures. These shade-tolerant traits can be used as the basis for selecting cultivars with high efficient utilization of light resources [15,16]. Su et al. [17] reported the parameters of photosynthetic production, such as leaf area index (LAI) and chlorophyll content and net photosynthetic rate (Pn), as references to the shade-tolerant traits to evaluate the difference between two soybean cultivars in relay intercropping. When the cultivar had higher photosynthetic capacity, the more light energy could be intercepted and the more grain yield was achieved.
From the view of botany, plant morphology and photosynthetic characteristics are important indicators of shade tolerance [14]. However, for agricultural production, the grain yield of crops depends on the number of reproductive structures after harvest, and shading can affect the development process of reproductive structures [18]. Seed number per unit area is the most important yield trait of soybean [19,20,21]. From the initial flowering to early seed-filling is the critical period for seed number determination, and there is a linear relationship between crop growth rate and seed number during this period [19,22,23,24]. Jiang and Egli [23] reported that shading from R1 to R5 significantly reduced the photosynthesis and biomass of soybean and ultimately decreased the crop growth rate and seed number. Egli and Yu [19] and Rotundo et al. [25] evaluated the characteristics through redefining the relevant parameters of the physiological model proposed by Charles-Edwards [26]. The reproductive characteristics of seed number determination can be the crop growth rate and duration of the critical period of seed set and the reproductive partitioning and seed set efficiency [19,25,27]. Therefore, it is necessary to systematically analyze the yield differences among soybean cultivars via determining the photosynthetic and reproductive production changed by shading under intercropping.
Soybean cultivars with different durations of growth periods in intercropping can induce the variations in grain yield due to different solar radiation interception [28]. To eliminate the effects of plant growth duration, four soybean cultivars were selected with similar development processes and grain yield in monoculture. All of them were measured by photosynthetic capacity, plant growth, and reproductive characteristics in order to reveal the reasons for the yield variance among cultivars under intercropping.

2. Materials and Methods

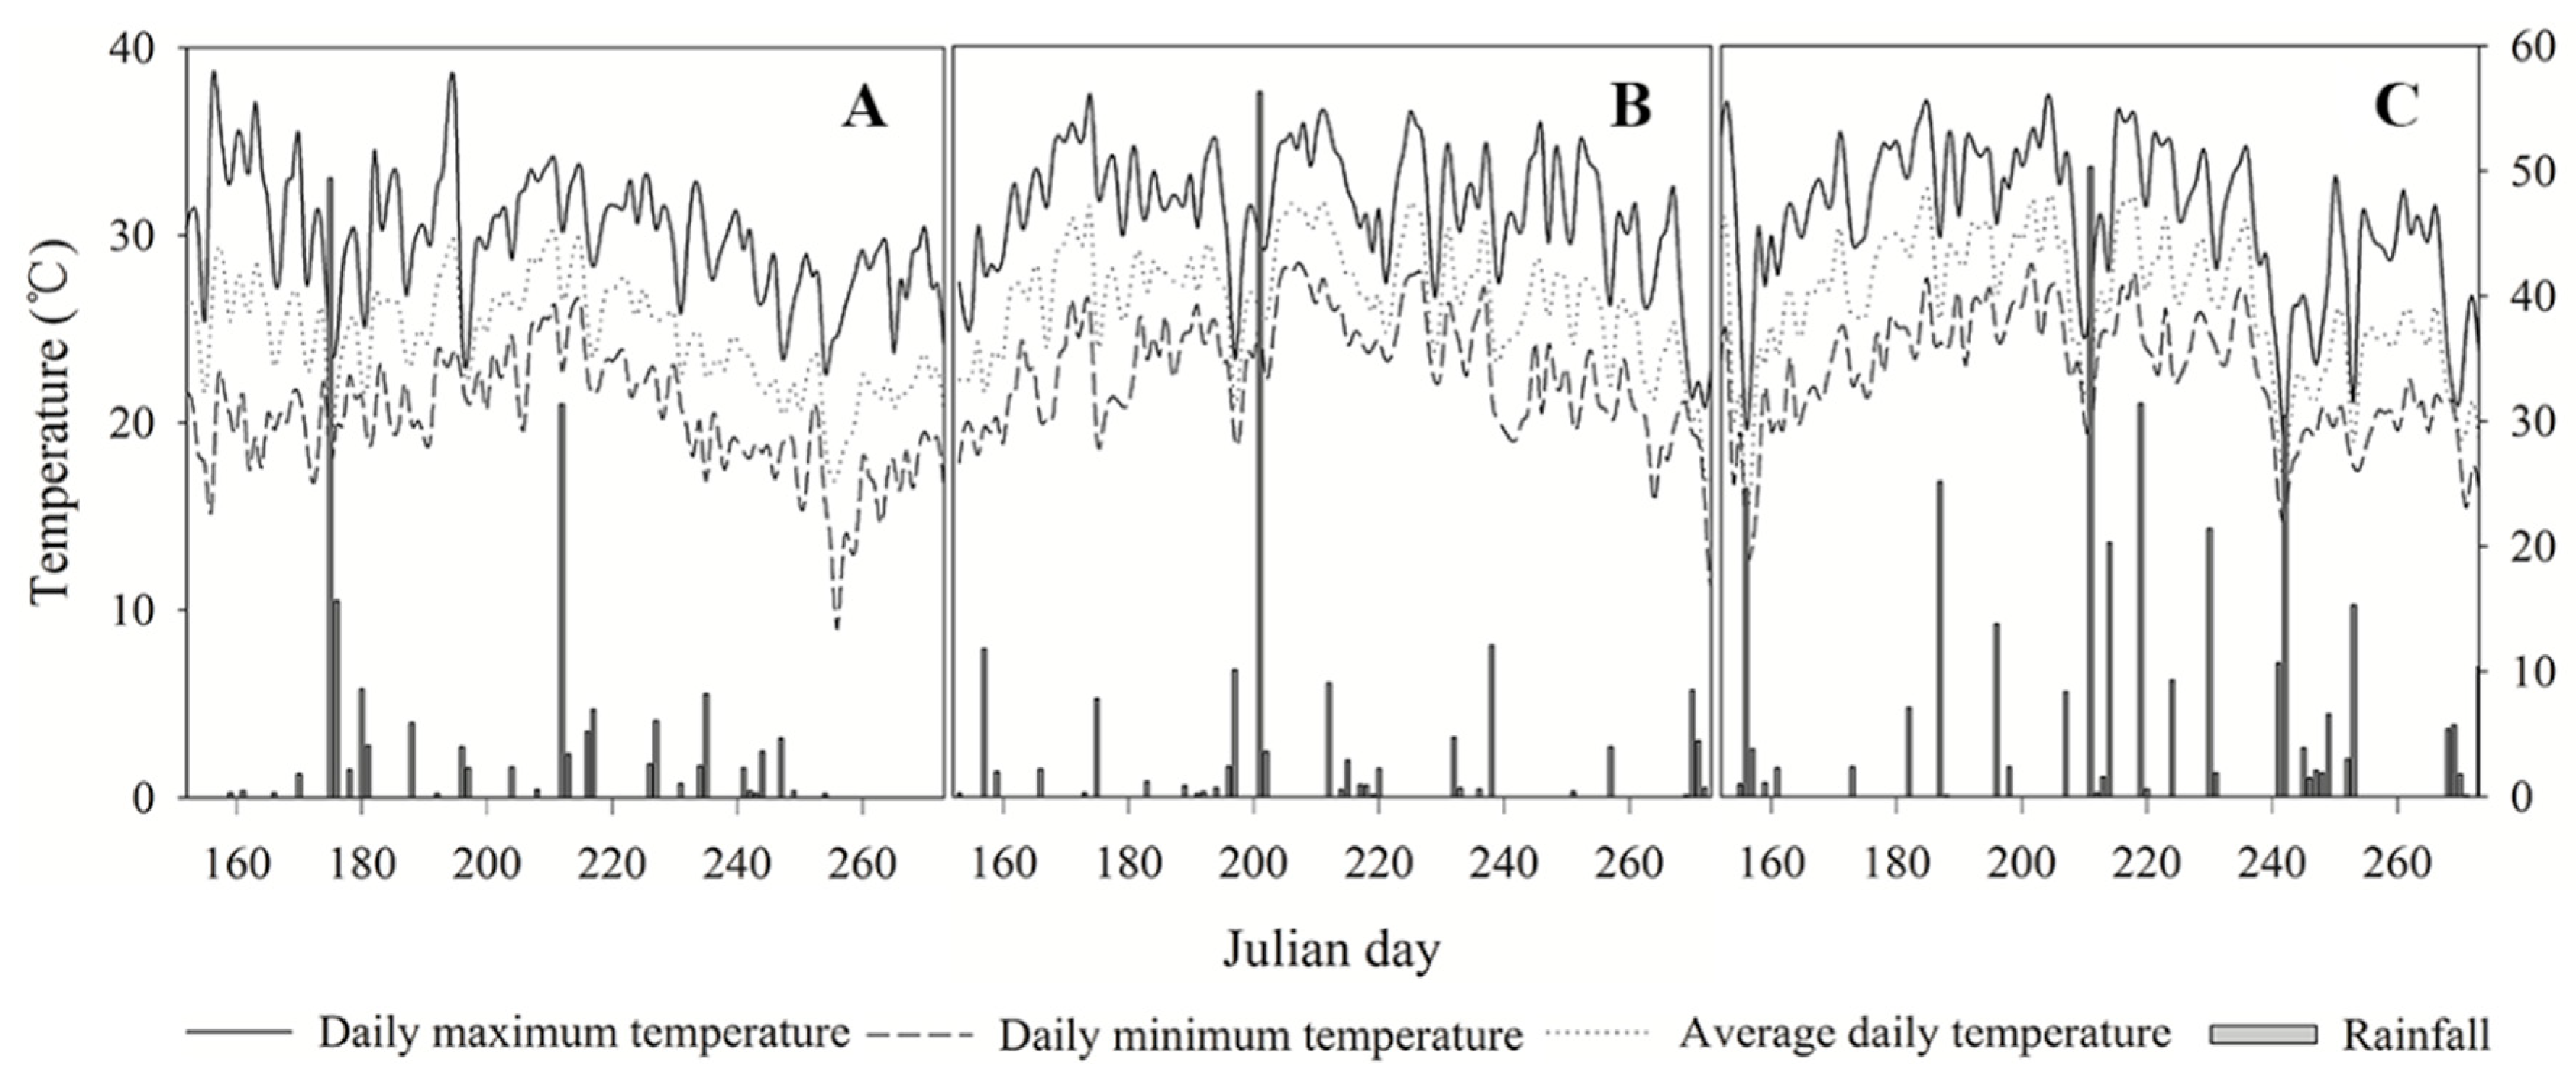
2.1. Experimental Site

Field experiments were established at two locations in the Huang-Huai-Hai Plain of China. The first site was located at Heze city (35°15′N, 115°25′E), Shandong province in 2015. The second one was at Zhengzhou city (34°47′N, 114°4′E), Henan province in 2016–2017. Rainfall and average daily temperature from sowing to maturity were 360.5 mm and 24.5 °C in 2015, and 410.0 mm and 26.5 °C in 2016, and 328.1 mm and 26.2 °C in 2017, respectively (Figure 1). The soil was clay texture in Heze and damp soil in Zhengzhou. Basic soil chemical characteristics (0–15 cm depth) before sowing were measured. The organic matter was 12.0, 17.3, and 16.6 g kg−1; N was 65.4, 54.5, and 52.8 mg kg−1; P was 61.4, 25.9, and 23.4 mg kg−1, and K was 229.0, 141.5, and 148.4 mg kg−1 in 2015–2017, respectively.

2.2. Cultivar

One hundred eighty-three soybean germplasms were collected from different regions in China. The soybean cultivars, which had a similar yield in monoculture but had significantly different yields in intercropping, were screened out by preliminary experiments from 2013 to 2015. Moreover, the growth period of component crops had temporal niche differentiation [10]. If soybean cultivars have a significant difference in plant growth duration, the overlap time between the two-component crops would be varied in intercropping. Then, the PAR interception and light utilization of the soybean canopy are subsequently different in intercropping. Finally, the different durations of the plant development processes can cause yield variation among cultivars in intercropping [6,11,28]. To eliminate the difference in grain yield affected by different plant development processes, four soybean cultivars with similar yield and plant development processes in monoculture were selected to carry out this study (Table 1).
The growth stages of soybean were classified according to Fehr and Caviness [29]. Twenty soybean plants in each plot were investigated every other day, and the phenology of the soybean plant was recorded. The data in Table 2 show the growth stages and the corresponding days after sowing.

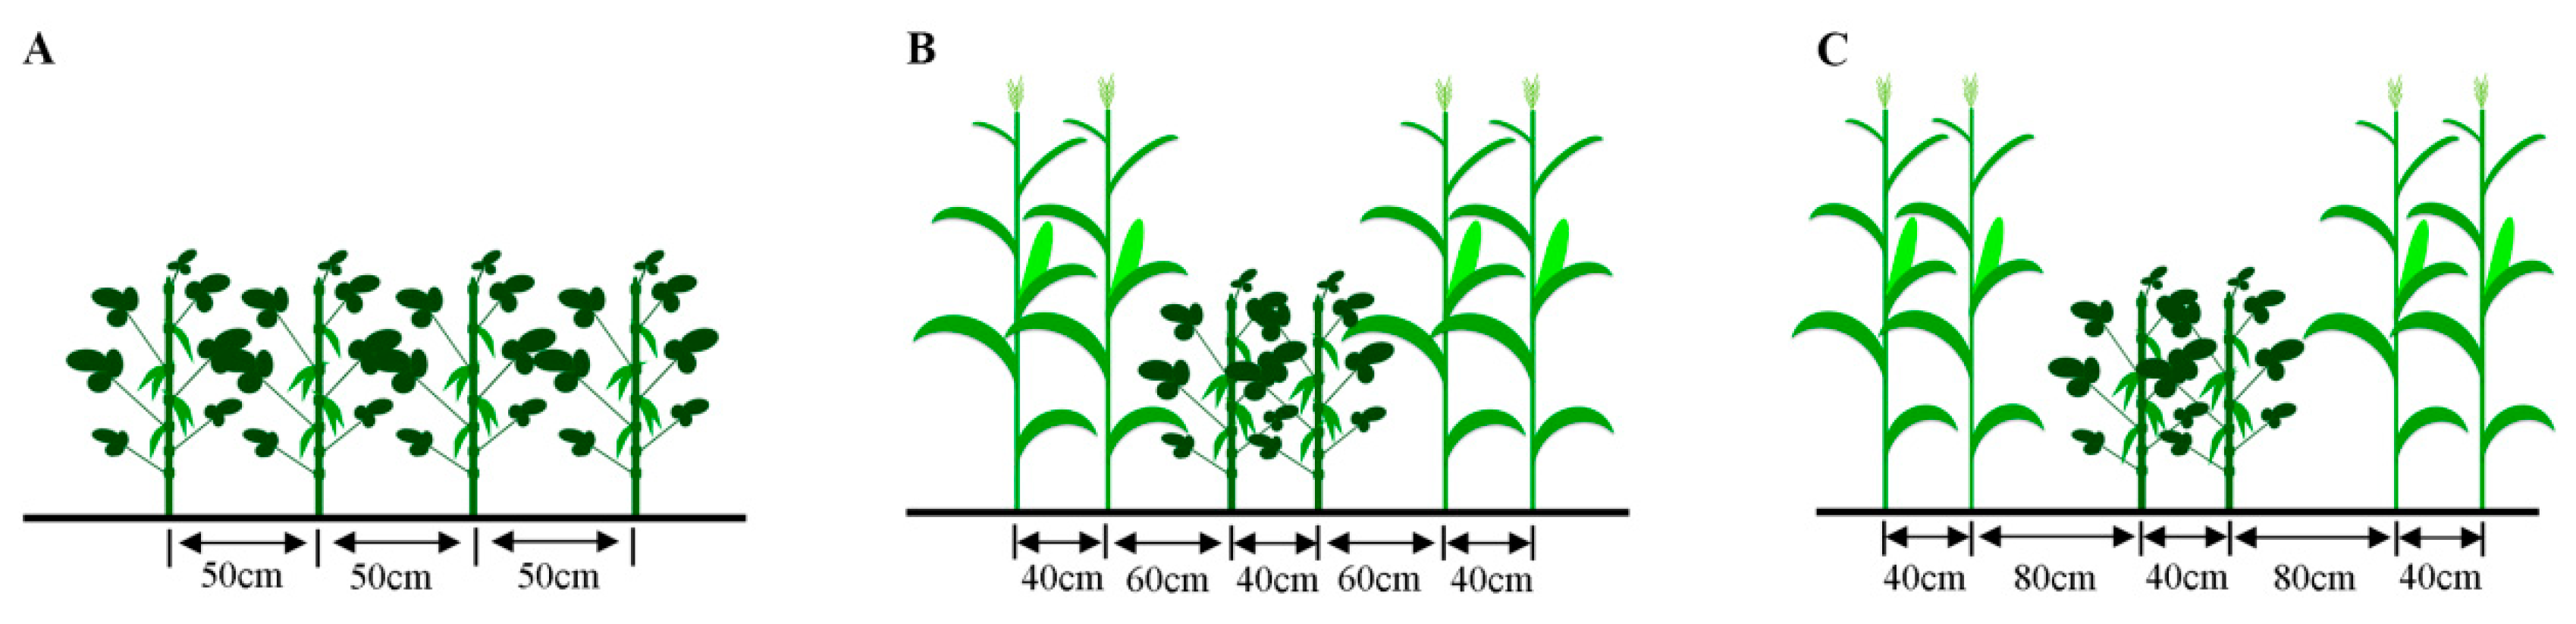
2.3. Experimental Design

A two-factor split-plot design was used in this experiment from 2015 to 2017. The planting patterns were the main plots, and the soybean cultivars were the split plots. All treatments were with three replications. The planting patterns included soybean monoculture (M0) and maize–soybean intercropping with two different bandwidths (2 m for INT1 and 2.4 m for INT2). The rows ratio was 2:2 for maize–soybean intercropping. Two rows of soybean were planted in the wide rows between the maize strip (Figure 2). The rows spacing between soybean to soybean and maize to maize was 0.4 m. The adjacent maize and soybean rows were 0.6 m for INT1 and 0.8 m for INT2. Soybean monoculture plots were eight rows 6 m long, with 0.5 m row spacing. Intercropping plots were 3 strips with 6 rows of soybean and 6 m long, and the land area of one plot was 36 m−2 for INT1 and 43.2 m−2 for INT2, respectively. The plant density was 16.5 plants per m2 for soybean and 7.05 plants per m2 for maize. A similar plant population was maintained in monoculture and two intercropping systems by shortening the distances between the contiguous standing plants. Maize cultivars “Xundan26” and “Xundan20” were used in Heze and Zhengzhou, respectively. The orientation of intercropping strips was east–west.
The times of sowing and harvesting for maize and soybean were on the same days. Sowing was on 17 June 2015, 14 June 2016, and 13 June 2017. Harvesting was on 1 October 2015, 30 September 2016 and 2017. Irrigation was applied using sprinklers at 0, 10, 26, 66 days after sowing to protect from water stress. Fertilizers were applied at rates of 150 kg N ha−1, 100 kg P ha−1, and 100 kg K ha−1 for intercropped maize at 20 days after sowing, but no fertilizer for soybean. Weeds were controlled by hand, and plant diseases and insect pests were prevented by chemicals.

2.4. Sampling Methods and Photosynthetic Production Analysis

To measure the total biomass, six consecutive plants were cut at the cotyledon node from each plot. Sampling commenced at the flowering initiation stage with 5- or 10-day intervals. All samples were separated into leaf, stem, petiole, pod, and seed. After that, subsamples were oven-dried at 105 °C for half an hour to kill the fresh tissues and then dried at 80 °C for more than 48 h until constant weight was reached.
The leaf area index (LAI) was measured simultaneously with biomass sampling. All leaves of six soybean plants in each plot were collected, and then fifteen leaves were randomly selected as subsamples. The area of every single leaf was calculated by multiplying the leaf maximum length and width with the shape coefficient factor of 0.75 [6]. LAI was calculated as (Equation (1)).
LAI = L A f × D W d w f × n × N
where LAf and dwf are the total leaf area and dry weight of fifteen leaves, respectively; DW is the dry weight of all leaves; n and N are the numbers of sampling plants and standing plants per m2, respectively.
Chlorophyll content was measured by a SPAD 502 Minolta chlorophyll meter from the initiation flowering (R1) stage of soybean. Each sampling time was 5- or 10-day intervals. Three soybean plants were selected from each experimental plot, and the middle leaflets of the full-unrolled trifoliate leaves at the third node from the top canopy of plants were measured. Each leaflet was measured six times as technical replicates and then the value was averaged.
The net photosynthesis rate (Pn) was measured by LI-6400XT (Li-Cor Inc., Lincoln, NE, USA) at 10, 20, 40, and 50 days after flowering in 2015. Three soybean plants without disease and pest injury were selected from each experimental plot, and the middle leaflets of the full-unrolled trifoliate leaves at the third node from the top canopy of plants were measured. The photosynthetically active radiation (PAR) was set at 1000 μmol m−2 s−1, provided by a 6400-02B LED light source, and CO2 flow was controlled at 380 μmol m−2 s−1. All samples were measured from 9:00 a.m. to 11:30 a.m.

2.5. Grain Yield and Yield Components

At full maturity, two rows of soybean (one left strip without sampling during the growth stages) were harvested in each plot, avoiding 0.5 m gaps from plot boundary and 4.5 m long. All plants were air-dried for at least 15 days and then threshed manually to measure the yield per unit area. In the harvested strip, 10 consecutive soybean plants were selected for measuring the pod and seed number per unit area, and seed weight and aboveground biomass. Seed size was calculated by 300-seeds weight from each treatment. The harvest index (HI) was the ratio between seed weight and aboveground biomass of 10 plants of soybean.

2.6. Reproductive Biomass and Characteristics Determinations

The critical period of determination of the soybean seed set is from the flowering initiation to the early seed-filling stage [19,22,23,30]. The reproductive characteristics were evaluated according to the model defined by Rotundo et al. [25].
Four soybean cultivars with consistent development processes were used so the critical period of seed set determination for all cultivars was estimated from 0 to 30 days after flowering (almost the stages between R1 and R5) in this experiment. The reproductive biomass at R5 (g m−2) was obtained from the pods excised from plants at 30 days after flowering. In addition, the CGRR1–R5 (crop growth rate between R1 and R5) was calculated using the linear regression between the sampling times and the corresponding total biomass from 0 to 30 days after flowering. Then, the slope of the linear equation was for CGRR1–R5 during the seed set period. Partitioning of total biomass to reproductive organs (PartCoef, g g−1) was the ratio between the reproductive biomass at R5 and the total biomass accumulated from 0 to 30 days after flowering. Seed set efficiency (SetEff, seed g−1) was the ratio between the seed number per unit area at harvest time and the reproductive biomass at R5.

2.7. Statistical Analysis

The ANOVA was used to analyze all the experimental data using SPSS (version 19.0, Chicago, IL, USA). Means of each treatment were compared with Duncan’s test at the 0.05 probability level. Pearson correlation was used to analyze the correlation coefficient between grain yield and seed number determined parameters. Figures were drawn using Sigmaplot 10.0, and linear regressions for the crop growth rate measurements were conducted with Curve Expert 1.4.

3. Results

3.1. Yield and Yield Components

The variance analysis of grain yield and yield components of soybean in different treatments from 2015 to 2017 showed cultivars, planting patterns, and years significantly affected the grain yield and yield components (p < 0.01), except planting patterns did not affect seed size (Table 3). The interaction between cultivars and planting patterns significantly affected (p < 0.01) the grain yield, pod number, seed number, and HI of soybean. The interaction between cultivars and years had no significant effect on grain yield and yield components. The interaction between planting patterns and years significantly affected (p < 0.01) grain yield, pod numbers, and seed numbers of soybean. The interaction of cultivars × planting patterns × years only significantly affected (p < 0.01) the pod numbers of soybean.
Intercropping significantly reduced the grain yield, pod number, seed number, and HI other than seed size, as compared to monoculture (Table 3). In intercropping, the grain yield of cvs. ZH39 and QH34 was considerably higher than those of cvs. HD19 and HD20 during three growing seasons. The decrease in yield of cvs. ZH39 and QH34 was both by an average of 60%, while the decrease of cvs. HD19 and HD20 was by an average of 72% and 70% as compared to monoculture, respectively.
Under intercropping, the pod numbers of cvs. ZH39 and QH34 were significantly higher than those of cvs. HD19 and HD20. As compared to monoculture, the decrease of cvs. ZH39 and QH34 was by an average of 52% and 53% in intercropping, while the decrease of cvs. HD19 and HD20 was by an average of 66% and 65% during three growing seasons, respectively.
The seed numbers of cvs. HD19 and HD20 were significantly lower than cultivar ZH39 under intercropping, but not for cv. QH34. Under intercropping, the decrease of cvs. ZH39 and QH34 was both by an average of 59%, while the decrease of cvs. HD19 and HD20 was by an average of 71% and 68%, as compared to monoculture during three growing seasons. Both in monoculture and intercropping, the seed size of cv. QH34 was significantly larger than those of the other three cultivars, while no significant differences were found in other cultivars. Under intercropping, the harvest index of cv. ZH39 was the highest and significantly higher than those of cvs. HD19 and HD20 in most cases from 2015 to 2017.

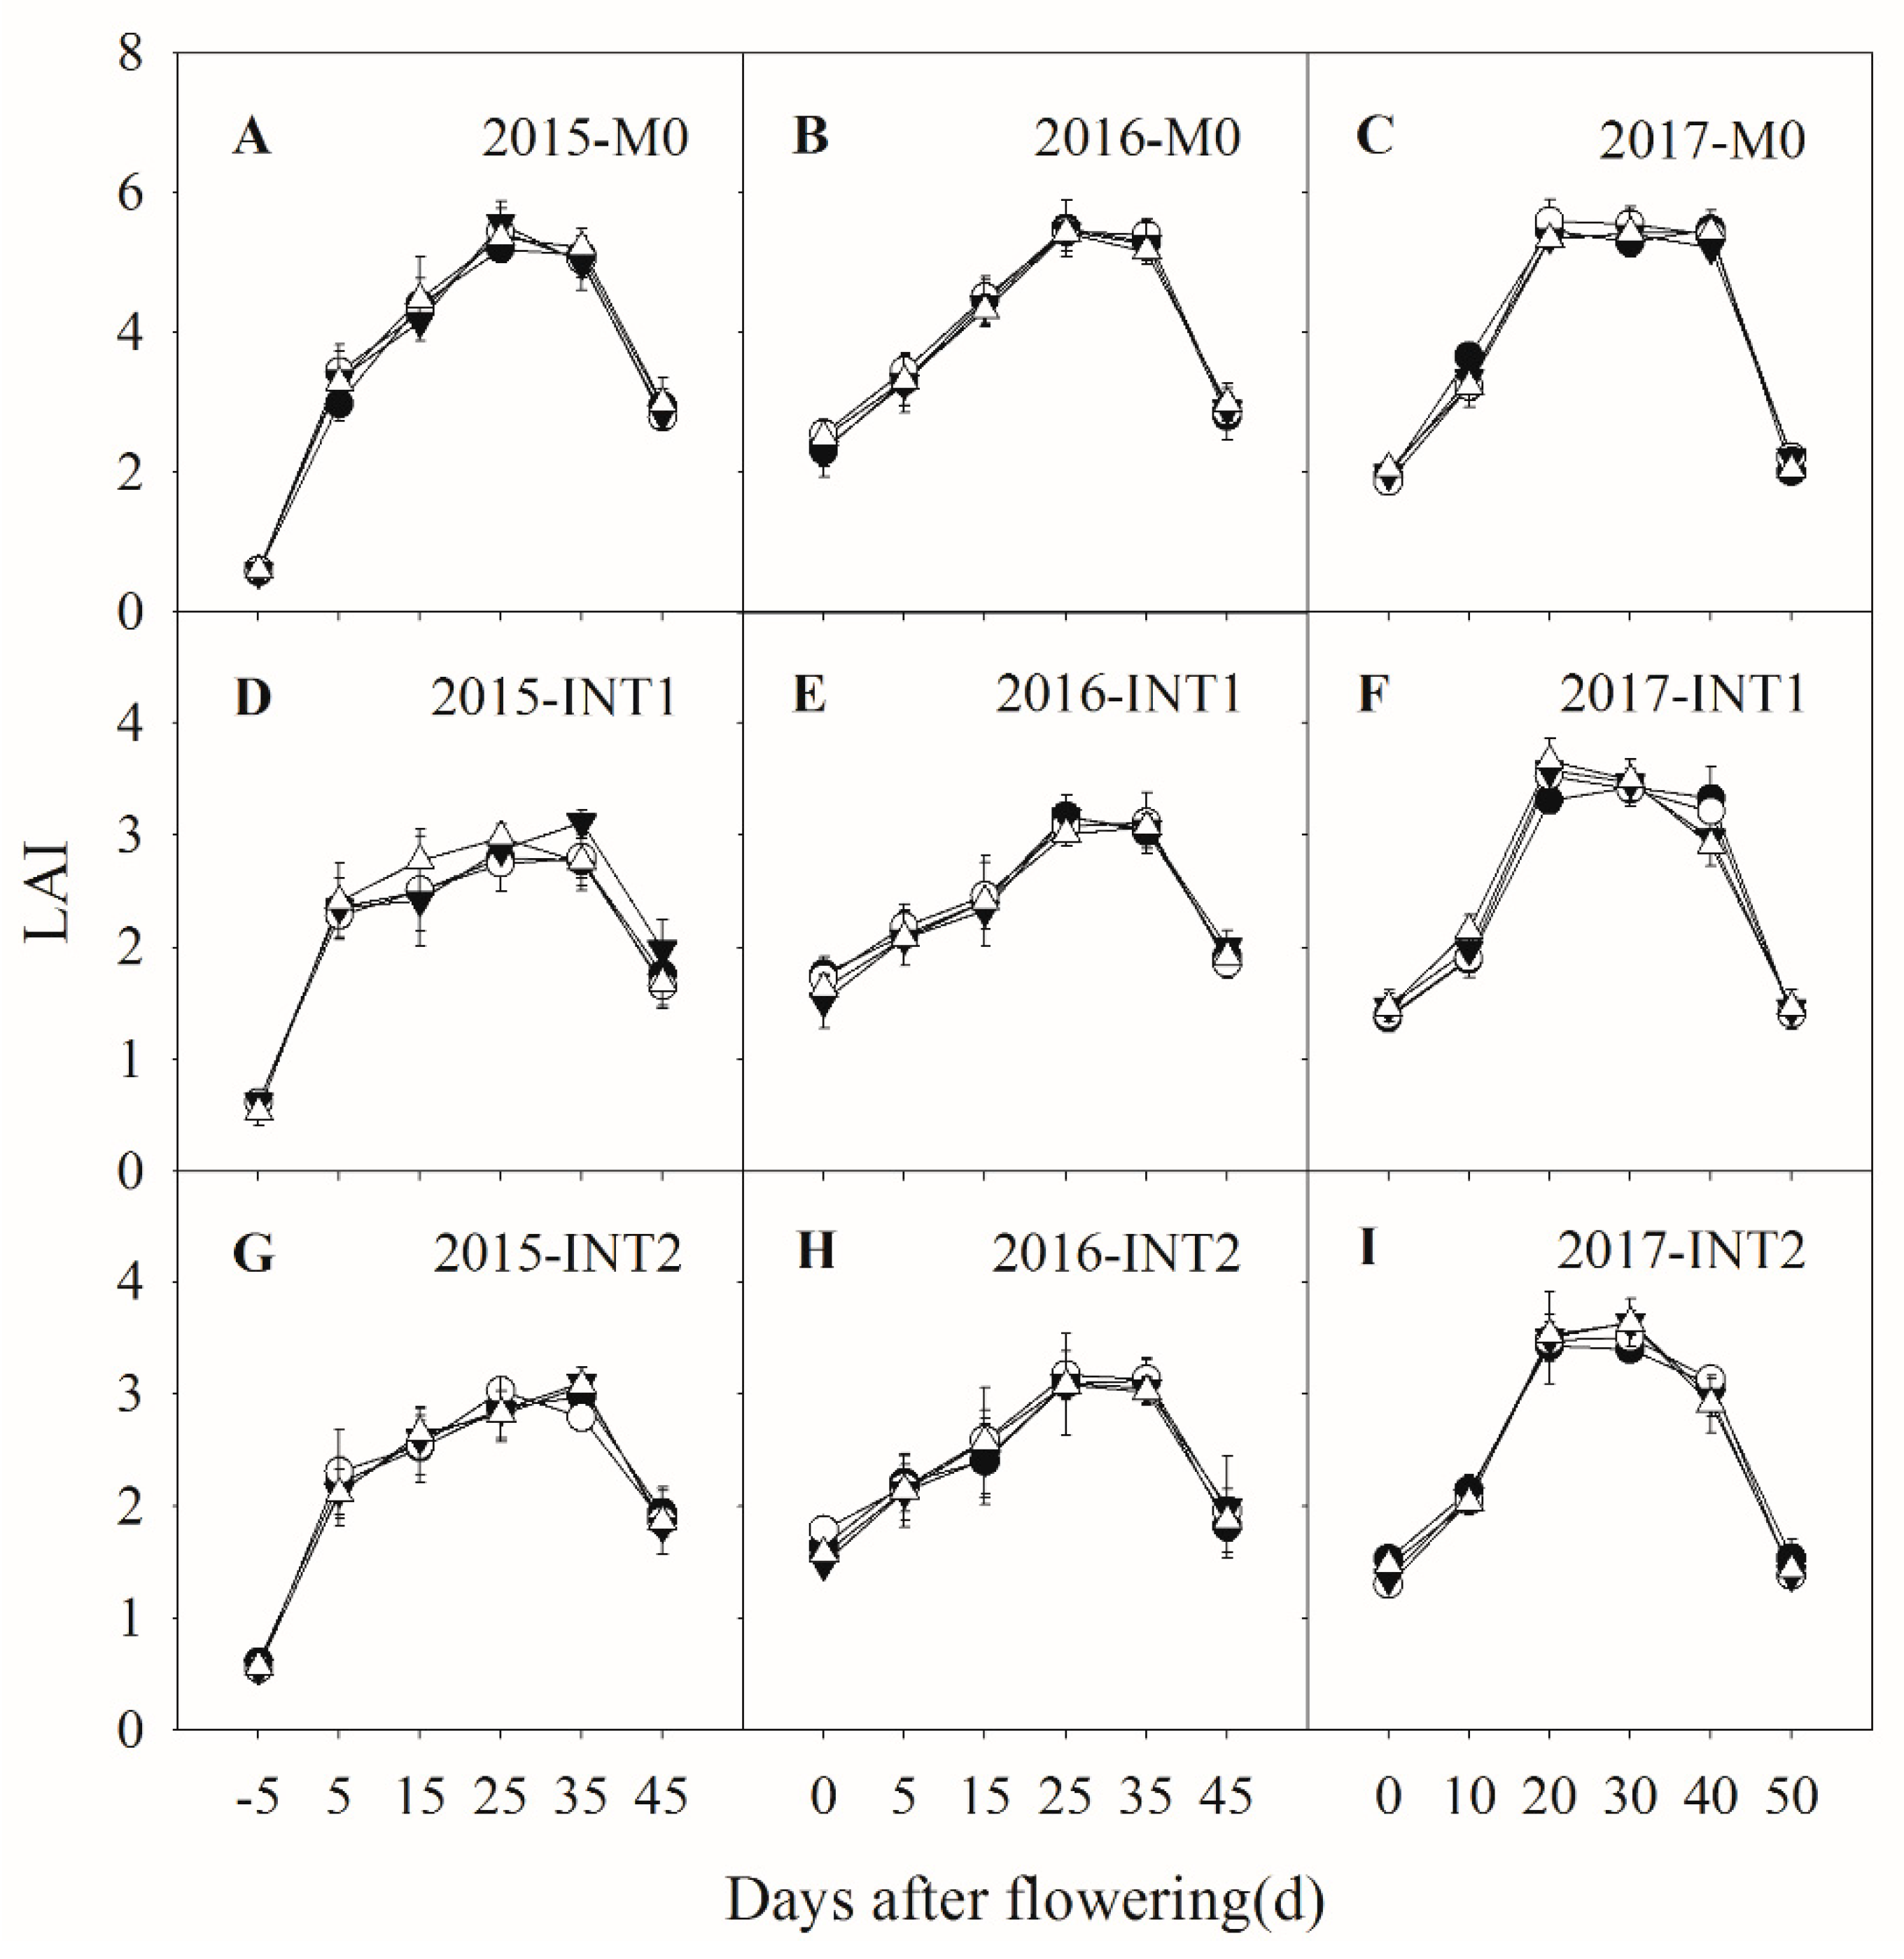
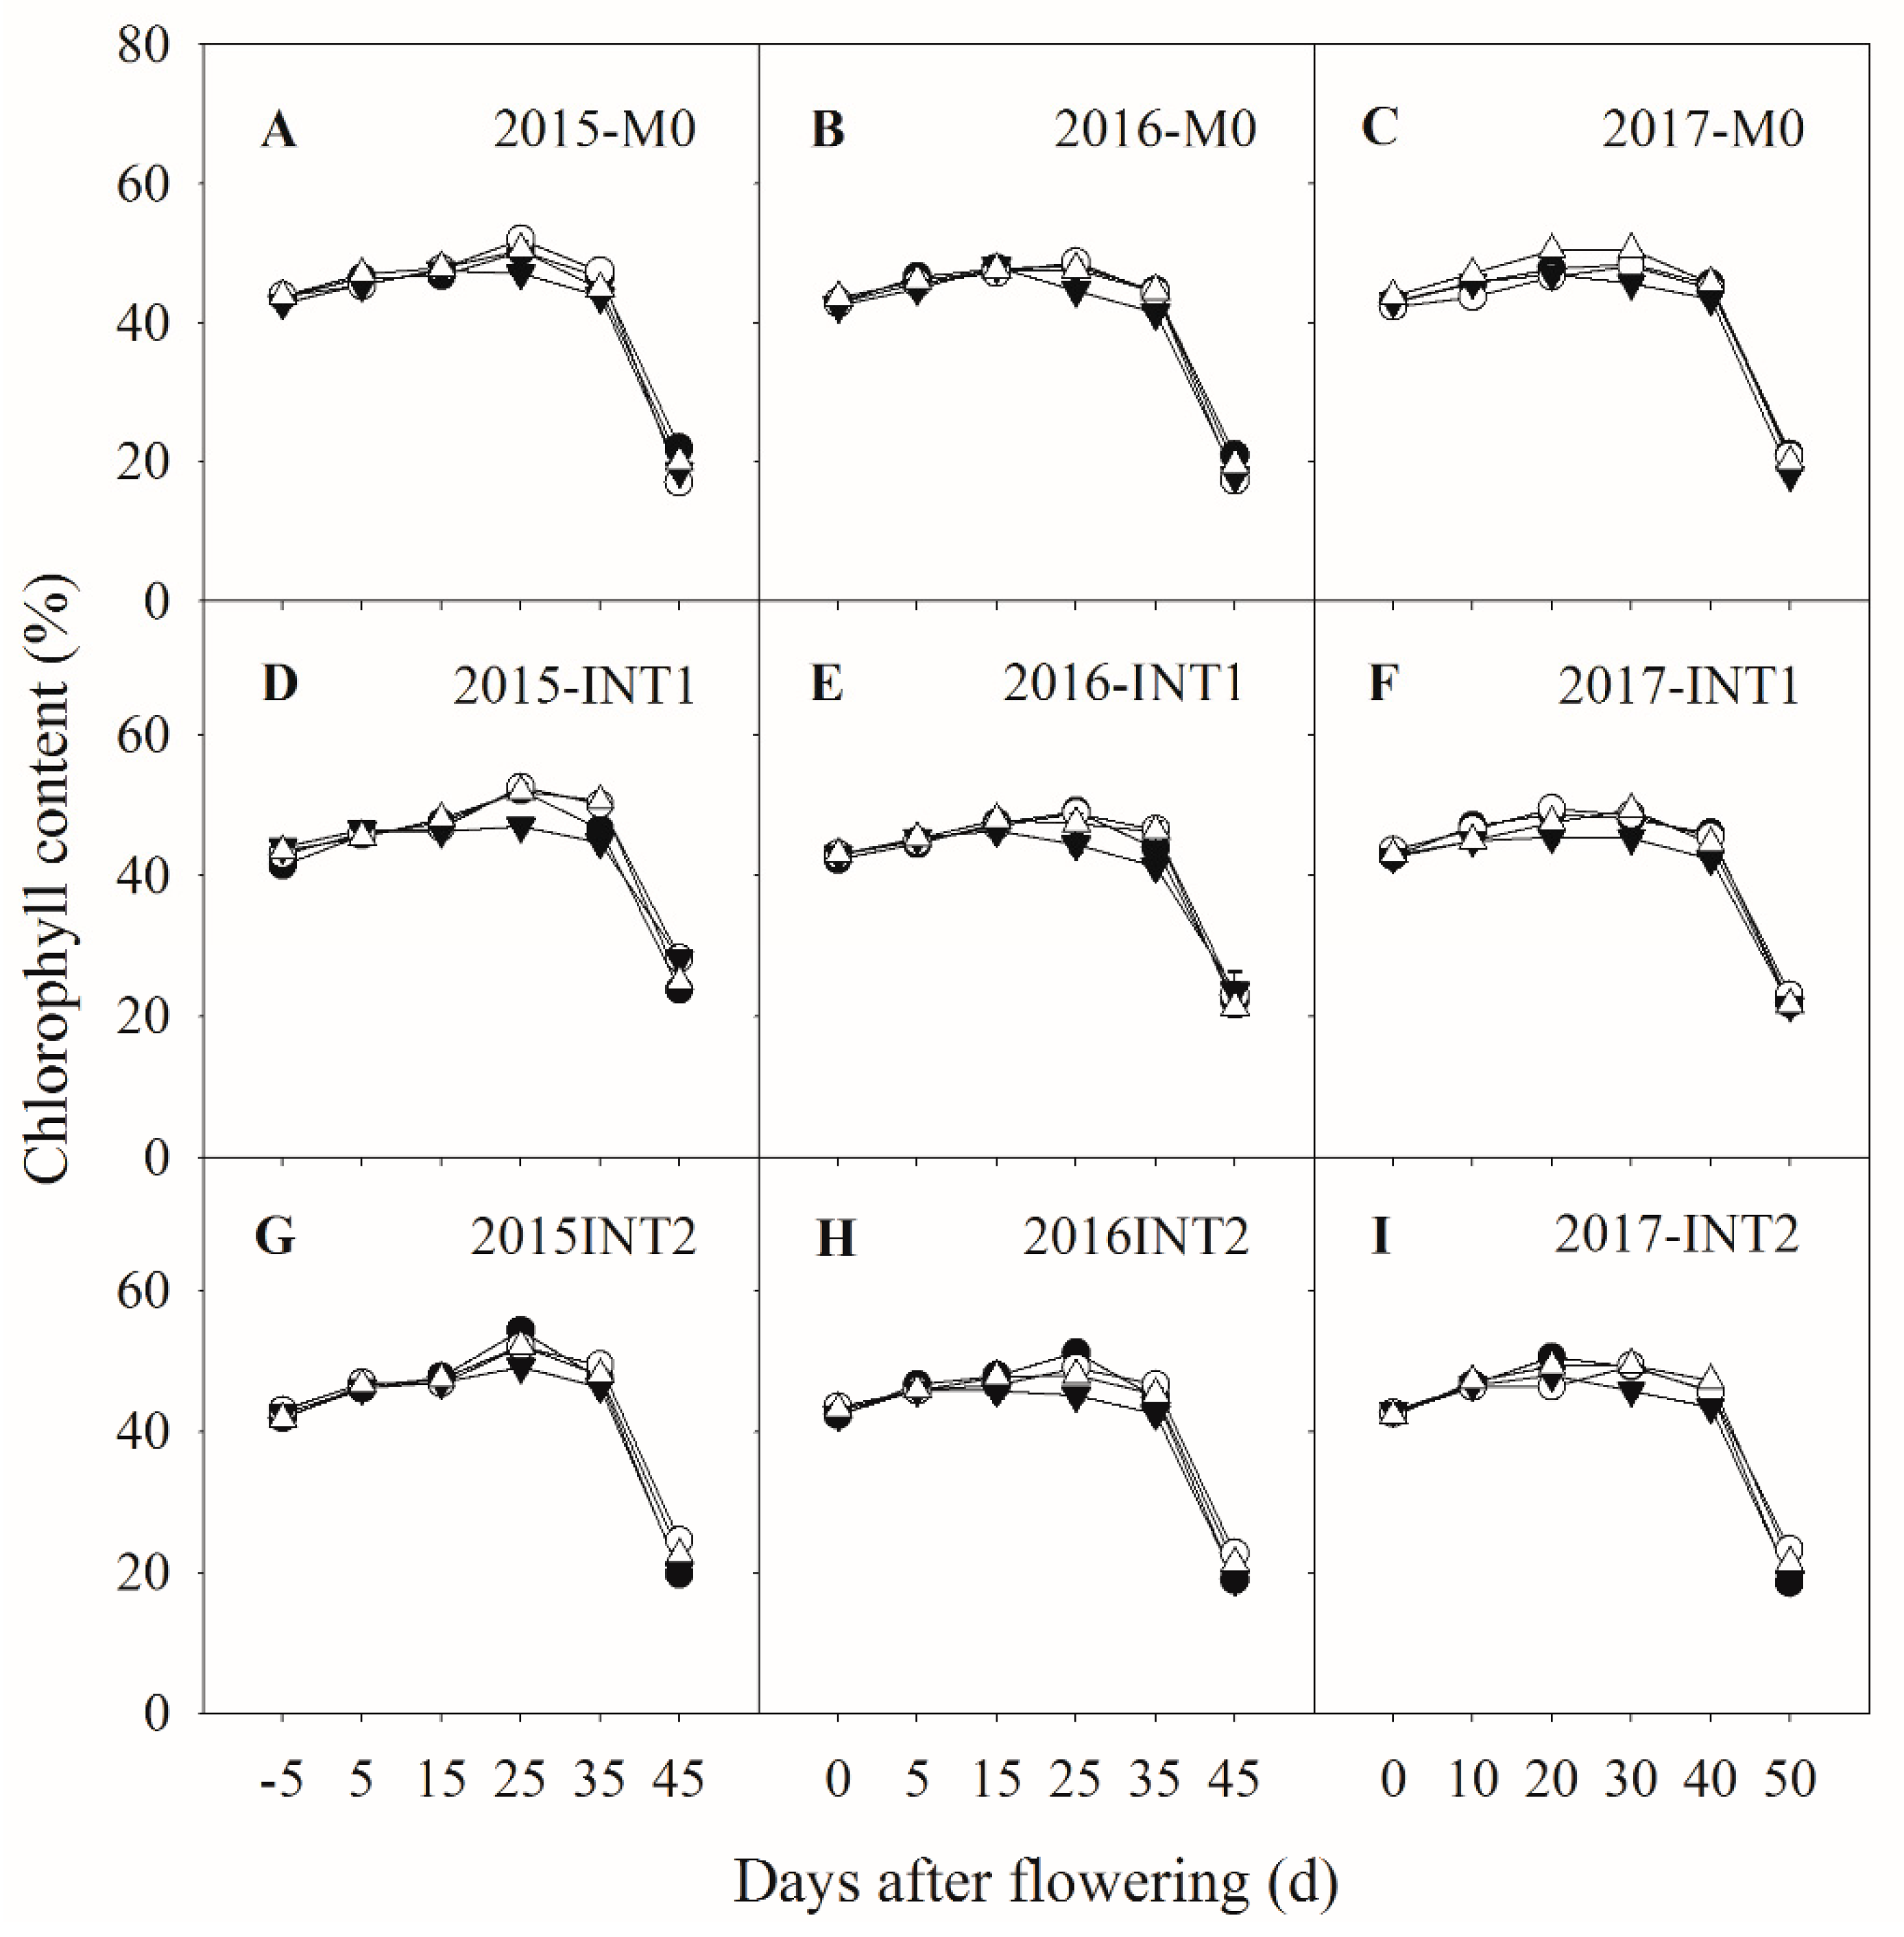
3.2. Photosynthetic Parameters

The planting pattern did not affect the growth dynamics of leaf area index (LAI), but LAI was significantly lower in intercropping than that of monoculture after flowering (Figure 3). In 2015 and 2016, the LAI was decreased by more than 40% at 15–35 days after flowering in intercropping. In 2017, the LAI was decreased by more than 35% at 10–40 days after flowering in intercropping. However, no significant differences of LAI among the four soybean cultivars were found either in monoculture or in intercropping.
The planting pattern did not affect the growth dynamics of leaf chlorophyll content (SPAD values) (Figure 4). Interestingly, soybean plants in intercropping had a higher chlorophyll content than that of monoculture during the seed filling stage, which implied a longer duration of green leaves (Figure 4D–I). After flowering, the chlorophyll content of cultivar ZH39 was significantly lower than that of the other three cultivars at 25 and 35 days in 2015, at 35 days in 2016, and at 30 and 40 days in 2017, respectively. To sum up, intercropping had little effect on chlorophyll content, while chlorophyll content among soybean cultivars showed a significant difference only at the seed filling stages.
Both in monoculture and intercropping, the net photosynthetic rate (Pn) of soybean leaves decreased gradually from 10 to 50 days after flowering (Figure 5). The highest Pn was by an average of 26.3 μmol CO2 m−2 s−1 for monoculture and 24.7 μmol CO2 m−2 s−1 for intercropping at 10 days after flowering. Compared with monoculture, intercropping significantly reduced the Pn at 10, 20, and 40 days after flowering, with an average decrease of 6%, 8%, and 11%, respectively (Figure 5B,C). In intercropping, the Pn among cultivars was significantly different at 10 and 40 days after flowering, which the Pn of cultivar QH34 was significantly higher than those of the other three soybean cultivars, while no significant differences were found in the other three cultivars.

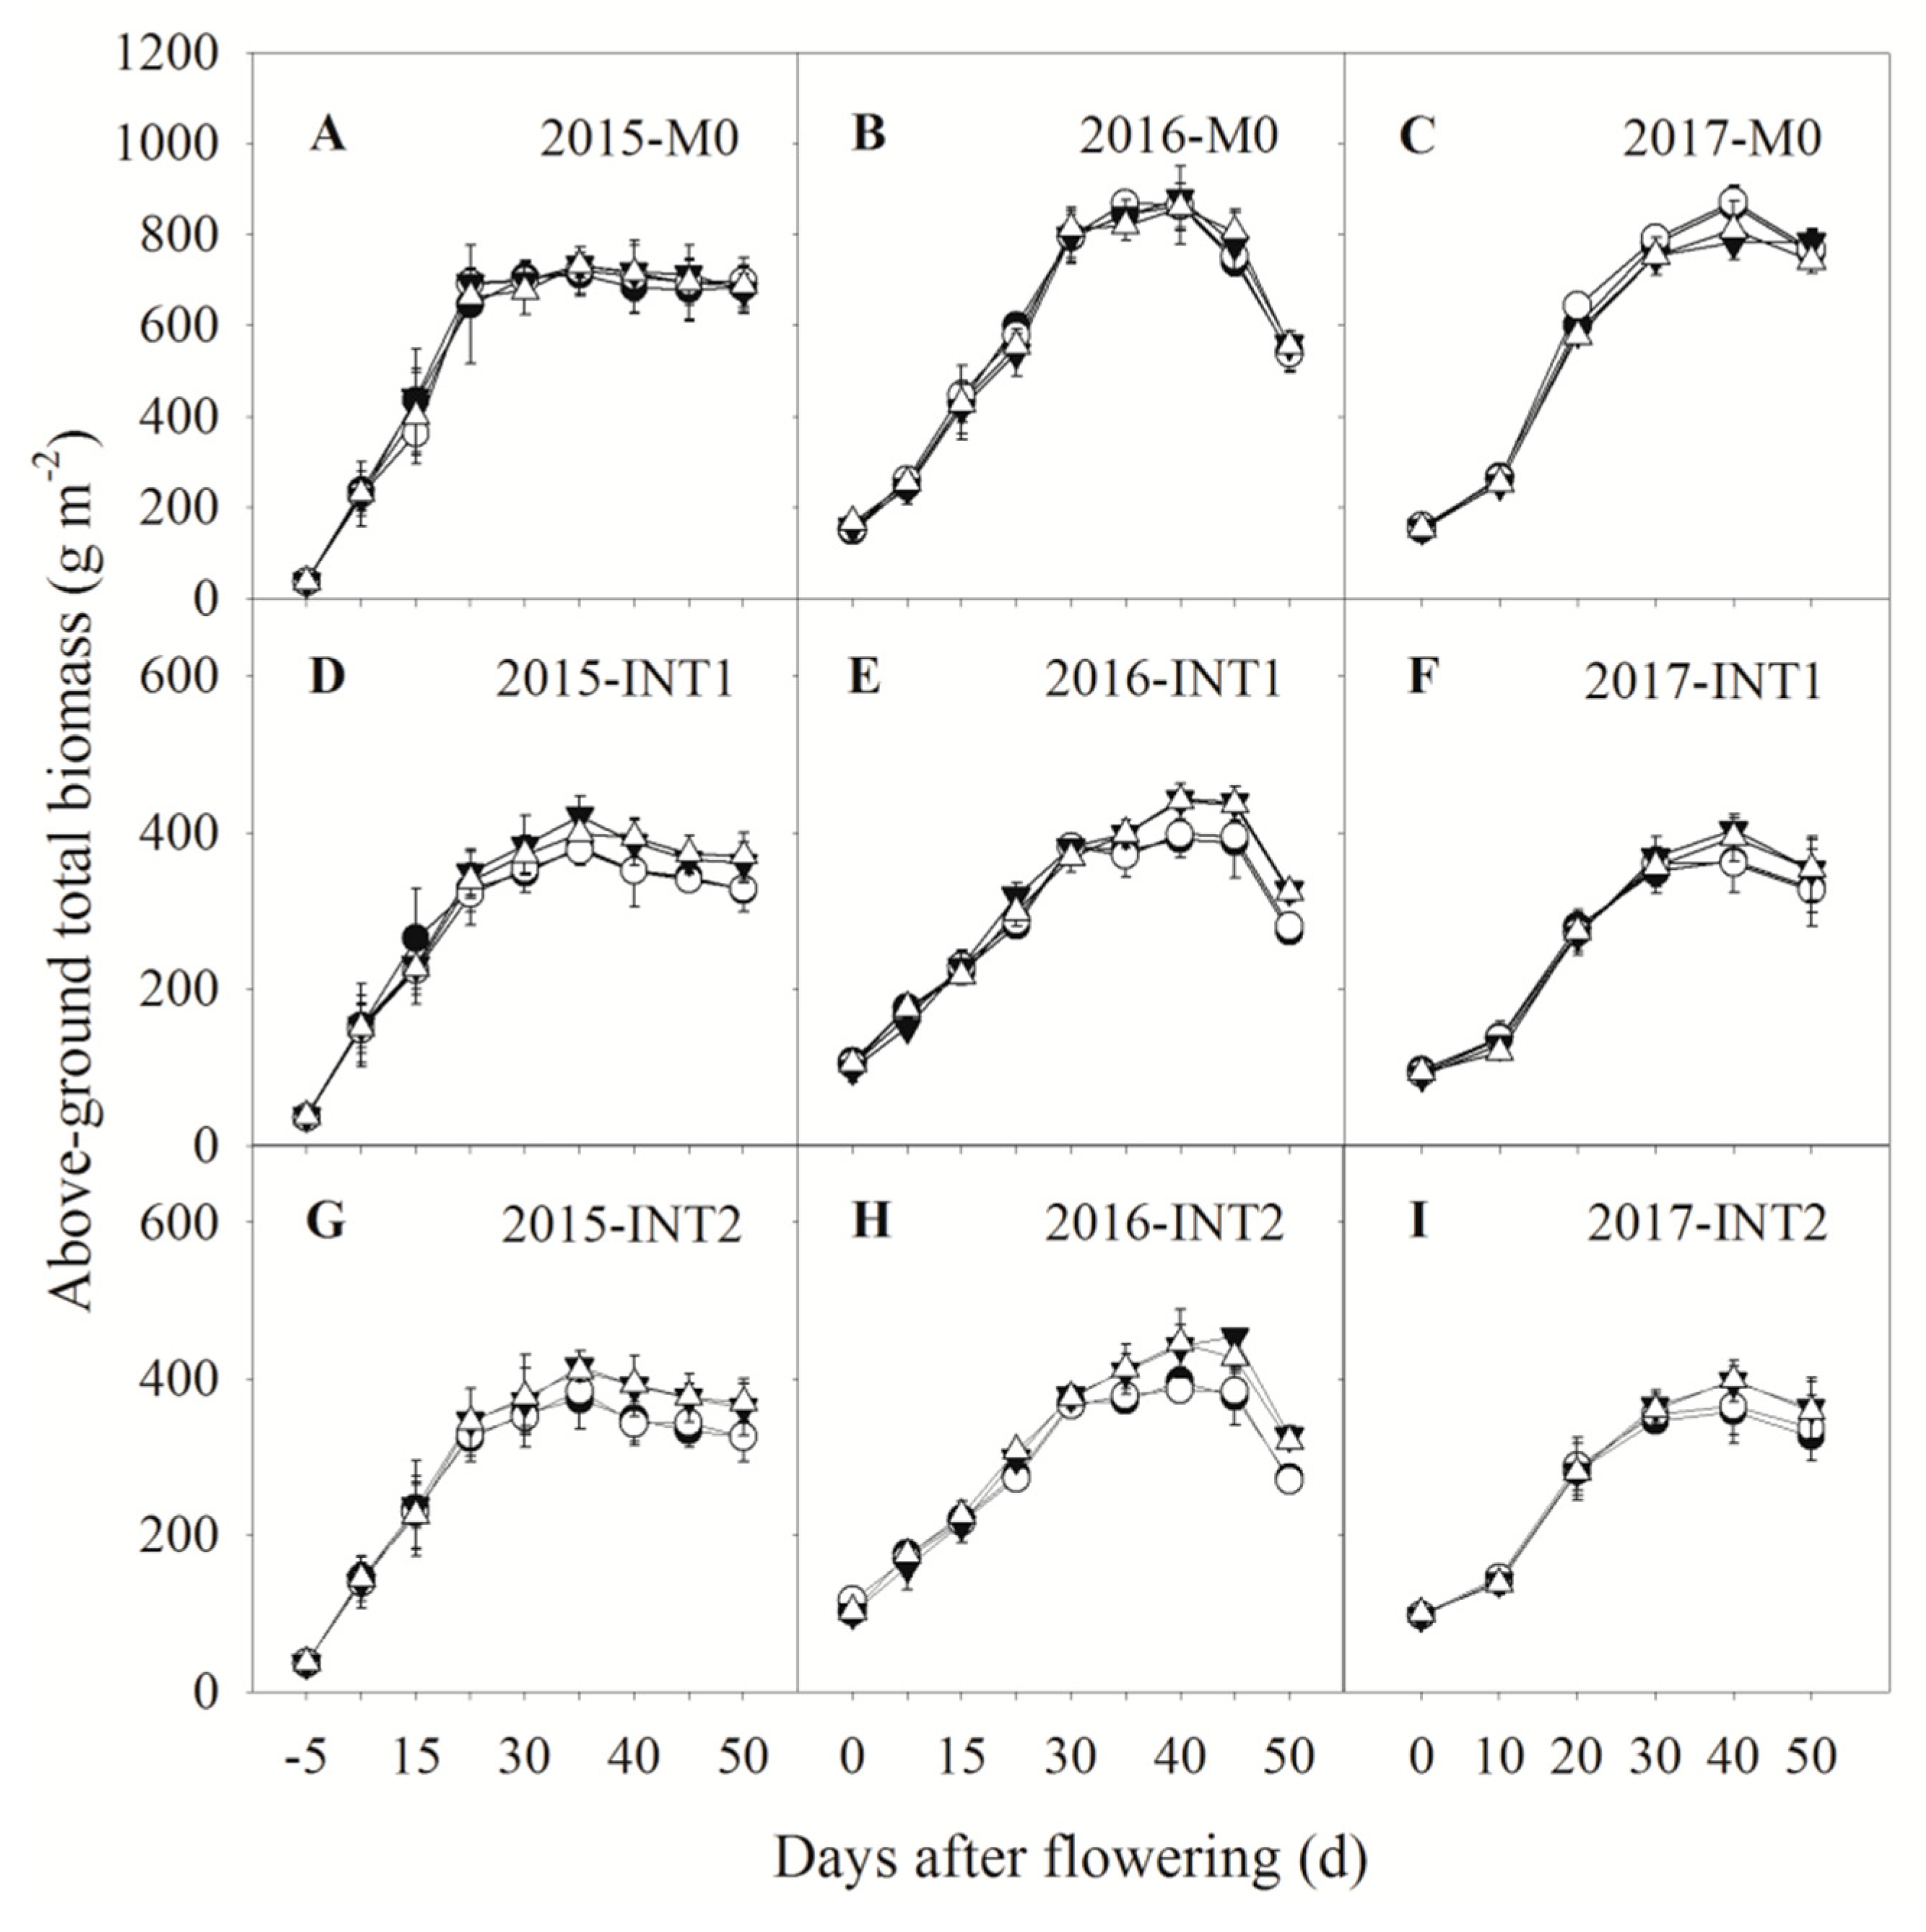
3.3. Total Biomass Accumulation

Intercropping did not affect the dynamics of total biomass accumulation, while it significantly reduced the total biomass (Figure 6). The mean maximum biomass was 724, 866, and 831 kg ha−1 in monoculture and 395, 418, and 380 kg ha−1 in intercropping at 35, 40, and 40 days after flowering from 2015 to 2017, respectively. In intercropping, the average decrease of soybean biomass was larger than 45% at 25–50, 15–50, and 10–50 days after flowering from 2015 to 2017, respectively. In addition, the average maximum decrease of biomass was 50%, 54%, and 55% at 25, 35, and 50 days after flowering during three growing seasons, respectively.
The biomass of different soybean cultivars was similar in monoculture (Figure 6A–C). However, in intercropping, the average biomass of cvs. ZH39 and QH34 was higher than those of cvs. HD19 and HD20 at 35–50 days after flowering in 2015 and 2016, and at 30–50 days after flowering in 2017, respectively.

3.4. Reproductive Biomass and Characteristics

Variance analysis of reproductive biomass and characteristics from 2015 to 2017 showed that planting patterns and years affected the reproductive biomass and characteristics at R5, and cultivars affected the reproductive biomass at R5 and seed set efficiency (Table 4). The interaction between planting patterns and cultivars, planting patterns, and years affected the reproductive biomass and characteristic at R5. The interaction between cultivars and years affected the reproductive biomass at R5 and reproductive partitioning. The interaction of cultivars × planting patterns × years only affected the reproductive partitioning.
The reproductive biomass at R5 was significantly reduced by intercropping, with an average decrease of 52%, 58%, and 57% in 2015–2017, respectively (Table 4). Moreover, the reproductive biomass at R5 of cvs. ZH39 and QH34 was significantly higher than those of cvs. HD19 and HD20 in 2015 and 2017 under intercropping.
The CGR between R1 and R5 was also significantly decreased by intercropping, with an average decrease of 56%, 53%, and 46% from 2015 to 2017, respectively (Table 4). In intercropping, the CGRR1–R5 of cvs. ZH39 and QH34 were merely significantly higher than those of cvs. HD19 and HD20 in 2016.
The effects of intercropping on the reproductive partitioning showed opposite results in different years (Table 4). In 2015, the reproductive partitioning was reduced by an average of 8% but significantly increased by an average of 12% and 26% in 2016 and 2017, respectively. Under intercropping, the reproductive partitioning of cvs. ZH39 and QH34 was significantly higher than that of cvs. HD19 and HD20 in 2015 and 2017.
In addition, seed set efficiency was significantly affected by intercropping, with an average decrease of 23%, 26%, and 31% from 2015 to 2017, respectively (Table 4). Under intercropping, the cultivar ZH39 had the highest seed set efficiency and was significantly higher than those of cvs. HD19 and HD20 for three years.

3.5. Correlation Analysis

As shown in Table 5, the grain yield was significantly positively correlated with seed number, reproductive biomass at R5, crop growth rate, and seed set efficiency (p < 0.01). The seed number was also significantly positively correlated with reproductive biomass at R5, crop growth rate and seed set efficiency (p < 0.01). There was a significant positive correlation between reproductive biomass at R5 and reproductive partitioning (p < 0.01). The crop growth rate had a significant positive correlation with seed set efficiency (p < 0.01), but significantly negatively correlated with reproductive partitioning (p < 0.01). Moreover, the reproductive partitioning was negatively correlated with seed set efficiency, while not at a significant level (p > 0.05).

4. Discussion

4.1. Variation of Yield and Yield Components among Soybean Cultivars in Strip Intercropping

The growth of soybean was hindered by the shading of the upper layer crops during the co-growth period, and the grain yield was significantly decreased in intercropping [31]. In this study, four soybean cultivars with similar yield and development processes in monoculture were adopted. The grain yield of soybean was significantly decreased by more than 50% when intercropped with maize from 2015 to 2017 (Table 3). These results agree with the reports by Liu et al. [31]. Moreover, there were significant differences in grain yield among cultivars under intercropping. The grain yield of cvs. ZH39 and QH34 under intercropping were decreased by an average of 60% less than that of cvs. HD19 and HD20 (by an average of 72% and 70%) compared to monoculture, respectively. Finally, the grain yield of cvs. ZH39 and QH34 was significantly higher than that of cvs. HD19 and HD20 when intercropped with maize (Table 3).
Under shading, the yield variation among cultivars was related to the range of grain number [32]. Many studies confirmed that the availability of photosynthate from soybean leaves significantly affects the grain number [22,23,30]. Previous studies showed the pod and seed number of soybean were significantly reduced by the negative effects of shading during the co-growth period, but not for seed size in maize and soybean intercropping systems [4,31]. Lesoing and Francis [33] found the seed number of soybean on border rows near the maize strip was significantly lower than that in the middle rows in maize and soybean intercropping, but the seed size had no changes. These results suggested that the shading hindered the formation of the reproductive structures in soybean while not affected the seed filling processes. Similar results were obtained in our study. Intercropping significantly reduced the pod and seed numbers per unit area of soybean. Under intercropping, the average decrease in the pod number of cvs. ZH39 and QH34 was 52% and 53% and the decrease in seed number was 59%, respectively. However, the average decrease in the pod numbers of cvs. HD19 and HD20 was 66% and 65% and the average decrease in seed number was 71% and 68%, respectively (Table 3). Therefore, cvs. ZH39 and QH34 produced more reproductive structures than cvs. HD19 and HD20, which resulted in the achievement of higher grain yield. This was similar to the yield differences in other crops, in which crop species with a stronger shade tolerance can produce more grains under low light conditions [15,16].
Intercropping also significantly reduced the harvest index of soybean [6,31]. Similar results were observed in the present study. Besides, we also found the harvest index among cultivars was significantly different in intercropping. In most cases, the harvest index of cvs. HD19 and HD20 was lower than that of cv. ZH39, but this was not found in cv. QH34 (Table 3). Further, it is necessary to explore the processes of the difference in harvest index among cultivars under intercropping [34].

4.2. Variation of Photosynthetic Production and Biomass Accumulation among Soybean Cultivars in Strip Intercropping

In maize–soybean intercropping systems, the development of the two combined crops are synchronous and the co-growth period is throughout the whole growth duration from sowing to harvest [6,7]. The main stem nodes and the individual leaf area of intercropped soybean was less than that of monoculture with the PAR decreased after the initial flowering stage, and that induced the LAI of intercropped soybean was lower than that of monoculture [7]. Our results showed that the LAI of intercropped soybean decreased by an average of more than 35% at 10–40 days after flowering (Figure 3). However, there was no significant difference in LAI after flowering among soybean cultivars both in monoculture and intercropping, which indicate that the changes in leaf area of different intercropped soybean cultivars are similar.
In the present study, we found intercropping significantly reduced the Pn of soybean leaves at 10, 20, and 40 days after flowering, with an average decrease of 6%, 8%, and 11%, respectively (Figure 5B,C). In addition, the Pn of different intercropped soybean cultivars only showed a significant difference at 10 and 40 days after flowering, in which the Pn of cv. QH34 was significantly higher than those of the other three cultivars, but with no significant difference among the other cultivars. We also found intercropping only significantly increased chlorophyll content (SPAD values) of soybean plants at seed filling stages, and the difference of soybean cultivars was only at 25–40 days after flowering, and the chlorophyll content of cv. ZH39 was lower than those of the other three cultivars (Figure 4). In summary, the response of soybean photosynthetic characteristics (i.e., LAI, Pn, and chlorophyll content) to maize shading under intercropping caused a significant decrease in total biomass after flowering. Meanwhile, the photosynthetic capacity among cultivars had no significant difference at 0–30 days after flowering, which explains that different soybean cultivars have similar photosynthate accumulation from flowering to the beginning of seed filling (Figure 6).

4.3. Variation of Seed Number Determinations among Soybean Cultivars in Strip Intercropping

The seed number of soybean were determined gradually from the beginning of flowering to a few days after seed filling [22,23]. Egli and Yu [19] investigated the relationship between canopy photosynthesis (i.e., estimated as the crop growth rate between R1 and R5) and seeds per unit area by referring to the model proposed by Charles-Edwards [26]. The results showed there was a linear relationship between the CGR and the seeds per unit area of soybean in different years and treatments. Moreover, Egli [24] considered that CGR was more important than other reproductive characteristics in seed number determinations and the stabilized linear relationship may be the result of species evolution and long-term selection by breeders. In the present study, we found that intercropping had a significant impact on the CGR between R1 and R5 of soybean, and then significantly reduced the CGRR1–R5. Besides, the seed number of soybean was also significantly reduced by intercropping (Table 3 and Table 4). It implied the seed number of soybean and CGRR1–R5 show a linear relationship when the planting pattern was transformed. However, under intercropping, the CGRR1–R5 showed no significant difference among cultivars (Table 4) and did not correlate with reproductive biomass at R5 (Table 5).
In the processes of seed set, the photoassimilate is partially distributed to reproductive structures, so that the model of seed number estimation should include the factors of photoassimilate distribution [27]. Rotundo et al. [25] used a physiological framework based on a modified Charles–Edwards [26] model and redefined the reproductive characteristics to explain the variation in seed number per unit area. In this study, cultivars only had a significant influence on seed set efficiency, while planting patterns had a significant impact on reproductive partitioning and seed forming efficiency. Shading could significantly improve reproductive partitioning in two growing seasons (Table 4). This may partially explain the physiological reasons why intercropping increases the radiation use efficiency (RUE) of soybean [9].
The four soybean cultivars had consistent growth and development processes under monoculture and intercropping so that they had the same duration of seed set period. The CGRR1–R5 was also similar among cultivars in intercropping. The reproductive partitioning was estimated by the duration of seed set period, CGRR1–R5, and reproductive biomass at R5, and the seed set efficiency was determined by the seed number at maturity and reproductive biomass at R5. Therefore, the reproductive partitioning and seed set efficiency of different cultivars would be varied by the reproductive biomass at R5 (Table 4). Besides, both reproductive partitioning and seed set efficiency have the same parameter (i.e., reproductive biomass at R5), which induce them to be negatively correlated in the numerical calculation (Table 5). Moreover, Egli et al. [35] reported that biomass accumulation and partitioning of soybean reproductive structures changed exponentially with time after R3. So that before comparing the reproductive characteristics of different cultivars, it is necessary to precisely determine the phenological stages of soybean. In summary, after evaluating the relationship between seed number and reproductive characteristics among soybean cultivars, the significant differences of reproductive biomass at R5 in intercropped soybean cultivars caused the yield differences among cultivars.

5. Conclusions

In the current study, the grain yield of soybean was significantly decreased by intercropping and there were significant differences in intercropped soybean cultivars. Under intercropping, the high-yielding cultivars had more pods and seeds. On the one hand, the photosynthetic production of the different cultivars was not shown to have significant differences in intercropping during the critical seed set periods. However, on the other hand, the reproductive biomass at R5 was found to be significantly different in soybean cultivars. Besides, when the planting pattern transformed from monoculture to intercropping, the reproductive partitioning and seed set efficiency of different cultivars were varied depending on the reproductive biomass at R5. Therefore, the results suggest that the differences in reproductive biomass at R5 explain the grain yield differences in intercropped soybean cultivars.

Author Contributions

Conceptualization, X.W. (Xingcai Wang) and W.Y.; Formal analysis, X.W. (Xingcai Wang), X.W. (Xiaoling Wu), G.D.; Investigation, X.W. (Xingcai Wang), X.W. (Xiaoling Wu), and G.D.; Methodology, X.W. (Xiaoling Wu), F.Y., T.Y., and X.W.(Xiaochun Wang); Funding acquisition, W.Y.; Writing-original draft, X.W. (Xingcai Wang); Writing-review & editing, F.Y., T.Y., and X.W. (Xiaochun Wang), and W.Y. All authors have read and agreed to the published version of the manuscript.

Funding

This research was supported by the National Key Research and Development Program of China (no. 2016YFD0300209), and Program on Industrial Technology System of National Soybean (no. CARS-04-PS19).

Conflicts of Interest

The authors declare no conflict of interest.

References

  1. Zhang, F.; Li, L. Using competitive and facilitative interactions in intercropping systems enhances crop productivity and nutrient-use efficiency. Plant Soil 2003, 248, 305–312. [Google Scholar] [CrossRef]
  2. Lithourgidis, A.; Dordas, C.; Damalas, C.A.; Vlachostergios, D. Annual intercrops: An alternative pathway for sustainable agriculture. Aust. J. Crop Sci. 2011, 5, 396–410. [Google Scholar]
  3. Regehr, A.; Oelbermann, M.; Videla, C.; Echarte, L. Gross nitrogen mineralization and immobilization in temperate maize-soybean intercrops. Plant Soil 2015, 391, 353–365. [Google Scholar] [CrossRef]
  4. Carruthers, K.; Prithiviraj, B.; Fe, Q.; Cloutier, D.; Martin, R.; Smith, D. Intercropping corn with soybean, lupin and forages: Yield component responses. Eur. J. Agron. 2000, 12, 103–115. [Google Scholar] [CrossRef]
  5. Prasad, R.; Brook, R. Effect of varying maize densities on intercropped maize and soybean in Nepal. Exp. Agric. 2005, 41, 365–382. [Google Scholar] [CrossRef]
  6. Gao, Y.; Duan, A.; Qiu, X.; Sun, J.; Zhang, J.; Liu, H.; Wang, H. Distribution and use efficiency of photosynthetically active radiation in strip intercropping of maize and soybean. Agron. J. 2010, 102, 1149–1157. [Google Scholar] [CrossRef]
  7. Yang, F.; Liao, D.; Wu, X.; Gao, R.; Fan, Y.; Raza, M.A.; Wang, X.; Yong, T.; Liu, W.; Liu, J. Effect of aboveground and belowground interactions on the intercrop yields in maize-soybean relay intercropping systems. Field Crop. Res. 2017, 203, 16–23. [Google Scholar] [CrossRef]
  8. Du, J.; Han, T.; Gai, J.; Yong, T.; Sun, X.; Wang, X.; Yang, F.; Liu, J.; Shu, K.; Liu, W. Maize-soybean strip intercropping: Achieved a balance between high productivity and sustainability. J. Integr. Agric. 2018, 17, 747–754. [Google Scholar] [CrossRef] [Green Version]
  9. Liu, X.; Rahman, T.; Song, C.; Yang, F.; Su, B.; Cui, L.; Bu, W.; Yang, W. Relationships among light distribution, radiation use efficiency and land equivalent ratio in maize-soybean strip intercropping. Field Crop. Res. 2018, 224, 91–101. [Google Scholar] [CrossRef]
  10. Yu, Y.; Stomph, T.-J.; Makowski, D.; Van Der Werf, W. Temporal niche differentiation increases the land equivalent ratio of annual intercrops: A meta-analysis. Field Crop. Res. 2015, 184, 133–144. [Google Scholar] [CrossRef]
  11. Andrade, J.F.; Cerrudo, A.; Rizzalli, R.H.; Monzon, J.P. Sunflower–soybean intercrop productivity under different water conditions and sowing managements. Agron. J. 2012, 104, 1049–1055. [Google Scholar] [CrossRef]
  12. Yang, F.; Wang, X.; Liao, D.; Lu, F.; Gao, R.; Liu, W.; Yong, T.; Wu, X.; Du, J.; Liu, J. Yield response to different planting geometries in maize–soybean relay strip intercropping systems. Agron. J. 2015, 107, 296–304. [Google Scholar] [CrossRef]
  13. Franklin, K.A. Shade avoidance. New Phytol. 2008, 179, 930–944. [Google Scholar] [CrossRef] [PubMed]
  14. Valladares, F.; Niinemets, Ü. Shade tolerance, a key plant feature of complex nature and consequences. Annu. Rev. Ecol. Evol. Syst. 2008, 39, 237–257. [Google Scholar] [CrossRef] [Green Version]
  15. Li, H.; Jiang, D.; Wollenweber, B.; Dai, T.; Cao, W. Effects of shading on morphology, physiology and grain yield of winter wheat. Eur. J. Agron. 2010, 33, 267–275. [Google Scholar] [CrossRef]
  16. Wang, L.; Deng, F.; Ren, W. Shading tolerance in rice is related to better light harvesting and use efficiency and grain filling rate during grain filling period. Field Crop. Res. 2015, 180, 54–62. [Google Scholar] [CrossRef]
  17. Su, B.; Song, Y.; Song, C.; Cui, L.; Yong, T.; Yang, W. Growth and photosynthetic responses of soybean seedlings to maize shading in relay intercropping system in Southwest China. Photosynthetica 2014, 52, 332–340. [Google Scholar] [CrossRef]
  18. Jiang, H.; Egli, D. Shade induced changes in flower and pod number and flower and fruit abscission in soybean. Agron. J. 1993, 85, 221–225. [Google Scholar] [CrossRef]
  19. Egli, D.B.; Yu, Z.W. Crop growth rate and seeds per unit area in soybean. Crop Sci. 1991, 31, 439–442. [Google Scholar] [CrossRef]
  20. Kantolic, A.G.; Slafer, G.A. Photoperiod sensitivity after flowering and seed number determination in indeterminate soybean cultivars. Field Crop. Res. 2001, 72, 109–118. [Google Scholar] [CrossRef]
  21. Kantolic, A.G.; Peralta, G.E.; Slafer, G.A. Seed number responses to extended photoperiod and shading during reproductive stages in indeterminate soybean. Eur. J. Agron. 2013, 51, 91–100. [Google Scholar] [CrossRef]
  22. Board, J.; Tan, Q. Assimilatory capacity effects on soybean yield components and pod number. Crop Sci. 1995, 35, 846–851. [Google Scholar] [CrossRef]
  23. Jiang, H.; Egli, D.B. Soybean seed number and crop growth rate during flowering. Agron. J. 1995, 87, 264–267. [Google Scholar] [CrossRef]
  24. Egli, D.B. Crop growth rate and the establishment of sink size: A comparison of maize and soybean. J. Crop Improv. 2019, 33, 346–362. [Google Scholar] [CrossRef]
  25. Rotundo, J.L.; Borrás, L.; De Bruin, J.; Pedersen, P. Physiological strategies for seed number determination in soybean: Biomass accumulation, partitioning and seed set efficiency. Field Crop. Res. 2012, 135, 58–66. [Google Scholar] [CrossRef]
  26. Charles-Edwards, D. On the ordered development of plants 1. An hypothesis. Ann. Bot. 1984, 53, 699–707. [Google Scholar] [CrossRef]
  27. Vega, C.R.C.; Andrade, F.H.; Sadras, V.O. Reproductive partitioning and seed set efficiency in soybean, sunflower and maize. Field Crop. Res. 2001, 72, 163–175. [Google Scholar] [CrossRef]
  28. Hiebsch, C.; Tetio-Kagho, F.; Chirembo, A.; Gardner, F. Plant density and soybean maturity in a soybean-maize intercrop. Agron. J. 1995, 87, 965–969. [Google Scholar] [CrossRef]
  29. Fehr, W.R.; Caviness, C.E. Stages of Soybean Development; Iowa State University. Agricultural and Home Economics Experiment Station: Ames, IA, USA, 1977. [Google Scholar]
  30. Board, J.; Wier, A.; Boethel, D. Source strength influence on soybean yield formation during early and late reproductive development. Crop Sci. 1995, 35, 1104–1110. [Google Scholar] [CrossRef]
  31. Liu, X.; Rahman, T.; Song, C.; Su, B.; Yang, F.; Yong, T.; Wu, Y.; Zhang, C.; Yang, W. Changes in light environment, morphology, growth and yield of soybean in maize-soybean intercropping systems. Field Crop. Res. 2017, 200, 38–46. [Google Scholar] [CrossRef]
  32. Slafer, G.; Calderini, D.; Miralles, D.; Dreccer, M. Preanthesis shading effects on the number of grains of three bread wheat cultivars of different potential number of grains. Field Crop. Res. 1994, 36, 31–39. [Google Scholar] [CrossRef]
  33. Lesoing, G.W.; Francis, C.A. Strip intercropping effects on yield and yield components of corn, grain sorghum, and soybean. Agron. J. 1999, 91, 807–813. [Google Scholar] [CrossRef]
  34. Hay, R. Harvest index: A review of its use in plant breeding and crop physiology. Ann. Appl. Biol. 1995, 126, 197–216. [Google Scholar] [CrossRef]
  35. Egli, D.B.; Guffy, R.; Leggett, J. Partitioning of Assimilate Between Vegetative and Reproductive Growth in Soybean. Agron. J. 1985, 77, 917–922. [Google Scholar] [CrossRef]
Figure 1. Daily temperature and rainfall of field experiments during three growing seasons at Heze city in 2015 (A) and Zhengzhou city in 2016 (B) and 2017 (C), respectively.
Agronomy 10 00110 g001
Figure 2. Spatial configurations of each treatment in the field experiment from 2015 to 2017, including soybean monoculture (A) and two bandwidth intercropping treatments, INT1 (B) and INT2 (C).
Agronomy 10 00110 g002
Figure 3. Dynamic changes of leaf area index (LAI) for the different soybean cultivars (●: HD19; ○: HD20; ▼: ZH39, and △: QH34) under different planting patterns (A, B and C for M0; D,E and F for INT1; G,H and I for INT2) at the days after anthesis during 2015–2017. Each value is the mean (n = 3) ± S.E.
Agronomy 10 00110 g003
Figure 4. Dynamic changes of chlorophyll content (SPAD values) for the different soybean cultivars (●: HD19; ○: HD20; ▼: ZH39, and △: QH34) under the M0 (A), INT1 (B) and INT2 (C) at days after flowering during 2015–2017. Each value is the mean (n = 9) ± S.E.
Agronomy 10 00110 g004
Figure 5. Dynamic changes of net photosynthesis rate (Pn) for the different soybean cultivars (●: HD19; ○: HD20; ▼: ZH39, and △: QH34) under the M0 (A), INT1 (B), and INT2 (C) at 10, 20, 40, and 50 days after flowering (corresponding to the different growth stages within R2, R4, R6, and R6.5, respectively) in 2015. Each value is the mean (n = 9) ± S.E.
Agronomy 10 00110 g005
Figure 6. Dynamic changes of above-ground total biomass for the different soybean cultivars (●: HD19; ○: HD20; ▼: ZH39 and △: QH34) under different planting patterns (A,B and C for M0; D,E and F for INT1; G,H and I for INT2, respectively) at the days after flowering during 2015–2017. Each value is the mean (n = 3) ± S.E.
Agronomy 10 00110 g006
Table 1. Information on the experimental cultivars.
Cultivar Branch Number (Plant−1) Growth HabitReleased (year)Origin from Institute
HD191.4Determinate2010Heze Academy of Agricultural Sciences
HD201.9Determinate2010Heze Academy of Agricultural Sciences
ZH391.8Determinate2010Chinese Academy of Agricultural Sciences
QH341.9Determinate2012Shandong Academy of Agricultural Sciences
Abbreviation for the cvs. Hedou19, Hedou20, Zhonghuang39, and Qihaung34, respectively. The effective branch number was from the breeding reports under sole cropping.
Table 2. The growth stages of soybean cultivars under the different planting patterns in 2015–2017.
Phenology201520162017
DateDays after Sowing (d)DateDays after Sowing (d)DateDays after Sowing (d)
Sowing17 June014 June013 June0
VE23 June619 June518 June5
R127 July40 (0) 22 July38 (0)22 July39 (0)
R520 August64 (24)17 August64 (26)17 August65 (26)
R66 September81 (41)2 September80 (42)1 September80 (41)
R721 September96 (56)18 September96 (58)18 September97 (58)
The number within the brackets refer to the days after flowering. The growth stages (VE: emergence; R1: beginning flowering; R5: beginning seed; R6: full seed; R7: beginning maturity) were according to descriptions from Fehr and Caviness (1977). The development of soybean plants between monoculture and intercropping was similar in this study.
Table 3. Analysis of variance of grain yield and yield components among soybean cultivars under the different planting patterns during 2015–2017.
YearCultivarGrain Yield (kg ha−1)Pod Number (No.m−2)Seed Number (No.m−2)Seed Size (mg)Harvest Index
M0INT1INT2M0INT1INT2M0INT1INT2M0INT1INT2M0INT1INT2
2015HD193422a950b927b721a217b236b1446a394b390b237b241a238b0.48a0.45a0.44b
HD203323a979b909b746a239b233b1353b408b386b245b240a236b0.49a0.46a0.45ab
ZH393417a1448a1214a751a306a323a1430a603a518a239b240a235b0.48a0.46a0.48a
QH343293a1450a1198a655b302a310a1266c572a463ab260a254a259a0.48a0.46a0.46ab
2016HD193471a863b1083ab635a212b240b1475a369b445a235b234b243ab0.47ab0.45ab0.44b
HD203227b982b1059b624a223b239b1333bc404b444a242ab243ab239b0.48ab0.44b0.44b
ZH393301ab1256a1296a638a330a316a1394ab530a547a237b237b238b0.49a0.46a0.47a
QH343170b1240a1218ab619a305a307a1238c488ab473a257a254a258a0.46b0.45ab0.45ab
2017HD193510a1087c1031c698a244b250c1507a489b431b233b223b240b0.48a0.44b0.44b
HD203558a1137bc1098bc664b235b234c1489a495b492b239b230b223b0.48a0.44b0.45ab
ZH393410a1511a1472a674ab334a354a1512a681a651a226b222b226b0.48a0.47a0.46a
QH343456a1431ab1371ab669ab318a313b1326b564ab537ab260a254a256a0.49a0.47a0.45ab
ANOVAdf
Cultivar (C)326.1 ** 67.9 ** 26.5 ** 45.5 ** 9.7 **
Planting pattern (P)23699.9 ** 4584.7 ** 2931.9 ** 1.5 ns 83.3 **
Year (Y)213.0 ** 21.2 ** 20.6 ** 9.8 ** 3.2 *
C × P611.2 ** 21.9 ** 14.5 ** 1.6 ns 3.1 **
C × Y60.9 ns 2.2 ns 1.1 ns 1.3 ns 0.8 ns
P × Y42.8 * 19.2 ** 1.8 ** 1.0 ns 0.5 ns
C × P × Y120.5 ns 2.0 * 0.4 ns 0.4 ns 0.9 ns
Means with the same letter in each column indicate no significant difference (p > 0.05) among different soybean cultivars. F-value was for different probability levels (ns: not significant, * p < 0.05, ** p < 0.01).
Table 4. Analysis of variance for seed number determinant parameters among soybean cultivars under different planting patterns during 2015–2017.
YearCultivarReproductive Biomass (g m−2)Crop Growth Rate (g m−2 d-1)Partitioning Coefficient (g g−1)Seed set efFiciency (Seed g−1)
M0INT1INT2M0INT1INT2M0INT1INT2M0INT1INT2
2015HD19199.6a73.6b79.0a19.5a9.0a9.1a0.34a0.27b0.29a7.2ab5.4b5.0b
HD20182.1b73.6b79.4a20.0a9.0a9.1a0.30b0.27b0.29a7.5ab5.5b4.9b
ZH39184.2b92.7a87.1a20.1a9.9a9.8a0.30b0.31a0.30a7.8a6.5a5.9a
QH34180.5b87.8a82.3a19.2a9.6a9.8a0.31ab0.31a0.28a7.0b6.5a5.6a
2016HD19215.1a98.8a94.2a21.1a8.3b8.1ab0.34a0.40a0.39ab6.9a3.7c4.7b
HD20204.1ab93.3a94.3a20.4ab8.7b7.7b0.33a0.36ab0.41a6.5ab4.3bc4.7b
ZH39199.5b97.8a97.8a20.0b9.5a8.7a0.33a0.34b0.37ab7.0a5.5a5.6a
QH34210.1ab101.1a95.2a20.1b8.4b8.7a0.35a0.40a0.36b5.9b4.9ab5.0ab
2017HD19191.2a92.4b85.8b22.2a9.0a8.8a0.29a0.34b0.33b7.9a5.3ab5.0a
HD20193.8a97.8b93.4b22.7a9.5a9.1a0.28a0.35b0.34b7.7a5.0b5.3a
ZH39180.2b109.4a110.2a21.3b9.7a9.3a0.28a0.37a0.39a8.4a6.2a5.9a
QH34178.3b106.2a104.8a21.2b9.4a9.4a0.28a0.37a0.38a7.4a5.3ab5.1a
ANOVAdf
Cultivar (C)33.4 * 2.6 ns 2.2 ns 19.2 **
Planting pattern (P)22907.7 ** 5451.4 ** 33.2 ** 208.2 **
Year (Y)263.3 ** 30.3 ** 125.0 ** 37.7 **
C × P610.0 ** 5.8 ** 4.0 ** 3.8 **
C × Y62.7 * 1.7 ns 4.4 ** 0.9 ns
P × Y416.2 ** 19.1 ** 32.8 ** 6.8 **
C × P × Y121.6 ns 1.0 ns 3.3 ** 0.7 ns
Means with the same letter in each column indicate no significant difference (p > 0.05) among different soybean cultivars in one growing season. F-value was for different probability levels (ns, not significant; * p < 0.05; ** p < 0.01).
Table 5. Correlation analysis of grain yield and seed number, reproductive biomass, and seeds determined parameters among soybean cultivars under intercropping during 2015–2017.
SourceGYSNRBCGRR1–R5PartCoefSetEff
GY-0.956 **0.646 **0.536 **0.2530.732 **
SN -0.677 **0.556 **0.2670.746 **
RB -0.0010.838 **0.021
CGRR1–R5 -−0.536 **0.754 **
PartCoef -−0.39
SetEff -
GY: grain yield; SN: seed number per unit area; RB: reproductive biomass at R5; CGRR1–R5: crop growth rate between R1 and R5; PartCoef: partitioning coefficient; SetEff: seed set efficiency. ** p < 0.01.

