Article

High-Temperature Hay Biochar Application into Soil Increases N2O Fluxes

1
Institute of Agricultural and Environmental Sciences, Estonian University of Life Sciences, 51006 Tartu, Estonia
2
Department of Geography, Institute of Ecology and Earth Sciences, University of Tartu, 50090 Tartu, Estonia
*
Author to whom correspondence should be addressed.
Agronomy 2020, 10(1), 109; https://doi.org/10.3390/agronomy10010109
Submission received: 27 November 2019 / Revised: 27 December 2019 / Accepted: 8 January 2020 / Published: 11 January 2020

Abstract

:
Biochar has been proposed as an amendment that can improve soil conditions, increase harvest yield, and reduce N losses through NO3 leaching and N2O emissions. We conducted an experiment to test the hay biochar mitigation effect on N2O emissions depending on its production temperature. The pot experiment consisted of the soil amendment with three different production temperature biochars (300 °C, 550 °C, 850 °C) alone and in combination with three different organic fertilizers (cattle slurry, slurry digestate, vinasse), in growth chamber conditions. The effects of biochar and fertilizer were both significant, but the interaction biochar:fertilizer was not. The amendment with the three fertilizer types and with the highest production temperature biochar resulted in significantly higher cumulative N2O fluxes. Biochar did not show a mitigation effect on N2O emissions when applied with organic fertilizer. Cumulative emissions were higher with biochar addition, with increasing emissions for increasing biochar production temperature. Our results support the idea that biochar cannot be considered as a universal tool for the reduction of N2O emissions.

1. Introduction

The urge to reduce emissions of greenhouse trace gasses (GHG) is generally acknowledged [1], with special focus on nitrous oxide (N2O) due to its high global warming potential [2], and for being the main ozone-depleting substance [3]. Anthropogenic sources of N2O account for almost 40% of global emissions, of which, agriculture represents 67%–80% [4]. Nitrogen fertilization, both organic and inorganic, is the main factor explaining the contribution of agriculture to N2O emissions [4,5].
N2O emissions from the soil are the product of two main processes: nitrification and denitrification [6,7]. Soil water content, soil temperature, soil pH, soil ammonium and nitrate content and carbon (C) availability are some of the key factors that regulate the prevalence of one of these processes as well as its importance.
Organic fertilization is the main fate of manure slurry [8], a by-product of livestock farms rich in NH4+, but it has been found to produce higher N2O emissions than synthetic fertilizer for the same amount of applied nitrogen [9,10]. Slurry digestate is the by-product of anaerobic digestion of slurry, also used for fertilization [11], and can have a higher NH4+ content than the original slurry [12]. Digestion of slurry reduces emissions of CH4 [13] but does not significantly reduce N2O emissions [14]. Vinasse is usually the by-product of sugar and ethanol production and it has also been reported to have higher N2O emissions than inorganic fertilizers [15,16].
Biochar, a carbon-rich material produced from organic matter by heating under low oxygen conditions (pyrolysis) [17,18], has been proposed as an amendment that can improve soil conditions and increase crop yield, especially for soils with small cation exchange capacity and low organic carbon content and pH [19,20], but also reduce N losses through NO3 leaching and N2O emissions into the atmosphere [21].
Recent meta-analyses have reported average reductions of N2O emissions for lab and field experiments between 32% and 54% [21,22,23] after biochar application. However, there are also studies indicating no effect from biochar application on N2O emissions [24,25,26,27] as well as increased emissions [28,29,30], and studies showing opposite outcomes by applying the same biochar to different soils [31,32,33].
The mechanisms by which biochar amendment reduces N2O emissions are not completely understood [30], and different hypothesis have been proposed: NO3 immobilization by biochar [21], reduction of organic matter degradation and soil C mineralization, a reduction that increases as biochar production temperature increases [34], and alteration of the microbial denitrifying communities [35], including the increase in abundance of N2O reductase bacteria, resulting in a reduced the N2O:N2 ratio [36], likely due to the increase of soil pH after biochar application [37,38]. Biochar can also sequester C [21,39,40], reducing available labile C, which is one of the factors controlling denitrification. On the other hand, it has been reported that biochar amendment can increase N2O emissions [33,41], what has been generally associated to an enhancement of nitrification [13,24]. Results of previous studies suggest that the effect of biochar on N2O fluxes depends on its properties, which are influenced by feedstock material and pyrolysis temperature [42,43], with a key role of pyrolysis temperature as it influences biochar surface area and aromacity [44], as well as pH [45], capacity to adsorp NO3 and NH4+ [23,46], and C sequestration [47]. The big variability in the effect on N2O emissions reported for different types of biochar, depending of its feedstock, production temperature, and method, highlights the need for a comprehensive study of different types of biochar and its effect on N2O emissions [48], especially in combination with other soil amendments commonly used in agriculture, like organic fertilizers.
We studied N2O emissions from a soil amended with pelletized hay biochar produced at three different temperatures (300 °C, 550 °C, and 850 °C) and three organic fertilizers (cattle slurry, yeast industry residue vinasse, and slurry digestate) separately and in mixture.
We hypothesized that: (i) organic fertilizer would produce higher emissions, (ii) hay biochar application would result in reduced N2O emissions both for fertilized and unfertilized soil, and (iii) the effect of biochar on N2O emissions would depend on its production temperature.

2. Materials and Methods

2.1. Experimental Design

The experiment was conducted in a growing chamber in the Institute of Agricultural and Environmental Sciences of the Estonian University of Life Sciences, between June and August of 2017, under controlled conditions over 60 days. Two treatments were applied, biochar production temperature and type of organic fertilizer, each consisting in four different levels: control and biochar produced at 300 °C, 550 °C, and 850 °C (hereafter Control, BC300, BC550, and BC850, respectively) for biochar production temperature, control, cattle slurry, slurry digestate, and vinasse (hereafter Control, CS, SD, and VN, respectively), for the type of organic fertilizer, and pure soil.
Pots built from polyvinyl chloride (PVC) were used in the experiment. The dimensions of the pots were 110 mm diameter and 30 cm height, and the volume of soil in the pots was 2.4 L.
The substrate in the pots was divided in two layers: a lower layer (depth between 10 and 27 cm) of 2000 g of air-dry soil, and an upper layer (depth between 0 and 10 cm), where 1200 g of soil was mixed with biochar and/or organic fertilizer depending on the treatment. The characterization of this layer for the 16 combinations of the factor treatments can be found in Table 1. The amount of manure applied was derived from common practices for croplands in the Baltic region [49]. The weight of fertilizer amendment was 0.053% for VN and 0.813% for CS and SD of the total weight of un-amended soil. The amount of biochar applied is the most common application rate [50]. The weight of biochar represented 0.272% of the total un-amended soil weight for all treatments.
The soil used in the experiment was a sandy loam (73% sand, 22% silt, 5% clay) excavated from the A horizon of a permanent grassland on Dystric Endostagnic Glossic Retisol (Colluvic) (FAO World Reference Base). Soil pHKCl was 4.46, and Ntot, Ctot, Ptot, Ktot, Catot, and Mgtot concentrations were 0.7, 12.4, 0.214, 0.715, 0.538, and 1.48 g kg−1, respectively.

2.2. Biochar

Hay from a permanent grassland dominated by reed canary grass (Phalaris arundinacea L.), cut at the seed ripening phase, was pressed into granules of 10–20 mm in length and 7 mm diameter. These granules were torrefied in the Fraunhofer Institute in Germany (Fraunhofer Institute for Environmental, Safety, and Energy Technology, Sulzbach-Rosenberg, Germany) at a temperature of 300 °C. Torrefaction is a mild pyrolysis, with lower temperatures, but also in the absence of oxygen [51,52]. These torrefied granules (hereafter BC300) were afterward pyrolyzed at 550 °C or 850 °C (hereafter BC550 and BC850, respectively) in the Lithuanian Energy Institute (Lietuvos Energetikos Institutas, Kaunas, Lithuania). The pyrolysis was performed with a slow pyrolysis reactor under laboratory conditions. A container filled with 22 L of the torrefied hay pellets was inserted into the furnace. Before heating, N2, at a rate of at 15 L min−1, was blown through the bottom of the furnace. The furnace was kept at the desired temperature (550 or 850 °C) for one hour. After the pyrolysis, the resulting biochar was left to cool in a closed device for 24 h. The pH for the different biochars ranged from 6.8 for BC300 to 11.8 for BC850 and the C/N ratio from 19.0 for BC300 to 26.6 for BC850 (Table 2). Further details of the different biochar properties can be found in Raave et al. [53].

2.3. Fertilizers

The fertilizers used in the experiment were cattle slurry (CS), yeast industry residue vinasse (VN), and cattle slurry digestate (SD). The pH of the three fertilizers was 4.5, 7.5, and 7.9 for vinasse, cattle slurry, and slurry digestate respectively (Table 3), and the NH4+-N content ranged between 0.214 for cattle slurry and 0.27 (%) for vinasse, with no detectable presence of NO3-N.
The combination of the amount of fertilizer applied (Table 1) and the dry matter content in each fertilizer results in the total amount of dry matter applied (cattle slurry: 29,275 kg/m2; slurry digestate: 19,425 kg/m2; vinasse: 11,986 kg/m2).

2.4. Cover Crop

The vegetation cover consisted of ryegrass (Lolium perenne L.). Into each pot, 100 ryegrass seeds were sown, after filling the pots with the substrate and watering to field capacity. During the experiment, the growth room air temperature was kept at 17 °C and air relative humidity at 60%, with a 13:11 h light:dark cycle. All pots were watered with the same amount of water three times a week, at a rate of 125 mL pot−1 during the first growing period (0–30 days) and 150 mL pot−1 during the second growing period (30–60 days). The water amount was calculated to avoid leaching and adjusted according to plant biomass size. Plants were harvested at the end of each growing period. The week before harvesting, watering was increased by 25 mL pot−1.

2.5. Flux Measurements

Flux measurements were carried out by the static closed chamber method [54] between June and August of 2017. The PVC chambers had the same dimensions as the pots, with 110 mm diameter and 30 cm height, and a total volume of 2.4 L. They were designed to fit inside the neck of the pots, achieving a hermetic sealing. The chambers had two holes, one for the sample extraction pipe, and the second for the temperature sensor. Trace gas measurements were carried out weekly, always the next day after watering to assure that the pots had a similar moisture level during all measurement dates.
Gas samples were collected during one hour in 20 min intervals (0, 20, 40, 60 min) into 12 mL pre-evacuated (0.04 mbar) bottles [55].
The gas concentration in the collected air was determined using the Shimadzu GC-2014 gas chromatography system (Shimadzu Corporation, Kyoto, Japan) equipped with an electron capture detector (ECD) and a flame ionization detector (FID). The system is based on the automated gas chromatographic system described by Loftfield et al. [56] and is located in the Department of Geography of the Institute of Ecology and Earth Sciences at the University of Tartu (Estonia).
The N2O flux was calculated from the slope of the least-squares linear regression of the N2O concentrations versus time [57,58], using the equation:
f   =   d C d t · V A
where f is the flux of N2O (ppm[v] s−1 m−2), C is the N2O concentration in the chamber headspace (ppm(v)), t is time (s), V is the volume of the chamber headspace (m3), and A is the surface entailed by the chamber (m2). Thus, dC/dt is the rate of change in concentration with time (ppm(v) s−1).
Three replicates for each of the treatments were sampled. The adjusted R2 value of the linear regression is used to check the quality of the chamber measurement, and if necessary, one of the observations is discarded, using the remaining three for the linear fit [58].
The cumulative flux was calculated as the time-integration of the total daily fluxes, after gap-filling by linear interpolation between measurement points [59].

2.6. Fourier Transformed Infrared Spectrophotometer (FTIR) Analysis

Fourier transformed infrared spectrophotometer (FTIR) analyses of the different biochars was carried out using the Thermo-Nicolet iS10 Fourier transformed infrared spectrophotometer (FTIR, Thermo Fisher Scientific, Waltham, MA, USA), with a 4 cm−1 resolution over the range from 4000 to 400 cm−1, and 32 scans per analysis. The resulting spectra were corrected against the ambient air spectrum as background, applying an automated baseline correction.

2.7. Statistical Analysis
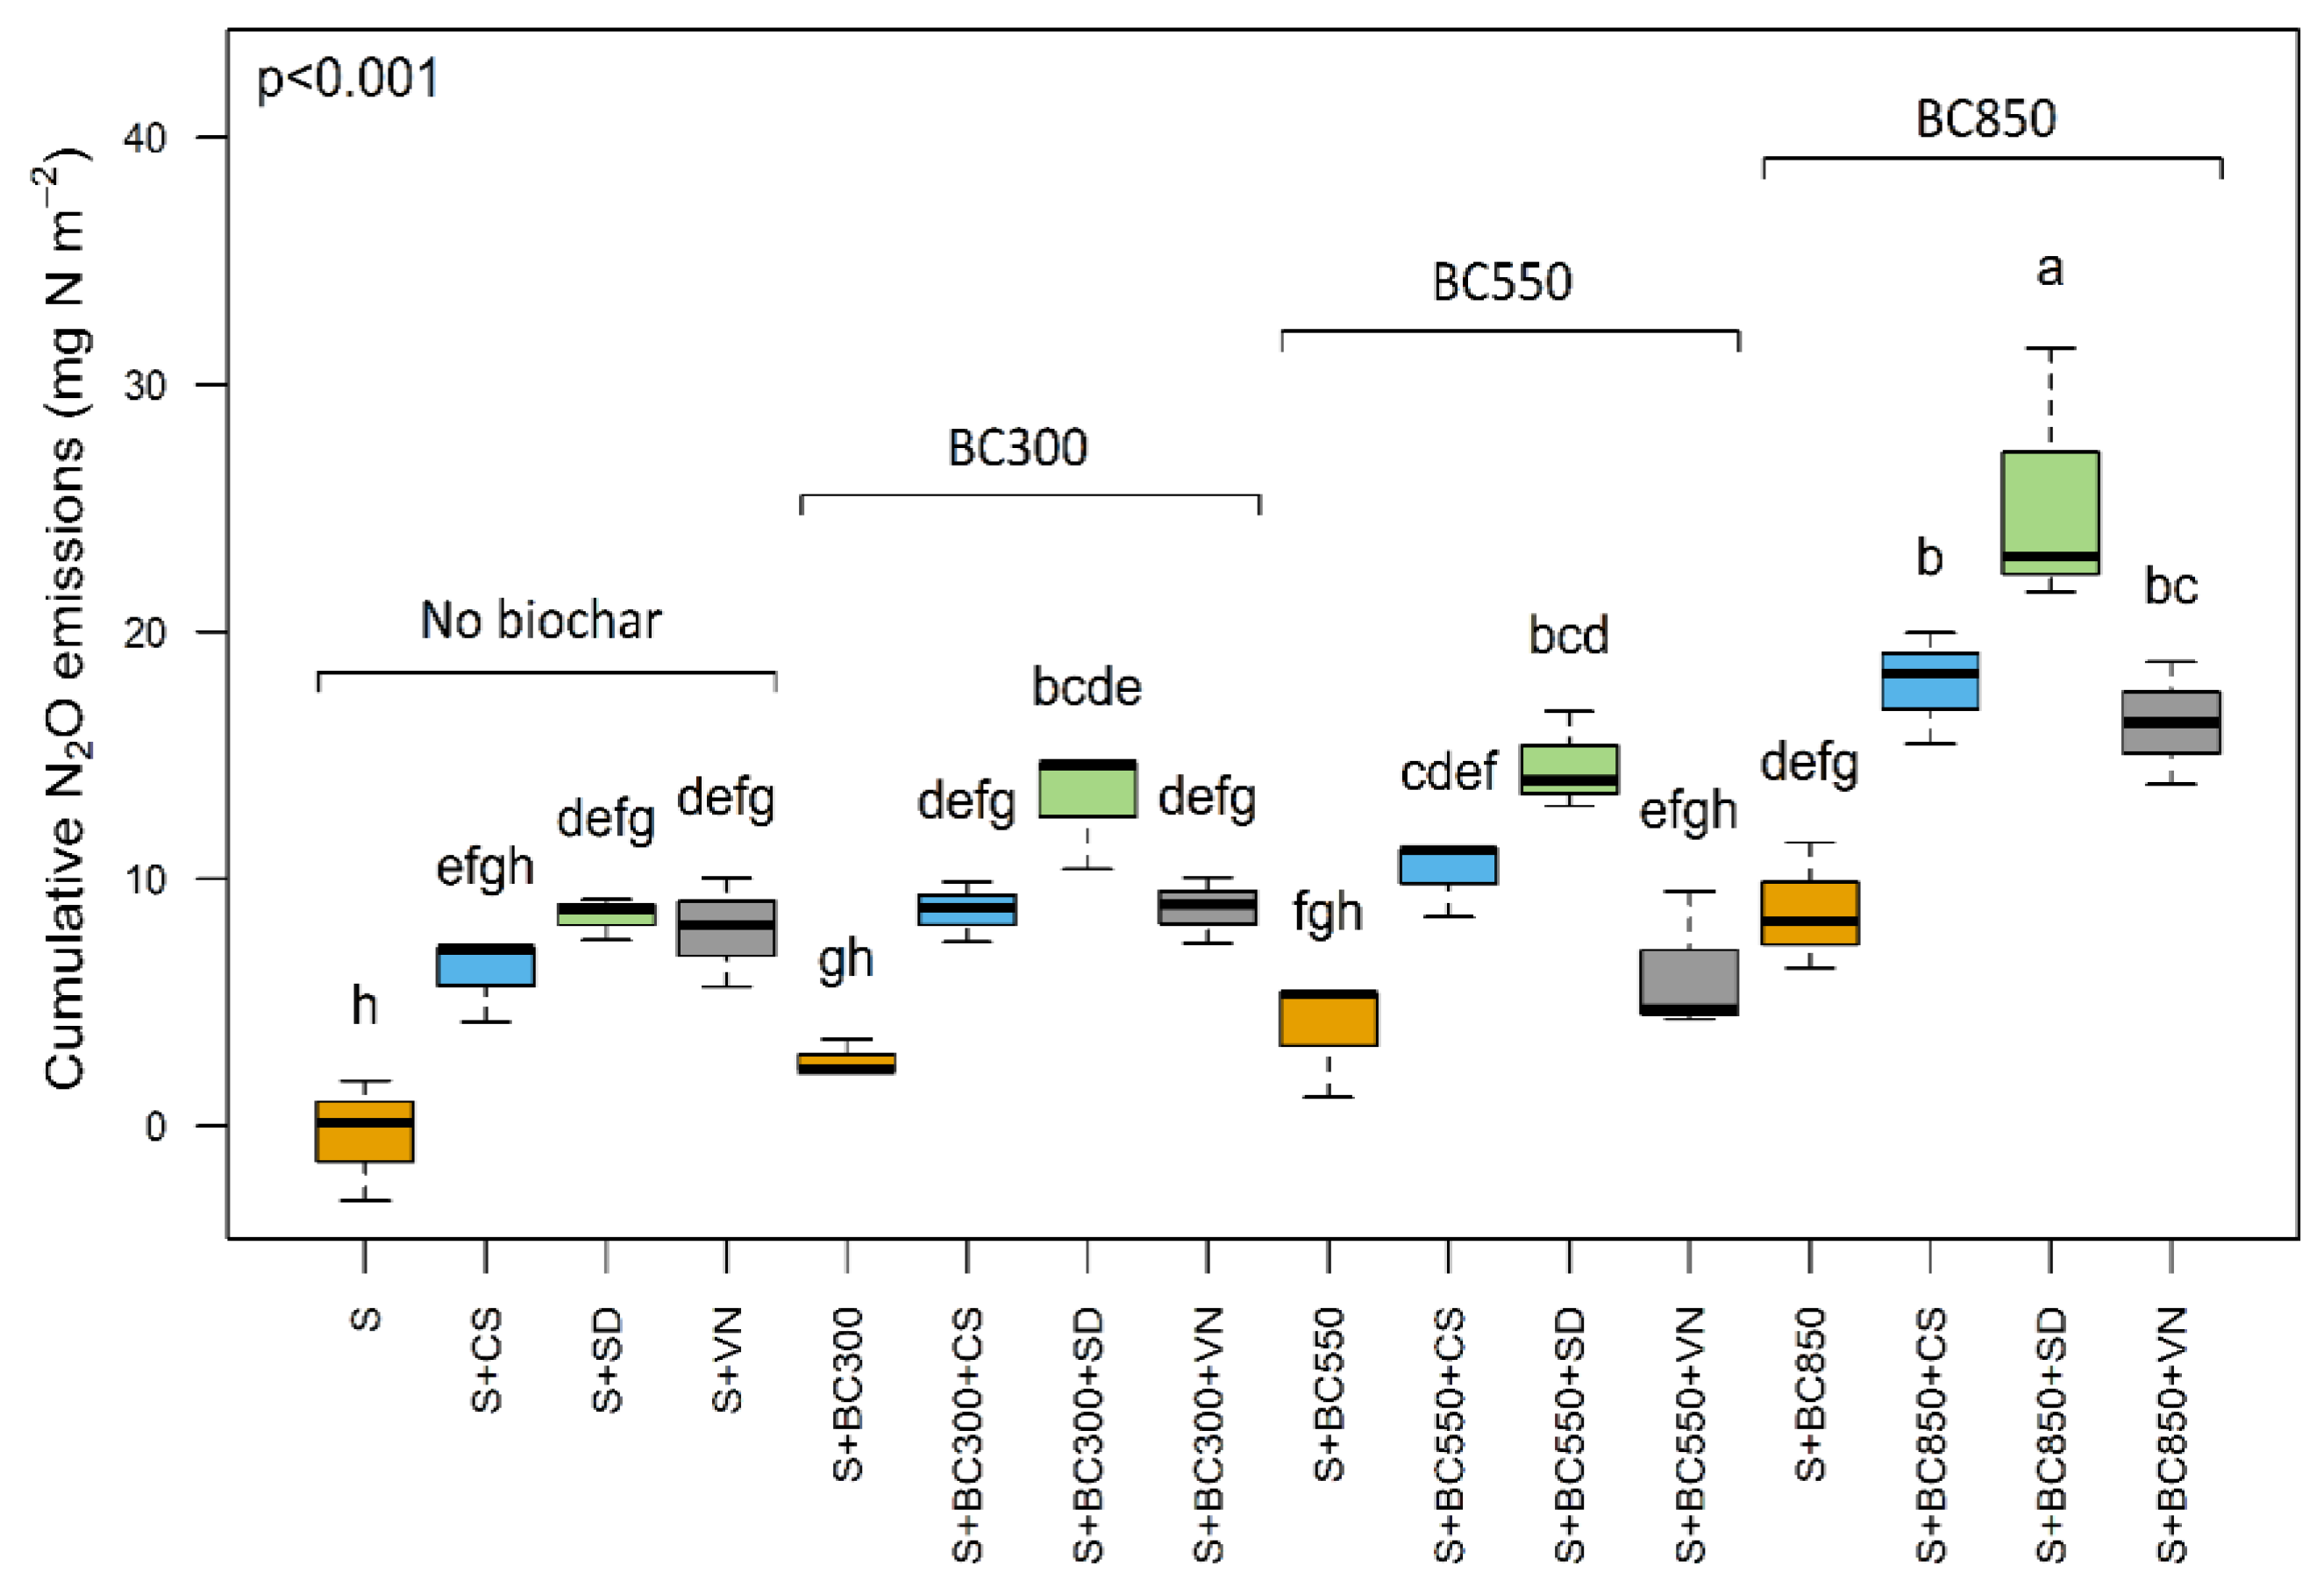
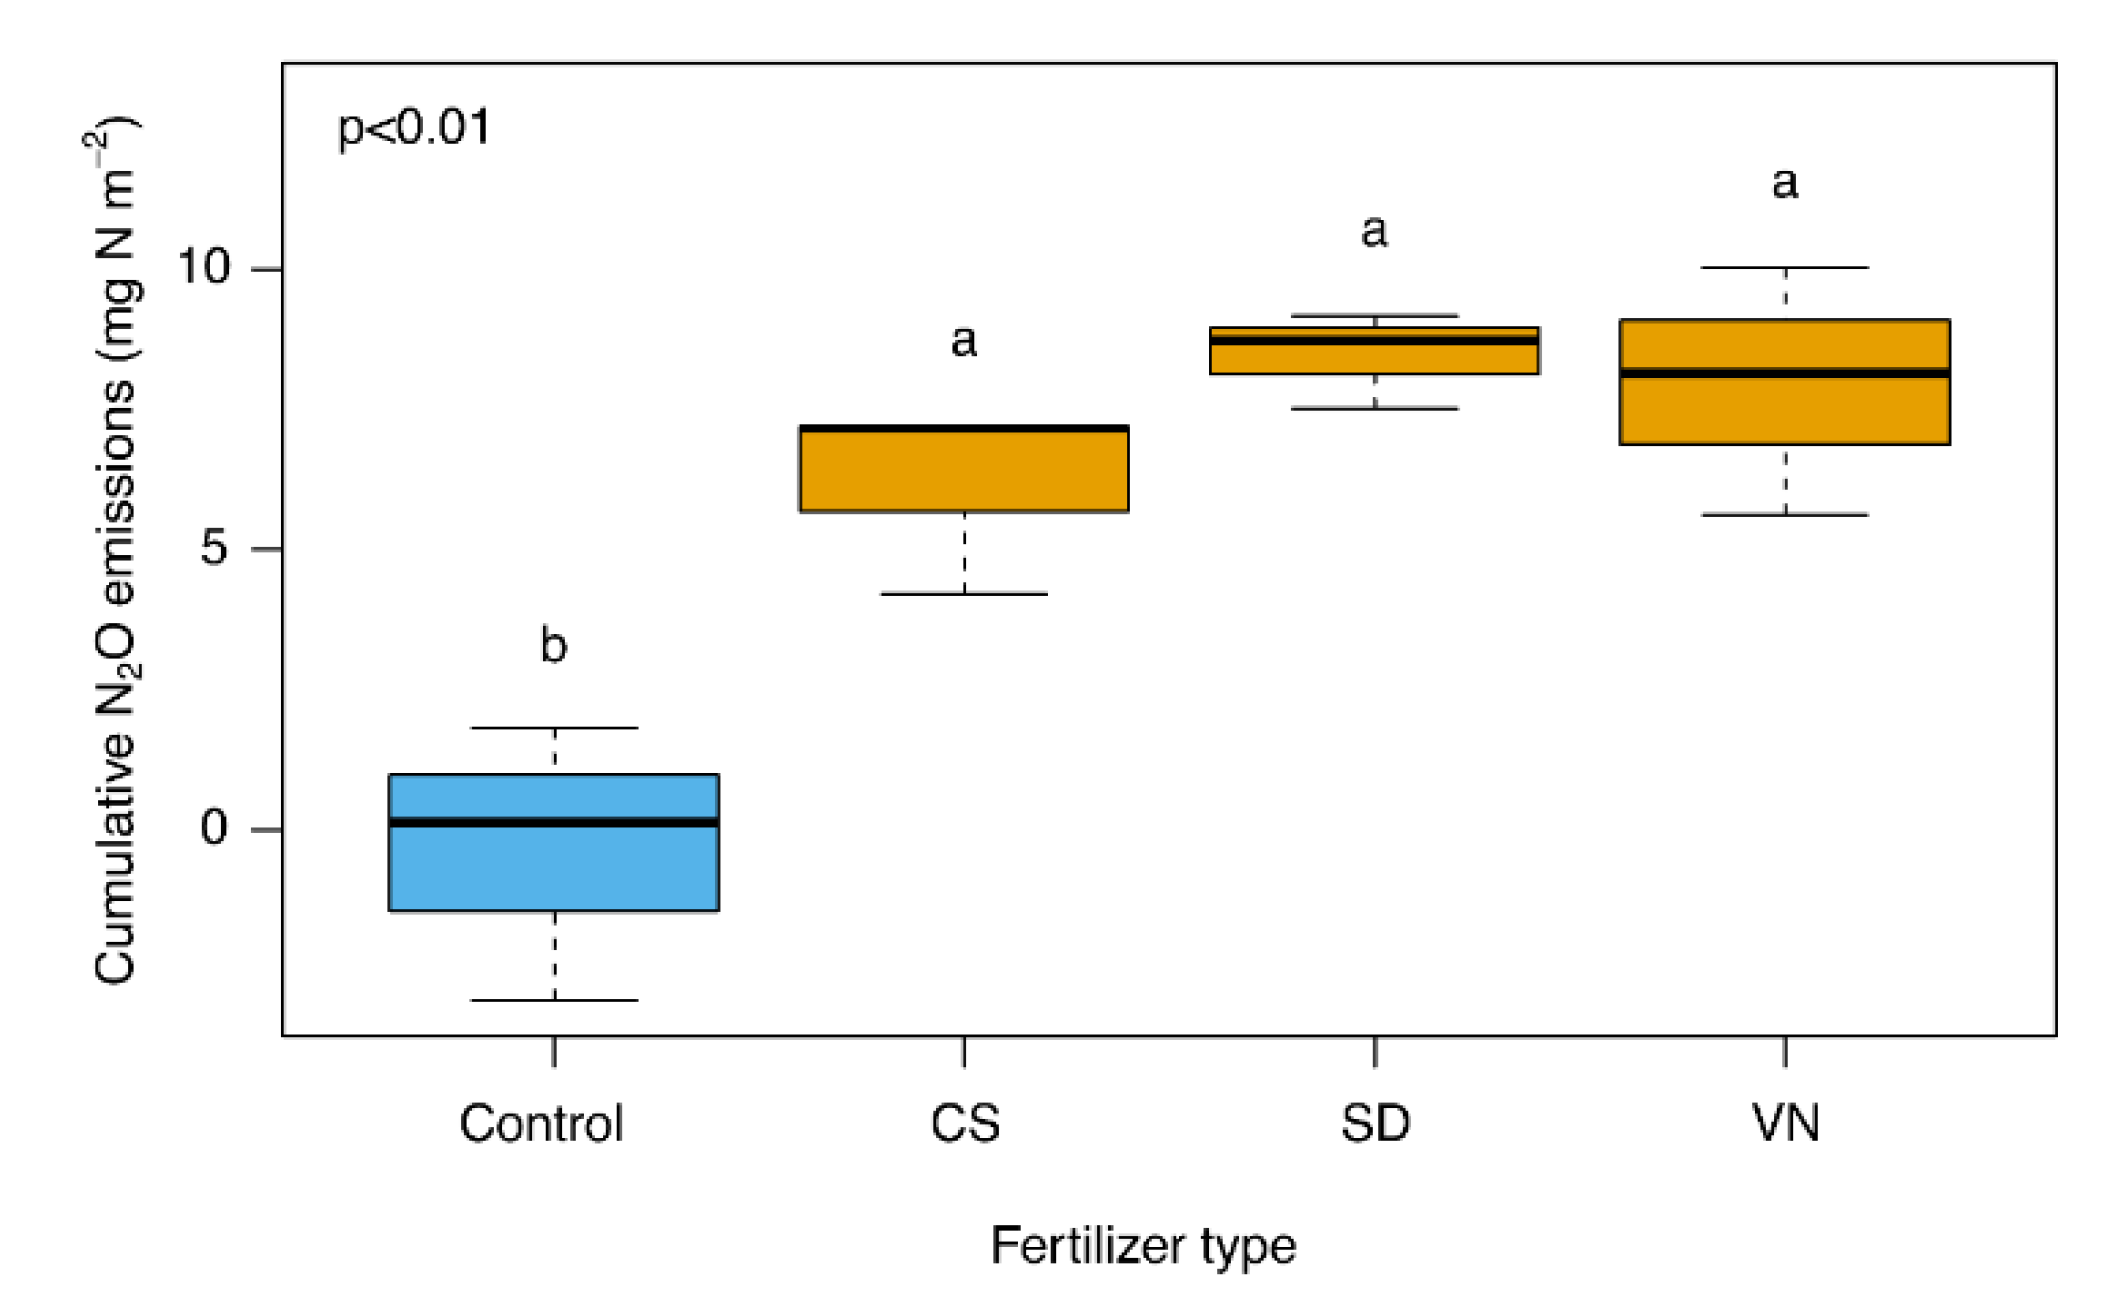
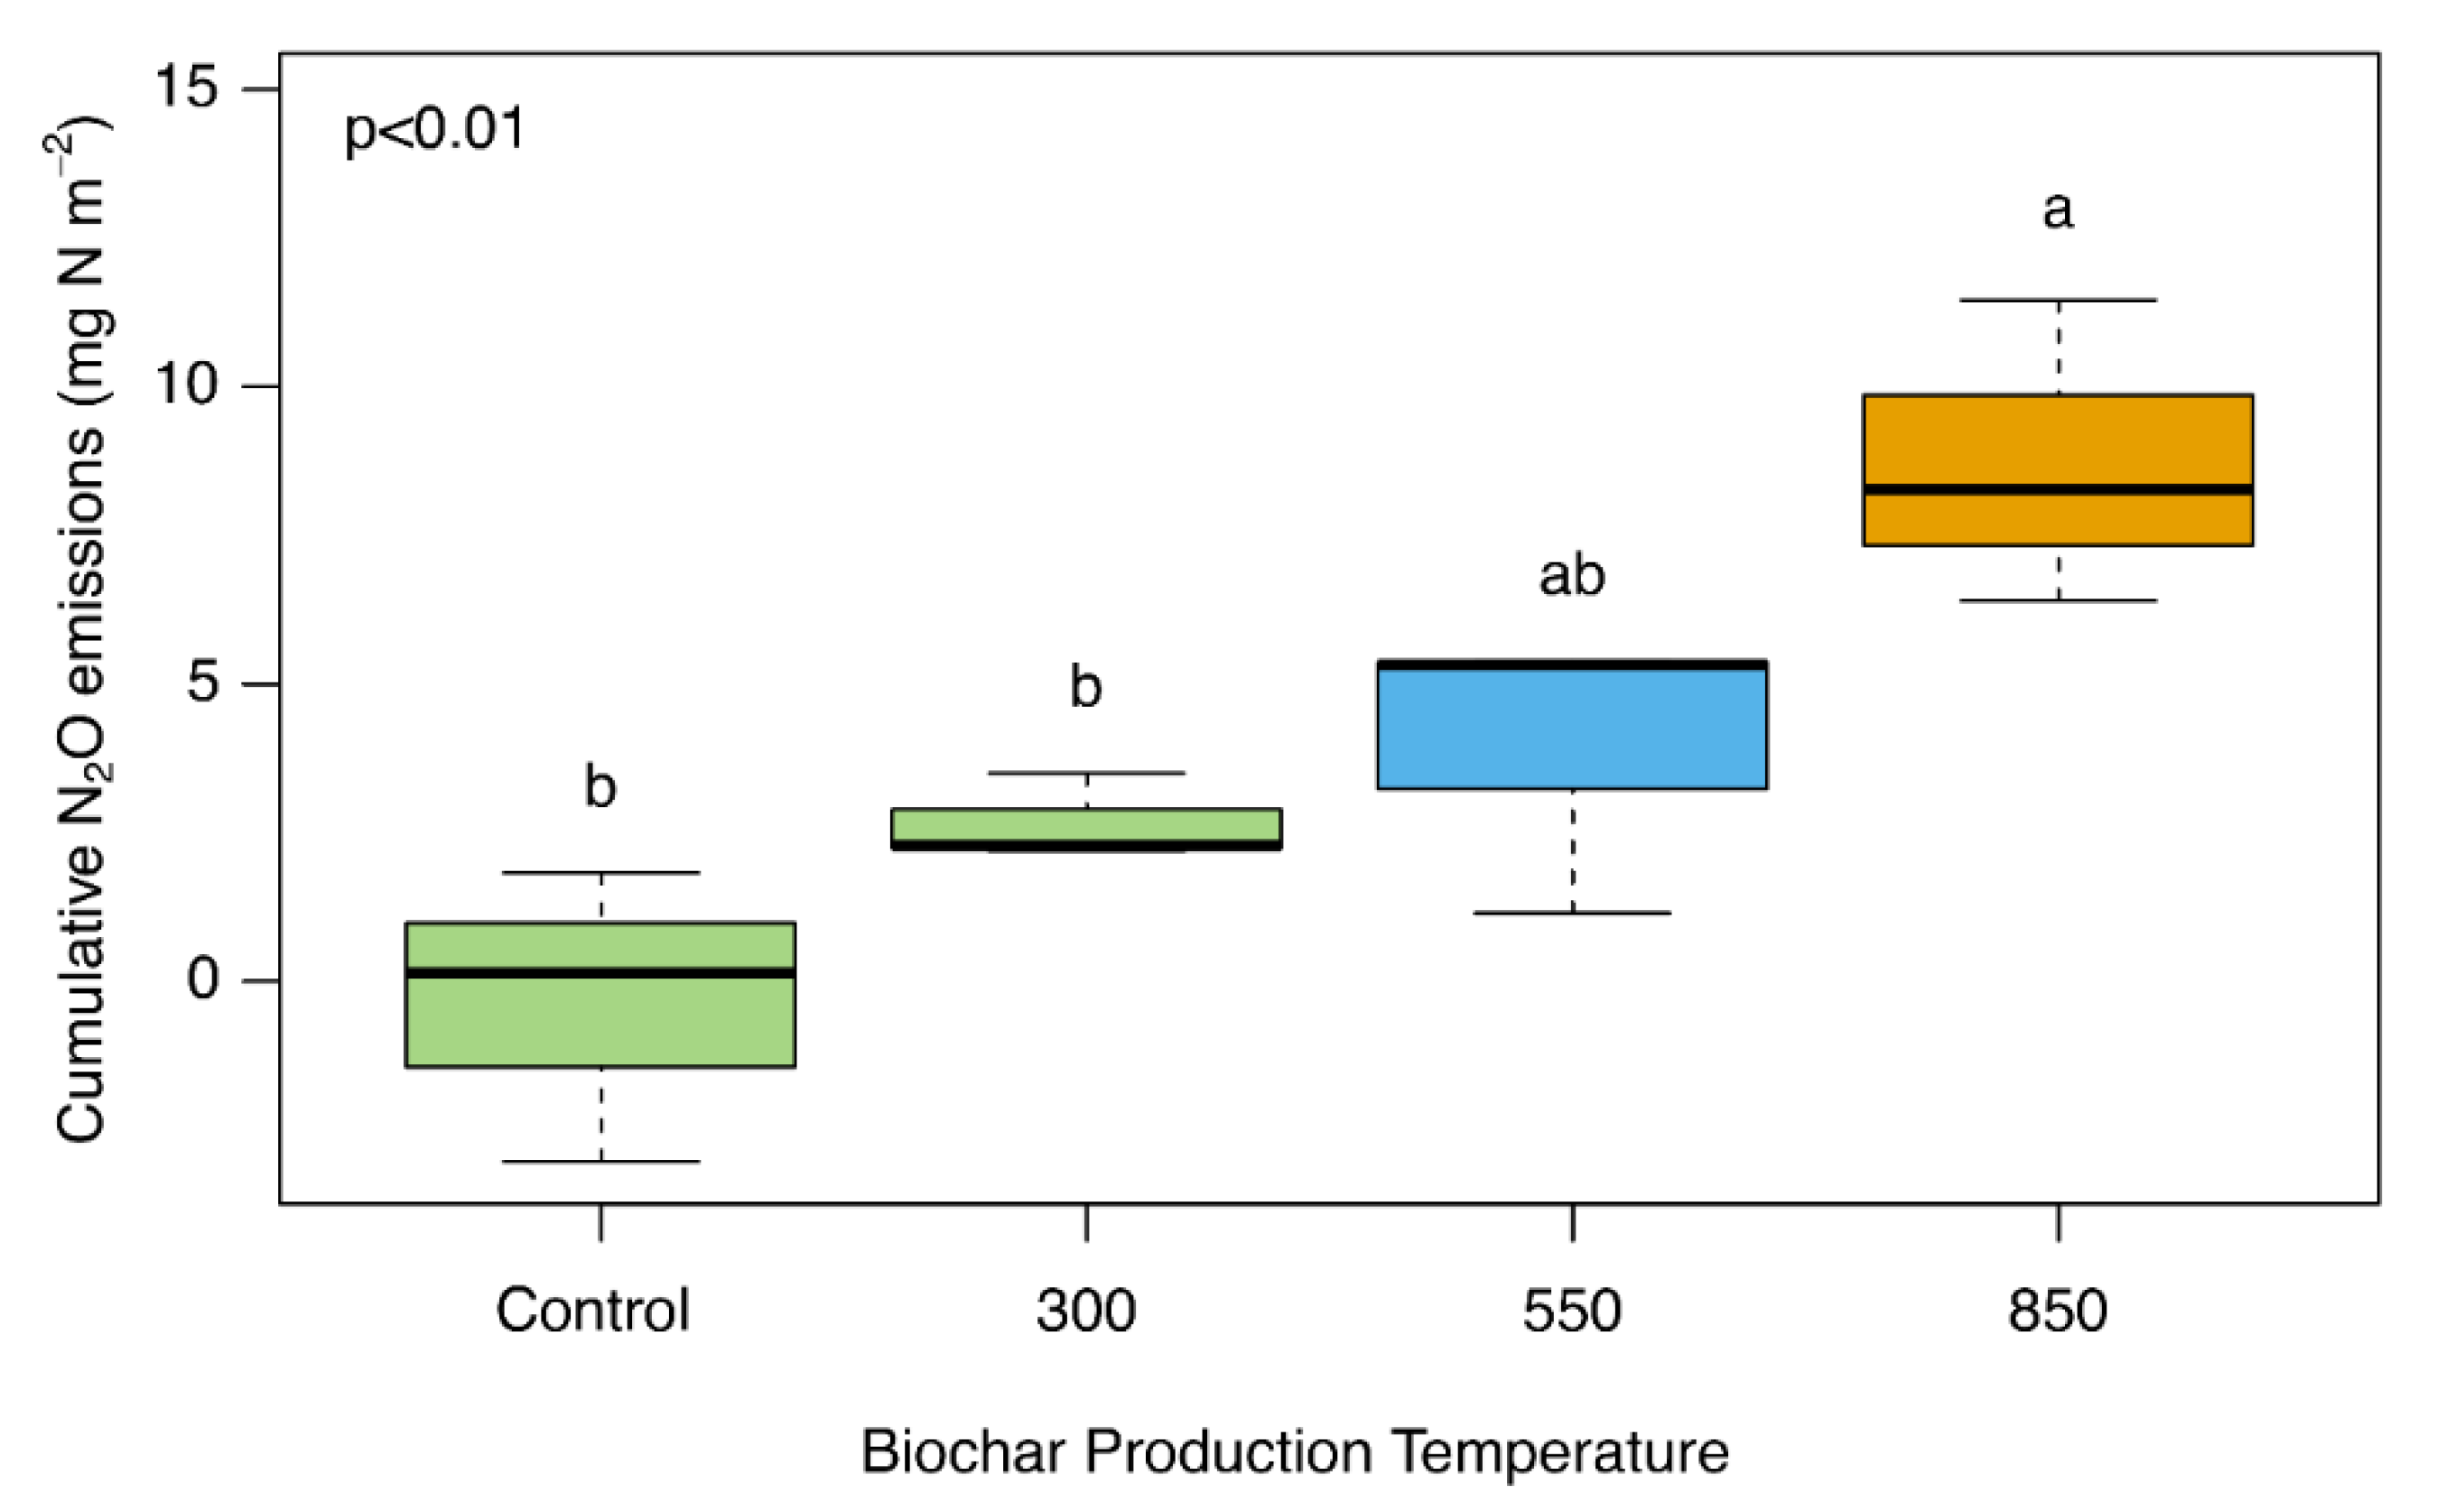
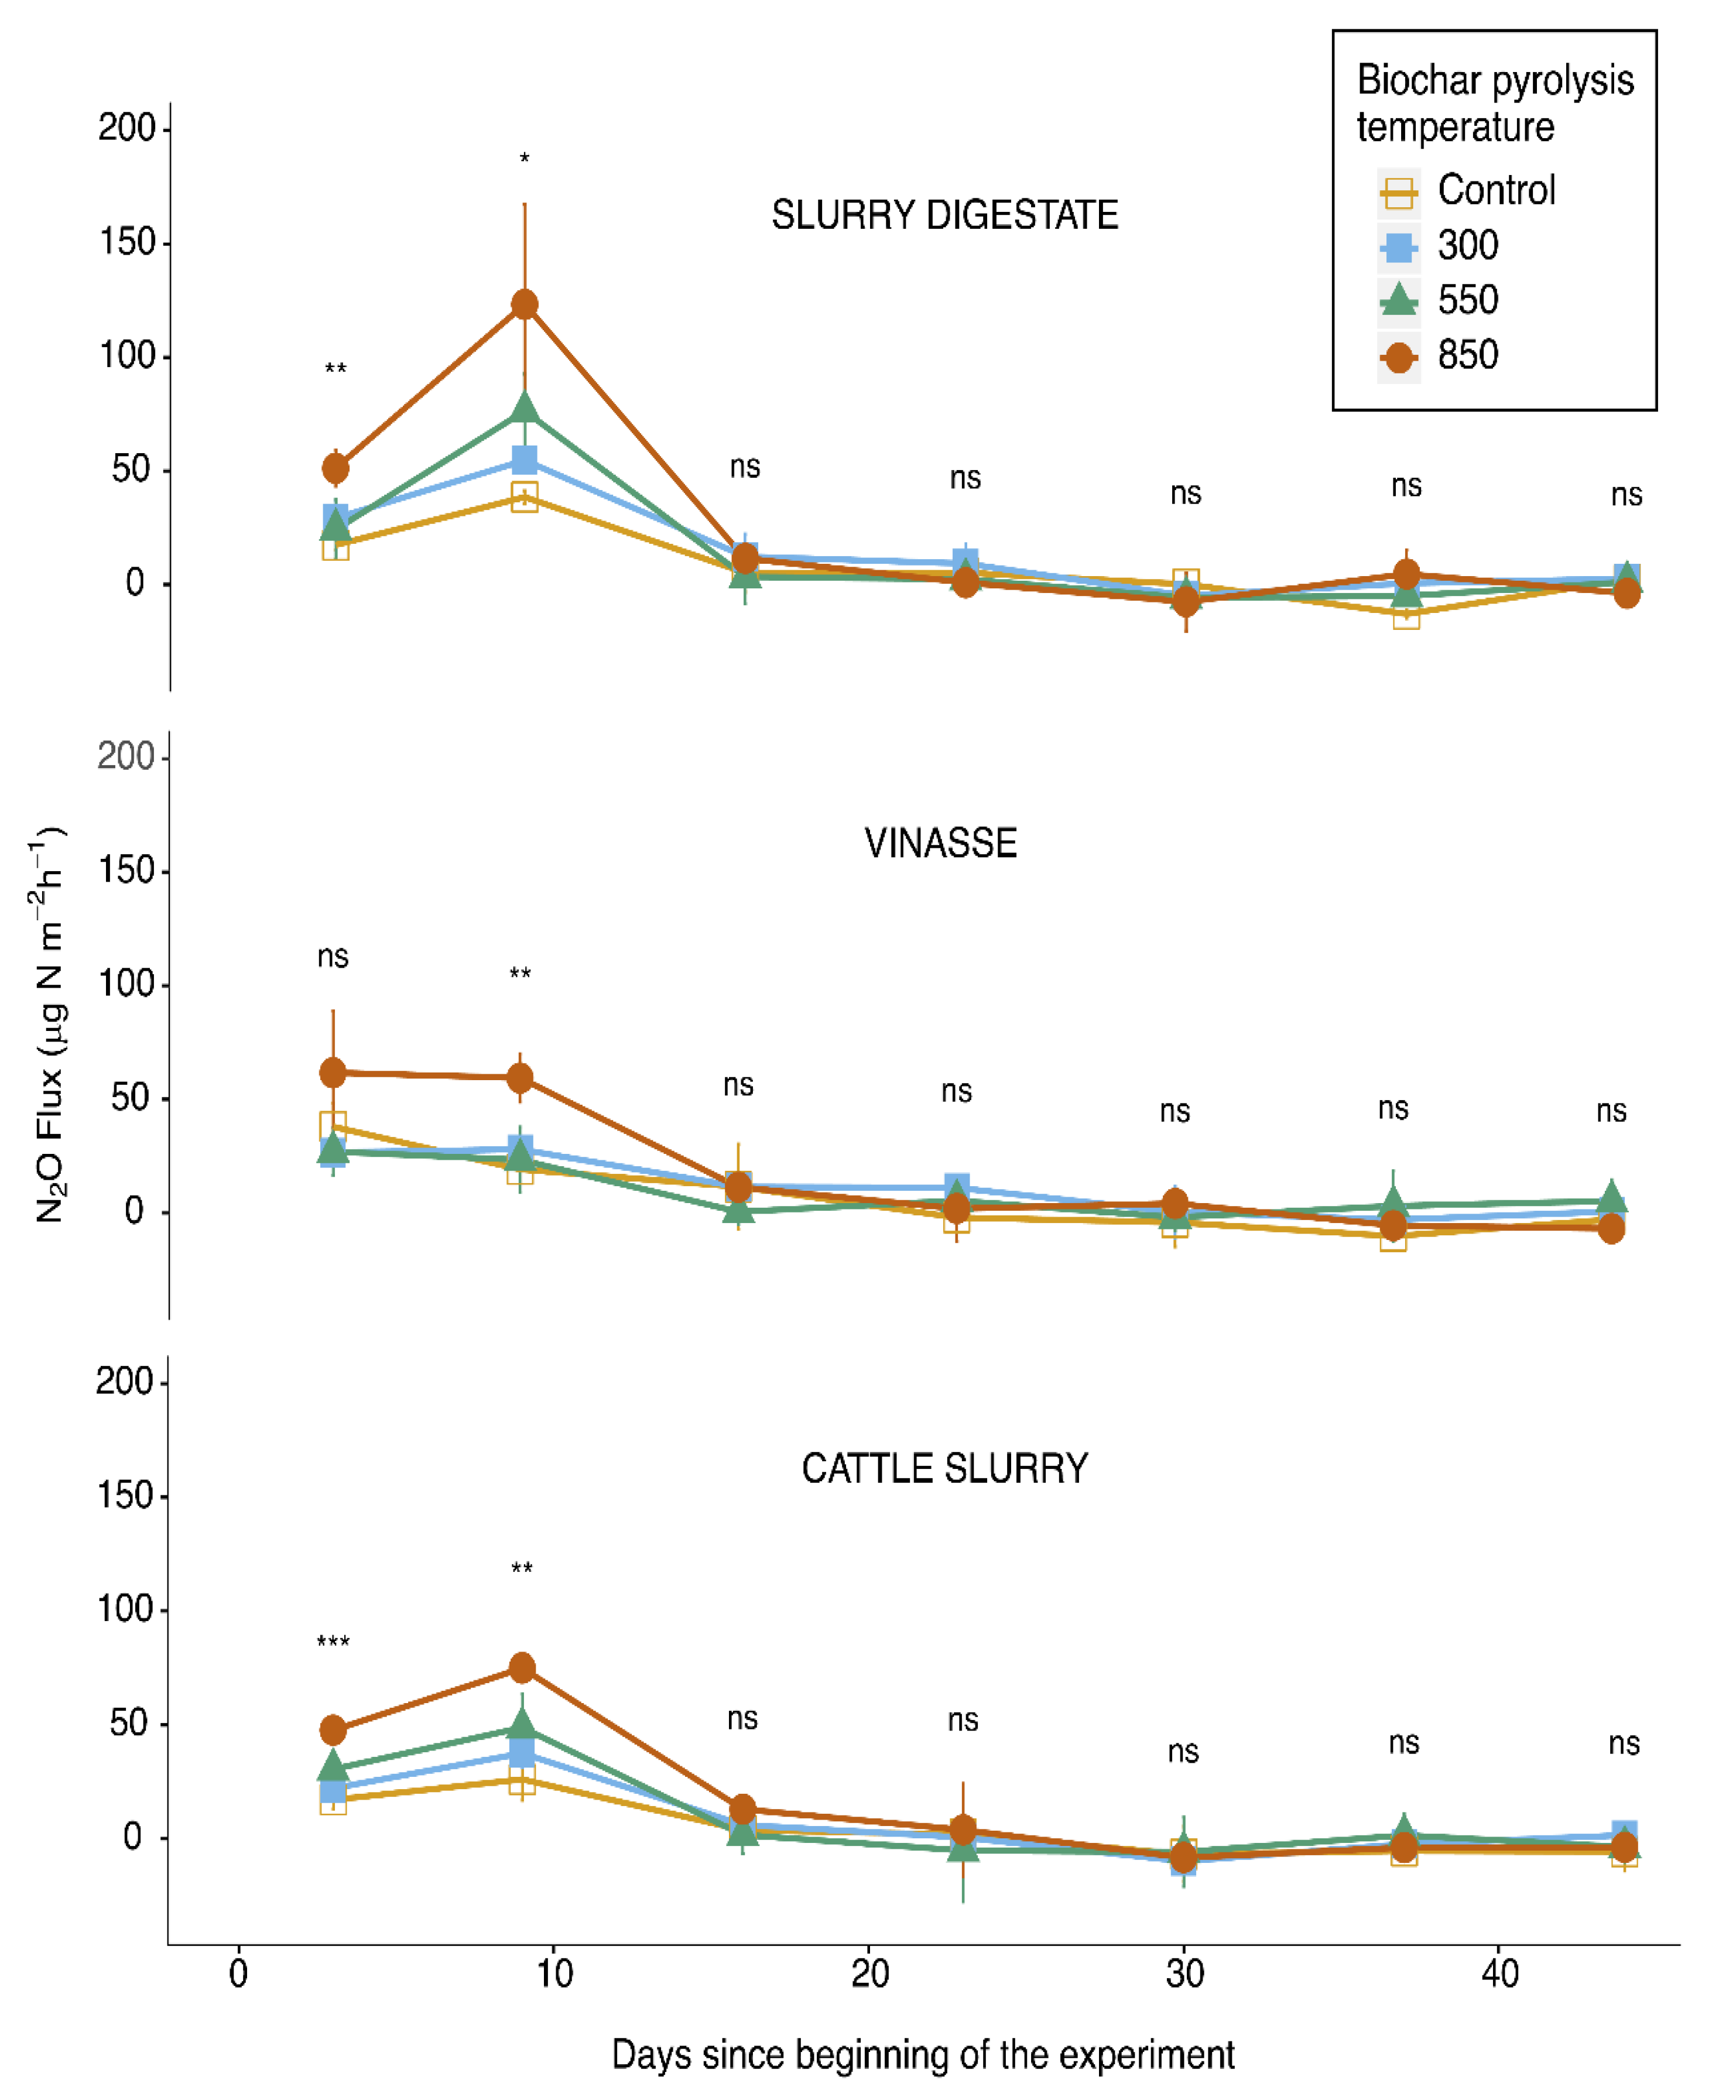
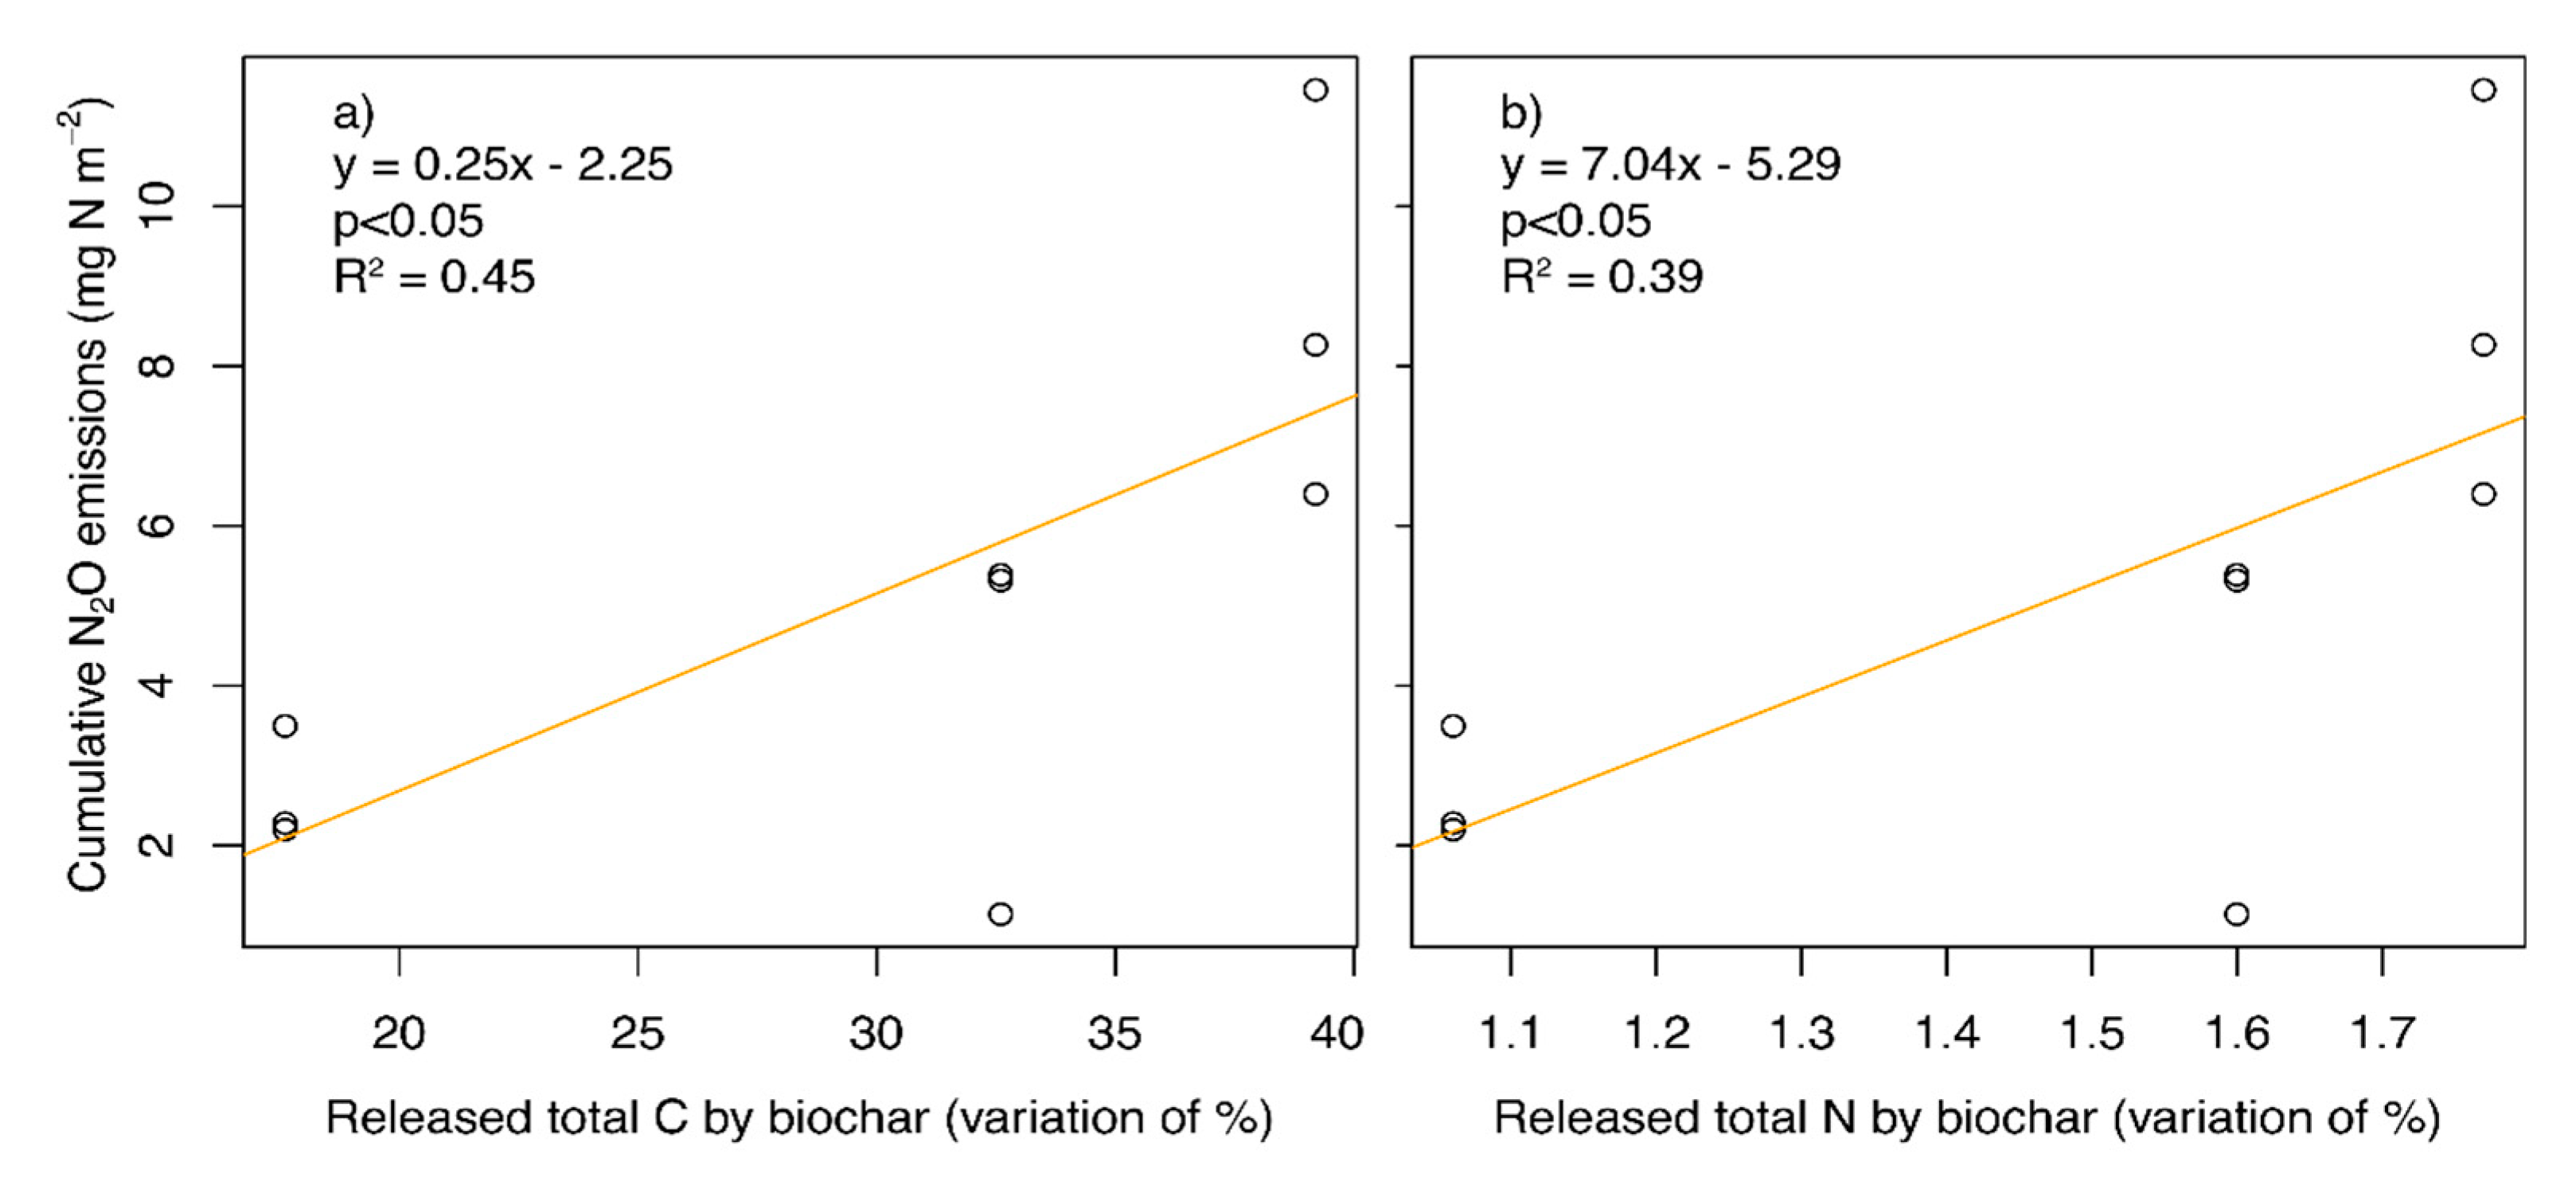
Statistical analyses were carried out using R programming language [60]. The fulfillment of test assumptions was checked prior to analysis. A three-way analysis of variance (ANOVA) was performed to study the effect of biochar, fertilizer, and number of days and the interaction between them. A post-hoc Tukey’s HSD (honest significant difference) analysis was performed after ANOVA to discriminate between groups for each treatment factor, with the package ‘agricolae’ in R [61]. The Pearson correlation coefficient was used for correlation analysis. Correlation analysis for fertilizer properties was performed after weighing, according to the application rate to compensate for the different amount of fertilizer applied, and for the differences in dry matter content. Cumulative fluxes are represented by box-and-whisker plots according the conventions described by Tukey [62].

3. Results

The biochar and fertilizer amendment significantly increased N2O emissions (Table 4, Figure 1). The effect of both factors (ω2 = 0.039 and ω2 = 0.037, for biochar and fertilizer) was similar. Among organic fertilizers, the three studied fertilizers (CS, SD, and VN) had a significant impact on N2O emissions (Figure 2). N2O emissions between the three organic fertilizer treatments were not significantly different (p > 0.05) (Figure 1).
The effect of biochar on N2O emissions was influenced by its production temperature and increased with it (Figure 1), but only fluxes from BC850 differed significantly from the control. Emissions from BC850 were also significantly higher than those of BC300 (p < 0.05), but not from those of BC550 (Figure 3).
Biochar mixing with organic fertilizer significantly increased N2O emissions (p < 0.001, for non-paired t-test) compared to the fertilizer treatment alone (Figure 1). That result is opposite to our hypothesis as we expected that biochar addition to organic fertilizer would reduce N2O emissions.
N2O emissions were significantly influenced by the number of days passed after BC and fertilizer incorporation into soil (factor time) (Table 4, Figure 4). The differences between treatments were statistically significant (p < 0.05) only for the first two sampling dates (days 3 and 9 after the application of the organic fertilizers and biochar) of the duration of the experiment (40 days) (Figure 4). After 9 days, N2O emissions decreased and stabilized in all treatments (including control).
The total cumulative emission for the peak period (20 days) was the greatest from the treatments where organic fertilizers had been mixed with biochar (13.485 mg N/ha), followed by treatments where only organic fertilizer (7.528 mg N/ha) and biochar (5.105 mg N/ha) were applied and the smallest flux was from the control treatment (–0.357 mg N/ha). Among the combination of organic fertilizer and biochar treatments, the greatest total cumulative emission was from treatments where BC850 had been mixed with the fertilizer (19.862 mg N/ha).
Final pH values ranged between 5.08 and 6.09 for all substrate combinations for both treatments (Table 5), while final total carbon content (%) ranged between 1.10 and 1.33 and total nitrogen content (%) between 0.052 and 0.073 among the different treatments (Supplementary Table S1).
No significant correlation was found between total emitted N2O with the properties of the organic fertilizers (pHKCl, NH4+-N, NO3-N, P, K, Ca, Mg) nor with the properties of biochar (pH, ash content, neutralization ability, surface area, cumulative pore volume) or nutrient content (Ntot, Ctot, Ptot, Ktot, Catot, Mgtot). N2O flux in BC treatments was influenced by the release of nutrients from biochar. A linear model was fit between nitrous oxide fluxes and both released Ctot and Ntot in the studied period (Table 6), showing a significant fit for both Ctot (p < 0.05, slope = 0.25) and Ntot (p < 0.05, slope = 7.04) (Figure 5).
Nutrient uptake by the plant cover was negligible in the first two weeks of the experiment (when the highest N2O emissions as well as the biggest differences between treatments were monitored), as the plants had not emerged yet or were in the sprout or seedlings stages. Total final nitrogen uptake by the plant cover was significantly different (p < 0.05) between fertilizers (control, CS, SD, and VN), but no difference (p > 0.05) was found in nitrogen uptake between biochars for the different fertilizers (control, CS, SD, and VN) ((Supplementary Table S2). Regarding Ptot, Ktot, Catot, and Mgtot, uptake by the crop cover between biochar treatments for the different fertilizer treatments showed significant differences (p < 0.05) only for total phosphorus [53].
The pyrolyzation process resulted in the breaking of the cellulose, hemicellulose, and lignin functional groups (1500–1000 cm−1 region), present in BC300 but not in BC850, as shown by FTIR analysis (Supplementary Figure S1) [63,64,65,66], with intermediate absorbance peaks for BC550, especially for lignin (1593 and 1032 cm−1). An increase in aromatic groups (region 1000–400 cm−1) was observed with increasing pyrolysis temperature, especially for BC850, with BC550 also showing intermediate peaks. Principal component analysis (PCA) of the FTIR spectra (Supplementary Figures S2 and S3) shows that BC850 is differentiated from BC300 and BC550 on differences of aromatic, aliphatic, and hydroxyl groups (first component, 70.6% of variability explained), while differences in cellulose, hemicellulose, and lignin content differentiate the three different production temperature biochars (first and second principal components).

4. Discussion

Organic fertilization significantly increased N2O emissions as a consequence of the large amount of NH4+-N being incorporated into the soil with the addition of fertilizer. Although, according to pH values, conditions were mostly favorable for denitrification in the soil, some nitrification spots would have allowed oxidation of the ammonium from the organic fertilizers into nitrates, especially in the initial period. Emissions were not influenced by the lower pH or the higher content of K, Ca, and Mg in vinasse.
It is well known that biochar can affect the water-holding capacity of the substrates [22], but because of the small relative weight of biochar amendment (0.272% of total soil weight; 0.725% for the 0–10 cm layer), no significant effect on soil moisture compared to control, nor on differences in soil moisture between treatments, is expected. Moisture was also assumed to be not significantly different between treatments, as no significant effect on soil water-holding capacity was expected, watering was the same for all treatments, no leaching or negligible leaching was monitored, uptake by plants was not different [53], and, as the relative amount of amended biochar was small and the biochar pellets were mixed, albedo of the soil should not be affected, therefore not affecting evaporation.
Contrary to our hypothesis, amendment with biochar did not reduce N2O emissions. Biochar addition into soil resulted in higher emissions of N2O (p < 0.05). Moreover, emissions were higher with higher temperature biochar. The ineffectiveness of the studied biochar in reducing N2O emissions could be explained by its low C/N values (Table 2), as the C/N values of the studied biochars were much lower compared to those commonly reported in the literature [21], even for biochar produced from herbaceous residues [23]. Previous research has documented that N-rich biochars with low C/N had no mitigation effect on N2O emissions [21]. A meta-analysis by Cayuela et al. [23] found that biochars with a low C/N ratio (<30) did not reduce N2O emissions. Spokas and Reicosky [31] found that, from 16 different studied biochars, only biochar with high N content, high labile organic matter, and a low C/N ratio, increased N2O emissions, with only one of the 16 different biochars, with a C/N ratio of 19.4, resulted in higher N2O emissions on all soils, while the other biochar generating higher emissions in different soil types presented C/N ratios between 21.85 and 207.5. Clough et al. [46] showed that biochar can increase N2O emissions, if soil moisture is favorable for denitrification, but also when large amounts of C and N are released from biochar. This is in line with our results, as the biggest losses of C and N were found for BC850, from which the highest emissions were also measured. Although BC850 presented the lowest initial N content (Table 2), and extractable carbon and nitrogen were higher for lower production temperature biochar (Supplementary Table S1), the higher release of nutrients measured with higher temperature biochar could be a consequence of the pH of the soil–biochar interface being closer to the optimal for ammonification, increasing the mineralization rate of biochar. The idea that BC’s enhancing effect on N2O emissions comes from C and N release is supported by the positive significant relation found from the linear fit between N2O flux and the released C and N amount. Released carbon becoming available would promote denitrifiers’ growth, and reduce O2 availability in the substrates, indirectly promoting denitrification too [14]. Available C is a key factor controlling denitrification [67,68,69], which was the predominant process involved in N2O production in the substrates, as a consequence of soil pH during the experiment and soil moisture, as the measurements were carried out the day after watering. The pH values at the end of the experiment for the substrate mixes were in the range between 5.08 and 6.09 (Table 5), which are below the optimum for nitrification (7.8–8.9) [70]. Denitrification is less sensitive to pH than nitrification, and, at lower values of pH, the ratio N2O:N2 increases [71], supporting that denitrification was the predominant process involved in the N2O emissions. Moreover, Hütsch et al. [72] reported the biggest losses due to denitrification, mainly N2O, for pH values of 5.2 and 5.9 for sandy and loamy soils respectively, which are almost coincident with the final pH values of the substrates tested in this experiment. It has also been reported that fast increases in soil pH can cause a sharp increase in denitrification potential, due to the solubilization of organic matter [73]. It has been documented that denitrifying bacteria recover faster when soils are rewetted after dry periods [74], and that rewetting after dry periods increases the concentration of dissolved organic carbon (DOC) [75] and C availability [76,77]. This would explain why the emissions peaked after the initial watering of the dry soil, and why the biggest differences among treatments were measured during the first two weeks. Firestone and Davidson [6] established that large increases in N2O emissions, like those observed after rewetting, are more typical for denitrification than for nitrification, which supports our assumption that conditions in the substrates were more favorable for denitrification, and that denitrification was the main reason for the observed emissions. According to Petersen [78], denitrification in manure slurries is promoted by the readily assimilable carbon. This would explain why biochar amendment does not reduce emissions with organic fertilization. In fact, organic carbon input can promote anaerobic conditions, even at low water-filled pore space (WFPS) values, increasing denitrification potential and N2O emissions [79]. Higher losses of C with the highest production temperature biochar would explain why this biochar presented the highest emissions.
The higher pH from higher pyrolysis temperature biochars could have also contributed to the differences in N2O fluxes, for higher rates of denitrification are expected under slightly alkaline than under acid conditions [80]. Finally, higher phosphorus content in higher production temperature biochar could have also promoted higher N2O emissions, as P content promotes N2O emissions from both nitrification and denitrification processes [81].
An alternative mechanism for explaining the differences in emissions after application of the different biochars could be a combination of biochar-mediated soil organic matter mineralization enhancement, in parallel with NH4+ sorption by the biochar which, in turn, reduces the nitrification potential. Although biochar has been reported to have opposed effects on mineralization [46], meta-analyses show a general increase in mineralization activity in biochar-amended soils [22,23], an increase that is usually attributed to the priming effect of biochar, by stimulating microorganisms to mineralize recalcitrant soil organic matter in response to the C input [21,41,46]. This would lead to an increase of nitrification activity [21], due to the NH4+ becoming available as a result of the ammonification process. Ammonification is not so sensitive to low pH as nitrification [82,83]. In parallel, NH4+ sorption by biochar would decrease nitrification activity, explaining the differences in the final N2O emissions from different treatments. As sorption takes place in the surface of biochar, it will be conditioned mostly by the biochar pH and not by the pH of the substrates. The different pH and, consequently, NH4+ sorption capacity of the different biochars would result in different NH4+ availability and, therefore, nitrification activity. Higher temperature biochar presents lower NH4+ sorption potential [84,85], leading to more available NH4+ in soil for nitrification. Although ammonium sorption capacity increases with increasing pH [84,85], higher pH values will cause a shift in the ammonium-ammonia equilibrium towards ammonia [86]. Wang et al. [86,87] observed that adjusting the pH of the solution to 7 resulted in increased NH4+ sorption. Assuming that the three biochars enhanced mineralization, then BC300, with its pH close to 7 and higher content of negatively charged functional groups present in cellulose, hemicellulose, and lignin with lower temperatures, as shown in the FTIR analysis (Supplementary Figure S1), would have been the one with the highest NH4+ sorption capacity, followed by BC550. However, the low levels of organic N and P in the soil would limit ammonification, and the low pH of the substrates would limit nitrification, therefore seeming unlikely that the combination of ammonification and NH4+ sorption could cause the measured differences in the N2O fluxes. Even for biochar and fertilizer combined amendment, where N was not limiting due to the addition of NH4+-N, as the interaction between biochar and fertilizer was not significant, this mechanism of combined ammonification and nitrification did not play a significant role, with the low pH for nitrification being the most likely limiting factor.

5. Conclusions

Organic fertilizers increased N2O emissions in comparison to the control as expected, but the increase was not different among fertilizers. Biochar amendment did not mitigate the increase in N2O emissions that resulted from organic fertilization, as biochar itself produced higher emissions. No significant interaction between biochar and fertilizer treatments was found. Biochar addition also increased emissions, with this difference being significant only for higher temperature production biochar. Our findings support the idea that biochar cannot be considered as a universal tool for the reduction of GHG emissions, and that each biochar, depending on its physical and chemical properties, can have a different effect. A low C/N ratio and a high N content in biochar can lead to higher emissions in biochar-amended soils. This study highlights the need for more research, focusing on different feedstocks and production methods of biochar, to provide a better understanding and allow future modeling of the mechanisms relating biochar properties and N2O emissions. This is particularly important for biochars produced from non-woody source materials, and especially with low C/N ratios, more likely to have an unexpected and undesired effect on GHG emissions.

Supplementary Materials

The following are available online at https://www.mdpi.com/2073-4395/10/1/109/s1, Figure S1: Fourier-transform infrared spectroscopy (FTIR) spectrum of the studied biochars (300°, 550°, and 850°) with identified functional groups. Figure S2: Biplot of the first two components of the principal component analysis (PCA) of the Fourier-transform infrared spectroscopy (FTIR) spectrum values for the three production temperature biochars (300°, 550°, and 850°). Figure S3: Scatterplot of wavenumber values and eigenvalues for the first two principal components of the principal component analysis (PCA) of the Fourier-transform infrared spectroscopy (FTIR) spectrum data. Table S1: Extractable Nitrogen and Carbon of the different production temperature biochar after 120 h. Table S2: Final pHKCl, Ctot and Ntot values for the different treatment level combinations.

Author Contributions

Conceptualization, H.R. and A.A.; methodology, A.A., K.S. and M.S.; validation, H.R. and M.S.; formal analysis, J.E.-G.; investigation, J.E.-G., H.R. and M.S.; resources, H.R., A.A., M.S. and K.S.; data curation, J.E.-G., H.R. and A.A.; writing—original draft preparation, J.E.-G.; writing—review and editing, H.R., A.A., K.S. and M.S.; visualization, J.E.-G.; supervision, H.R., A.A., M.S. and K.S.; project administration, H.R.; funding acquisition, H.R. and A.A. All authors have read and agreed to the published version of the manuscript.

Funding

The research was funded by the Estonian Agricultural Registers and Information Board (ARIB) program “Support for development of new products, practices, processes, and technologies” (RT I, 31.07.2015, 6).

Acknowledgments

We would like to thank the research contractor Taivo Roomann from Leedi farm in Raplamaa and the “Biosyngas production from torrefied hay” project coordinator Tommy Biene.

Conflicts of Interest

The authors declare no conflict of interest.

References

  1. UNFCCC. Adoption of the Paris Agreement. FCCC/CP/2015/L.9/Rev.1. In Proceedings of the United Nations Framework Convention on Climate Change: 21st Conference of the Parties, Paris, France, 30 November–11 December 2015. [Google Scholar]
  2. IPCC. Climate Change 2014: Synthesis Report. Contribution of Working Groups I, II and III to the Fifth Assessment Report of the Intergovernmental Panel on Climate Change; Meyer, L.A., Pachauri, R.K., Eds.; Core Writing Team: Geneva, Switzerland, 2014; p. 151. [Google Scholar]
  3. Ravishankara, A.R.; Daniel, J.S.; Portmann, R.W. Nitrous oxide (N2O): The dominant ozone-depleting substance emitted in the 21st century. Science 2009, 326, 123–125. [Google Scholar] [CrossRef] [PubMed] [Green Version]
  4. Ussiri, D.; Lal, R. Soil Emission of Nitrous Oxide and Its Mitigation; Springer: Dordrecht, The Netherlands, 2013; Volume XVIII, p. 378. [Google Scholar]
  5. Park, S.; Croteau, P.; Boering, K.A.; Etheridge, D.M.; Ferretti, D.; Fraser, P.J.; Kim, K.R.; Krummel, P.B.; Langenfelds, R.L.; van Ommen, T.D.; et al. Trends and seasonal cycles in the isotopic composition of nitrous oxide since 1940. Nat. Geosci. 2012, 5, 261–265. [Google Scholar] [CrossRef]
  6. Firestone, M.K.; Davidson, E.A. Microbiological Basis of NO and N2O Production and Consumption in Soils. In Exchange of Trace Gases between Terrestrial Ecosystems and the Atmosphere; Andreae, M.O., Schimel, D.S., Eds.; John Willey and Sons: New York, NY, USA, 1989; pp. 7–21. [Google Scholar]
  7. Braker, G.; Conrad, R. Diversity, Structure, and Size of N2O-Producing Microbial Communities in Soils—What Matters for Their Functioning? In Advances in Applied Microbiology; Academic Press: Cambridge, MA, USA, 2011; Volume 75, pp. 33–70. [Google Scholar]
  8. Shen, J.; Treu, R.; Wang, J.; Nicholson, F.; Bhogal, A.; Thorman, R. Modeling nitrous oxide emissions from digestate and slurry applied to three agricultural soils in the United Kingdom: Fluxes and emission factors. Environ. Pollut. 2018, 243, 1952–1965. [Google Scholar] [CrossRef] [PubMed]
  9. Jones, S.K.; Rees, R.M.; Skiba, U.M.; Ball, B.C. Influence of organic and mineral N fertiliser on N2O fluxes from a temperate grassland. Agric. Ecosyst. Environ. 2007, 121, 74–83. [Google Scholar] [CrossRef]
  10. van Groenigen, J.W.; Kasper, G.J.; Velthof, G.L.; van den Pol-van Dasselaar, A.; Kuikman, P.J. Nitrous oxide emissions from silage maize fields under different mineral nitrogen fertilizer and slurry applications. Plant Soil 2004, 263, 101–111. [Google Scholar] [CrossRef]
  11. Marchaim, U. Biogas Processes for Sustainable Development; FAO: Rome, Italy, 1992. [Google Scholar]
  12. Ciborowski, P. Anaerobic Digestion of Livestock Manure for Pollution Control and Energy Production: A Feasibility Assessment; Minnesota Pollution Control Agency: St. Paul, MN, USA, 2001; p. 233.
  13. Petersen, S.O. Greenhouse gas emissions from liquid dairy manure: Prediction and mitigation. J. Dairy Sci. 2018, 101, 6642–6654. [Google Scholar] [CrossRef]
  14. Holly, M.A.; Larson, R.A.; Powell, J.M.; Ruark, M.D.; Aguirre-Villegas, H. Greenhouse gas and ammonia emissions from digested and separated dairy manure during storage and after land application. Agric. Ecosyst. Environ. 2017, 239, 410–419. [Google Scholar] [CrossRef]
  15. Lourenco, K.S.; Rossetto, R.; Vitti, A.C.; Montezano, Z.F.; Soares, J.R.; Sousa, R.M.; do Carmo, J.B.; Kuramae, E.E.; Cantarella, H. Strategies to mitigate the nitrous oxide emissions from nitrogen fertilizer applied with organic fertilizers in sugarcane. Sci. Total Environ. 2019, 650, 1476–1486. [Google Scholar] [CrossRef]
  16. Carmo, J.B.D.; Filoso, S.; Zotelli, L.C.; de Sousa Neto, E.R.; Pitombo, L.M.; Duarte-Neto, P.J.; Vargas, V.P.; Andrade, C.A.; Gava, G.J.C.; Rossetto, R.; et al. Infield greenhouse gas emissions from sugarcane soils in Brazil: Effects from synthetic and organic fertilizer application and crop trash accumulation. GCB Bioenergy 2013, 5, 267–280. [Google Scholar] [CrossRef]
  17. Lehmann, J.; Joseph, S. Biochar for Environmental Management: Science and Technology; Earthscan: London, UK, 2009. [Google Scholar]
  18. Sohi, S.P. Carbon storage with benefits. Science 2012, 338, 1034–1035. [Google Scholar] [CrossRef]
  19. Crane-Droesch, A.; Abiven, S.; Jeffery, S.; Torn, M.S. Heterogeneous global crop yield response to biochar: A meta-regression analysis. Environ. Res. Lett. 2013, 8. [Google Scholar] [CrossRef]
  20. Jeffery, S.; Abalos, D.; Prodana, M.; Bastos, A.C.; van Groenigen, J.W.; Hungate, B.A.; Verheijen, F. Biochar boosts tropical but not temperate crop yields. Environ. Res. Lett. 2017, 12. [Google Scholar] [CrossRef]
  21. Borchard, N.; Schirrmann, M.; Cayuela, M.L.; Kammann, C.; Wrage-Monnig, N.; Estavillo, J.M.; Fuertes-Mendizabal, T.; Sigua, G.; Spokas, K.; Ippolito, J.A.; et al. Biochar, soil and land-use interactions that reduce nitrate leaching and N2O emissions: A meta-analysis. Sci. Total Environ. 2019, 651, 2354–2364. [Google Scholar] [CrossRef] [PubMed]
  22. Liu, Q.; Zhang, Y.; Liu, B.; Amonette, J.E.; Lin, Z.; Liu, G.; Ambus, P.; Xie, Z. How does biochar influence soil N cycle? A meta-analysis. Plant Soil 2018, 426, 211–225. [Google Scholar] [CrossRef]
  23. Cayuela, M.L.; van Zwieten, L.; Singh, B.P.; Jeffery, S.; Roig, A.; Sánchez-Monedero, M.A. Biochar’s role in mitigating soil nitrous oxide emissions: A review and meta-analysis. Agric. Ecosyst. Environ. 2014, 191, 5–16. [Google Scholar] [CrossRef]
  24. Scheer, C.; Grace, P.R.; Rowlings, D.W.; Kimber, S.; Van Zwieten, L. Effect of biochar amendment on the soil-atmosphere exchange of greenhouse gases from an intensive subtropical pasture in northern New South Wales, Australia. Plant Soil 2011, 345, 47–58. [Google Scholar] [CrossRef] [Green Version]
  25. Suddick, E.C.; Six, J. An estimation of annual nitrous oxide emissions and soil quality following the amendment of high temperature walnut shell biochar and compost to a small scale vegetable crop rotation. Sci. Total Environ. 2013, 465, 298–307. [Google Scholar] [CrossRef]
  26. Rittl, T.F.; Butterbach-Bahl, K.; Basile, C.M.; Pereira, L.A.; Alms, V.; Dannenmann, M.; Couto, E.G.; Cerri, C.E.P. Greenhouse gas emissions from soil amended with agricultural residue biochars: Effects of feedstock type, production temperature and soil moisture. Biomass Bioenergy 2018, 117, 1–9. [Google Scholar] [CrossRef]
  27. Buchkina, N.P.; Hüppi, R.; Leifeld, J. Biochar and short-term N2O and CO2 emission from plant residue-amended soil with different fertilisation history. Zemdirb. Agric. 2019, 106, 99–106. [Google Scholar] [CrossRef]
  28. Van Zwieten, L.; Singh, B.; Joseph, S.; Kimber, S.; Cowie, A.; Chan, K.Y. Biochar and Emissions of Non-CO2 Greenhouse Gases from Soil. In Biochar for Environmental Management: Science and Technology; Lehmann, J., Joseph, S., Eds.; Routledge: London, UK, 2009. [Google Scholar] [CrossRef]
  29. Clough, T.J.; Bertram, J.E.; Ray, J.L.; Condron, L.M.; O’Callaghan, M.; Sherlock, R.R.; Wells, N.S. Unweathered Wood Biochar Impact on Nitrous Oxide Emissions from a Bovine-Urine-Amended Pasture Soil. Soil Sci. Soc. Am. J. 2010, 74, 852–860. [Google Scholar] [CrossRef] [Green Version]
  30. Verhoeven, E.; Six, J. Biochar does not mitigate field-scale N2O emissions in a Northern California vineyard: An assessment across two years. Agric. Ecosyst. Environ. 2014, 191, 27–38. [Google Scholar] [CrossRef]
  31. Spokas, K.A.; Reicosky, D.C. Impacts of Sixteen Different Biochars on Soil Greenhouse Gas Production. Ann. Environ. Sci. 2009, 3, 179–193. [Google Scholar]
  32. Malghani, S.; Gleixner, G.; Trumbore, S.E. Chars produced by slow pyrolysis and hydrothermal carbonization vary in carbon sequestration potential and greenhouse gases emissions. Soil Biol. Biochem. 2013, 62, 137–146. [Google Scholar] [CrossRef] [Green Version]
  33. Sánchez-García, M.; Roig, A.; Sánchez-Monedero, M.A.; Cayuela, M.L. Biochar increases soil N2O emissions produced by nitrification-mediated pathways. Front. Environ. Sci. 2014, 2, 25. [Google Scholar] [CrossRef] [Green Version]
  34. Christel, W.; Zhu, K.; Hoefer, C.; Kreuzeder, A.; Santner, J.; Bruun, S.; Magid, J.; Jensen, L.S. Spatiotemporal dynamics of phosphorus release, oxygen consumption and greenhouse gas emissions after localised soil amendment with organic fertilisers. Sci. Total Environ. 2016, 554–555, 119–129. [Google Scholar] [CrossRef] [PubMed] [Green Version]
  35. Wang, C.; Lu, H.; Dong, D.; Deng, H.; Strong, P.J.; Wang, H.; Wu, W. Insight into the effects of biochar on manure composting: Evidence supporting the relationship between N2O emission and denitrifying community. Environ. Sci. Technol. 2013, 47, 7341–7349. [Google Scholar] [CrossRef] [PubMed]
  36. Harter, J.; Krause, H.M.; Schuettler, S.; Ruser, R.; Fromme, M.; Scholten, T.; Kappler, A.; Behrens, S. Linking N2O emissions from biochar-amended soil to the structure and function of the N-cycling microbial community. ISME J. 2014, 8, 660–674. [Google Scholar] [CrossRef] [PubMed]
  37. Hüppi, R.; Felber, R.; Neftel, A.; Six, J.; Leifeld, J. Effect of biochar and liming on soil nitrous oxide emissions from a temperate maize cropping system. Soil 2015, 1, 707–717. [Google Scholar] [CrossRef]
  38. Obia, A.; Cornelissen, G.; Mulder, J.; Dorsch, P. Effect of Soil pH Increase by Biochar on NO, N2O and N2 Production during Denitrification in Acid Soils. PLoS ONE 2015, 10, e0138781. [Google Scholar] [CrossRef] [Green Version]
  39. Bird, M.I.; Wynn, J.G.; Saiz, G.; Wurster, C.M.; McBeath, A. The Pyrogenic Carbon Cycle. Annu. Rev. Earth Planet. Sci. 2015, 43, 273–298. [Google Scholar] [CrossRef]
  40. Santin, C.; Doerr, S.H.; Merino, A.; Bucheli, T.D.; Bryant, R.; Ascough, P.; Gao, X.; Masiello, C.A. Carbon sequestration potential and physicochemical properties differ between wildfire charcoals and slow-pyrolysis biochars. Sci. Rep. 2017, 7, 11233. [Google Scholar] [CrossRef] [PubMed] [Green Version]
  41. Nelissen, V.; Rütting, T.; Huygens, D.; Staelens, J.; Ruysschaert, G.; Boeckx, P. Maize biochars accelerate short-term soil nitrogen dynamics in a loamy sand soil. Soil Biol. Biochem. 2012, 55, 20–27. [Google Scholar] [CrossRef]
  42. Joseph, S.D.; Camps-Arbestain, M.; Lin, Y.; Munroe, P.; Chia, C.H.; Hook, J.; van Zwieten, L.; Kimber, S.; Cowie, A.; Singh, B.P.; et al. An investigation into the reactions of biochar in soil. Soil Res. 2010, 48, 501–515. [Google Scholar] [CrossRef]
  43. Enders, A.; Hanley, K.; Whitman, T.; Joseph, S.; Lehmann, J. Characterization of biochars to evaluate recalcitrance and agronomic performance. Bioresour. Technol. 2012, 114, 644–653. [Google Scholar] [CrossRef]
  44. Ahmad, M.; Lee, S.S.; Dou, X.; Mohan, D.; Sung, J.K.; Yang, J.E.; Ok, Y.S. Effects of pyrolysis temperature on soybean stover- and peanut shell-derived biochar properties and TCE adsorption in water. Bioresour. Technol. 2012, 118, 536–544. [Google Scholar] [CrossRef]
  45. Ippolito, J.A.; Novak, J.M.; Busscher, W.J.; Ahmedna, M.; Rehrah, D.; Watts, D.W. Switchgrass biochar affects two aridisols. J. Environ. Qual. 2012, 41, 1123–1130. [Google Scholar] [CrossRef]
  46. Clough, T.; Condron, L.; Kammann, C.; Müller, C. A Review of Biochar and Soil Nitrogen Dynamics. Agronomy 2013, 3, 275–293. [Google Scholar] [CrossRef] [Green Version]
  47. Biederman, L.A.; Harpole, W.S. Biochar and its effects on plant productivity and nutrient cycling: A meta-analysis. GCB Bioenergy 2013, 5, 202–214. [Google Scholar] [CrossRef]
  48. Feng, Z.; Zhu, L. Impact of biochar on soil N2O emissions under different biochar-carbon/fertilizer-nitrogen ratios at a constant moisture condition on a silt loam soil. Sci. Total Environ. 2017, 584–585, 776–782. [Google Scholar] [CrossRef]
  49. Tybirk, K.; Luostarinen, S.; Hamelin, L.; Rodhe, L.; Haneklaus, S.; Poulsen, H.D.; Jensen, A.L.S. Sustainable Manure Management in the Baltic Sea Region; Jokioinen, Finland, 2013; Available online: http://eu.baltic.net/Project_Database.5308.html?contentid=58&contentaction=single (accessed on 1 October 2019).
  50. Jeffery, S.; Verheijen, F.G.A.; van der Velde, M.; Bastos, A.C. A quantitative review of the effects of biochar application to soils on crop productivity using meta-analysis. Agric. Ecosyst. Environ. 2011, 144, 175–187. [Google Scholar] [CrossRef]
  51. Bates, R.B.; Ghoniem, A.F. Biomass torrefaction: Modeling of volatile and solid product evolution kinetics. Bioresour. Technol. 2012, 124, 460–469. [Google Scholar] [CrossRef] [PubMed]
  52. Hagemann, N.; Spokas, K.; Schmidt, H.-P.; Kägi, R.; Böhler, M.; Bucheli, T. Activated Carbon, Biochar and Charcoal: Linkages and Synergies across Pyrogenic Carbon’s ABCs. Water 2018, 10, 182. [Google Scholar] [CrossRef] [Green Version]
  53. Raave, H.; Escuer-Gatius, J.; Kauer, K.; Shanskiy, M.; Tõnutare, T.; Astover, A. Pyrolysis temperature influence on nutrient release from hay biochar and on the biochar impact on perennial ryegrass nutrient uptake and yield. Manuscript submitted for publication.
  54. Hutchinson, G.L.; Livingston, G.P. Use of chamber systems to measure trace gas fluxes. In Agricultural Ecosystem Effects on Trace Gases and Global Climate Change; Harper, L.A., Mosier, A.R., Duxbury, J.M., Rolston, D.E., Eds.; American Society of Agronomy: Madison, WI, USA, 1993; pp. 63–78. [Google Scholar] [CrossRef] [Green Version]
  55. Järveoja, J.; Peichl, M.; Maddison, M.; Soosaar, K.; Vellak, K.; Karofeld, E.; Teemusk, A.; Mander, Ü. Impact of water table level on annual carbon and greenhouse gas balances of a restored peat extraction area. Biogeosciences 2016, 13, 2637–2651. [Google Scholar] [CrossRef] [Green Version]
  56. Loftfield, N.; Flessa, H.; Augustin, J.; Beese, F. Automated Gas Chromatographic System for Rapid Analysis of the Atmospheric Trace Gases Methane, Carbon Dioxide, and Nitrous Oxide. J. Environ. Qual. 1997, 26, 560–564. [Google Scholar] [CrossRef]
  57. Livingston, G.P.; Hutchinson, G.L. Enclosure-based measurement of trace gas exchange: Applications and sources of error. In Biogenic Trace Gases: Measuring Emissions from Soil and Water; Matson, P.A., Harriss, R.C., Eds.; Blackwell Publishing: Oxford, UK, 1995; pp. 14–51. [Google Scholar]
  58. Parkin, T.B.; Venterea, R.T.; Follett, R.F. Chapter 3. Chamber-Based Trace Gas Flux Measurements; USDA-ARS: Beltsville, MD, USA, 2010.
  59. Vinzent, B.; Fuß, R.; Maidl, F.-X.; Hülsbergen, K.-J. N2O emissions and nitrogen dynamics of winter rapeseed fertilized with different N forms and a nitrification inhibitor. Agric. Ecosyst. Environ. 2018, 259, 86–97. [Google Scholar] [CrossRef]
  60. R Development Core Team. R: A Language and Environment for Statistical Computing; R Foundation for Statistical Computing: Vienna, Austria, 2016. [Google Scholar]
  61. Mendiburu, F.D. Agricolae: Statistical Procedures for Agricultural Research; R Package Version 1.2-3; The Comprehensive R Archive Network: Vienna, Austria, 2015. [Google Scholar]
  62. Tukey, J.W. Exploratory Data Analysis; Addison-Wesley Publishing Company: Reading, MA, USA, 1977. [Google Scholar]
  63. Yang, H.; Yan, R.; Chen, H.; Lee, D.H.; Zheng, C. Characteristics of hemicellulose, cellulose and lignin pyrolysis. Fuel 2007, 86, 1781–1788. [Google Scholar] [CrossRef]
  64. Keiluweit, M.; Nico, P.S.; Johnson, M.G.; Kleber, M. Dynamic molecular structure of plant biomass-derived black carbon (biochar). Environ. Sci. Technol. 2010, 44, 1247–1253. [Google Scholar] [CrossRef] [Green Version]
  65. Song, K.; Zhang, H.; Wu, Q.; Zhang, Z.; Zhou, C.; Zhang, Q.; Lei, T. Structure and thermal properties of tar from gasification of agricultural crop residue. J. Therm. Anal. Calorim. 2014, 119, 27–35. [Google Scholar] [CrossRef]
  66. Horikawa, Y.; Hirano, S.; Mihashi, A.; Kobayashi, Y.; Zhai, S.; Sugiyama, J. Prediction of Lignin Contents from Infrared Spectroscopy: Chemical Digestion and Lignin/Biomass Ratios of Cryptomeria japonica. Appl. Biochem. Biotechnol. 2019, 188, 1066–1076. [Google Scholar] [CrossRef]
  67. Firestone, M.K.; Tiedje, J.M. Temporal change in nitrous oxide and dinitrogen from denitrification following onset of anaerobiosis. Appl. Environ. Microbiol. 1979, 38, 673–679. [Google Scholar] [CrossRef] [Green Version]
  68. Clemens, J.; Huschka, A. The effect of biological oxygen demand of cattle slurry and soil moisture on nitrous oxide emissions. Nutr. Cycl. Agroecosystems 2001, 59, 193–198. [Google Scholar] [CrossRef]
  69. Butterbach-Bahl, K.; Baggs, E.M.; Dannenmann, M.; Kiese, R.; Zechmeister-Boltenstern, S. Nitrous oxide emissions from soils: How well do we understand the processes and their controls? Philos. Trans. R. Soc. Lond. B Biol. Sci. 2013, 368, 20130122. [Google Scholar] [CrossRef] [PubMed]
  70. Halling-Sørensen, B.; Jørgensen, S.E. Process Chemistry and Biochemistry of Nitrification. In Studies in Environmental Science; Halling-Sørensen, B., Jørgensen, S.E., Eds.; Elsevier Science: Amsterdam, The Netherlands, 1993; Volume 54, pp. 55–118. [Google Scholar]
  71. Simek, M.; Cooper, J.E. The influence of soil pH on denitrification: Progress towards the understanding of this interaction over the last 50 years. Eur. J. Soil Sci. 2002, 53, 345–354. [Google Scholar] [CrossRef]
  72. Hütsch, B.W.; Zhang, S.; Feng, K.; Yan, F.; Schubert, S. Effect of pH on denitrification losses from different arable soils. Plant Nutr. 2001, 962–963. [Google Scholar] [CrossRef]
  73. Anderson, C.R.; Peterson, M.E.; Frampton, R.A.; Bulman, S.R.; Keenan, S.; Curtin, D. Rapid increases in soil pH solubilise organic matter, dramatically increase denitrification potential and strongly stimulate microorganisms from the Firmicutes phylum. PeerJ 2018, 6, e6090. [Google Scholar] [CrossRef] [PubMed] [Green Version]
  74. Smith, M.S.; Parsons, L.L. Persistence of Denitrifying Enzyme Activity in Dried Soils. Appl. Environ. Microbiol. 1985, 49, 316–320. [Google Scholar] [CrossRef] [PubMed] [Green Version]
  75. Kalbitz, K.; Solinger, S.; Park, J.H.; Michalzik, B.; Matzner, E. Controls on the Dynamics of Dissolved Organic Matter in Soils: A Review. Soil Sci. 2000, 165, 277–304. [Google Scholar] [CrossRef]
  76. Lundquist, E.J.; Jackson, L.E.; Scow, K.M.; Hsu, C. Changes in microbial biomass and community composition, and soil carbon and nitrogen pools after incorporation of rye into three California agricultural soils. Soil Biol. Biochem. 1999, 31, 221–236. [Google Scholar] [CrossRef]
  77. Ruser, R.; Flessa, H.; Russow, R.; Schmidt, G.; Buegger, F.; Munch, J.C. Emission of N2O, N2 and CO2 from soil fertilized with nitrate: Effect of compaction, soil moisture and rewetting. Soil Biol. Biochem. 2006, 38, 263–274. [Google Scholar] [CrossRef]
  78. Petersen, S.O. Nitrous Oxide Emissions from Manure and Inorganic Fertilizers Applied to Spring Barley. J. Environ. Qual. 1999, 28, 1610–1618. [Google Scholar] [CrossRef]
  79. Chen, Z.; Ding, W.; Luo, Y.; Yu, H.; Xu, Y.; Müller, C.; Xu, X.; Zhu, T. Nitrous oxide emissions from cultivated black soil: A case study in Northeast China and global estimates using empirical model. Glob. Biogeochem. Cycles 2014, 28, 1311–1326. [Google Scholar] [CrossRef]
  80. Yamulki, S.; Harrison, R.M.; Goulding, K.W.T.; Webster, C.P. N2O, NO and NO2 fluxes from a grassland: Effect of soil pH. Soil Biol. Biochem. 1997, 29, 1199–1208. [Google Scholar] [CrossRef]
  81. Mori, T.; Ohta, S.; Ishizuka, S.; Konda, R.; Wicaksono, A.; Heriyanto, J.; Hardjono, A. Effects of phosphorus addition on N2O and NO emissions from soils of an Acacia mangium plantation. Soil Sci. Plant Nutr. 2010, 56, 782–788. [Google Scholar] [CrossRef] [Green Version]
  82. Dancer, W.S.; Peterson, L.A.; Chesters, G. Ammonification and Nitrification of N as Influenced by Soil pH and Previous N Treatments1. Soil Sci. Soc. Am. J. 1973, 37, 67–69. [Google Scholar] [CrossRef]
  83. Haynes, R.J.; Swift, R.S. Effect of rewetting air-dried soils on pH and accumulation of mineral nitrogen. J. Soil Sci. 1989, 40, 341–347. [Google Scholar] [CrossRef]
  84. Yang, H.I.; Lou, K.; Rajapaksha, A.U.; Ok, Y.S.; Anyia, A.O.; Chang, S.X. Adsorption of ammonium in aqueous solutions by pine sawdust and wheat straw biochars. Environ. Sci. Pollut. Res. Int. 2018, 25, 25638–25647. [Google Scholar] [CrossRef] [PubMed]
  85. Fidel, R.B.; Laird, D.A.; Spokas, K.A. Sorption of ammonium and nitrate to biochars is electrostatic and pH-dependent. Sci. Rep. 2018, 8, 17627. [Google Scholar] [CrossRef] [PubMed]
  86. Wang, B.; Lehmann, J.; Hanley, K.; Hestrin, R.; Enders, A. Adsorption and desorption of ammonium by maple wood biochar as a function of oxidation and pH. Chemosphere 2015, 138, 120–126. [Google Scholar] [CrossRef] [Green Version]
  87. Wang, B.; Lehmann, J.; Hanley, K.; Hestrin, R.; Enders, A. Ammonium retention by oxidized biochars produced at different pyrolysis temperatures and residence times. RSC Adv. 2016, 6, 41907–41913. [Google Scholar] [CrossRef]
Figure 1. Total cumulative N2O fluxes (mg N m−2) for each treatment (S: Soil; BC300: biochar produced at 300 °C; BC550: biochar produced at 550 °C; BC850: biochar produced at 850 °C; CS: cattle slurry; SD: slurry digestate; VN: vinasse) for the considered period (20 days). Different letters indicate different groups according Tukey’s honest significant difference (HSD) test (α = 0.05). p-value for two-way ANOVA for biochar temperature production and fertilizer type. Colors indicate fertilizer treatment (orange: no fertilizer; blue: cattle slurry; green: slurry digestate; and gray: vinasse).
Agronomy 10 00109 g001
Figure 2. Total cumulative N2O fluxes (mg N m−2) for the different studied fertilizers (Control: soil; CS: cattle slurry; SD: slurry digestate; VN: vinasse) without biochar amendment for the considered period (20 days). p-value for one-way ANOVA for fertilizer type.
Agronomy 10 00109 g002
Figure 3. Total cumulative N2O fluxes (mg N m−2) for the different production temperatures of biochar (Control: soil; BC300: biochar produced at 300 °C; BC550: biochar produced at 550 °C; BC850: biochar produced at 850 °C) without fertilizer for the considered period (20 days). p-value for one-way ANOVA for biochar production temperature. Different letters and colors indicate different groups according to Tukey’s HSD test (α = 0.05).
Agronomy 10 00109 g003
Figure 4. N2O-N fluxes for each fertilizer and production temperature biochar during the studied period (BC300: Biochar produced at 300 °C; BC550: Biochar produced at 550 °C; BC850: Biochar produced at 850 °C). Stars indicate significant differences according ANOVA (*: p < 0.05; **: p < 0.01; ***: p < 0.001; ns: not significant).
Agronomy 10 00109 g004
Figure 5. Linear regression for the cumulative N2O fluxes of the selected period (20 days) with (a) released total C, and (b) released total N.
Agronomy 10 00109 g005
Table 1. Mixture for the 0–10 cm depth layer for each of the treatments and amount of applied biochar and/or fertilizer (g m−2). BC300: torrefied granules at 300 °C, BC550: BC300 pyrolyzed at 550 °C, BC850: BC300 pyrolyzed at 850 °C, CS: cattle slurry, SD: slurry digestate, VN: vinasse.
Treatment0–10 cm Depth
Soil (S)Soil without fertilizer or BC
S + CSSoil + CS (2736 g m−2)
S + SDSoil + SD (2736 g m−2)
S + VNSoil + VN (178.9 g m−2)
S + BC300Soil + BC300 (915.8 g m−2)
S + BC300 + CSSoil + BC300 (915.8 g m−2) + CS (2736 g m−2)
S + BC300 + SDSoil + BC300 (915.8 g m−2) + SD (2736 g m−2)
S + BC300 + VNSoil + BC300 (915.8 g m−2) + VN (178.9 g m−2)
S + BC550Soil + BC550 (915.8 g m−2)
S + BC550 + CSSoil + BC550 (915.8 g m−2) + CS (2736 g m−2)
S + BC550 + SDSoil + BC550 (915.8 g m−2) + SD (2736 g m−2)
S + BC550 + VNSoil + BC550 (915.8 g m−2) + VN (178.9 g m−2)
S + BC850Soil + BC850 (915.8 g m−2)
S + BC850 + CSSoil + BC850 (915.8 g m−2) + CS (2736 g m−2)
S + BC850 + SDSoil + BC850 (915.8 g m−2) + SD (2736 g m−2)
S + BC850 + VNSoil + BC850 (915.8 g m−2) + VN (178.9 g m−2)
Table 2. Biochar physical and chemical properties. BC300: torrefied granules at 300 °C, BC550: BC300 pyrolyzed at 550 °C, BC850: BC300 pyrolyzed at 850 °C.
ParameterBC300BC550BC850
pH6.810.111.8
Ash content (%)10.420.323.0
Neutralization ability, CaCO3 (%) 4.358.158.11
Surface area (BET) 1 (m2 g−1)0.993.916.17
Cumulative pore volume (DFT) 2 (cm3 g−1)0.0020.0180.008
Ntot (%)2.822.922.56
Ctot (%)53.565.968.1
C/N 19.022.626.6
Ptot (%)0.240.540.60
Ktot (%)2.284.625.10
Catot (%)0.932.112.44
Mgtot (%)0.470.931.03
1 BET: Brunauer-Emmett-Teller method. 2 DFT: density functional theory method.
Table 3. Dry Matter, pHKCl, and nutrient content of the three fertilizers.
Cattle SlurrySlurry DigestateVinasse
Dry Matter (%)10.77.167.0
pH7.57.94.5
NH4+-N (%)10.2140.2570.27
NO3-N (%) 1<md<mdnd
P (%) 20.1120.1020.101
K (%) 20.3620.30213.25
Ca (%) 20.1820.1622.061
Mg (%) 20.0660.0410.161
1 content in fresh material; 2 content in dry matter. md: minimum detectable concentration, nd: not detected.
Table 4. Results of the three-way analysis of variance (ANOVA) and effect size (ω2) testing the effects of biochar production temperature (BC), applied fertilizer type (FERT), days since beginning of the application of fertilizer (TIME), and the interactions between these factors on N2O fluxes for the full duration of the experiment. Stars indicate significance: ***: 0.001; **: 0.01; *: 0.05; ns: not significant.
DfSum of
Squares
Mean
Square
F ValuePr(>F)Significance ω2
BC37057235225.114.82 × 10−14***0.039
FERT36696223223.8242.02 × 10−13***0.037
TIME692,00015,333163.674<2 × 10⁻¹⁶***0.529
BC:FERT9602670.7140.6957ns0.000
BC:TIME1817,97399910.658<2 × 10⁻¹⁶***0.094
FERT:TIME1820,224112411.993<2 × 10⁻¹⁶***0.107
BC:FERT:TIME5472231341.4280.0392*0.012
Residuals22420,985940.182
Table 5. Final pHKCl for the different treatment level combinations.
Biochar
no-bc300550850
Fertilizerno-fert5.155.445.825.77
CS5.205.676.09 6.05
VN5.205.565.915.87
SD5.085.425.955.88
no-bc: no biochar; BC300: biochar produced at 300 °C; BC550: biochar produced at 550 °C; BC850: biochar produced at 850 °C; no-fert: no fertiler, CS: cattle slurry; SD: slurry digestate; VN: vinasse.
Table 6. Initial and final content (%) of Ntot and Ctot, in biochar at the beginning and at the end of the experiment, and Ctot and Ntot released by the biochar during the experiment, proportion of total (%, w/w).
BiocharNtotCtot
Initial (%)3002.8253.5
5502.9265.9
8502.5668.1
Final (%)3001.7635.9
5501.3233.3
8500.7928.9
Released (difference %, w:w)3001.0617.6
5501.6032.6
8501.7739.2

