
Degradation of Albumin on Plasma-Treated Polystyrene by Soft X-ray Exposure

 ,
,  ,
,  ,
, 
Abstract
:
1. Introduction
2. Materials and Methods
2.1. Polystyrene Substrates
2.2. Human Serum Albumin
2.3. Gaseous Plasma Treatment
2.4. Atomic Force Microscopy (AFM)
2.5. X-ray Photoelectron Spectroscopy (XPS)
2.6. Near-Edge X-ray Absorption Fine Structure (NEXAFS)
3. Results and Discussion
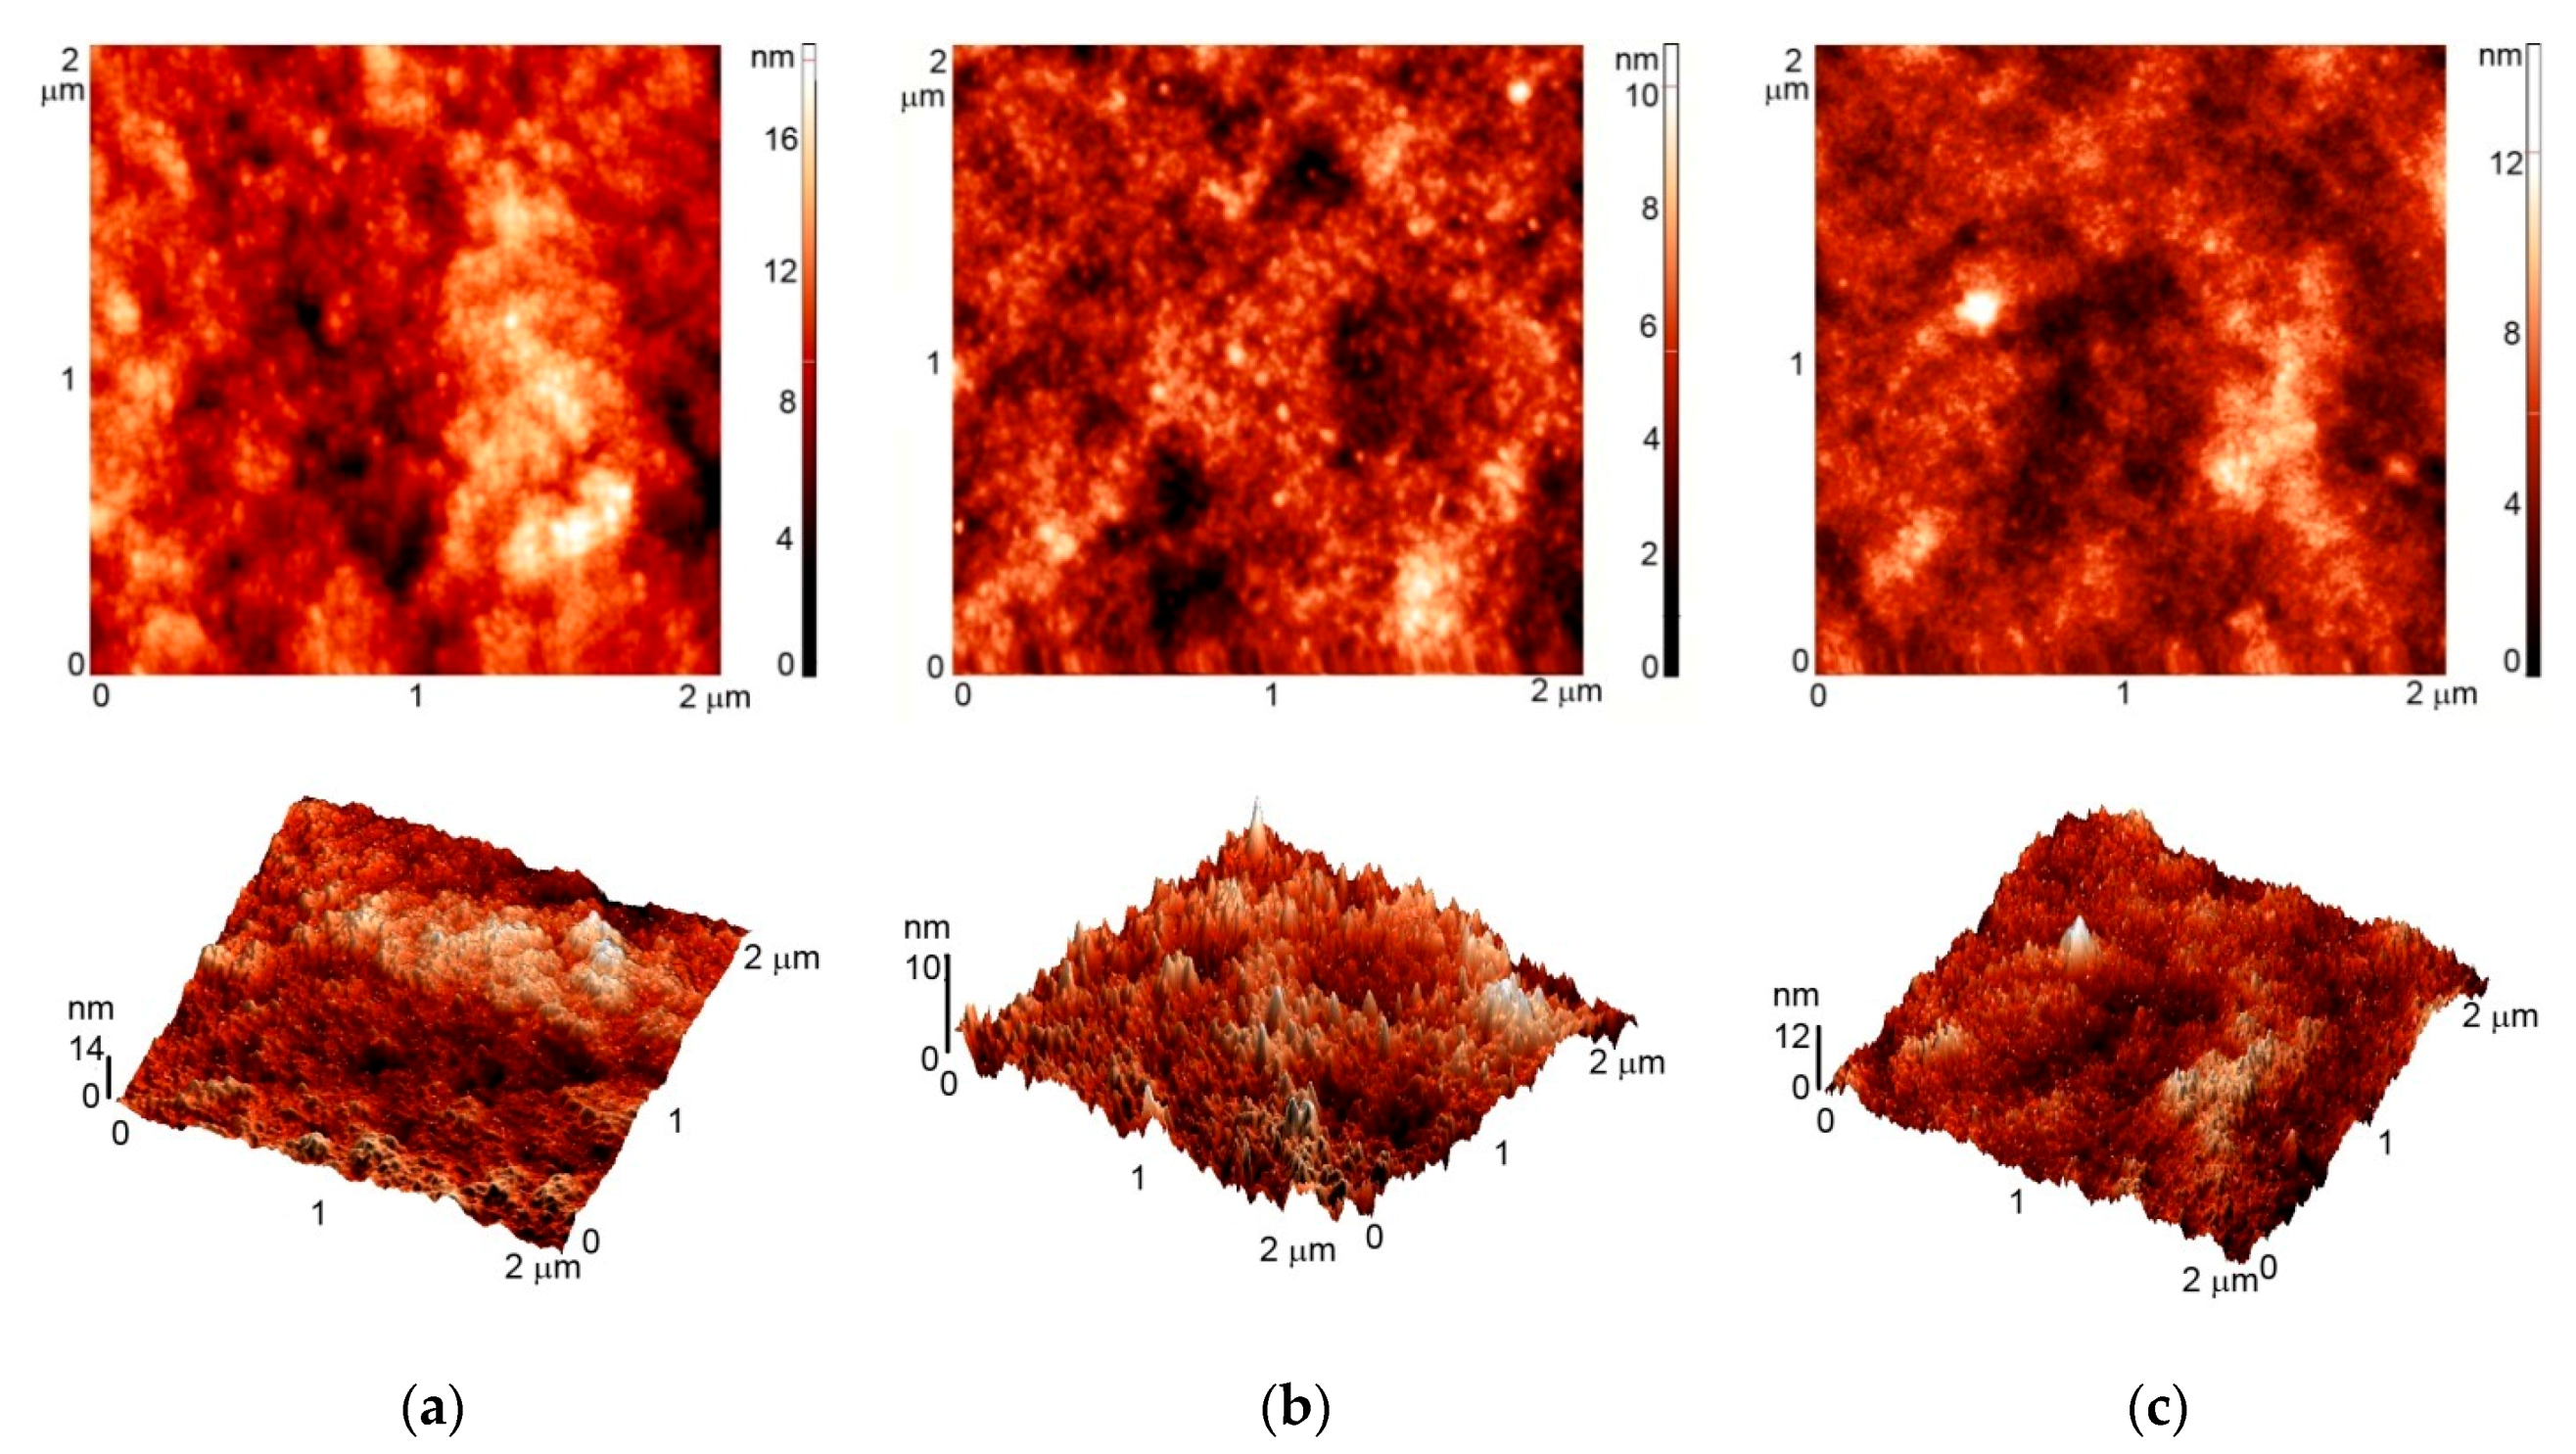
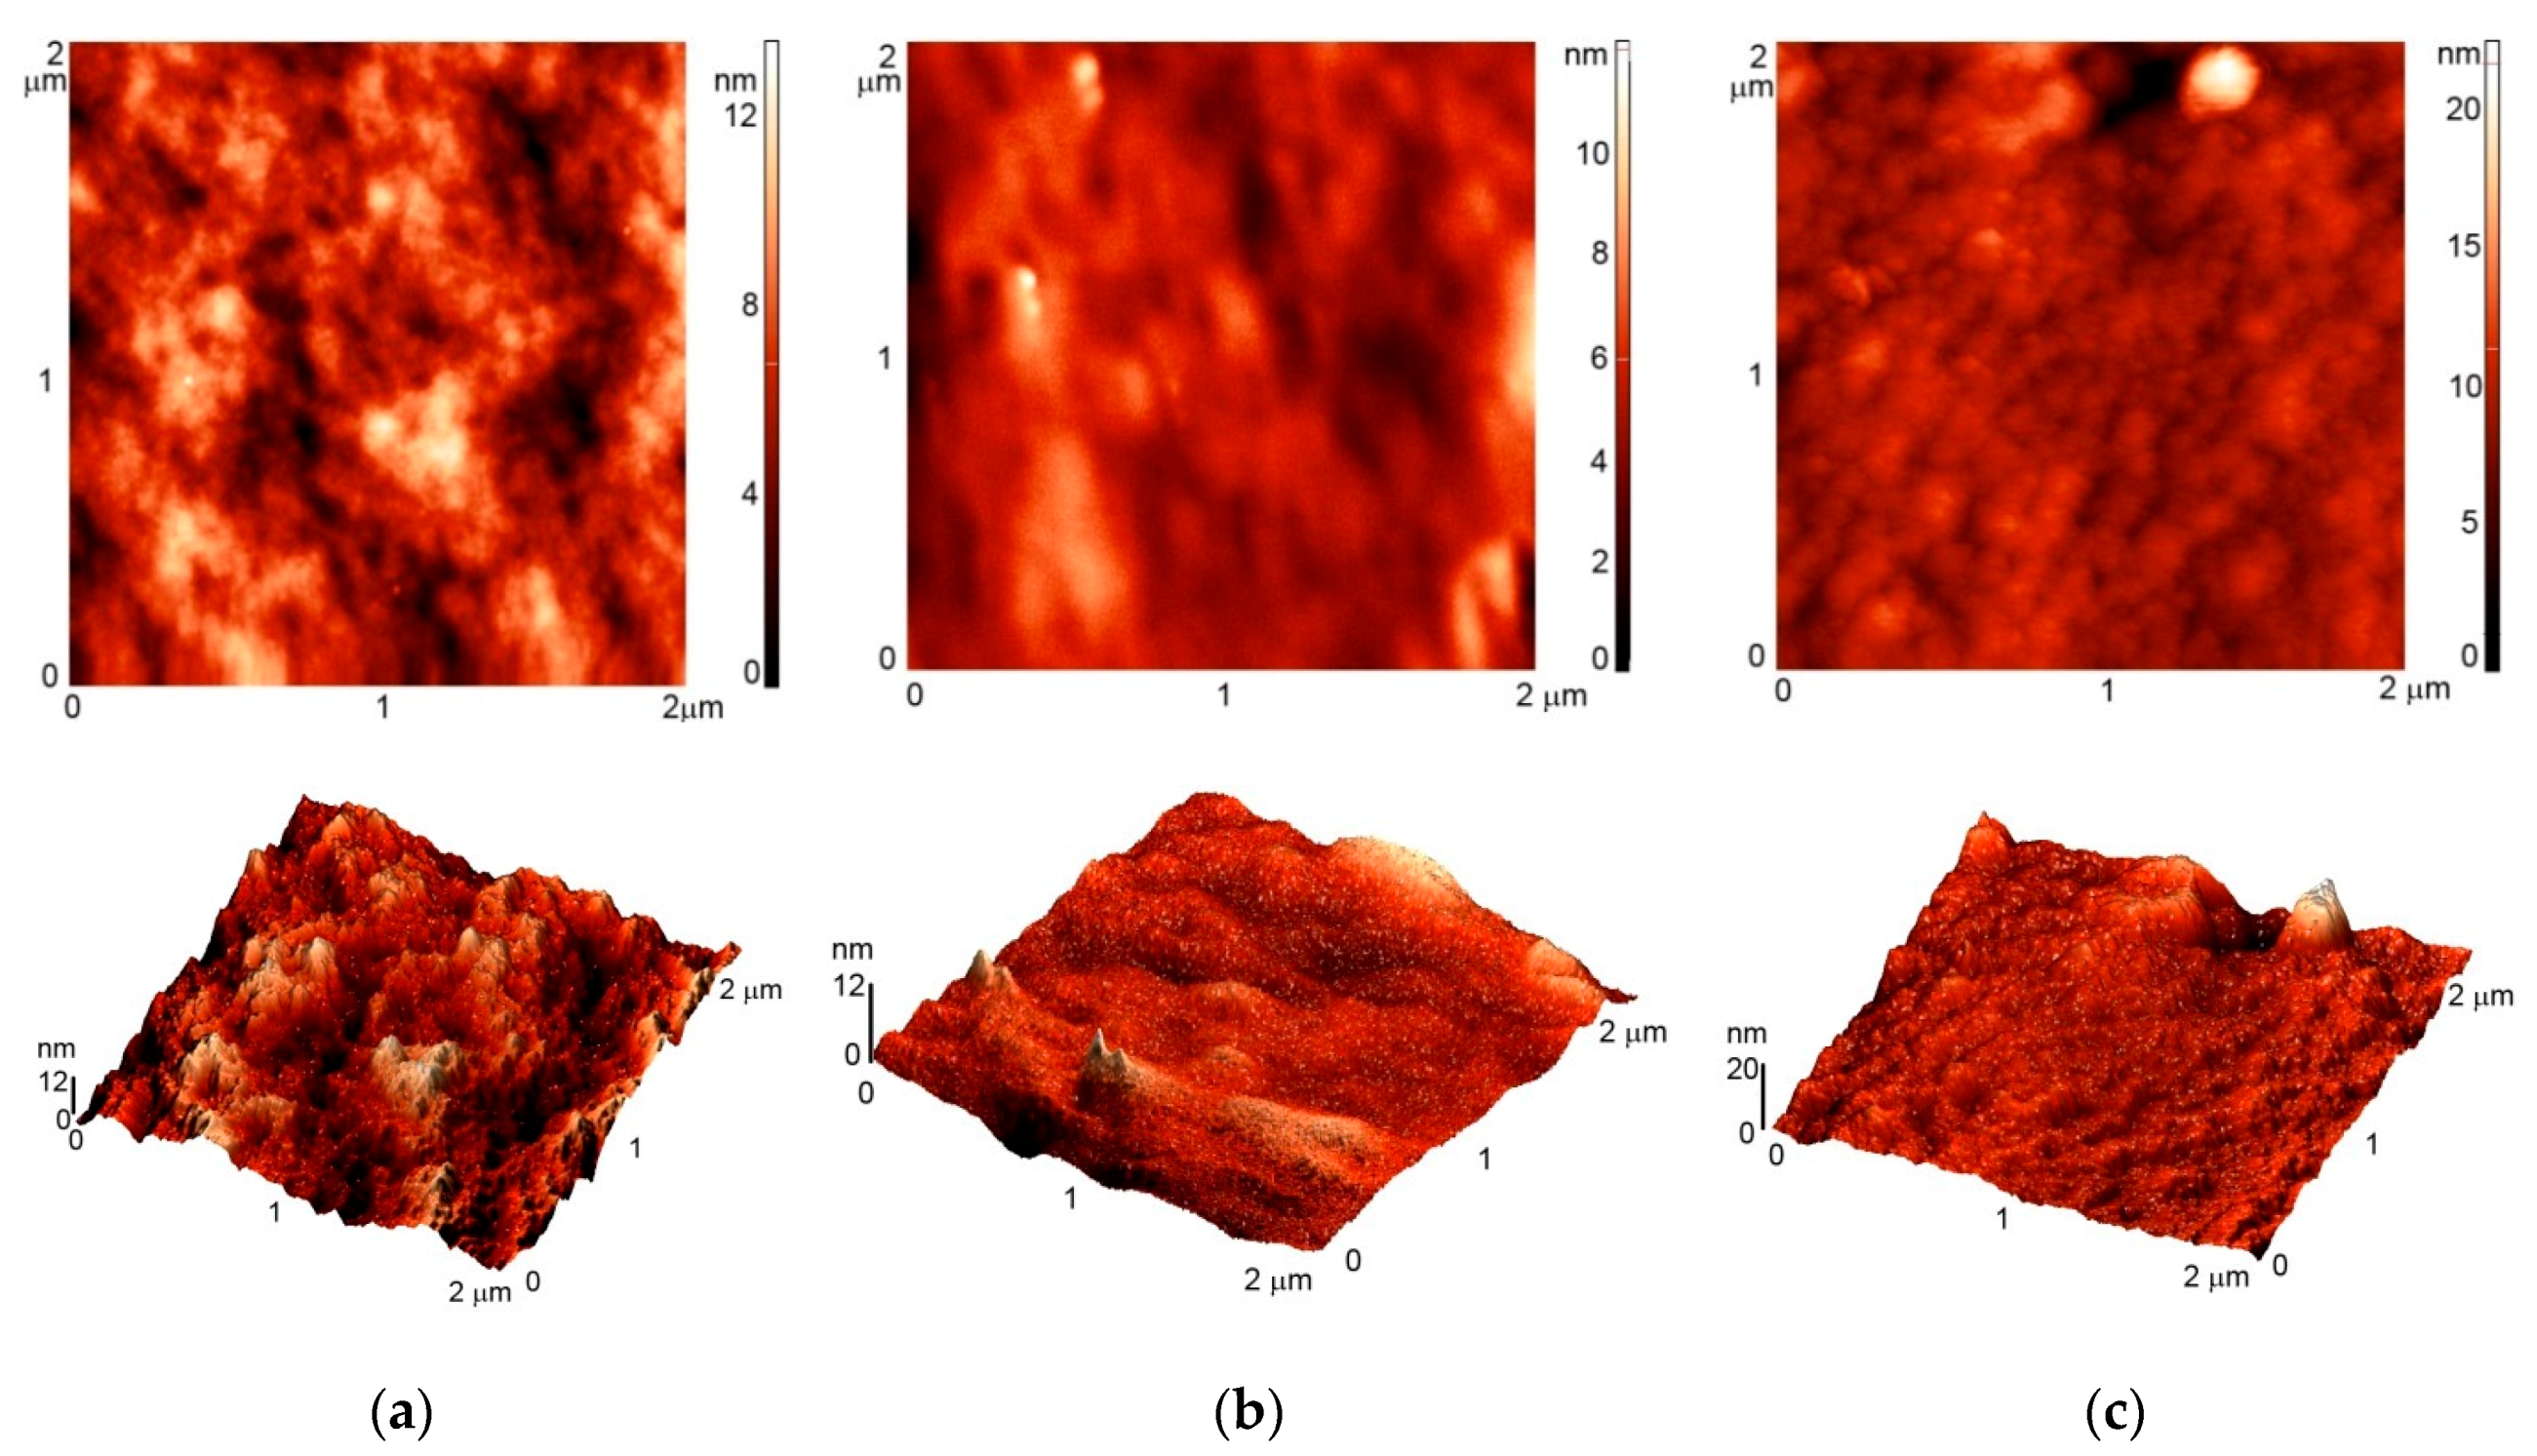
3.1. AFM Imaging
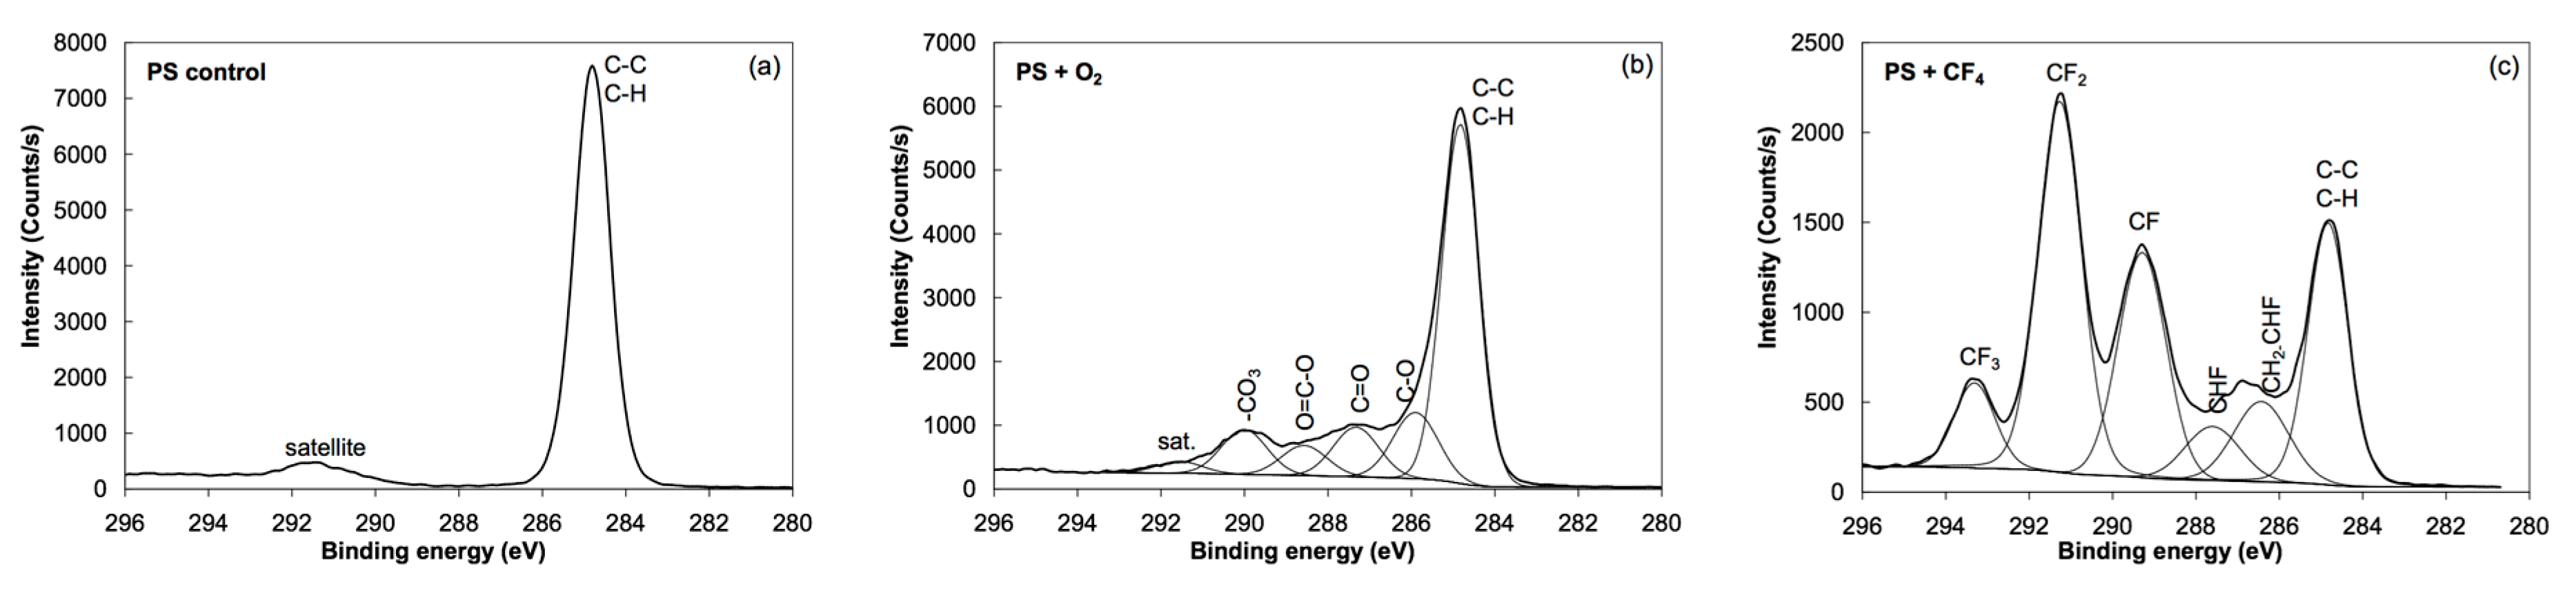
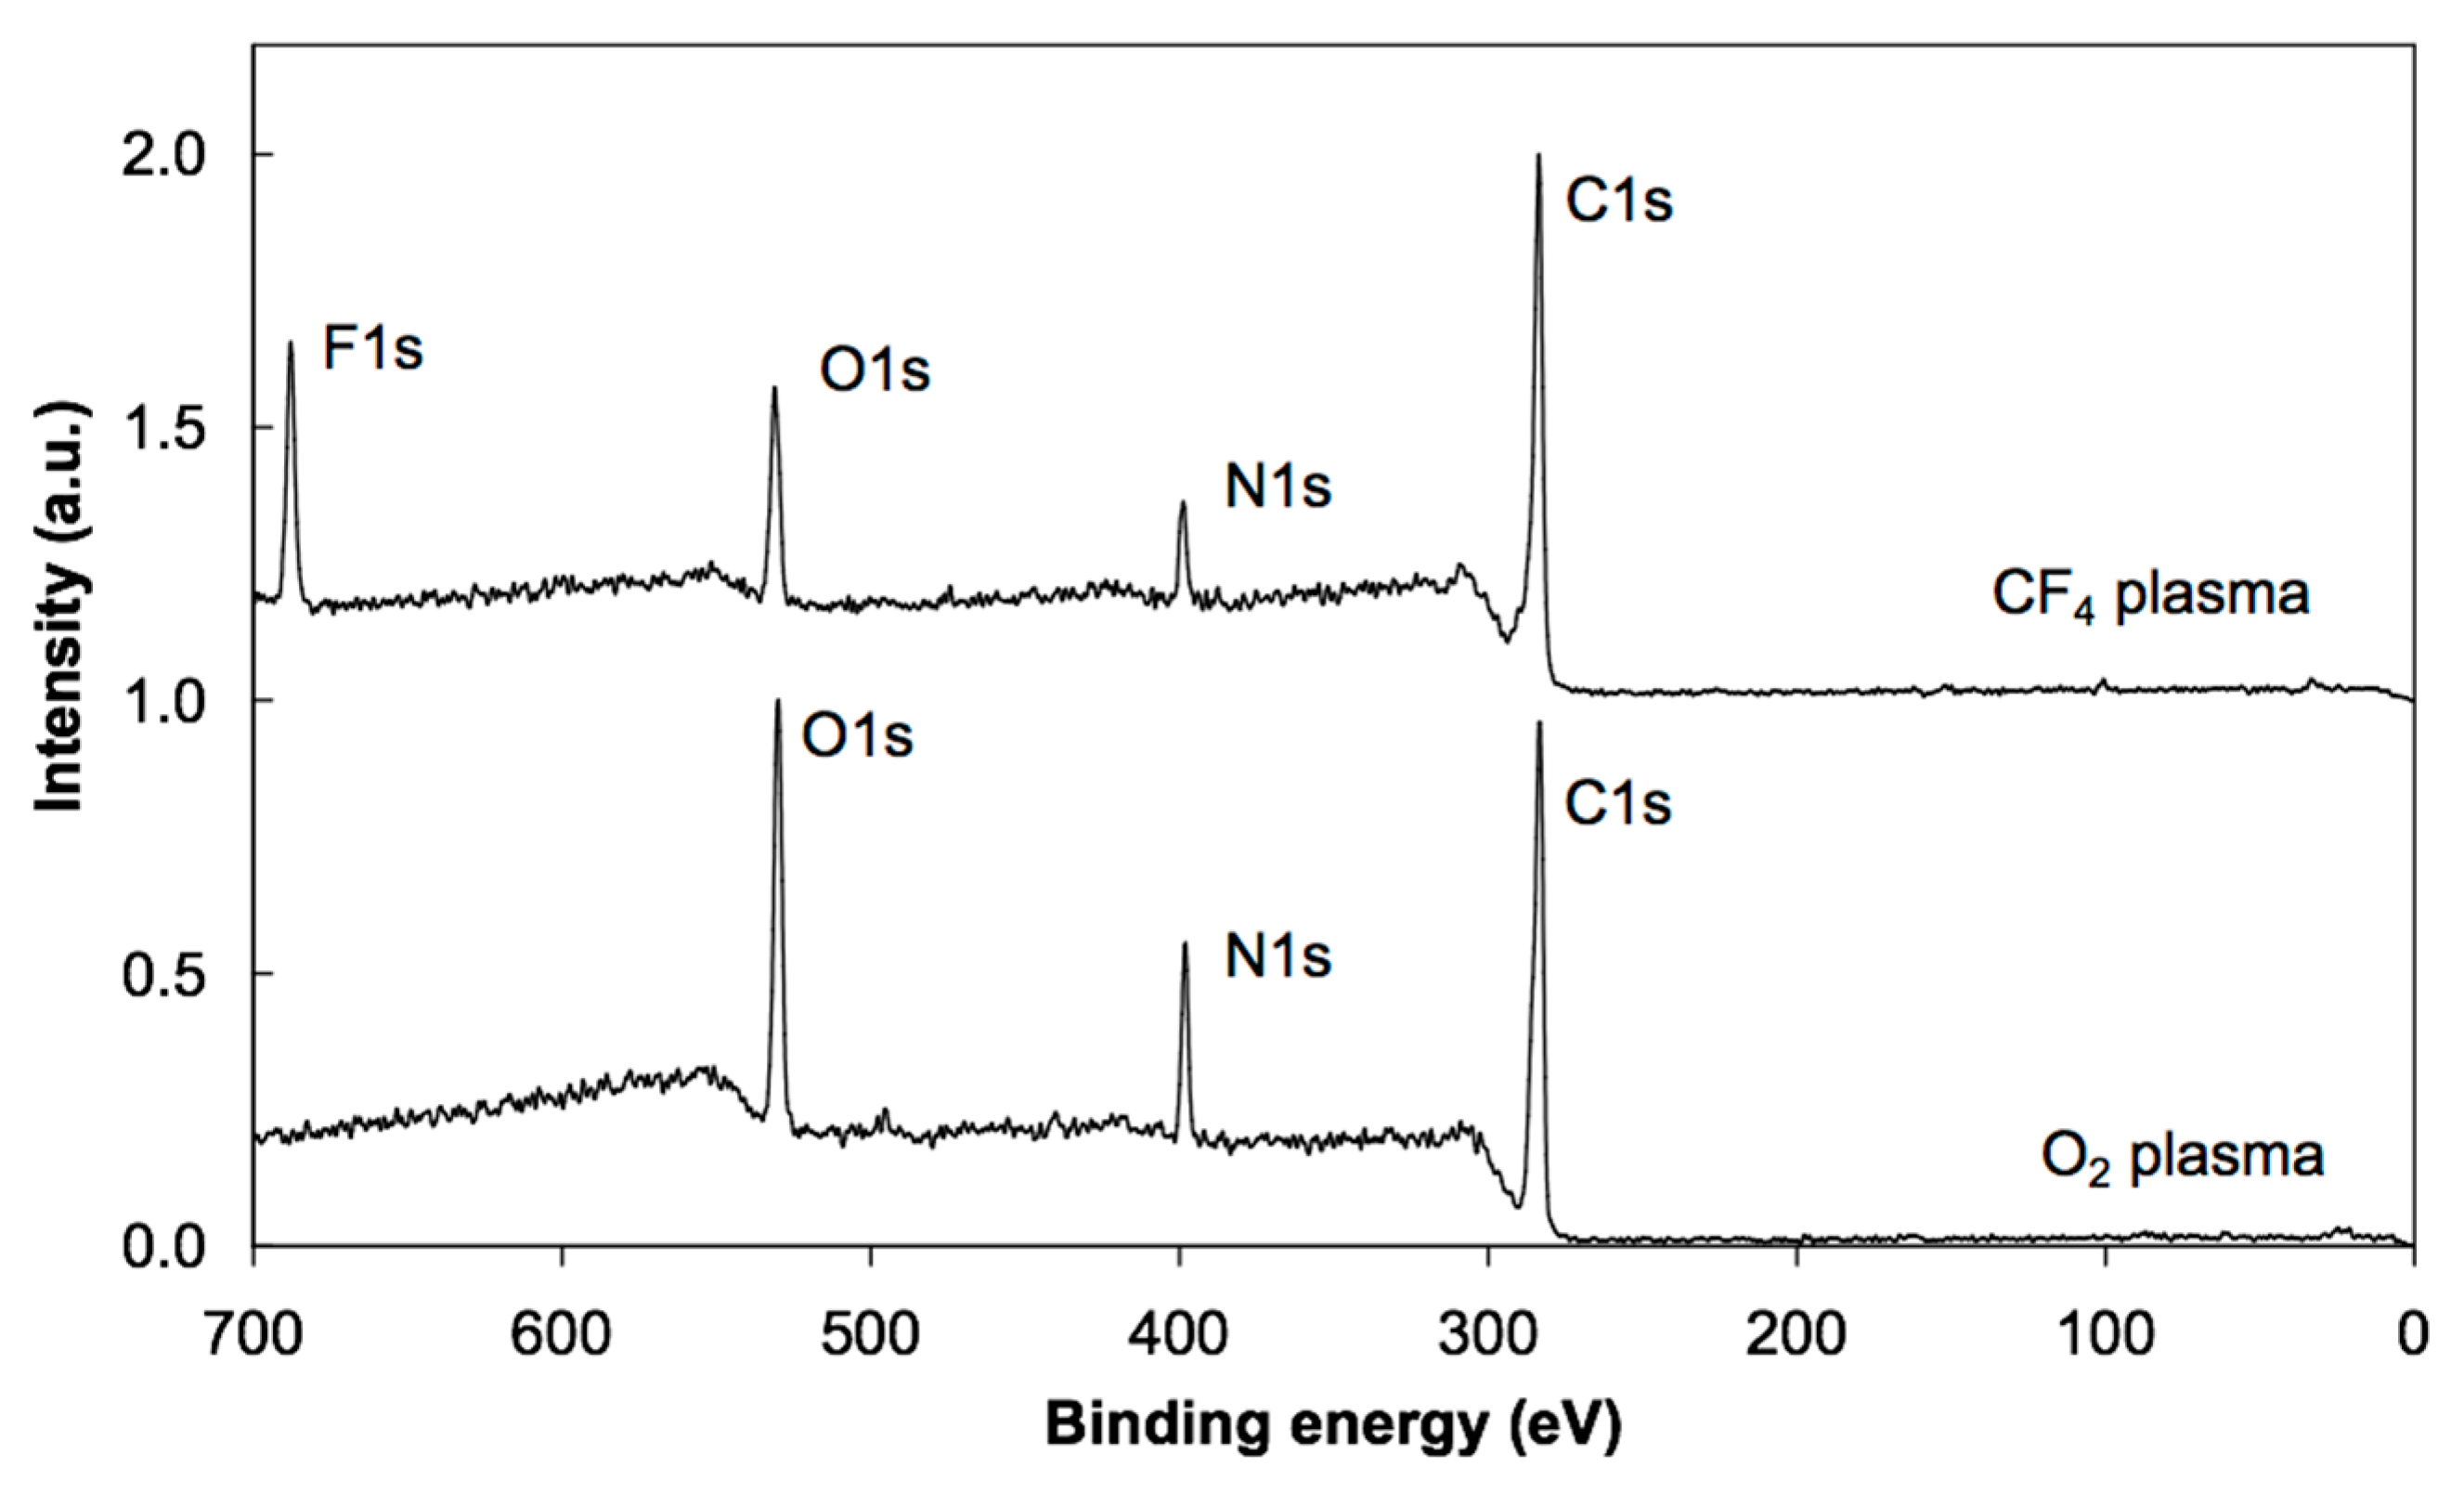
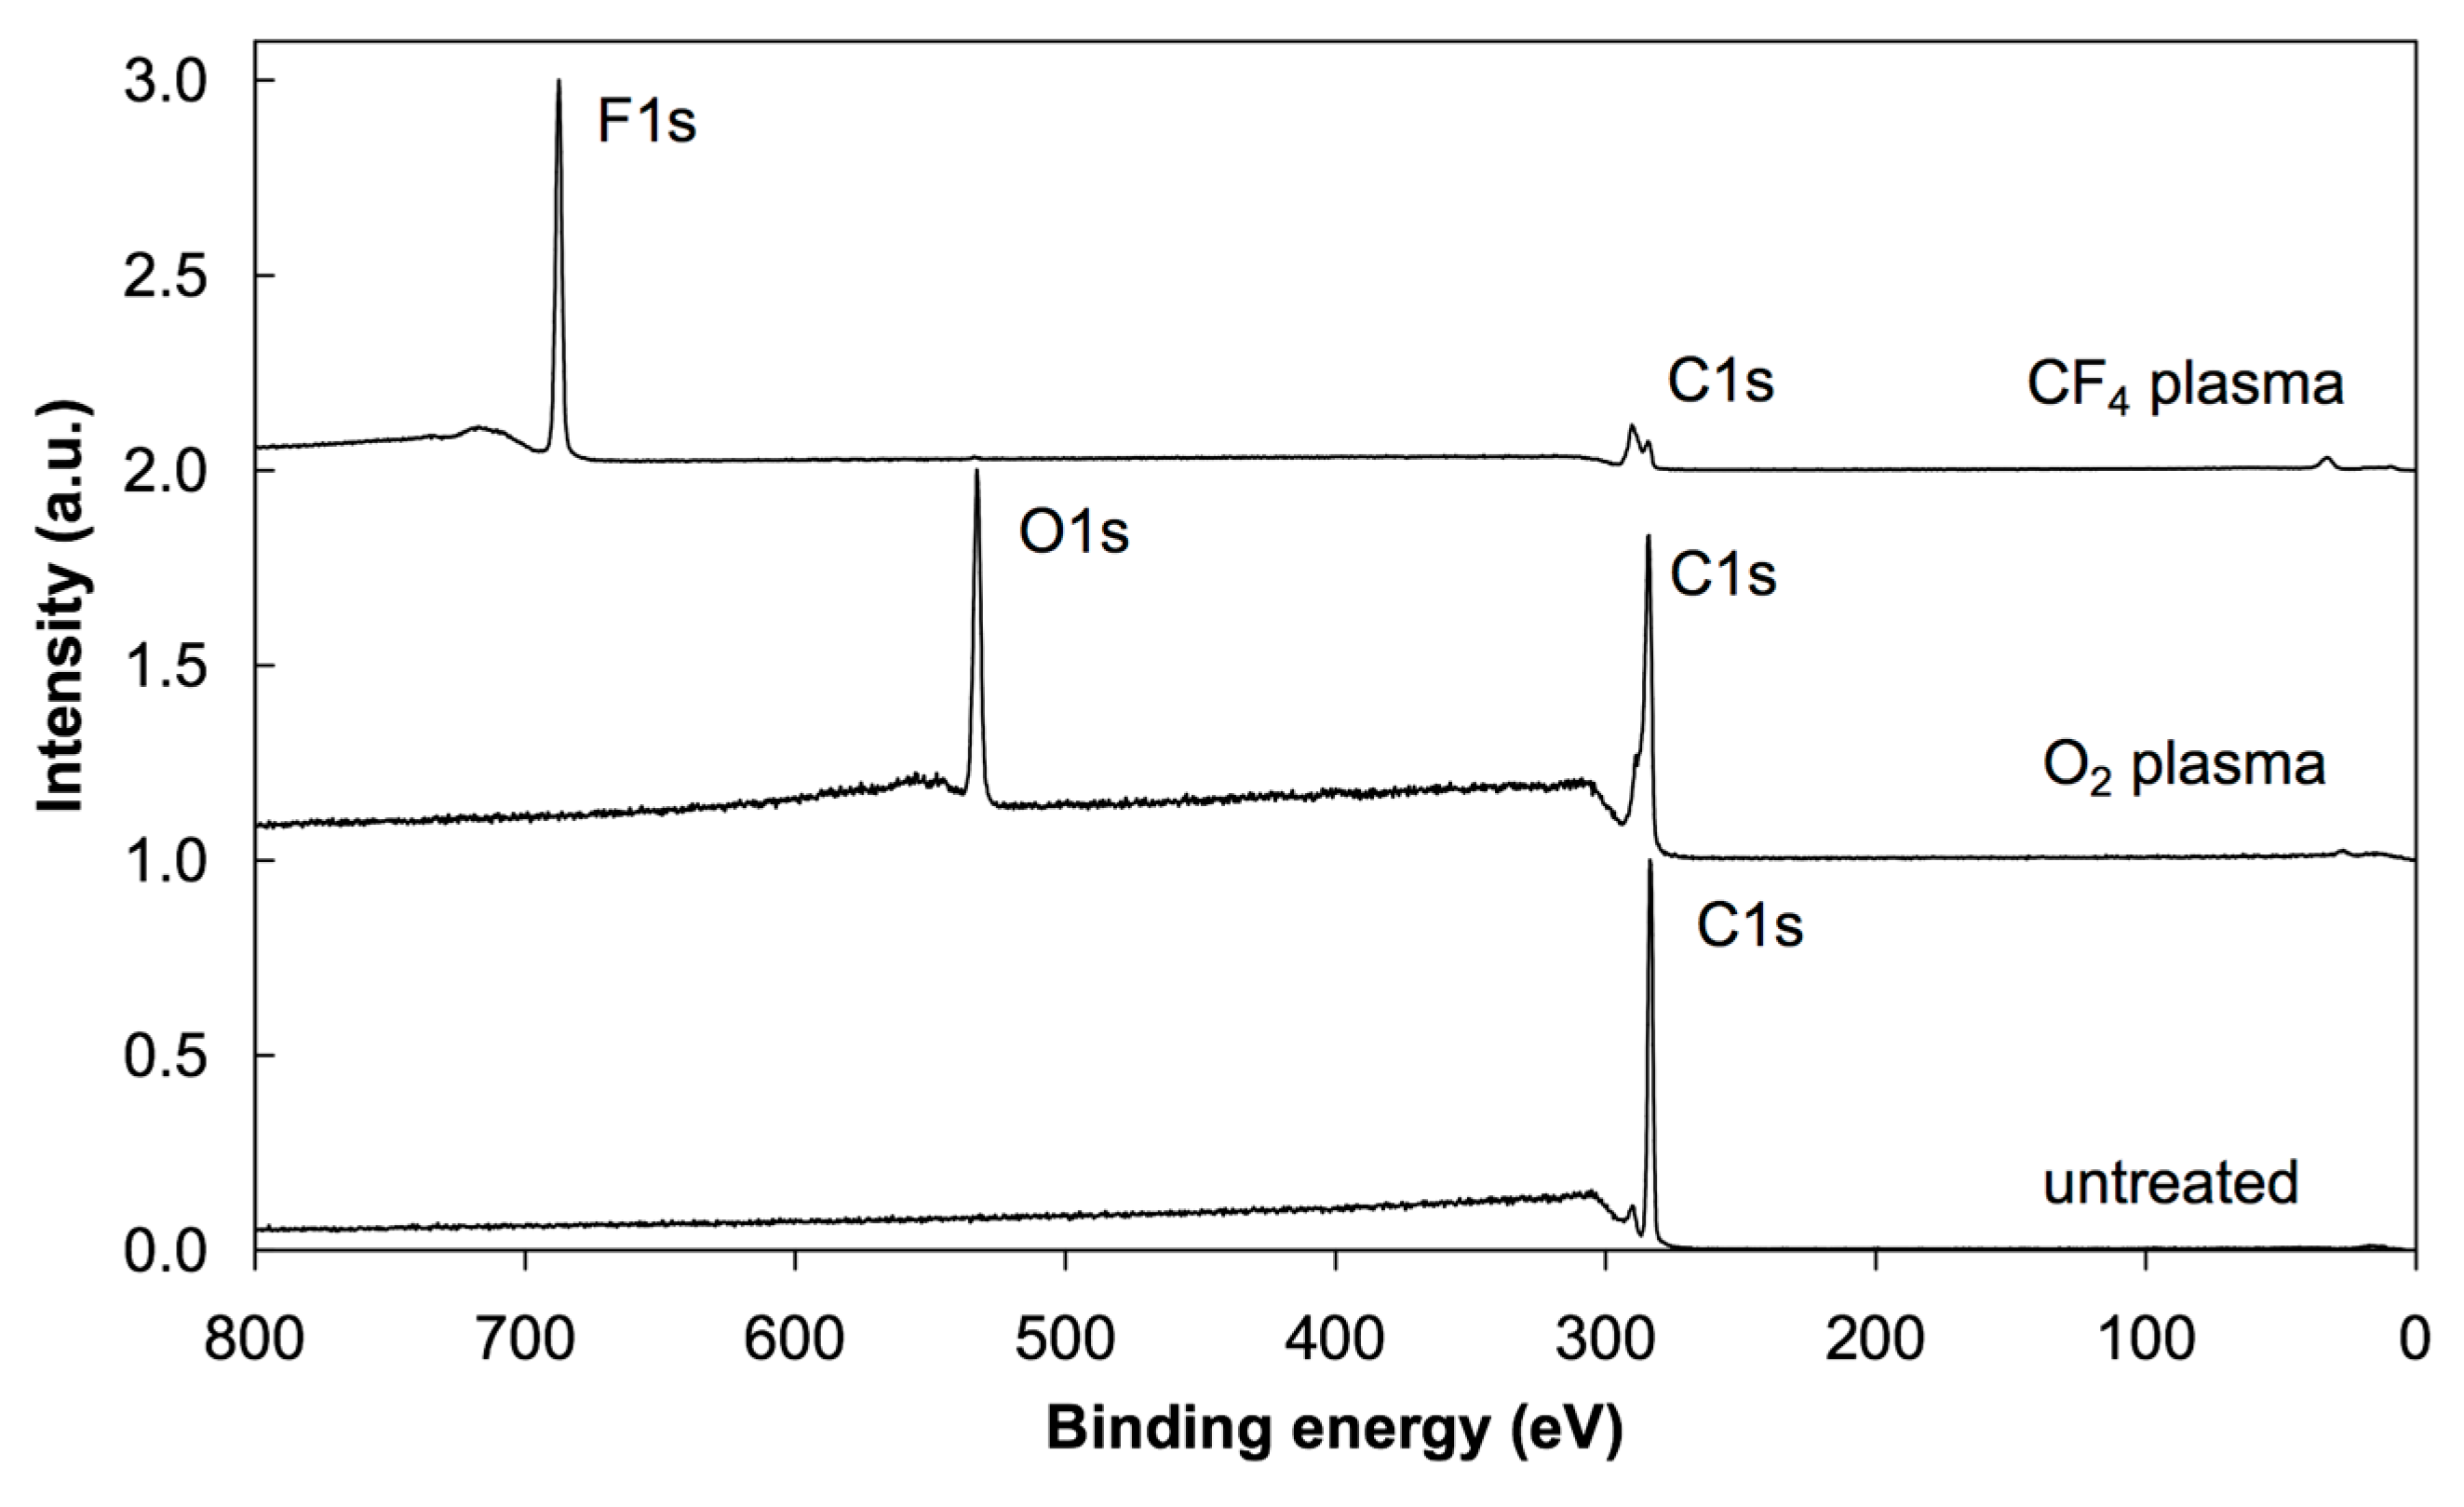
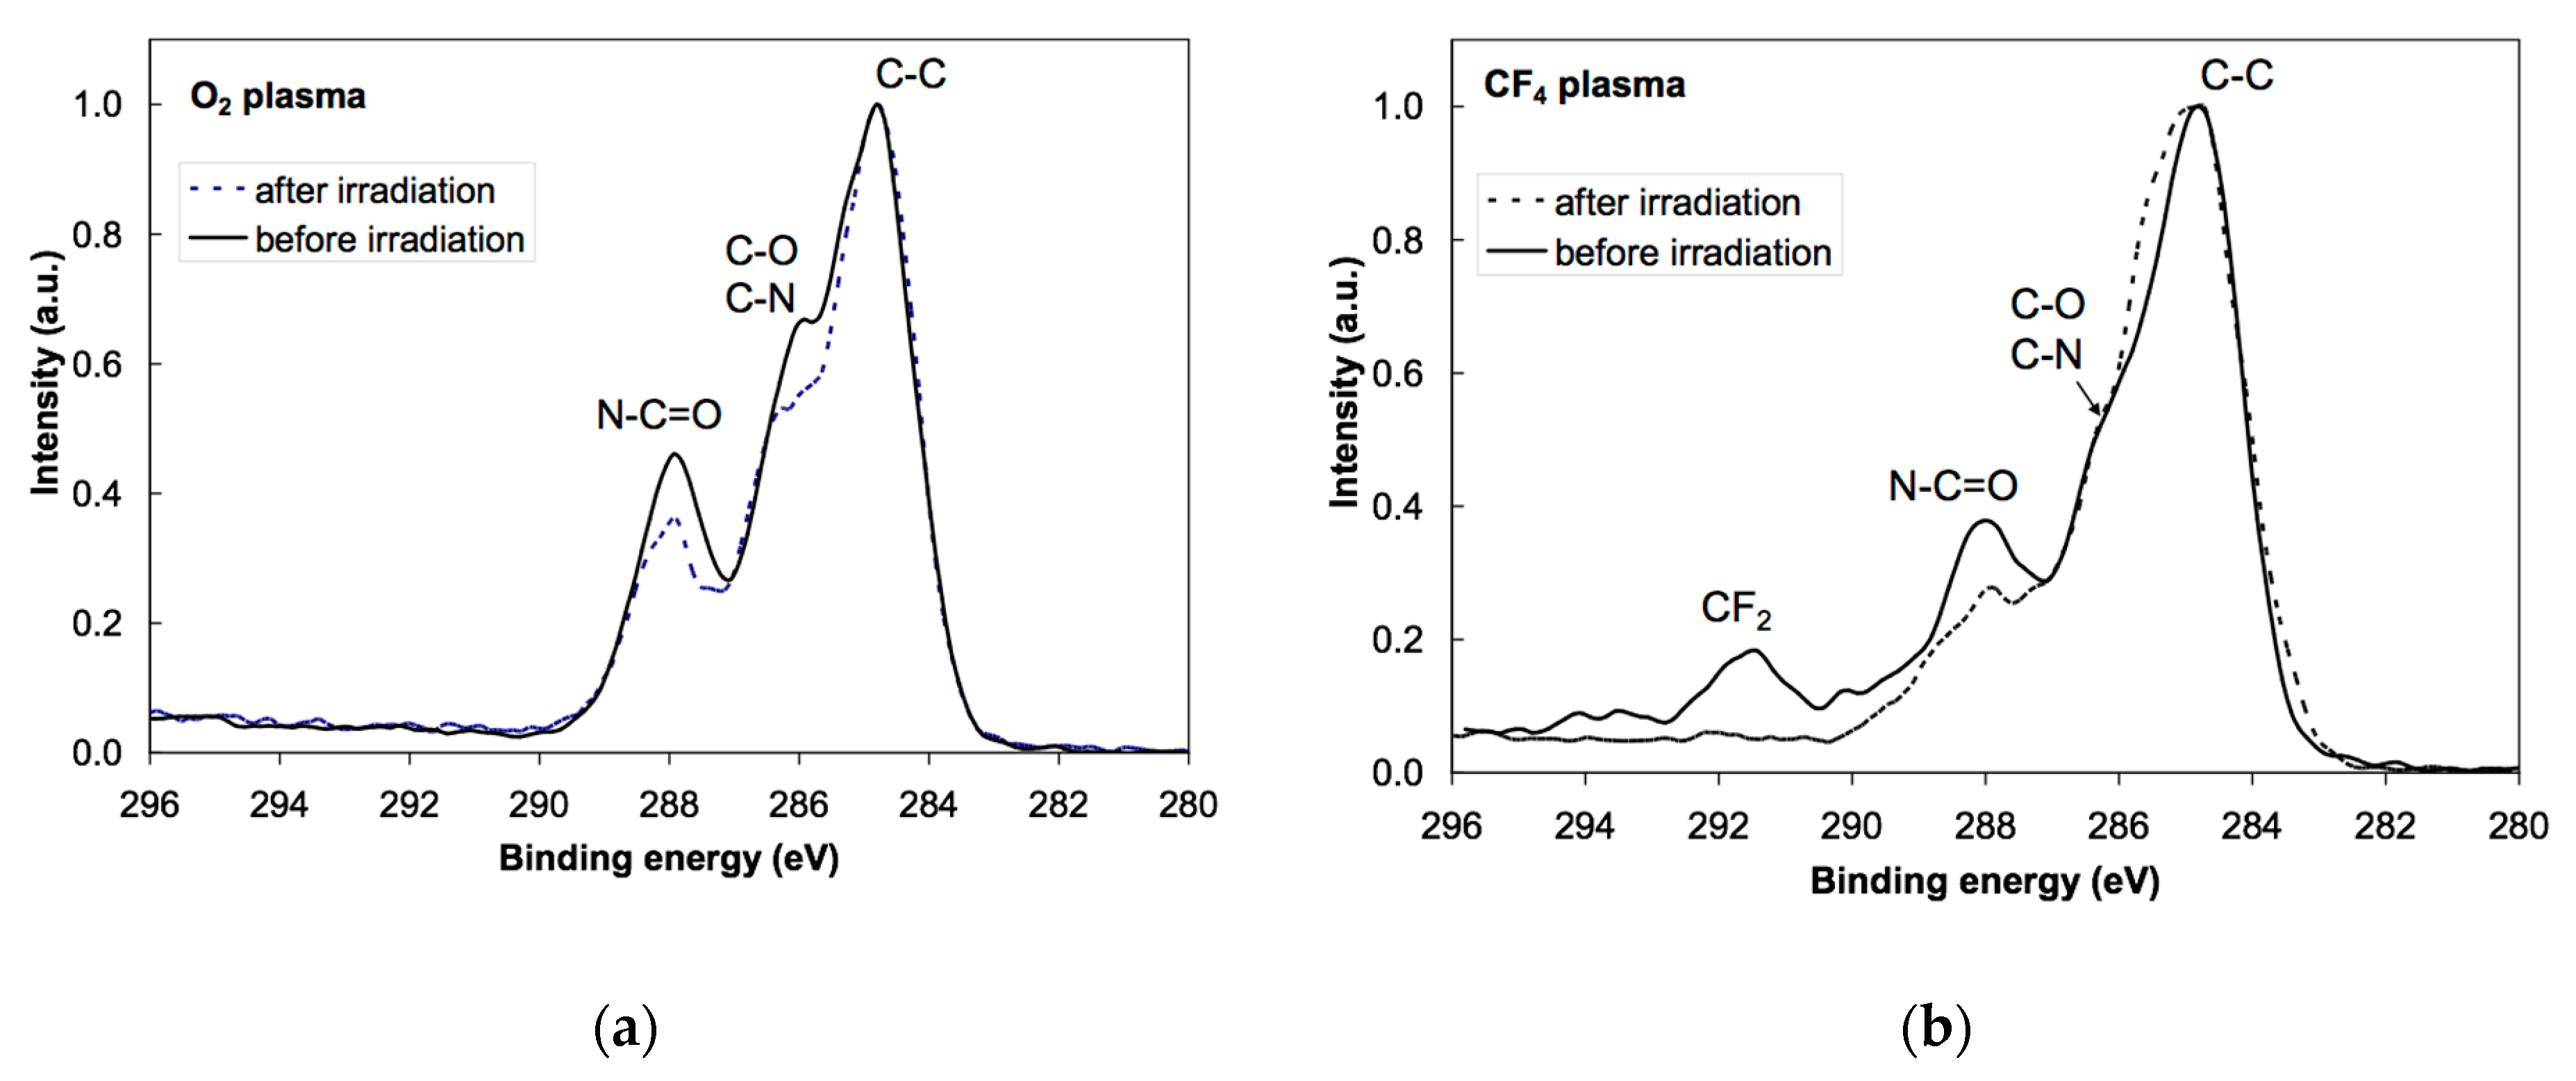
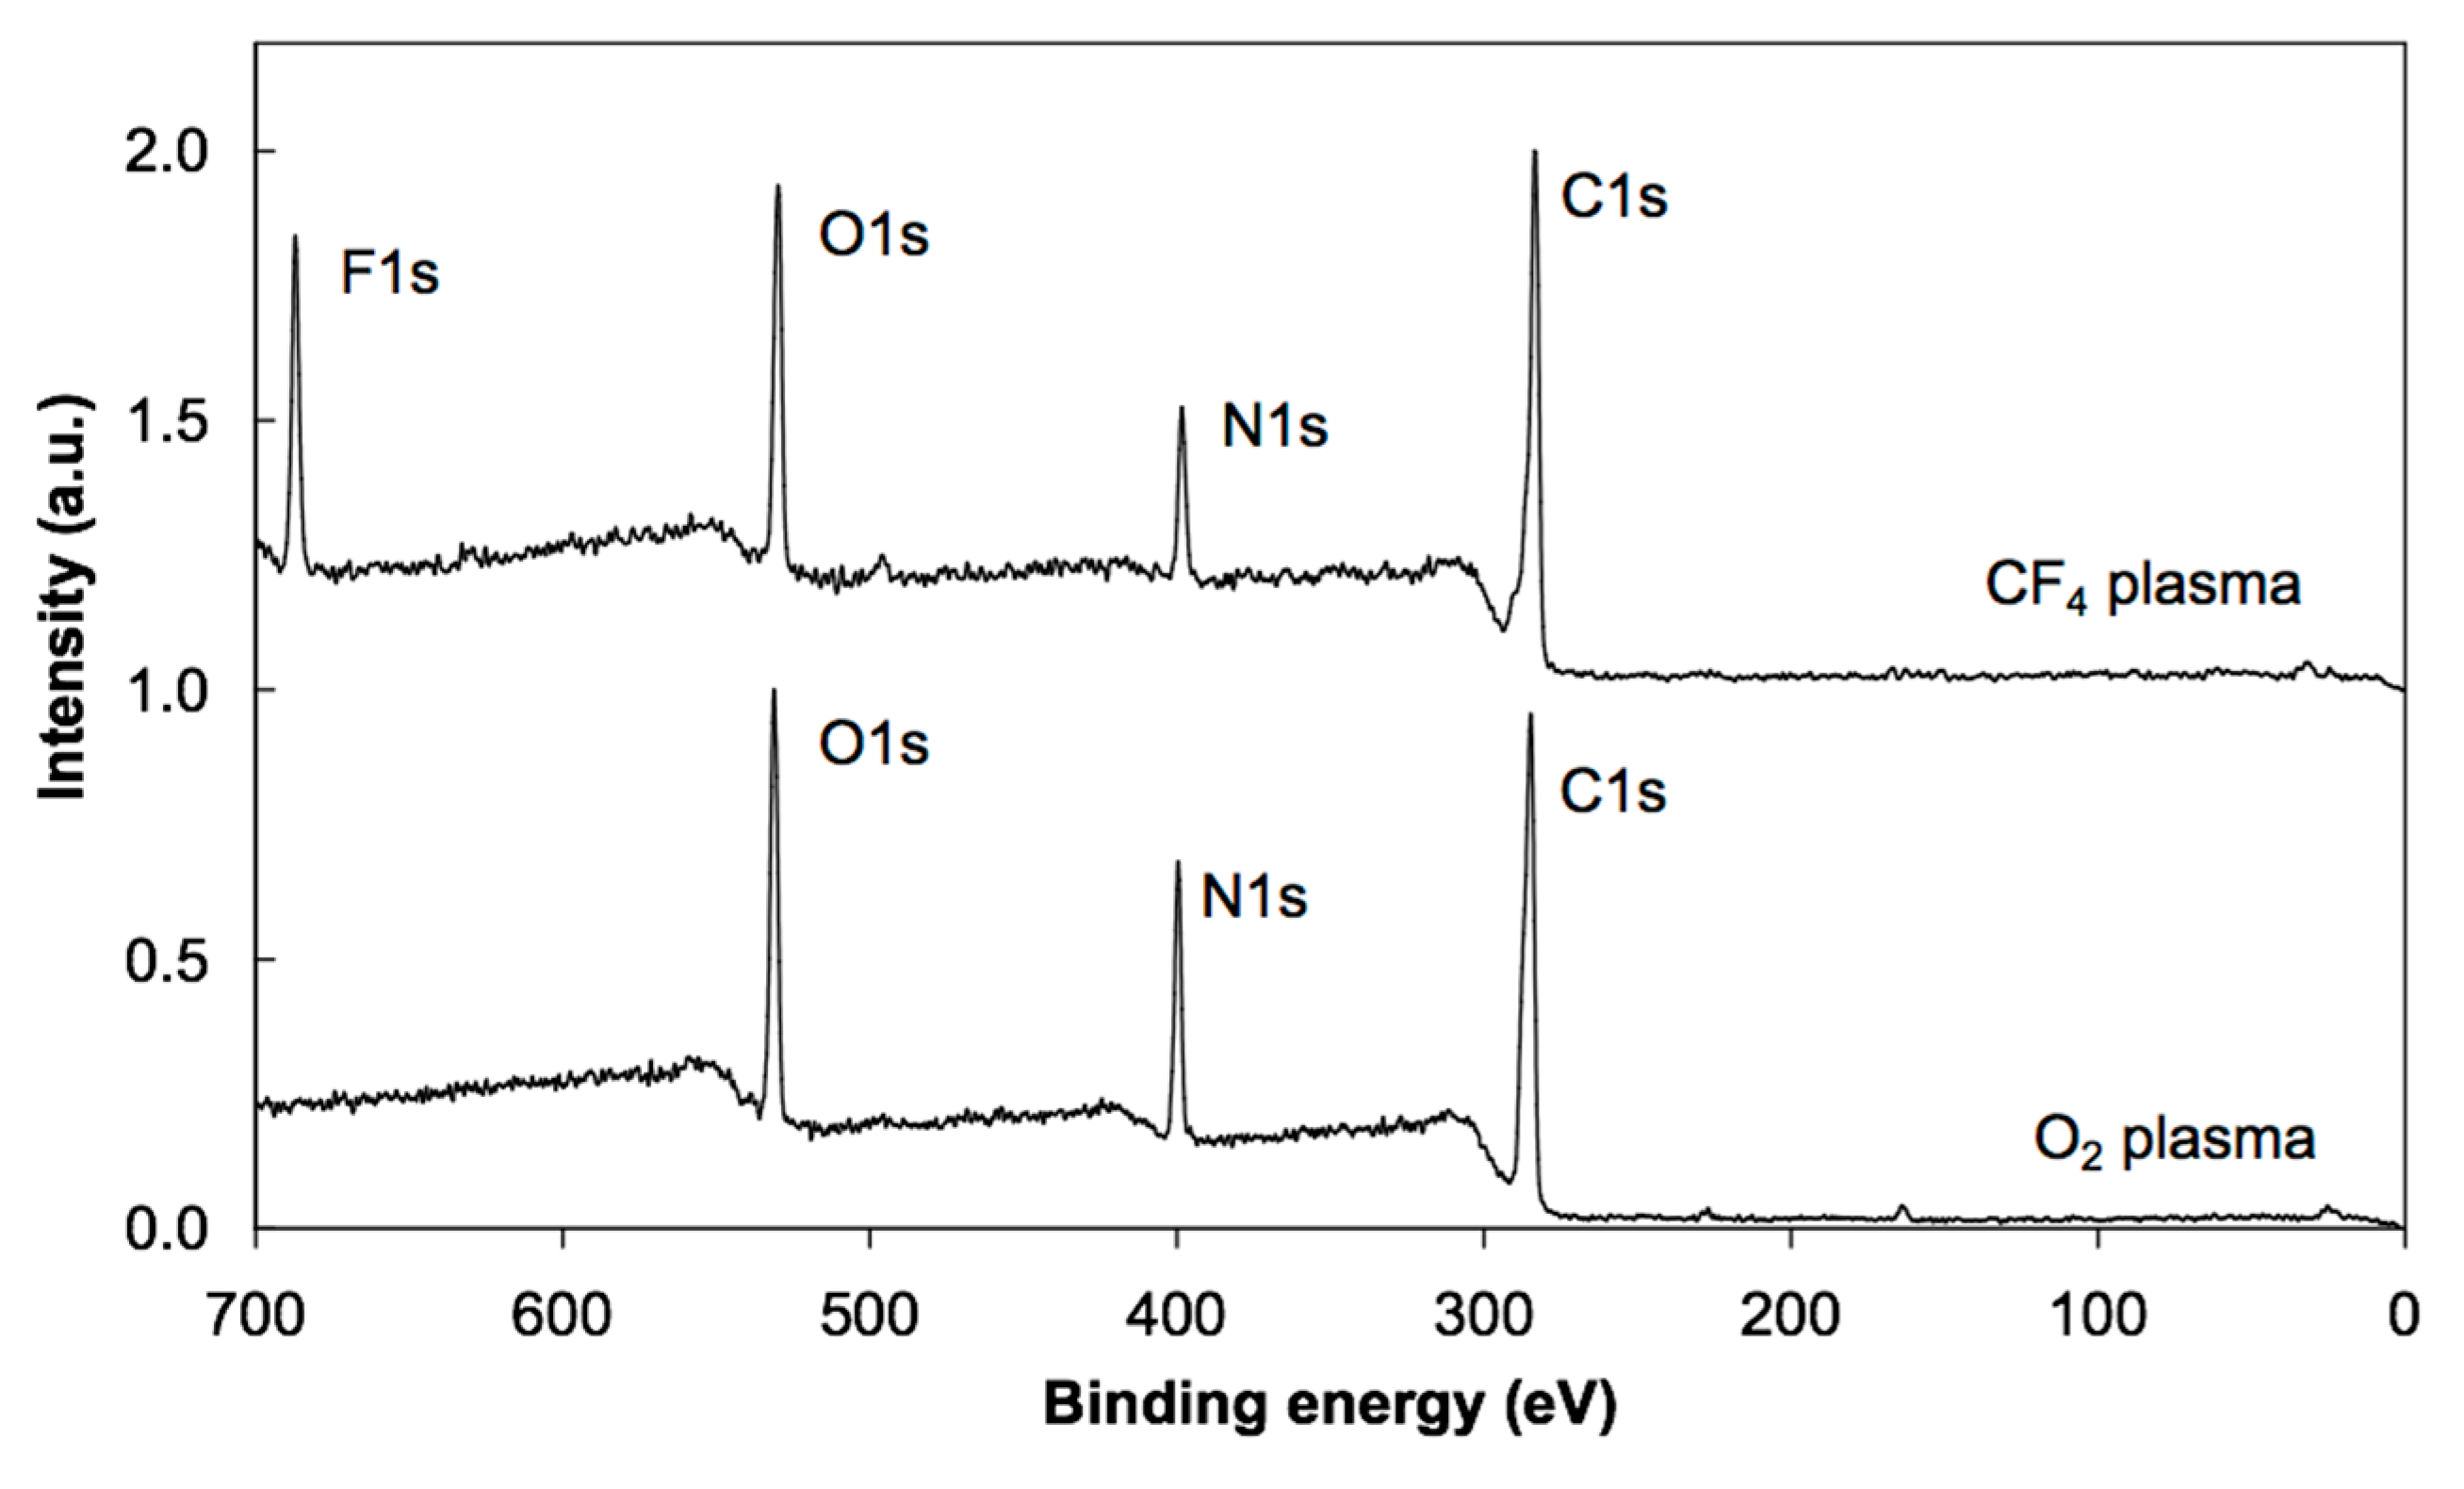
3.2. XPS Results
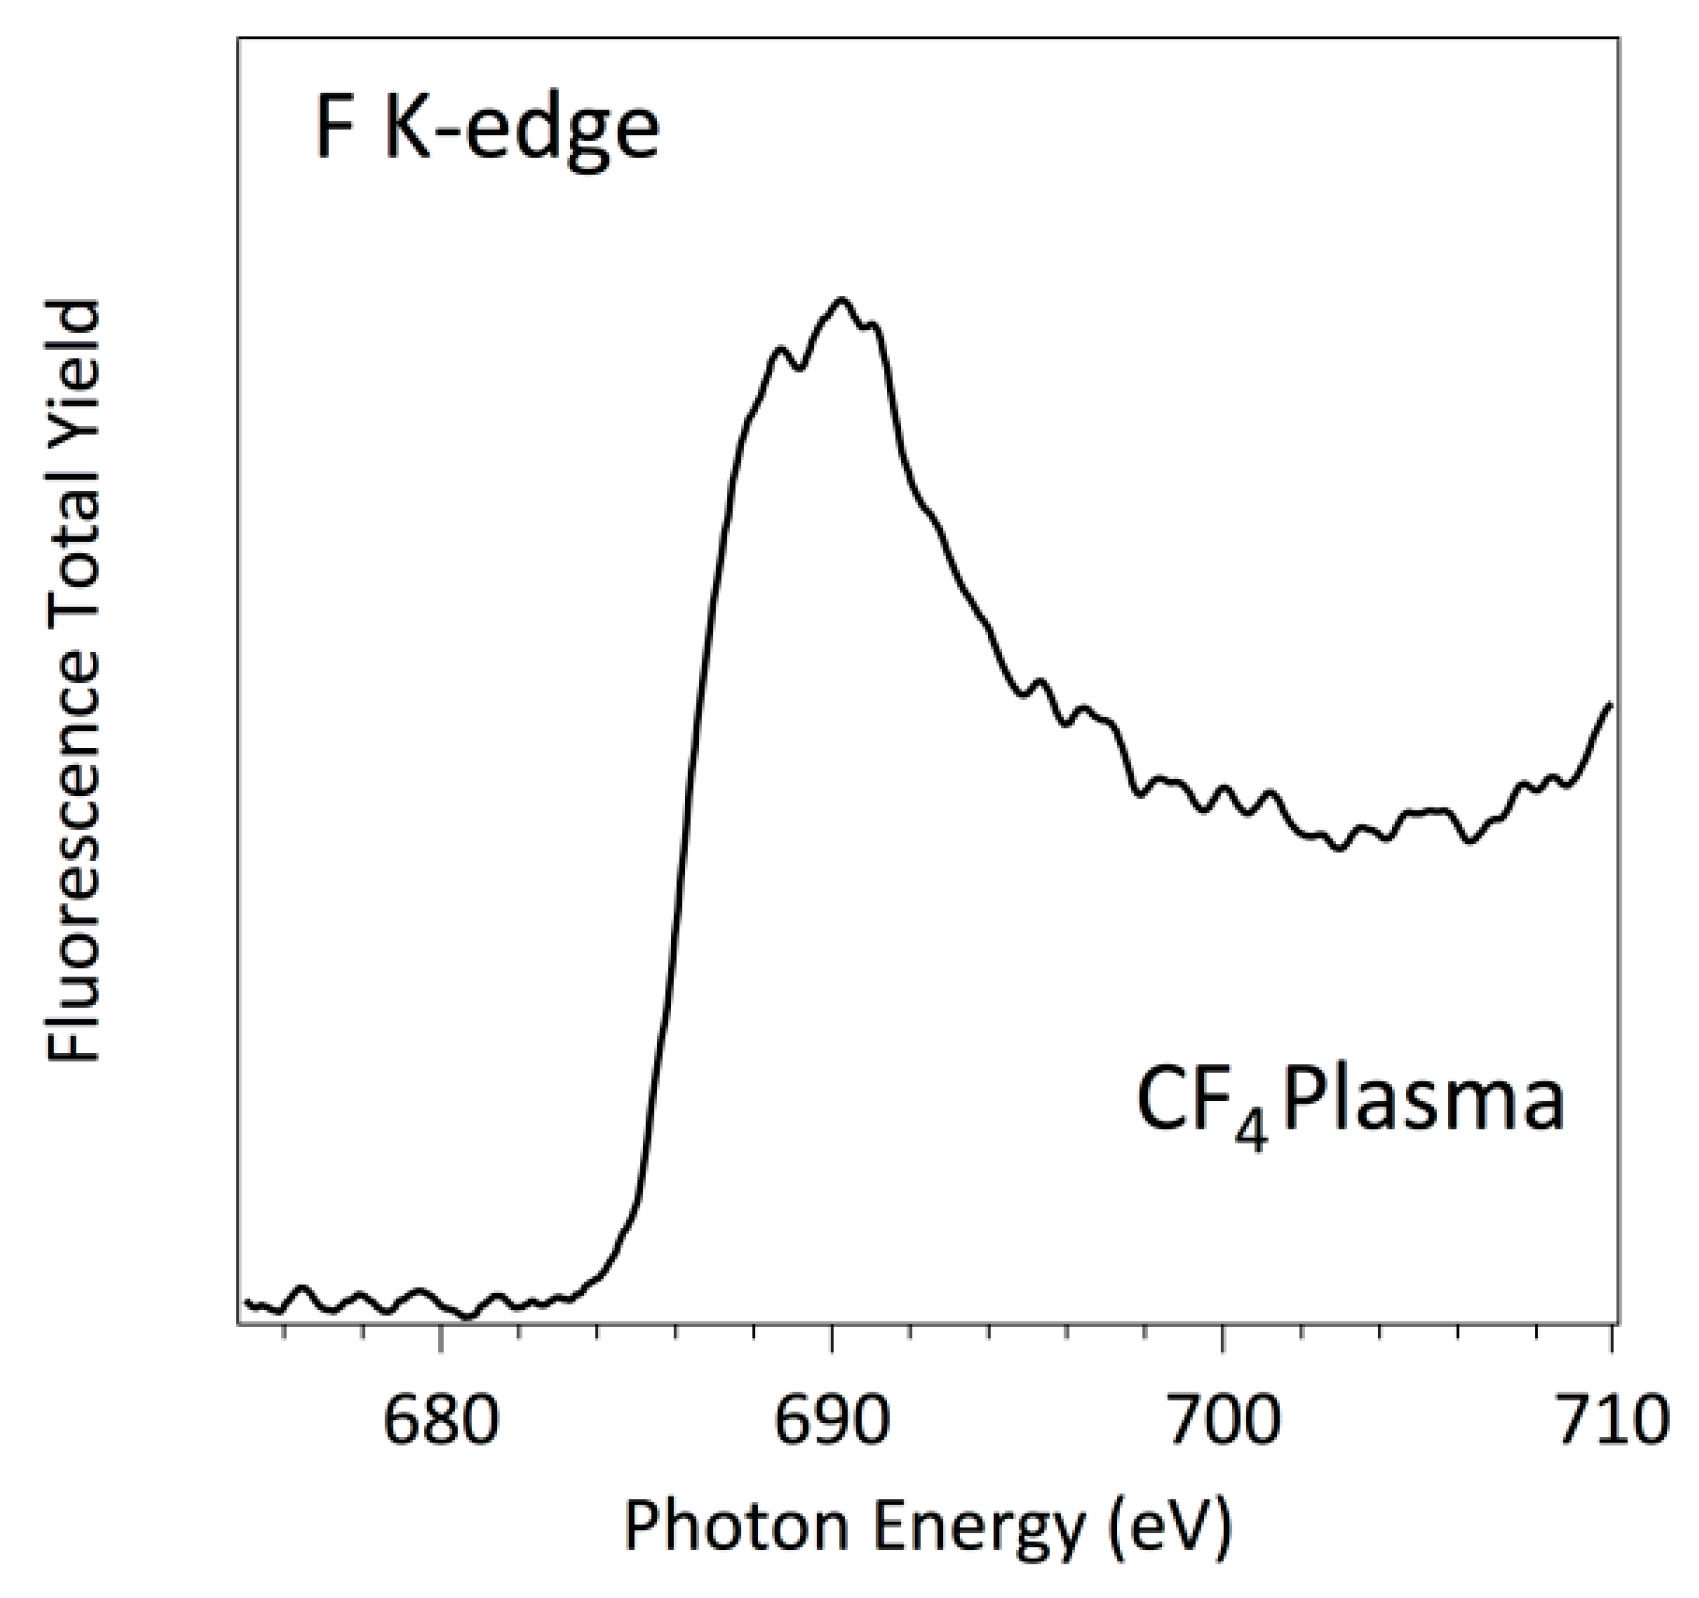
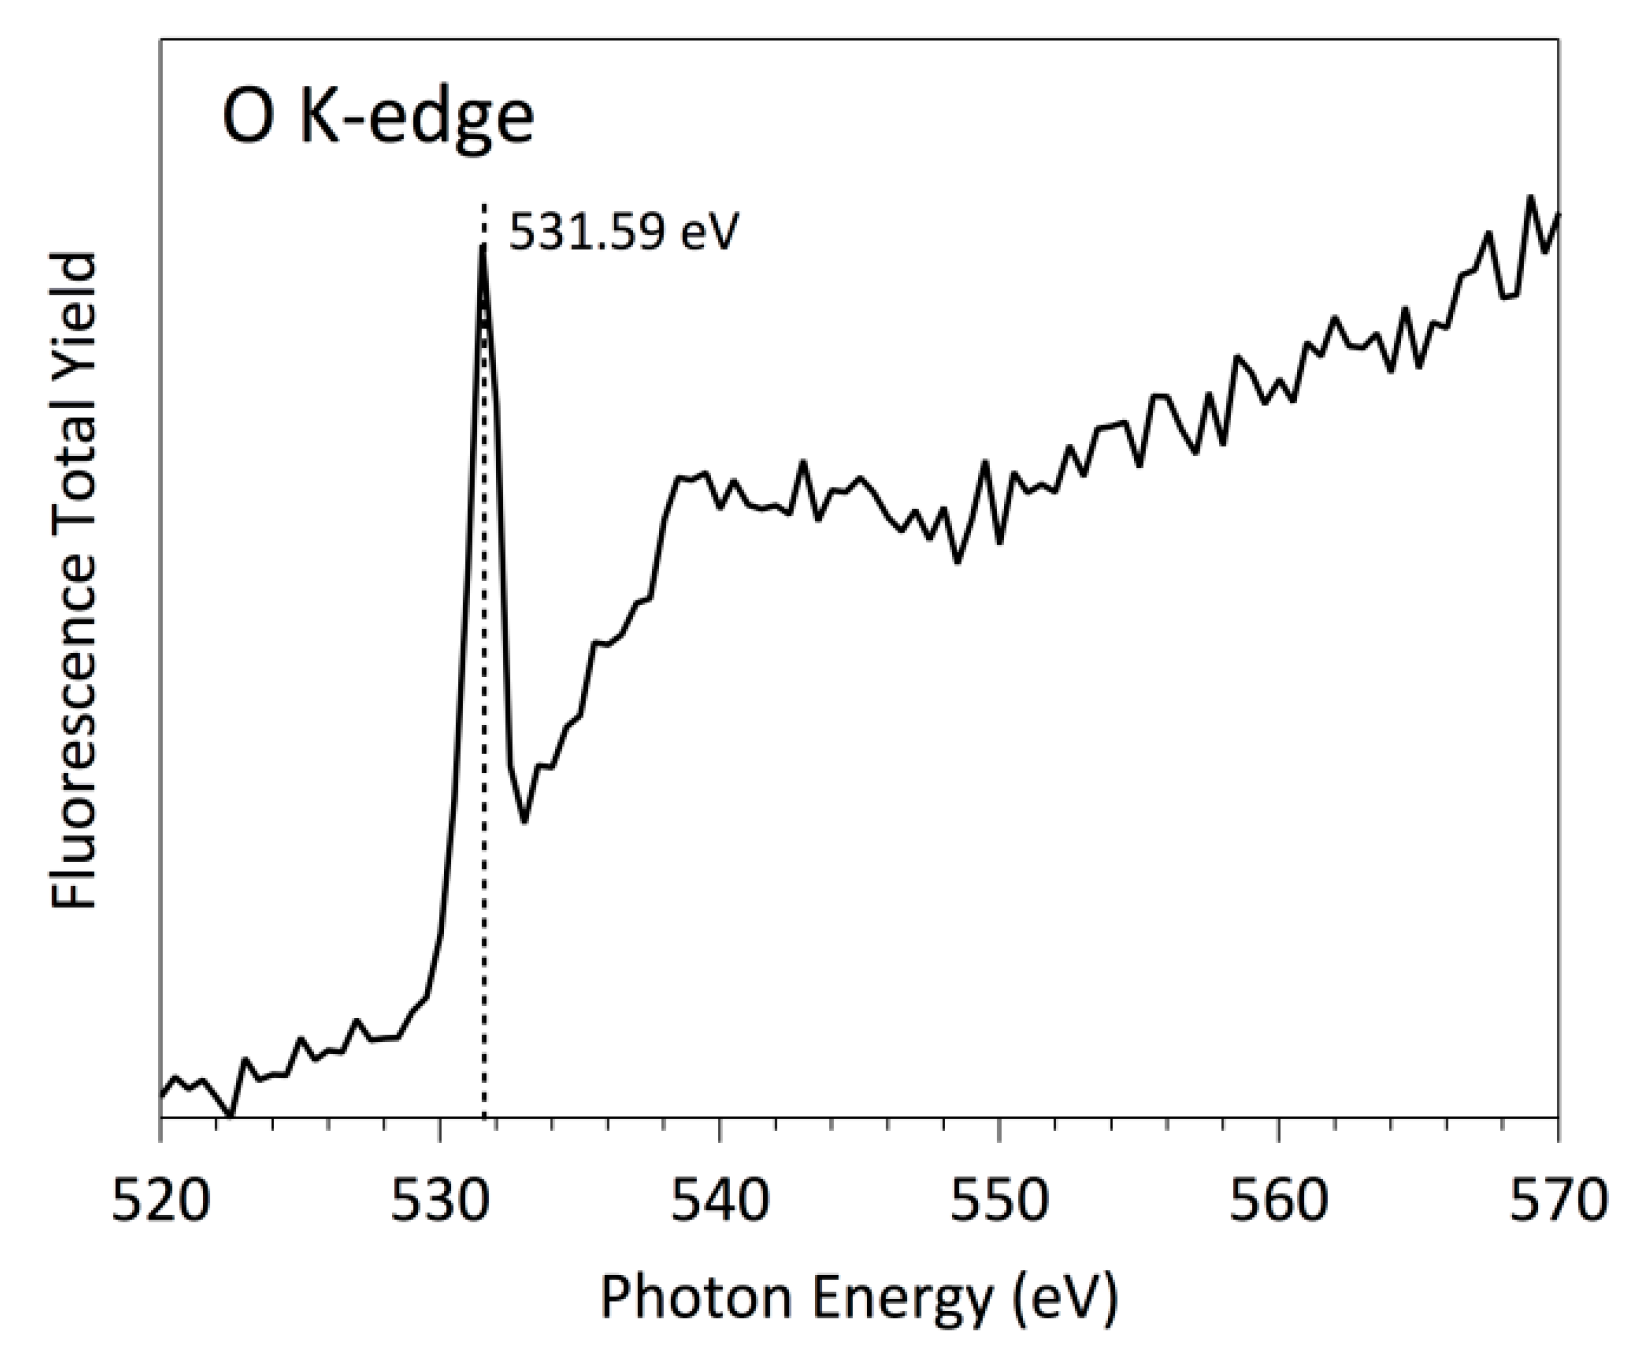
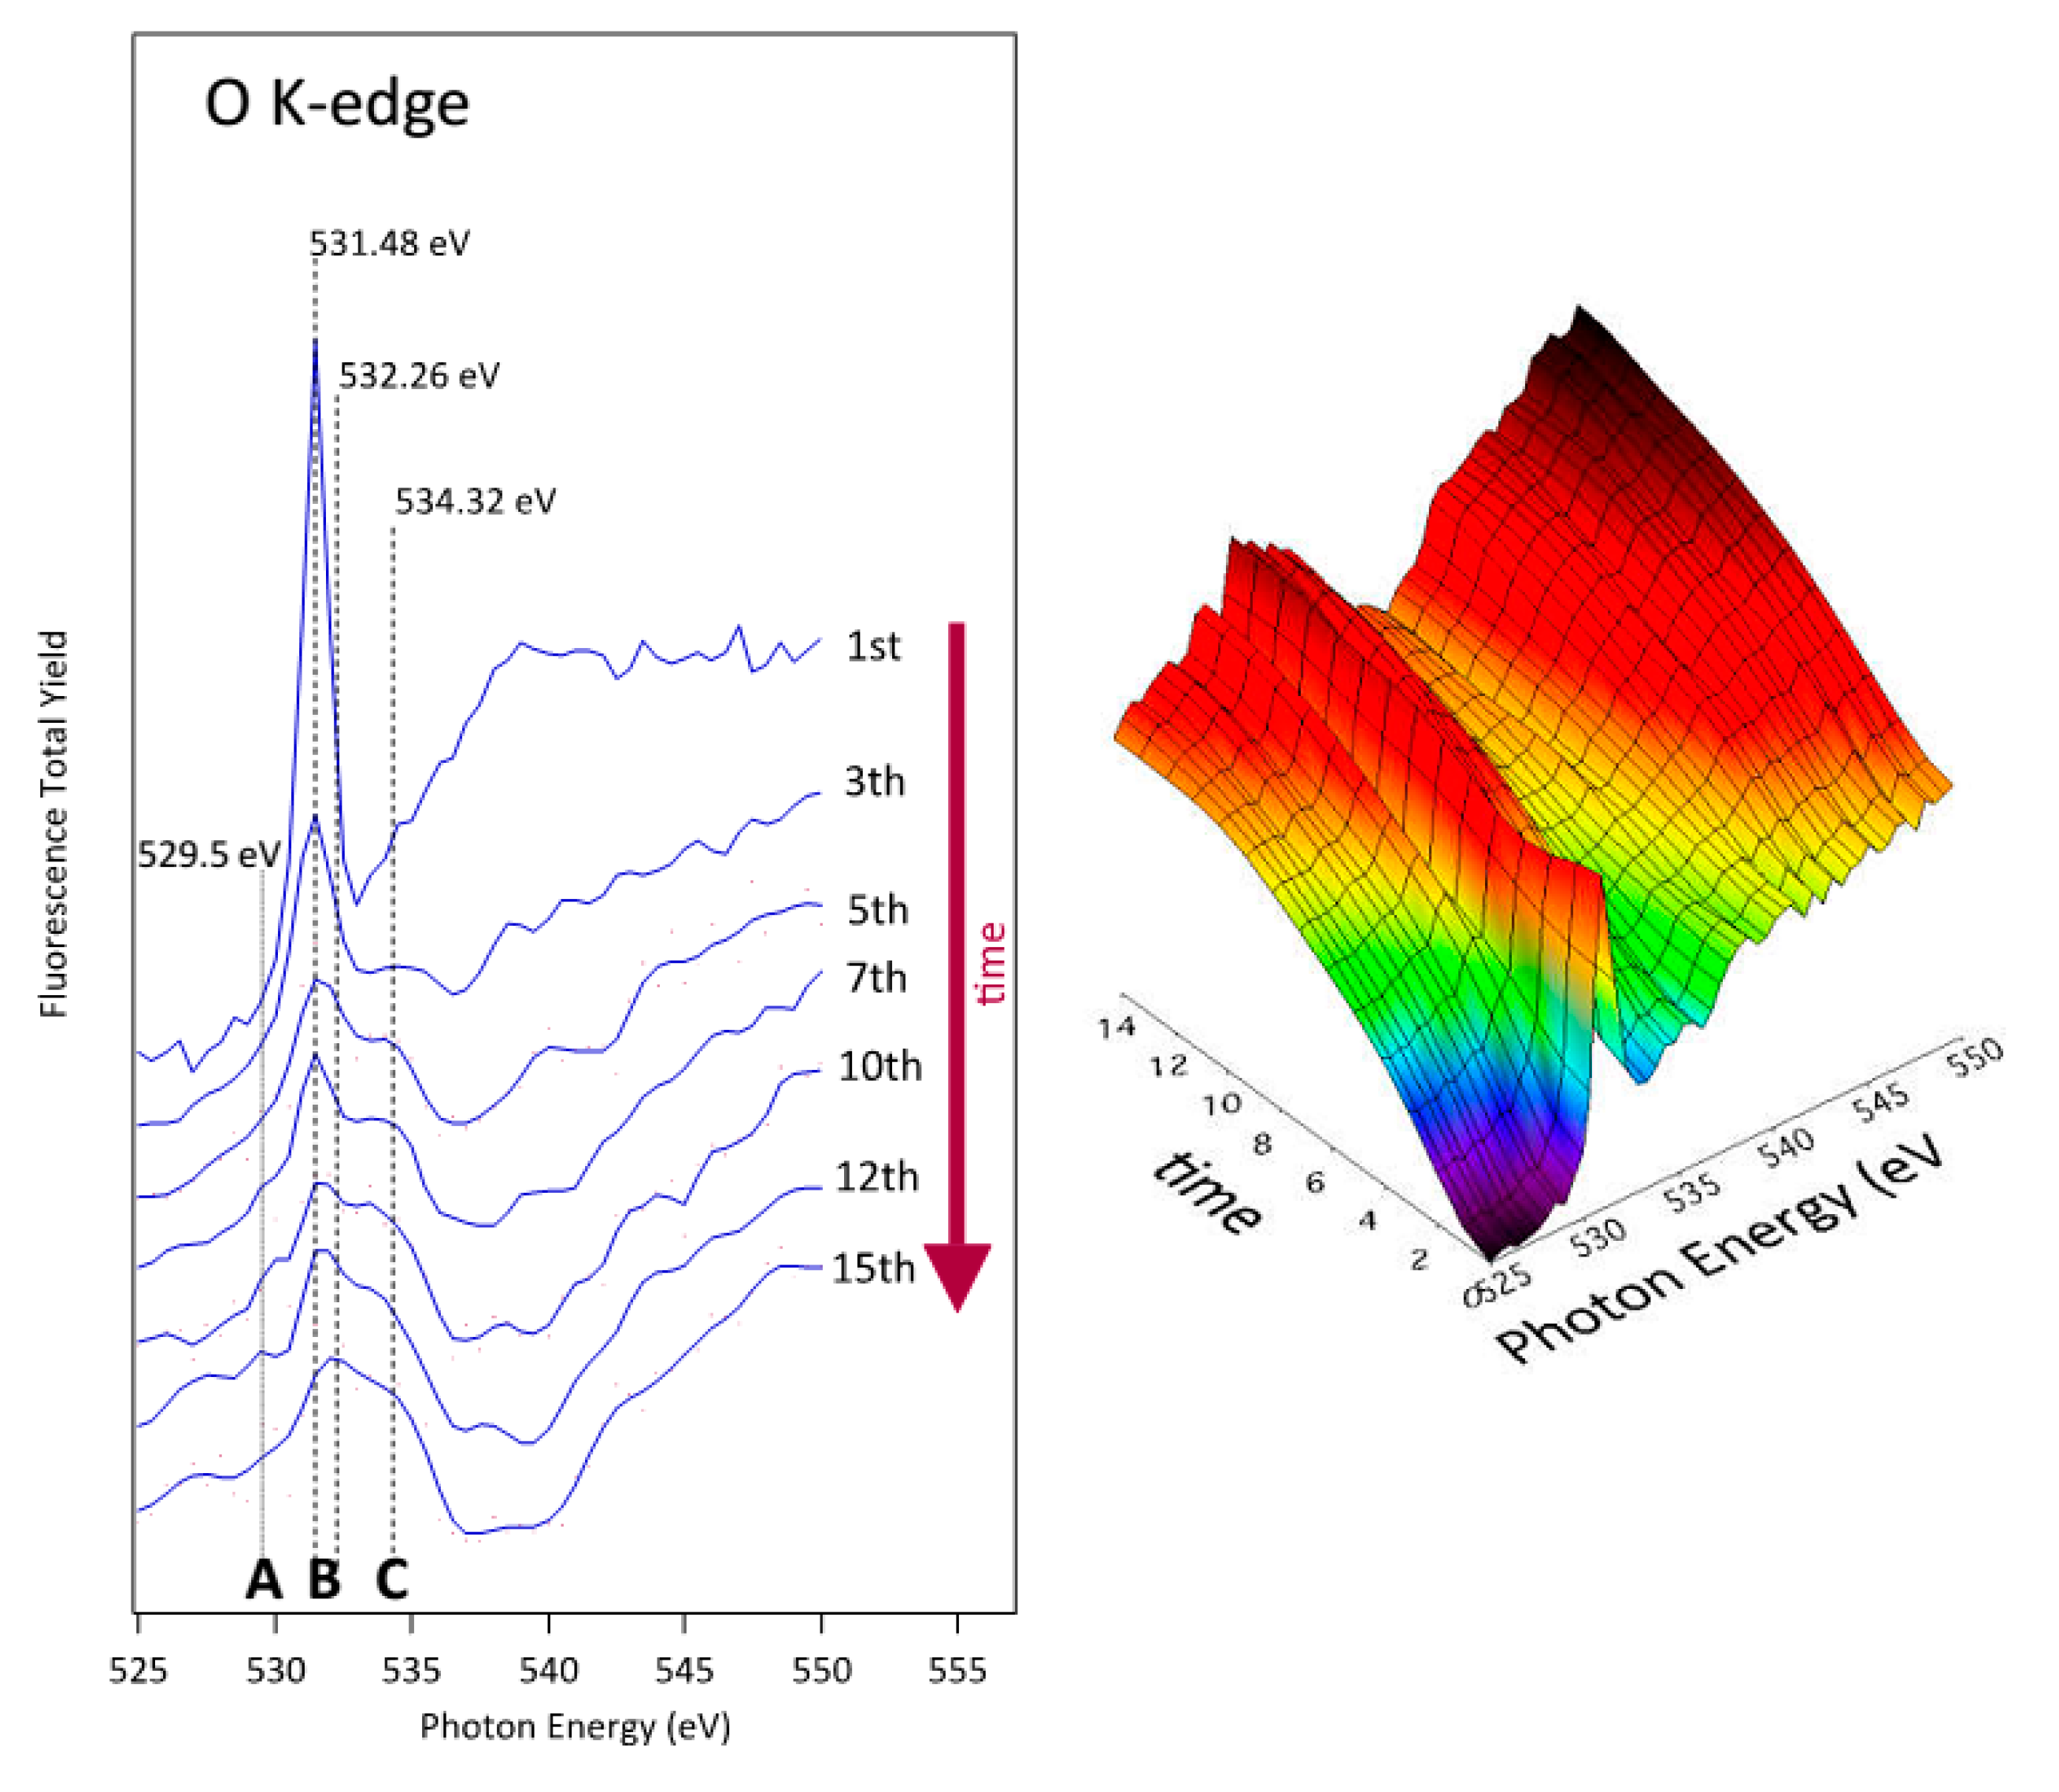
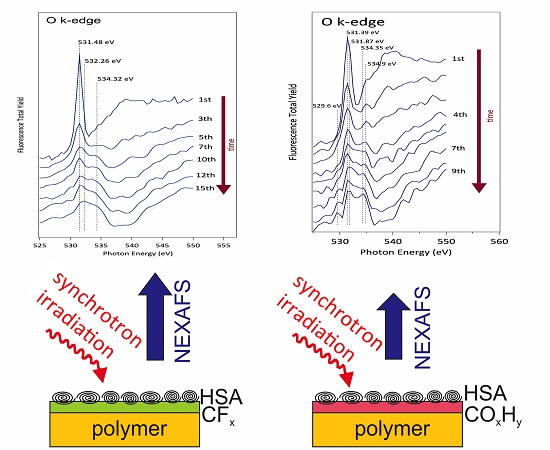
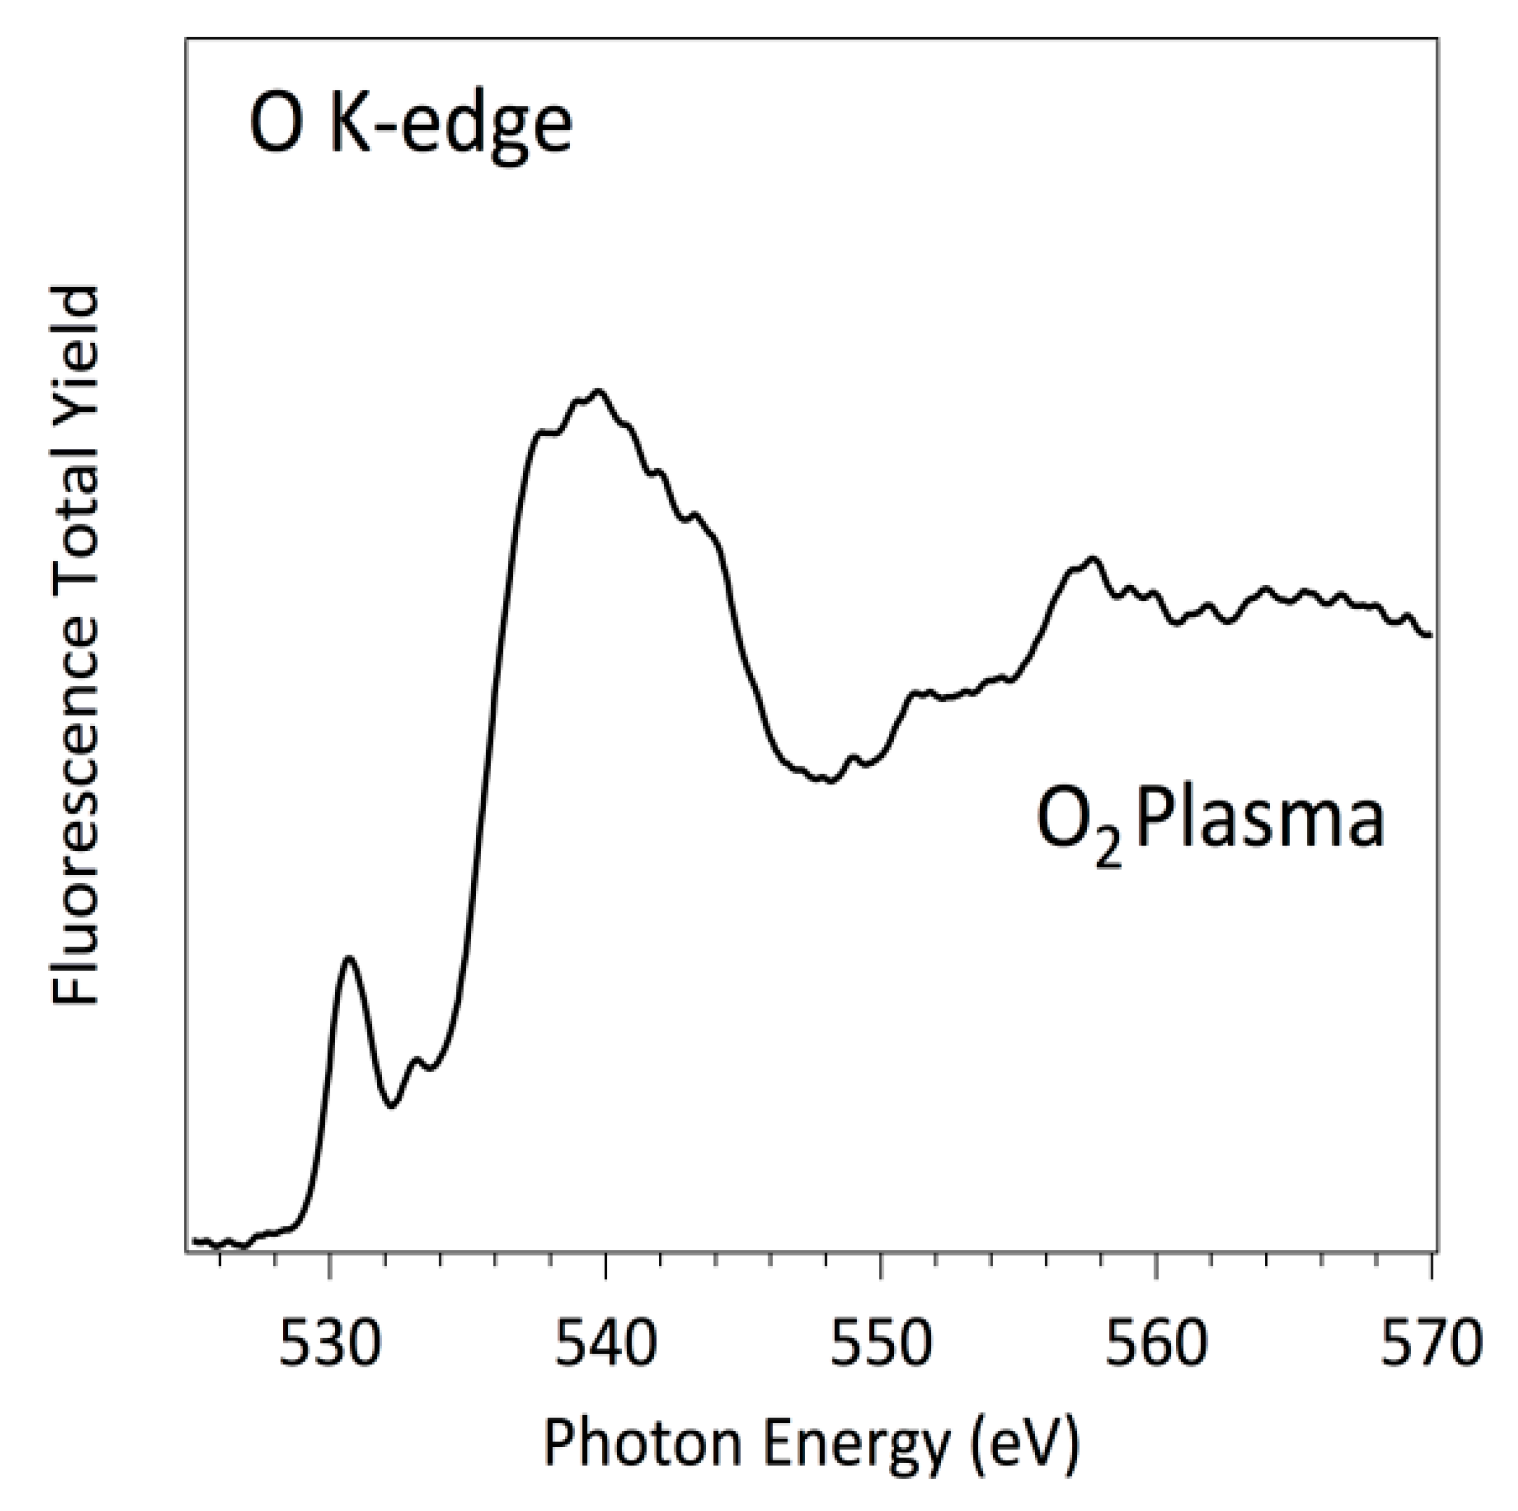
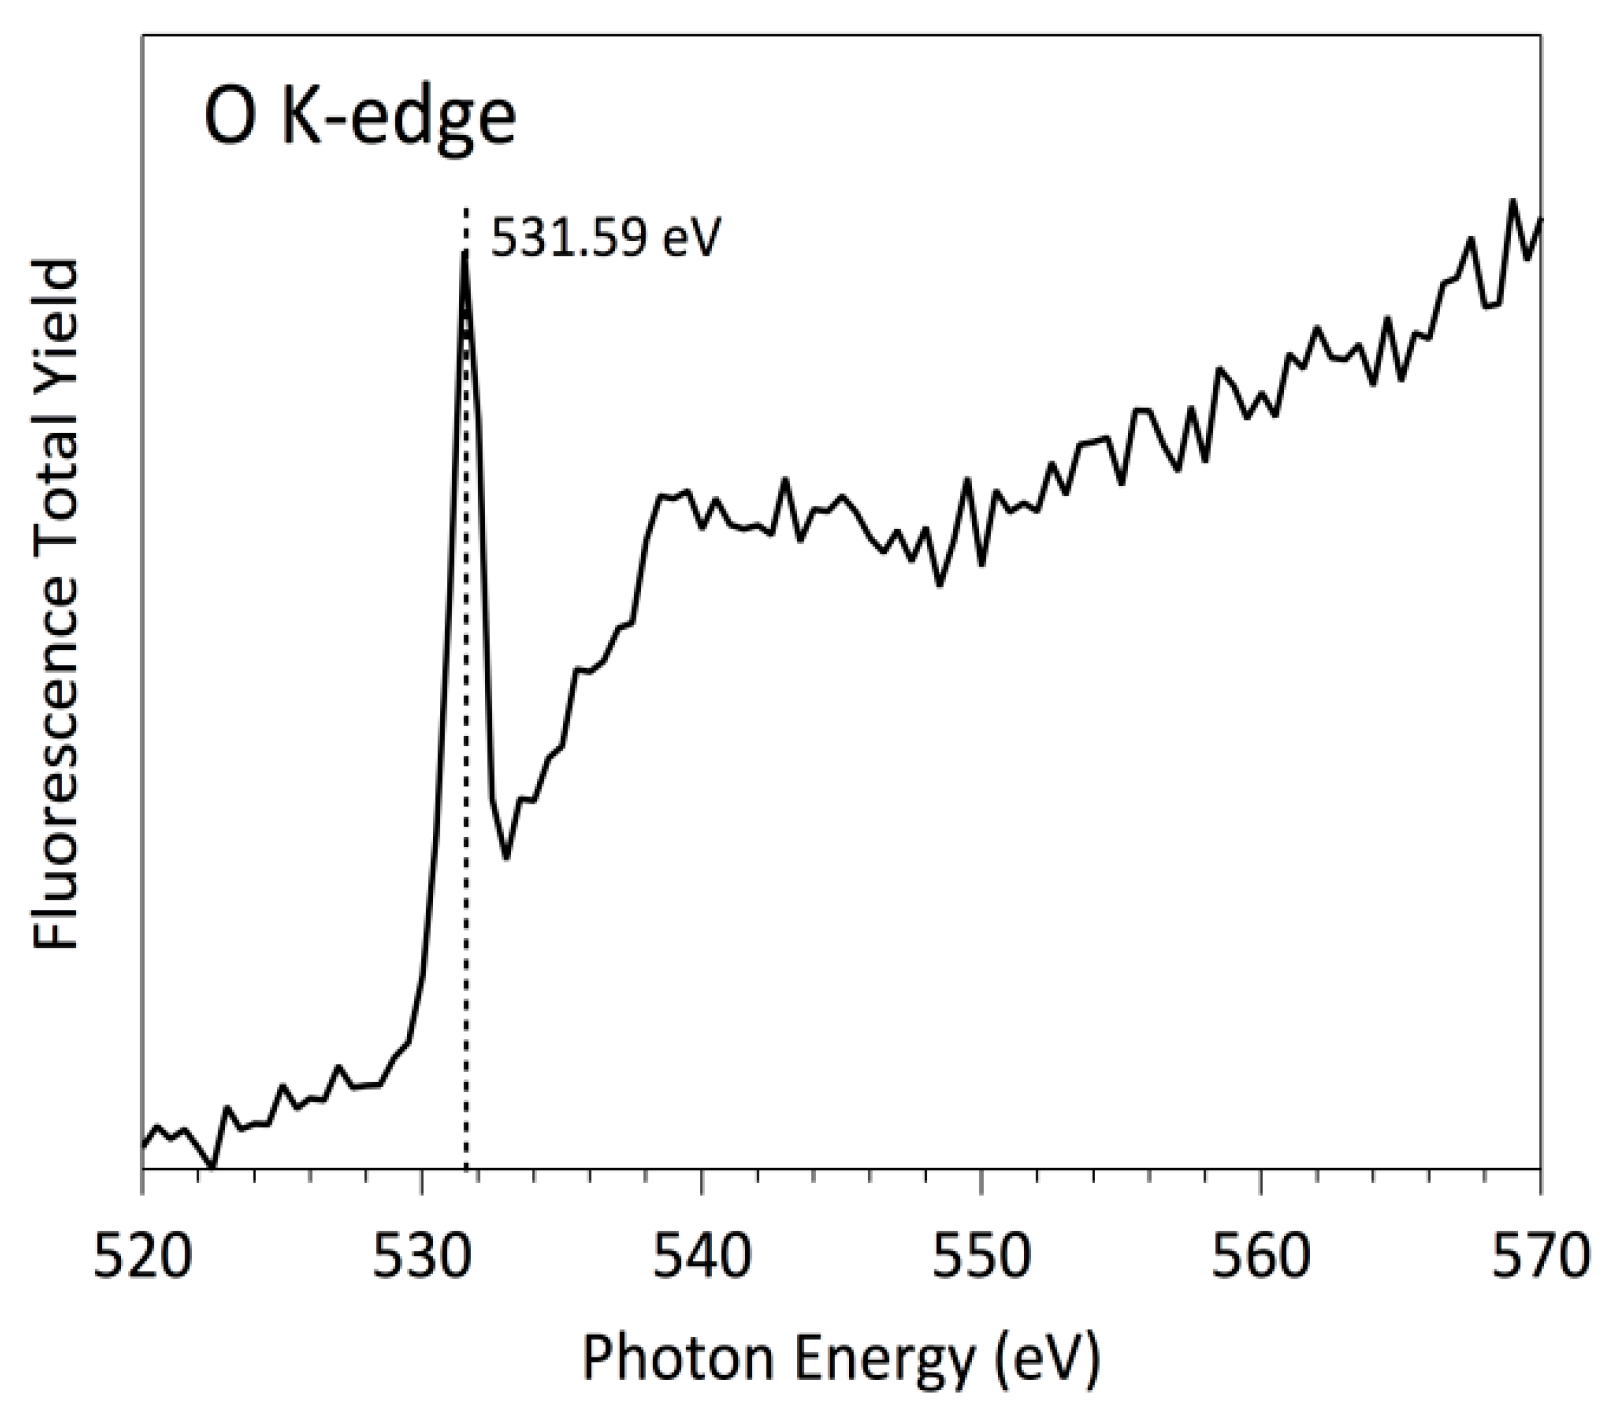
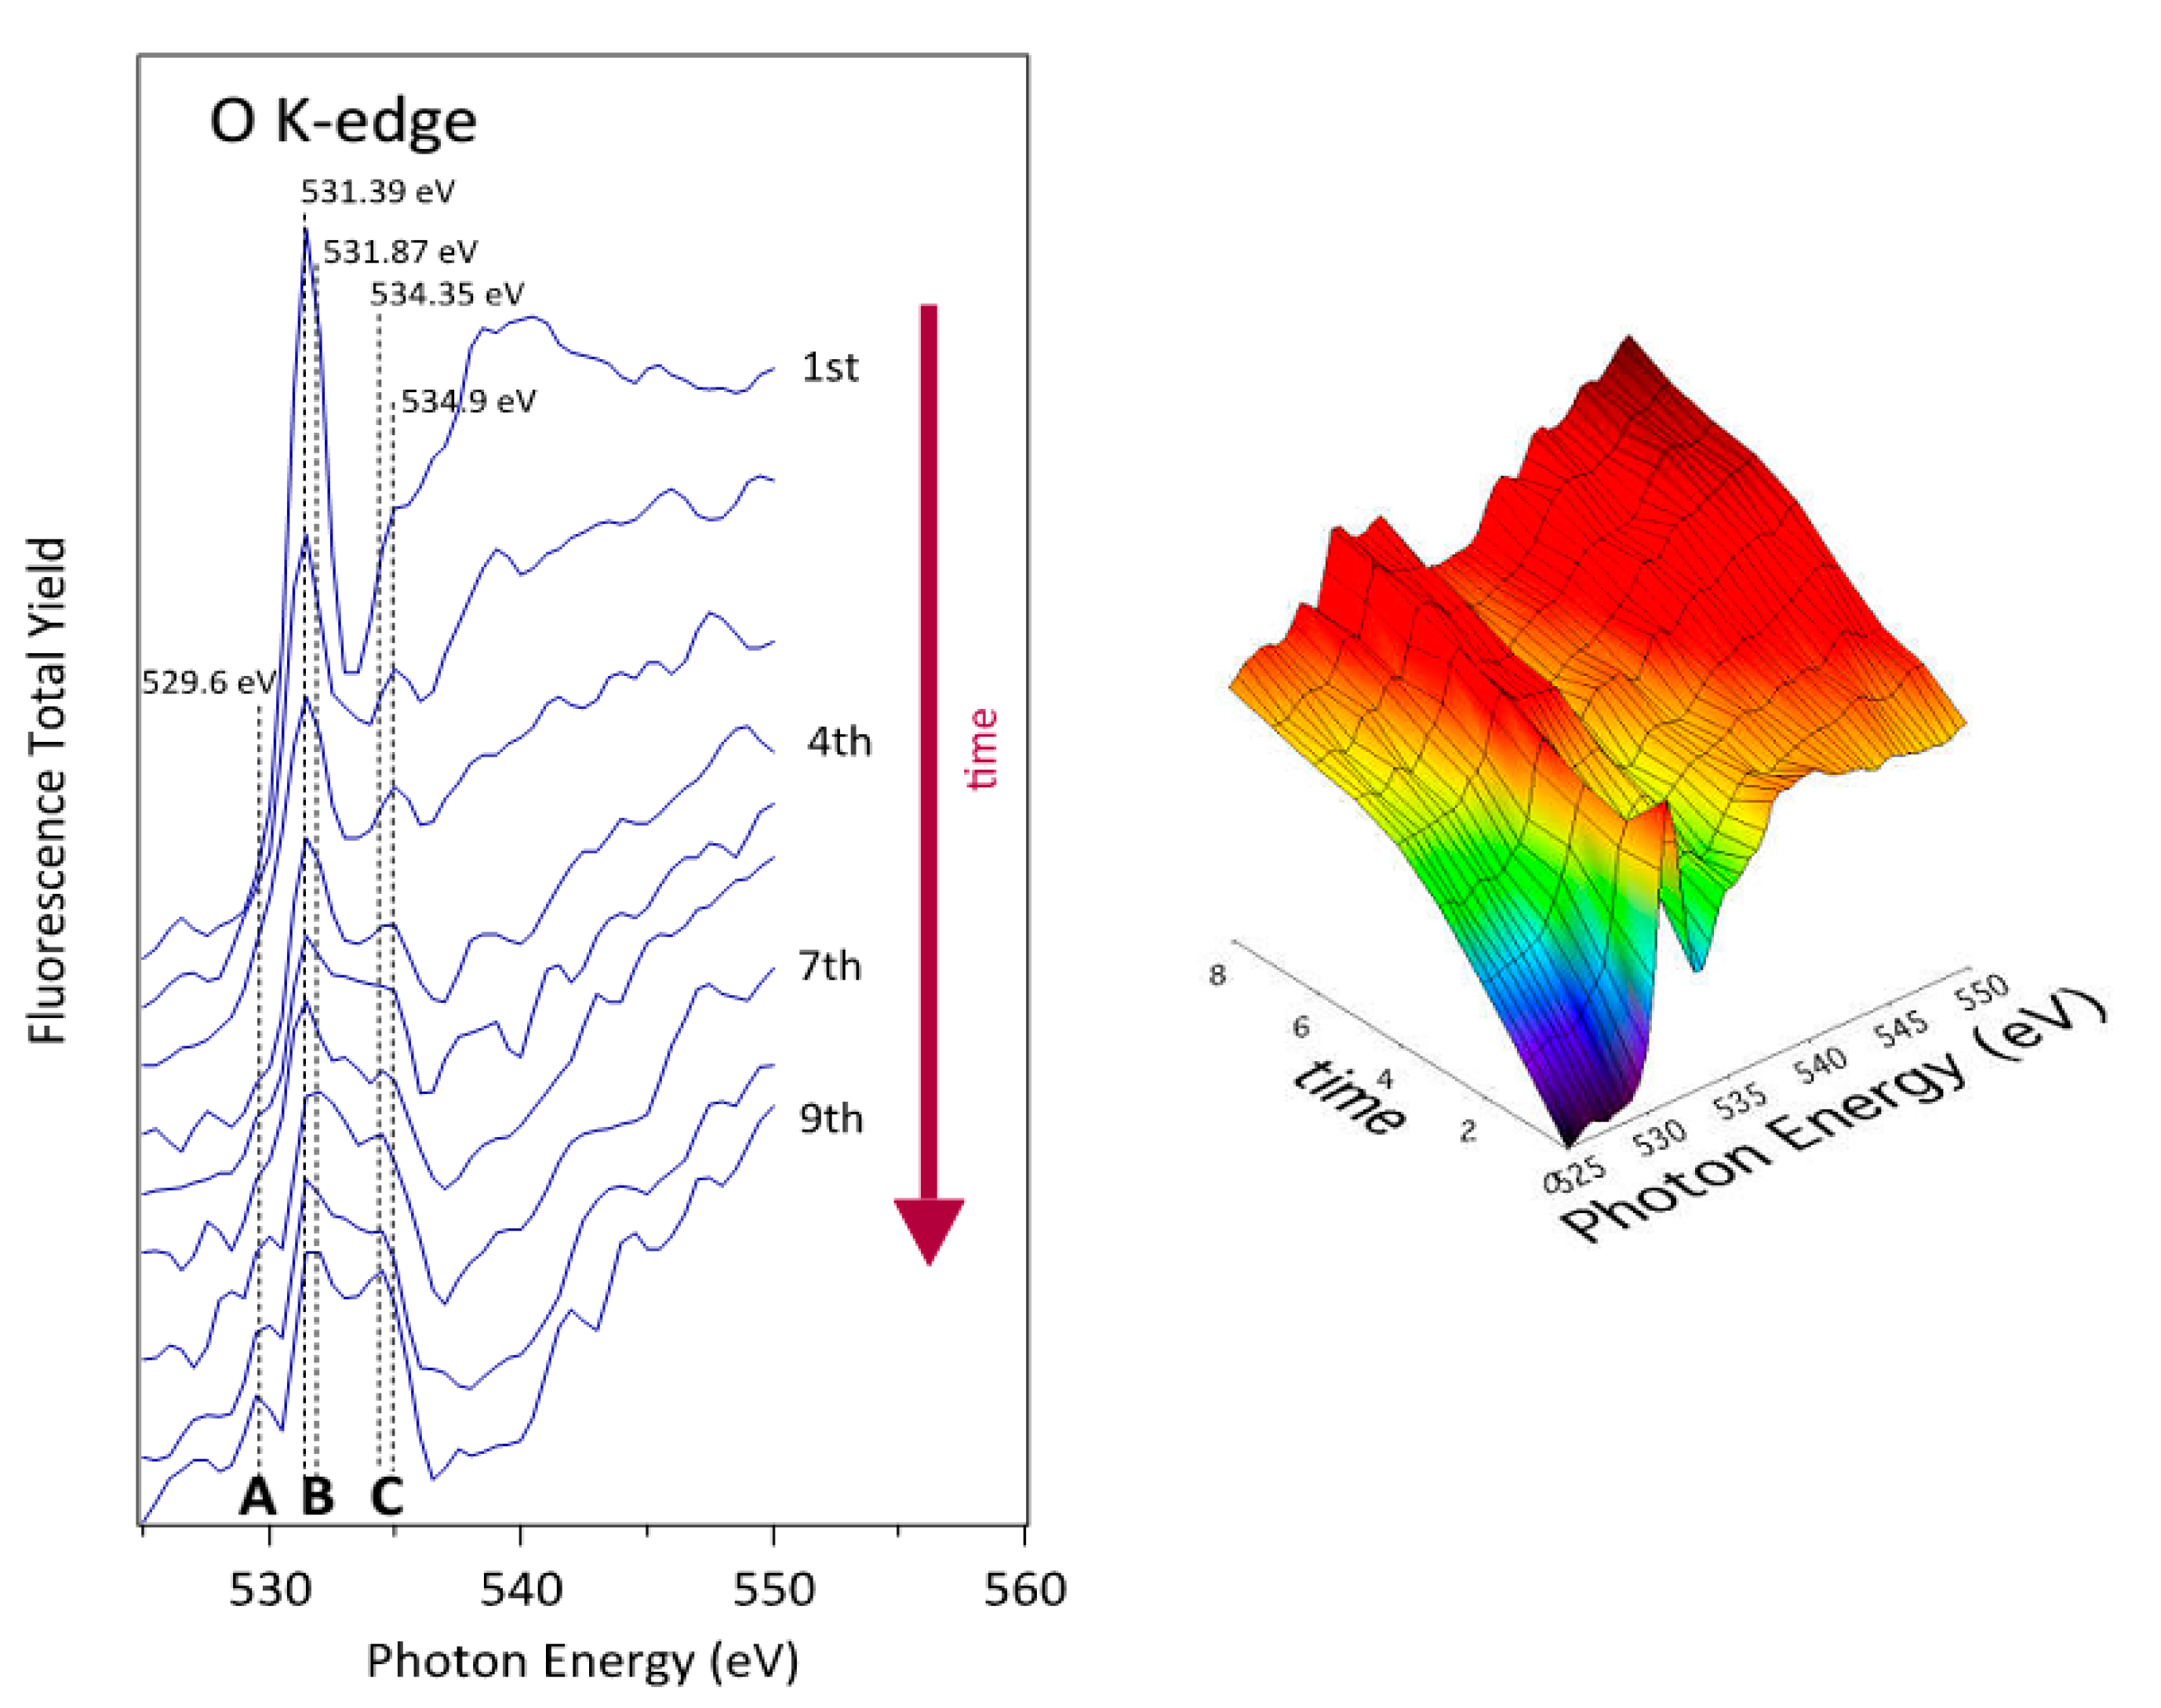
3.3. NEXAFS Analyzes
4. Conclusions
Acknowledgments
Author Contributions
Conflicts of Interest
Abbreviations
| AFM | Atomic force microscopy |
| FWHM | Full width at half maximum |
| HAS | Human serum albumin |
| LUMO | Lowest unoccupied molecular orbital |
| NEXAFS | Near-edge X-ray absorption fine structure |
| PS | Polystyrene |
| RF | Radiofrequency |
| UPS | Ultraviolet photoelectron spectroscopy |
| UV | Ultraviolet |
| VUV | Vacuum ultraviolet radiation |
| XANES | X-ray absorption near-edge spectroscopy |
| XPS | X-ray photoelectron spectroscopy |
References
- Kasemo, B. Biological surface science. Surf. Sci. 2002, 500, 656–677. [Google Scholar] [CrossRef]
- De Mel, A.; Cousins, B.G.; Seifalian, A.M. Surface modification of biomaterials: A quest for blood compatibility. Int. J. Biomater. 2012, 2012, 707863. [Google Scholar] [CrossRef] [PubMed]
- Chu, P.K.; Chen, J.Y.; Wang, L.P.; Huang, N. Plasma-surface modification of biomaterials. Mater. Sci. Eng. R Rep. 2002, 36, 143–206. [Google Scholar] [CrossRef]
- Wise, S.G.; Waterhouse, A.; Kondyurin, A.; Bilek, M.M.; Weiss, A.S. Plasma-based biofunctionalization of vascular implants. Nanomedicine 2012, 7, 1907–1916. [Google Scholar] [CrossRef] [PubMed]
- Mirenghi, L.; Ramires, P.A.; Pentassuglia, R.E.; Rotolo, P.; Romito, A. Growth of human endothelial cells on plasma-treated polyethyleneterephthalate surfaces. J. Mater. Sci. Mater. Med. 2000, 11, 327–331. [Google Scholar] [CrossRef] [PubMed]
- Sipehia, R.; Martucci, G.; Barbarosie, M.; Wu, C. Enhanced attachment and growth of human endothelial cells derived from umbilical veins on ammonia plasma modified surfaces of PTFE and ePTFE synthetic vascular graft biomaterials. Biomater. Artif. Cell Immobil. Biotechnol. 1993, 21, 455–468. [Google Scholar] [CrossRef]
- Wang, J.; Pan, C.J.; Huang, N.; Sun, H.; Yang, P.; Leng, Y.X.; Chen, J.Y.; Wan, G.J.; Chu, P.K. Surface characterization and blood compatibility of poly(ethylene terephthalate) modified by plasma surface grafting. Surf. Coat. Technol. 2005, 196, 307–311. [Google Scholar] [CrossRef]
- Vesel, A.; Kolar, M.; Recek, N.; Kutasi, K.; Stana-Kleinschek, K.; Mozetic, M. Etching of blood proteins in the early and late flowing afterglow of oxygen plasma. Plasma Process. Polym. 2014, 11, 12–23. [Google Scholar] [CrossRef]
- Vesel, A.; Junkar, I.; Cvelbar, U.; Kovac, J.; Mozetic, M. Surface modification of polyester by oxygen- and nitrogen-plasma treatment. Surf. Interface Anal. 2008, 40, 1444–1453. [Google Scholar] [CrossRef]
- Cheng, T.-S.; Lin, H.-T.; Chuang, M.-J. Surface fluorination of polyethylene terephthalate films with RF plasma. Mater. Lett. 2004, 58, 650–653. [Google Scholar] [CrossRef]
- Wang, C.; Lai, P.-C.; Syu, S.H.; Leu, J. Effects of CF4 plasma treatment on the moisture uptake, diffusion, and WVTR of poly(ethylene terephthalate) flexible films. Surf. Coat. Technol. 2011, 206, 318–324. [Google Scholar] [CrossRef]
- Kinga, K.; Vasco, G.; Paulo, A.S. Active species downstream of an Ar–O2 surface-wave microwave discharge for biomedicine, surface treatment and nanostructuring. Plasma Sour. Sci. Technol. 2011, 20, 035006. [Google Scholar]
- Vesel, A. Modification of polystyrene with a highly reactive cold oxygen plasma. Surf. Coat. Technol. 2010, 205, 490–497. [Google Scholar] [CrossRef]
- De Geyter, N.; Morent, R. Nonthermal plasma sterilization of living and nonliving surfaces. Ann. Rev. Biomed. Eng. 2012, 14, 255–274. [Google Scholar] [CrossRef] [PubMed]
- Shintani, H.; Sakudo, A.; Burke, P.; McDonnell, G. Gas plasma sterilization of microorganisms and mechanisms of action. Exp. Ther. Med. 2010, 1, 731–738. [Google Scholar] [CrossRef] [PubMed]
- Modic, M.; Junkar, I.; Vesel, A.; Mozetic, M. Aging of plasma treated surfaces and their effects on platelet adhesion and activation. Surf. Coat. Technol. 2012, 213, 98–104. [Google Scholar] [CrossRef]
- Hitchcock, A.P.; Morin, C.; Zhang, X.; Araki, T.; Dynes, J.; Stöver, H.; Brash, J.; Lawrence, J.R.; Leppard, G.G. Soft X-ray spectromicroscopy of biological and synthetic polymer systems. J. Electron Spectrosc. 2005, 144–147, 259–269. [Google Scholar] [CrossRef]
- Stewart-Ornstein, J.; Hitchcock, A.P.; Hernández Cruz, D.; Henklein, P.; Overhage, J.; Hilpert, K.; Hale, J.D.; Hancock, R.E.W. Using intrinsic X-ray absorption spectral differences to identify and map peptides and proteins. J. Phys. Chem. B 2007, 111, 7691–7699. [Google Scholar] [CrossRef] [PubMed]
- Zubavichus, Y.; Shaporenko, A.; Grunze, M.; Zharnikov, M. Is X-ray absorption spectroscopy sensitive to the amino acid composition of functional proteins? J. Phys. Chem. B 2008, 112, 4478–4480. [Google Scholar] [CrossRef] [PubMed]
- Ozcam, A.E.; Efimenko, K.; Jaye, C.; Spontak, R.J.; Fischer, D.A.; Genzer, J. Modification of PET surfaces with self-assembled monolayers of organosilane precursors. J. Electron Spectrosc. 2009, 172, 95–103. [Google Scholar] [CrossRef]
- Watts, B.; Swaraj, S.; Nordlund, D.; Lüning, J.; Ade, H. Calibrated NEXAFS spectra of common conjugated polymers. J. Chem. Phys. 2011, 134, 024702. [Google Scholar] [CrossRef] [PubMed]
- Urquhart, S.G.; Ade, H. Trends in the carbonyl core (C 1s, O 1s)→ π*C=O transition in the near-edge X-ray absorption fine structure spectra of organic molecules. J. Phys. Chem. B 2002, 106, 8531–8538. [Google Scholar] [CrossRef]
- Buchwalter, L.P.; Czornyj, G. Poly(methyl methacrylate) degradation during x-ray photoelectron spectroscopy analysis. J. Vac. Sci. Technol. A 1990, 8, 781–784. [Google Scholar] [CrossRef]
- Beetz, T.; Jacobsen, C. Soft X-ray radiation-damage studies in PMMA using a cryo-STXM. J. Synchrotron Radiat. 2003, 10, 280–283. [Google Scholar] [CrossRef] [PubMed]
- Artyushkova, K.; Fulghum, J.E. Quantification of PVC–PMMA polymer blend compositions by XPS in the presence of x-ray degradation effects. Surf. Interface Anal. 2001, 31, 352–361. [Google Scholar] [CrossRef]
- Ferraria, A.M.; Lopes da Silva, J.D.; Botelho do Rego, A.M. XPS studies of directly fluorinated HDPE: Problems and solutions. Polymer 2003, 44, 7241–7249. [Google Scholar] [CrossRef]
- Johansson, L.-S.; Campbell, J.M. Reproducible XPS on biopolymers: Cellulose studies. Surf. Interface Anal. 2004, 36, 1018–1022. [Google Scholar] [CrossRef]
- Jose, A.; Ivy, R.-C.; Stehane, L.; Bruno, L.; Jean-Luc, G.; François, P.; Maria, C.A. ANTARES, a scanning photoemission microscopy beamline at SOLEIL. J. Phys. Conf. Ser. 2013, 425, 192023. [Google Scholar]
- José, A.; Asensio, M.C. First NanoARPES user facility available at SOLEIL: An innovative and powerful tool for studying advanced materials. Synchrotron Radiat. News 2014, 27, 24–30. [Google Scholar]
- Siow, K.S.; Britcher, L.; Kumar, S.; Griesser, H.J. Plasma methods for the generation of chemically reactive surfaces for biomolecule immobilization and cell colonization—A review. Plasma Process. Polym. 2006, 3, 392–418. [Google Scholar] [CrossRef]
- Ramires, P.A.; Mirenghi, L.; Romano, A.R.; Palumbo, F.; Nicolardi, G. Plasma-treated PET surfaces improve the biocompatibility of human endothelial cells. J. Biomed. Mater. Res. 2000, 51, 535–539. [Google Scholar] [CrossRef]
- Rabe, M.; Verdes, D.; Seeger, S. Understanding protein adsorption phenomena at solid surfaces. Adv. Colloid. Interface Sci. 2011, 162, 87–106. [Google Scholar] [CrossRef] [PubMed]
- Anand, G.; Sharma, S.; Dutta, A.K.; Kumar, S.K.; Belfort, G. Conformational transitions of adsorbed proteins on surfaces of varying polarity. Langmuir 2010, 26, 10803–10811. [Google Scholar] [CrossRef] [PubMed]
- Anselme, K.; Ploux, L.; Ponche, A. Cell/material interfaces: Influence of surface chemistry and surface topography on cell adhesion. J. Adhes. Sci. Technol. 2010, 24, 831–852. [Google Scholar] [CrossRef]
- D’Sa, R.A.; Burke, G.A.; Meenan, B.J. Protein adhesion and cell response on atmospheric pressure dielectric barrier discharge-modified polymer surfaces. Acta Biomater. 2010, 6, 2609–2620. [Google Scholar] [CrossRef] [PubMed]
- Doliska, A.; Ribitsch, V.; Stana Kleinschek, K.; Strnad, S. Viscoelastic properties of fibrinogen adsorbed onto poly(ethylene terephthalate) surfaces by QCM-D. Carbohydr. Polym. 2013, 93, 246–255. [Google Scholar] [CrossRef] [PubMed]
- Zelzer, M.; Albutt, D.; Alexander, M.R.; Russell, N.A. The role of albumin and fibronectin in the adhesion of fibroblasts to plasma polymer surfaces. Plasma Process. Polym. 2012, 9, 149–156. [Google Scholar] [CrossRef]
- Xu, T.; Fu, R.; Yan, L. A new insight into the adsorption of bovine serum albumin onto porous polyethylene membrane by zeta potential measurements, FTIR analyses, and AFM observations. J. Colloid Interface Sci. 2003, 262, 342–350. [Google Scholar] [CrossRef]
- Mori, O.; Imae, T. AFM investigation of the adsorption process of bovine serum albumin on mica. Colloid. Surf. B 1997, 9, 31–36. [Google Scholar] [CrossRef]
- Recek, N.; Jaganjac, M.; Kolar, M.; Milkovic, L.; Mozetic, M.; Stana-Kleinschek, K.; Vesel, A. Protein adsorption on various plasma-treated polyethylene terephthalate substrates. Molecules 2013, 18, 12441–12463. [Google Scholar] [CrossRef] [PubMed]
- Stöhr, J. NEXAFS Spectroscopy, Springer Series in Surface Sciences, 1st ed.; Springer: Heidelberg, Germany, 1992; Volume 25. [Google Scholar]
- Hahner, G. Near edge X-ray absorption fine structure spectroscopy as a tool to probe electronic and structural properties of thin organic films and liquids. Chem. Soc. Rev. 2006, 35, 1244–1255. [Google Scholar] [CrossRef] [PubMed]
- Rehr, J.J.; Albers, R.C. Theoretical approaches to x-ray absorption fine structure. Rev. Mod. Phys. 2000, 72, 621–654. [Google Scholar] [CrossRef]
- Messer, B.M.; Cappa, C.D.; Smith, J.D.; Wilson, K.R.; Gilles, M.K.; Cohen, R.C.; Saykally, R.J. pH dependence of the electronic structure of glycine. J. Phys. Chem. B 2005, 109, 5375–5382. [Google Scholar] [CrossRef] [PubMed]
- Myneni, S.C.B. Soft X-ray spectroscopy and spectromicroscopy studies of organic molecules in the environment. Rev. Miner. Geochem. 2002, 49, 485–579. [Google Scholar] [CrossRef]
- Cody, G.D.; Gupta, N.S.; Briggs, D.E.G.; Kilcoyne, A.L.D.; Summons, R.E.; Kenig, F.; Plotnick, R.E.; Scott, A.C. Molecular signature of chitin-protein complex in Paleozoic arthropods. Geology 2011, 39, 255–258. [Google Scholar] [CrossRef]
- Koprinarov, I.; Lippitz, A.; Friedrich, J.F.; Unger, W.E.S.; Wöll, C. Surface analysis of DC oxygen plasma treated or chromium evaporated poly(ethylene terephthalate) foils by soft X-ray absorption spectroscopy (NEXAFS). Polymer 1997, 38, 2005–2010. [Google Scholar] [CrossRef]
- Francis, J.T.; Hitchcock, A.P. Inner-shell spectroscopy of p-benzoquinone, hydroquinone, and phenol: Distinguishing quinoid and benzenoid structures. J. Phys. Chem. 1992, 96, 6598–6610. [Google Scholar] [CrossRef]
- Hitchcock, A.P.; Fischer, P.; Gedanken, A.; Robin, M.B. Antibonding .sigma.* valence MOs in the inner-shell and outer-shell spectra of the fluorobenzenes. J. Phys. Chem. 1987, 91, 531–540. [Google Scholar] [CrossRef]
- Feng, S.; Li, L.; Yang, X.; Zhou, X.; Bai, S.; Sham, T.K. Effect of defects induced by 12C+ ion irradiation on the fluorination of pyrolytic carbon coating in flinak salt. Adv. Eng. Mater. 2014, 16, 897–904. [Google Scholar] [CrossRef]
- Zhang, Z.; Wächter, T.; Kind, M.; Schuster, S.; Bats, J.W.; Nefedov, A.; Zharnikov, M.; Terfort, A. Self-assembled monolayers of perfluoroanthracenylaminoalkane thiolates on gold as potential electron injection layers. ACS Appl. Mater. Interfaces 2016, 8, 7308–7319. [Google Scholar] [CrossRef] [PubMed]
- Friedrich, J.F.; Geng, S.; Unger, W.; Lippitz, A.; Erdmann, J.; Gorsler, H.V.; Wöll, C.; Schertel, A.; Bierbaum, K. Plasma functionalization and reorientation of macromolecules at polymer surfaces. Surf. Coat. Technol. 1995, 74–75, 664–669. [Google Scholar] [CrossRef]
- Seki, K.; Mitsumoto, R.; Itoc, E.; Araki, T.; Sakurai, Y.; Yoshimura, D.; Ishii, H.; Ouchi, Y.; Miyamae, T.; Narita, T.; et al. High-energy spectroscopic studies of the electronic structures of organic systems formed from carbon and fluorine by UPS, vacuum-UV optical spectroscopy, and NEXAFS: Poly(hexafluoro-1,3-butadiene) [C(CF3)=C(CF3)]n, fluorinated graphites (CF, C2F, and C6F), perfluoroalkanes n-Cn F2n+2, poly(tetrafluoroethylene) (CF2)n, and fluorinated fullerenes (C60Fx and C70Fx). Mol. Cryst. Liq. Cryst. Sci. Technol. A 2001, 355, 247–274. [Google Scholar]
- Sakkayawong, N.; Thiravetyan, P.; Nakbanpote, W. Adsorption mechanism of synthetic reactive dye wastewater by chitosan. J. Colloid Interface Sci. 2005, 286, 36–42. [Google Scholar] [CrossRef] [PubMed]
- Zubavichus, Y.; Shaporenko, A.; Grunze, M.; Zharnikov, M. Innershell absorption spectroscopy of amino acids at all relevant absorption edges. J. Phys. Chem. A 2005, 109, 6998–7000. [Google Scholar] [CrossRef] [PubMed]
- Zubavichus, Y.; Shaporenko, A.; Grunze, M.; Zharnikov, M. NEXAFS spectroscopy of homopolypeptides at all relevant absorption edges: Polyisoleucine, polytyrosine, and polyhistidine. J. Phys. Chem. B 2007, 111, 9803–9807. [Google Scholar] [CrossRef] [PubMed]


| Sample | C | O | N | F |
|---|---|---|---|---|
| Untreated PS | 100 | |||
| Pure albumin | 66 | 19 | 15 | |
| PS + O2 plasma | 73 | 27 | ||
| PS + CF4 plasma | 43 | 1 | 56 | |
| PS + O2 plasma + albumin prior irradiation | 66 | 18 | 16 | |
| PS + O2 plasma + albumin after irradiation | 68 | 20 | 12 | |
| PS + CF4 plasma + albumin prior irradiation | 64 | 15 | 11 | 10 |
| PS + CF4 plasma + albumin after irradiation | 72 | 12 | 7 | 9 |
© 2016 by the authors. Licensee MDPI, Basel, Switzerland. This article is an open access article distributed under the terms and conditions of the Creative Commons Attribution (CC-BY) license ( http://creativecommons.org/licenses/by/4.0/).
Share and Cite
Recek, N.; Primc, G.; Vesel, A.; Mozetic, M.; Avila, J.; Razado-Colambo, I.; Asensio, M.C. Degradation of Albumin on Plasma-Treated Polystyrene by Soft X-ray Exposure. Polymers 2016, 8, 244. https://doi.org/10.3390/polym8070244
Recek N, Primc G, Vesel A, Mozetic M, Avila J, Razado-Colambo I, Asensio MC. Degradation of Albumin on Plasma-Treated Polystyrene by Soft X-ray Exposure. Polymers. 2016; 8(7):244. https://doi.org/10.3390/polym8070244
Chicago/Turabian StyleRecek, Nina, Gregor Primc, Alenka Vesel, Miran Mozetic, José Avila, Ivy Razado-Colambo, and Maria C. Asensio. 2016. "Degradation of Albumin on Plasma-Treated Polystyrene by Soft X-ray Exposure" Polymers 8, no. 7: 244. https://doi.org/10.3390/polym8070244
APA StyleRecek, N., Primc, G., Vesel, A., Mozetic, M., Avila, J., Razado-Colambo, I., & Asensio, M. C. (2016). Degradation of Albumin on Plasma-Treated Polystyrene by Soft X-ray Exposure. Polymers, 8(7), 244. https://doi.org/10.3390/polym8070244