
Poly(Acrylic acid)–Based Hybrid Inorganic–Organic Electrolytes Membrane for Electrical Double Layer Capacitors Application

Abstract
:
1. Introduction
2. Experimental Section
2.1. Materials
2.2. Preparation of Filler Added Poly(Vinyl Alcohol)-Based Polymer Electrolyte Membranes
2.3. Characterization of Polymer Electrolyte Membranes
2.3.1. Ionic Conductivity Studies
2.3.2. Attenuated Total Reflectance—Fourier Transform Infrared (ATR-FTIR)
2.3.3. Morphological Studies
2.3.4. Linear Sweep Voltammetry (LSV)
2.4. Electrode Preparation
2.5. EDLC Fabrication
2.6. EDLC Characterization
2.6.1. Cyclic Voltammetry (CV)
2.6.2. Galvanostatic Charge-Discharge Performance (GCD)
3. Results
3.1. Ambient Temperature-Ionic Conductivity Studies
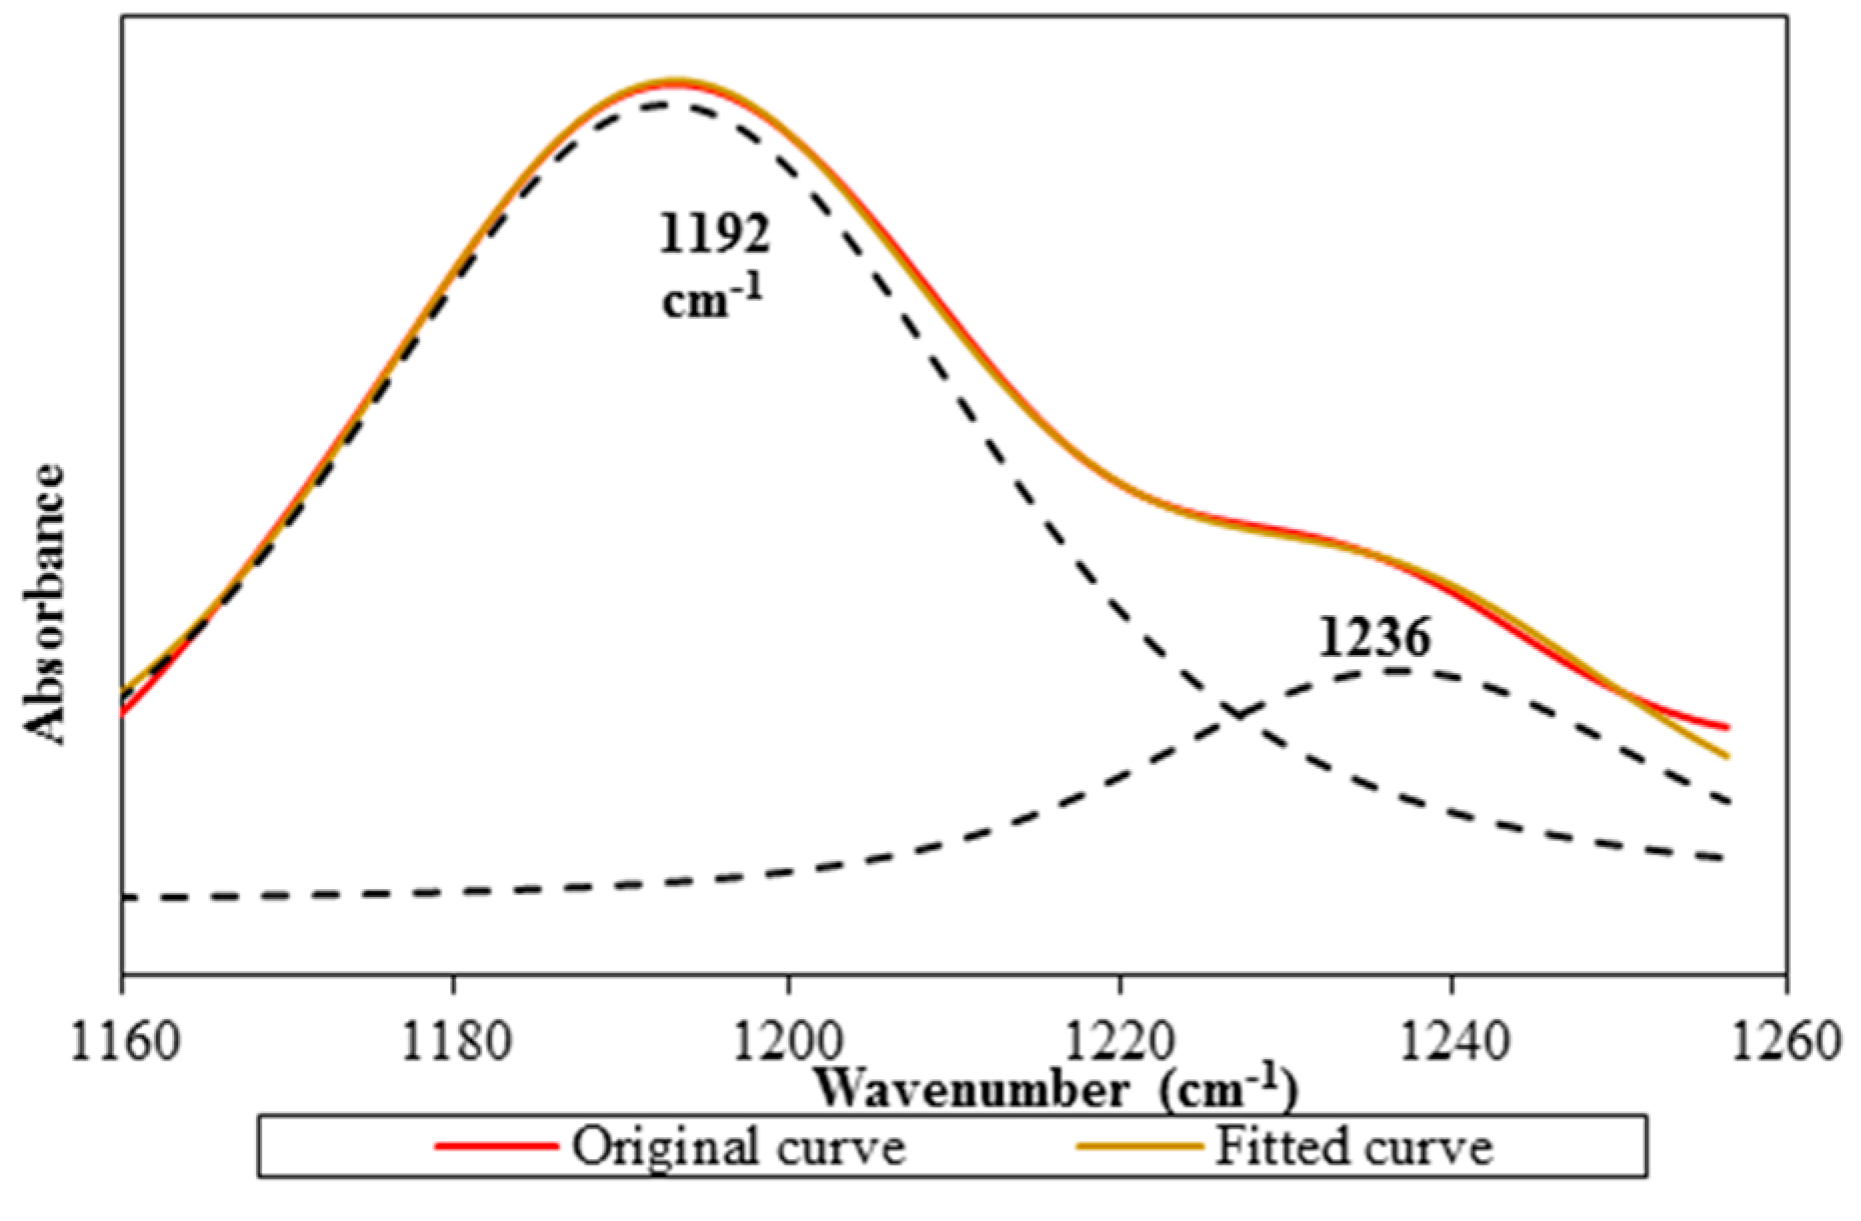
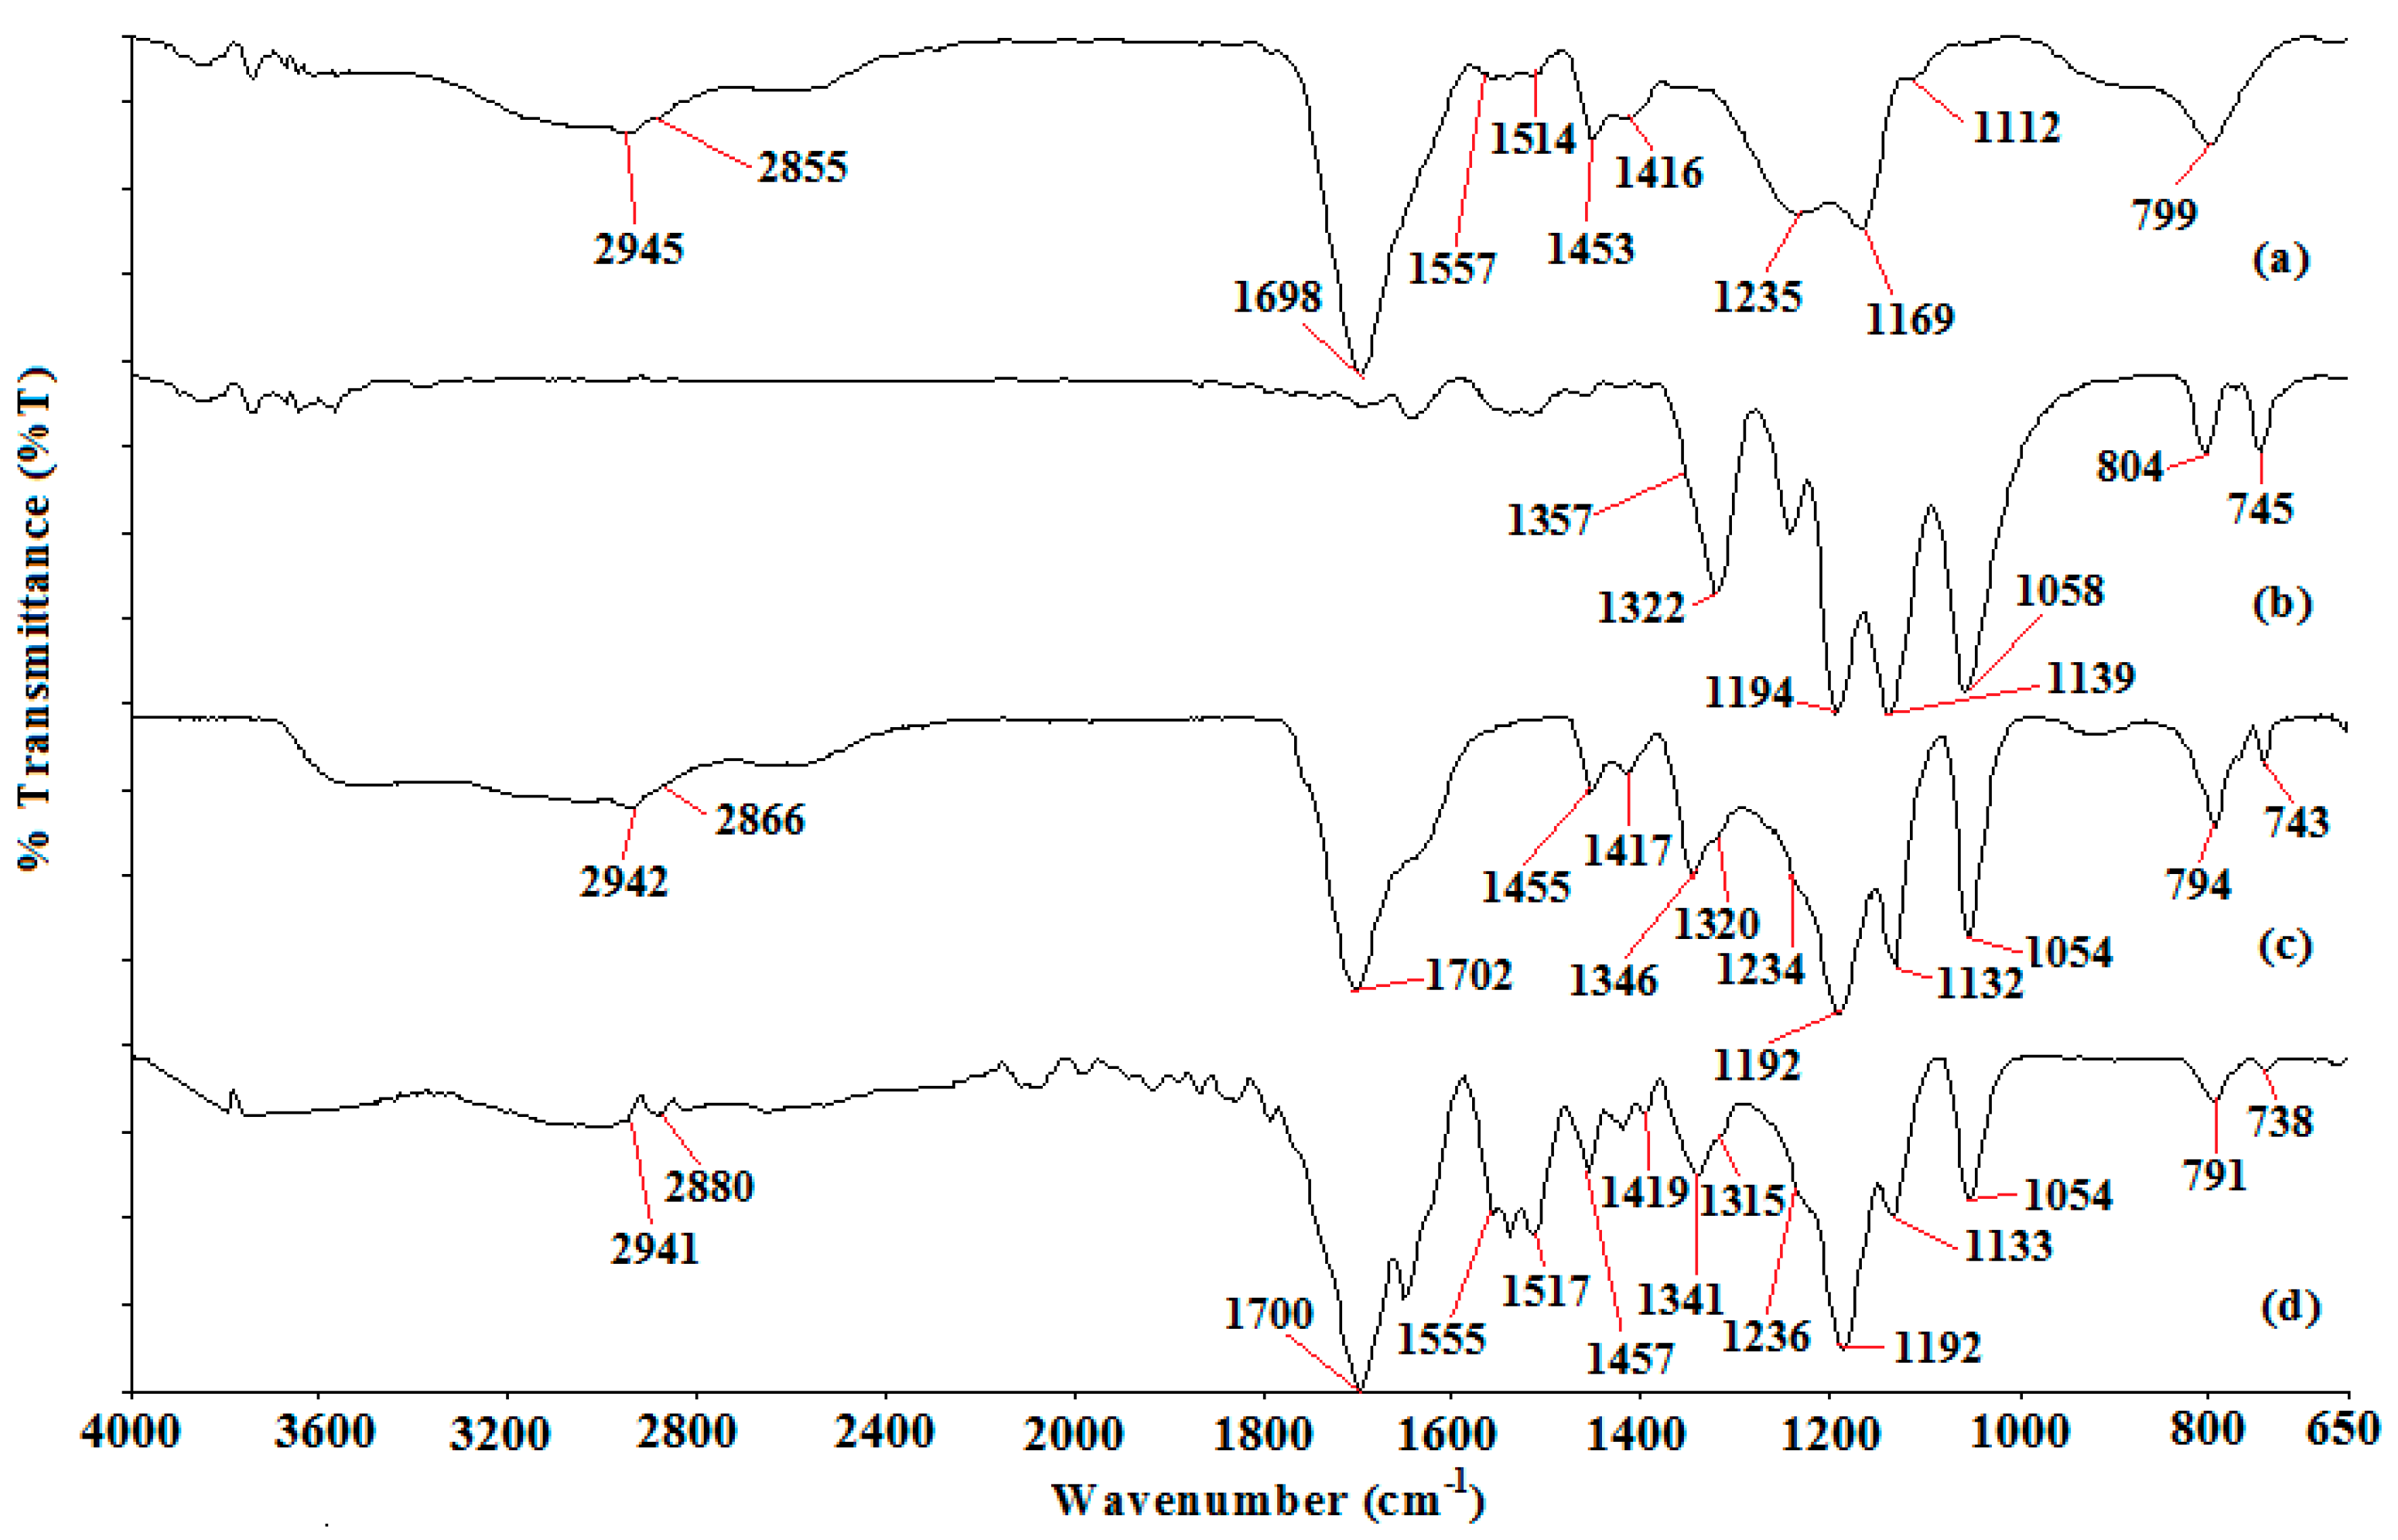
3.2. Attenuated Total Reflectance—Fourier Transform Infrared (ATR-FTIR)
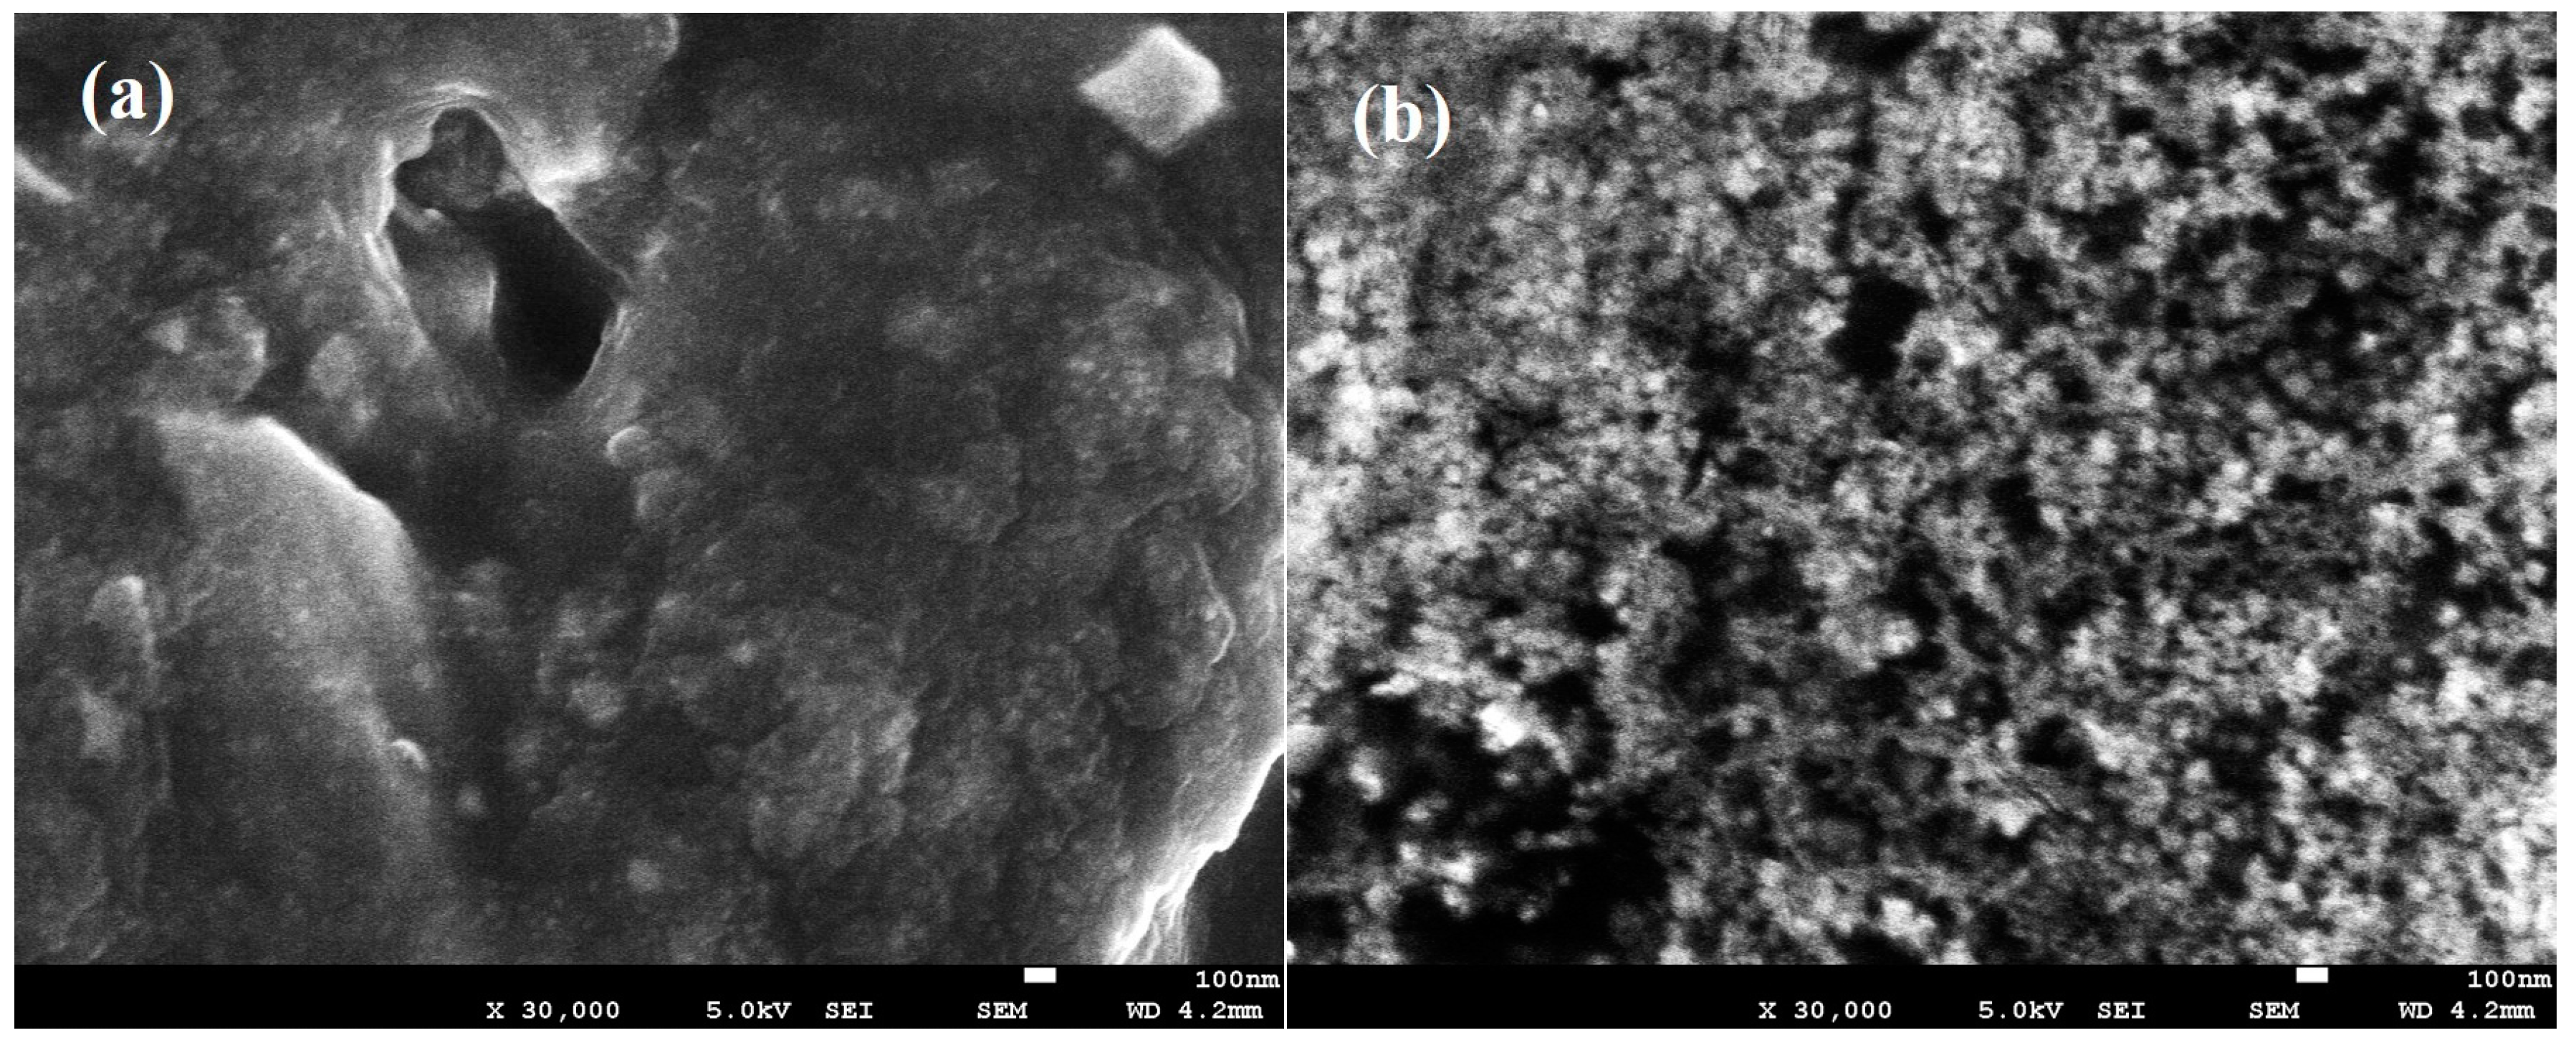
3.3. Morphological Studies
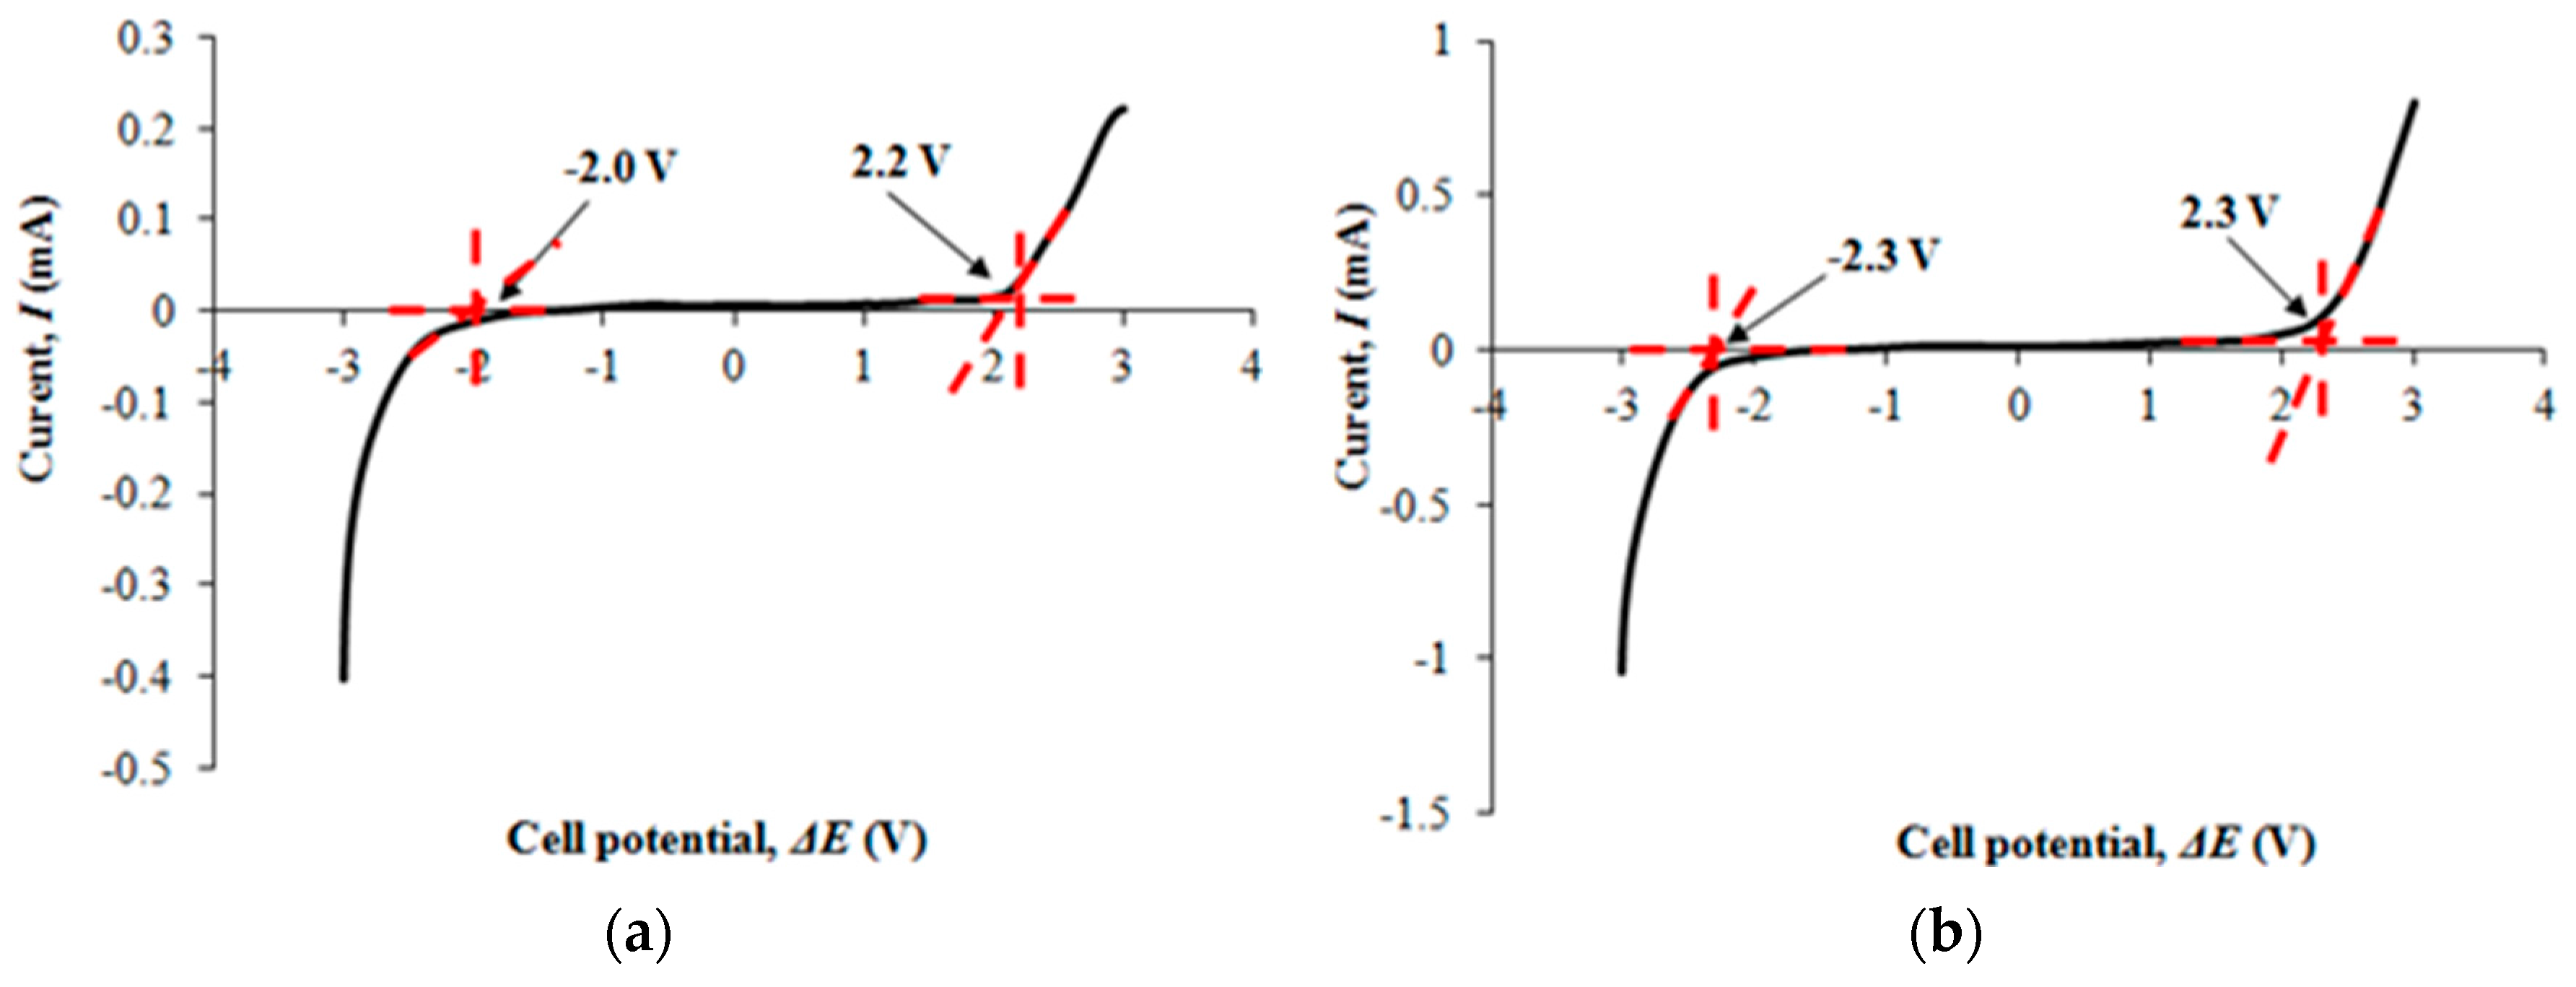
3.4. Linear Sweep Voltammetry (LSV)
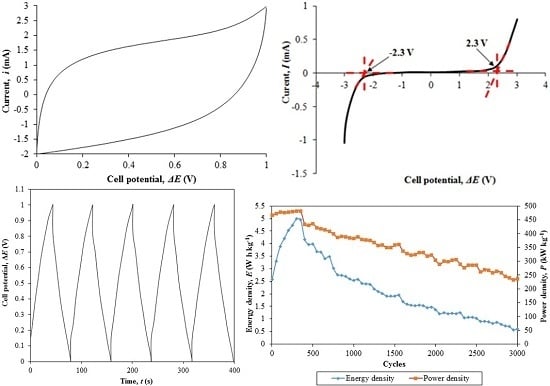
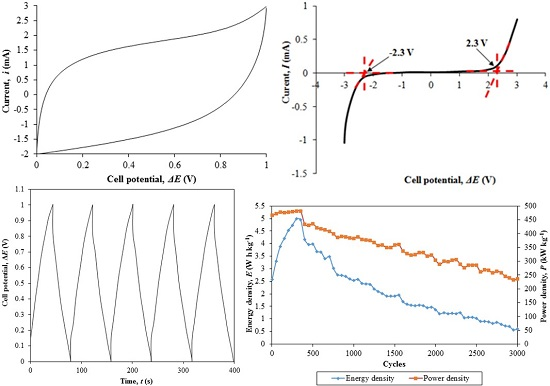
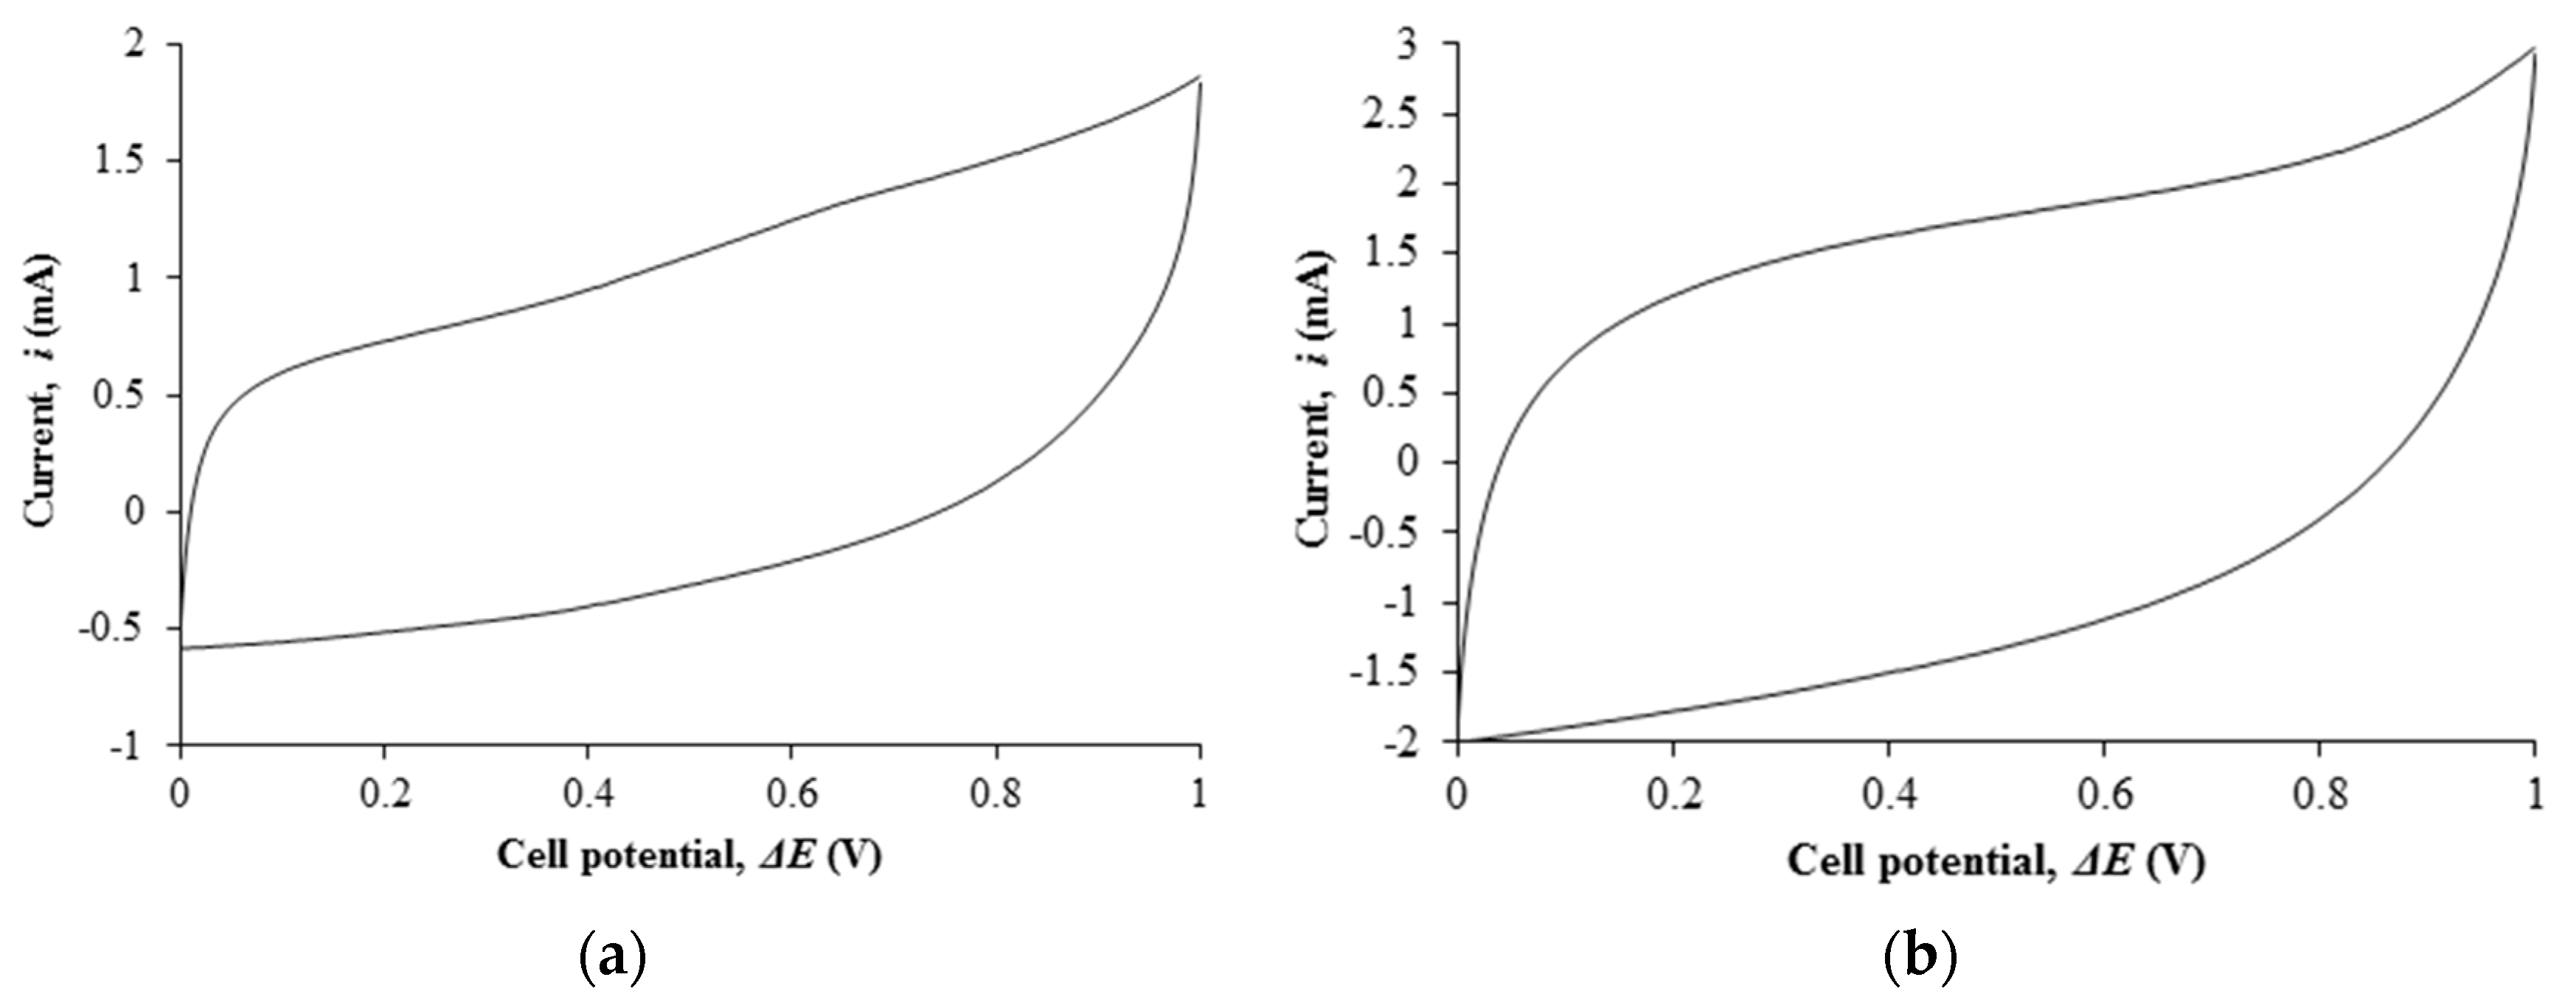
3.5. Cyclic Voltammetry (CV)
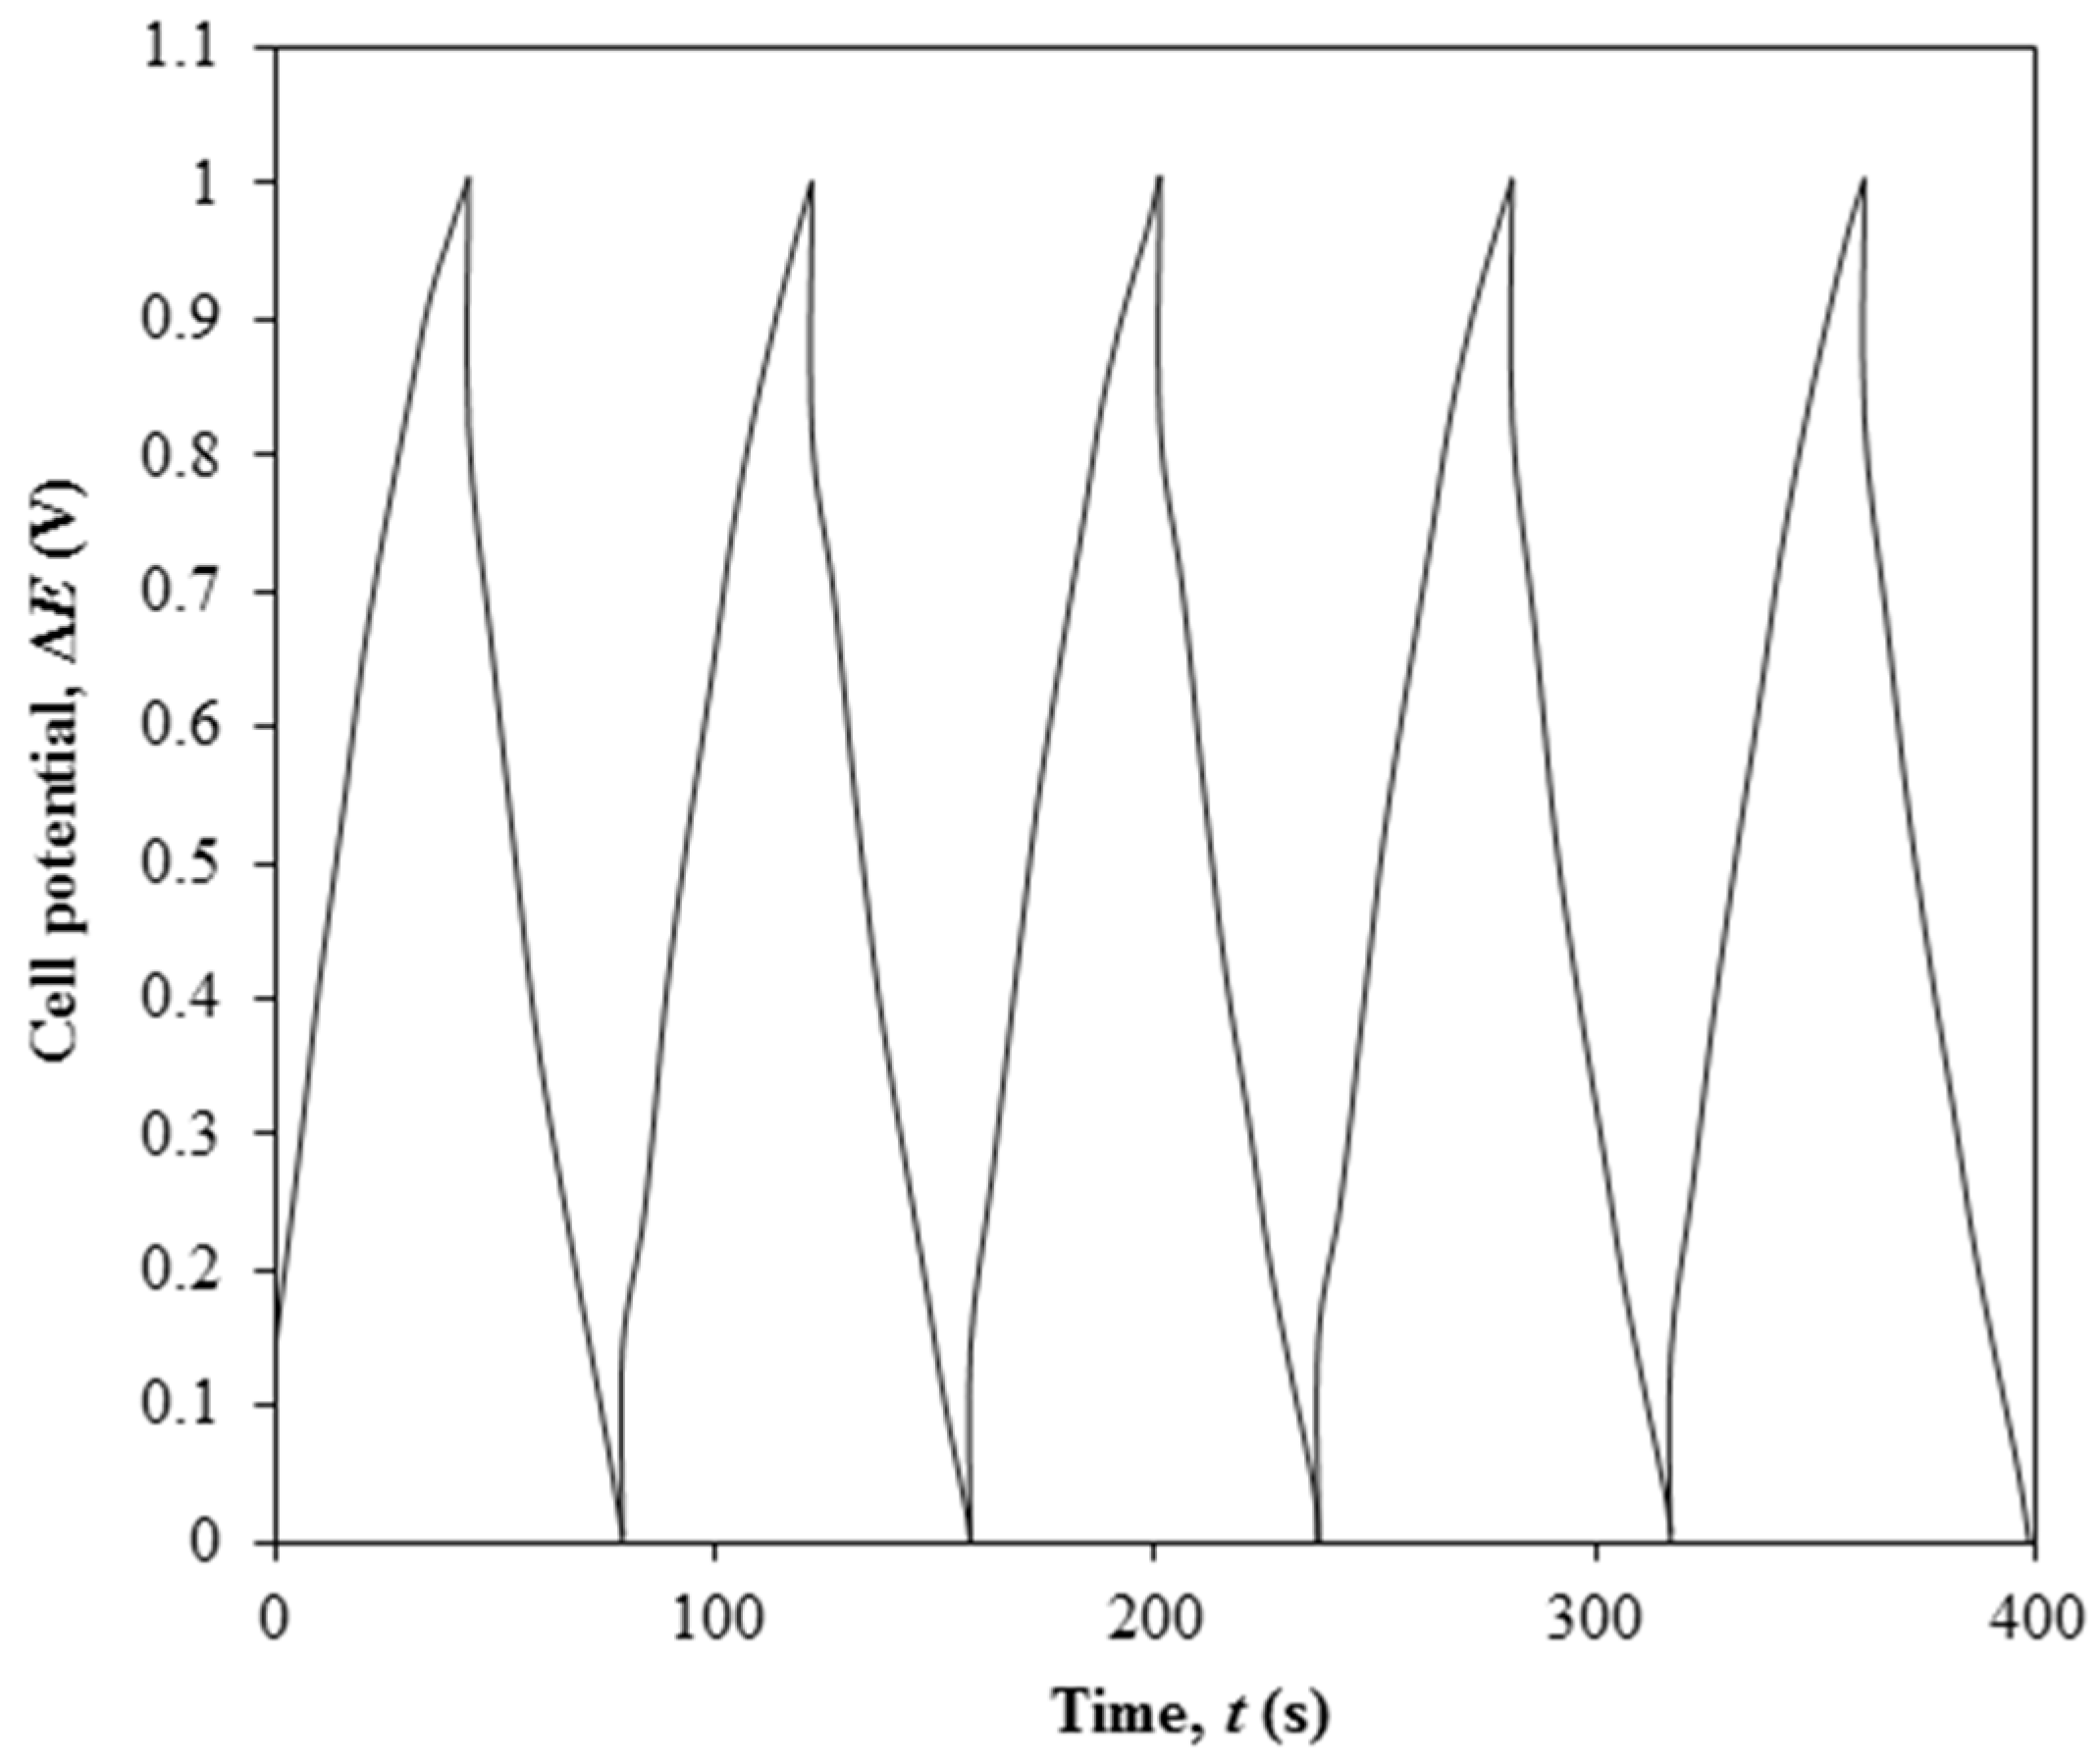
3.6. Galvanostatic Charge-Discharge Performance (GCD)
4. Discussion
4.1. Ambient Temperature-Ionic Conductivity Studies
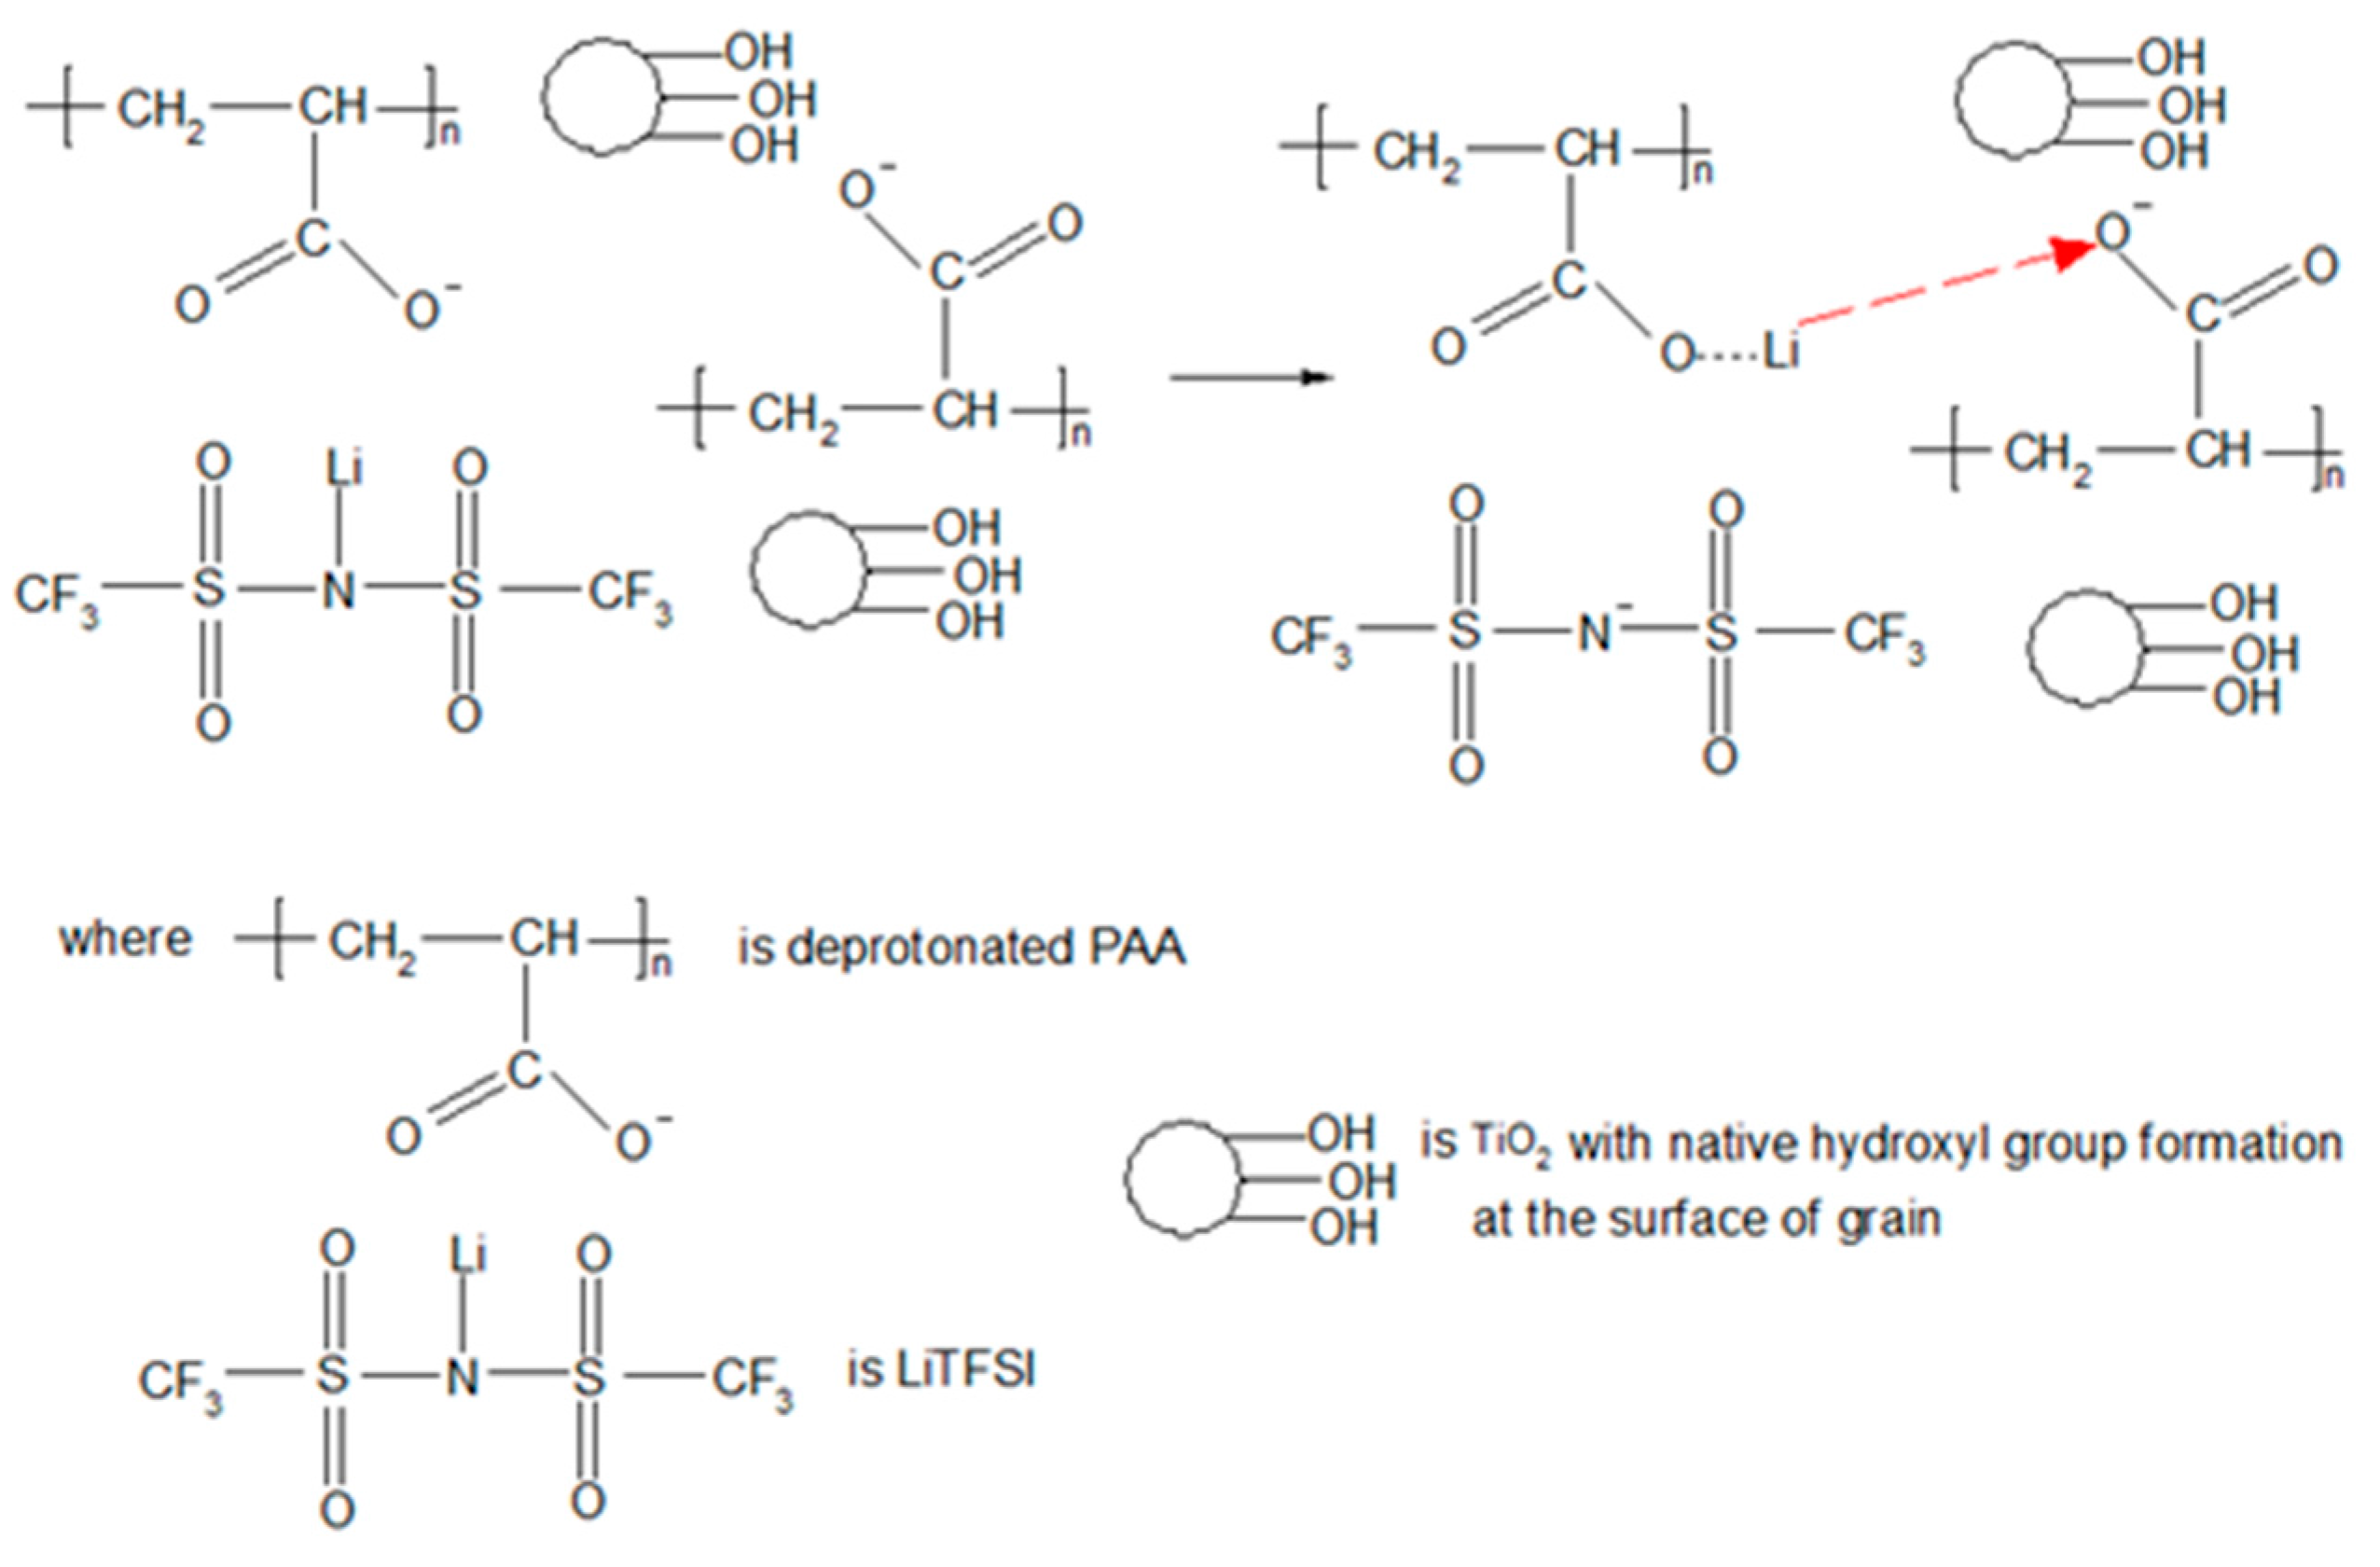
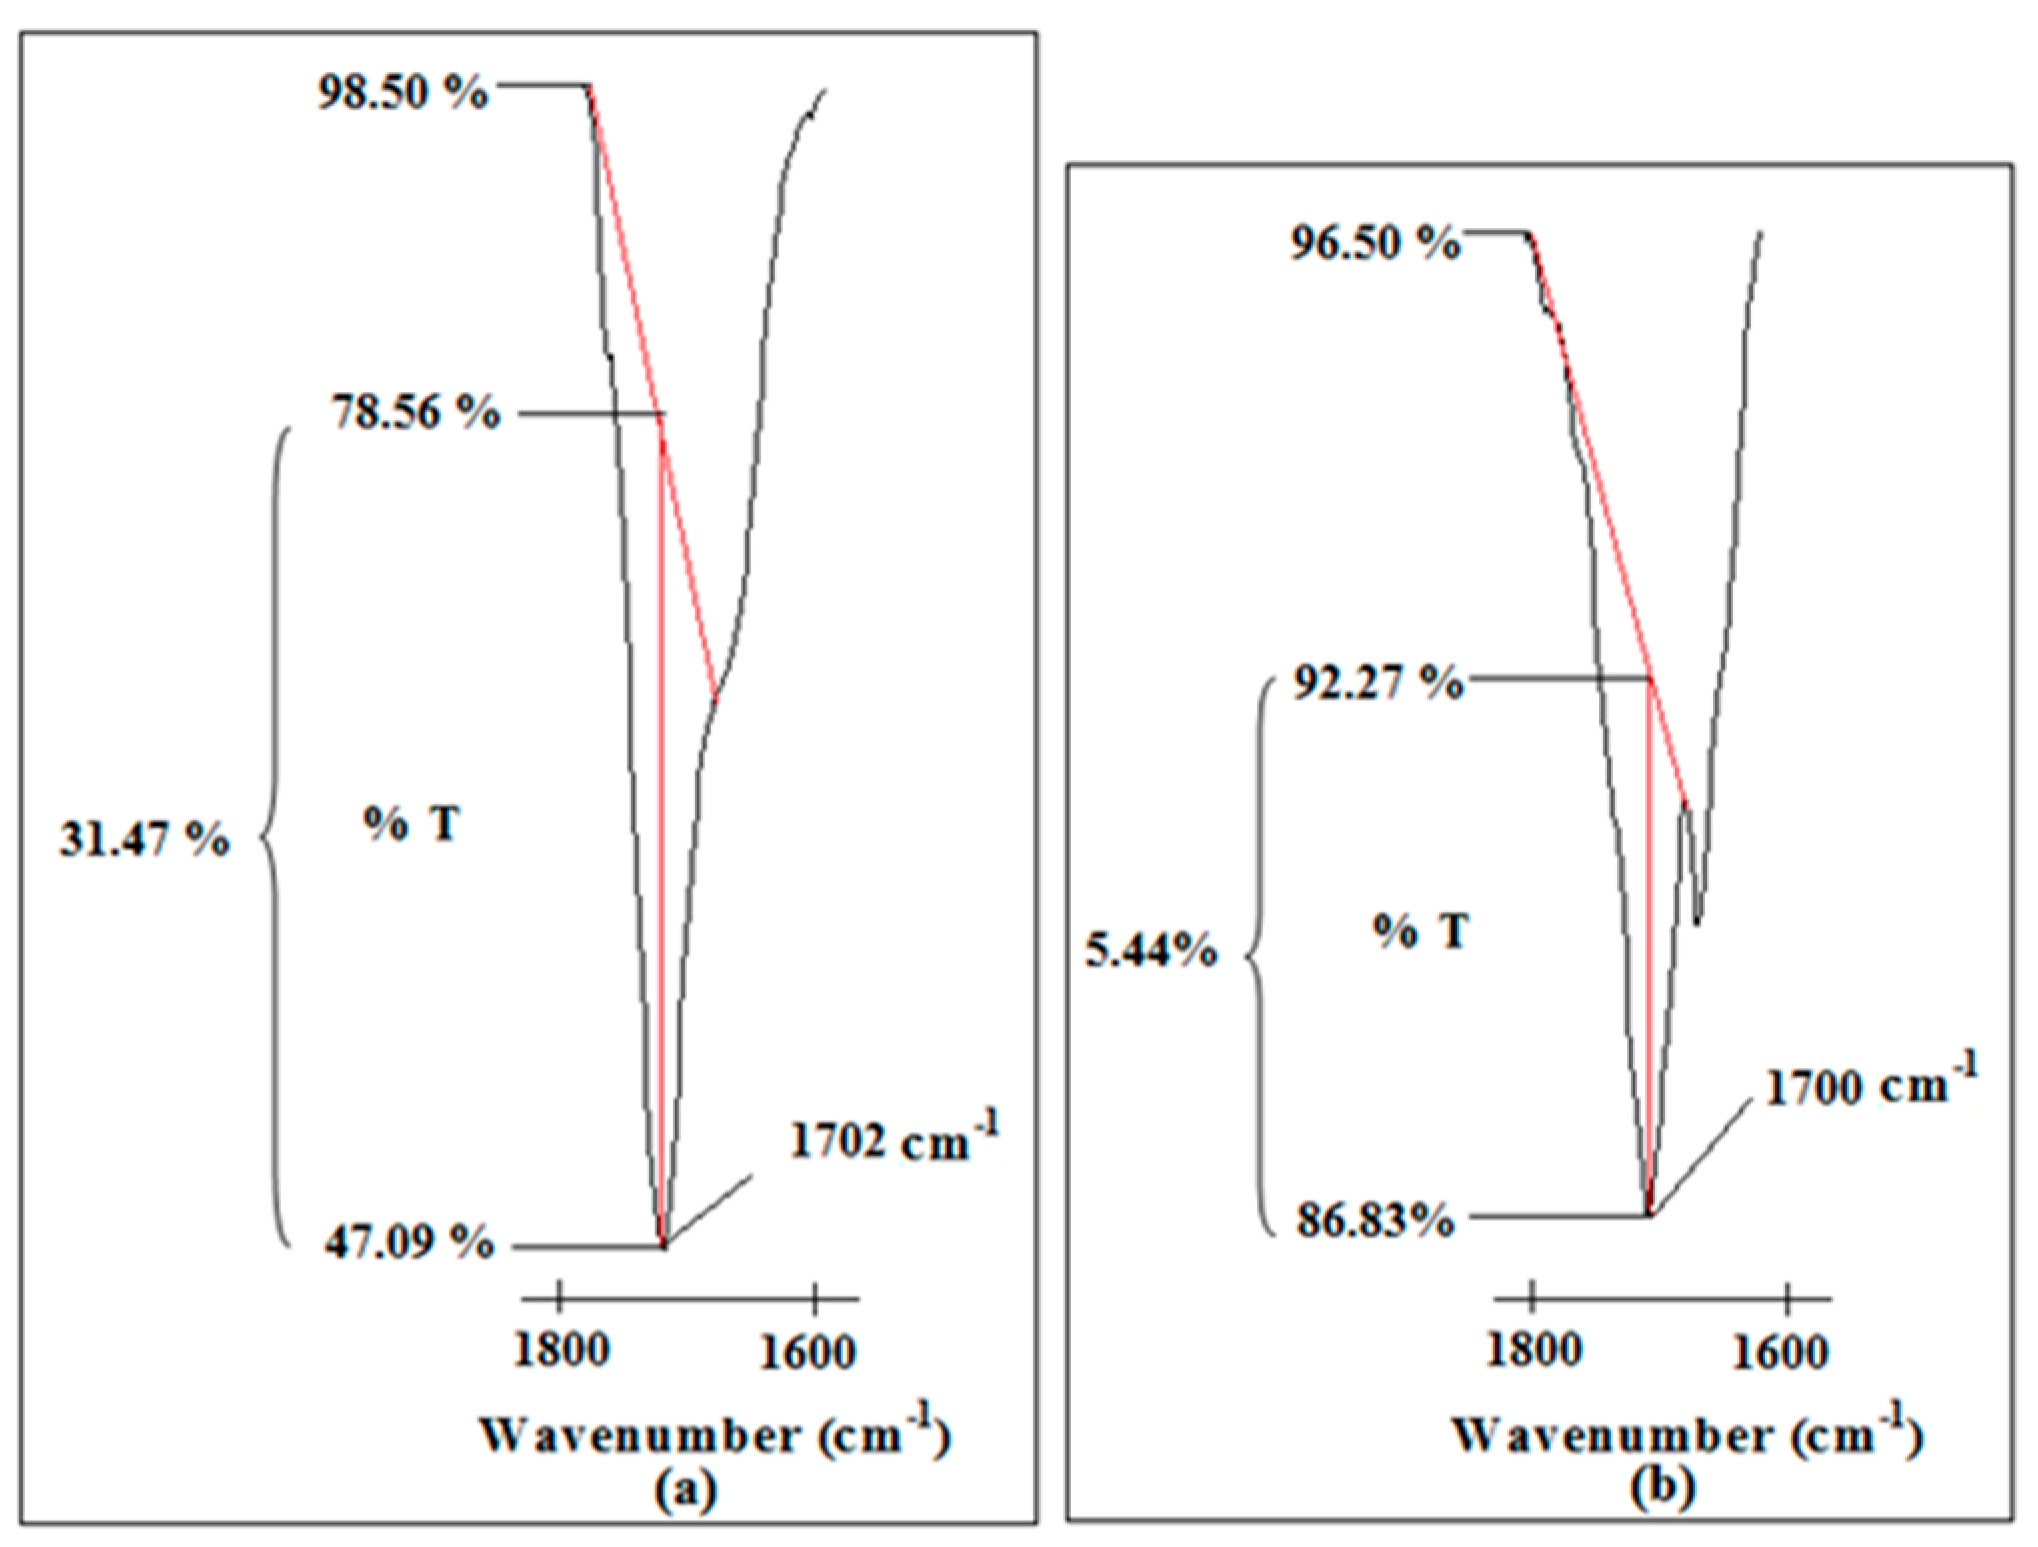
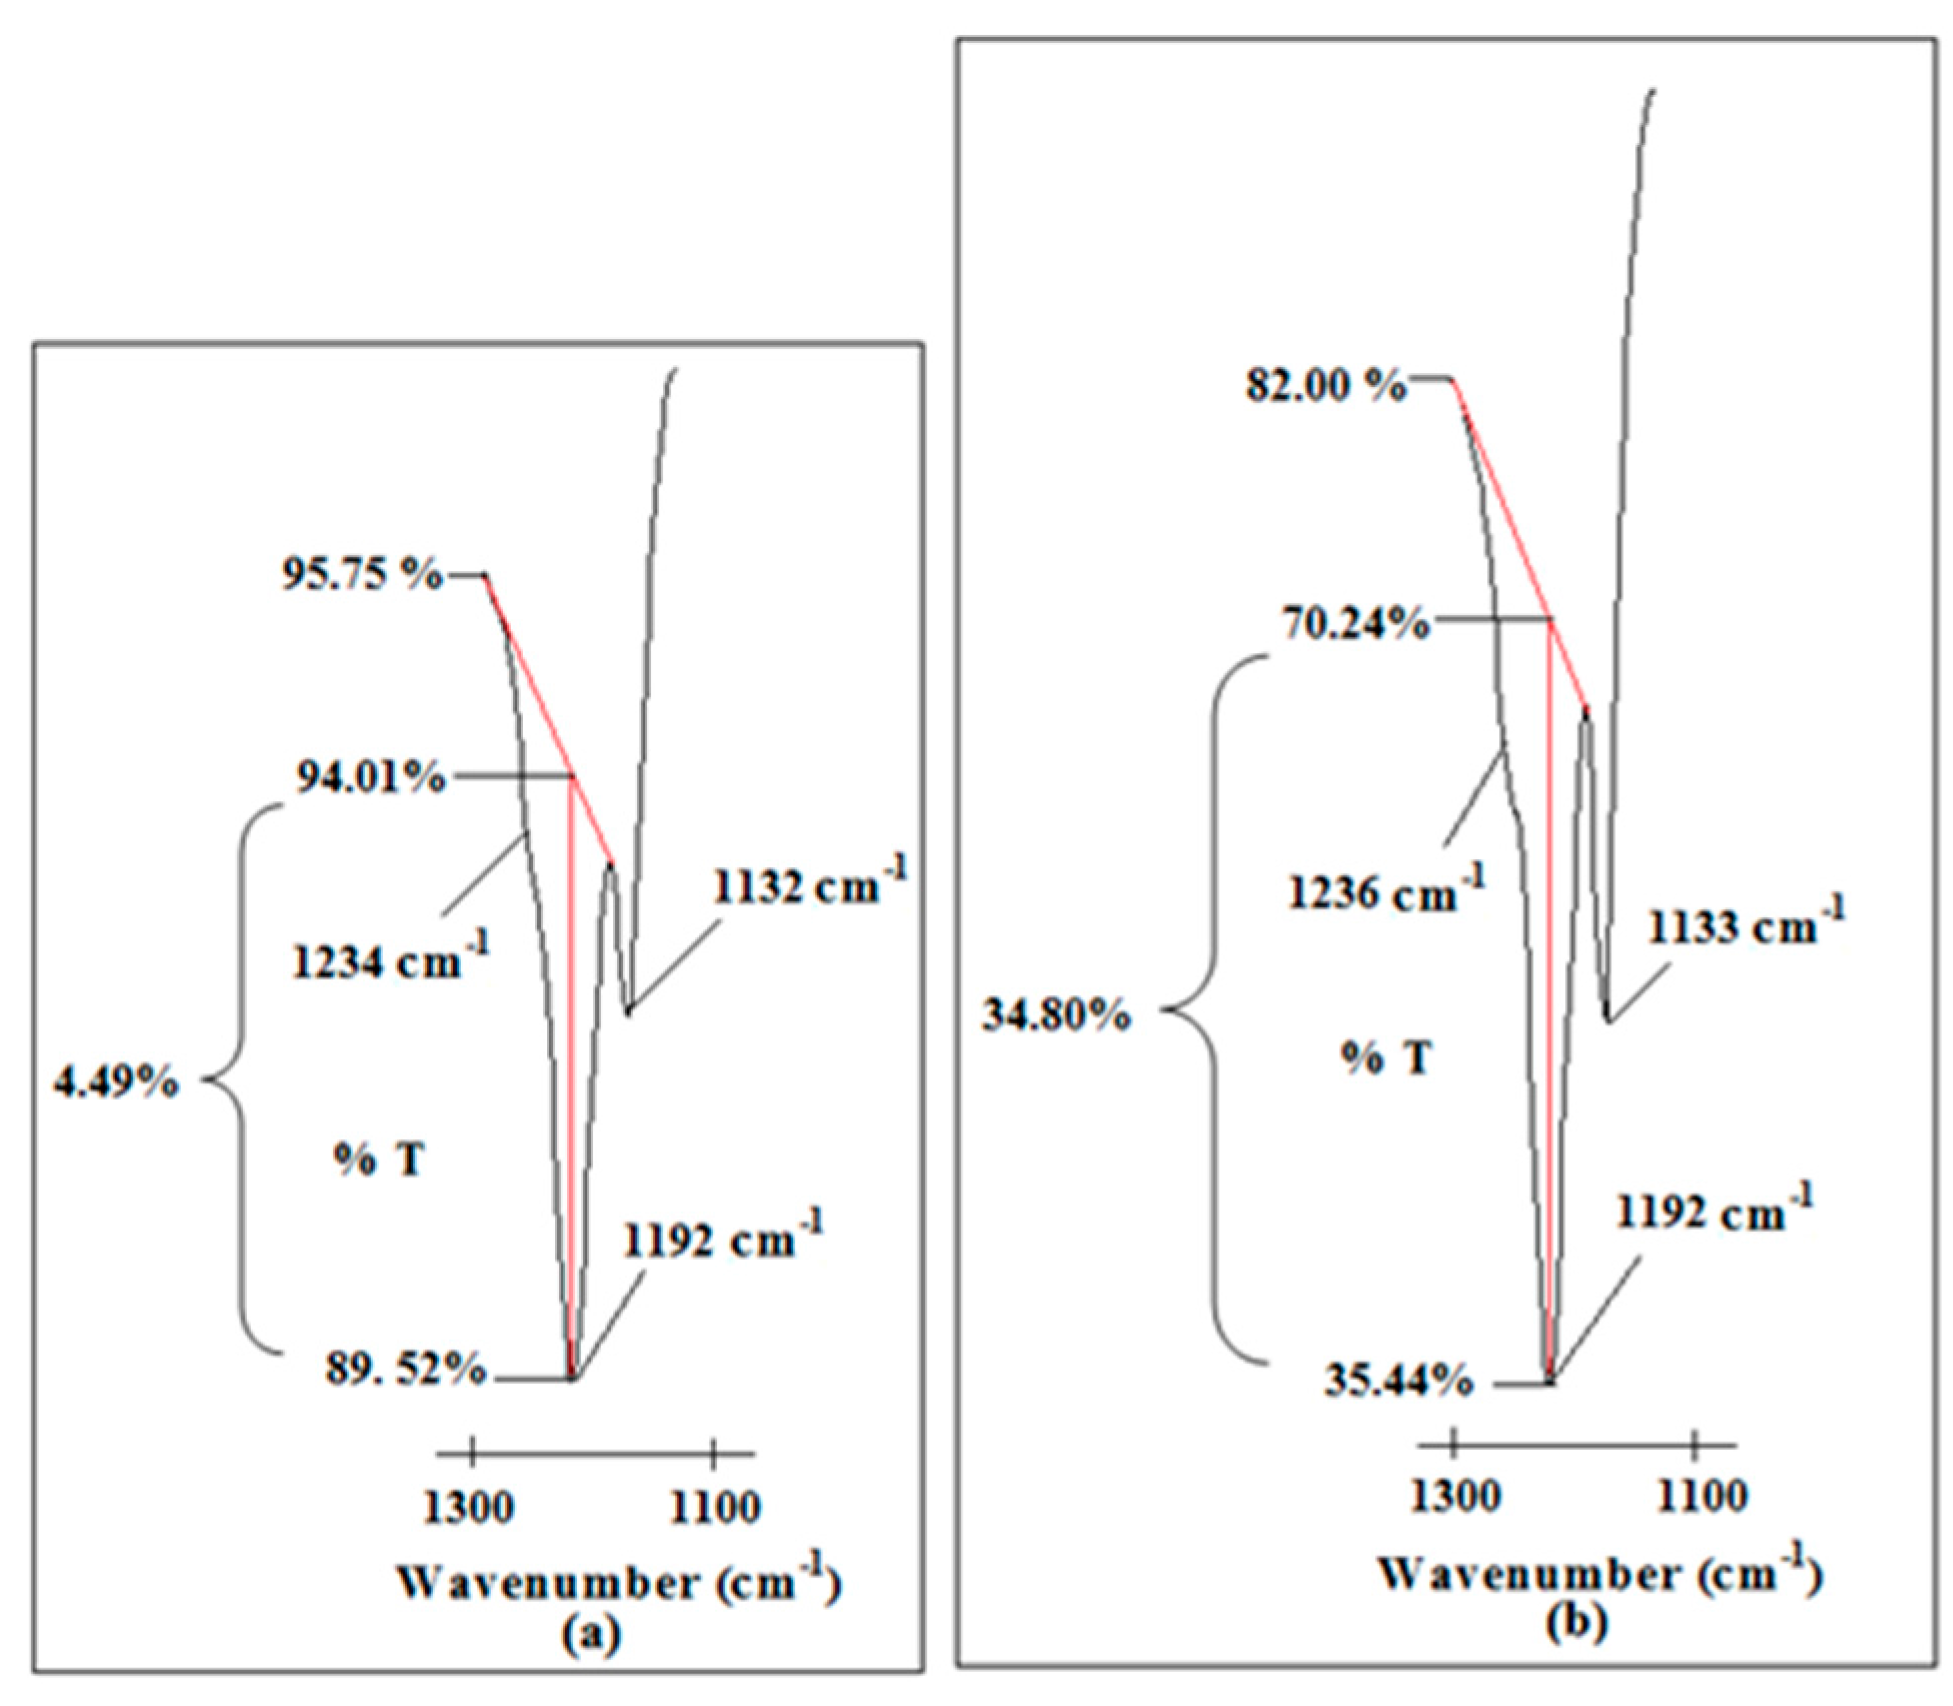
4.2. Attenuated Total Reflectance—Fourier Transform Infrared (ATR-FTIR)
- The deprotonation of the carboxylic group in PAA has taken place for the conduction mechanism;
- Ti 3 has more mobile TFSI anions than Ti 0 which leads to higher ionic conductivity.
4.3. Morphological Studies
4.4. Linear Sweep Voltammetry (LSV)
4.5. Cyclic Voltammetry (CV)
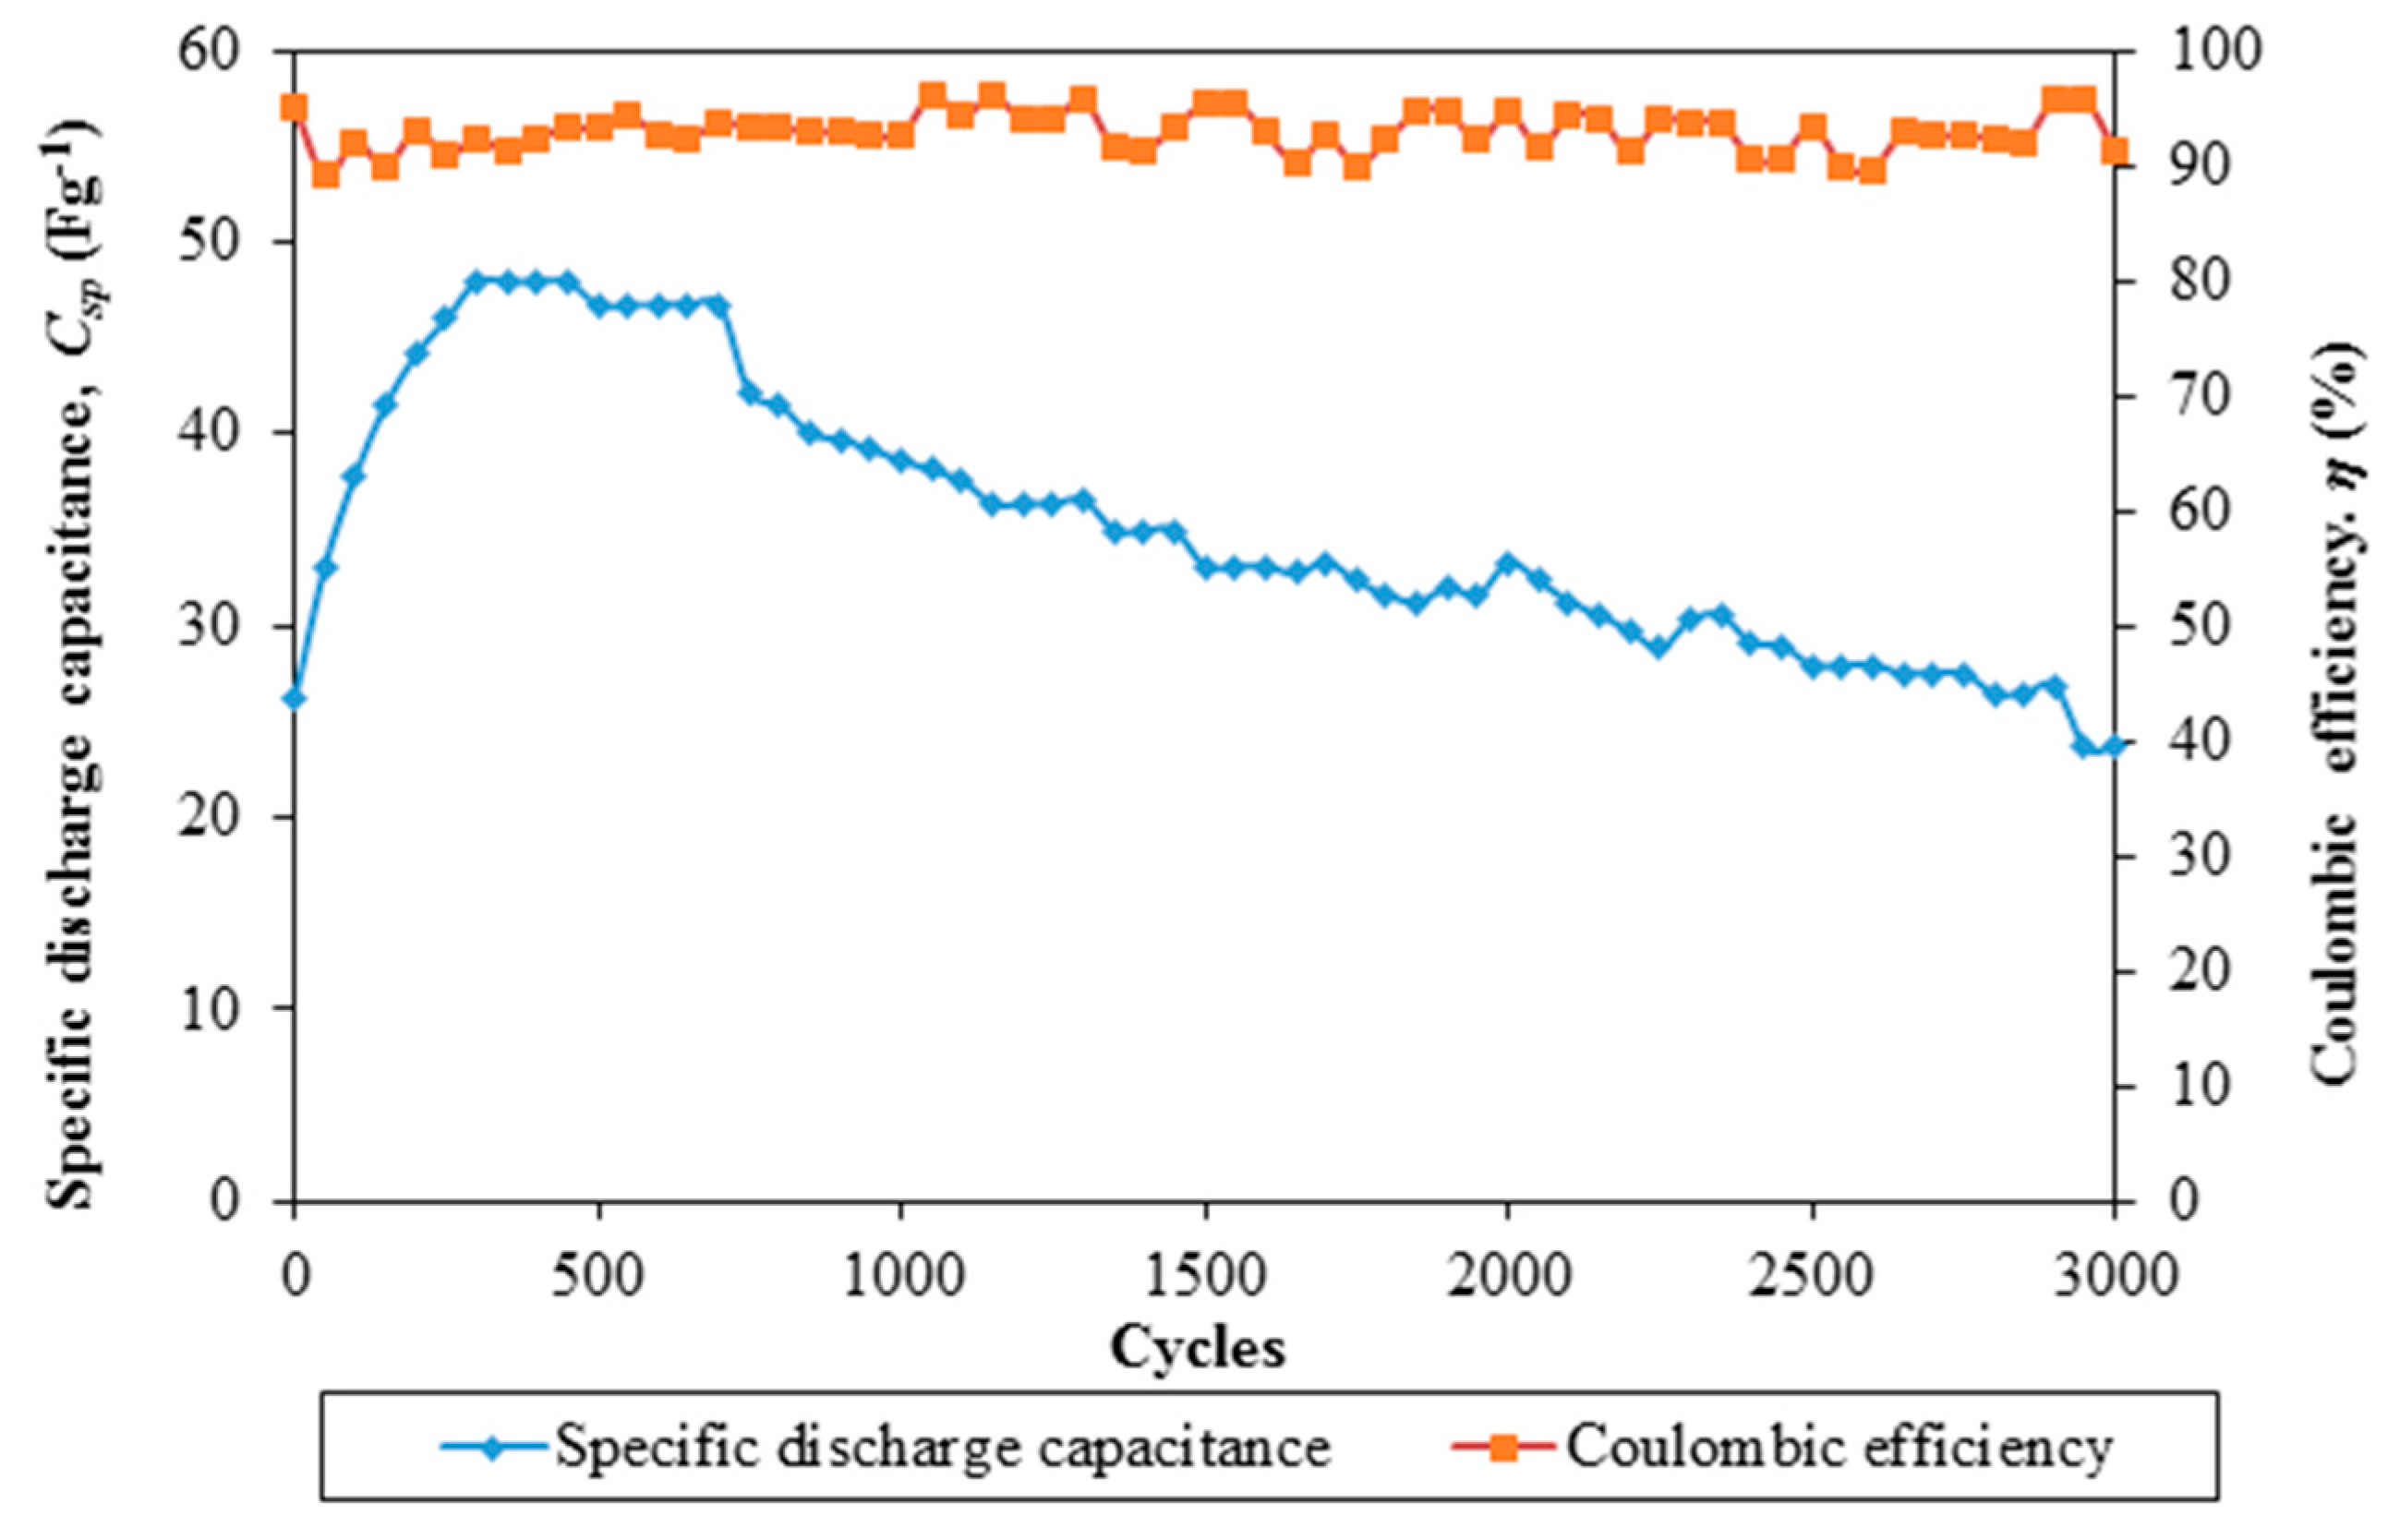
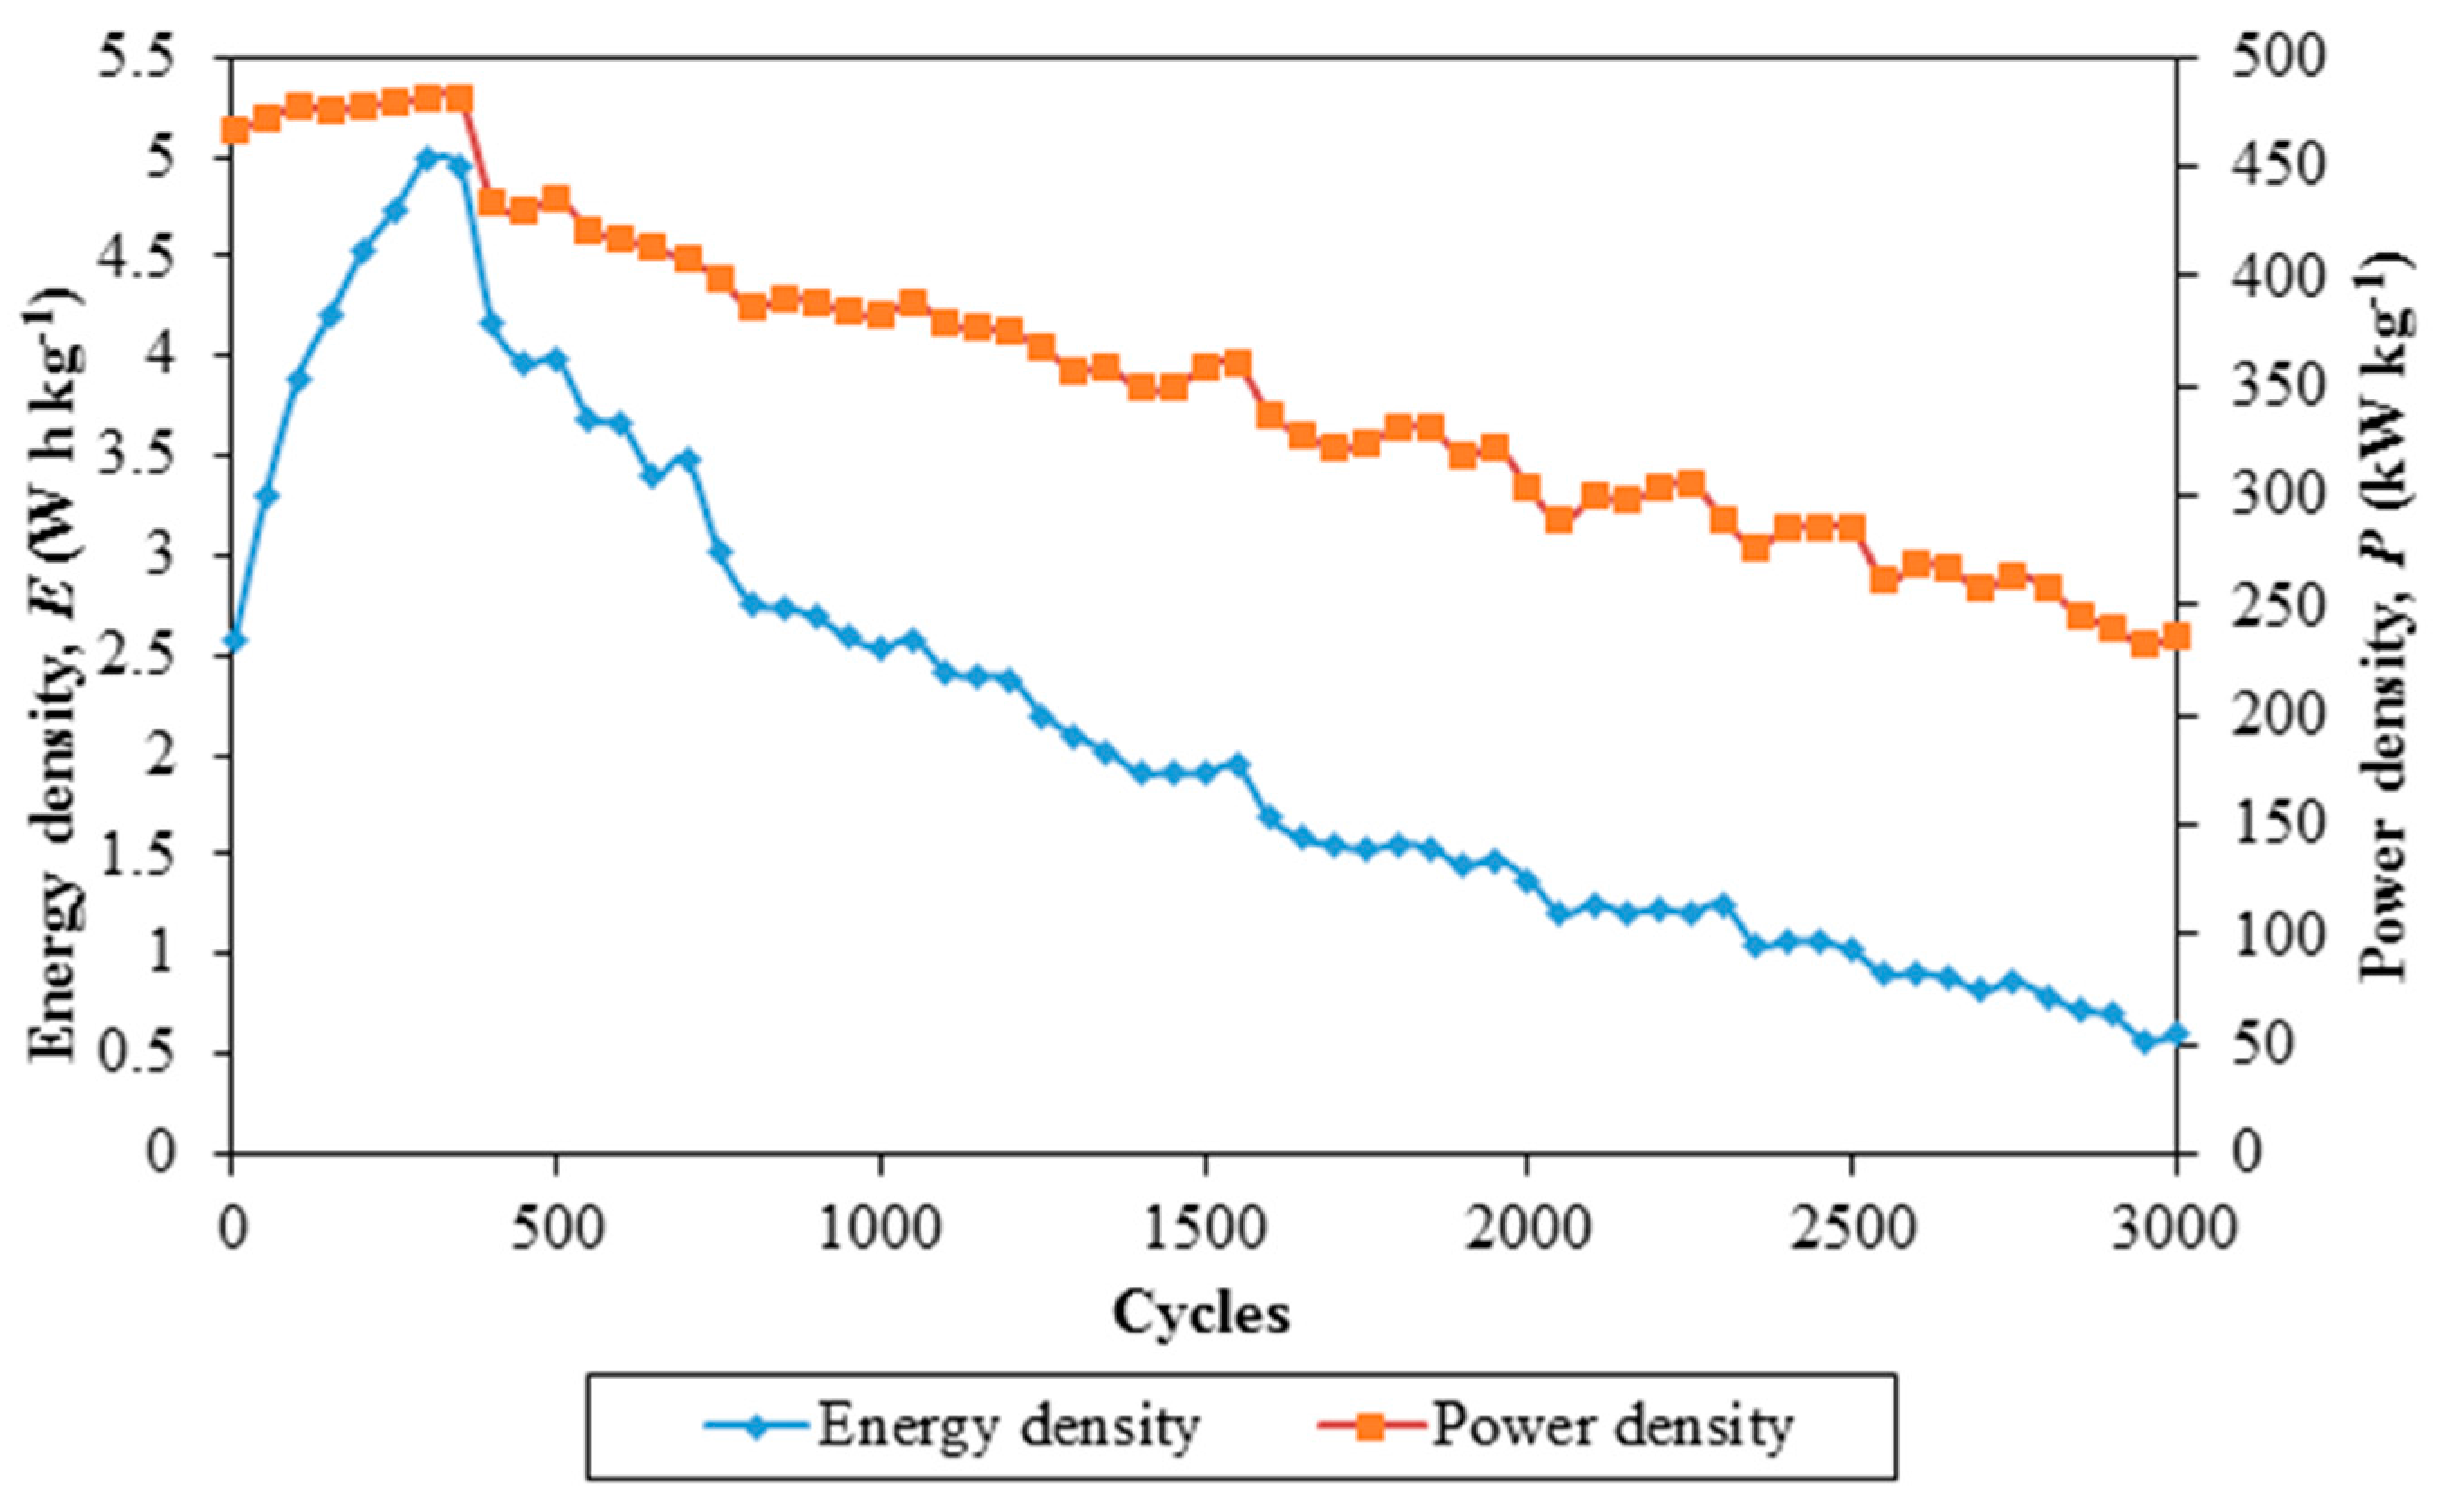
4.6. Galvanostatic Charge-Discharge Performance (GCD)
5. Conclusions
Acknowledgments
Author Contributions
Conflicts of Interest
References
- Adebahr, J.; Byrne, N.; Forsyth, M.; MacFarlane, D.R.; Jacobsson, P. Enhancement of ion dynamics in PMMA-based gels with addition of TiO2 nano-particles. Electrochim. Acta 2003, 48, 2099–2103. [Google Scholar] [CrossRef]
- Armand, M.B. Polymer electrolytes. Ann. Rev. Mater. Sci. 1986, 16, 245–261. [Google Scholar] [CrossRef]
- Gray, F.M. Solid Polymer Electrolytes: Fundamentals of Technological Applications, 1st ed.; Wiley-VCH: New York, NY, USA, 1991; pp. 1–30. [Google Scholar]
- Ramesh, S.; Liew, C.-W. Development and investigation on PMMA-PVC blend-based solid polymer electrolytes with LiTFSI as dopant salt. Polym. Bull. 2013, 70, 1277–1288. [Google Scholar] [CrossRef]
- Baskaran, R.; Selvasekarapandian, S.; Kuwata, N.; Kawamura, J.; Hattori, T. Structure, thermal and transport properties of PVAc-LiClO4 solid polymer electrolytes. J. Phys. Chem. Solids 2007, 68, 407–412. [Google Scholar] [CrossRef]
- Imrie, C.T.; Inkster, R.T.; Lu, Z.; Ingram, M. Discotic side group liquid crystal polymer electrolytes. Mol. Cryst. Liq. Cryst. 2004, 408, 33–43. [Google Scholar] [CrossRef]
- Rajendran, S.; Sivakumar, M.; Subadevi, R. Investigations on the effect of the various plasticizers in PVA–PMMA solid polymer blend electrolytes. Mater. Lett. 2004, 58, 641–649. [Google Scholar] [CrossRef]
- Krawiec, W.; Scanlon, L.G., Jr.; Fellner, J.P.; Vaia, R.A.; Vasudevan, S.; Giannelis, E.P. Polymer nanocomposites: A new strategy for synthesizing solid electrolytes for rechargeable lithium batteries. J. Power Sources 1995, 54, 310–315. [Google Scholar] [CrossRef]
- Samir, M.A.S.A.; Alloin, F.; Sanchez, J.-Y.; Dufresne, A. Nanocomposite polymer electrolytes based on poly(oxyethylene) and cellulose whiskers. Polím. Ciênc. Tecnol. 2005, 15, 109–113. [Google Scholar] [CrossRef]
- Jian-hua, T.; Peng-fei, G.; Zhi-yuan, Z.; Wen-hui, L.; Zhong-qiang, S. Preparation and performance evaluation of a Nafion-TiO2 composite membrane for PEMFCs. Int. J. Hydrogen Energy 2008, 33, 5686–5690. [Google Scholar] [CrossRef]
- Kim, K.M.; Park, N.-G.; Ryu, K.S.; Chang, K.S. Characterization of poly(vinylidenefluoride-co-hexafluoropropylene)–based polymer electrolytes filled with TiO2 nanoparticles. Polymer 2002, 43, 3951–3957. [Google Scholar] [CrossRef]
- Hammami, R.; Ahamed, Z.; Charradi, K.; Beji, Z.; Assaker, I.B.; Naceur, J.B.; Auvity, B.; Squadrito, G.; Chtourou, R. Elaboration and characterization of hybrid polymer electrolytes Nafion-TiO2 for PEMFCs. Int. J. Hydrogen Energy 2013, 38, 11583–11590. [Google Scholar] [CrossRef]
- Saikia, D.; Chen-Yang, Y.W.; Chen, Y.T.; Li, Y.K.; Lin, S.I. 7Li NMR spectroscopy and ion conduction mechanism of composite gel polymer electrolyte: A comparative study with variation of salt and plasticizer with filler. Electrochim. Acta 2009, 54, 1218–1227. [Google Scholar] [CrossRef]
- Yang, C.-C.; Chien, W.-C.; Li, Y.J. Direct methanol fuel cell based on poly(vinyl alcohol)/titanium oxide nanotubes/poly(styrene sulfonic acid) (PVA/nt-TiO2/PSSA) composite polymer membrane. J. Power Sources 2010, 195, 3407–3415. [Google Scholar] [CrossRef]
- Mei, A.; Wang, X.-L.; Feng, Y.-C.; Zhao, S.-J.; Li, G.-J.; Geng, H.-X.; Lin, Y.-H.; Nan, C.-W. Enhanced ionic transport in lithium lanthanum titanium oxide solid state electrolyte by introducing silica. Solid State Ion. 2008, 179, 2255–2259. [Google Scholar] [CrossRef]
- Boonsin, R.; Sudchanham, J.; Panusophon, N.; Sae-Heng, P.; Sae-Kung, C.; Pakawatpanurut, P. Dye-sensitized solar cell with poly(acrylic acid-co-acrylonitrile)–based gel polymer electrolyte. Mater. Chem. Phys. 2012, 132, 993–998. [Google Scholar] [CrossRef]
- Tang, Z.; Liu, Q.; Tang, Q.; Wu, J.; Wang, J.; Chen, S.; Cheng, C.; Yu, H.; Lan, Z.; Lin, J.; et al. Preparation of PAA-g-CTAB/PANI polymer based gel-electrolyte and the application in quasi-solid-state dye-sensitized solar cells. Electrochim. Acta 2011, 58, 52–57. [Google Scholar] [CrossRef]
- Shan, D.; Cheng, G.; Zhu, D.; Xue, H.; Cosnier, S.; Ding, S. Direct electrochemistry of hemoglobin in poly(acrylonitrile-co-acrylic acid) and its catalysis to H2O2. Sens. Actuat. B 2009, 137, 259–265. [Google Scholar] [CrossRef]
- Shaikh, J.S.; Pawar, R.C.; Tarwal, N.L.; Patil, D.S.; Patil, P.S. Supercapacitor behavior of CuO–PAA hybrid films: Effect of PAA concentration. J. Alloy. Compd. 2011, 509, 7168–7174. [Google Scholar] [CrossRef]
- Gu, X.; Wang, G. Interfacial morphology and friction properties of thin PEO and PEO/PAA blend films. Appl. Surf. Sci. 2011, 257, 1952–1959. [Google Scholar] [CrossRef]
- Yin, Z.; Cui, R.; Liu, Y.; Jiang, L.; Zhu, J.-J. Ultrasensitive electrochemical immunoassay based on cadmium ion-functionalized PSA@PAA nanospheres. Biosens. Bioelectron. 2010, 25, 1319–1324. [Google Scholar] [CrossRef] [PubMed]
- Dasenbrock, C.O.; Ridgway, T.H.; Seliskar, C.J.; Heineman, W.R. Evaluation of the electrochemical characteristics of a poly(vinyl alcohol)/poly(acrylic acid) polymer blend. Electrochim. Acta 1998, 43, 3497–3502. [Google Scholar] [CrossRef]
- Huang, J.; Guo, Q.; Ohya, H.; Fang, J. The characteristics of crosslinked PAA composite membrane for separation of aqueous organic solutions by reverse osmosis. J. Membr. Sci. 1998, 144, 1–11. [Google Scholar] [CrossRef]
- Shaikh, J.S.; Pawar, R.C.; Moholkar, A.V.; Kim, J.H.; Patil, P.S. CuO–PAA hybrid films: Chemical synthesis and supercapacitor behavior. Appl. Surf. Sci. 2011, 257, 4389–4397. [Google Scholar] [CrossRef]
- Ohya, H.; Shibata, M.; Negish, Y.; Guo, Q.H.; Choi, H.S. The effect of molecular weight cut-off of PAN ultrafiltration support layer on separation of water-ethanol mixtures through pervaporation with PAA-PAN composite membrane. J. Membr. Sci. 1994, 90, 91–100. [Google Scholar] [CrossRef]
- Moscoso-Londoño, O.; Gonzalez, J.S.; Muraca, D.; Hoppe, C.E.; Alvarez, V.A.; López-Quintela, A.; Socolovsky, L.M.; Pirota, K.R. Structural and magnetic behavior of ferrogels obtained by freezing thawing of polyvinyl alcohol/poly(acrylic acid) (PAA)-coated iron oxide nanoparticles. Eur. Polym. J. 2013, 49, 279–289. [Google Scholar] [CrossRef]
- Elliott, J.E.; Macdonald, M.; Nie, J.; Bowman, C.N. Structure and swelling of poly(acrylic acid) hydrogels: Effect of pH, ionic strength, and dilution on the crosslinked polymer structure. Polymer 2004, 45, 1503–1510. [Google Scholar] [CrossRef]
- Kang, X. Nonaqueous liquid electrolytes for lithium-based rechargeable batteries. Chem. Rev. 2004, 104, 4303–4417. [Google Scholar]
- Ramesh, S.; Lu, S.C. Effect of nanosized silica in poly(methyl methacrylate)-lithium bis(trifluoromethanesulfonyl)imide based polymer electrolytes. J. Power Sources 2008, 185, 1439–1443. [Google Scholar] [CrossRef]
- Kim, K.M.; Ko, J.M.; Park, N.-G.; Ryu, K.S.; Chang, S.H. Characterization of poly(vinylidenefluoride-co-hexafluoropropylene)-based polymer electrolyte filled with rutile TiO2 nanoparticles. Solid State Ion. 2003, 161, 121–131. [Google Scholar] [CrossRef]
- Arunmetha, S.; Manivasakan, P.; Karthik, A.; Babu, N.R.D.; Srither, S.R.; Rajendran, V. Effect of processing methods on physicochemical properties of titania nanoparticles produced from natural rutile sand. Adv. Powder Technol. 2013, 24, 972–979. [Google Scholar] [CrossRef]
- Huang, S.-Y.; Ganesan, P.; Popov, B.N. Electrocatalytic activity and stability of niobium-doped titanium oxide supported platinum catalyst for polymer electrolyte membrane fuel cells. Appl. Catal. B 2010, 96, 224–231. [Google Scholar] [CrossRef]
- Ekström, H.; Wickman, B.; Gustavsson, M.; Hanarp, P.; Eurenius, L.; Olsson, E.; Lindbergh, G. Nanometer-thick films of titanium oxide acting as electrolyte in the polymer electrolyte fuel cell. Electrochim. Acta 2007, 52, 4239–4245. [Google Scholar] [CrossRef]
- Dittmann, R.; Wintermantel, E.; Graule, T. Sintering of nano-sized titania particles and the effect of chlorine impurities. J. Eur. Ceram. Soc. 2013, 33, 3257–3264. [Google Scholar] [CrossRef]
- Mehta, M.; Raman, V.; Fox, R.O. On the role of gas-phase and surface chemistry in the production of titania nanoparticles in turbulent flames. Chem. Eng. Sci. 2013, 104, 1003–1018. [Google Scholar] [CrossRef]
- Ning, X.; Wang, X.; Yu, X.; Zhao, J.; Wang, M.; Li, H.; Yang, Y. Outstanding supercapacitive properties of Mn-doped TiO2 micro/nanostructure porous film prepared by anodization method. Sci. Rep. 2016, 6, 22634–22642. [Google Scholar] [CrossRef] [PubMed]
- Raghavan, N.; Thangavel, S.; Venugopal, G. Enhanced photocatalytic degradation of methylene blue by reduced graphene-oxide/titanium dioxide/zinc oxide ternary nanocomposites. Mater. Sci. Semicond. Process. 2015, 30, 321–329. [Google Scholar] [CrossRef]
- Bermudez, V.Z. Lithium-doped hybrid polymer electrolytes. In Polymer Electrolytes: Fundamentals and Applications; Sequeira, C., Santos, D., Eds.; Woodhead Publishing Limited: Cambridge, UK, 2010; pp. 176–218. [Google Scholar]
- Ahmad, S.; Deepa, M.; Agnihotry, S.A. Effect of salts on the fumed silica-based composite polymer electrolytes. Sol. Energ. Mater. Sol. Cells 2008, 92, 184–189. [Google Scholar] [CrossRef]
- Neira, A.; Tarraga, M.; Catalan, R. Degradation of polyacrylic acid by Fenton’s reagent. J. Chil. Chem. Soc. 2007, 52, 1314–1317. [Google Scholar] [CrossRef]
- Ali, A.M.M.; Yahya, M.Z.A.; Bahron, H.; Subban, R.H.Y.; Harun, M.K.; Atan, I. Impedance studies on plasticized PMMA-LiX [X: CF3SO3−, N(CF3SO2)2−] polymer electrolytes. Mater. Lett. 2007, 61, 2026–2029. [Google Scholar] [CrossRef]
- Jang, S.-R.; Choi, M.-J.; Vittal, R.; Kim, K.-J. Anchorage of N3 dye-linked polyacrylic acid to TiO2/electrolyte interface for improvement in the performance of a dye-sensitized solar cell. Sol. Energ. Mater. Sol. Cells 2007, 91, 1209–1214. [Google Scholar] [CrossRef]
- Bozkurt, A.; Meyer, W.H.; Wegner, G. PAA/imidazol-based proton conducting polymer electrolytes. J. Power Sources 2003, 123, 126–131. [Google Scholar] [CrossRef]
- Tiwari, I.; Singh, K.P.; Singh, M.; Banks, C.E. Polyaniline/polyacrylic acid/multi-walled carbon nanotube modified electrodes for sensing ascorbic acid. Anal. Method 2012, 4, 118–124. [Google Scholar] [CrossRef]
- Yuan, S.; Tang, Q.; He, B.; Yu, L. Conducting gel electrolytes with microporous structures for efficient quasi-solid-state dye-sensitized solar cells. J. Power Sources 2015, 273, 1148–1155. [Google Scholar] [CrossRef]
- Capiglia, C.; Imanishi, N.; Takeda, Y.; Henderson, W.A.; Passerini, S. Polyethylene oxide LiN(SO2CF2CF3)2 polymer electrolytes IV. Raman characterization. J. Electrochem. Soc. 2003, 150, A525–A531. [Google Scholar] [CrossRef]
- Pradeepa, P.; Edwinraj, S.; Ramesh Prabhu, M. Effects of ceramic filler in poly(vinyl chloride)/poly(ethyl methacrylate) based polymer blend electrolytes. Chin. Chem. Lett. 2015, 26, 1191–1196. [Google Scholar] [CrossRef]
- Goldshtein, K.; Golodnitsky, D.; Peled, E.; Adler-Abramovich, L.; Gazit, E.; Khatun, S.; Stallworth, P.; Greenbaum, S. Effect of peptide nanotube filler on structural and ion-transport properties of solid polymer electrolytes. Solid State Ion. 2012, 220, 39–46. [Google Scholar]
- Kumar, A.; Logapperumal, S.; Sharma, R.; Das, M.K.; Kar, K.K. Li-ion transport, structural and thermal studies on lithium triflate and barium titanate incorporated poly(vinylidene fluoride-co-hexafluoropropene) based polymer electrolyte. Solid State Ion. 2016, 289, 150–158. [Google Scholar]
- Aravindan, V.; Vickraman, P. Lithium fluoroalkylphosphate based novel composite polymer electrolytes (NCPE) incorporated with nanosized SiO2 filler. Mater. Chem. Phys. 2009, 115, 251–257. [Google Scholar]
- Pandey, G.P.; Kumar, Y.; Hashmi, S.A. Ionic liquid incorporated PEO based polymer electrolyte for electrical double layer capacitors: A comparative study with lithium and magnesium systems. Solid State Ion. 2011, 190, 93–98. [Google Scholar]
- Liew, C.-W.; Ramesh, S.; Arof, A.K. Characterization of ionic liquid added poly(vinyl alcohol)-based proton conducting polymer electrolytes and electrochemical studies on the supercapacitors. Int. J. Hydrogen Energy 2015, 40, 852–862. [Google Scholar]
- Lim, C.-S.; Teoh, K.H.; Liew, C.-W.; Ramesh, S. Capacitive behavior studies on electrical double layer capacitor using poly(vinyl alcohol)-lithium perchlorate based polymer electrolyte incorporated with TiO2. Mater. Chem. Phys. 2014, 143, 661–667. [Google Scholar]
- Teoh, K.H.; Lim, C.-S.; Liew, C.-W.; Ramesh, S. Electric double-layer capacitors with corn starch-based biopolymer electrolytes incorporating silica as filler. Ionics 2015, 21, 2061–2068. [Google Scholar]


| Sample designation | Weight percent of material (wt %) | Ionic conductivity (S·cm−1) | ||
|---|---|---|---|---|
| PAA | LiTFSI | TiO2 | ||
| Ti 0 | 70 | 30 | 0 | (1.04 ± 0.01) × 10−6 |
| Ti 1 | 68.6 | 29.4 | 2 | (2.88 ± 0.02) × 10−4 |
| Ti 2 | 67.2 | 28.8 | 4 | (4.04 ± 0.01) × 10−4 |
| Ti 3 | 65.8 | 28.2 | 6 | (8.36 ± 0.01) × 10−4 |
| Ti 4 | 64.4 | 27.6 | 8 | (4.65 ± 0.01) × 10−4 |
| Ti 5 | 63 | 27 | 10 | (3.22 ± 0.01) × 10−4 |
| Peak/band assignments | Wavenumber (cm−1) | References | |||
|---|---|---|---|---|---|
| PAA | LiTFSI | Ti 0 | Ti 3 | ||
| S–N stretching mode of LiTFSI | – | 745 | 743 | 738 | [39] |
| Combination of C–S stretching and S–N asymmetric stretching mode of LiTFSI | – | 804 | 794 | 791 | [39] |
| CH2 rocking mode of PAA | 799 | – | 794 | 791 | [40] |
| S–N–S asymmetric stretching mode of LiTFSI | – | 1,058 | 1,054 | 1,054 | [39] |
| C–CH2 stretching mode of PAA | 1,112 | – | – | – | [24] |
| Combination of C–F stretching mode and C–SO2 –N bonding mode of LiTFSI | – | 1,139 | 1,132 | 1,133 | [29,41] |
| –(C–O)H stretching mode of PAA | 1,169 | – | – | – | [42] |
| CF3 symmetric stretching mode of LiTFSI | – | 1,194 | 1,192 | 1,192 | [39] |
| C–O stretching coupled with O–H in-plane bending mode of PAA | 1,235 | – | 1,234 | 1,236 | [24,40] |
| S=O asymmetric stretching mode of LiTFSI | – | 1,322 | 1,320 | 1,315 | [41] |
| SO2 asymmetric stretching mode of LiTFSI | – | 1,357 | 1,346 | 1,341 | [39] |
| CH2 bonding mode of PAA | 1,416 | – | 1,417 | 1,419 | [42] |
| –COO− group of PAA | 1,453 | – | 1,455 | 1,457 | [24] |
| C=O bending mode of PAA | 1,514 | – | – | 1,517 | [43] |
| –COO− asymmetric stretching mode of PAA | 1,557 | – | – | 1,555 | [43,44] |
| C=O stretching mode of carboxylic group in PAA | 1,698 | – | 1,702 | 1,700 | [18,24,45,46] |
| sp3 C–H stretching mode of PAA | 2,855 and 2,945 | – | 2,866 and 2,942 | 2,880 and 2,941 | [24,39,42,45,46] |
© 2016 by the authors. Licensee MDPI, Basel, Switzerland. This article is an open access article distributed under the terms and conditions of the Creative Commons Attribution (CC-BY) license ( http://creativecommons.org/licenses/by/4.0/).
Share and Cite
Liew, C.-W.; Ng, H.M.; Numan, A.; Ramesh, S. Poly(Acrylic acid)–Based Hybrid Inorganic–Organic Electrolytes Membrane for Electrical Double Layer Capacitors Application. Polymers 2016, 8, 179. https://doi.org/10.3390/polym8050179
Liew C-W, Ng HM, Numan A, Ramesh S. Poly(Acrylic acid)–Based Hybrid Inorganic–Organic Electrolytes Membrane for Electrical Double Layer Capacitors Application. Polymers. 2016; 8(5):179. https://doi.org/10.3390/polym8050179
Chicago/Turabian StyleLiew, Chiam-Wen, H.M. Ng, Arshid Numan, and S. Ramesh. 2016. "Poly(Acrylic acid)–Based Hybrid Inorganic–Organic Electrolytes Membrane for Electrical Double Layer Capacitors Application" Polymers 8, no. 5: 179. https://doi.org/10.3390/polym8050179
APA StyleLiew, C.-W., Ng, H. M., Numan, A., & Ramesh, S. (2016). Poly(Acrylic acid)–Based Hybrid Inorganic–Organic Electrolytes Membrane for Electrical Double Layer Capacitors Application. Polymers, 8(5), 179. https://doi.org/10.3390/polym8050179