1. Introduction
The density of charges along a polyelectrolyte chain makes the chain conformation sensitive to electrolytes. The two most efficient strategies to control changes in polyelectrolyte conformation are the screening of electrostatic interactions among charged polymer segments by adding an inert salt [
1] and the neutralization of charges on the polyelectrolyte chain by adding specifically-interacting counterions [
2,
3]. Synthetic polyelectrolytes may, therefore, be used as simple models for biopolymers, where the role of electric charges is essential for the proper functioning of nucleic acids, numerous enzymes, and proteins.
Theoretical understanding of the mechanism underlying the impact of specifically-interacting cations has made significant progress. To give but an example, the shape of the anionic polyacrylate coils gradually changes from a coil to a compact sphere with increasing electrostatic discharging via binding of specifically-interacting alkaline earth cations, thereby passing a cascade of transition states. For these transition states cigar-like or pearl necklace structures are discussed. The latter were predicted in analogy to the Rayleigh instability of oil droplets while being electrically charged [
4,
5]. Beyond all doubt, the actual shape depends, in a subtle way, on the counterion concentration and interactions between solvent and chain backbone [
4,
5,
6,
7,
8,
9,
10]. Although, the pearl necklace model has attracted much attention [
11,
12,
13,
14,
15], a quantitative analysis of the collapsed domains is still lacking.
Some progress in this direction could be achieved with anomalous small-angle X-ray scattering (ASAXS). ASAXS enables the structural characterization of the counterion distribution around the macroions and a quantitative estimation of the amount of condensed counterions by tuning the energy in the vicinity of the absorption edge of the counter ion in question. The distribution of the counterions is not accessible by conventional SAXS measurements, because the scattering contributions of the counterions and the macroions superimpose and cannot be distinguished. The first ASAXS experiments of counterion distributions were reported by Stuhrmann [
16] and more recent results are published in [
15,
17,
18,
19,
20,
21,
22,
23,
24,
25]. In several of those studies sodium polyacrylate (NaPA) chains were subjected to the addition of two different divalent cations [M
2+] with M
2+ equal to Sr
2+ or Pb
2+ as two examples for the impact of specifically interacting cations on the conformation and solubility of NaPA chains. The specifically interacting M
2+ cations form complex bonds with the anionic carboxylate residues, located on every other carbon atom of the polymer backbone. Formation of complex bonds between the anionic groups and the M
2+ cations neutralizes electric charges and thereby changes the nature of the respective chain segments. As a consequence, the solubility of the polyelectrolyte is lowered which leads to a significant coil shrinking and eventually causes a precipitation of the respective M
2+-salt [
2,
3,
14,
15]. Noteworthy, the studies where NaPA chains have been subjected to the addition of Sr
2+ or Pb
2+ revealed a degree of decoration of the NaPA chains, which remained below the expected value with a larger discrepancy in case of Pb
2+-PA [
23,
24]. Whereas, in the case of the Sr
2+ cationss ASAXS suggested a percentage of neutralization of the COO
− groups of 20%–33% compared to the anticipated value of 50% [
23], the apparent degree of neutralization suggested by ASAXS in case of Pb
2+ was only 5%–10% compared to an expected value close to 30% [
24].
In order to shed further light on the validity of quantitative ASAXS, in general, and on this discrepancy, in particular, a combined SANS and ASAXS investigation has been performed on the behavior of NaPA chains, subjected to the addition of divalent Pb
2+ cations as the specifically-interacting cation. As has just been mentioned, the Pb
2+ cations showed a particularly large discrepancy between anticipated amount of Pb
2+ cations and the respective amount recovered by ASAXS. In the present study, D
2O has been used as solvent in order to enable a combined small angle neutron scattering (SANS) and SAXS study. SANS at the same sample where ASAXS is carried out shall provide an independent access to the shape of the collapsing NaPA coil with a focus on the organic matrix, hosting the lead cations. Accordingly, we expect to get a detailed picture on the size and shape of the “confinement”, which are formed by the collapsing NaPA coils and which serve as containers for the condensing Pb
2+ cations. The amount of Pb
2+ cations in solution is selected to create samples close to the precipitation threshold of Pb
2+-PA, as under such conditions intermediates with a significant degree of collapse are achieved. Deduction of the amount of Pb
2+ in the collapsed phase is inferred from ASAXS by a precise analysis of what has been introduced as the resonant-invariant (RI) in a former publication [
23]. The concentrations of Pb
2+ ions in the condensed phase deduced accordingly from the ASAXS measurements are compared to Monte Carlo simulations.
Anomalous Small-Angle X-Ray Scattering
The remarkable possibilities of the ASAXS techniques are based on the energy dependence of the atomic scattering factors giving selective access to the specific SAXS contributions of nano-scaled phases, which are built up by different chemical constituents for instance clouds of Pb
2+-counterions, which surround negatively-charged polyacrylate chains. In general, the atomic scattering factors are energy dependent complex quantities:
where
Z represents the atomic number. When performing ASAXS measurements on Pb
2+counterions in the vicinity of the L
III-absorption edge of Pb at 13,035 eV the scattering amplitude is:
where
q is the magnitude of the scattering vector
,
is the scattering angle, λ the X-ray wavelength and
V is the irradiated sample volume.
are the differences of electron densities of the non-resonant scattering monomer units of the polyacrylates and the resonant scattering Pb
2+counterions respectively:
where
is the electron density of the entire solution. The volume
represents the volume of the non-resonant scattering monomer unit and
corresponds to the volume of the resonant scattering Pb
2+ ion. The functions
are the number densities of monomer units, specified in more detail below, and of Pb
2+ ions representing the respective spatial distribution in the sample. The monomeric scattering factor,
, is nearly energy independent, while the atomic scattering factor,
, shows a strong variation with the energy in the vicinity of the L
III-absorption edge of the resonant scattering Pb due to the so-called anomalous dispersion corrections
. Calculating the scattering intensity
by means of Equations (2)–(3), and averaging over all orientations, yields the sum of three basic scattering contributions [
16]:
with:
and:
Equation (5) gives the non-resonant scattering, , the cross-term or mixed-resonant scattering, , originating from the superposition of the scattering amplitudes of the non-resonant polyacrylates, and the resonant scattering Pb2+ ions and finally, , which contains only the scattering contributions of the resonant scattering Pb2+ ions. and in Equation (6) represent the squared scattering amplitudes averaged over all orientations (Debye), which depend only on the number density distributions of the monomers and the Pb2+-counterions, respectively, thereby liberated from their contrast with respect to the solvent. In analogy Re(AM(q)APb(q)) denotes the (averaged) superposition of the scattering amplitudes of the monomer and the Pb2+-counterions.
When solving the vector equation constituted by ASAXS measurements at a minimum of three energies by the Gaussian elimination procedure, the form factor
can be determined in analytical form [
15,
23,
24,
25,
26,
27]:
where
F(E1,
E2,
E3) represents a normalization factor composed of the anomalous dispersion corrections at the respective three energies
E1,
E2,
E3. A comprehensive description of the mathematical details can be found in [
28].
is the Fourier transform of the pair correlation function of the resonant scattering Pb2+-counterions. Thus, Equation (7) provides direct access to the small-angle scattering of Pb2+ ion assemblies and, along with it, structural information on the distribution of the Pb2+-counterions. More generally spoken, Equation (7) provides a method, which gives access to the pure-resonant scattering contribution of the Pb2+-counterions by measuring the small-angle scattering at only three suitable energies.
In addition to the structural information, which can be obtained from
, important quantitative information related to the amount of inhomogeneously-distributed Pb
2+ ions can be deduced from the integral [
23]:
In analogy to the so-called invariant [
29,
30], we will call
the resonant-invariant (RI) of the inhomogeneously-distributed resonant scattering Pb
2+ ions. The RI, as defined in Equation (8), is related to the number density of inhomogeneously-distributed Pb
2+ ions,
, as was outlined in detail in [
23,
27,
31,
32]:
where
r0 is the classical electron radius and the volume of the Pb
2+ ions
is estimated with the ion radius
RPb. Due to the integral in the square root, Equation (9) provides the quantitative analysis of concentration fluctuations of the chemical species Pb
2+, independent of its spatial distribution. As indicated by the upper integration limit in Equation (9) the integral is extended up to
qSAXS, which is predefined by the setup of the SAXS experiment. In order to analyze the systematic limitations introduced by
qSAXS when determining the chemical concentrations Monte-Carlo calculations (MC) have been performed. The MC calculations were designed to simulate the scattering of Pb
2+ ions confined in a small volume predetermined by the shrinking polyacrylate coils and suggested experimentally by our SAXS and SANS analyses of the respective samples (see below). Specifically, we have adopted cube-like containers to model the collapsed subdomains in the shrinking Pb
2+-PA coils. As a result, simulated scattering curves are received, which are processed with Equation (9) in an analogous way as our experimental ASAXS curves. Up to degrees of filling (volume fractions) of 50% only one of the two solutions in Equation (9) is significant
i.e. the one with the negative sign. Beyond 50% the calculated values estimate only the lower limit, which is obtained by extrapolation of Equation (9) to higher degrees of filling by using the negative sign. The positive sign over estimates strongly the concentrations and is not further considered.
In order to scrutinize to which extent such application of Equation (9) recovers the true amount of Pb
2+ ions in the confinements this true value,
i.e. the true invariant has to be known. The true invariant is given by all photons scattered in all directions in space (and not only recorded by the limited solid angle of the detector). This true invariant is accessible for our present simulations and calculated as follows. The scattering deduced from the MC calculations is extended over the “entire reciprocal space”, defined by the wavelength of the (A)SAXS experiment under consideration and by the maximum scattering angle (2θ = 180°). In our present experiment the wavelength is predefined by the energy of the L
III-absorption edge of Pb (13,035 eV) to λ = 0.091 nm which results in a maximum value of
qmax = 136 nm
−1 for an integration which is the “entire reciprocal space”. Integration of the scattering cross-section accordingly provides the true invariant,
Qmax, which is directly related to the number
N of Pb ions per cubic-like confinement:
with
and
VP the volume of the confinement (for details see
Supplementary Materials). (A)SAXS experiments are restricted to a limited
q-range
qSAXS and by no means cover the above introduced “entire reciprocal space”. Thus, Equation (10) cannot be used for the calculation of chemical concentrations because it is valid only if the integration of the scattering cross sections is extended over the entire q-space limited by
qmax. This q-space is inevitably much larger than that covered by
qSAXS. However, the chemical concentrations of inhomogeneously-distributed Pb
2+ ions can be estimated from scattering curves in the limited SAXS regime by means of Equation (9) which is based on Porod’s theory [
30]. Porod assumed, that only sample inhomogeneities established by deviations from the average scattering length density contribute to the scattering in the SAXS regime. A detailed derivation of Equation (9) was outlined in [
23].
In case of the ASAXS experiments the degree ε to which the amount of Pb
2+ ions in the confinement is recovered by Equation (9) in the limited
q-range of 0 nm
−1 ≤
q ≤
qSAXS can be deduced from the ratio of
given in Equation (9) and N as defined in Equation (10) with the 2nd term in the bracket vanishing while integrating up to
qmax:
For Kratky curves from MC simulations, the ratio ε can be calculated alternatively by numerically integrating these Kratky curves up to the limit of qmax.
2. Materials and Methods
NaNO3 and Pb(NO3)2 of analytical grade were purchased from Fluka, (Buchs, Switzerland), NaOD (40% w/w in D2O) was purchased from Sigma-Aldrich (Taufkirchen, Germany) and the sodium polyacrylate standard P585 was purchased from Polymer Standards Service (Mainz, Germany). D2O from Deutero GmbH (Kastellaun, Germany) was used without further purification.
The pH value of a solution of 0.1 M NaNO
3 in D
2O was set to 9 using 0.1 M NaOD in D
2O. A stock solution of the NaPA standard was prepared in 0.1 M NaNO
3 as solvent and gently mixed for three days. Another stock solution was prepared containing 5 mM Pb(NO
3)
2 and 90 mM NaNO
3 in D
2O. Both stock solutions were used to prepare the samples FRM01 and FRM02 for the small angle scattering experiments by mixing appropriate amounts of the 0.1 M NaNO
3 solution, the NaPA stock solution, and the stock solution containing the lead ions. The composition of the two samples can be taken from
Table 1.
The ASAXS measurements were carried out at the beam line B1 (former JUSIFA) at HASYLAB, DESY Hamburg [
33,
34] using a double-crystal (Si-311) monochromator with an energy resolution of about
covering a
q-range between 0.06 and 2.5 nm
−1 at three energies in the vicinity of the L
III-absorption edge of Pb at 13035 eV.
Table 2 provides the anomalous dispersion corrections for Pb at the three energies used here based on the calculations of Cromer and Liberman [
35,
36]. The scattering patterns have been detected with a 300 k Pilatus detector (DECTRIS, Baden-Daettwil, Switzerland). All scattering patterns have been normalized and corrected for background and transmission. The scattering of the solvent was subtracted from the sample scattering. Transmission measurements were performed with a precision better than 10
−4 using a special (windowless) photodiode (Hamamatsu S2387-1010N, Hamamatsu, Japan). The scattering intensity was calibrated into an absolute macroscopic scattering cross section in units of cross-section per unit volume [cm
2/cm
3] = [cm
−1] by use of the JUSIFA reference (glassy carbon) standards. The ASAXS sequences covering three energies followed the JUSIFA standard procedures
i.e. repeating the whole sequence several times with subsequent averaging [
27]. The two samples selected for ASAXS as well as the solvent were filled into capillaries from Hilgenberg GmbH (Malsfeld, Germany). The capillaries are made of borosilicate glass with an inner diameter of 2 mm and a wall thickness of 0.05 mm. The capillaries were closed with a pipette plug fixed by two-component quick setting adhesive.
The SANS measurements have been performed at the Jülich Center for Neutron Science (JCNS) with the beam line KWS-2 at the FRM II (Forschungsreaktor München of the Technische Universität München, Garching, Germany) [
37]. The samples were filled in standard Helma cells with a thickness of 2 mm and have been exposed to a neutron beam of wavelength 0.7 nm at sample detector distances of 2, 8, and 20 m. Along with the sample solvent measurements have been performed using 0.1 M NaNO
3 in D
2O.
3. Results
Figure 1 compares the scattering curves obtained from SAXS for samples FRM01 and FRM02 (a) with SANS experiments performed with sample FRM02 (b). All curves have in common that they indicate a shallow shoulder in the regime of 0.5 nm
−1 <
q < 1 nm
−1, which suggests the occurrence of dense domains in the order of magnitude of a few nanometers. In agreement with our preceding experiments on the same system [
24], the present data confirms the existence of partially collapsed intermediate states of the polyacrylate chains. The collapse is induced by the binding of Pb
2+ ions, which generates densely packed pearl-like subdomains in the chain, interconnected by string-like non-collapsed chain segments. The total scattering curves from SAXS show slight differences for the two samples. The scattering curve of FRM02, which is closer to the phase boundary, reveals a larger scattering cross-section in the low
q-regime and, in parallel, a distinct
q−4-behavior (Porod) at larger
q-values indicating that the formation of collapsed phases is more evolved when compared to FRM01.
In order to analyze the samples in terms of structurally characteristic parameters more quantitatively, we applied the same model as introduced in [
24]. The model is a chain of m freely-jointed rod-like monomers each of bond length
l, which includes
n equally-spaced spheres of radius R, with any two neighboring spheres separated by
m/(
n−1) rod-like monomers. The model is, hereafter, denoted as a freely-jointed chain pearl necklace (FJC-PN). The spheres represent the collapsed subdomains and the freely jointed chain segments the interconnecting strings. Potential polydispersity of the pearls is accounted for by a Schulz–Zimm distribution of the sphere volume (see model-2 in [
24]). The model fits qualitatively reproduce the total SAXS curves and are particularly satisfactory in the regime of 0.2 nm
−1 <
q < 2 nm
−1 From the fit curves radii between 2.6 and 3.4 nm for the collapsed domains have been deduced with less than five pearls correlating in a volume of about 30 nm size, offered by the partially collapsed polyacrylate chain.
Figure 1b summarizes the results obtained from SANS measurements of FRM02 only because the data quality of FRM01 is not sufficient for a further interpretation. For comparison we have plotted the fit curve of the FJC-PN model obtained from SAXS via scaling into the SANS curve of FRM02 (solid line). Interestingly the FJC-PN model reproduces the SANS curve over one order in magnitude of the q-range between 0.1 and 2 nm
−1. An explanation will be given in the discussion.
Figure 1a also compiles the results of the SAXS curves measured at three different X-ray energies in the vicinity of the L
III-absorption edge of Pb at 13035 eV of NaPA in D
2O. From Equation (7) the form factor of the pure-resonant scattering was calculated (symbols with the label “pure”). The solid lines running through the symbols represent the self-term of the pearls from the FJC-PN-model scaled to the form factor of the pure-resonant scattering. This nicely confirms that the scattering of the Pb
2+ ions is perfectly reproduced by the pearl-like collapsed subdomains.
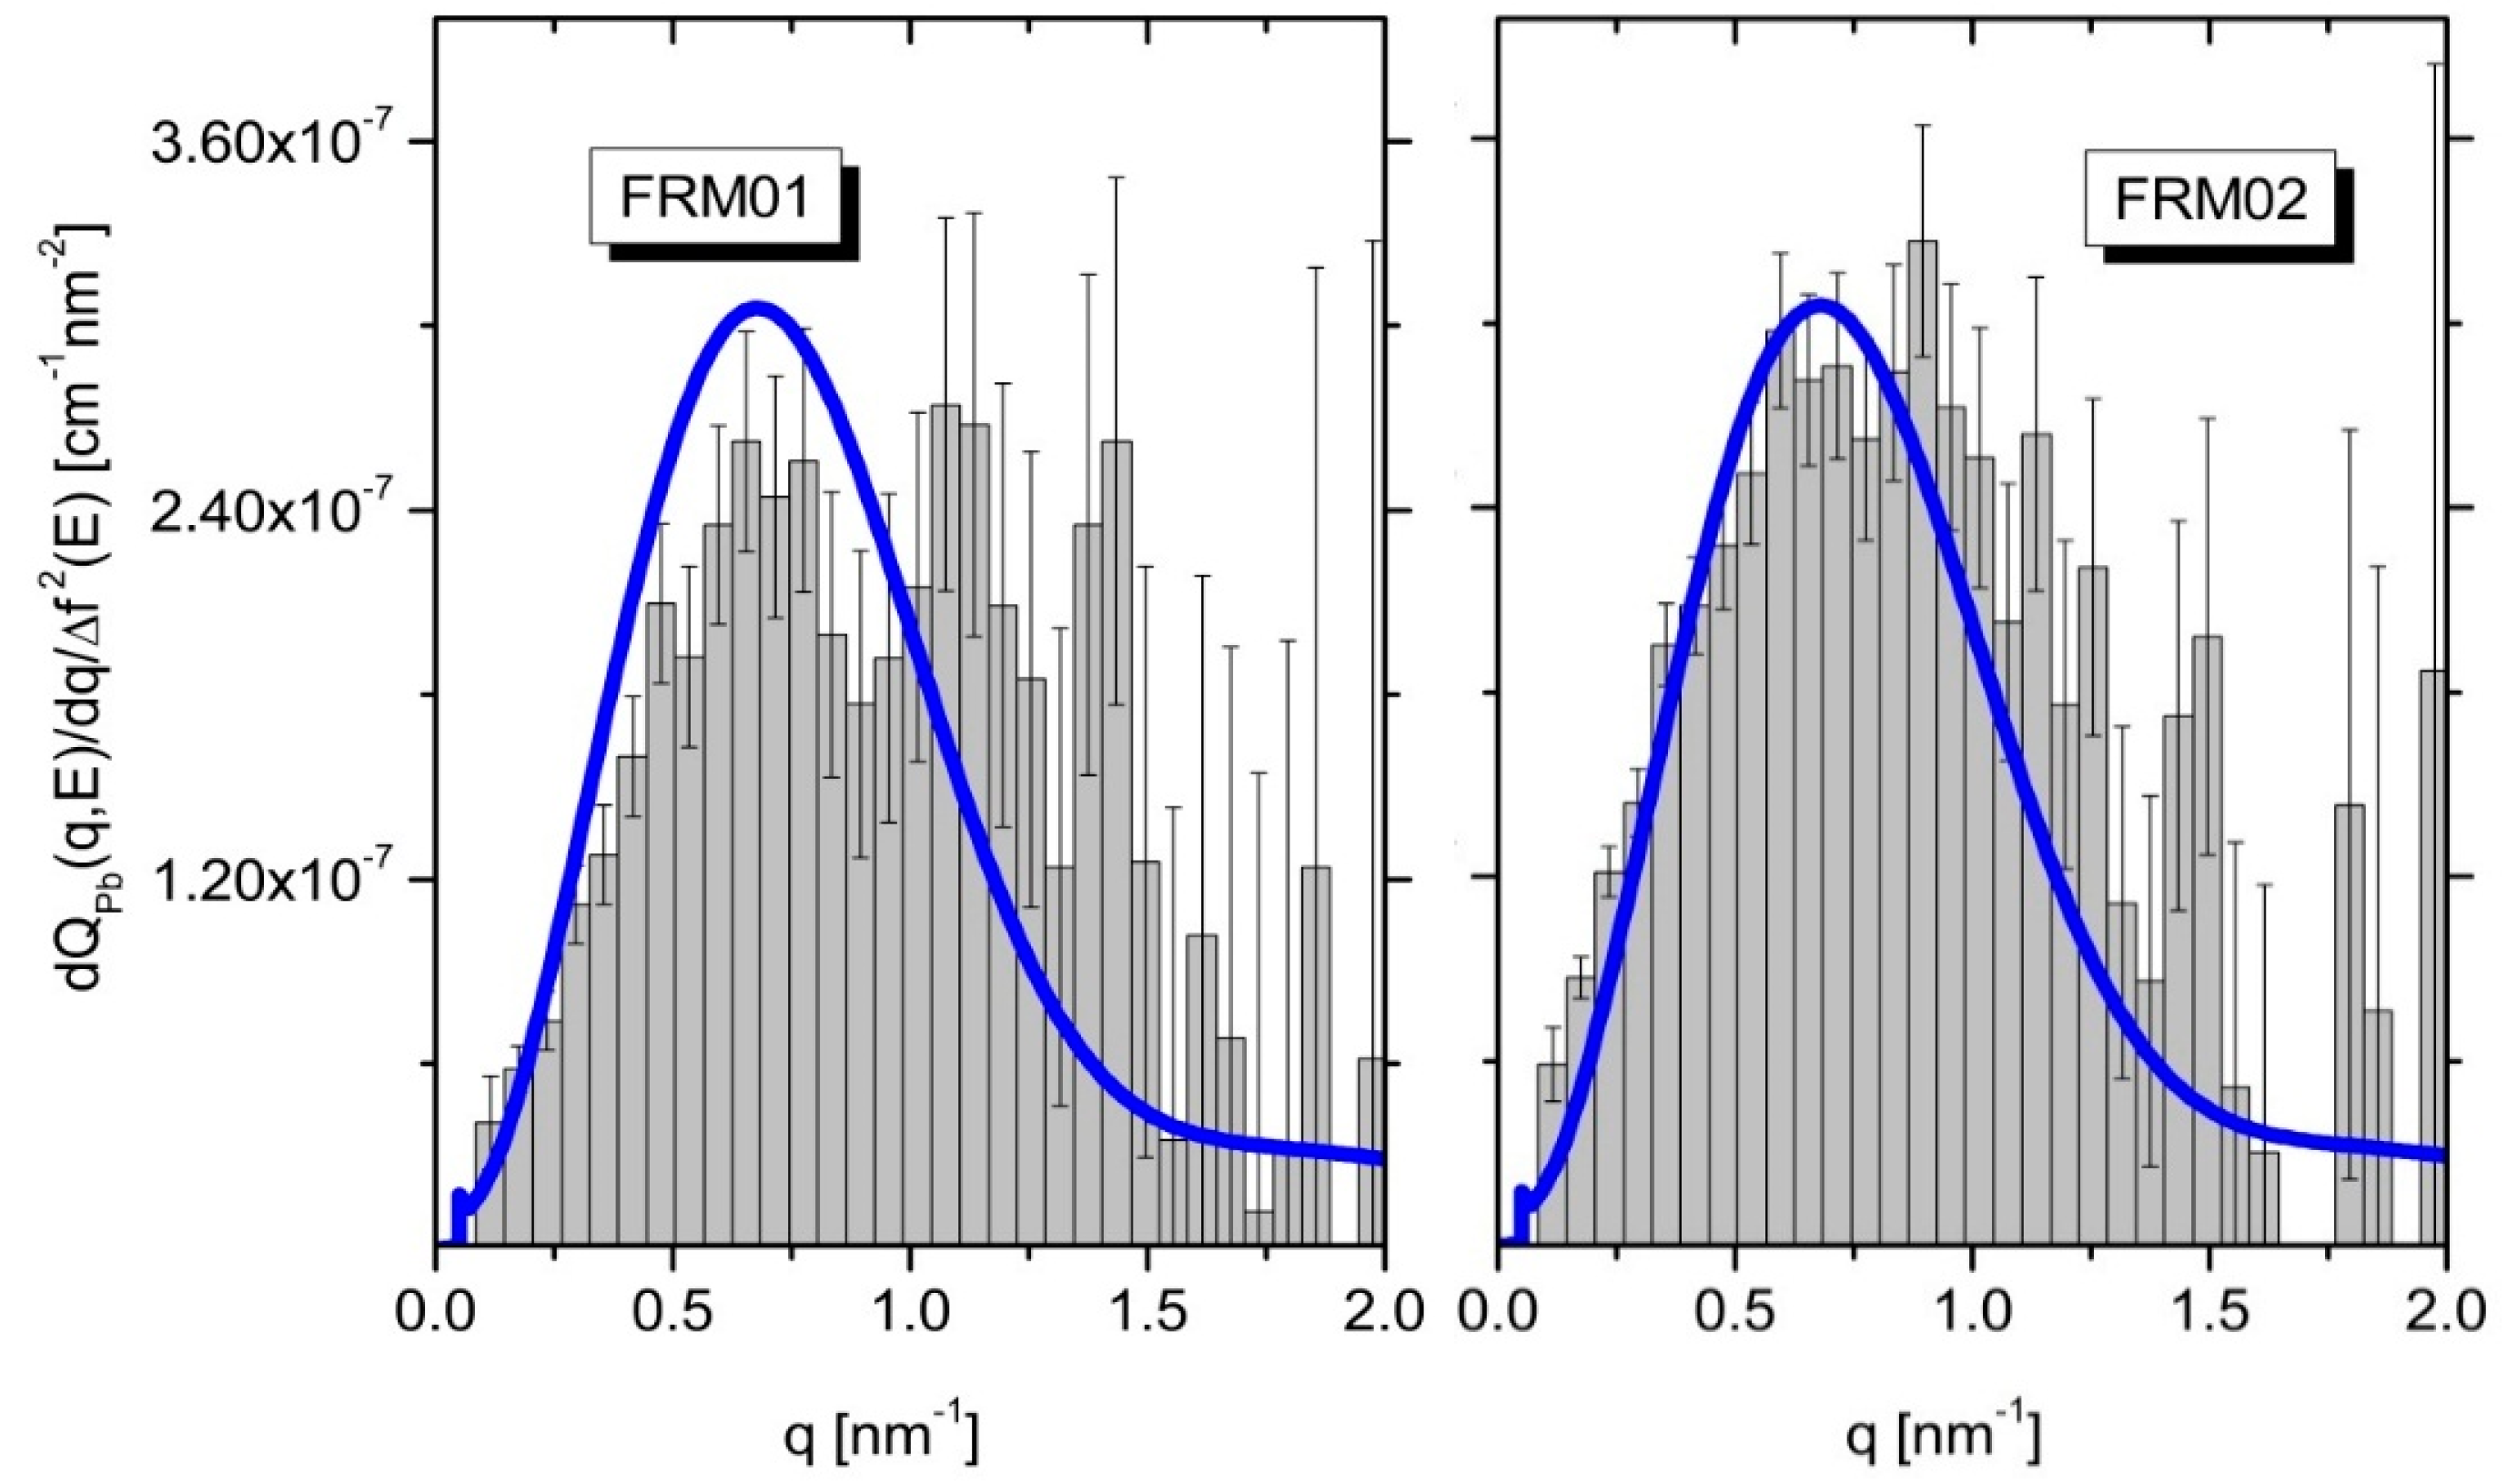
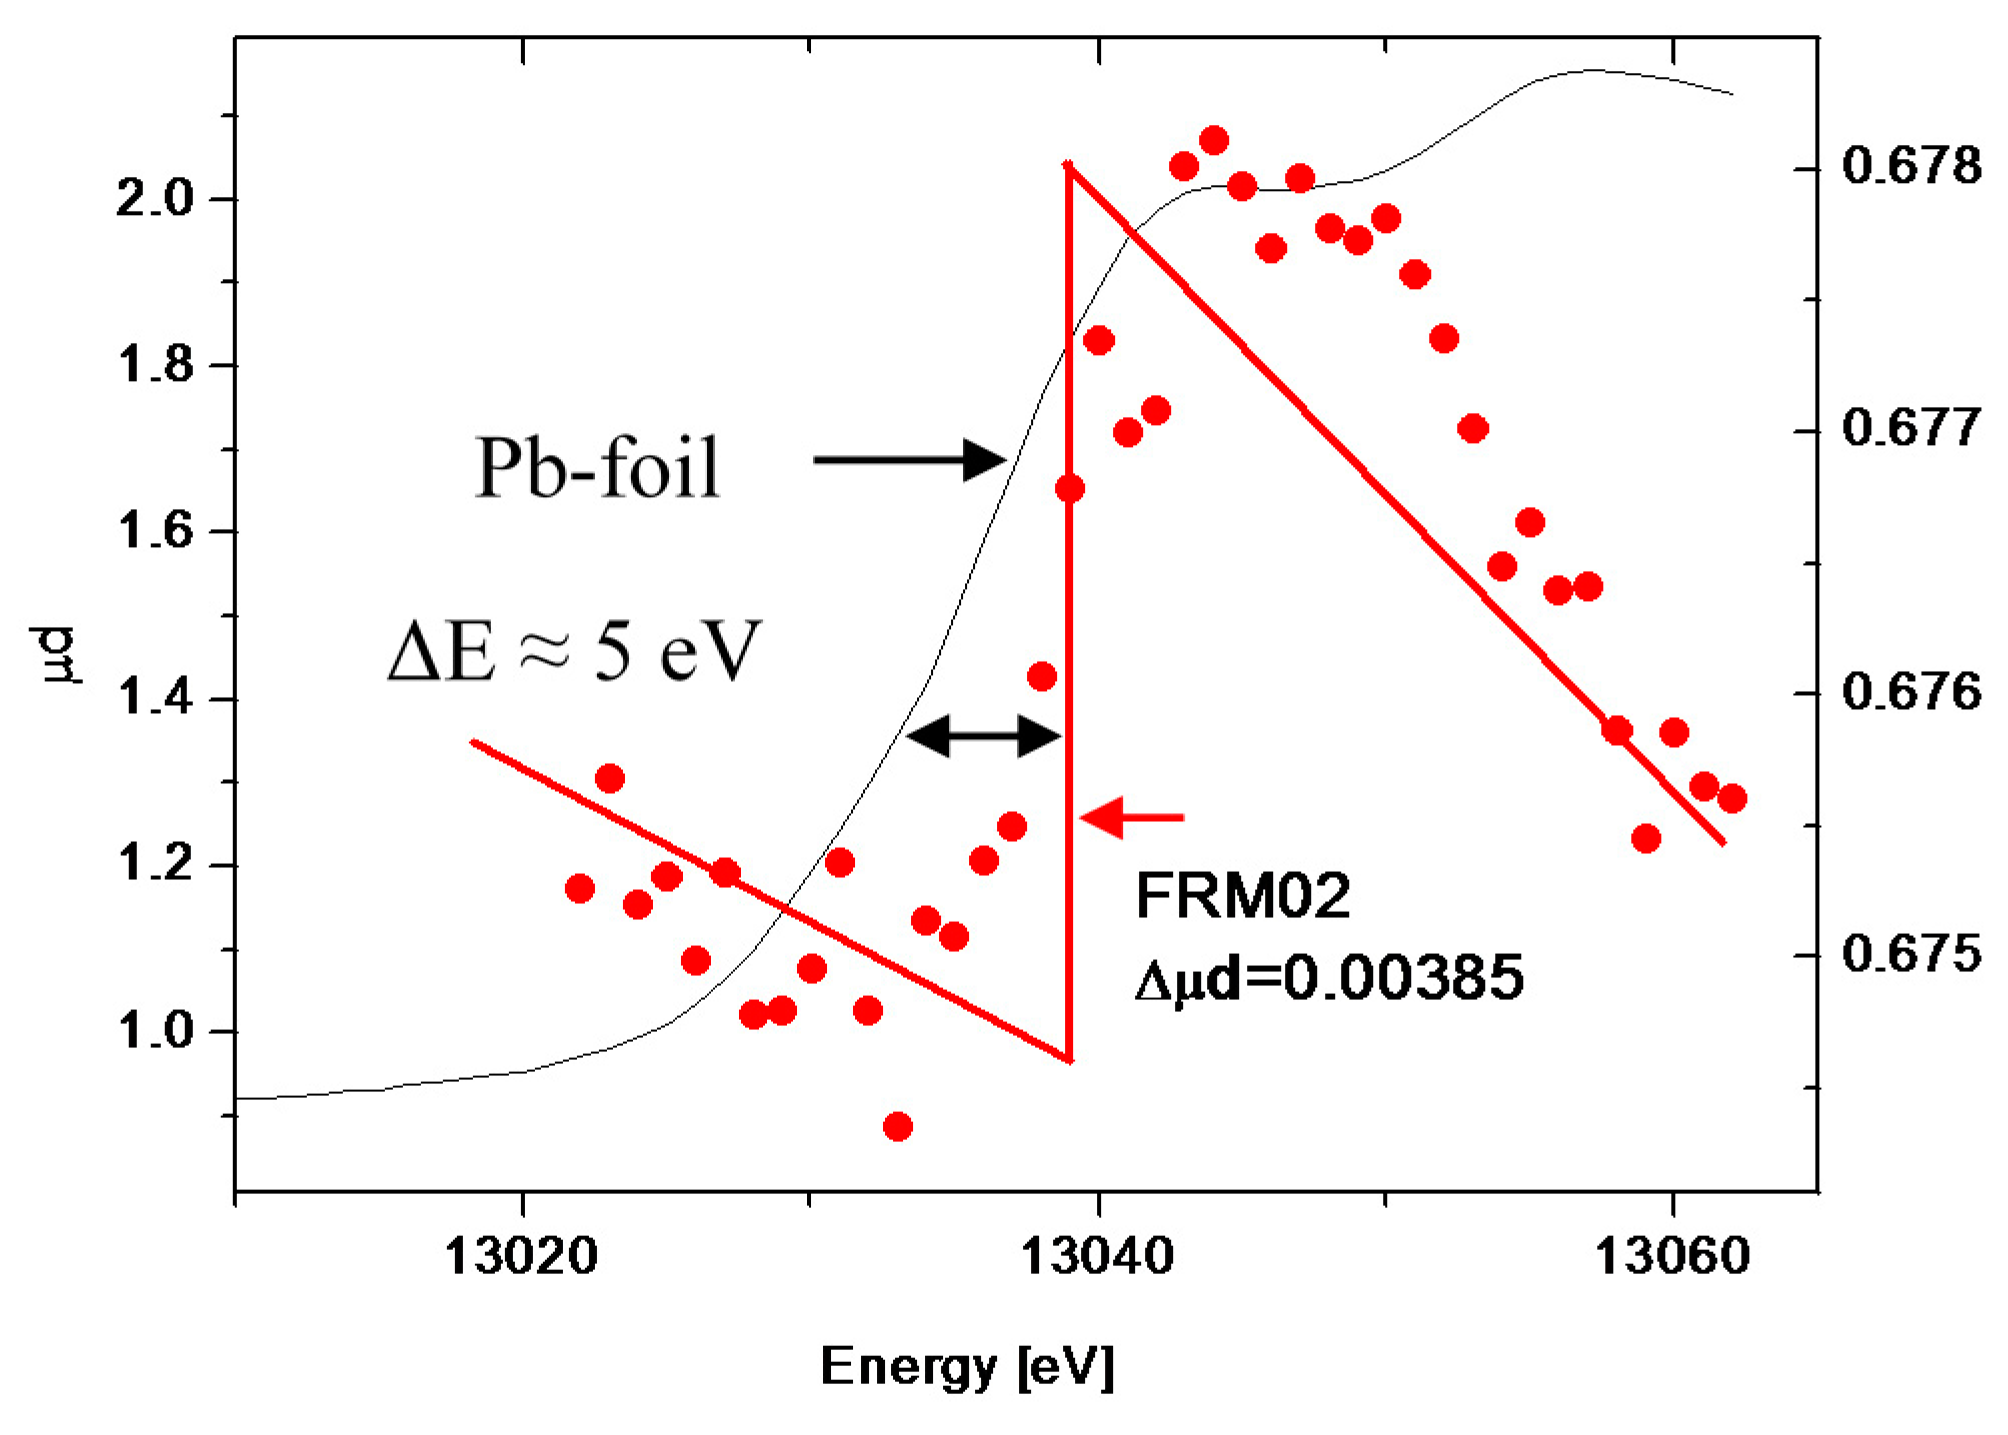
Figure 2 depicts the RI of the Pb
2+counterions for the two samples. From the integrals of the ASAXS curves (grey area in
Figure 2) the Pb
2+concentrations localized in the condensed phases have been calculated and compared with the Pb
2+concentrations obtained from the XANES measurements (
Figure 3) of the two samples. The results are summarized in
Table 1. The Pb
2+content obtained from the XANES measurements is in good agreement with the value known from the sample preparation, while the comparison with the chemical concentrations obtained from the RI analysis tells us that only about 10%–14% of the Pb
2+counterions are detected in the collapsed domains (see discussion).
4. Discussion
Since neutron scattering is mainly sensitive to the organic component the SANS curves represent the superposition of the scattering originating from the NaPA chains and the incorporated Pb2+ ions. Contributions from the PA chains is larger than from the Pb2+ ions because, at best, 40% of the anionic monomers are directly bound to divalent Pb2+ ions, while 60% of the anionic residues are not. In case of the SAXS curves the situation is different. Here, the contrast of the heavy Pb2+ ions is large with respect to the solvent, and the contrast of the organic PA chains is weak. Hence, the SAXS curves are dominated by the scattering of the Pb-containing PA segments. Having available a SAXS and a SANS curve from the same sample FRM02, we are able to draw significant conclusions with respect to the internal structure of the Pb–PA complex. The FJC-PN model successfully reproduces the SAXS curve of this sample in the entire q-regime available. Strikingly, the same model curve reproduces equally well the respective SANS curve in the entire regime of 0.07 < q < 2 nm−1 accessible to the SAXS experiment. This coincidence demonstrates, that the SAXS curve runs parallel with the SANS curve in this q space, thus proving that the structural features of the PA chain is essentially identical with the spatial distribution of the Pb2+ ions bound to this chain in the corresponding size window. Clearly, the structure of the collapsing NaPA chain is reproduced by the bound Pb2+ ions.
We now turn to the quantitative analysis of the ASAXS experiments
i.e. the analysis of the resonant invariant in order to determine the amount of Pb
2+ ions captured in the suspected collapsed subdomains (pearls). We emphasize that no model functions are required for the quantitative analysis of the resonant invariant. The grey areas in
Figure 2 simply represent the chemical concentrations of the Pb
2+ ions located in the polymer chains and, therein, predominantly in the collapsed domains. Although the self-term of the pearls from the FJC-PN model suggests that it essentially reproduces the grey areas, the Pb
2+-contents obtained from the XANES measurements (
Figure 3) show strong discrepancies from the chemical concentrations obtained with the ASAXS-based RI-analysis. The ASAXS based RI analysis indicates that only between 11% (FRM01) and 14% (FRM02) of the Pb
2+counterions are detected as being in the collapsed subdomains (last column in
Table 1). This can be attributed to two different origins, respectively: (i) an incomplete q-range is covered by the present ASAXS experiments, to which the integration of the Kratky-plot is limited; and (ii) there are in fact much less Pb
2+ cations absorbed into the collapsed domains than are expected from a complete neutralization of the COO
− residues of the polyacrylate chains by Pb
2+ cations and suggested accordingly by the phase diagram. It is important to note that the concentration of Pb
2+ in both samples was only slightly sub-stoichiometric with respect to the amount of negatively-charged COO
− residues provided by the polyelectrolyte chains.
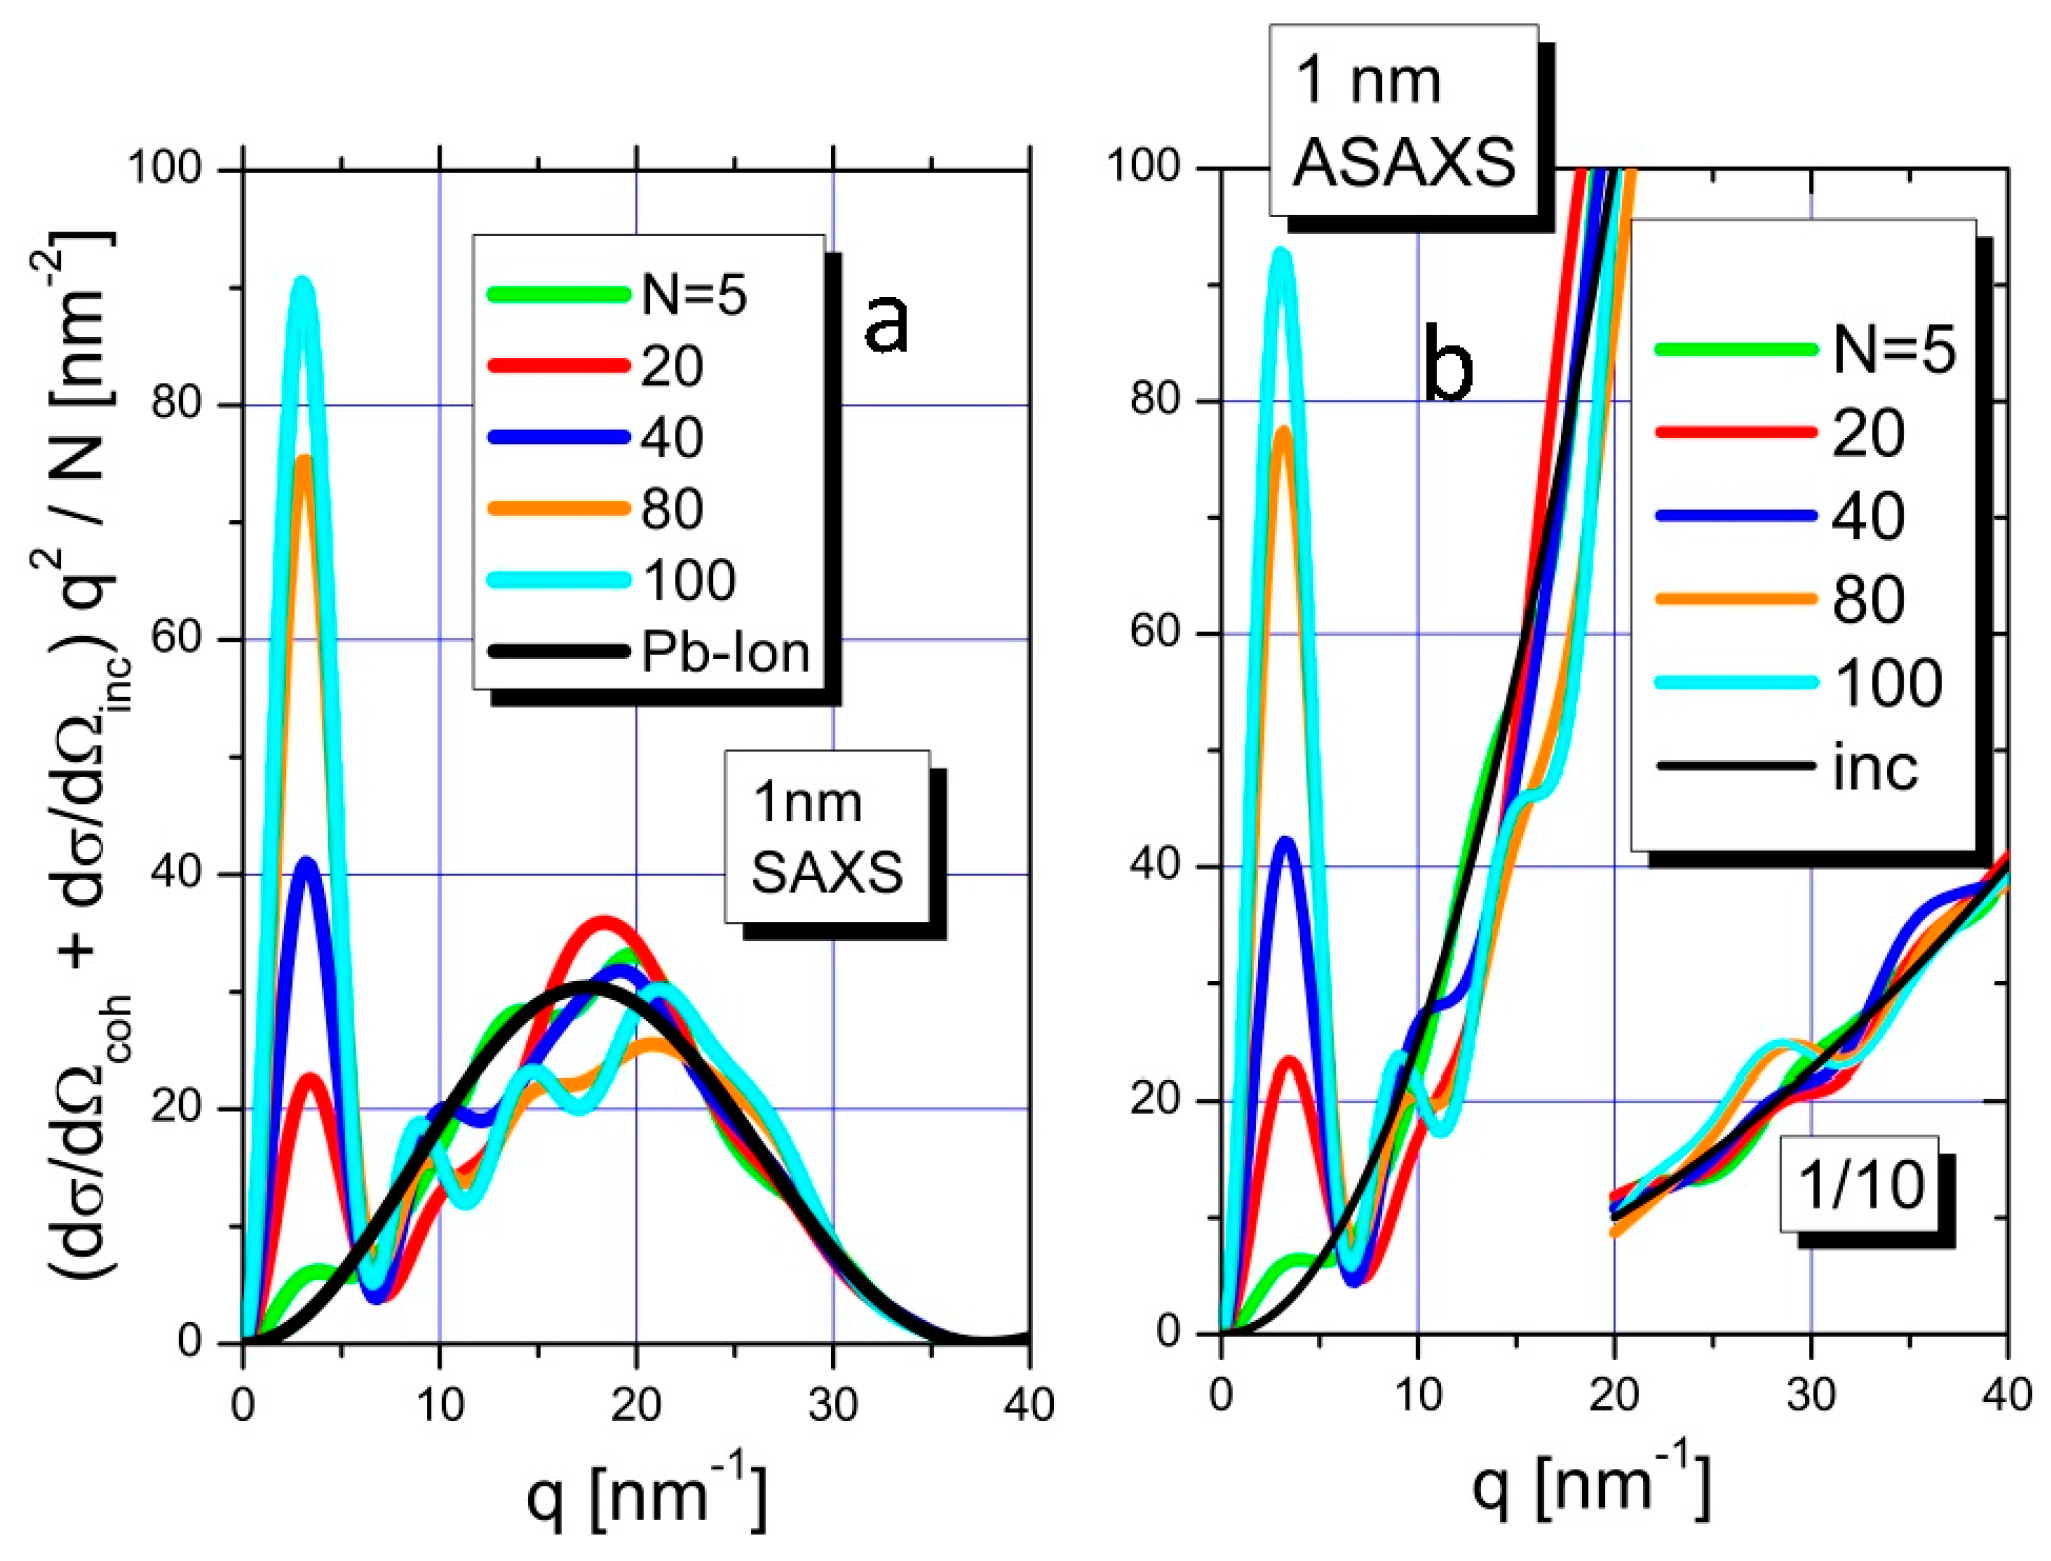
In order to better judge these two alternative explanations, Monte Carlo (MC) simulations have been performed providing two states of such a counterion condensation induced collapse; one relevant for SAXS and one relevant for ASAXS. The MC simulations are performed under the assumption that the only scattering entities are Pb2+ ions, which is correct in the case of ASAXS. In the case of SAXS this assumption does not hold, but shall still be highly instructive if used as a working hypothesis to highlight certain crucial aspects.
Simulations have been performed for confinements with sizes based on the structural information obtained from the FJC-PN model. At this stage we like to remind the reader, that these confinements represent the pearls (partially-collapsed subdomains). In detail the scattering curves of Pb2+ ions collected in cubic volumes of different sizes (1, 2, 4, and 6.5 nm) were simulated in the q-range between 0.1 and 136 nm−1. As was outlined before the value 136 nm−1 is the largest q-value, which can be achieved with a wavelength of 0.091 nm in the energy range of the LIII-absorption edge of Pb. Different amounts of Pb2+ ions have been allocated inside the cubic confinement, starting with a single ion, up to numbers of Pb2+ ions close to the volume fraction of dense spherical packing i.e. 0.74. The distances between the Pb2+ ions were randomly chosen, but the overlap of volumes of different Pb ions was excluded or, in other words, the ions are assumed to follow the behavior of a real gas. From the random ion-ion distances the structure factor resulting from the complete assembly was calculated, thus establishing the form factor of a cubic confinement. In order to address SAXS and ASAXS aspects of the present MC simulation, two form factors have been used for the simulation of the Pb2+ ions collected by the polyacrylate chains. Whereas, for the simulations of SAXS measurements the form factor of Pb2+ ions was modeled with a sphere with a radius of 0.119 nm, the δ-function was employed as the form factor of Pb2+ ions for the simulation of ASAXS measurements. The latter is justified, because in the energy range of resonant scattering the atomic form factor of Pb ions represent point-like scattering centers to good approximation.
Figure 4a depicts the Kratky plot of the simulated scattering curves for SAXS measurements together with the Kratky plot of the spherical form factor of an isolated Pb
2+ ion. Simulated curves include normalized Kratky plots of 5, 20, 40, 80, and 100 Pb
2+ ions in a 1 nm confinement. Normalization was performed with the number of ions per confinement. The amount of 100 Pb
2+ ions as the largest number of ions per confinement corresponds to a volume fraction of about 0.7 of the Pb ions in the 1 nm confinement.
The integrals of the Kratky-plots (area below curves) are directly related to the chemical concentration of Pb
2+ ions in the simulated confinements via employment of Equation (9). As can be seen from the black curve of
Figure 4a most of the integral of the form factor of an isolated Pb
2+ ion is located at q-values beyond 10 nm
−1 i.e. beyond the
q-range of the SAXS resolution, which in the present experiment was terminated at 2 nm
−1. The situation changes, when Pb
2+ ions are successively filled into the confinement with 5, 20, 40, 80, or 100 Pb
2+ ions per confinement respectively. The resulting scattering contributions in the
q-range below 10 nm
−1 (the SAXS range) becomes increasingly significant and finally dominant, when compared to the overall integral. Along with the increasing fill rate, the scattering curve gradually approaches the shape of the form factor of a cube.
A completely different result is established by the simulations of the ASAXS measurements. Now point-like scattering centers, instead of spherical form factors, for the scattering of the collected ions are used.
Figure 4b shows the superposition of the incoherent scattering of the point-like scatterers (
i.e., the scattering of the uncorrelated Pb
2+ ions) with the coherent scattering originating from the Pb
2+ ions in the confinement. The coherent scattering oscillates around the incoherent scattering when approaching larger
q-values. The curves in the regime of
q < 10nm
−1 are dominated by the coherent scattering and show strong increasing scattering intensity with increasing number of Pb ions while at larger
q-values oscillations around the parabolic increasing scattering occur. From a comparison of
Figure 4a with
Figure 4b it is evident, that ASAXS measurements show a significant difference of the intensity distribution in the range of 10 <
q < 40 nm
−1 due to the different form factors addressed by SAXS and ASAXS respectively, leading to a different degree of completeness of the integral when Equation (9) is used for the estimation of chemical concentrations.
Equation (10) was used to prove consistency of the MC simulations. In fact, Equation (10) yields the same invariant and, along with it, the full number N of scattering Pb2+ ions as the numerical integration of the simulated ASAXS curves does if extended over the entire q-regime of 0 nm−1 ≤ q ≤ qmax with qmax = 136 nm−1. In a truncated range of q of 0 ≤ q ≤ 2 nm−1 or of 0 ≤ q ≤ 10 nm−1 the resulting invariant contribution recovers a certain number of Pb2+ ions NR which offers insight into the extent of completeness of the respective estimate as NR/N = ε given in Equation (11).
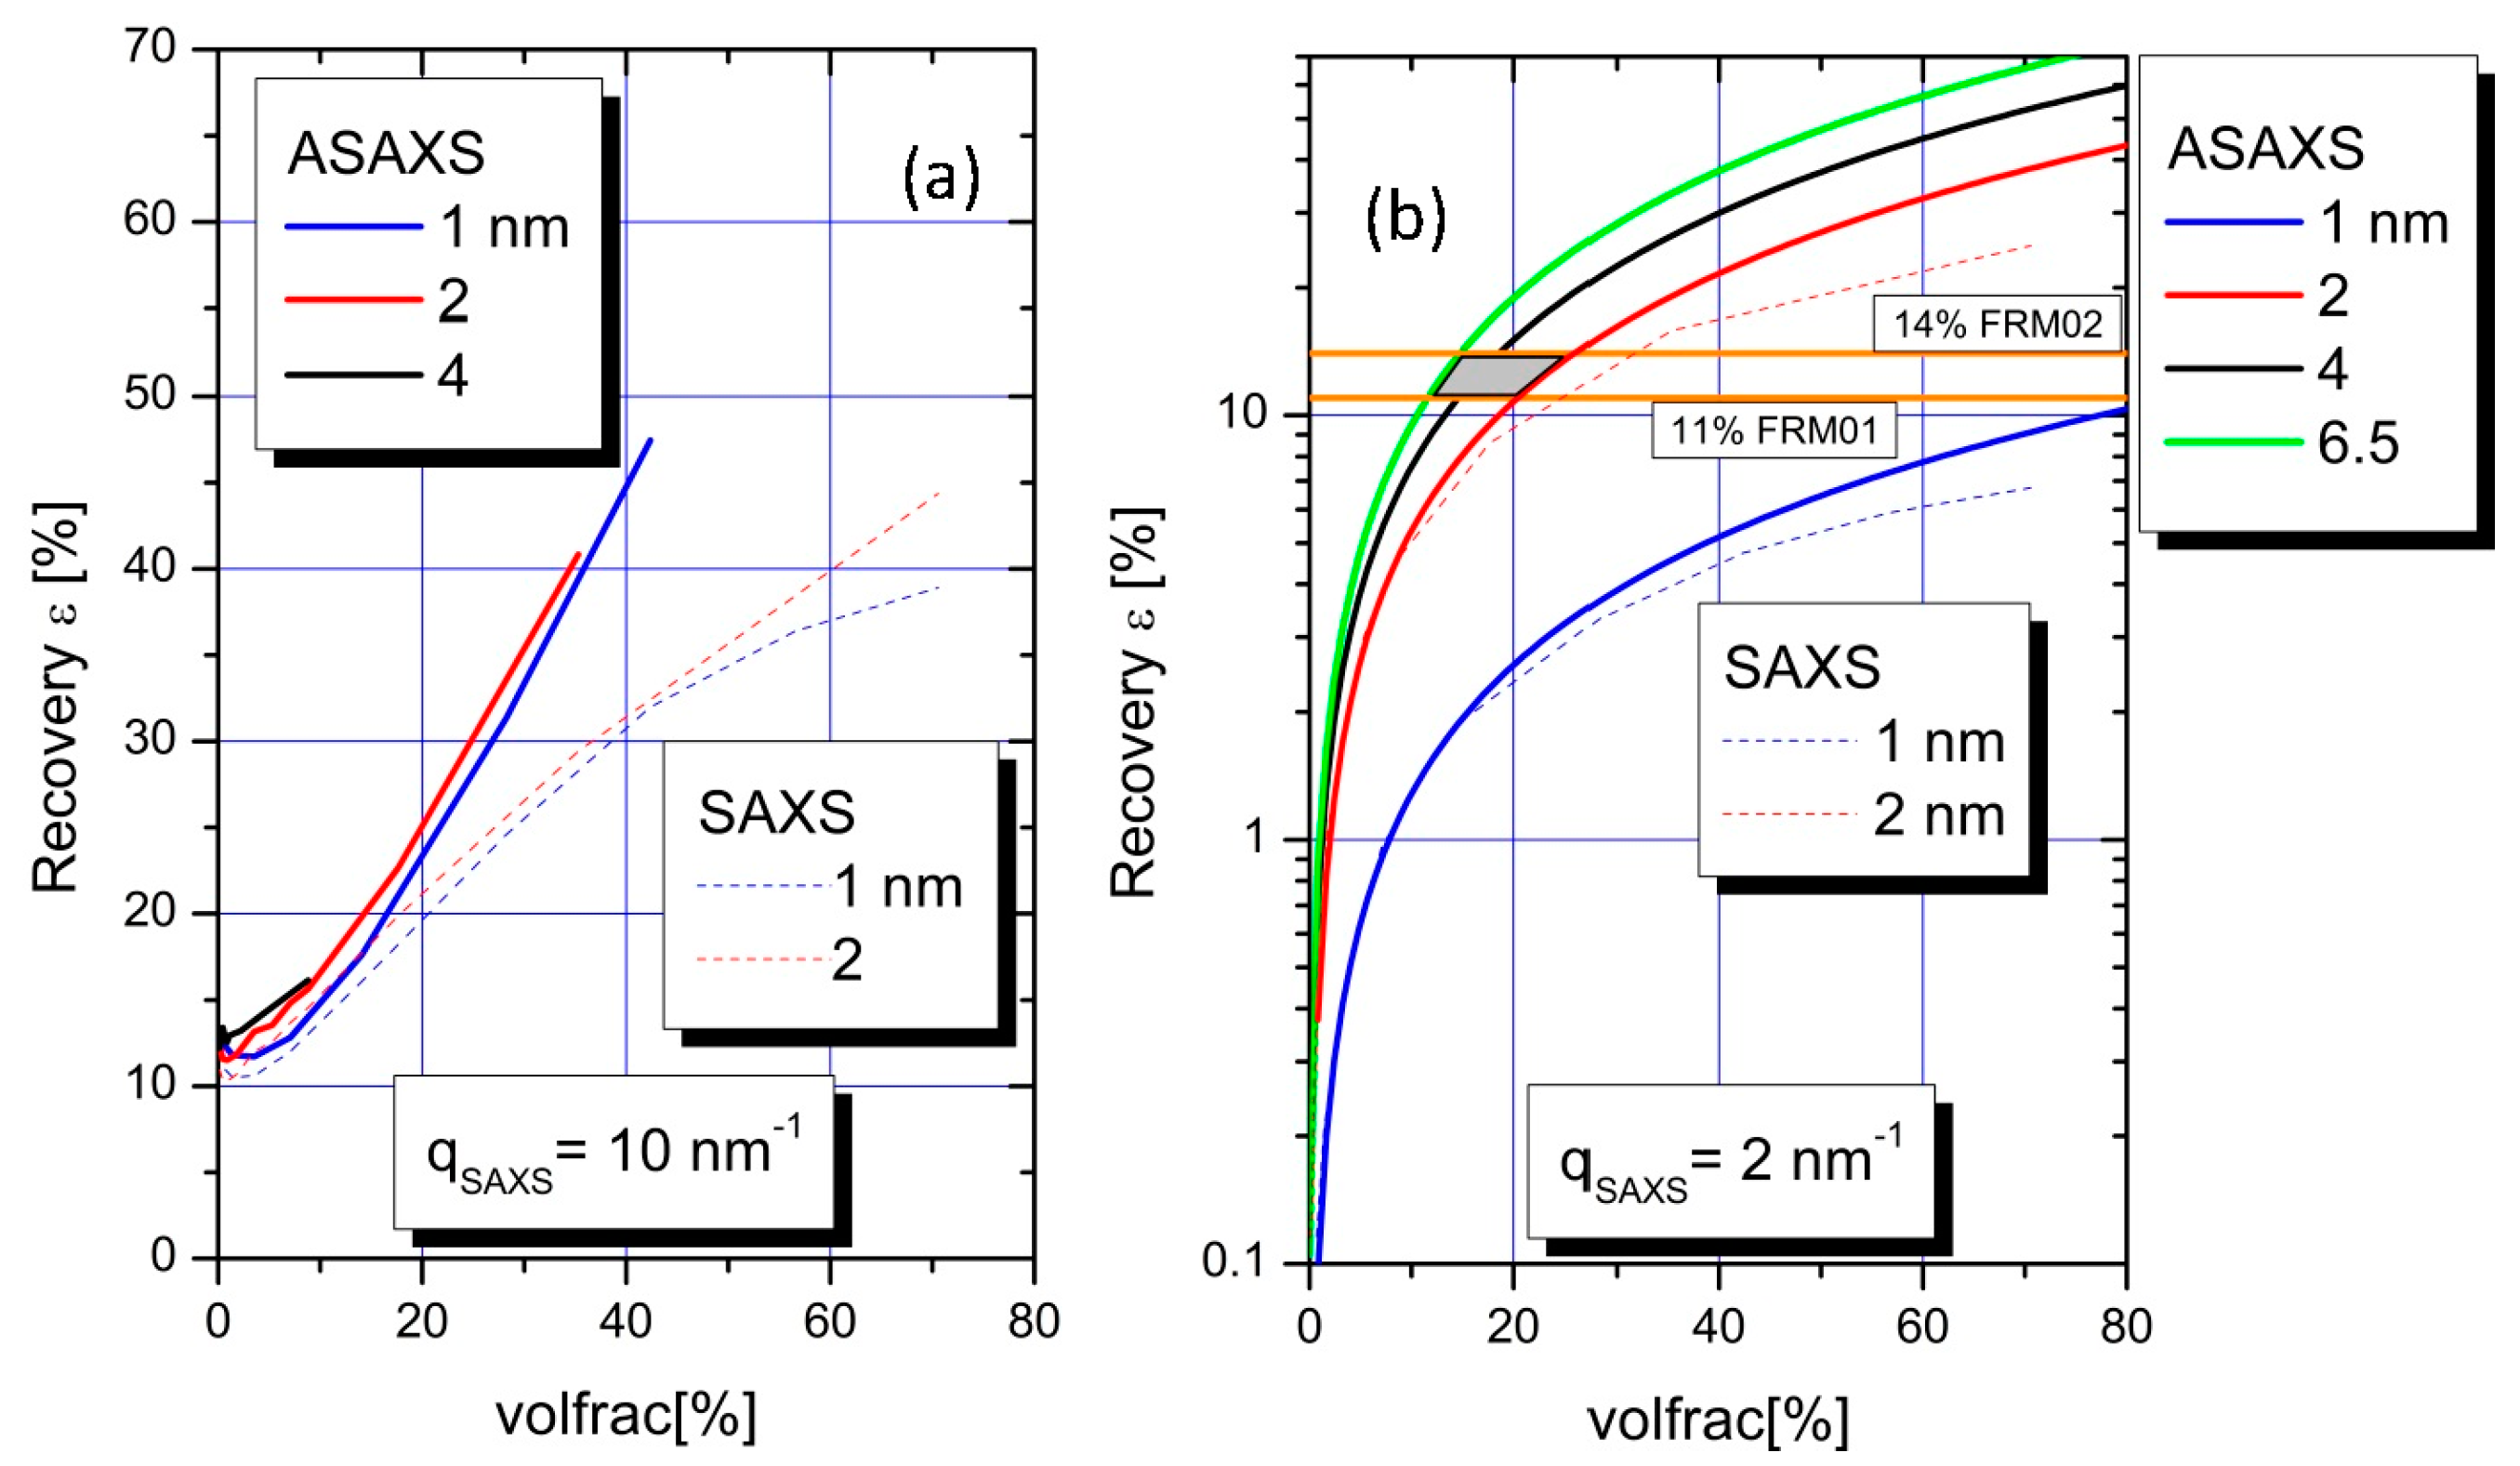
Figure 5 summarizes, quantitatively, the results from the MC simulations with four different cubic confinements with edge lengths of 1, 2, 4, and 6.5 nm respectively. The latter three length values have been chosen due to the results deduced from the FJC-PN model suggesting pearls with radii between 2.6 and 3.4 nm. On the y-axis the degree of recovery is plotted, which is calculated by employing Equation (11) with the integral of Equation (9) calculated for two different integration ranges of the Kratky plot: (i) from 0 to 10 nm
−1 (
Figure 5a), and (ii) from 0 to 2 nm
−1 (
Figure 5b). These integral fractions entering Equation (11) are plotted
versus the volume fraction of the cubic confinement, which is covered by the Pb
2+ ions up to values close to the value for hexagonal close-packing of spheres (0.74).
The RI from ASAXS achieved via integrating up to 10 nm
−1 are indicated as the colored solid lines in
Figure 5a for the different confinements (blue = 1 nm, red = 2 nm, black = 4 nm). When approaching volume fraction of 35% in the cubic confinements 41% of the scattering intensity is recovered in the case of 2 nm sized cubes, while the degree of completeness is 48% for 1 nm size for a volume fraction of 42%. Due to computer limitations the simulation was not performed for this limit in the 4 nm confinement, but it can be expected that the values converge for the larger degrees of filling. This also applies for larger confinements.
Strongly different results were found for the extended integration range in the case of SAXS measurements. The degree of recovery (completeness of the integral) is smaller in the extended q-range when comparing SAXS to ASAXS. This increased discrepancy can be attributed to the influence of the form factor of spatially extended ions.
For the discussion of the results calculated for the limited
q-range up to 2 nm
−1 in accordance with our present ASAXS experiment we switch to a logarithmic scale on the y-axis (
Figure 5b) in order to visualize with a better resolution. The results are represented by the colored solid lines for the different confinements (blue = 1 nm, red = 2 nm, black = 4 nm, and green = 6.5 nm). In a linear plot, the curves are straight lines. Thus, the linear functions can be extrapolated to values of spherical dense packing for the large confinements (4 and 6.5 nm). When approaching close packing of the cubic confinements nearly 70% of the scattering intensity is recovered in the case of 6.5 nm sized pearls while the degree of completeness is only 9% for 1 nm size. Significant differences appear for the trends in recovered scattering curves of ASAXS and SAXS measurements in this
q-regime. The ASAXS measurements reveal a superior degree of recovery when compared to SAXS at higher volume fractions.
In order to make optimal use of these simulations, with respect to an appropriate evaluation of our quantitative RI-analysis, we adopt the following point of view. If both samples would lie on the phase boundary for Pb-PA in 0.1 M NaNO
3, given in [
24] as:
with [COO
−]
c and [Pb
2+]
c the concentration of NaPA and Pb
2+ in moles per liter at the threshold, the degree of decoration of both samples would be [Pb
2+]/[COO
−] ~0.3. According to the selected values of [COO
−] and [Pb
2+] of the two samples (
Table 1) this is not possible. However, we can still assume as a limiting case that all Pb
2+ ions available in solution are bound by COO
−-residues of the NaPA chains and that those bound Pb
2+ ions are all trapped in collapsed pearl-like confinements. This assumption leads us to assign a degree of decoration of [Pb
2+]/[COO
−] ~0.21 (FRM01) and [Pb
2+]/[COO
−] ~0.24 (FRM02), and to conclude that the present RI-analysis, which is based on an integral according to Equation (8) up to
q = 2 nm
−1, has recovered just 11% and 14% of those Pb
2+ ions which presumably decorate the NaPA chains and are, thereby, condensed to confinements. Entering into
Figure 5b with these percentages (the two horizontal lines), it can be realized that such a discrepancy is only compatible with a confinement size
D of 2 <
D < 6.4 nm filled with a number of Pb
2+ ions representing volume fractions of Pb
2+ ions in the confinement between 10 and 25%. The regime of compatible confinement sizes is represented by the grey area in
Figure 5b. This is in excellent agreement with the results deduced from the FJC-PN model which results in confinements larger than 1 nm.
If, unlike to the just-adopted point of view, not all Pb
2+ ions in solution are bound by chains,
i.e., in case of a significant portion of Pb
2+ ions moving freely in solution and, thus, scattering only incoherently the number of Pb
2+ ions recovered as being bound to chains by the restricted integral up to 2 nm
−1 must be larger than 11%–14%, which in
Figure 5b can only be accommodated by a volume fraction of Pb
2+ ions in the confinement larger than ~20%.
In order to shed more light on the consequences of the latter, we present a gedankenexperiment. Let us assume that only 50% of the Pb
2+ ions are in the collapsed subdomains while the other 50% are free in solution and not contributing to the small-angle scattering of the collapsed subdomains. Given, now, that 11% and 14% of the ASAXS active species are recovered by RI analysis, 22% and 28% of the counterions have to be in the condensed phase because, per definition, 50% of the Pb
2+ ions cannot be detected by ASAXS. Entering with these numbers
Figure 5b (horizontal lines now at 22% and 28%) provides volume fractions between 25% and 50% for the confinements with sizes between 2 and 6.5 nm. This seems to mark an upper limit of the volume fractions for Pb
2+, because along with the filling by Pb
2+ ions additional volume has to be allocated to the hosting polymer segments and, most likely, some volume is also occupied by residual solvent molecules.


