Effects of Polybenzoxazine on Shape Memory Properties of Polyurethanes with Amorphous and Crystalline Soft Segments

Abstract
:
1. Introduction
2. Experimental Section
2.1. Materials
2.2. Preparation Method
2.2.1. Benzoxazine Monomer

| Sample | MDI (mole) | PTMG (mole) | BD (mole) | Benzoxazine (mole) | HSC (%) | PB (wt%) |
|---|---|---|---|---|---|---|
| gPU | 3 | 1 | 2 | 0 | 58.9 | 0 |
| gPUPB2 | 3 | 1 | 1.8 | 0.2 | 61.1 | 6.4 |
| gPUPB4 | 3 | 1 | 1.6 | 0.4 | 63.0 | 12.1 |
2.2.2. SMPU with Amorphous Soft-Segment
2.2.3. SMPU with Crystalline Soft-Segment

| Sample | MDI (mole) | PCL (mole) | BD (mole) | Benzoxazine (mole) | HSC (%) | PB (wt%) |
|---|---|---|---|---|---|---|
| mPU | 5 | 1 | 4 | 0 | 28.7 | 0 |
| mPUPB5 | 5 | 1 | 3.5 | 0.5 | 31.4 | 4.6 |
| mPUPB10 | 5 | 1 | 3 | 1.0 | 33.9 | 8.8 |
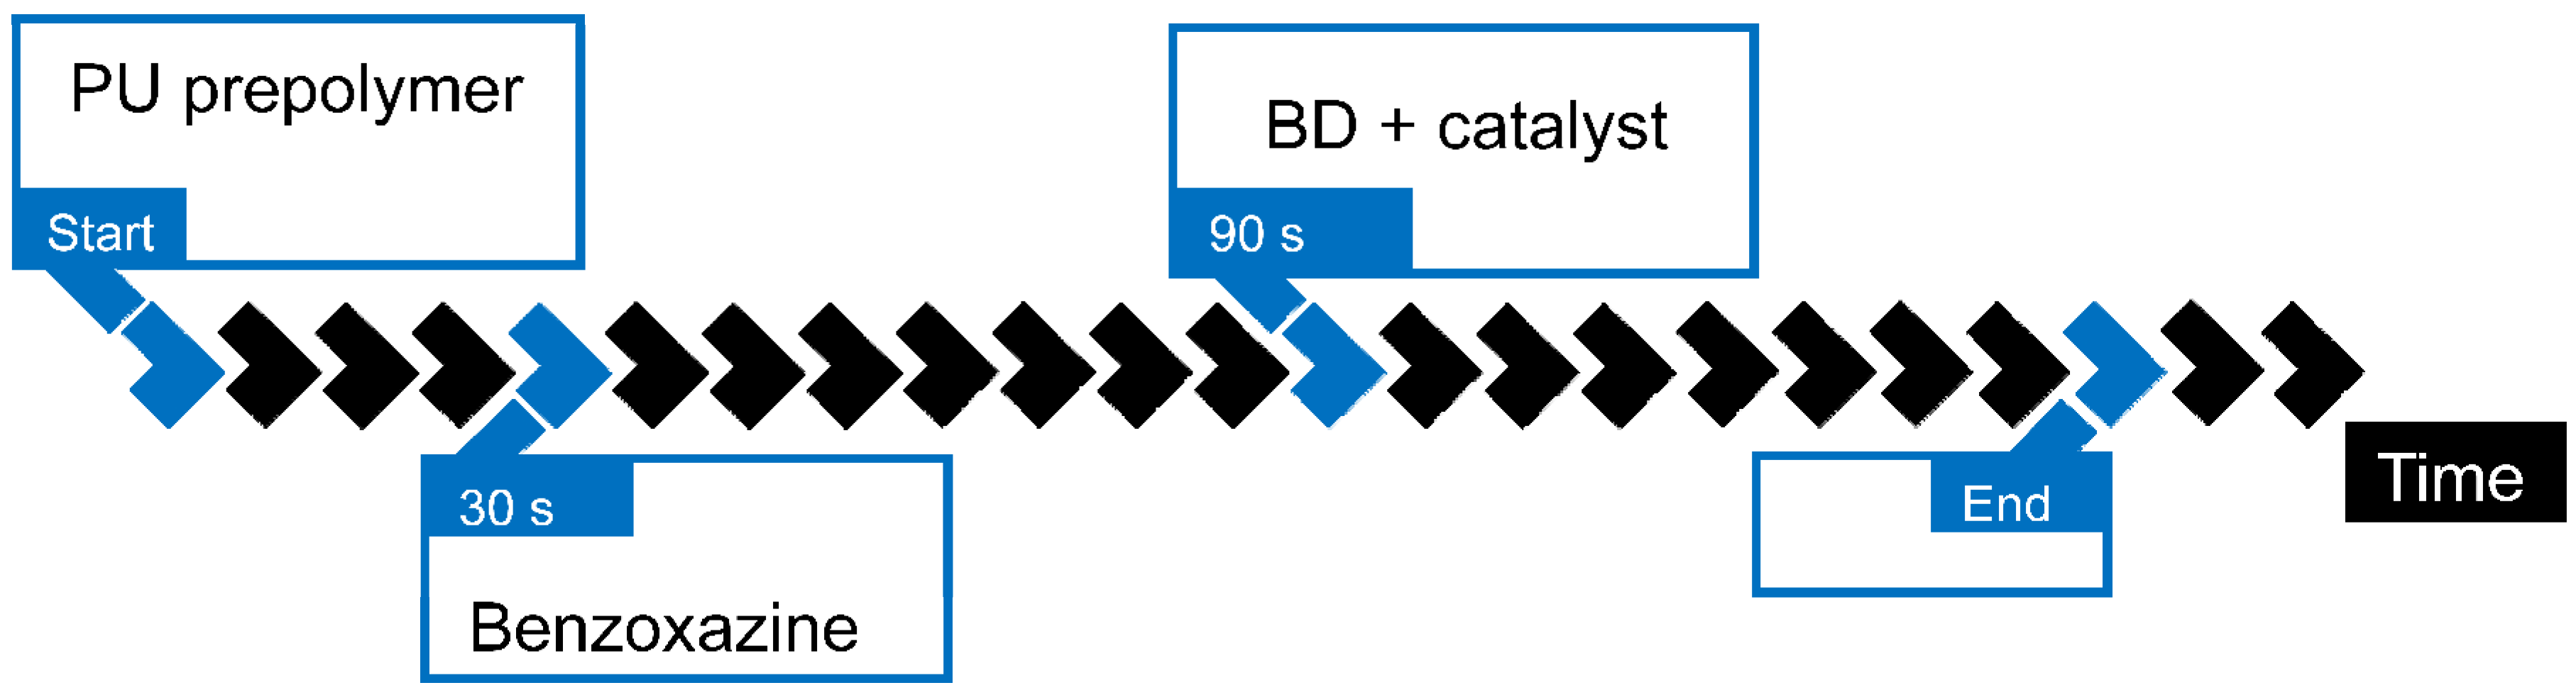
2.2.4. Preparation of SMPU-PB Compounds
2.3. Characterization
2.3.1. Thermal Properties
2.3.2. Thermo-Mechanical Characterization
2.3.3. Surface Morphology
2.3.4. Fourier Transform Infra-Red Analysis
2.3.5. Shape-Memory Properties
| Sample | Ttrans (°C) |
|---|---|
| gPU | 54 |
| gPUPB2 | 92 |
| gPUPU4 | 110 |
3. Results and Discussion
3.1. SMPU with Amorphous Soft-Segment
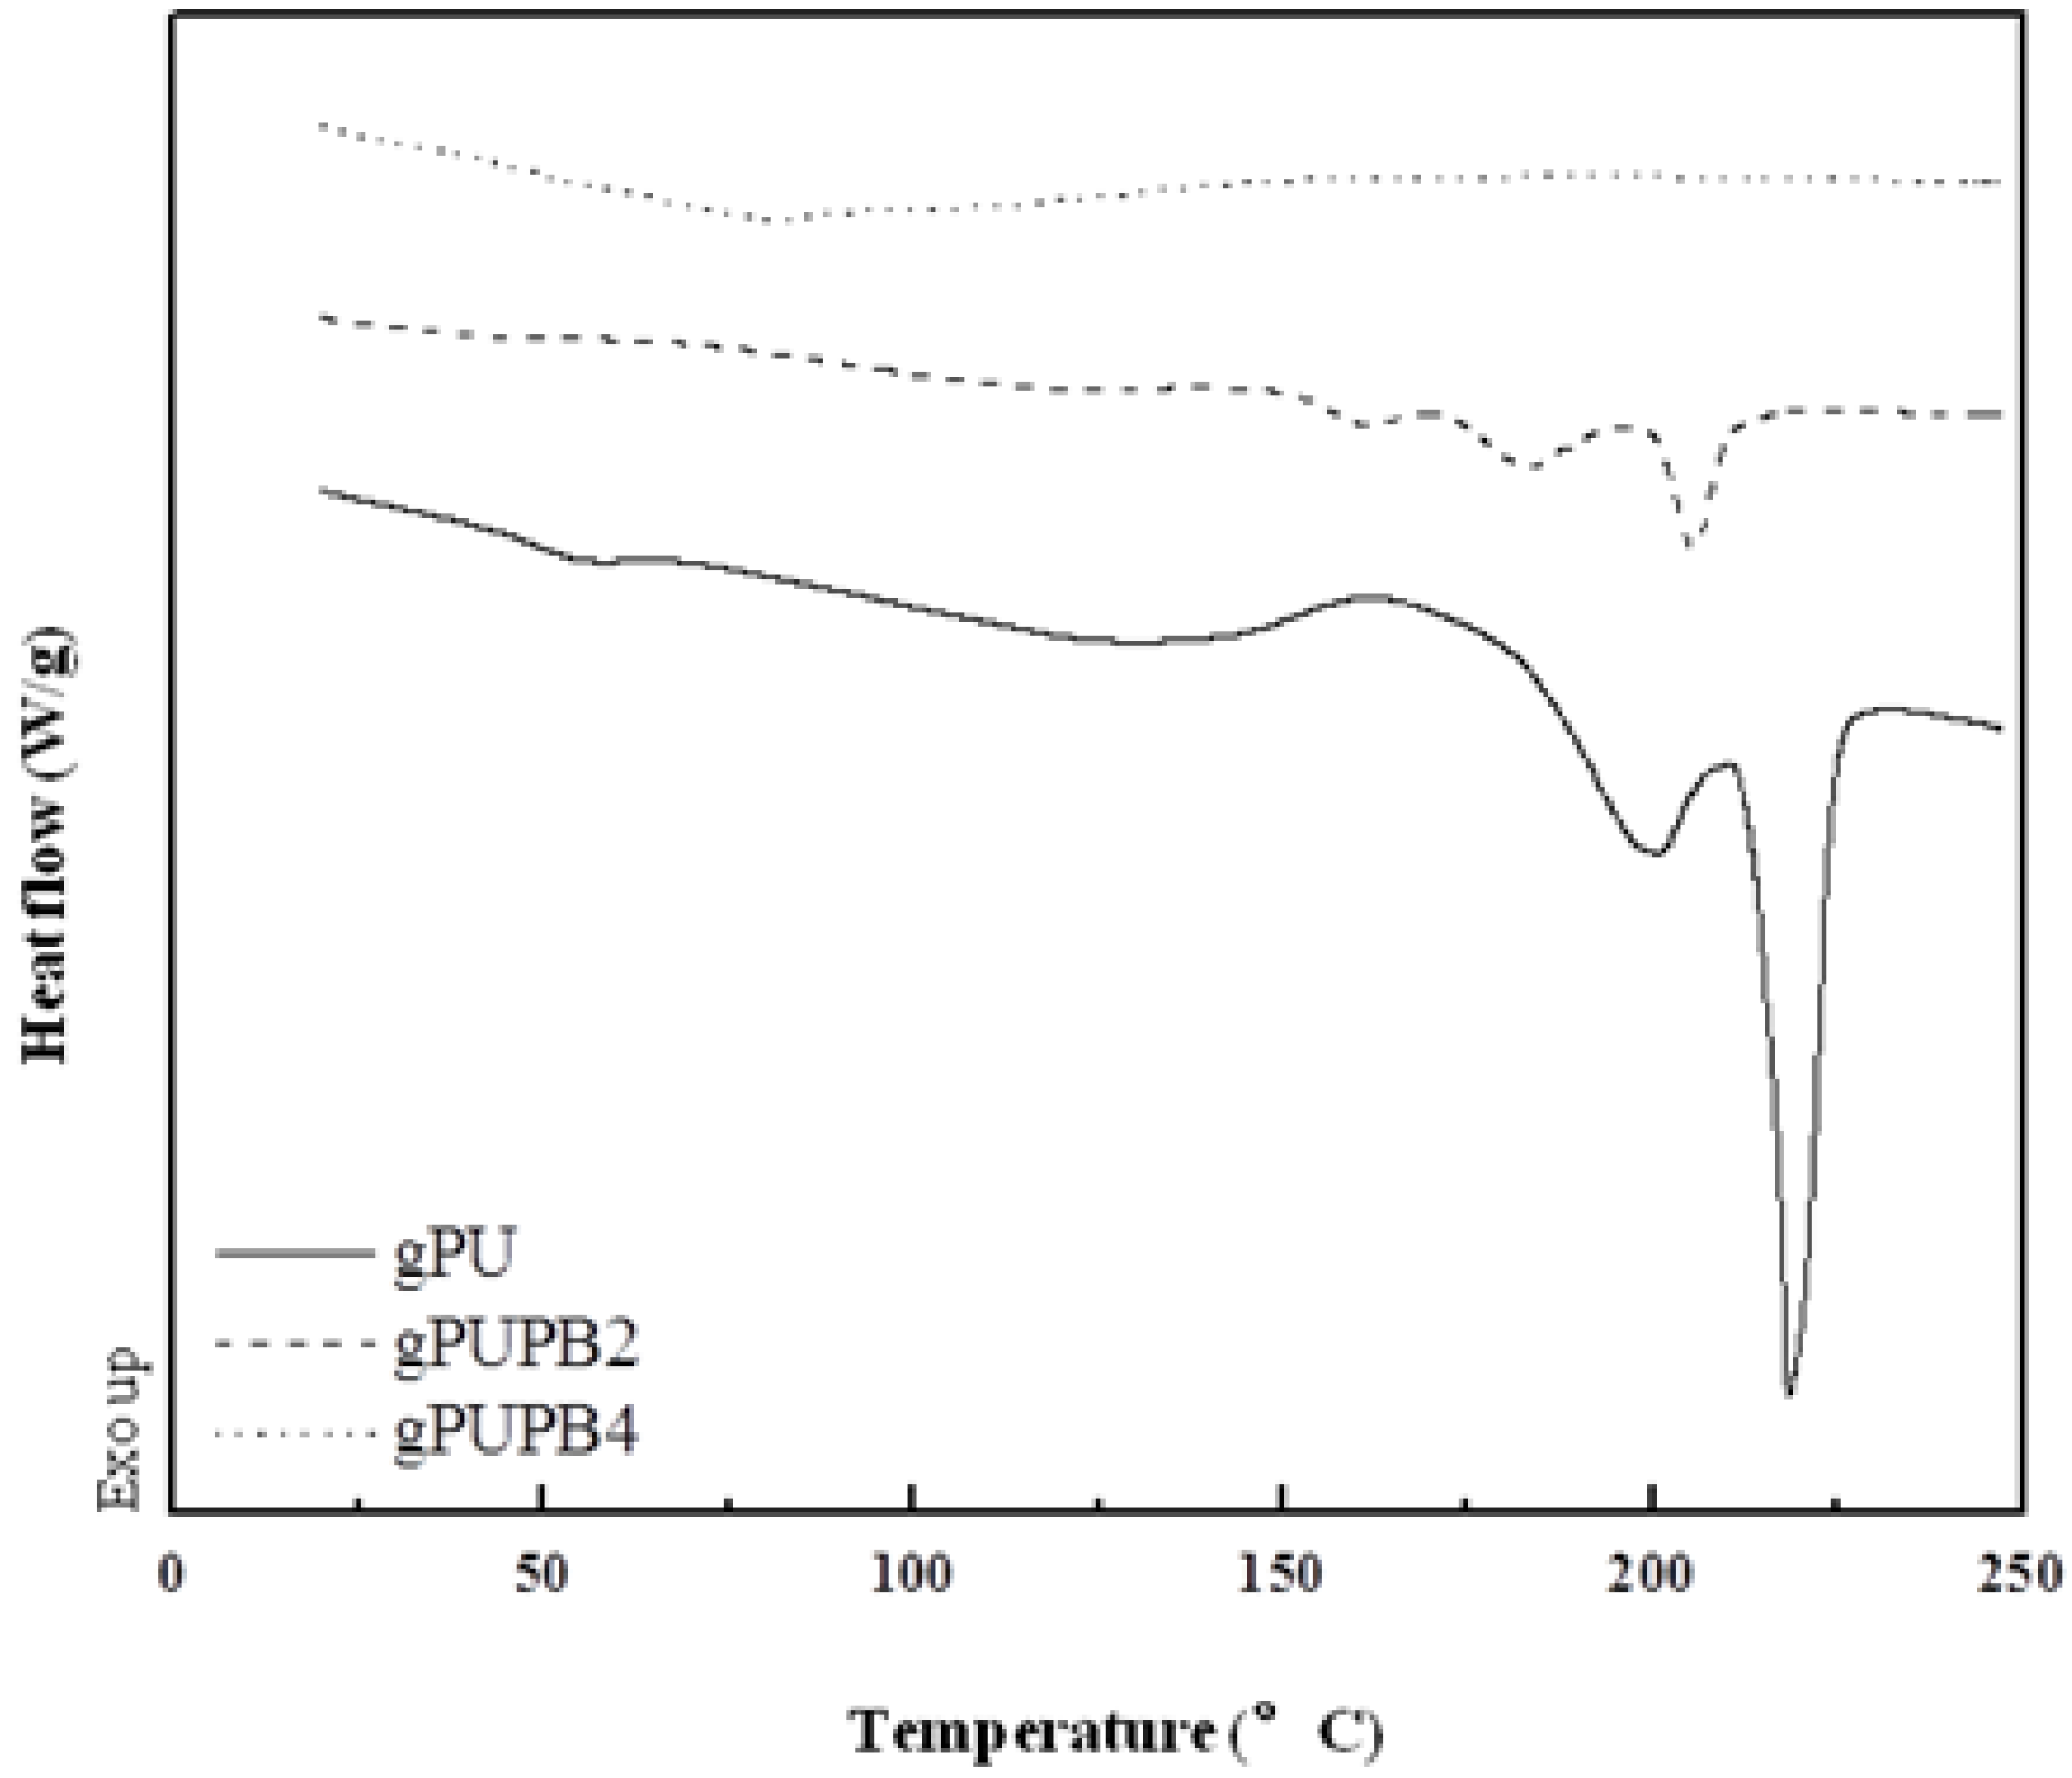
3.1.1. Glass Transition and Melting

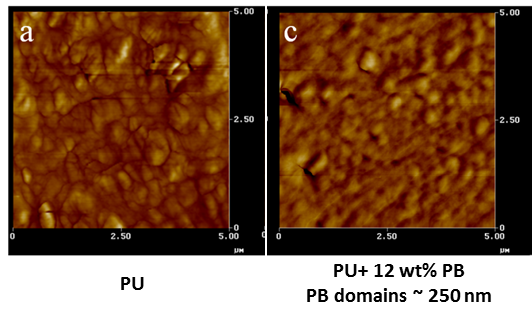
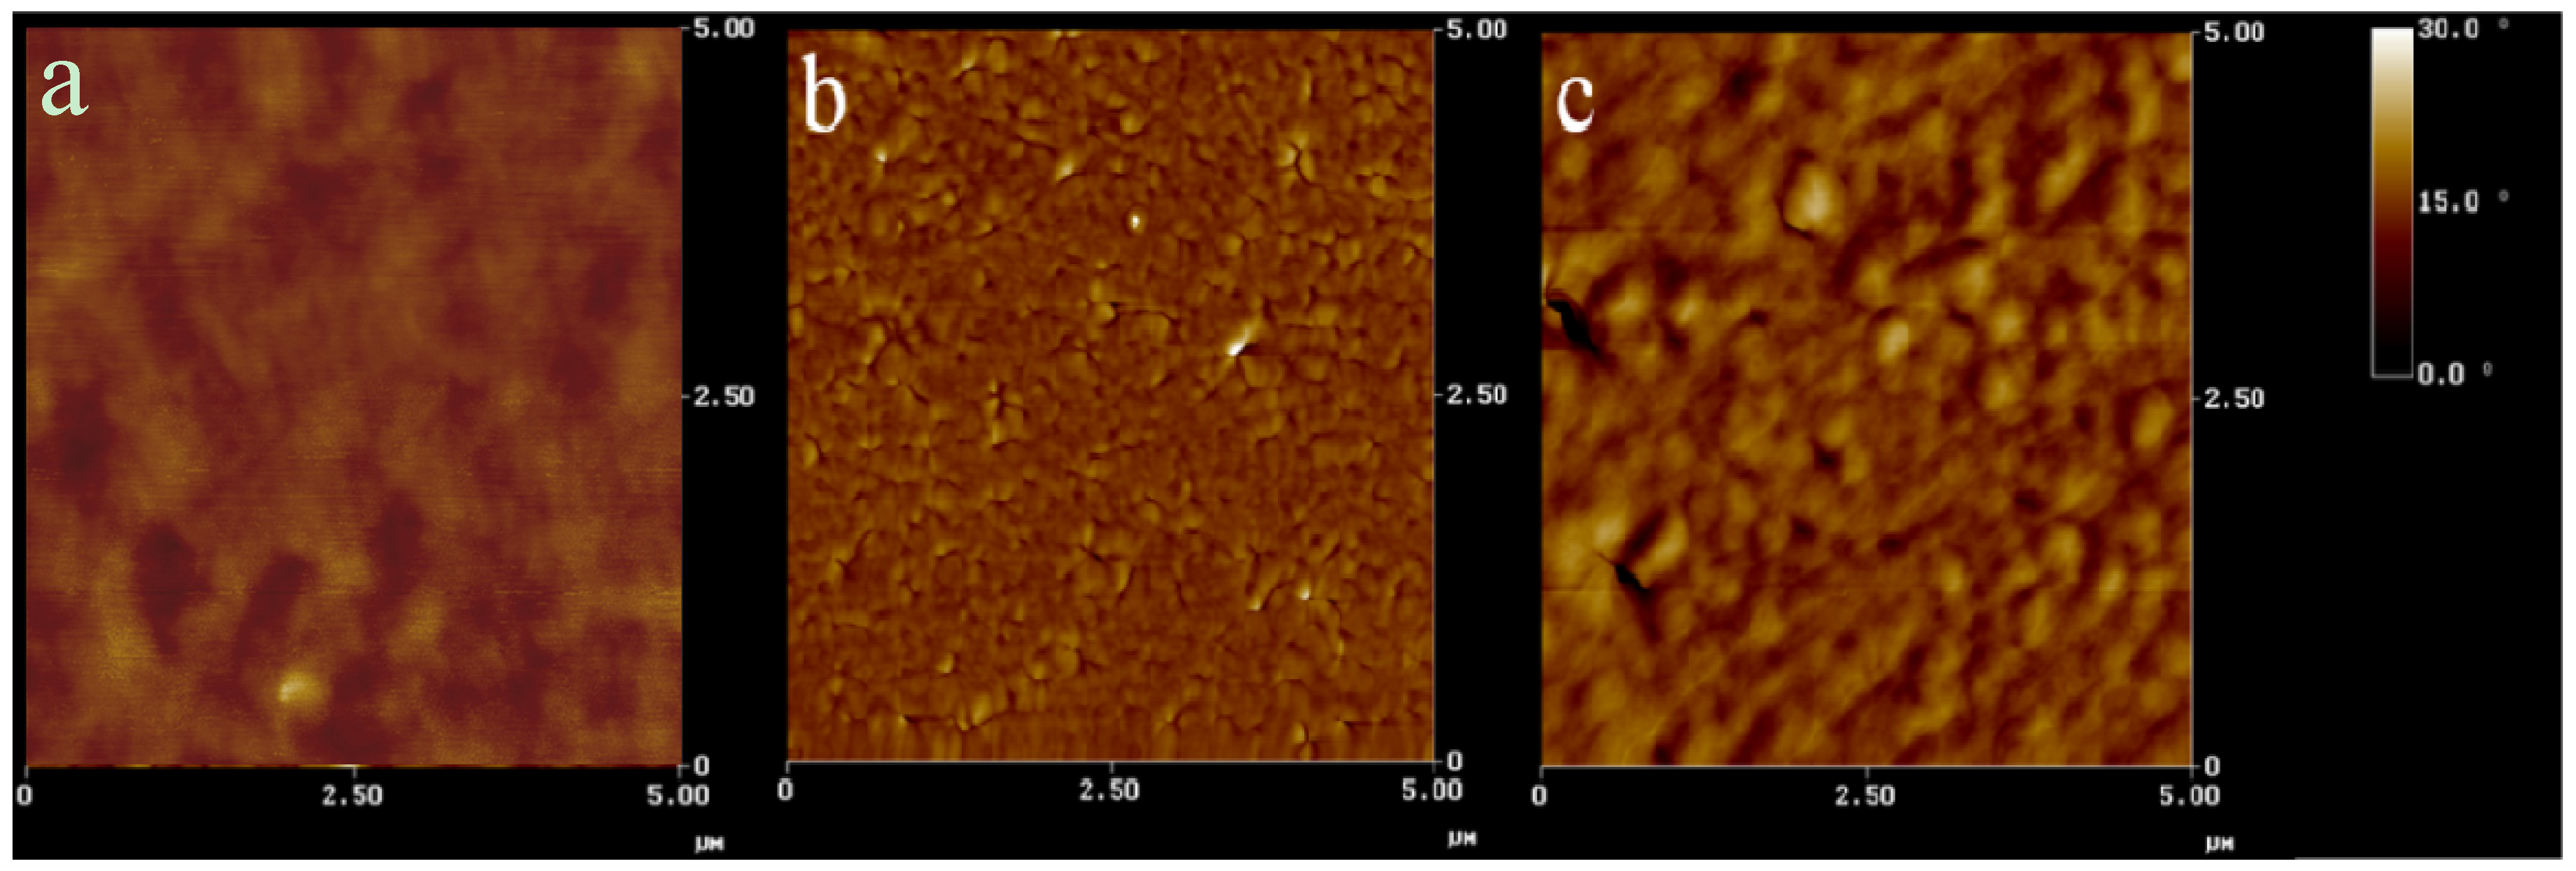
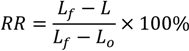
3.1.2. Phase Mixing and PB Domain Size
| Sample | AcHCO | AaHCO | AFCO | α |
|---|---|---|---|---|
| gPU | 5.2 | N/A | 3.0 | 0.63 |
| gPUPB2 | 0.8 | 2.2 | 7.0 | 0.30 |
| gPUPB4 | 0.7 | 2.0 | 6.5 | 0.29 |
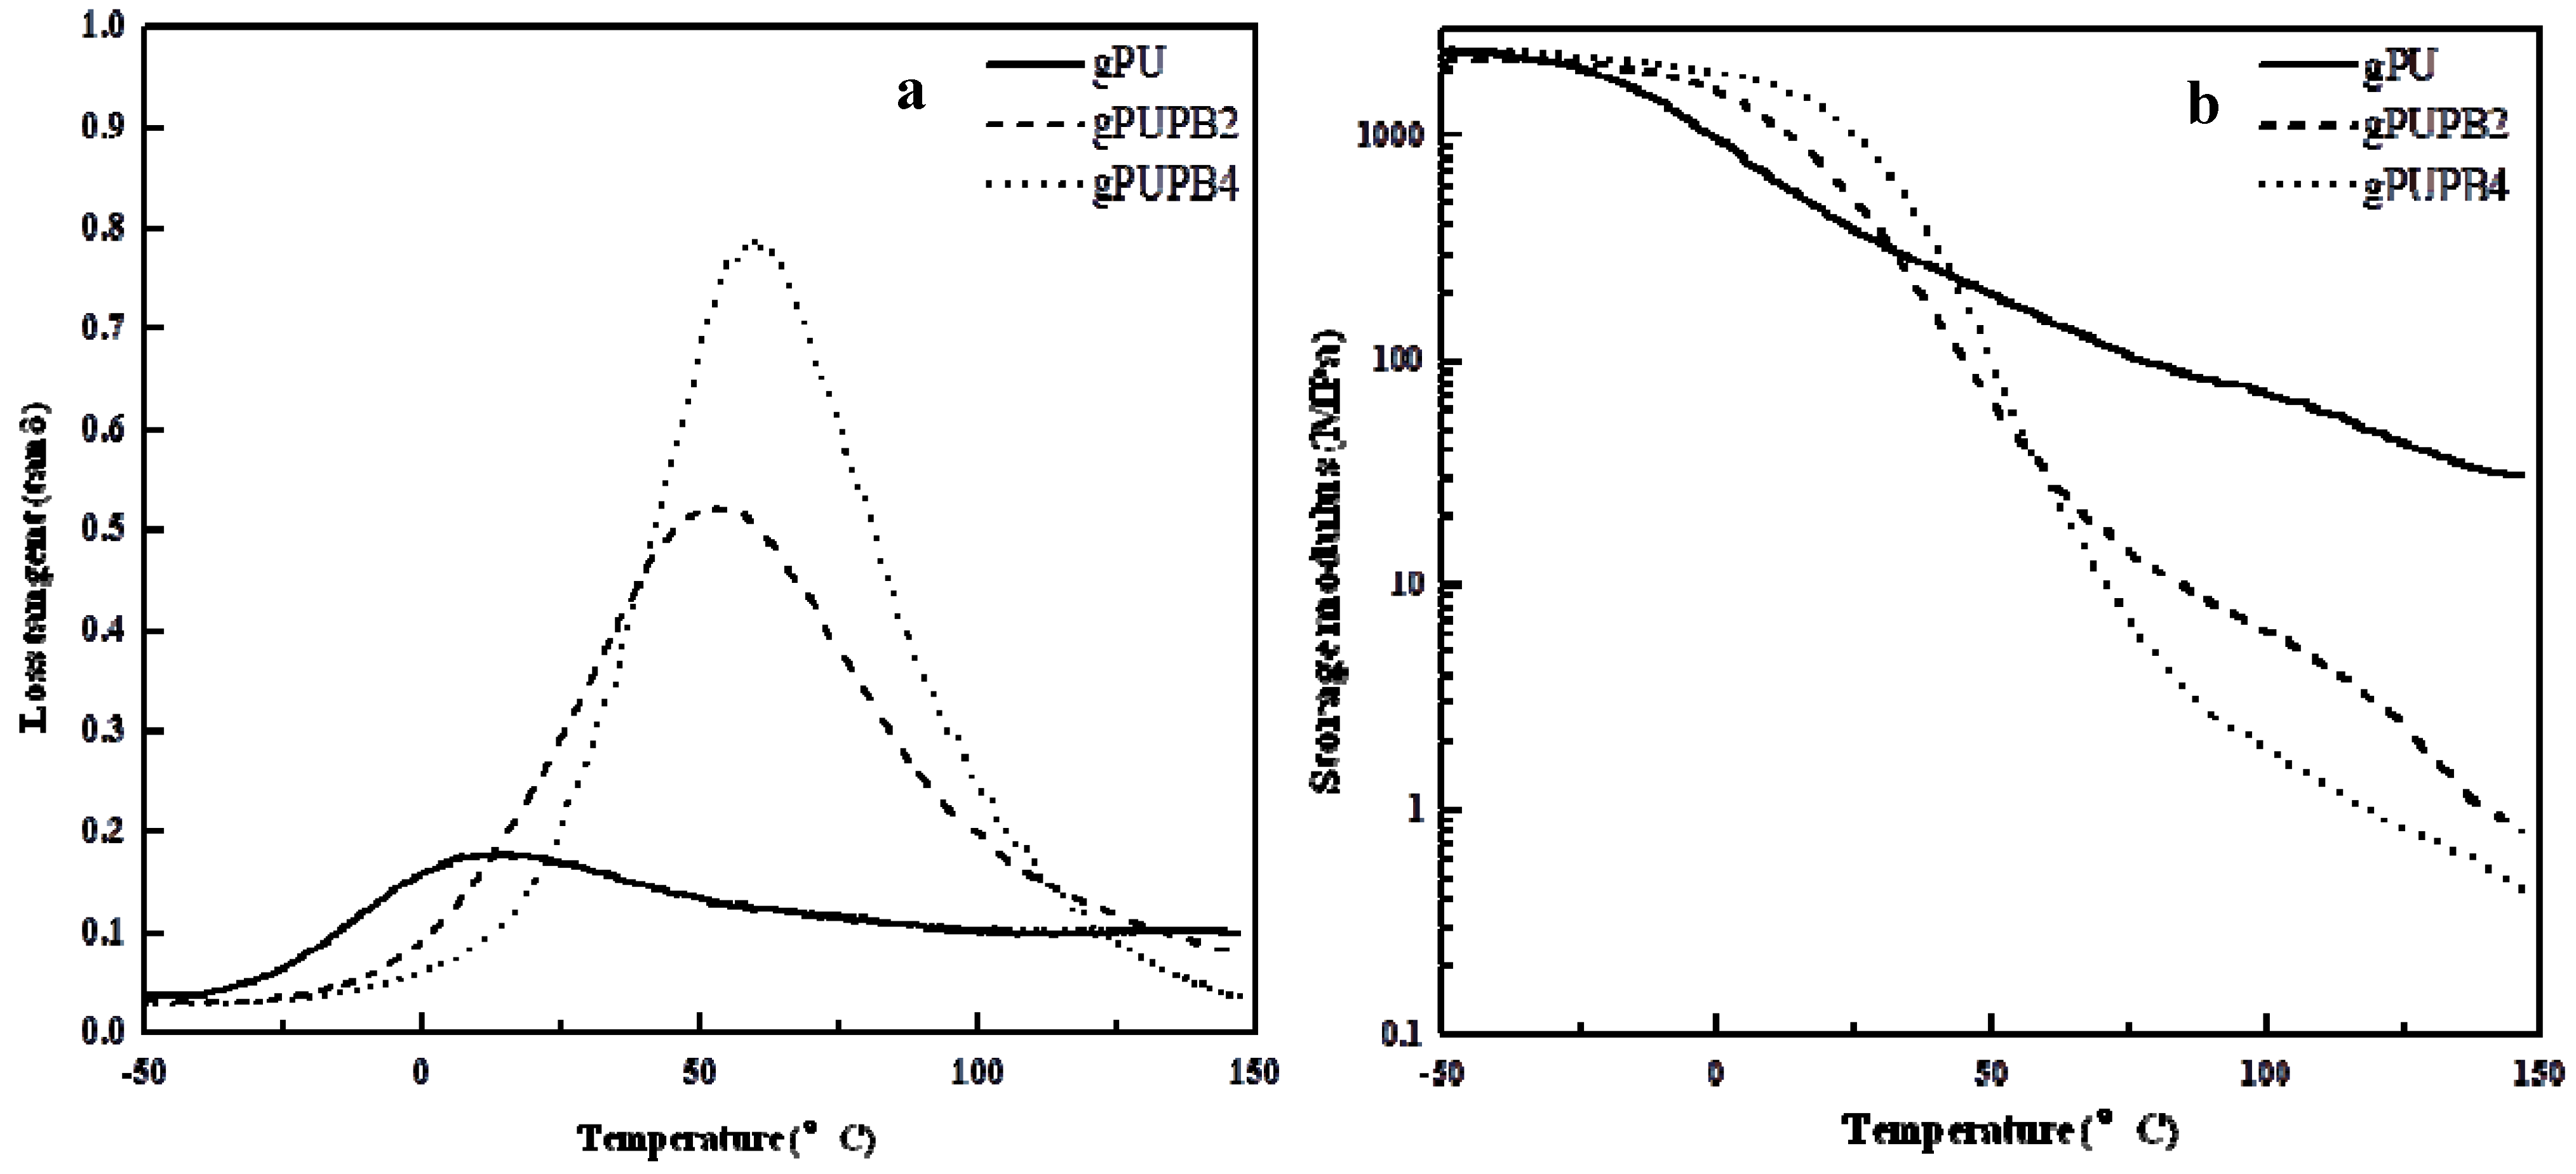
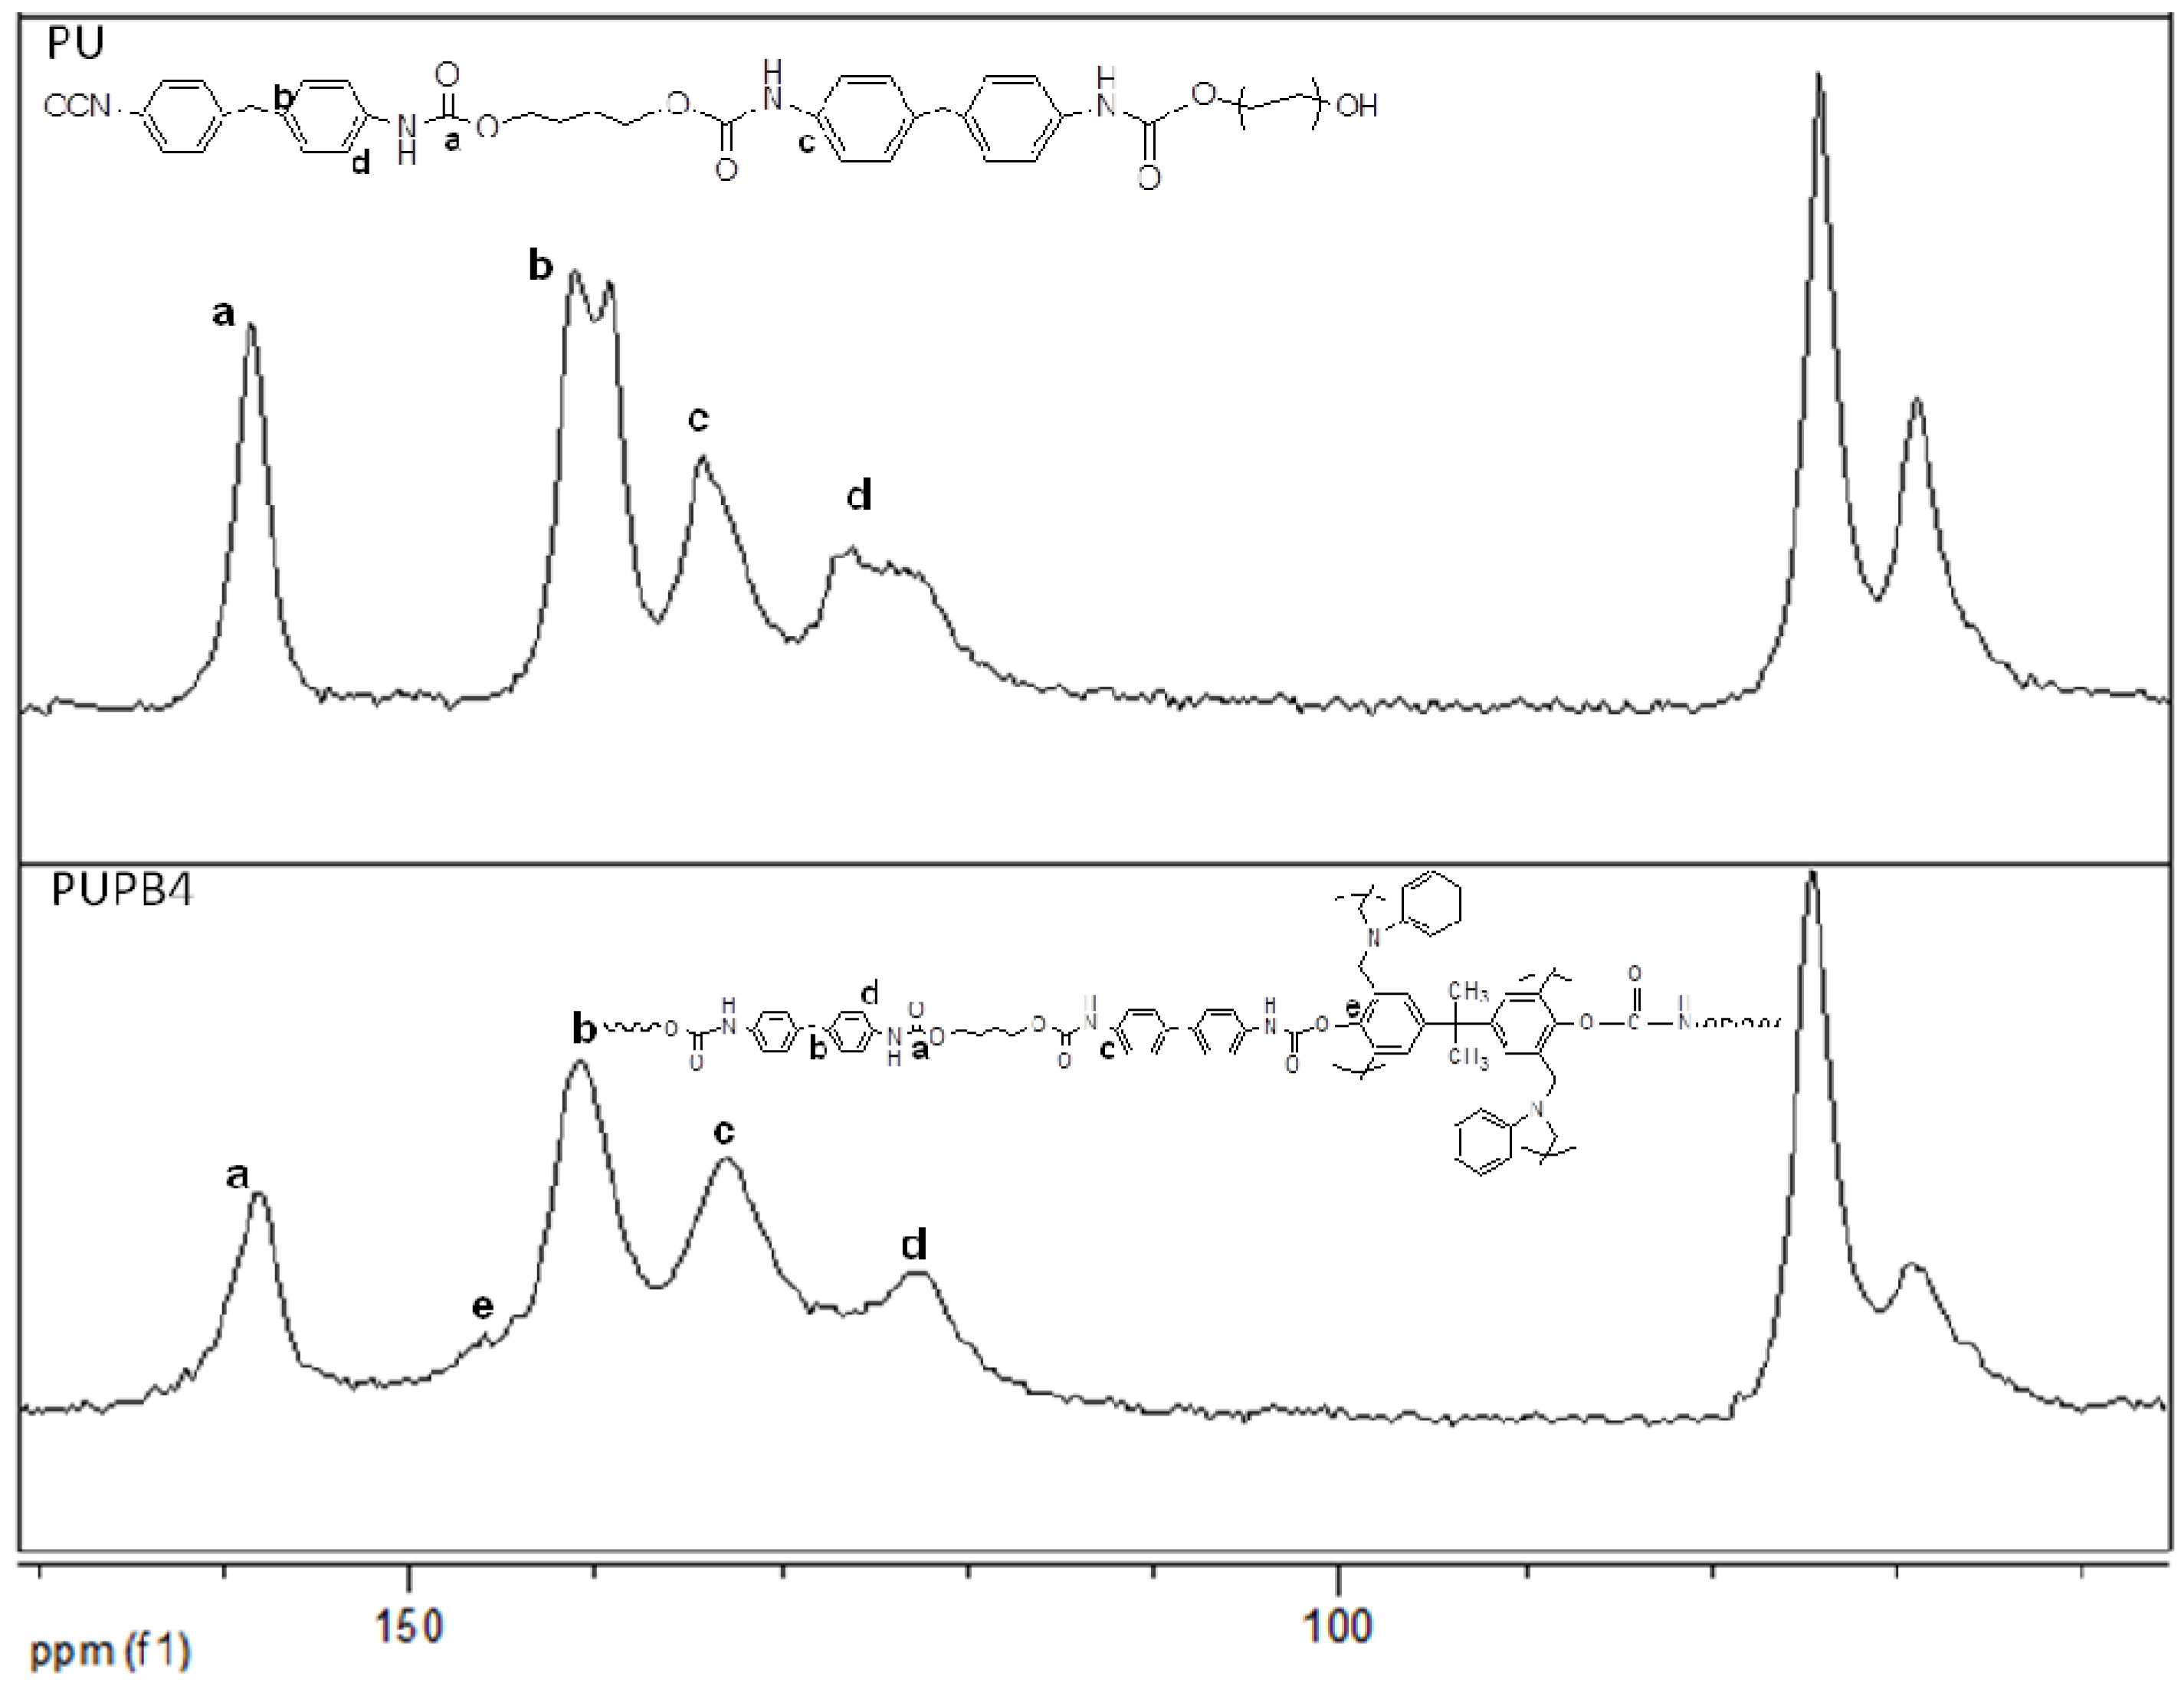
3.1.3. Dynamic Mechanical Properties
| Sample | E'(Tg – 20 °C) (MPa) | E'(Tg + 20 °C) (MPa) | E'(Tg – 20 °C)/E'(Tg + 20 °C) |
|---|---|---|---|
| gPU | 1100 | 292 | 4 |
| gPUPB2 | 818 | 8 | 102 |
| gPUPB4 | 313 | 2 | 156 |
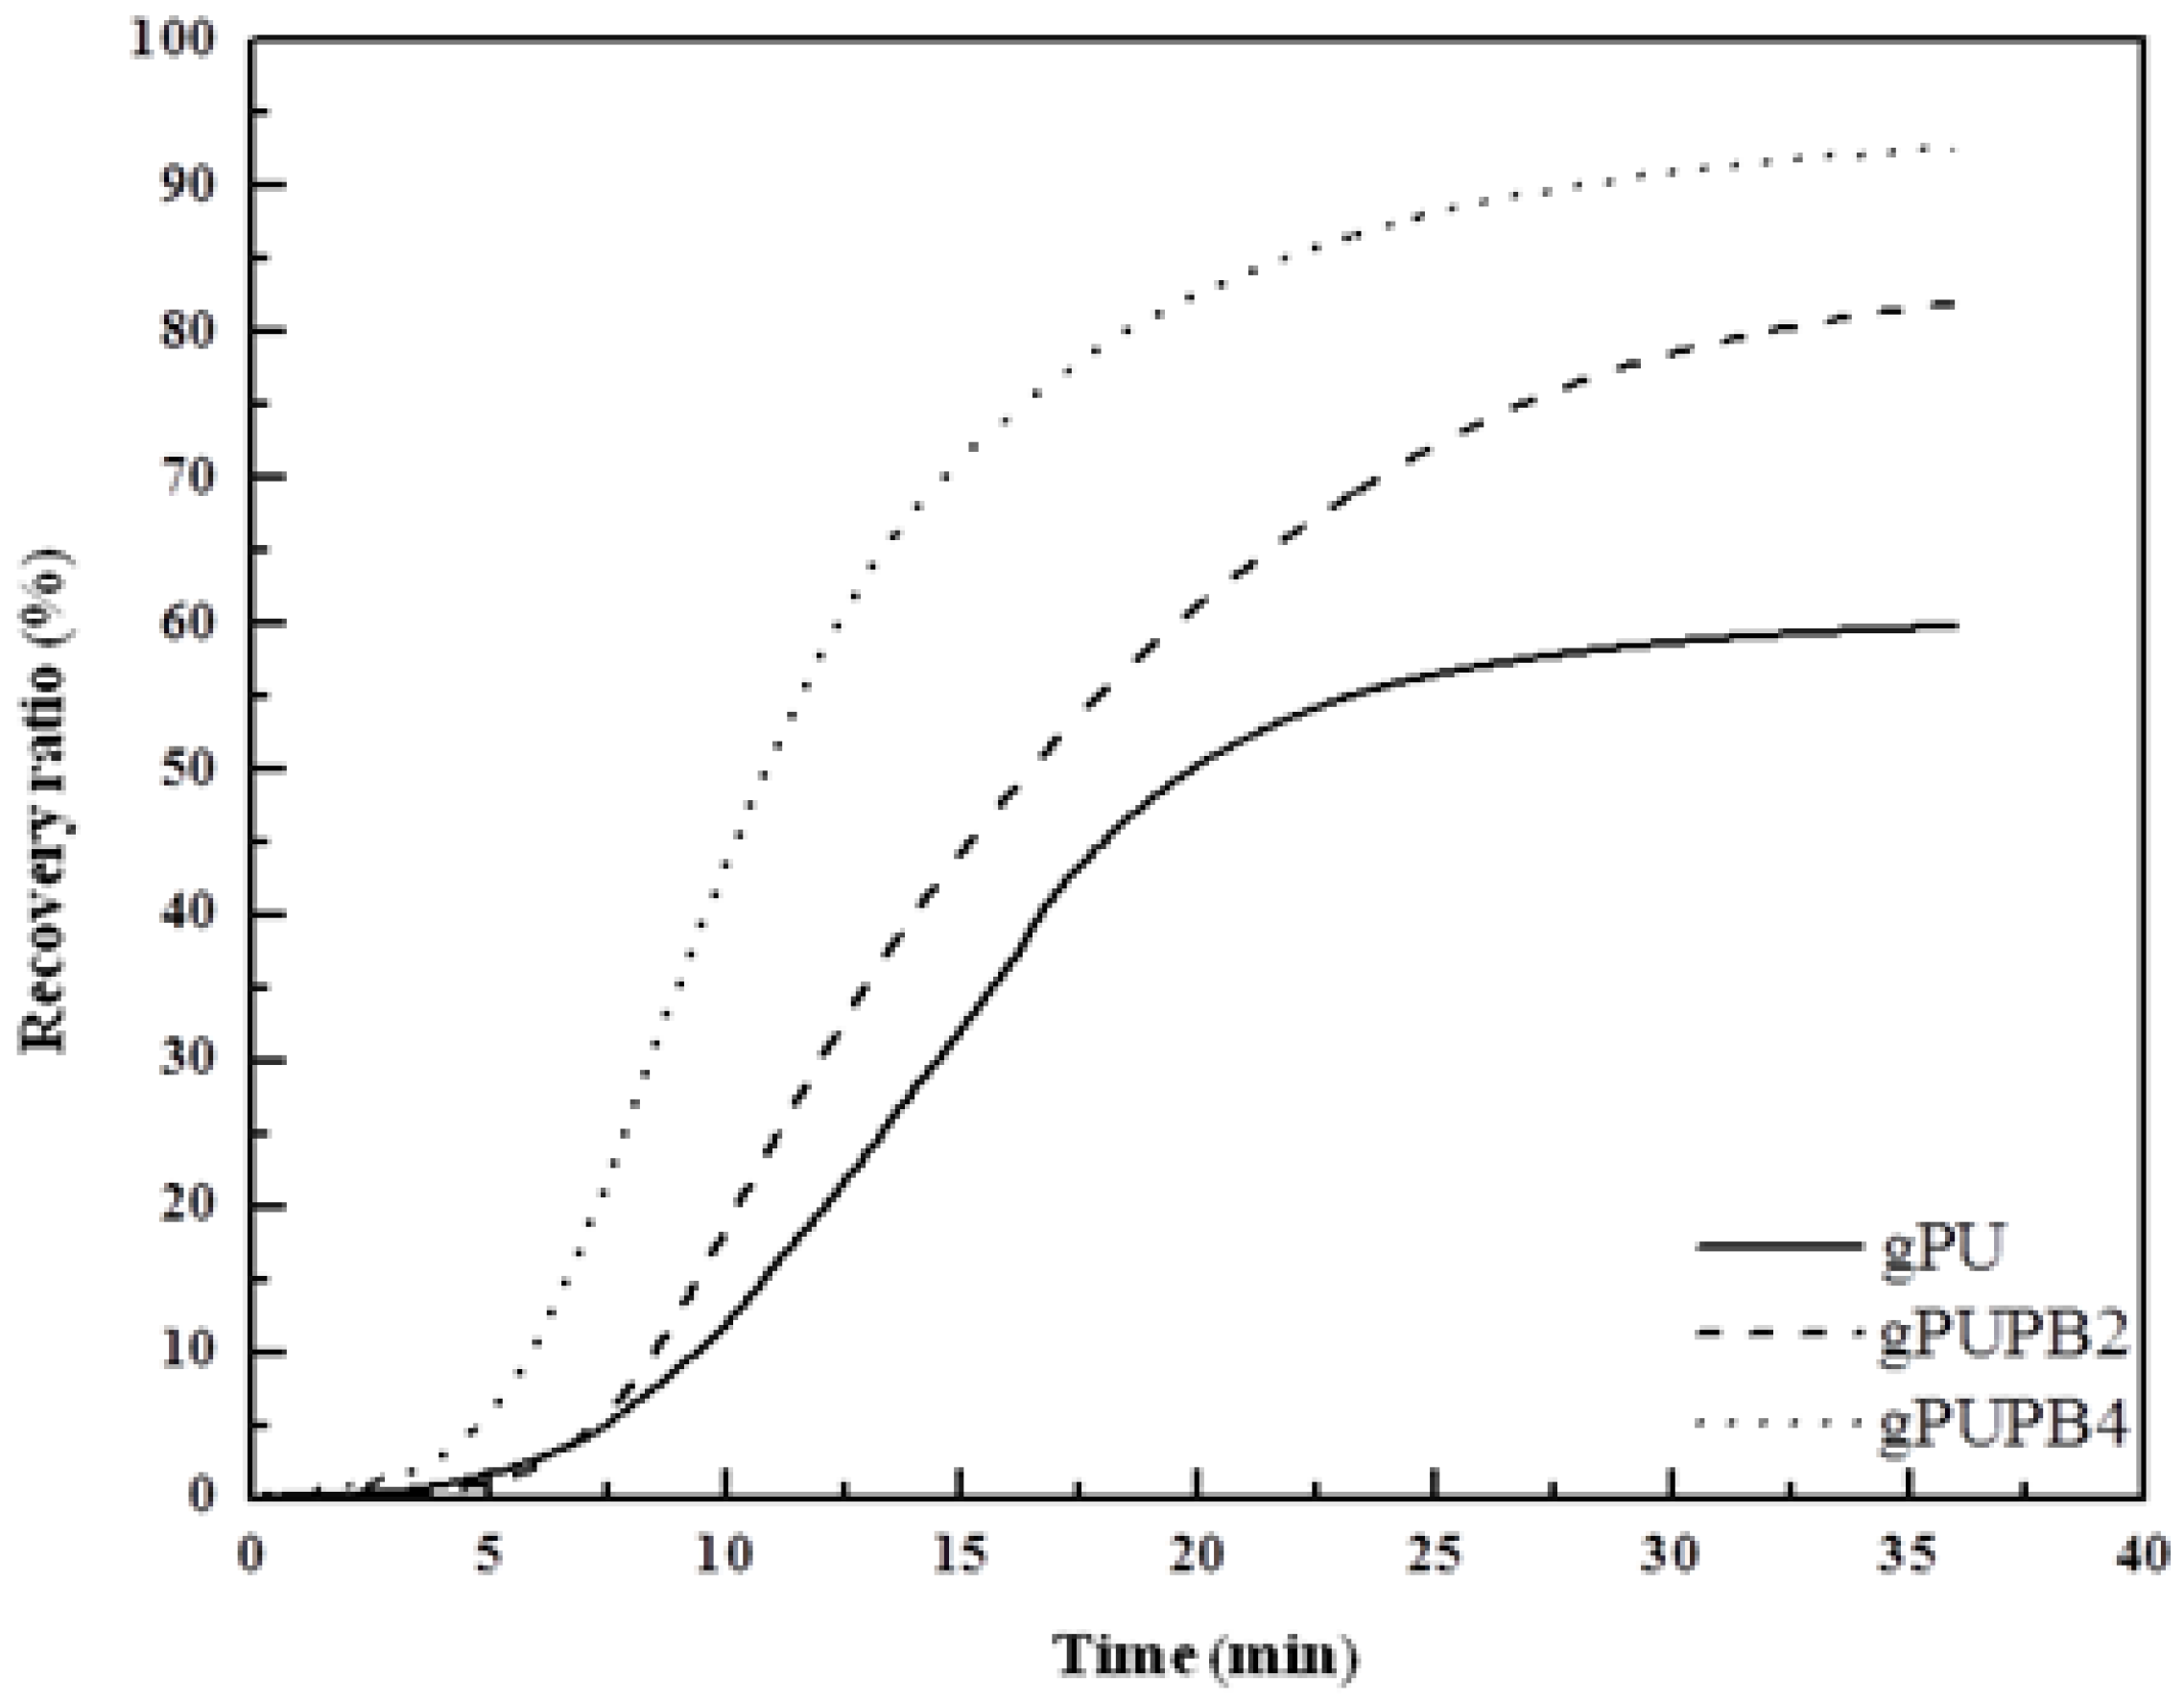
3.1.4. Shape-Memory Properties
3.2. SMPU with Crystalline Soft Segment
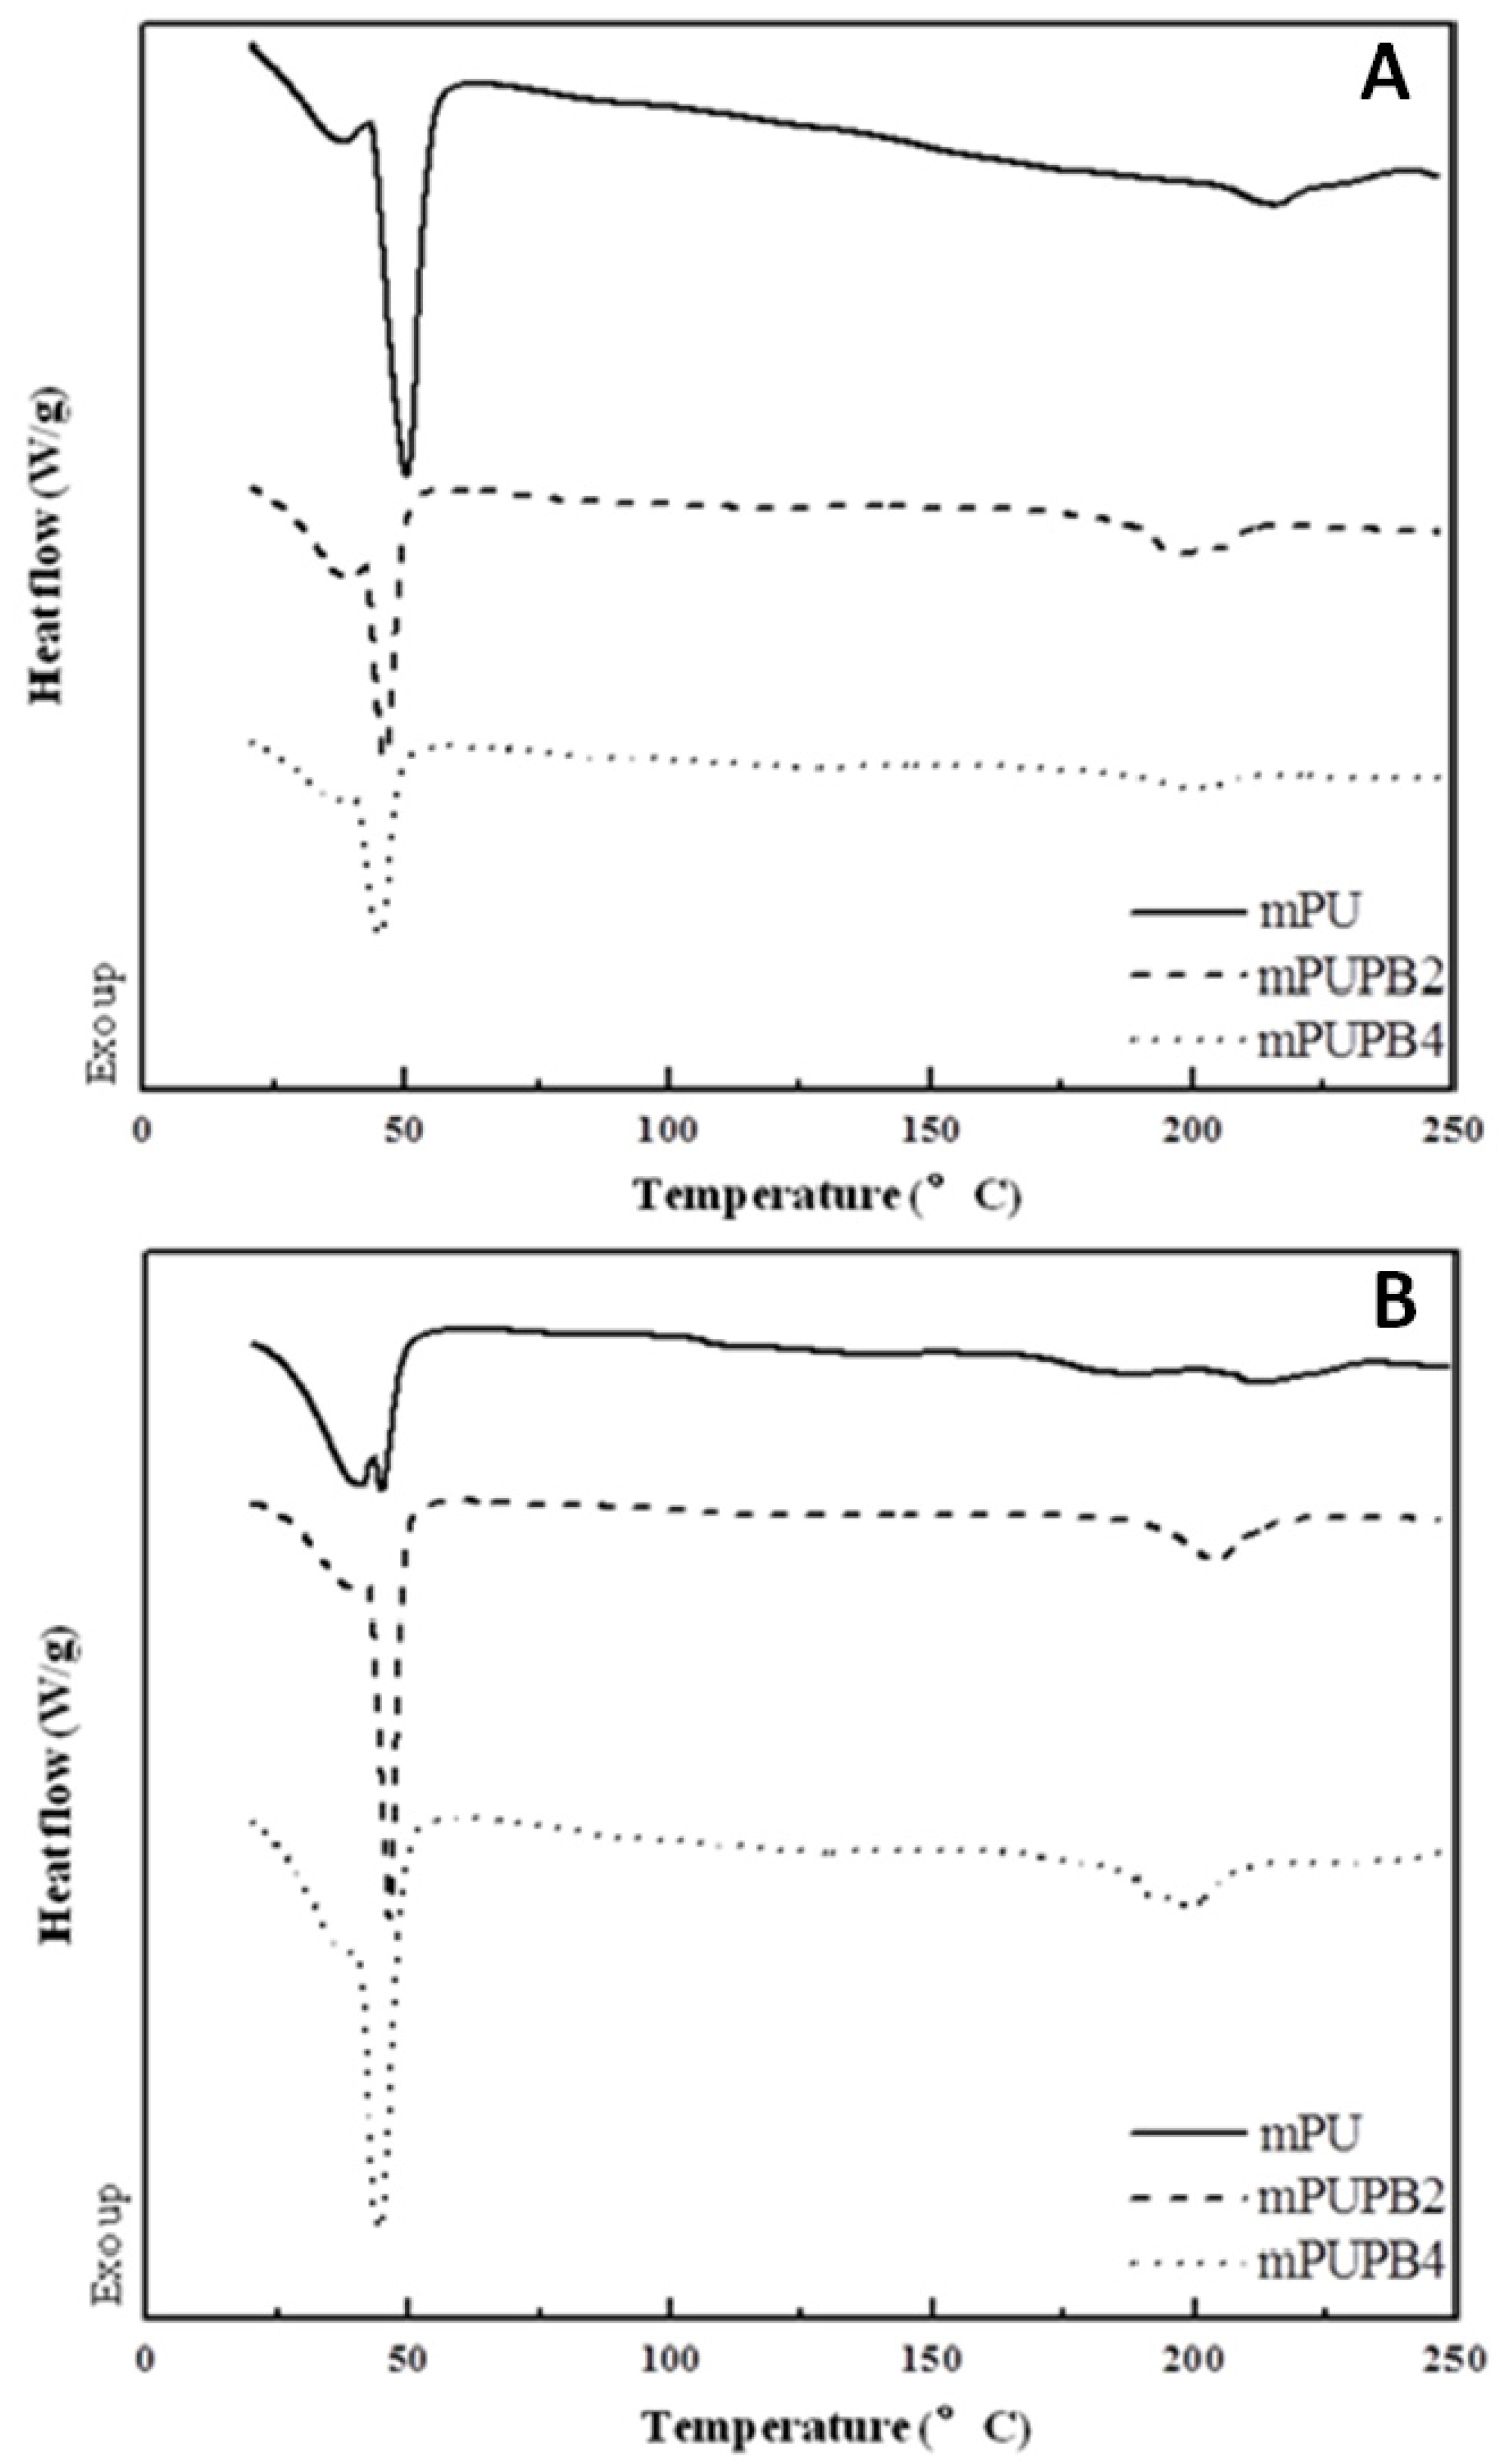
3.2.1. Thermal Transitions
| Sample | Melting temperature (°C) | Heat of fusion (J g−1) | ||
|---|---|---|---|---|
| Before stretching | After stretching | Before stretching | After stretching | |
| mPU | 50 | 45 | 33.3 | 19.9 |
| mPUPB5 | 46 | 46 | 25.1 | 19.3 |
| mPUPB10 | 45 | 45 | 18.1 | 20.8 |
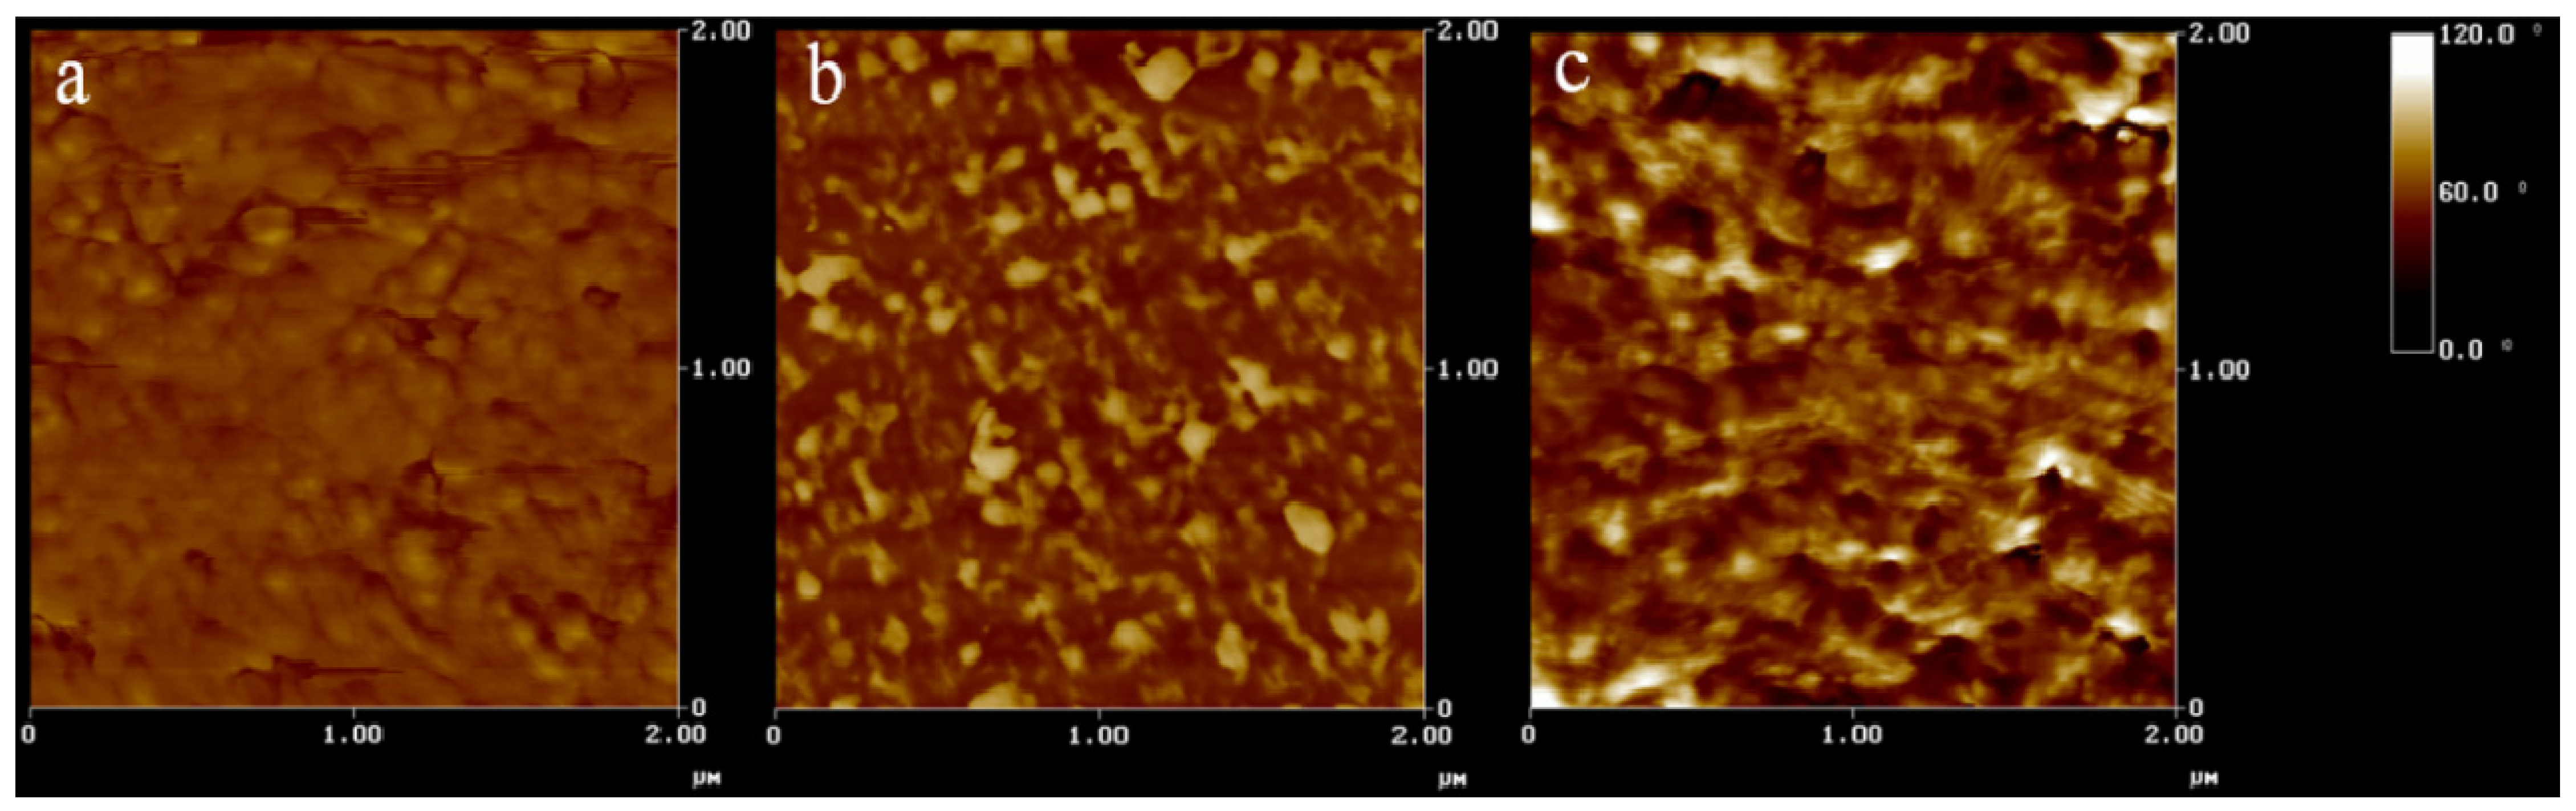
3.2.2. Phase Mixing

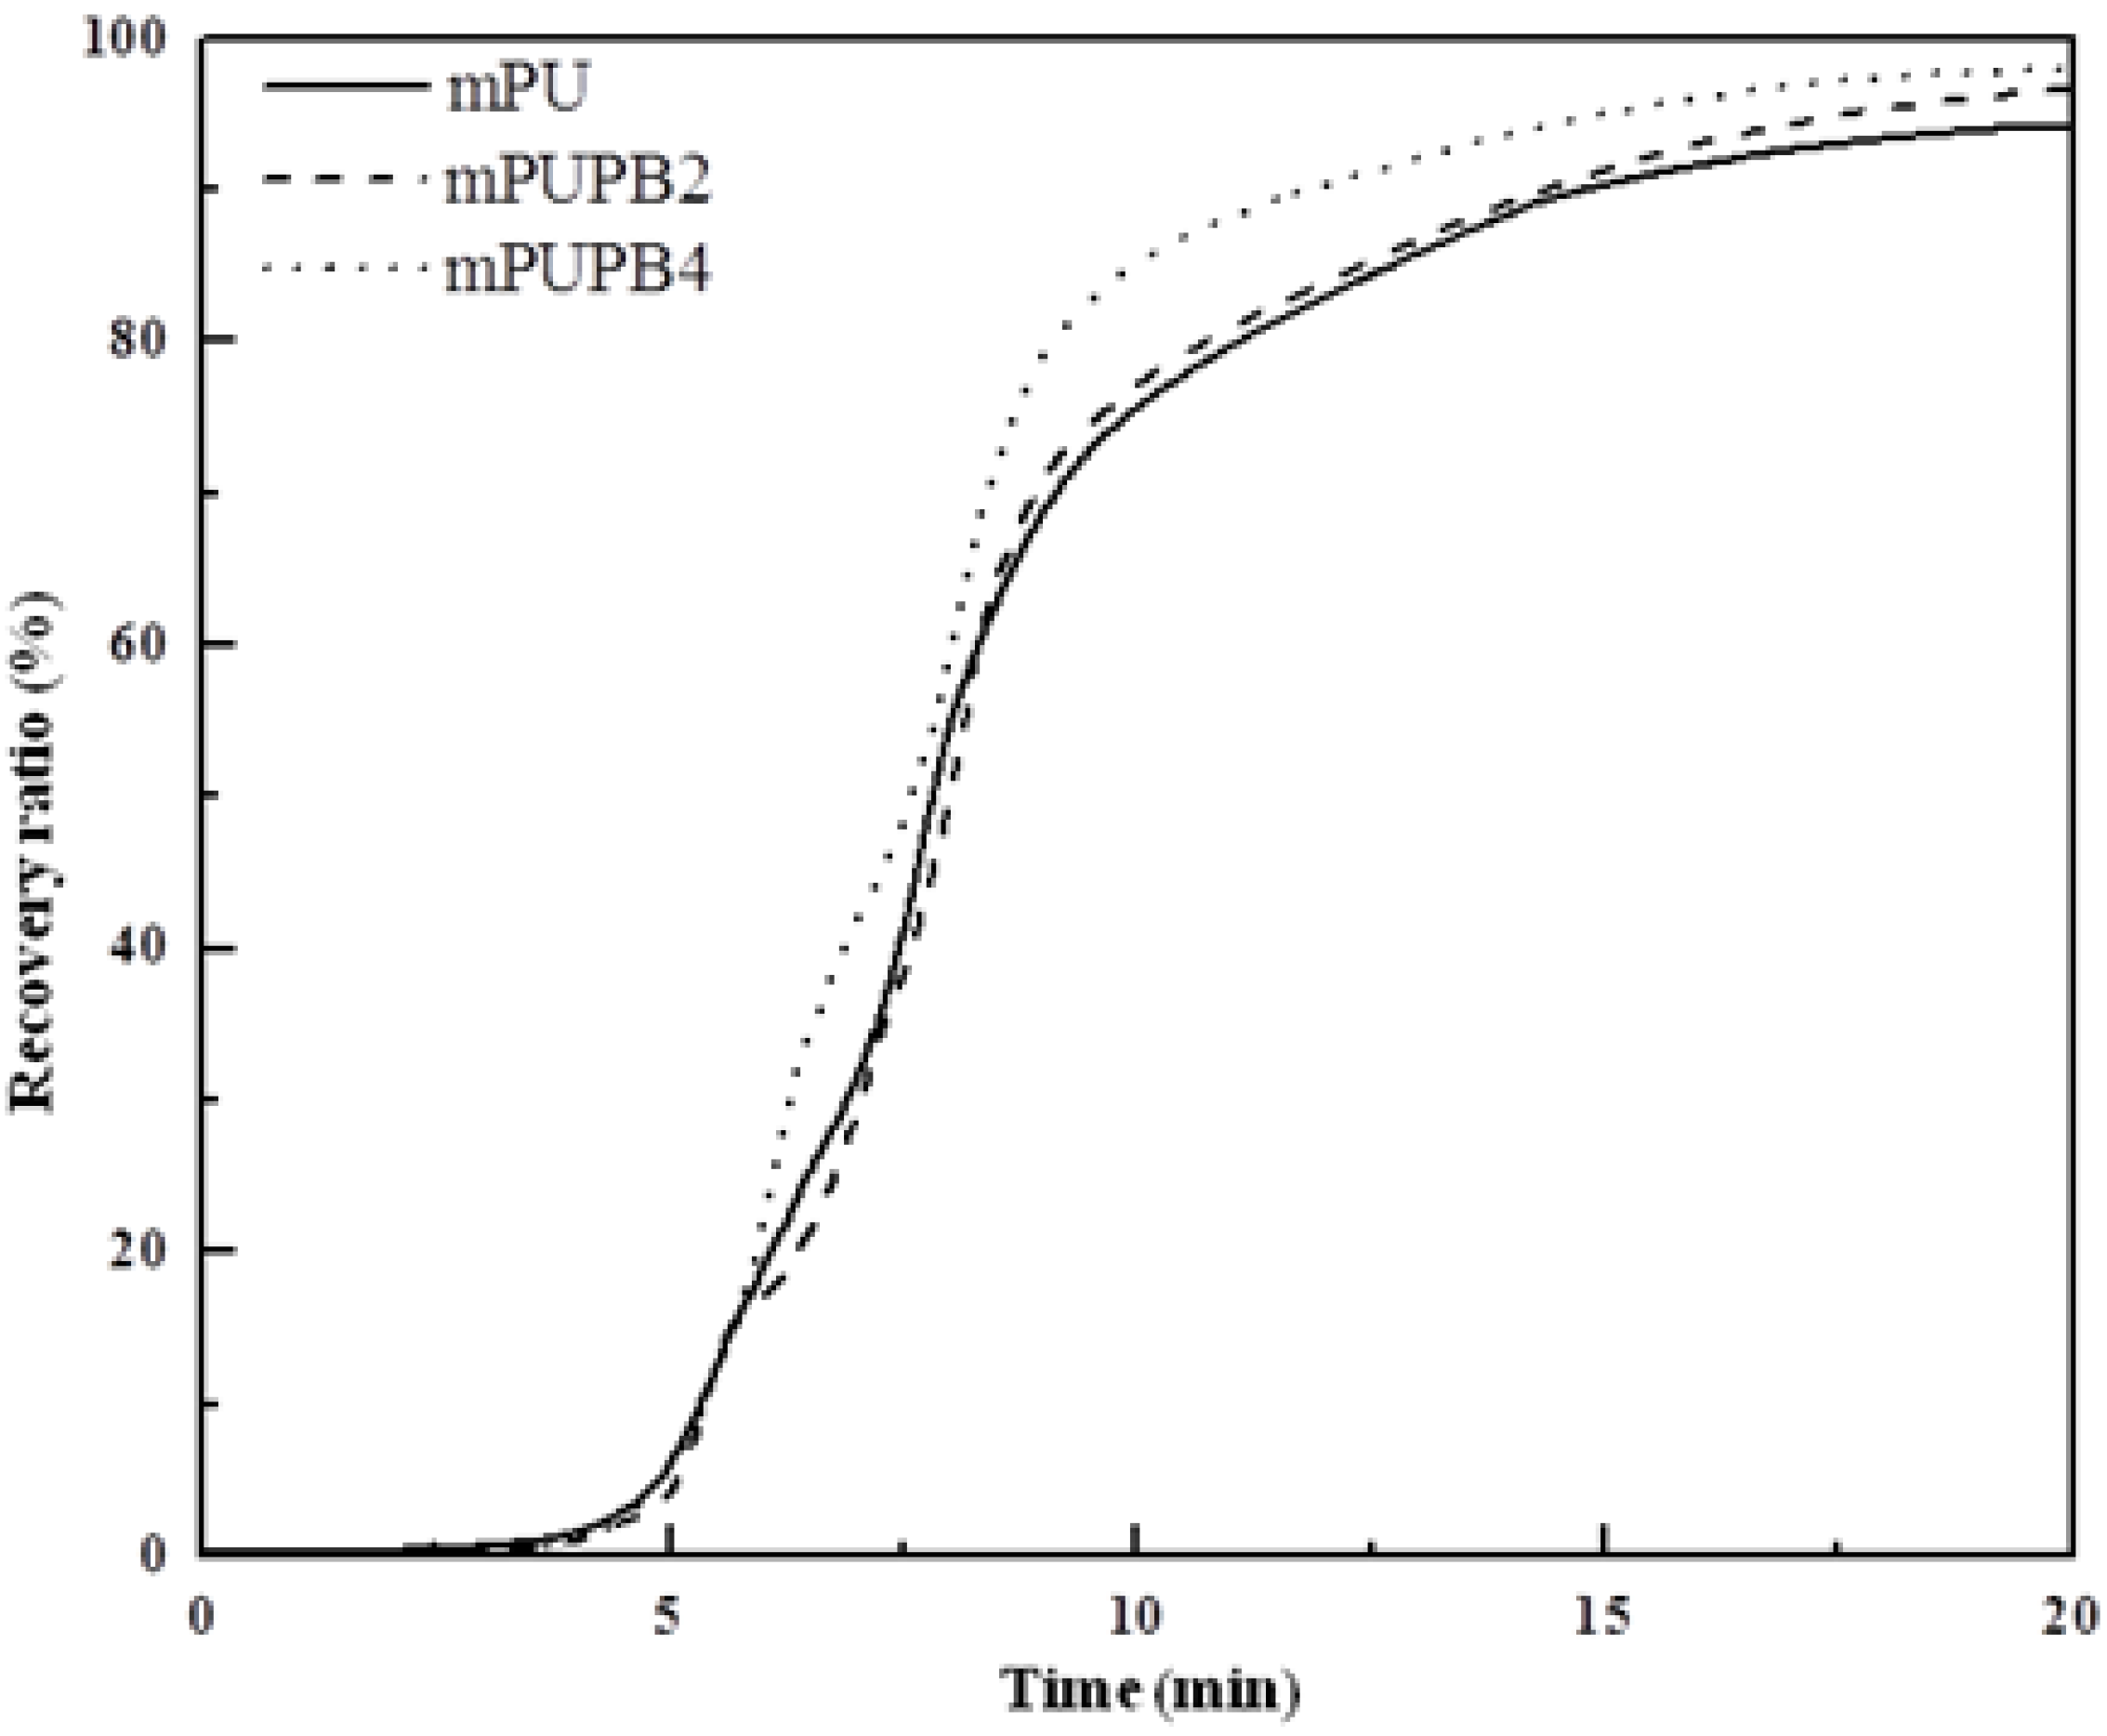
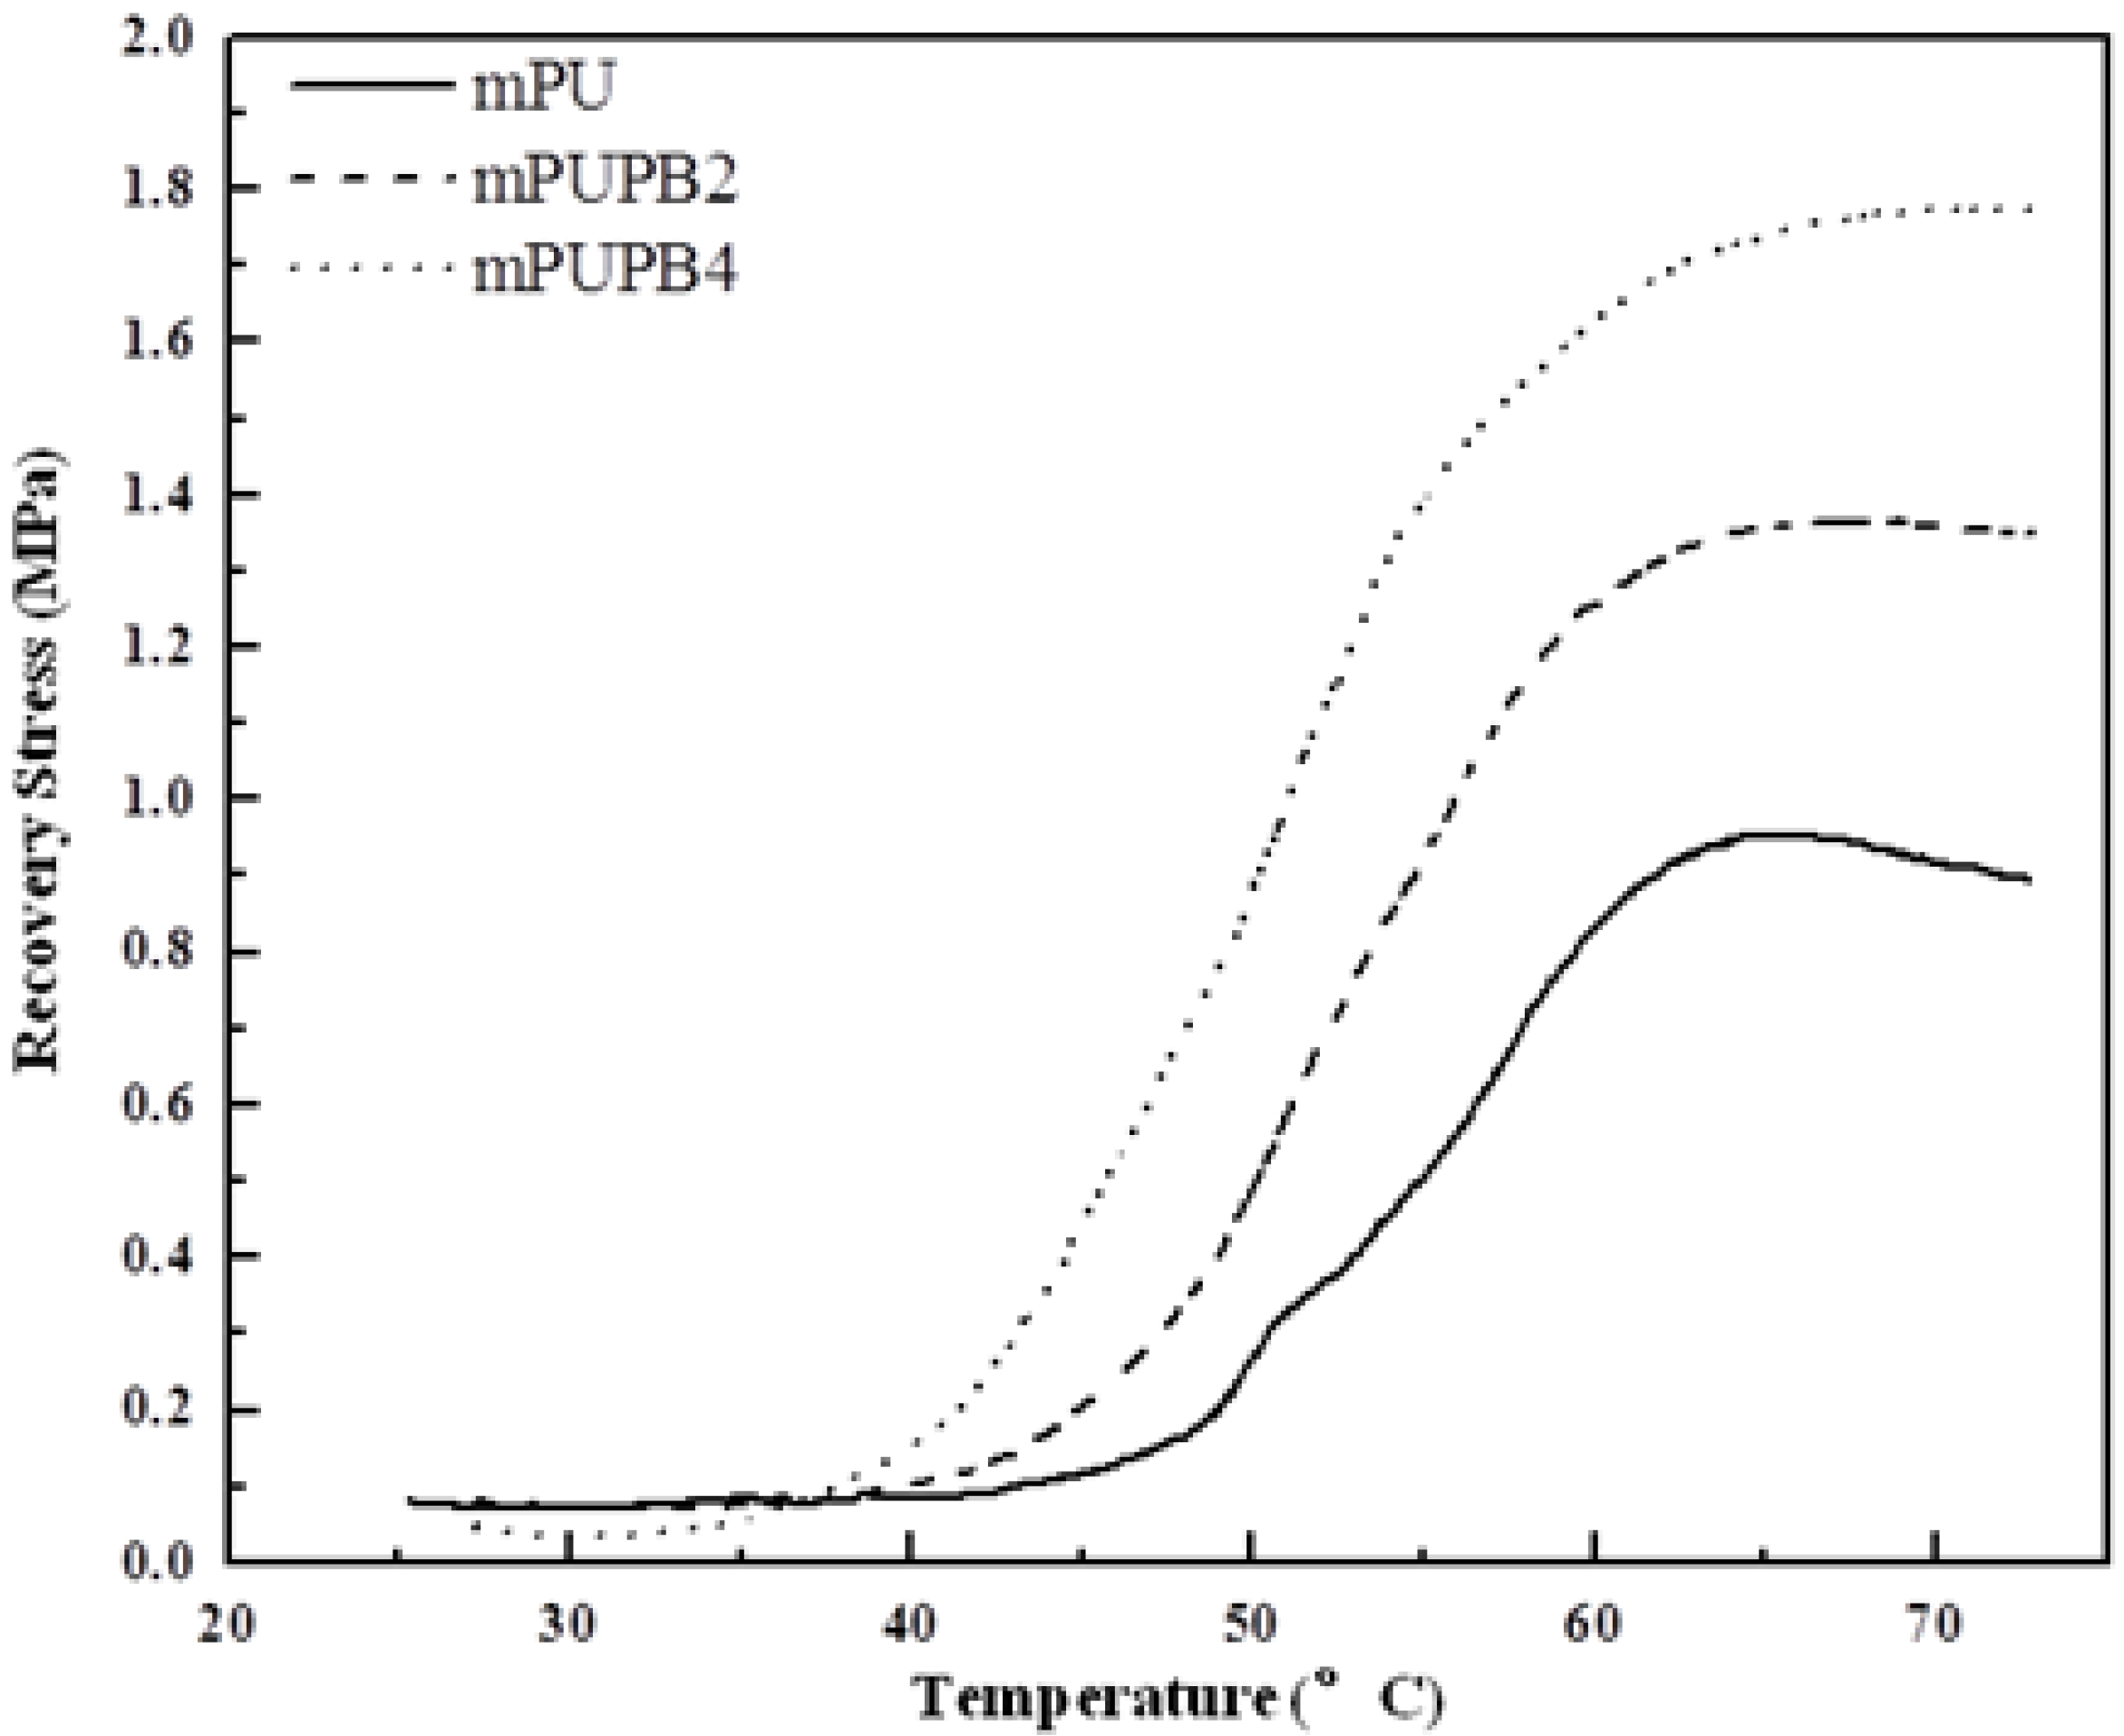
3.2.3. Shape-Memory Properties
4. Conclusions
Conflicts of Interest
Acknowledgment
References
- Wei, Z.G.; Sandstorm, R.; Miyazaki, S. Shape-memory materials and hybrid composites for smart systems: Part I Shape-memory materials. J. Mater. Sci. 1998, 33, 3743–3783. [Google Scholar] [CrossRef]
- Lendlein, A.; Kelch, S. Shape-memory polymers. Angew. Chem. Int. Ed. 2002, 41, 2034–2057. [Google Scholar] [CrossRef]
- Liu, C.; Qin, H.; Mather, P.T. Review of progress in shape-memory polymers. J. Mater. Chem. 2007, 17, 1543–1558. [Google Scholar] [CrossRef]
- Gunes, S.I.; Jana, S.C. Shape memory polymers and their nanocomposites: A review of science and technology of new multifunctional materials. J. Nanosci. Nanotech. 2008, 8, 1616–1637. [Google Scholar] [CrossRef]
- Liang, C.; Rogers, C.A.; Malafeew, E. Investigation of shape memory polymers and their hybrid composites. J. Intel. Mat. Syst. Str. 1997, 8, 380–386. [Google Scholar] [CrossRef]
- Mather, P.T.; Luo, X.; Rousseau, I.A. Shape memory polymer research. Annu. Rev. Mater. Res. 2009, 39, 445–471. [Google Scholar] [CrossRef]
- Luo, X.; Mather, P.T. Triple-shape polymeric composites (TSPCs). Adv. Funct. Mater. 2010, 20, 2649–2656. [Google Scholar] [CrossRef]
- Shao, Y.; Laviguer, C.; Zhu, X.X. Multishape memory effect of norbornene-based copolymers with cholic acid pendant groups. Macromolecules 2012, 45, 1924–1930. [Google Scholar]
- Qin, H.; Mather, P.T. Combined One-Way and Two-Way Shape Memory in a Glass-Forming Nematic Network. Macromolecules 2009, 42, 273–280. [Google Scholar] [CrossRef]
- Xie, T.; Xiao, X.; Cheng, Y.-T. Revealing triple-shape memory effect by polymer bilayers. Macromol. Rapid Commun. 2009, 30, 1823–1827. [Google Scholar] [CrossRef]
- Xie, T. Tunable polymer multi-shape memory effect. Nature 2010, 464, 267–270. [Google Scholar] [CrossRef]
- He, Z.; Satarkar, N.; Xie, T.; Cheng, Y.-T.; Hilt, J.Z. Remote controlled multishape polymer nanocomposites with selective radiofrequency actuations. Adv. Mater. 2011, 23, 3192–3196. [Google Scholar] [CrossRef]
- Liu, Y.; Lv, H.; Lan, X.; Leng, J.; Du, S. Review of electro-active shape-memory polymer composite. Comp. Sci. Tech. 2009, 69, 2064–2068. [Google Scholar] [CrossRef]
- Hayashi, S.; Kobayashi, K. Shape memory fibrous sheet and method of imparting shape memory property to fibrous sheet product. U.S. Patent 5,098,776, 24 March 1992. [Google Scholar]
- Hayashi, S.; Kobayashi, K. Woven fabric made of shape memory polymer. U.S. Patent 5,128,197, 7 July 1992. [Google Scholar]
- Gunatillake, P.A.; McCarthy, S.J.; Meijs, G.F.; Adhikari, R. Shape memory polyurethane or polyurethane-urea polymers. U.S. Patent 6,858,680, 22 February 2005. [Google Scholar]
- Hayashi, S.; Ishibashi, A.; Ikenoue, T. Heat insulator made of shape memory polymer foam. U.S. Patent 5,093,384, 3 March 1992. [Google Scholar]
- Lin, J.R.; Chen, L.W. Study on shape-memory behavior of polyether-based polyurethanes. I. Influence of hard-segment content. J. Appl. Polym. Sci. 1998, 69, 1563–1574. [Google Scholar] [CrossRef]
- Lin, J.R.; Chen, L.W. Study on shape-memory behavior of polyether-based polyurethanes. II. Influence of soft-segment molecular weight. J. Appl. Polym. Sci. 1998, 69, 1575–1586. [Google Scholar] [CrossRef]
- Murarka, M.R.; Deanin, R.D. Structure and Properties of One-Shot Thermoplastic Polyurethane Elastomers; University of Lowell: Lowell, MA, USA, 1983. [Google Scholar]
- Kim, B.K.; Lee, S.Y. Polyurethanes having shape memory effects. Polymer 1996, 37, 5781–5793. [Google Scholar] [CrossRef]
- Li, F.; Zhang, X.; Hou, J.; Xu, M.; Ma, D.; Kim, B.K. Studies on Thermally Stimulated Shape Memory Effect of Segmented Polyurethanes. J. Appl. Polym. Sci. 1997, 64, 1511–1516. [Google Scholar] [CrossRef]
- Ji, F.L.; Hu, J.L.; Li, T.C.; Wong, Y.W. Morphology and shape memory effect of segmented polyurethanes. Part 1: With crystalline reversible phase. Polymer 2007, 48, 5133–5145. [Google Scholar] [CrossRef]
- Müller, W.W.; Pretsch, T. Hydrolytic aging of crystallizable shape memory poly(ester urethane): Effects on the thermo-mechanical properties and visco-elastic modeling. Eur. Polym. J. 2010, 46, 1745–1758. [Google Scholar] [CrossRef]
- Weng, S.; Xia, Z.; Chen, J.; Gong, L. Shape Memory Properties of Polycaprolactone-based Polyurethanes Prepared by Reactive Extrusion. J. Appl. Polym. Sci. 2013, 127, 748–759. [Google Scholar] [CrossRef]
- Bothe, M.; Emmerling, F.; Pretsch, T. Poly(ester urethane) with varying polyester chain length: Polymorphism and shape memory behavior. Macromol. Chem. Phys. 2013, 214, 2683–2693. [Google Scholar] [CrossRef]
- Jimenez, G.; Jana, S.C. Composites of carbon nanofibers and thermoplastic polyurethanes with shape-memory properties prepared by chaotic mixing. Polym. Eng. Sci. 2009, 49, 2020–2030. [Google Scholar] [CrossRef]
- Gunes, I.S.; Jimenez, G.; Jana, S.C. Carbonaceous fillers for shape memory actuation of polyurethane composites by resistive heating. Carbon 2009, 47, 981–997. [Google Scholar] [CrossRef]
- Koerner, H.; Price, G.; Pearce, N.A.; Alexander, M.; Vaia, R.A. Remotely actuated polymer nanocomposites—Stress-recovery of carbon-nanotube-filled thermoplastic elastomers. Nat. Mater. 2004, 3, 115–120. [Google Scholar] [CrossRef]
- Gall, K.; Mikulas, M.; Munshi, N.A.; Beavers, F.; Tupper, M. Carbon fiber reinforced shape memory polymer composites. J. Intel. Mat. Syst. Str. 2000, 11, 877–886. [Google Scholar] [CrossRef]
- Zhang, C.S.; Ni, Q.Q.; Fu, S.Y. Electromagnetic interference shielding effect of nanocomposites with carbon nanotube and shape memory polymer. Compos. Sci. Tech. 2007, 67, 2973–2980. [Google Scholar] [CrossRef]
- Leng, J.; Lv, H.; Liu, Y.; Du, S. Synergic effect of carbon black and short carbon fiber on shape memory polymer actuation by electricity. J. Appl. Phys. 2008, 104, 104917:1–104917:4. [Google Scholar]
- Meng, Q.; Hu, J.; Zhu, Y. Shape-memory polyurethane/multiwalled carbon nanotube fibers. J. App. Poly. Sci. 2007, 106, 837–848. [Google Scholar] [CrossRef]
- Pattanayak, A.; Jana, S.C. Thermoplastic polyurethane nanocomposites of reactive silicate clays: Effects of soft segments on properties. Polymer 2005, 46, 5183–5193. [Google Scholar] [CrossRef]
- Cao, F.; Jana, S.C. Nanoclay-tethered shape memory polyurethane nanocomposites. Polymer 2007, 48, 3790–3800. [Google Scholar] [CrossRef]
- Gunes, I.S.; Cao, F.; Jimenez, G.; Jana, S.C. Evaluation of nanoparticulate fillers for development of shape memory polyurethane nanocomposites. Polymer 2008, 49, 2223–2234. [Google Scholar] [CrossRef]
- Kurahashi, E.; Sugimoto, H.; Nakanishi, E.; Nagata, K.; Inomata, K. Shape memory properties of polyurethane/poly(oxyethylene) blends. Soft Matter 2012, 8, 496–503. [Google Scholar] [CrossRef]
- Jeong, H.M.; Song, J.H.; Lee, S.Y.; Kim, B.K. Miscibility and shape memory property of poly(vinyl chloride)/thermoplastic polyurethane blends. J. Mater. Sci. 2001, 36, 5457–5463. [Google Scholar] [CrossRef]
- Madbouly, S.A.; Lendlein, A. Degradable Polyurethane/Soy Protein Shape-Memory Polymer Blends Prepared Via Environmentally-Friendly Aqueous Dispersions. Macromol. Mater. Eng. 2012, 297, 1213–1224. [Google Scholar] [CrossRef]
- Gunes, I.S.; Pérez-Bolivar, C.; Cao, F.; Jimenez, G.A.; Anzenbacher, P.; Jana, S.C. Analysis of non-covalent interactions between the nanoparticulate fillers and the matrix polymer as applied to shape memory performance. J. Mater. Chem. 2010, 20, 3467–3474. [Google Scholar] [CrossRef]
- Ishida, H.; Allen, D.J. Physical and mechanical characterization of near-zero shrinkage polybenzoxazines. J. Polym. Sci. B Polym. Phys. 1996, 34, 1019–1030. [Google Scholar] [CrossRef]
- Ishida, H.; Sanders, D.P. Regioselectivity and solid-state structure of alkyl-substituted aromatic amine-based polybenzoxazines. Macromolecules 2000, 33, 8149–8157. [Google Scholar] [CrossRef]
- Takeichi, T.; Kawauchi, T.; Agag, T. High-performance polymer alloys of polybenzoxazine and bismaleimide. Polymer 2008, 49, 1173–1179. [Google Scholar] [CrossRef]
- Cui, Y.; Chen, Y.; Wang, X.; Tian, G,; Tang, X. Synthesis and characterization of polyurethane/polybenzoxazine-based interpenetrating polymer networks (IPNs). Polym. Int. 2003, 52, 1246–1248. [Google Scholar] [CrossRef]
- Rimdusit, S.; Pirstpindvong, S.; Tanthapanichakoon, W.; Damrongsakkul, S. Toughening of polybenzoxazine by alloying with urethane prepolymer and flexible epoxy: A comparative study. Poly. Eng. Sci. 2005, 45, 288–296. [Google Scholar] [CrossRef]
- Takechi, T.; Guo, Y. Preparation and properties of poly(urethane-benzoxazine)s based on monofunctional benzoxazine monomer. Polym. J. 2001, 33, 437–443. [Google Scholar] [CrossRef]
- Takechi, T.; Guo, Y.; Agag, T. Synthesis and characterization of poly(urethane-benzoxazine) films as novel type of polyurethane/phenolic resin composites. J. Polym. Sci. A Polym. Chem. 2000, 38, 4165–4176. [Google Scholar] [CrossRef]
- Erden, N.; Jana, S.C. Synthesis and Characterization of Shape-Memory Polyurethane–Polybenzoxazine Compounds. Macromol. Chem. Phys. 2013, 214, 1225–1237. [Google Scholar] [CrossRef]
- Lee, S.H.; Kim, J.W.; Kim, B.K. Shape memory polyurethanes having crosslinks in soft and hard segments. Smart Mater. Struct. 2004, 13, 1345–1350. [Google Scholar] [CrossRef]
- Ishida, H. Polybenzoxazine nanocomposites of clay and method for making same. U.S. Patent 6,323,270, 27 November 2001. [Google Scholar]
- Ishida, H.; Ning, X. Phenolic materials via ring-opening polymerization: Synthesis and characterization of bisphenol-A based benzoxazines and their polymers. J. Polym. Sci. A Polym. Chem. 1994, 32, 1121–1129. [Google Scholar] [CrossRef]
- Hayashi, S. Properties and Applications of Polyurethane-Series Shape Memory Polymer. Int. Prog. Urethane 1993, 6, 90–115. [Google Scholar]
© 2014 by the authors; licensee MDPI, Basel, Switzerland. This article is an open access article distributed under the terms and conditions of the Creative Commons Attribution license (http://creativecommons.org/licenses/by/3.0/).
Share and Cite
Gu, S.; Jana, S. Effects of Polybenzoxazine on Shape Memory Properties of Polyurethanes with Amorphous and Crystalline Soft Segments. Polymers 2014, 6, 1008-1025. https://doi.org/10.3390/polym6041008
Gu S, Jana S. Effects of Polybenzoxazine on Shape Memory Properties of Polyurethanes with Amorphous and Crystalline Soft Segments. Polymers. 2014; 6(4):1008-1025. https://doi.org/10.3390/polym6041008
Chicago/Turabian StyleGu, Senlong, and Sadhan Jana. 2014. "Effects of Polybenzoxazine on Shape Memory Properties of Polyurethanes with Amorphous and Crystalline Soft Segments" Polymers 6, no. 4: 1008-1025. https://doi.org/10.3390/polym6041008
APA StyleGu, S., & Jana, S. (2014). Effects of Polybenzoxazine on Shape Memory Properties of Polyurethanes with Amorphous and Crystalline Soft Segments. Polymers, 6(4), 1008-1025. https://doi.org/10.3390/polym6041008