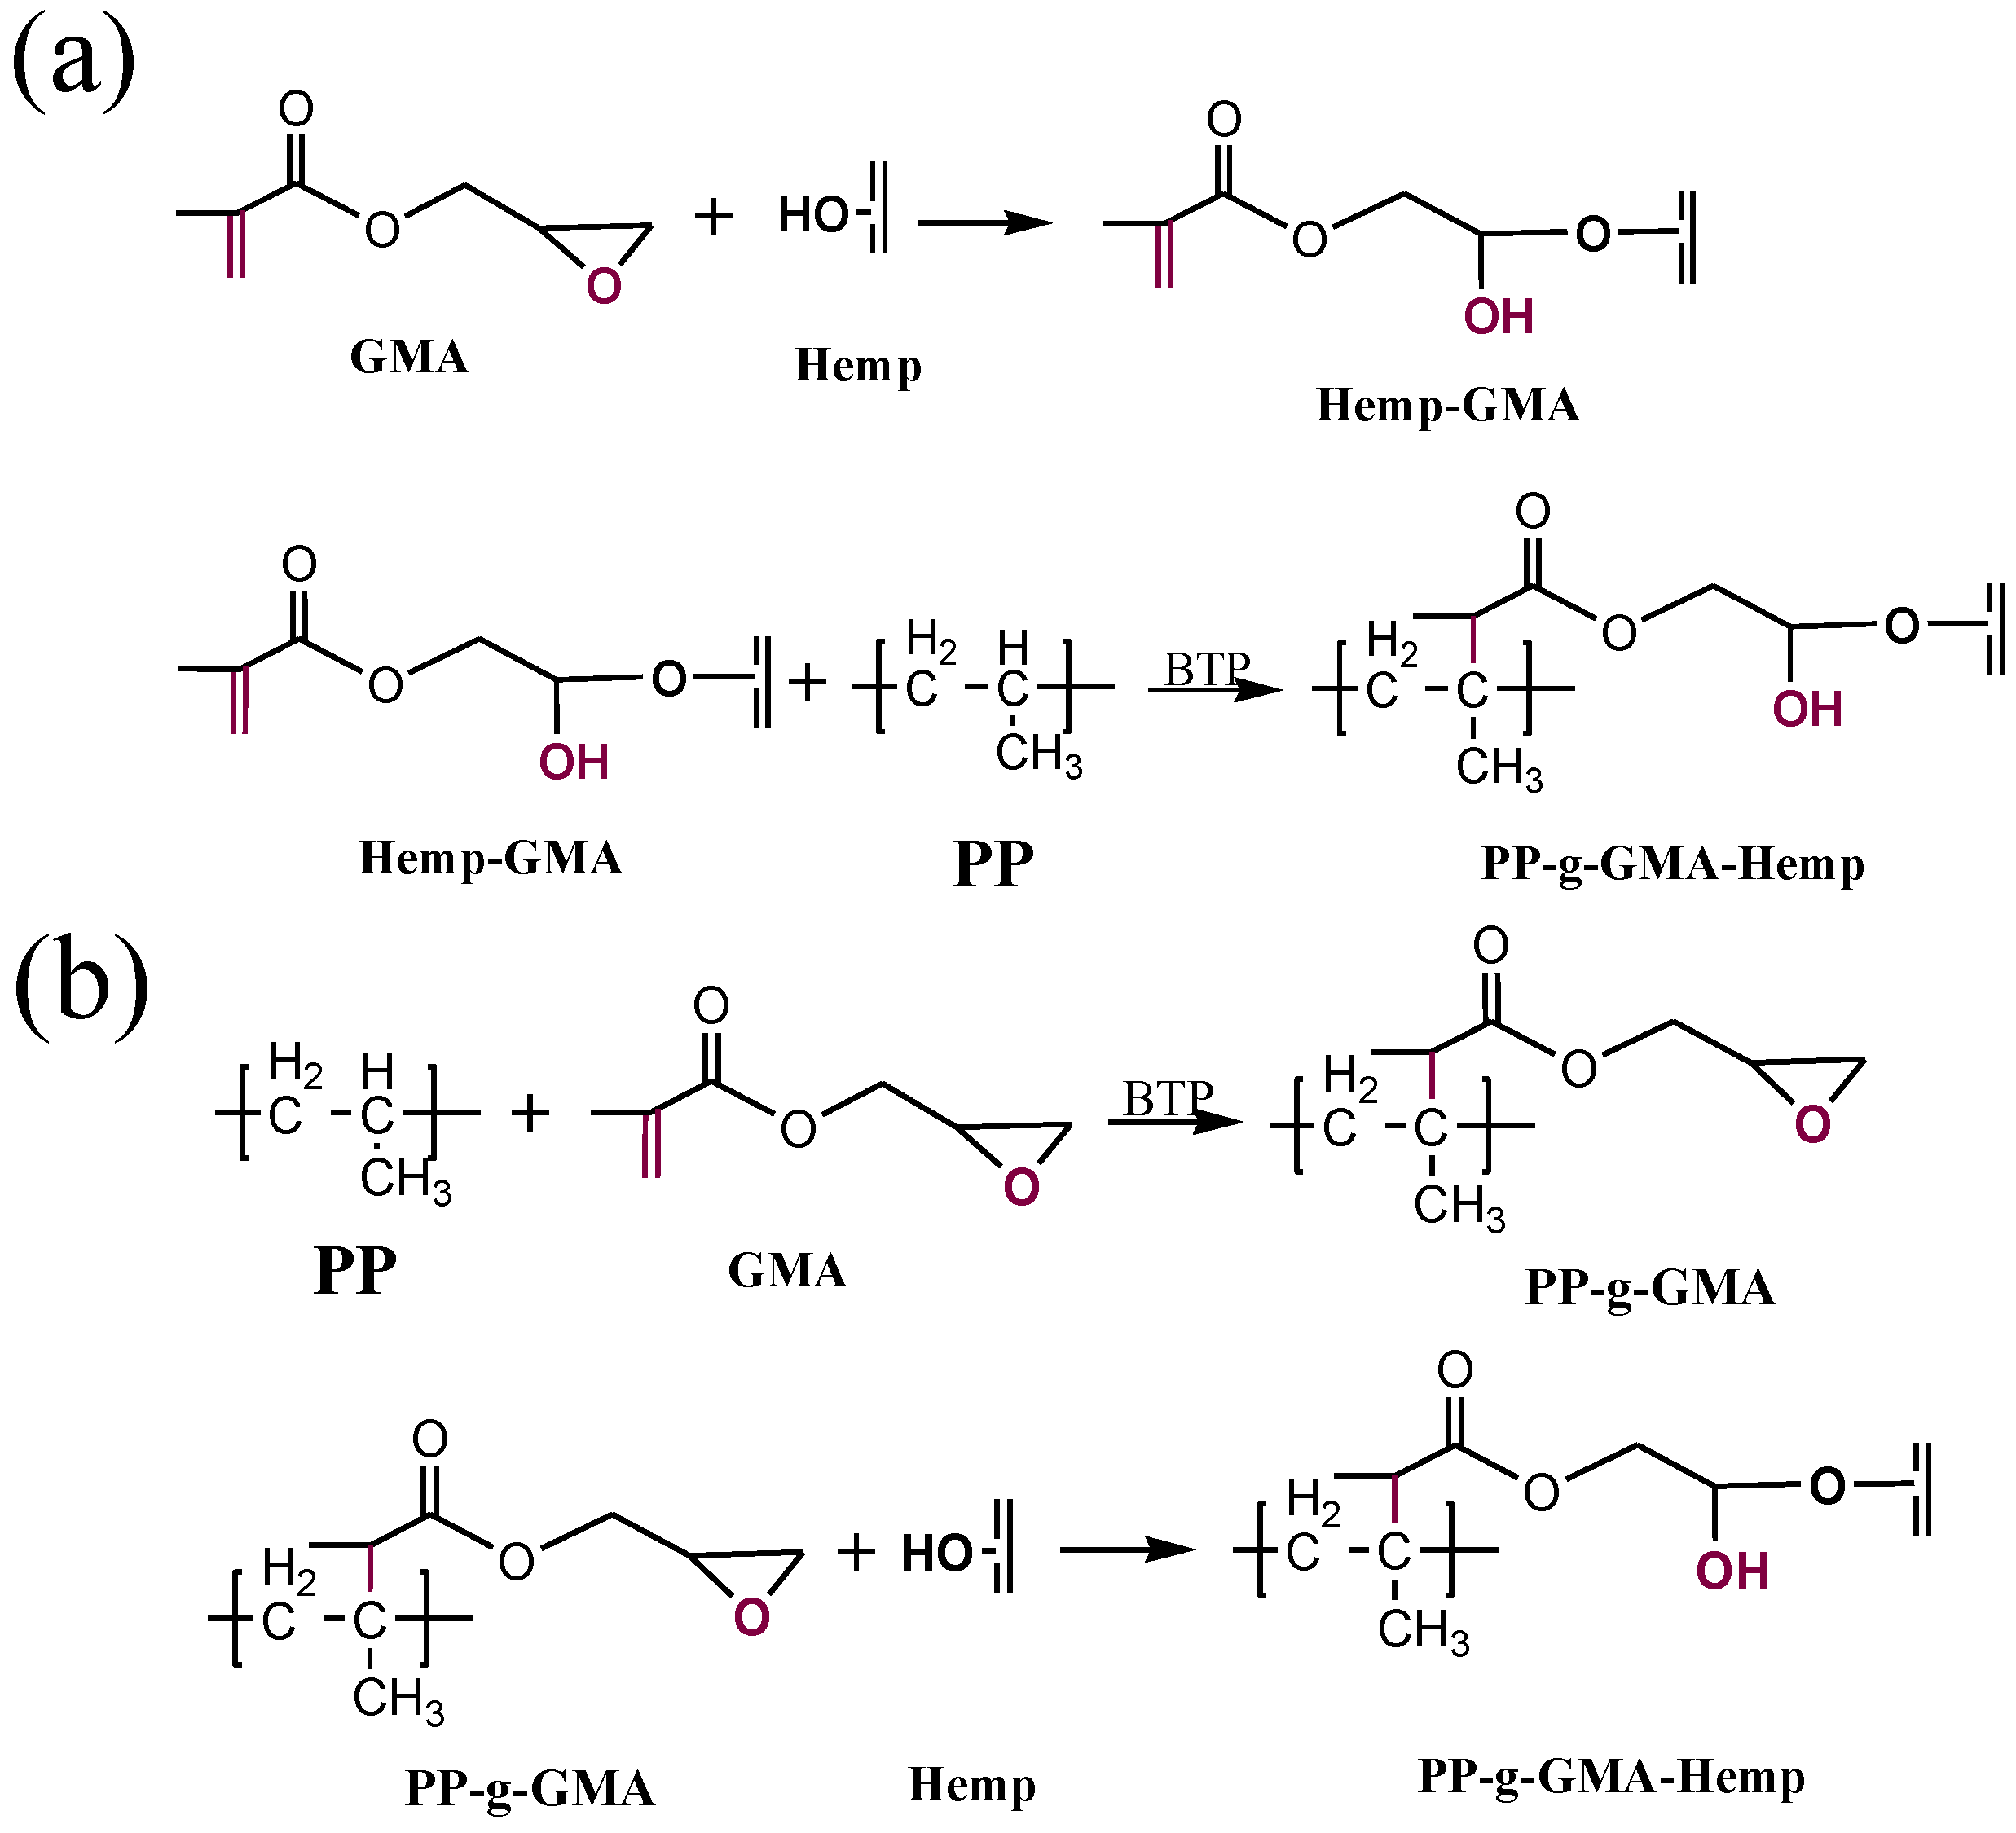
3.1. PP/Hemp Composites
Modification of hemp fibers was performed by exploiting the reaction of the hydroxyl groups of hemp (after treatment with NaOH) with GMA monomer in triethylamine solution, which gives rise to the formation of ether bonds on the fiber surface (Hemp-GMA), according to the procedure described in [
15]. The Hemp-GMA fibers could react with PP during the melt mixing, in the presence of a radical initiator (BTP), through the attack of PP macroradicals on the double bond of methacrylate moiety of GMA [
Figure 2(a)].
Figure 2.
Scheme of (a) hemp modification with GMA and grafting onto PP, (b) grafting of GMA onto PP and reaction with hemp.
Figure 2.
Scheme of (a) hemp modification with GMA and grafting onto PP, (b) grafting of GMA onto PP and reaction with hemp.
PP functionalization was obtained by melt grafting of GMA in the presence of BTP radical initiator [
16]; then PP-g-GMA reacted with hemp during melt mixing by exploiting the reaction of the epoxide ring of GMA with the OH groups of fibers [
Figure 2(b)].
The grafting reactions were monitored by means of FT-IR spectroscopy: Spectra of modified fibers, recorded at different reaction times, showed a marked absorption in the carbonyl region (1,710 cm
−1) and peaks (1,668 and 1,630 cm
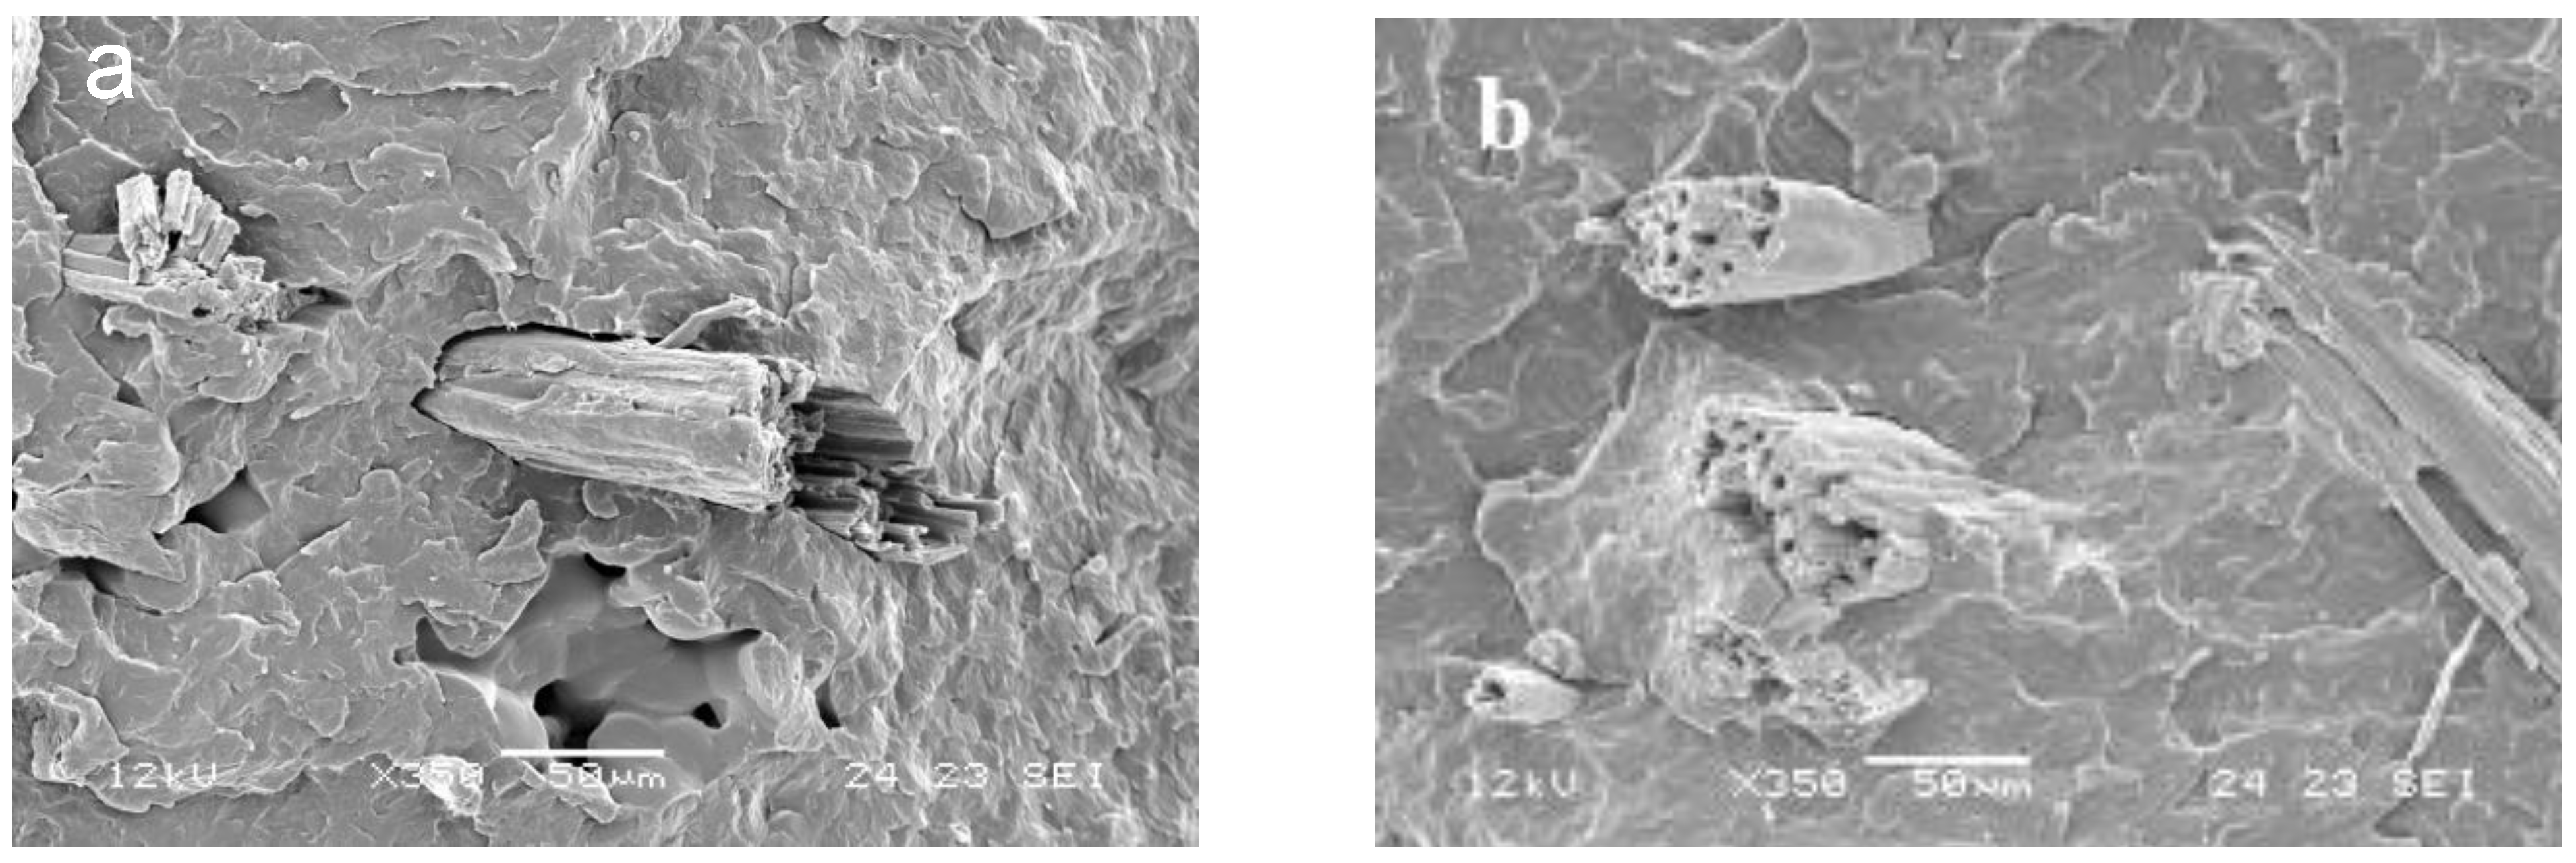
−1) associated with the methacrylic ester bond and the double bond of GMA, respectively. The SEM analysis of PP/Hemp-GMA and PP/Hemp/PP-g-GMA composites clearly indicated an improved adhesion of the fibers to the matrix as a consequence of the effective interactions at the interface (
Figure 3).
The effect of fibers modification and concentration on the phase behavior of polymer matrix was examined by DSC under dynamic and isothermal conditions. The addition of hemp to PP resulted in an increase of crystallization temperature and crystallinity of PP matrix, and a further increase was observed in the presence of modified fibers (PP/Hemp-GMA).
Figure 3.
SEM micrographs of (a) PP/Hemp 90/10 and (b) PP/Hemp 90/10 compatibilized with PP-g-GMA (10 pph).
Figure 3.
SEM micrographs of (a) PP/Hemp 90/10 and (b) PP/Hemp 90/10 compatibilized with PP-g-GMA (10 pph).
The crystallization behavior of the matrix was examined by studying the isothermal crystallization kinetics of the various samples in the range 120–138 °C using the Avrami model [
17]:
where
Kn is the kinetic constant and
n the Avrami exponent, depending on growth geometry and nucleation type of the crystals.
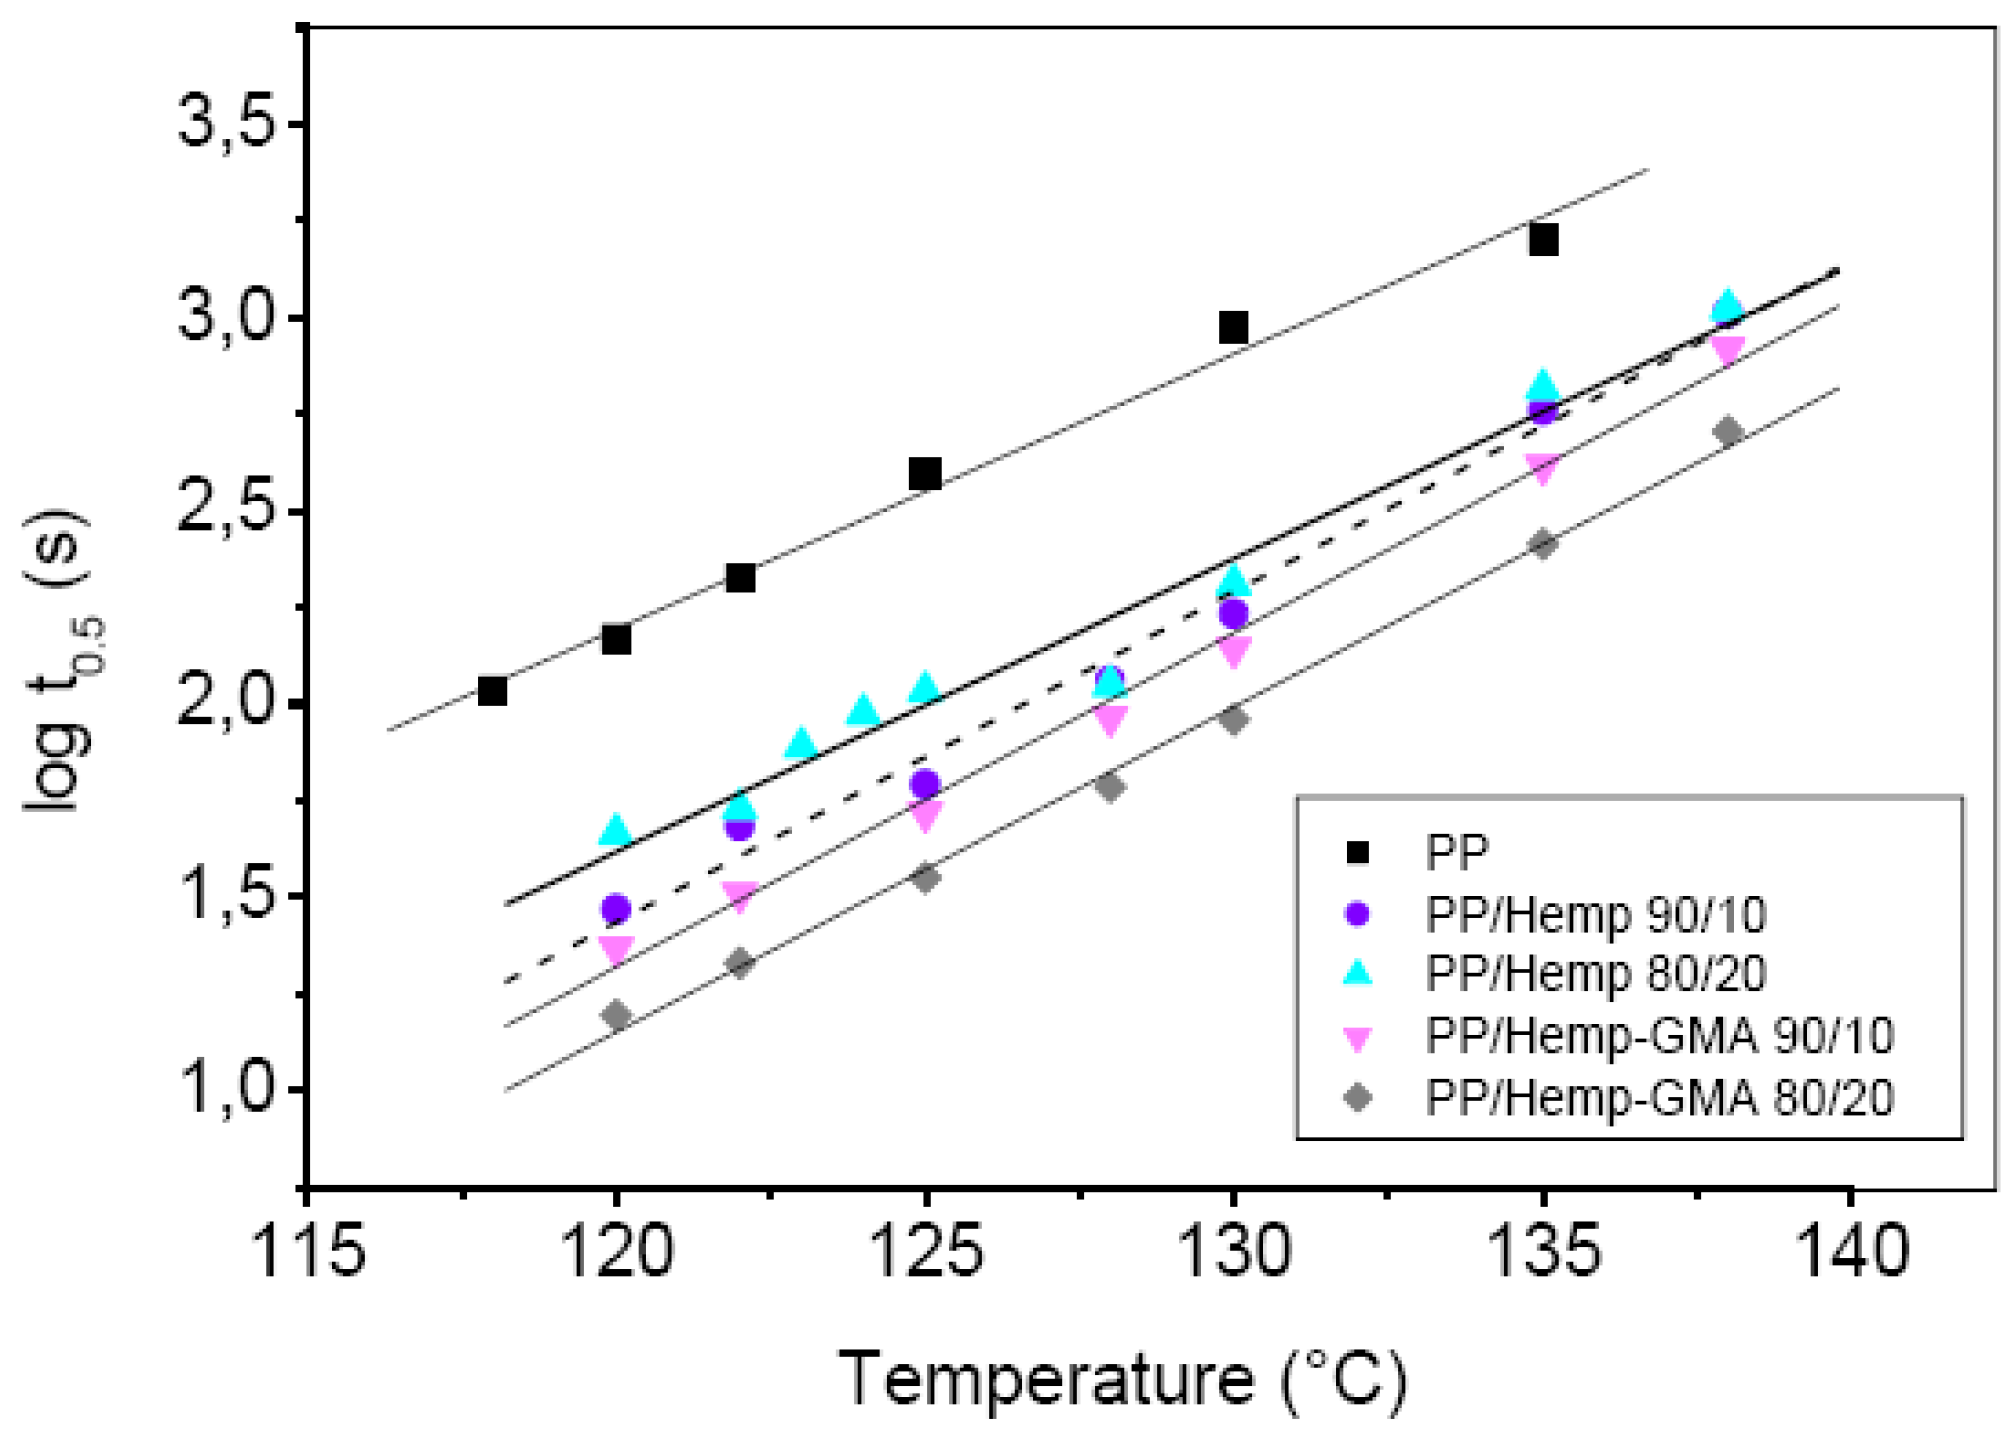
The variation of the crystallization half-time (
t0.5),
i.e., the reciprocal of the overall crystallization rate, is pointed out in
Figure 4 for all examined samples, as a function of the crystallization temperature,
Tc. An increase of about one order of magnitude in the crystallization rate of composites with respect to neat PP, at the same
Tc, was noticed for the whole temperature range. In particular, the composites with modified Hemp (PP/Hemp-GMA 90/10 and 80/20) displayed higher crystallization rates (lower
t0.5) than PP/Hemp. Moreover, as shown in
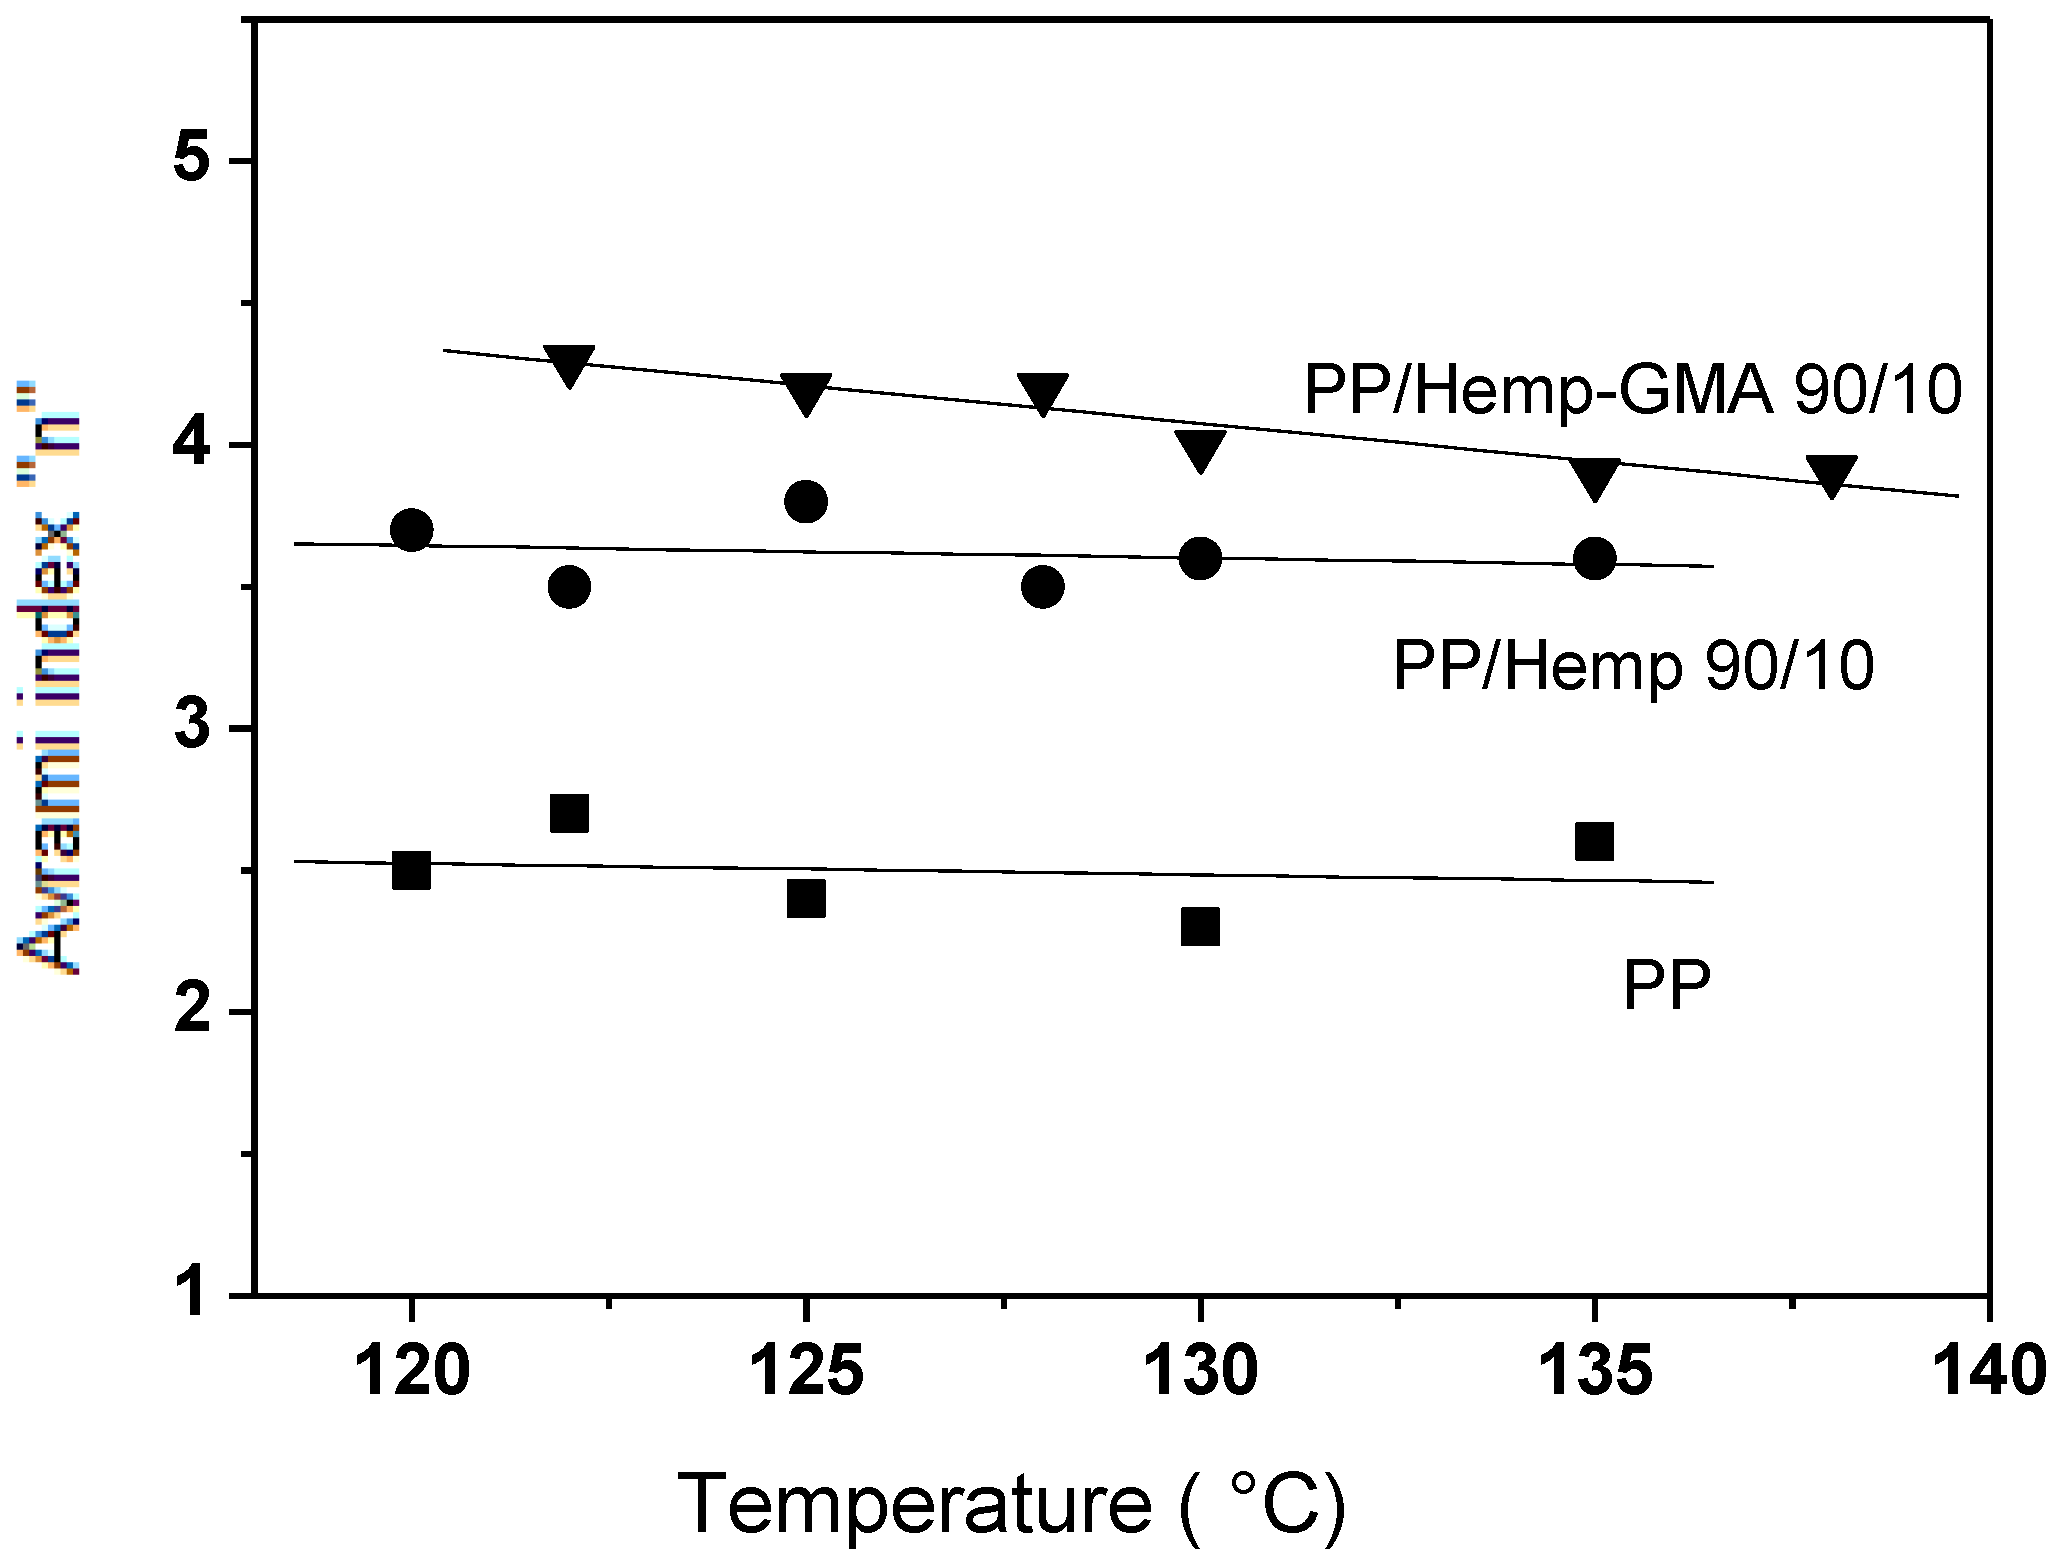
Figure 5, the observed values of the Avrami exponent
n indicated that the nucleation process of the polymer crystals was affected by the fibers. Since the overall crystallization rate of the polyolefin is related to the spherulite growth rate, and the number of primary nuclei per unit volume [
18], and as the growth rate is not affected by the fiber content, the increase of the overall crystallization rate in the composites can be ascribed to the increased crystal nucleation density on the fiber surface [
19,
20]. This effect was more marked for composites with Hemp-GMA mainly as a consequence of the enhanced fiber–matrix interactions.
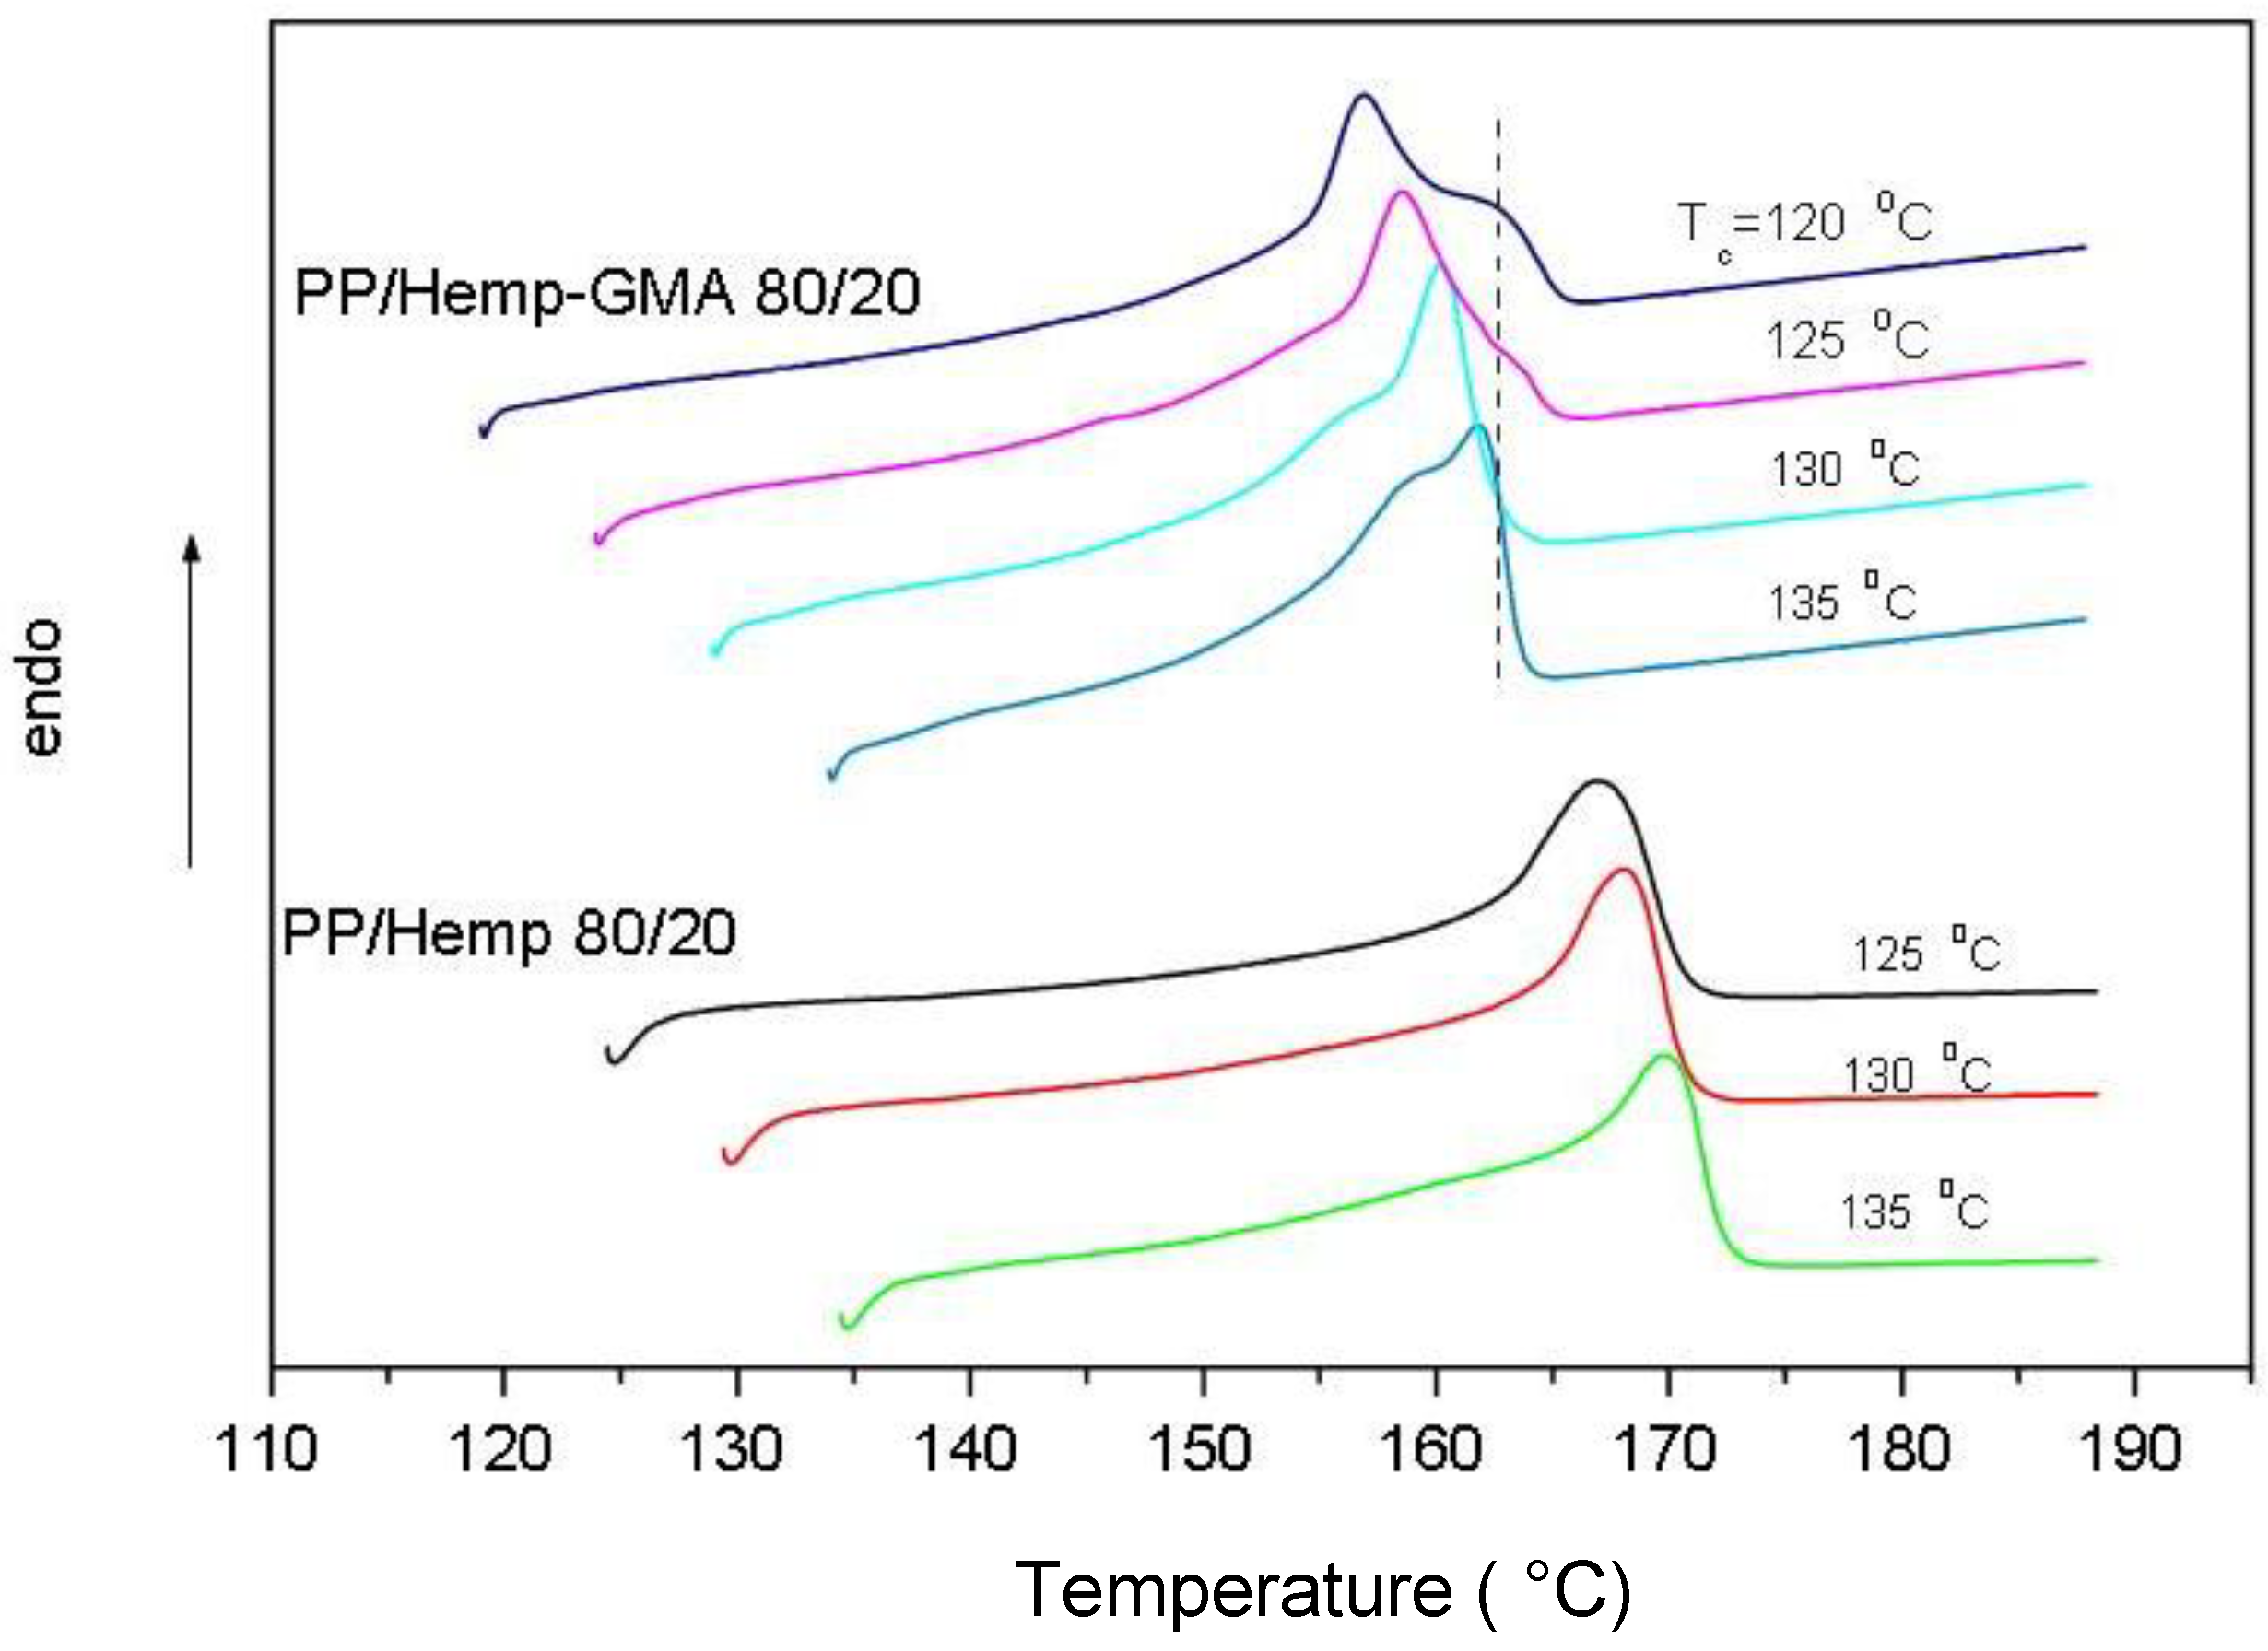
The DSC analysis of the melting behavior of isothermally crystallized samples showed a double melting peak for PP/Hemp-GMA composites and a single melting peak for PP and PP/Hemp samples (
Figure 6). According to the polymer crystallization theory [
21], plots of the melting temperature,
Tm, as a function of
Tc, displayed an increasing linear trend for all examined samples. Extrapolation of the lines to
Tm =
Tc gives values of equilibrium melting temperature (
T°
m) near to 190 °C for PP [
18] and PP/Hemp, and about 176 °C for PP/Hemp-GMA. The decrease of
T°
m recorded for the samples with modified fibers, suggests that the thermodynamic stability of the PP crystals is decreased mostly owing to the chemical constraints occurring at the fiber–matrix interface, as a consequence of PP grafting onto the fibers.
Figure 4.
Temperature dependence of the crystallization half-time for PP, PP/Hemp and PP/Hemp-GMA composites isothermally crystallized from the melt.
Figure 4.
Temperature dependence of the crystallization half-time for PP, PP/Hemp and PP/Hemp-GMA composites isothermally crystallized from the melt.
Figure 5.
Values of the Avrami exponent n for PP/Hemp composites isothermally crystallized from melt at various temperatures.
Figure 5.
Values of the Avrami exponent n for PP/Hemp composites isothermally crystallized from melt at various temperatures.
By relating the temperature dependence of the kinetic constant,
Kn (Equation 1), to the activation energy for the formation of critical nuclei [
21], it was possible to evaluate a change of the free energy of folding of polymer crystals,
σe, from 96 erg/cm
2 for plain PP to about 50 erg/cm
2 for PP/Hemp‑GMA.
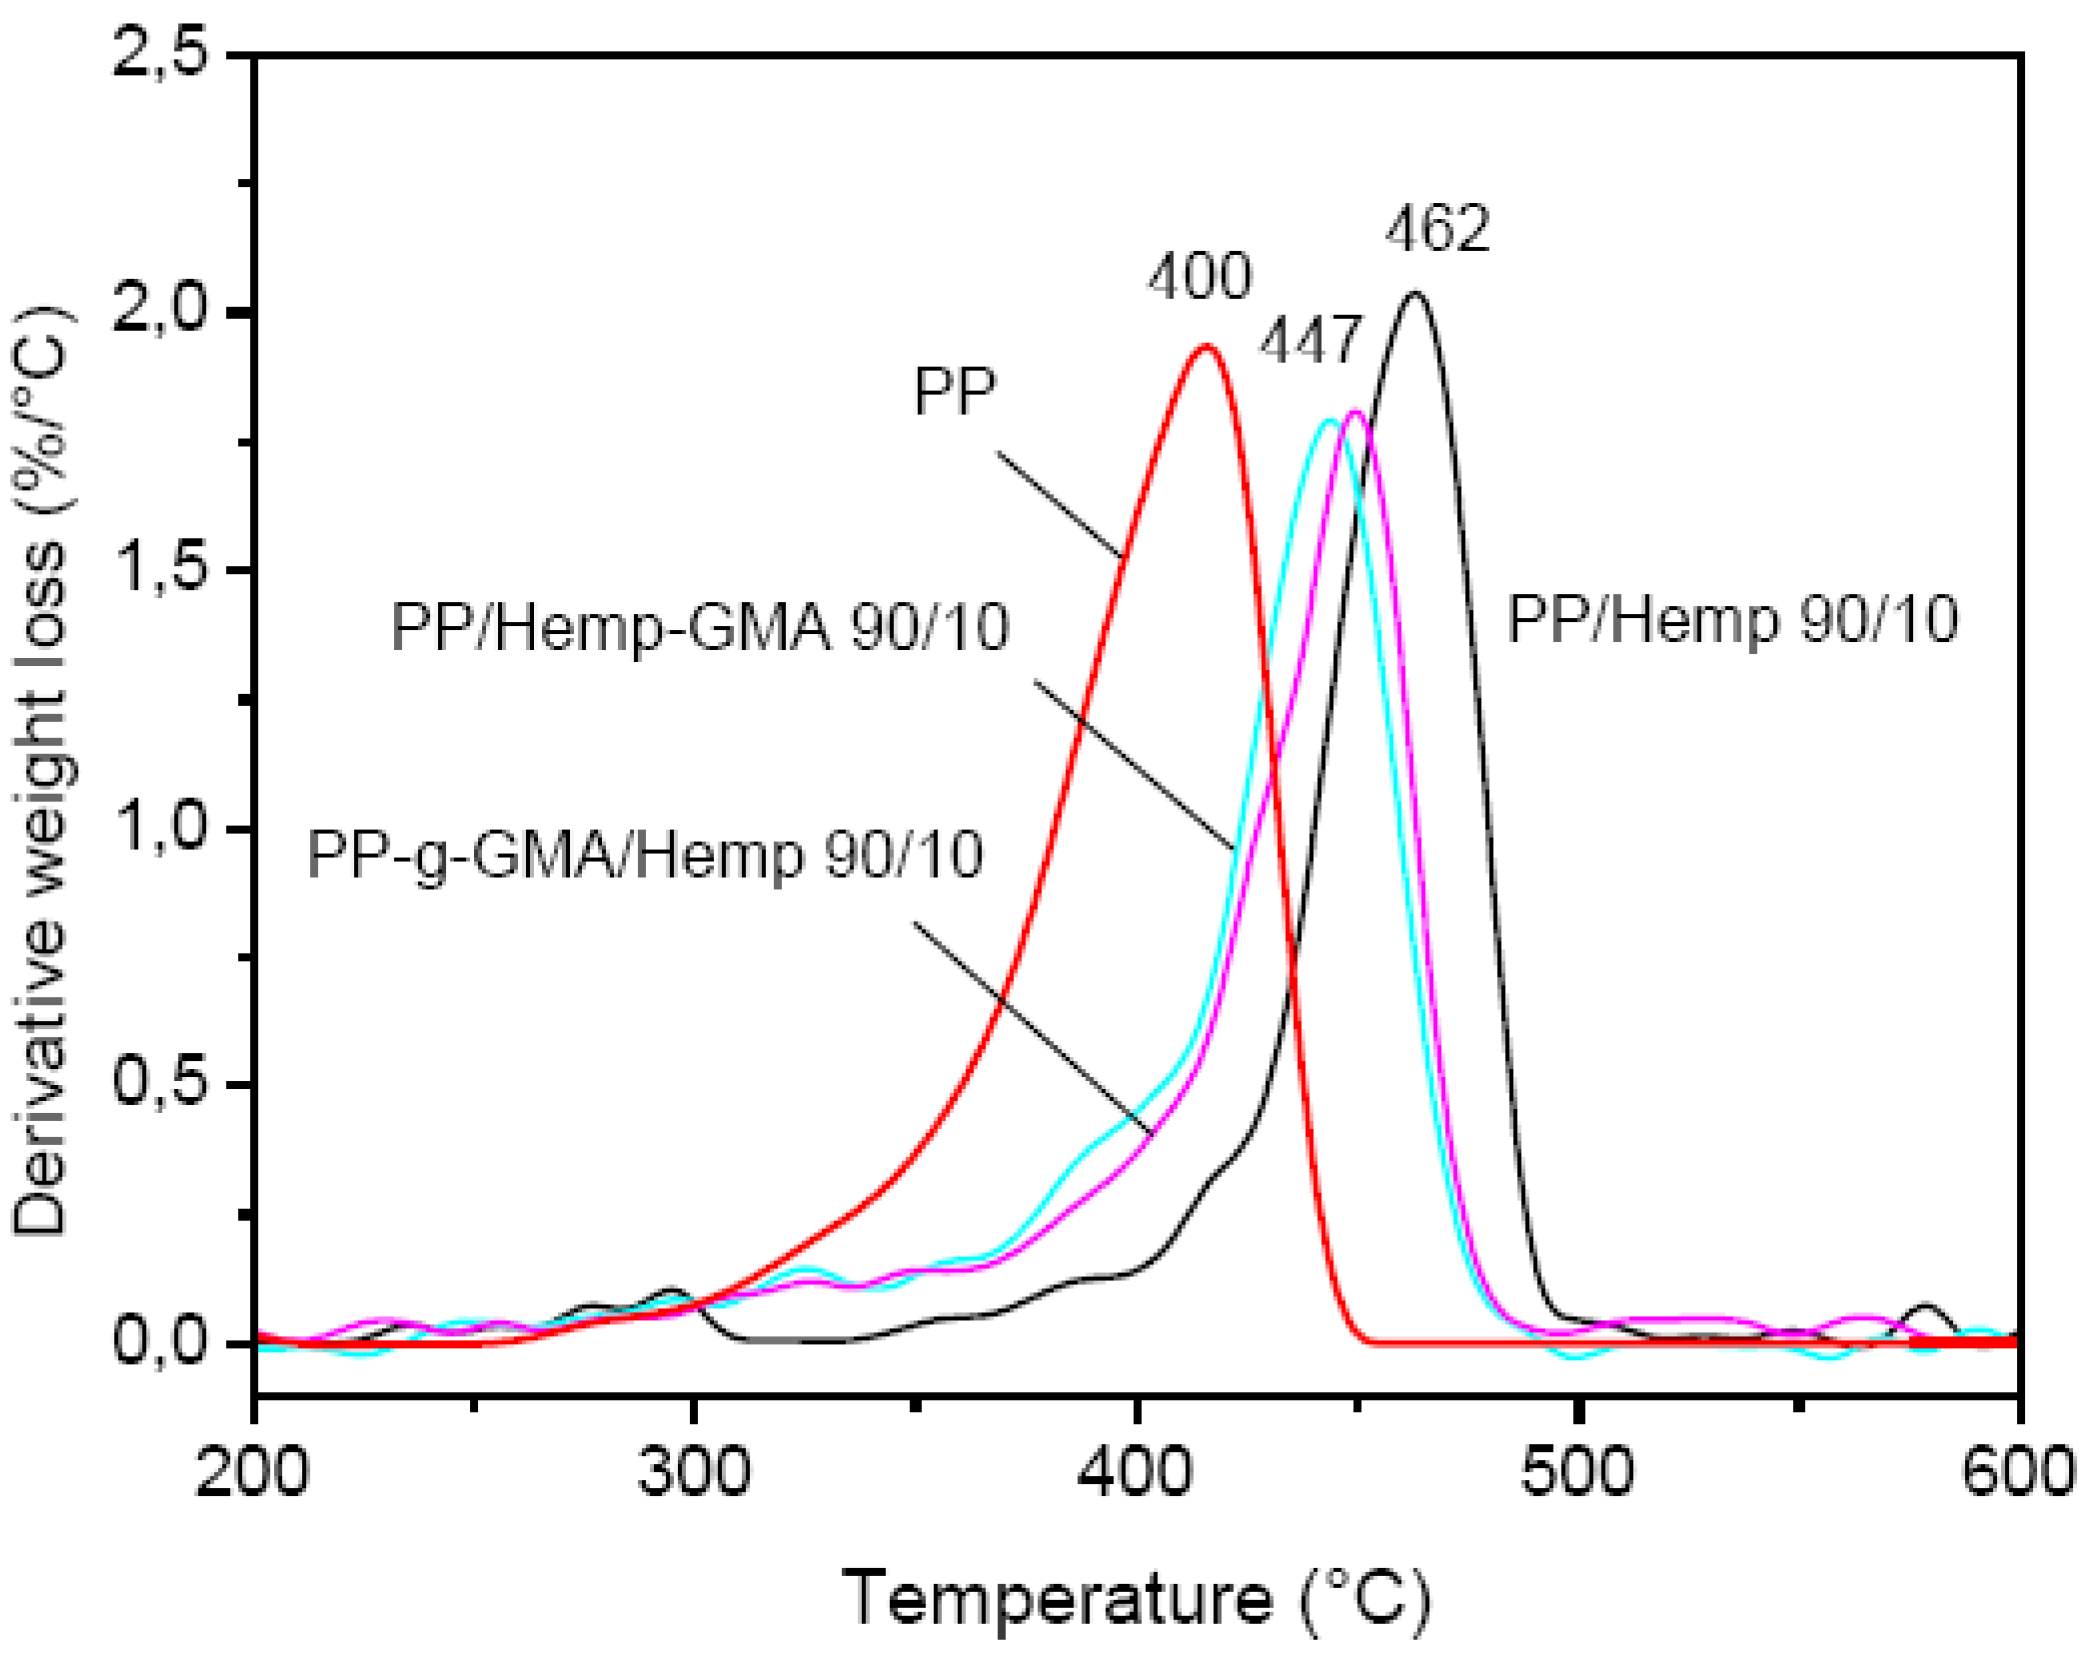
The results of TGA analysis evidenced a higher thermal stability of the GMA modified fibers with a maximum degradation rate at 321 °C, as compared to the unmodified ones (max at about 300 °C) and NaOH treated hemp (max at about 315 °C) [
15]. In the DTG curves of composites (
Figure 7) the maximum degradation rate always shifted to a higher temperature with respect to neat PP (
Tmax= 400 °C) and cellulose, the largest increase being observed for the unmodified PP/Hemp (
Tmax = 462 °C). For composites with Hemp-GMA a lower decomposition temperature was observed (
Tmax = 447 °C).
Figure 6.
DSC melting curves of PP/Hemp and PP/Hemp-GMA composites isothermally crystallized from the melt at various Tc (heating rate: 10 °C/min).
Figure 6.
DSC melting curves of PP/Hemp and PP/Hemp-GMA composites isothermally crystallized from the melt at various Tc (heating rate: 10 °C/min).
Figure 7.
DTG curves of PP/Hemp and PP/PP-g-MA/Hemp composites (in N2).
Figure 7.
DTG curves of PP/Hemp and PP/PP-g-MA/Hemp composites (in N2).
For all composites the tensile tests showed a rather brittle behavior, other than that observed for plain PP. As reported in
Table 1, a marked increase of the Young modulus was found for PP/Hemp samples when compared to plain PP, while the strength at max and elongation at break decreased, as found for other natural fiber reinforced polymer composites [
22,
23,
24]. An increase of stiffness was observed in the presence of PP-
g-GMA, which can be related to the effect of the compatibilizer on the interfacial adhesion: Values of modulus above 3,000 MPa were found for PP/Hemp samples added with 10 pph PP-
g-GMA.
Table 1.
Tensile properties of PP, PP/Hemp and PP/Hemp/PP-g-GMA composites.
Table 1.
Tensile properties of PP, PP/Hemp and PP/Hemp/PP-g-GMA composites.
| Sample | Composition crystallization | PP-g-GMA (pph) | Tensile Modulus (MPa) | Stress at max (MPa) | Stress at break (MPa) | Elongation at break (%) |
|---|
| PP | 100 | – | 1800 | 31.8 | 19.8 | 18.0 |
| PP/Hemp | 90/10 | – | 2600 | 27.0 | 25.4 | 4.0 |
| PP/Hemp | 90/10 | 5 | 1900 | 27.9 | 27.2 | 3.5 |
| PP/Hemp | 90/10 | 10 | 3100 | 27.8 | 26.9 | 2.6 |
| PP/Hemp | 80/20 | – | 2800 | 25.7 | 24.8 | 2.8 |
| PP/Hemp | 80/20 | 5 | 2500 | 23.1 | 22.2 | 2.2 |
| PP/Hemp | 80/20 | 10 | 3000 | 25.7 | 25.3 | 2.3 |
3.2. Composites with PS Matrix
We investigated the compatibilization and the properties of PS composites containing cellulose or oat as natural fillers. In particular, the study was aimed at evaluating the role of addition of PS copolymers containing reactive functional groups—namely PS-
co-MA and SEBS-
g-MA copolymers—on the interfacial interaction phenomena which control the phase structure, phase transitions and mechanical behavior of the composites [
25].
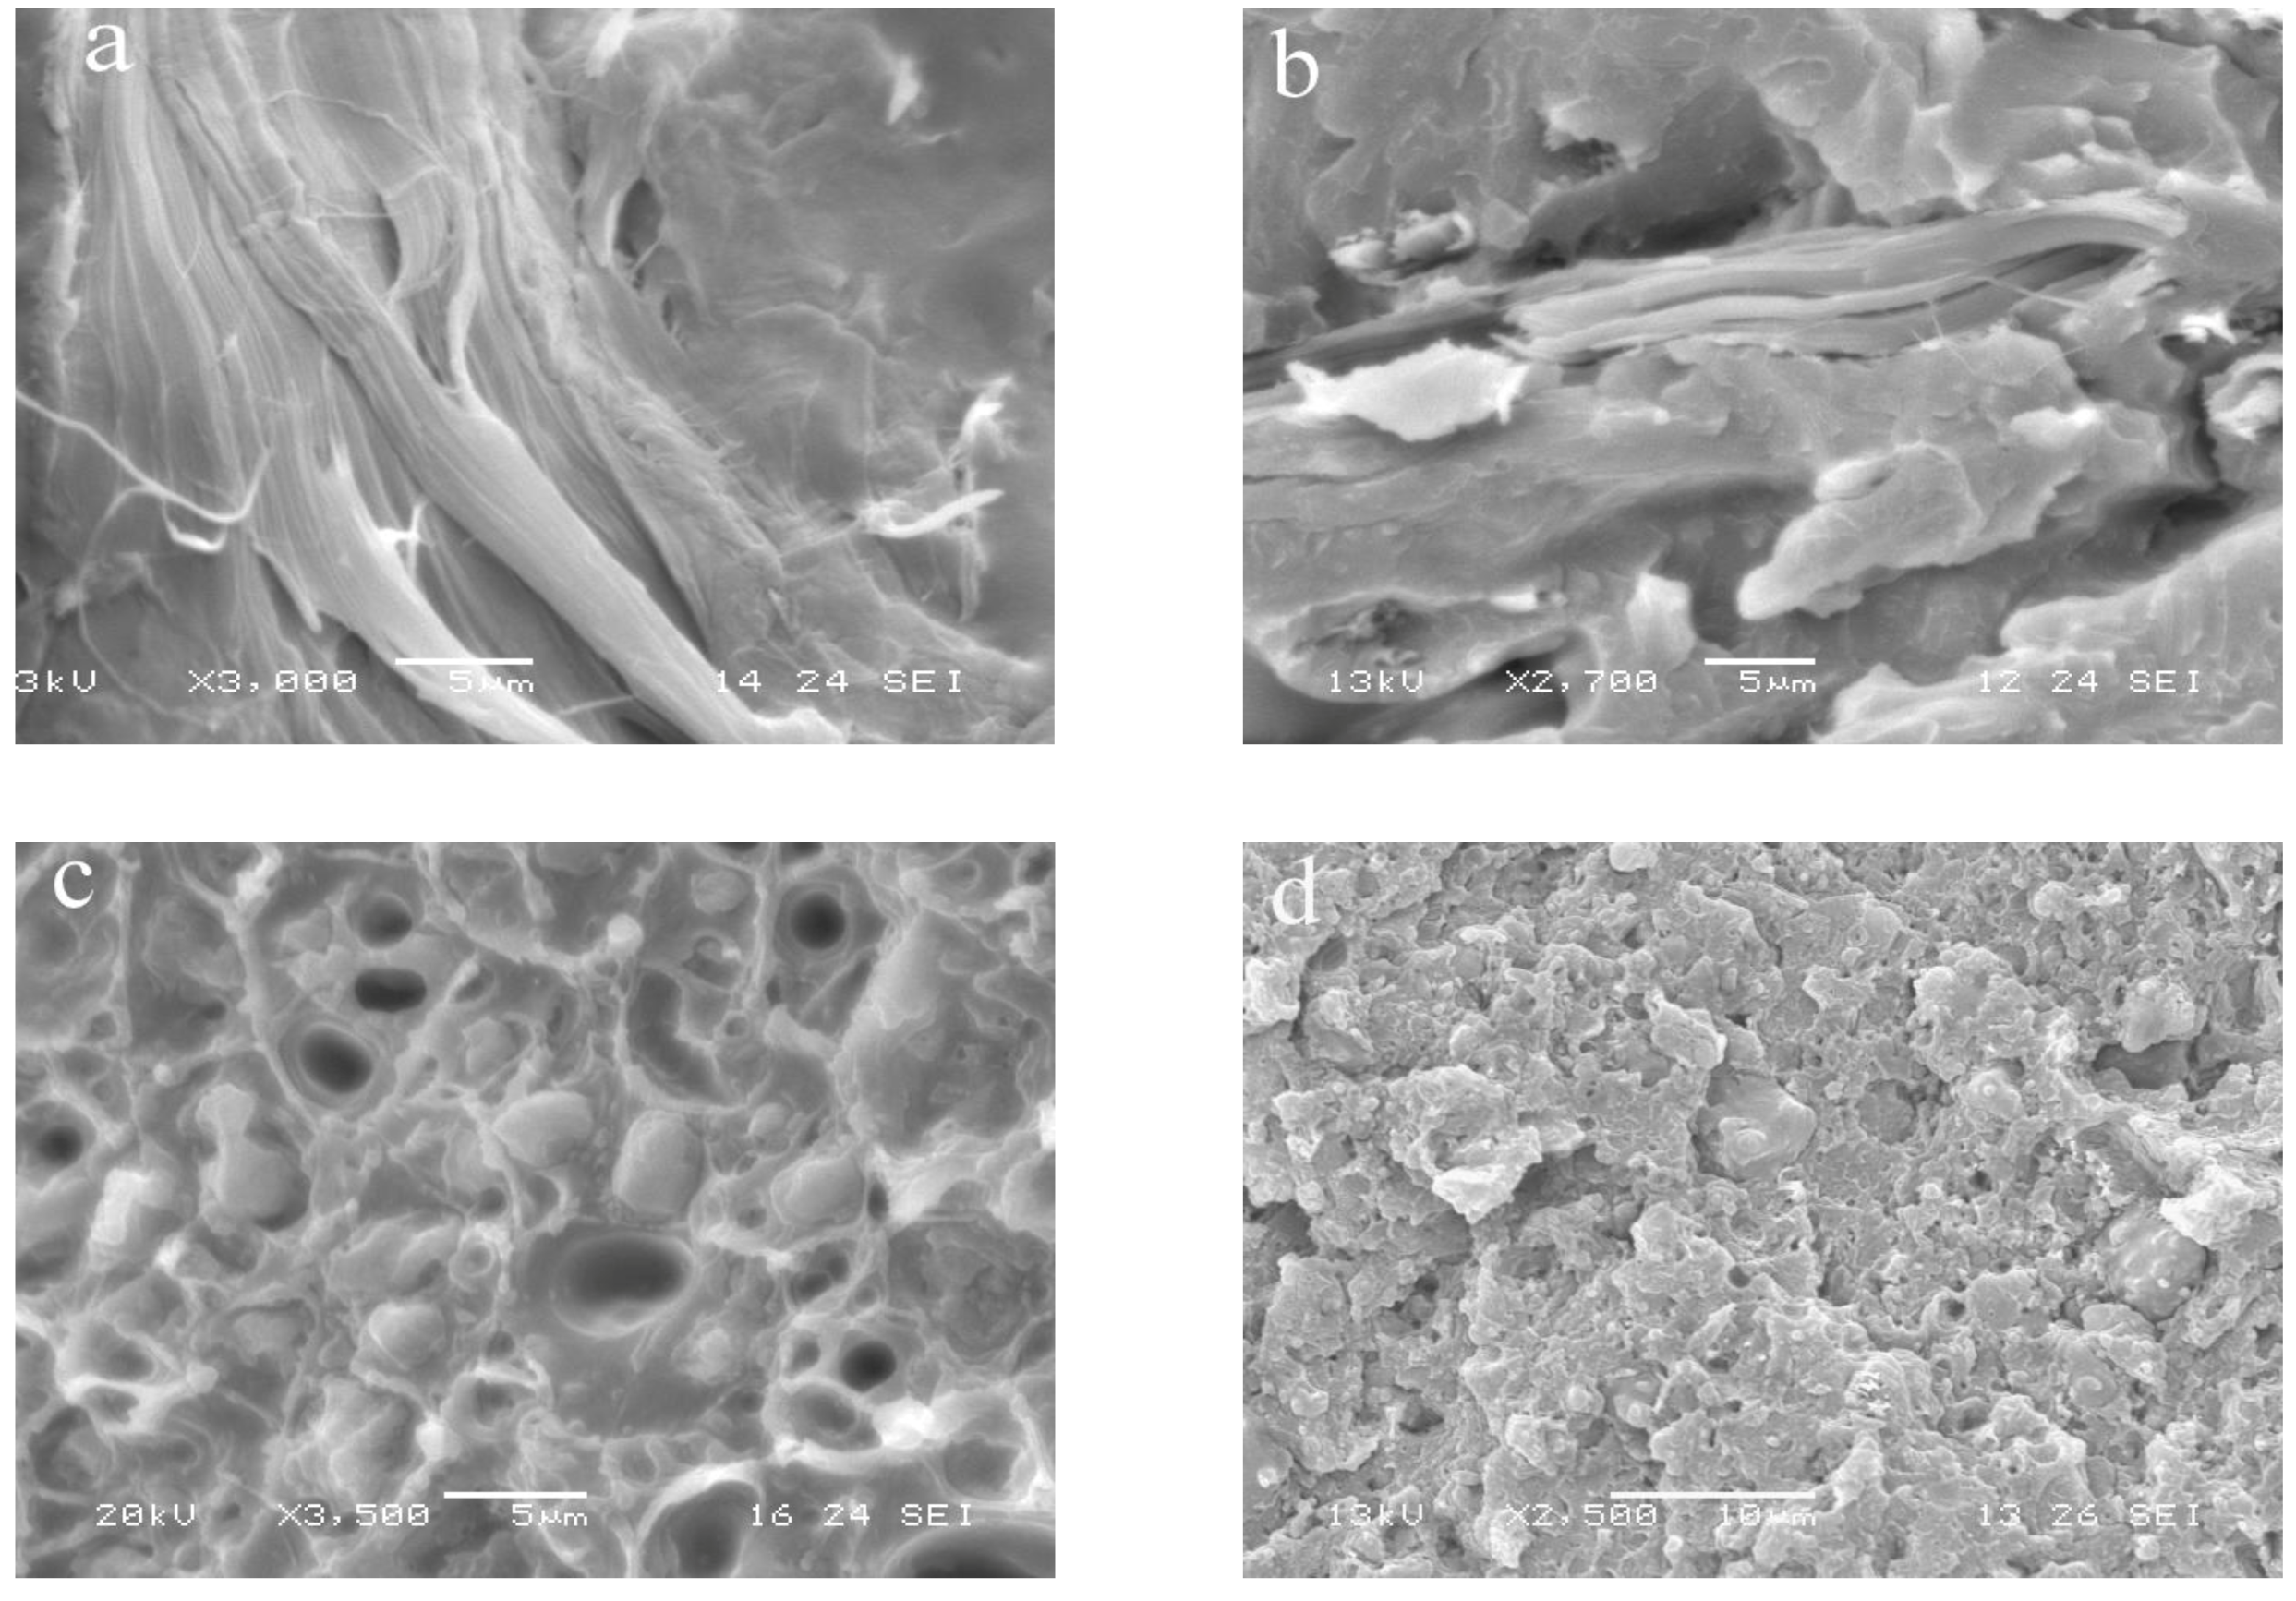
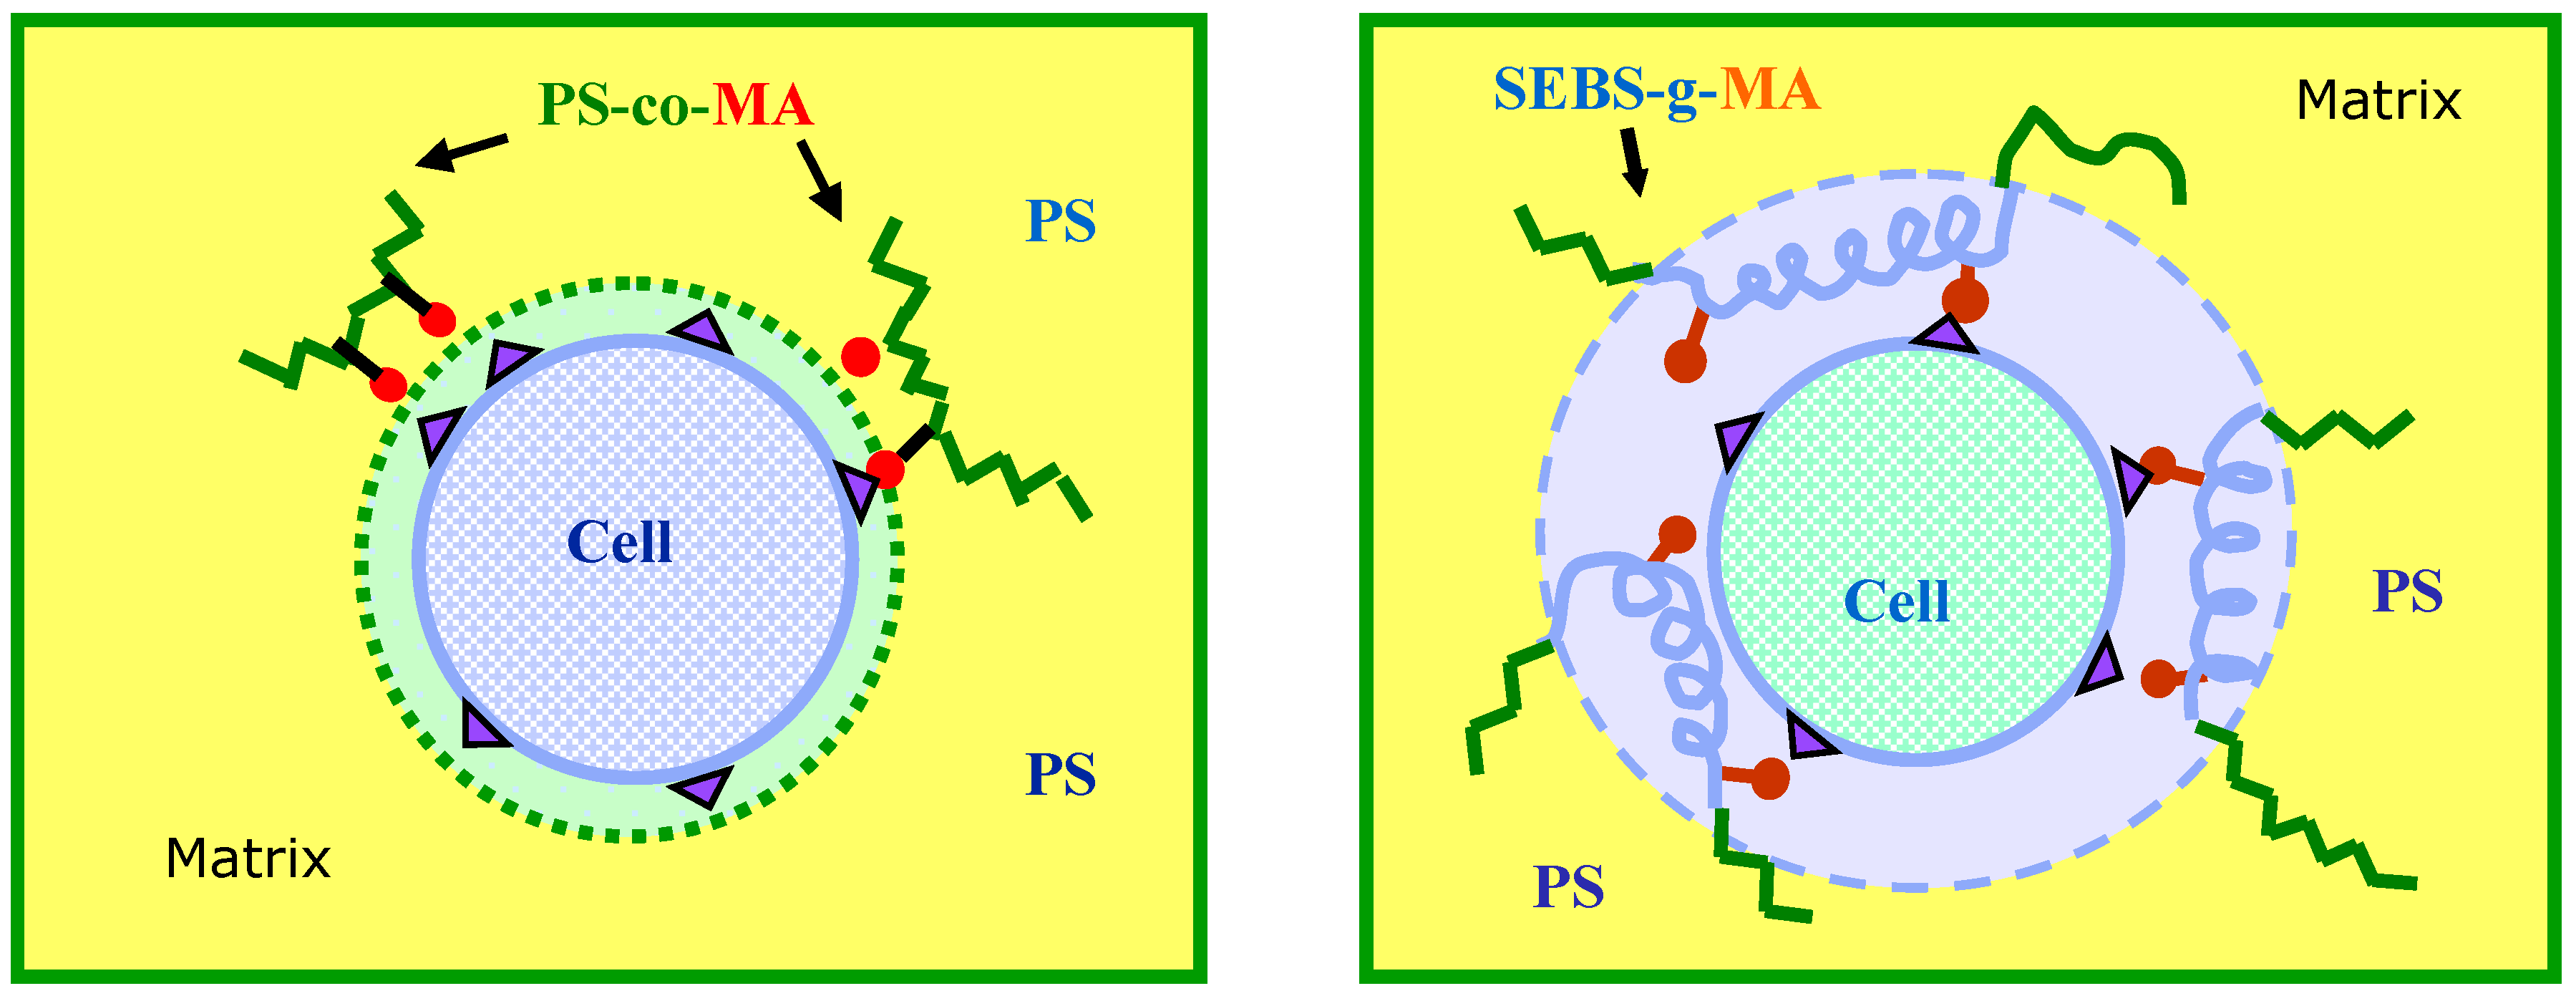
SEM analysis of fracture surfaces of PS/Cell and PS/Oat composites revealed a poor adhesion between matrix and particles in all cases (
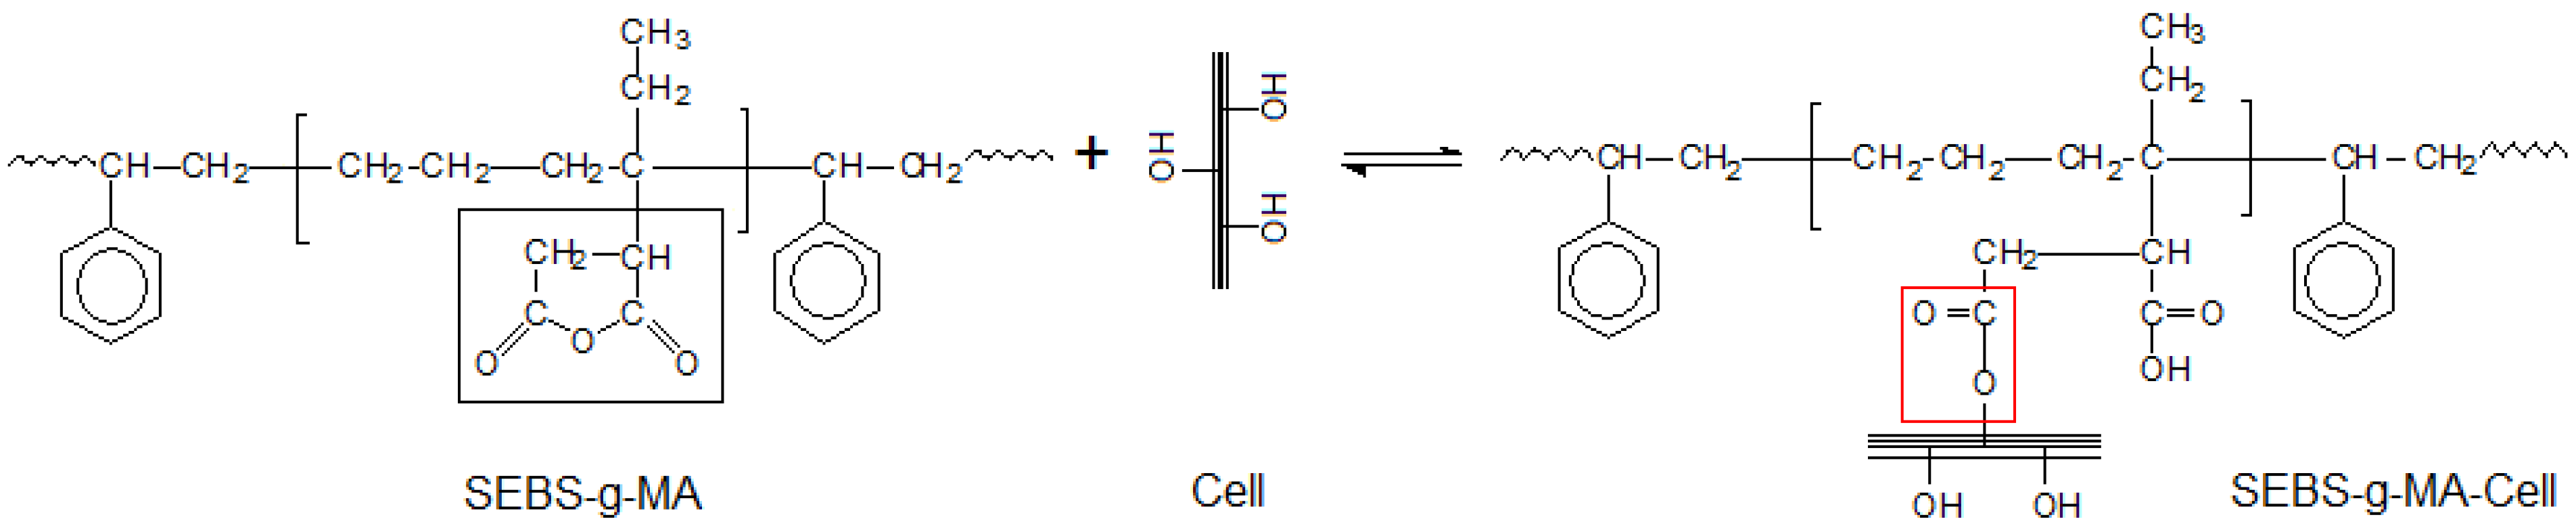
Figure 8). The addition of reactive compatibilizers to PS/Cell composites determined a marked change of the morphology with improved interfacial adhesion and reduced pull-out phenomena. SEM micrographs of binary and ternary systems containing reactive copolymers (
Figure 9) indicated a high adhesion between the components with quite a diffused polymer-fiber interface, which is ascribed to the occurrence of chemical interactions between MA and the hydroxyl groups on the fiber surface.
For PS/Oat and PS/CaCO
3 composites, the addition of PEG and SEBS-g-MA, respectively, caused an improvement of filler dispersion and interfacial interactions [
25].
Figure 8.
SEM micrographs of (a) PS/Cell and (b) PS/Oat composites.
Figure 8.
SEM micrographs of (a) PS/Cell and (b) PS/Oat composites.
Figure 9.
SEM micrographs of (a) SEBS-g-MA/Cell 50/50, (b) PS-co-MA/Cell 50/50, (c) PS/Oat/PEG composites and (d) PS/CaCO3/SEBS-g-MA.
Figure 9.
SEM micrographs of (a) SEBS-g-MA/Cell 50/50, (b) PS-co-MA/Cell 50/50, (c) PS/Oat/PEG composites and (d) PS/CaCO3/SEBS-g-MA.
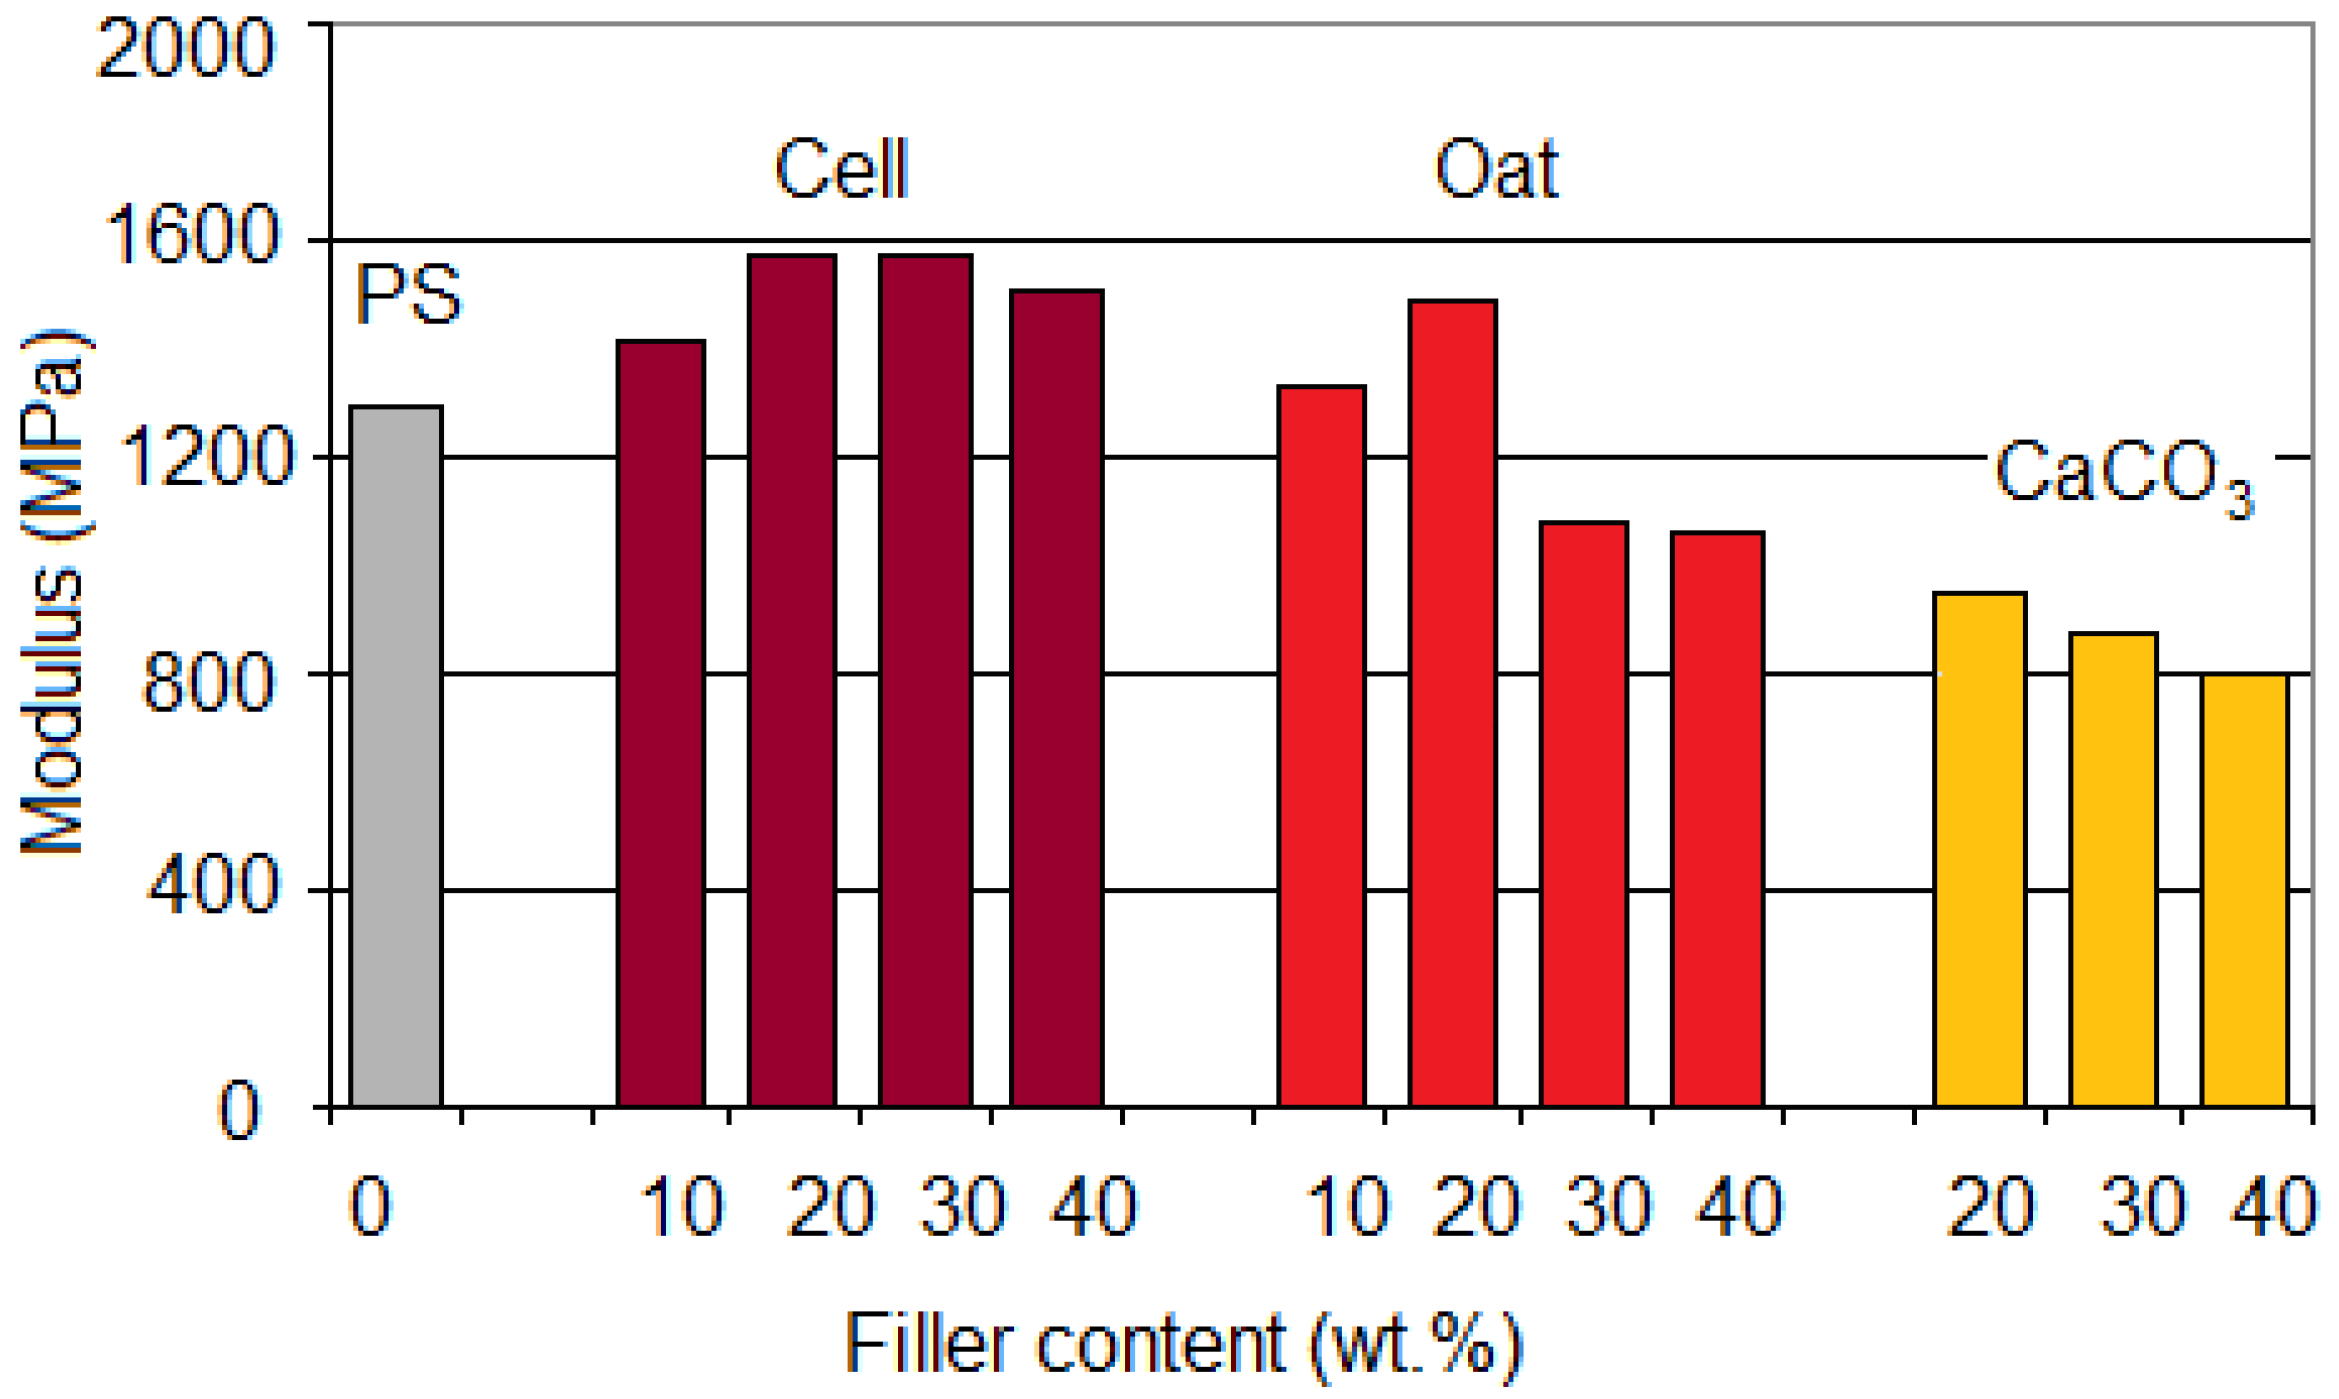
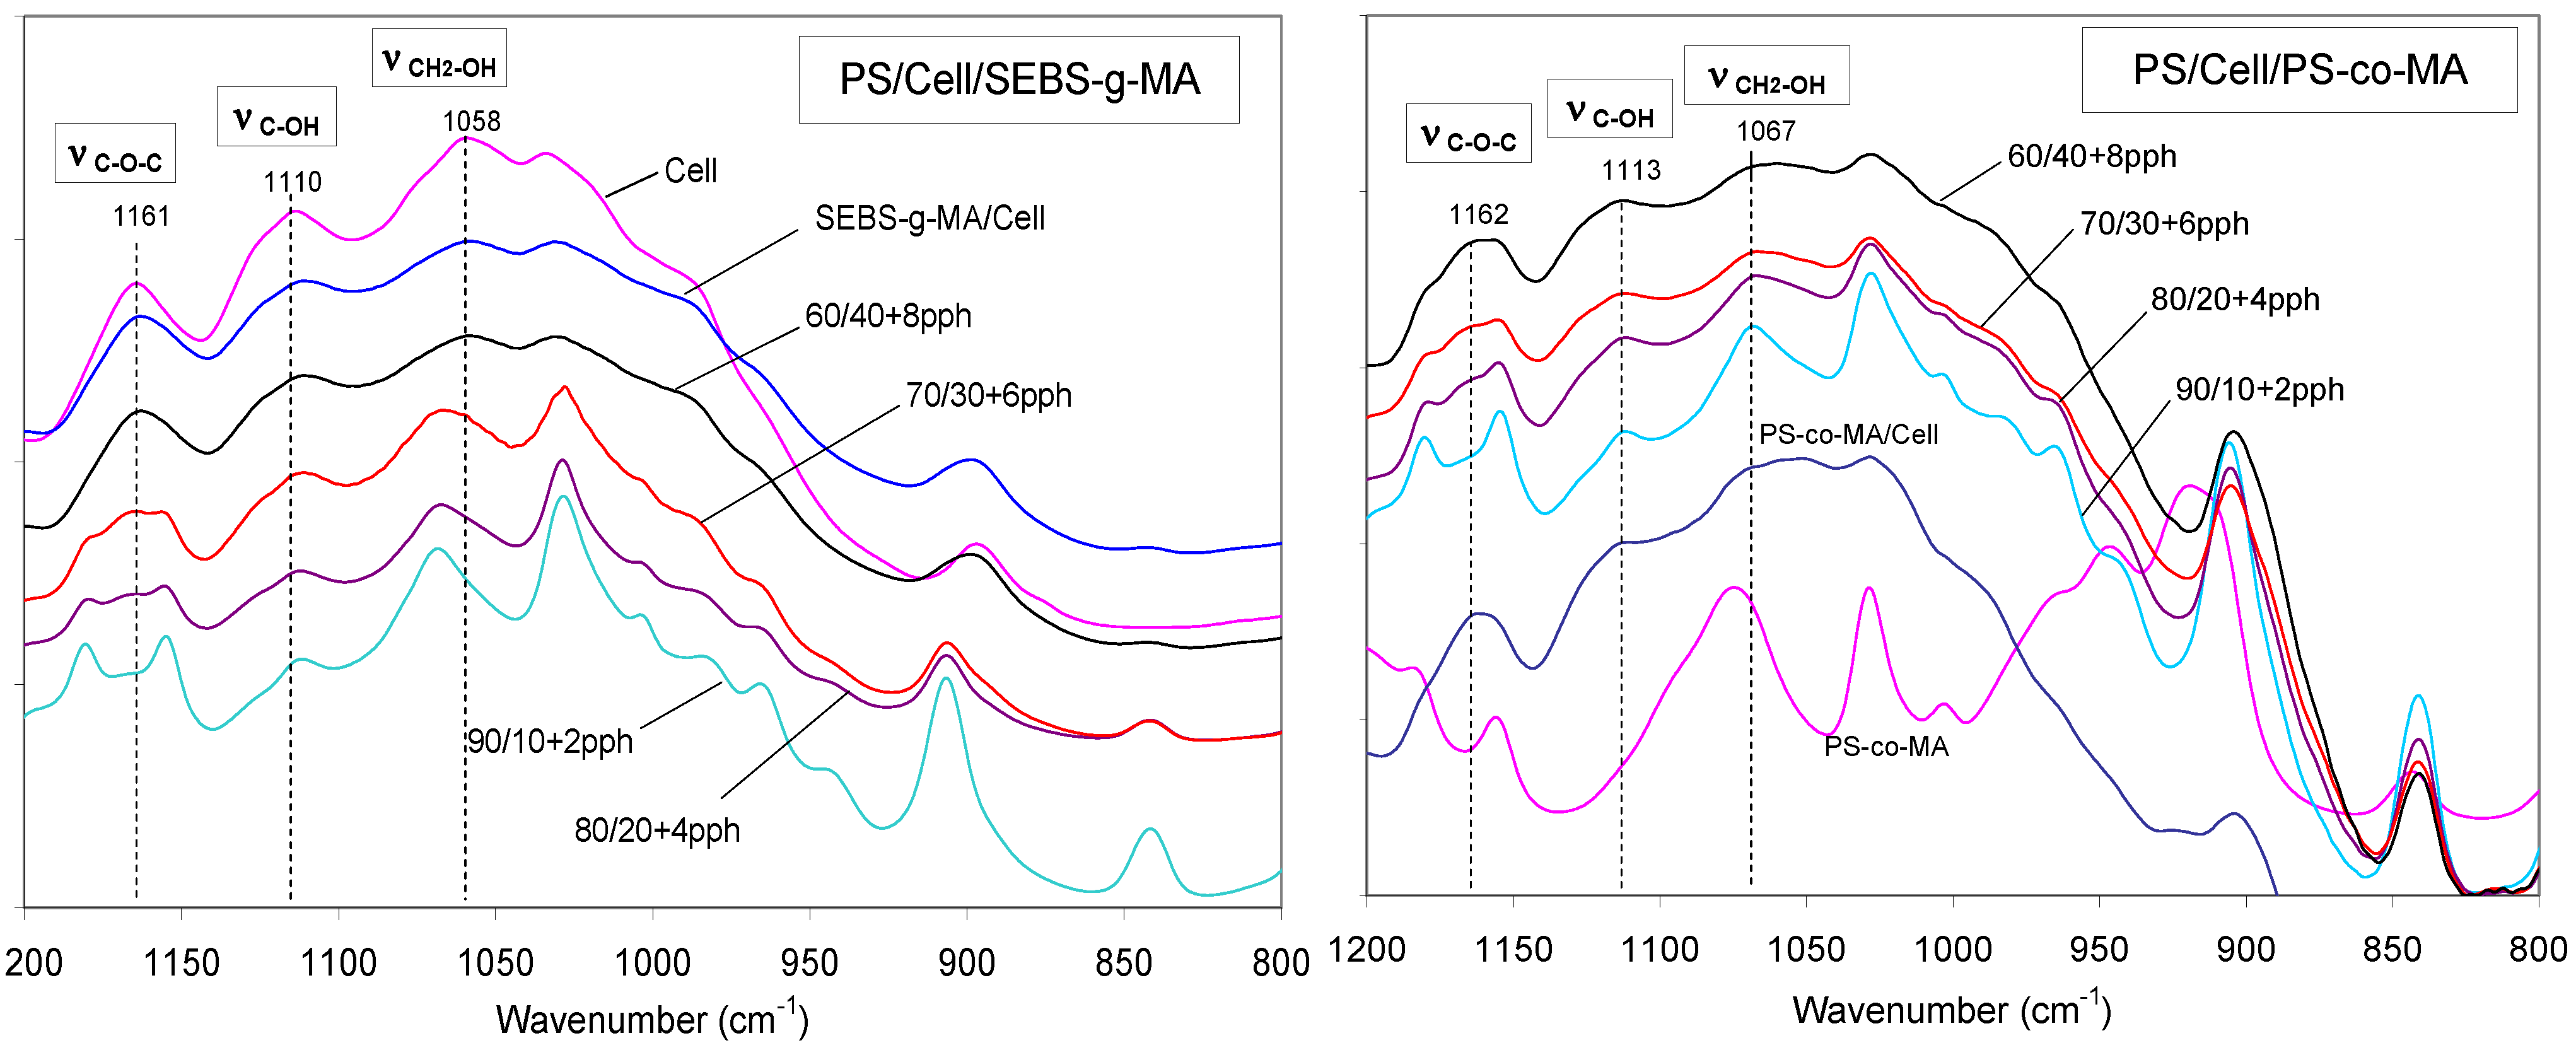
PS/Cell samples containing SEBS-
g-MA and PS-
co-MA copolymers were analyzed by FT-IR spectroscopy to investigate the effect of the compatibilizer at the polymer-fiber interface. The occurrence of interactions between maleic anhydride and hydroxyl groups of cellulose was carefully examined in the frequency ranges 2,000–1,650 cm
−1 and 1,200–850 cm
−1 respectively. The reaction scheme and FT-IR spectra of composites are shown in
Figure 10 and
Figure 11 respectively. Significant shifts of the MA carbonyl stretching band (νCO) at about 1,780 cm
−1 and relevant ester band (νCOO) near to 1,740 cm
−1 were recorded, as well as the changes of alcohol (νCOH) and ether (νCOC) stretching in the spectra of cellulose at 1,164, 1,114, 1,060 and 1,033 cm
−1 respectively; supporting the formation of stable ester bond at the fiber/matrix interface [
26,
27].
Figure 10.
Reaction scheme of SEBS-g-MA and Cellulose.
Figure 10.
Reaction scheme of SEBS-g-MA and Cellulose.
Figure 11.
FT-IR spectra of PS/Cell compatibilized with SEBS-g-MA and PS-co-MA, in the region 800–1,200 cm−1 (compatibilizer amount in pph).
Figure 11.
FT-IR spectra of PS/Cell compatibilized with SEBS-g-MA and PS-co-MA, in the region 800–1,200 cm−1 (compatibilizer amount in pph).
The glass transition behavior of the PS matrix in the composites was examined by DSC as a function of the filler content and type of compatibilizer. For uncompatibilized PS/Cell samples, a variation of Tg was observed only at higher contents of cellulose, while a significant effect was recorded on the addition of compatibilizer. For samples containing SEBS-g-MA, Tg increased on increasing the fiber content from 94 °C (plain PS) to about 100 °C (40% by weight of Cell), but a minor increment was found for samples compatibilized with PS-co-MA.
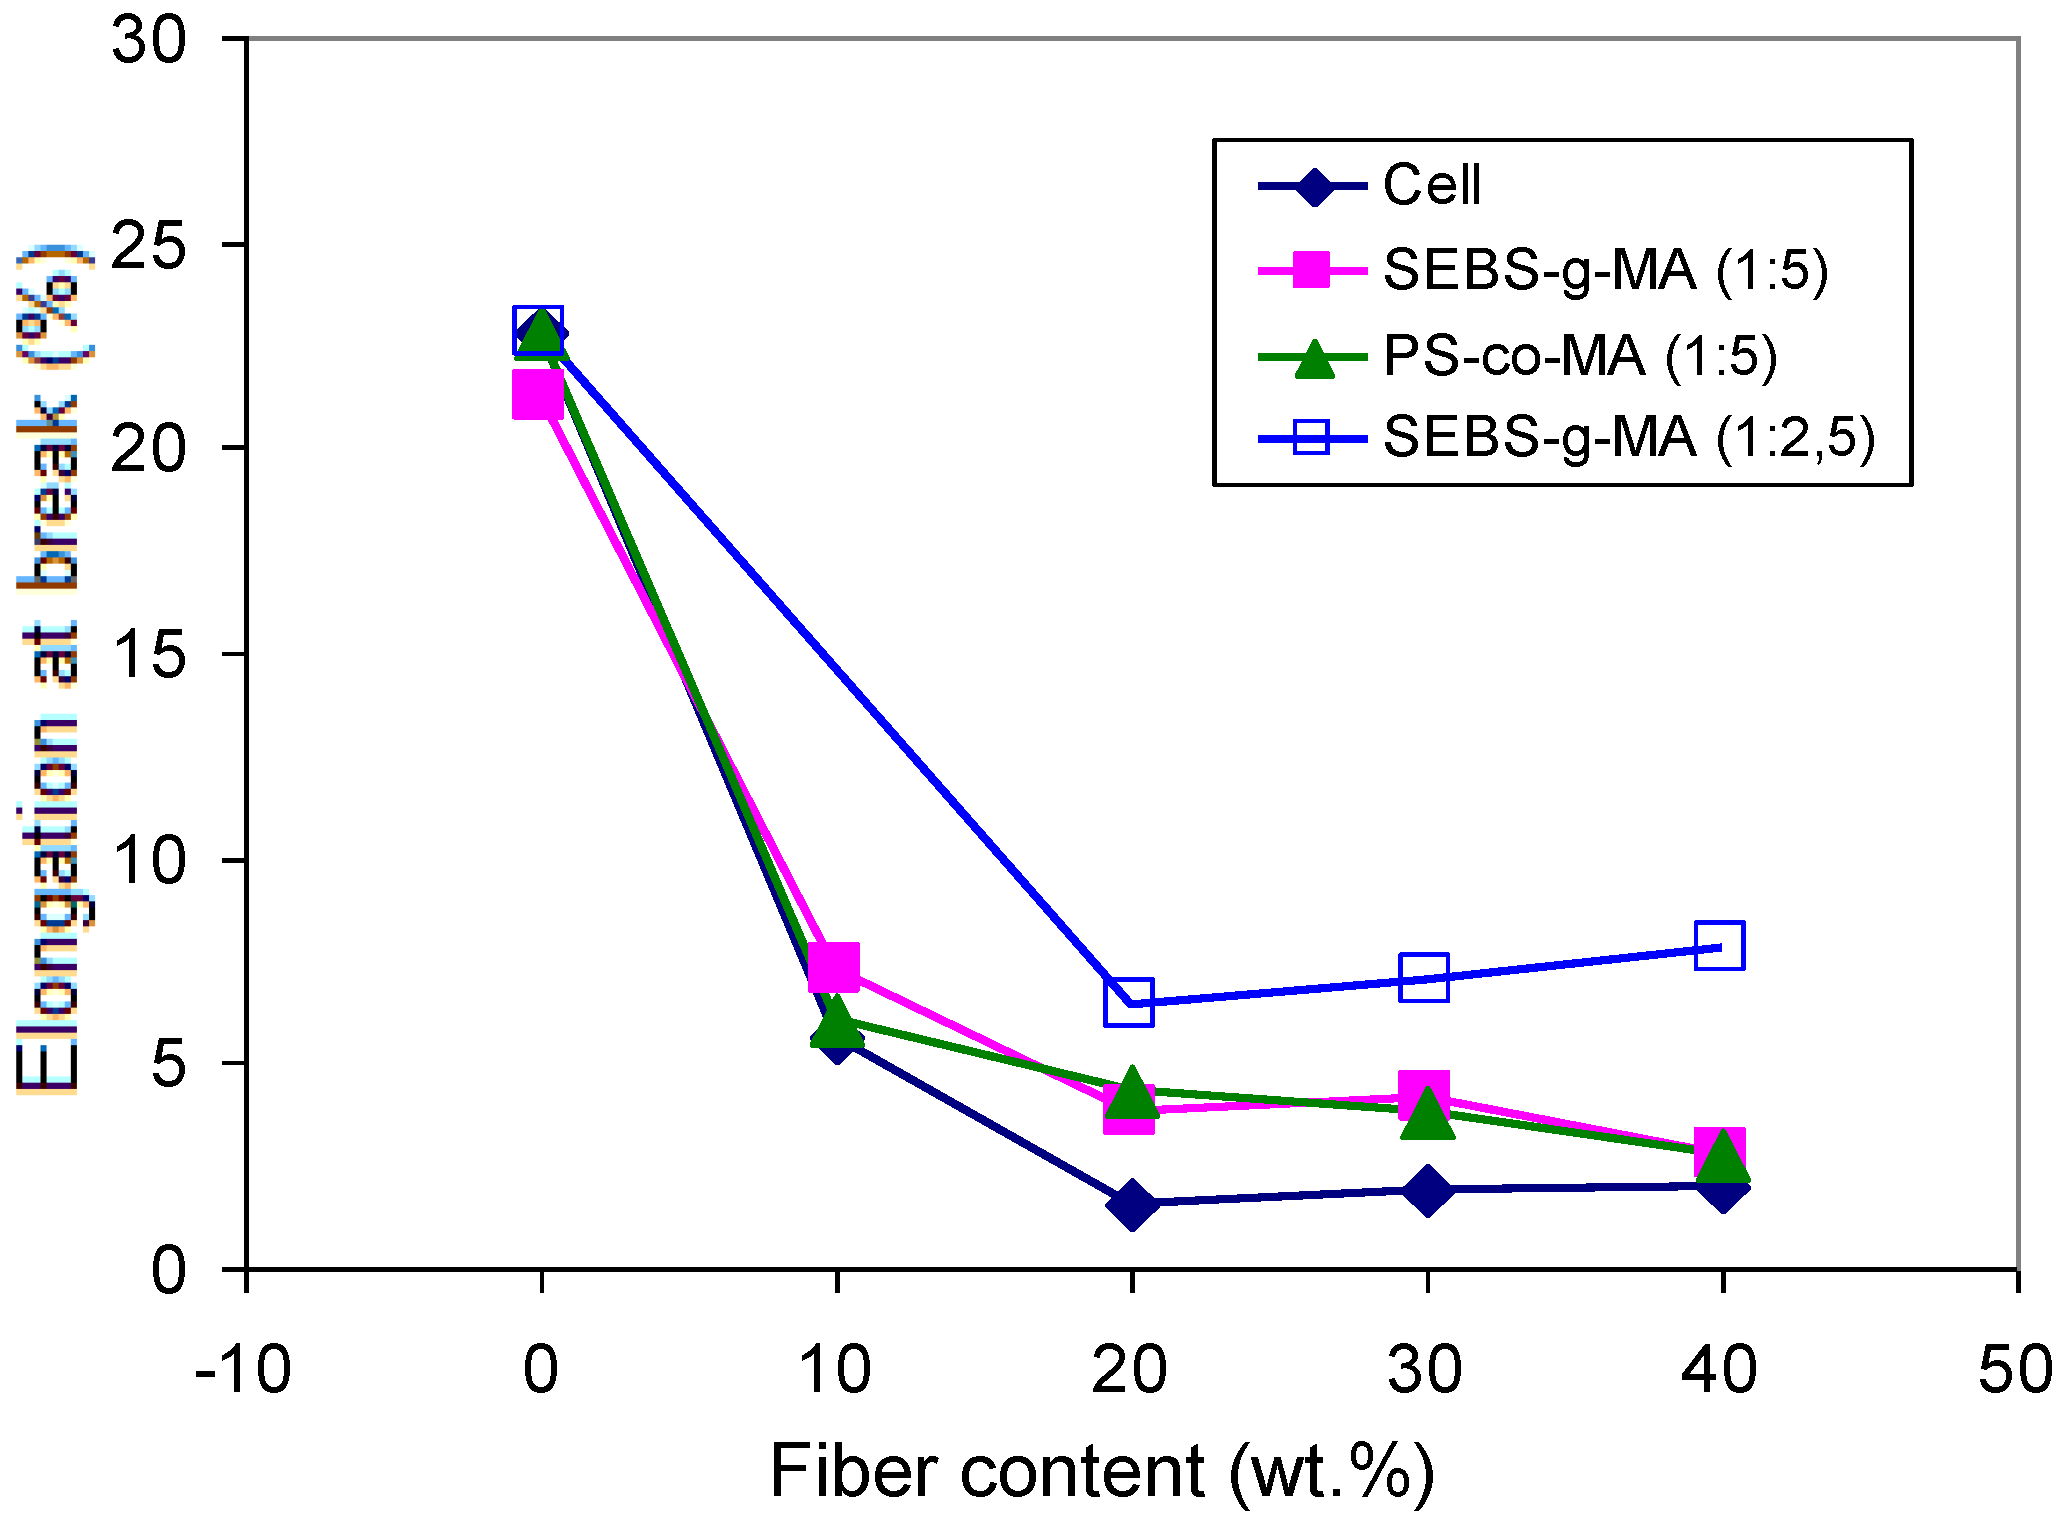
The values of tensile modulus, for binary composites of PS with Cell, Oat and CaCO
3, are compared in
Figure 12 for filler contents ranging from 10 to 40 wt.%. PS/Cell and PS/Oat samples showed a rather brittle behaviour similar to that observed for PP/Hemp. The variation of tensile modulus and elongation at break for PS/Cell composites, compatibilized both with PS-
co-MA and SEBS-
g-MA, is reported in
Figure 13 and
Figure 14 respectively, as a function of fiber content.
Figure 12.
Values of elastic modulus for PS/Cell, PS/Oat and PS/CaCO3 composites vs. filler content.
Figure 12.
Values of elastic modulus for PS/Cell, PS/Oat and PS/CaCO3 composites vs. filler content.
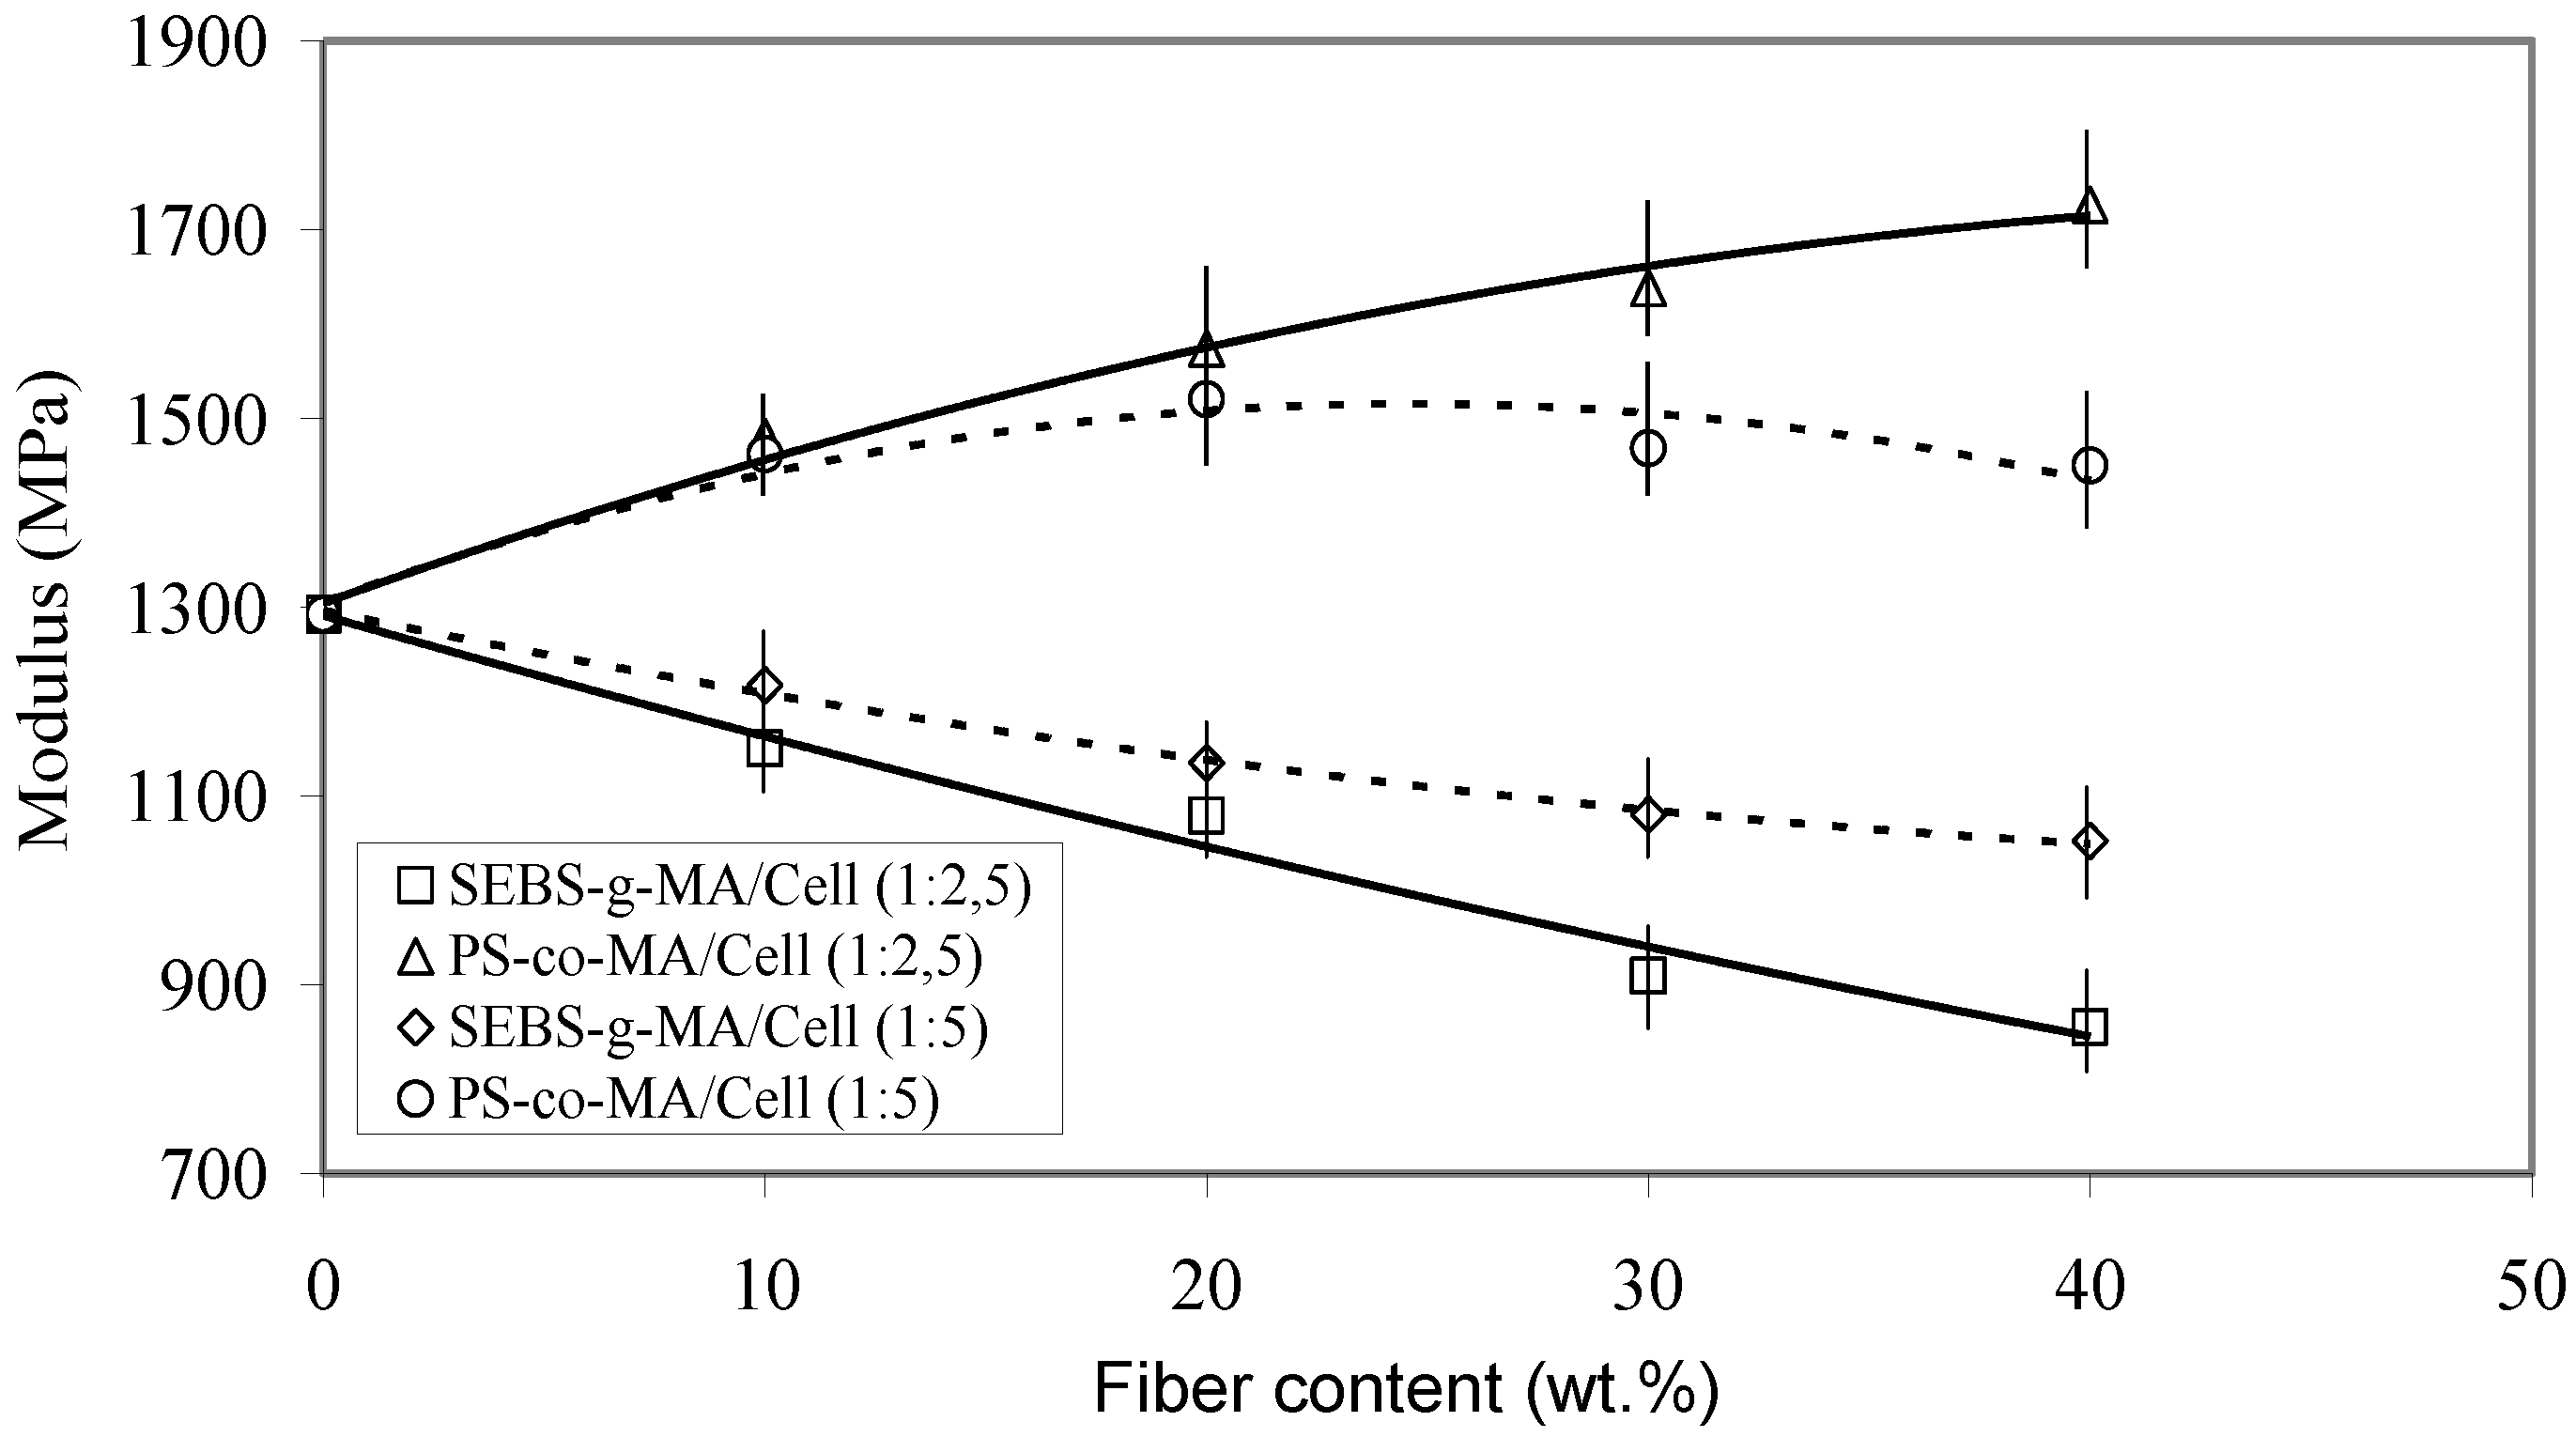
Figure 13.
Elastic modulus of PS/Cell composites compatibilized with PS-co-MA and SEBS-g-MA (at different copolymer/fiber ratios) as a function of cellulose content.
Figure 13.
Elastic modulus of PS/Cell composites compatibilized with PS-co-MA and SEBS-g-MA (at different copolymer/fiber ratios) as a function of cellulose content.
A marked increase of the modulu,s up to about 1,750 MPa, was found for PS/Cell (60/40) upon addition of PS-
co-MA (16 pph), while the strength at max and elongation at break decreased, depending on the fiber/compatibilizer ratio (
Figure 14). Otherwise, the addition of SEBS-
g-MA copolymer caused a ductile behavior with lower modulus and increased elongation at break, owing to the ethylene-butene elastomeric block in the copolymer chain [
28]. However, as it was pointed out by SEM analysis of fracture surfaces of binary SEBS-g-MA/Cell samples, a stronger surface adhesion accompanied by extended fiber fraying was noticed with respect to PS-
co-MA/Cell samples. For PS/Oat composites the addition of PEG (5–10 pph), as plasticizer, resulted in a decrease of modulus and tensile strength, but with a steady improvement of the elongation at break.
Figure 14.
Effect of cellulose content on the elongation at break of PS/Cell composites containing PS-co-MA and SEBS-g-MA (at different copolymer/fiber ratios).
Figure 14.
Effect of cellulose content on the elongation at break of PS/Cell composites containing PS-co-MA and SEBS-g-MA (at different copolymer/fiber ratios).
3.3. Composites with EVA Matrix
Ethylene vinyl acetate (EVA) copolymers, due to their important rubber and resin properties [
29], are used for several applications, such as packaging films, adhesives coatings, cable insulation, barrier sheets,
etc. [
30]. However, the properties of EVA composites have been analyzed for a limited number of systems. It has been reported that wood powder (WP) influenced the crystallization behavior of EVA for composites of PP/EVA blends with WP [
31]. For composites of EVA and cellulose acetate (CA) containing natural fibers (Sterculia villosa), it was found that the tensile strength of EVA composites decreased with the addition of fiber; whereas in CA composites, tensile strength increased due to the well distribution of fibers [
32]. EVA/Sisal fiber composites were prepared by melt mixing in the presence of dicumyl peroxide (DCP) as radical initiator, and it was found that grafting between EVA and Sisal fiber took place. These composites were thermally more stable than both EVA and Sisal fiber alone [
33]. For PP/EVA/Cell composites, it has been reported that EVA improved the resistance of the composites to water absorption [
34].
We examined the structure-property relationships of EVA composites with cellulose fibers modified with maleic anhydride and glycidyl methacrylate for improving the interfacial adhesion and thus the compatibility between the components. We focused attention on the effect of functional groups on the cellulose surface on the morphology, thermal behavior, mechanical properties and fiber-matrix interactions of these systems.
The functionalized cellulose fibers were characterized by SEM and FT-IR analysis. The fiber surfaces displayed extended roughness after modification, in contrast with the smooth surface of the untreated cellulose. The FT-IR spectra of MA treated cellulose displayed an extra peak at 1,570 cm
−1 corresponding to –COOH group, due to the chemical reaction between the hydroxyl groups of cellulose and maleic anhydride [
35]. In the spectrum of GMA treated cellulose an intense carbonyl stretching peak was observed at 1,718 cm
−1, supporting the reaction between epoxy groups of GMA and OH groups of cellulose. The degree of substitution of GMA treated cellulose (DS = 0.16) was also examined by elemental analysis. The variation of torque moment recorded during melt mixing in Brabender indicated that the reaction between cellulose and EVA polymer took place.
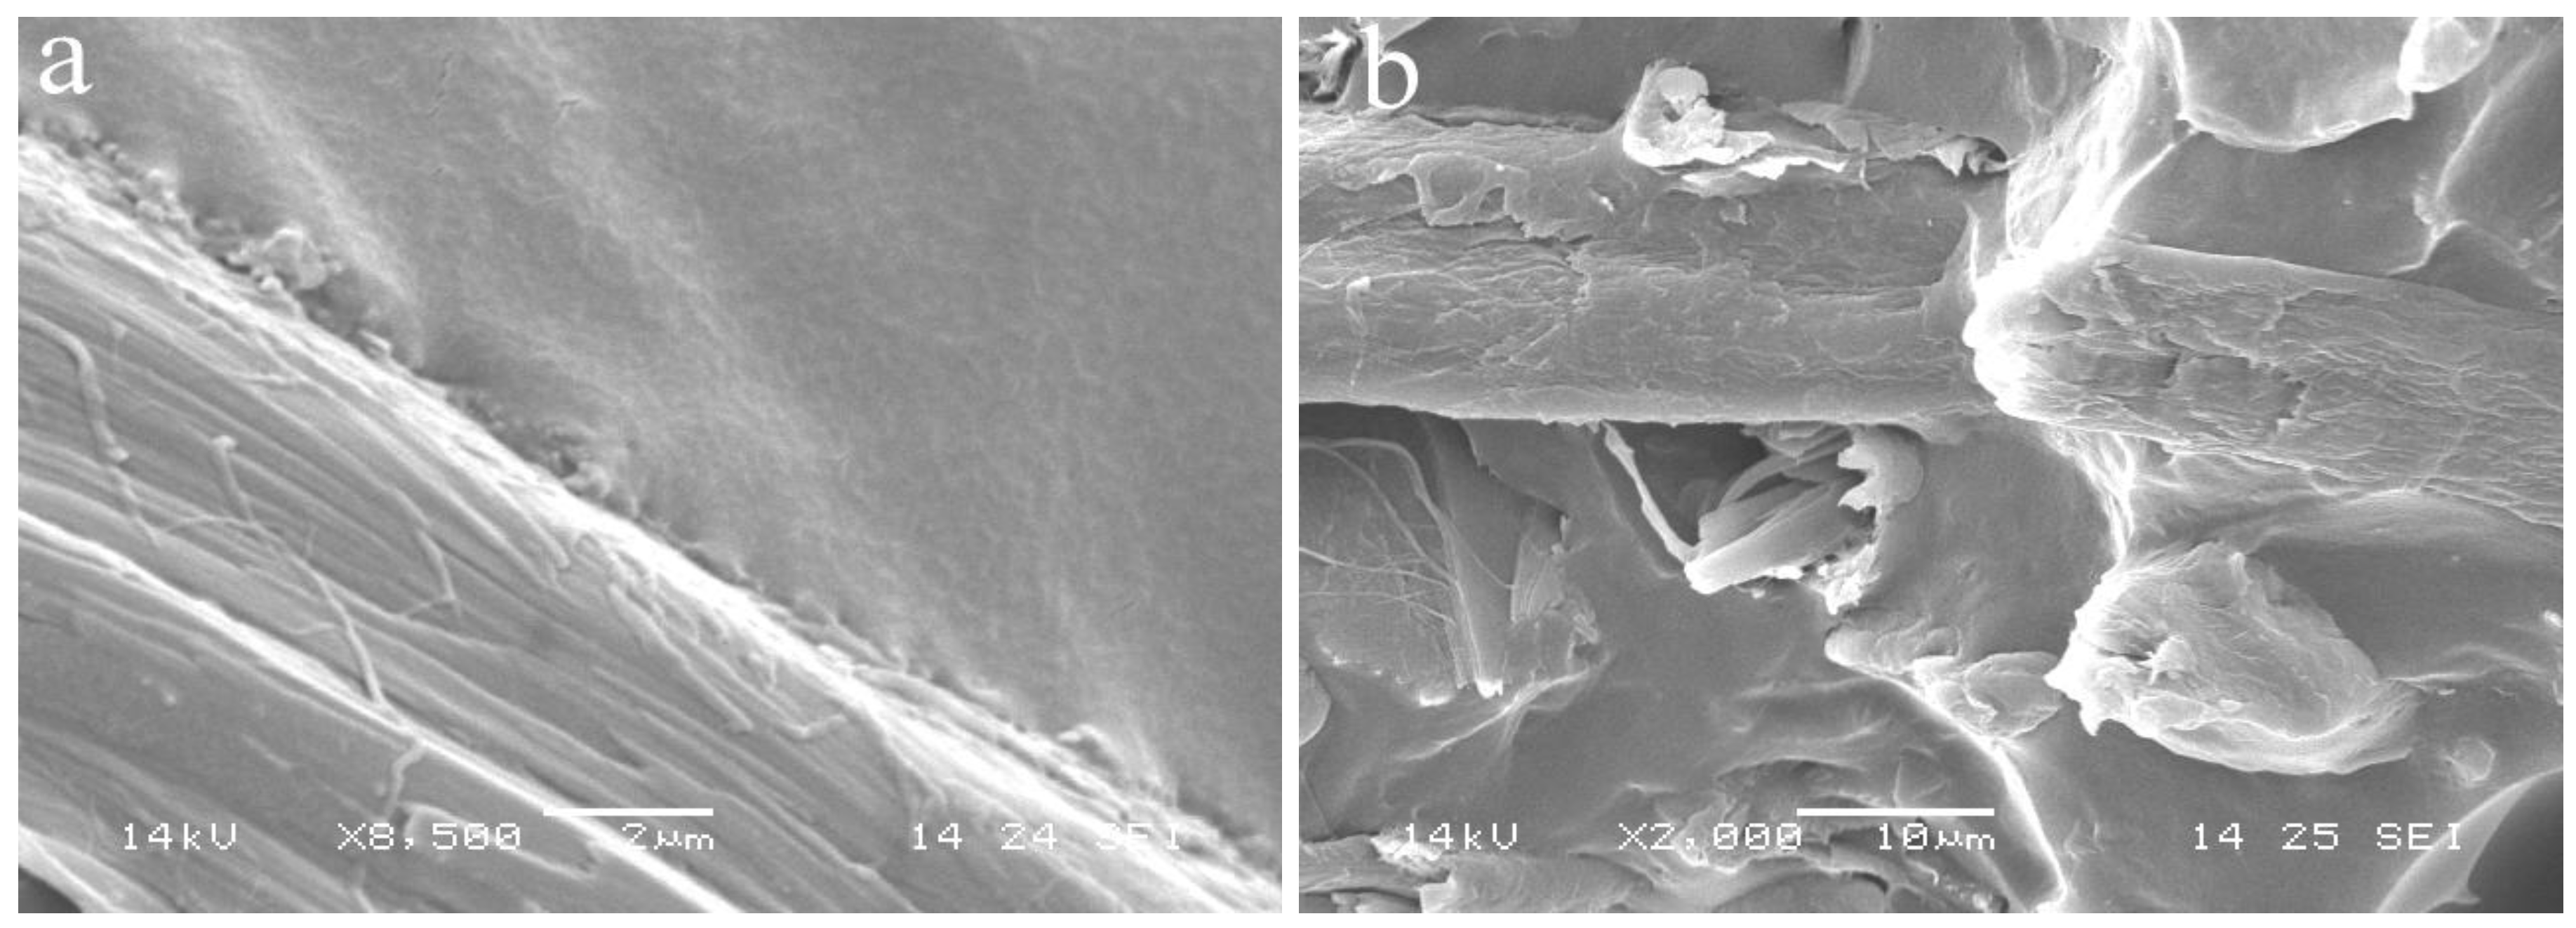
SEM micrographs of the fracture surfaces of EVA/Cell-GMA and EVA-GMA/Cell composites are presented in
Figure 15. Samples of unmodified EVA/Cell show poor adhesion between fiber and polymer with frequent pullout phenomena of the fibers. Otherwise, the fracture surfaces of samples with functionalized components display good interfacial adhesion and the fiber surfaces are coated with a layer of polymer. This indicates an improved compatibility of treated cellulose with EVA copolymers.
Accordingly, FT-IR spectra of EVA, Cell-GMA and EVA/Cell-GMA samples (after removing the EVA matrix with toluene) supported the presence of chemical interactions between EVA and Cell‑GMA in the composites.
Figure 15.
SEM micrographs of (a) EVA/Cell-GMA 80/20 and (b) EVA-GMA/Cell 70/30.
Figure 15.
SEM micrographs of (a) EVA/Cell-GMA 80/20 and (b) EVA-GMA/Cell 70/30.
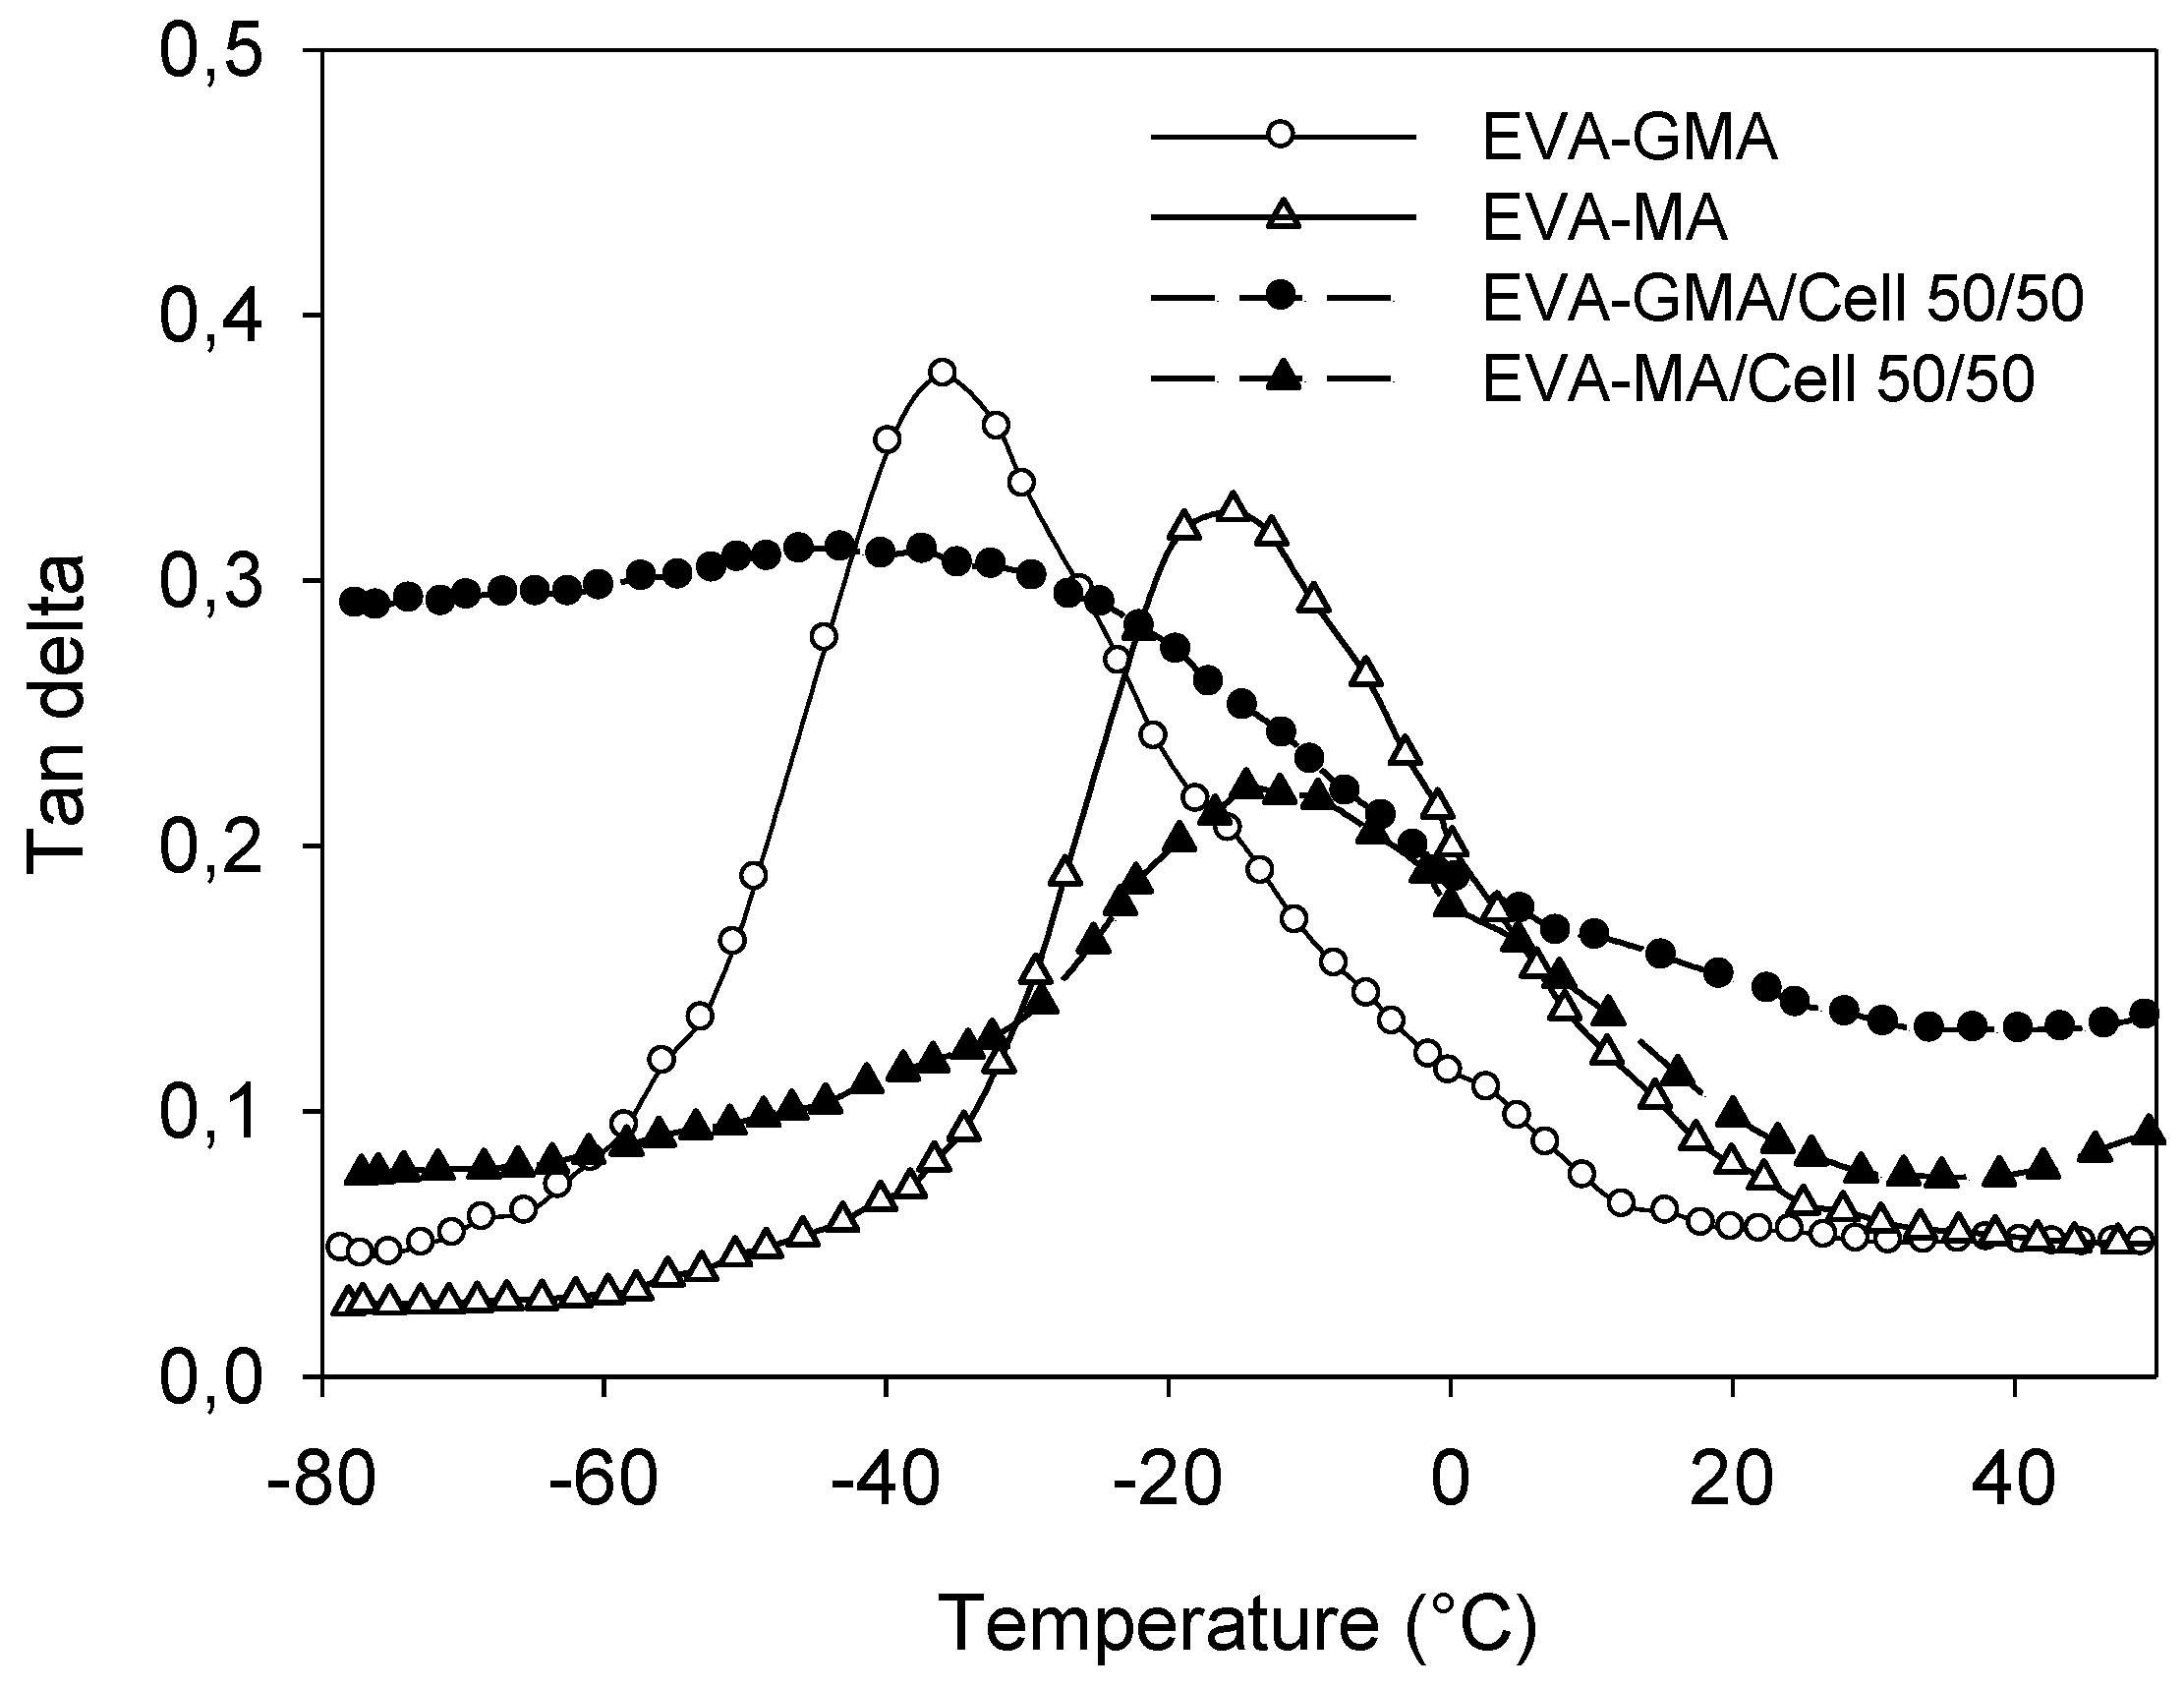
Figure 16 shows the effect of temperature on
tan δ of polymer matrices and their composites. Cellulose incorporation reduces the
tan δ peak height by restricting the movement of the polymer molecules. It was seen that cellulose fiber decreased the
Tg of EVA-GMA; on the other hand
Tg of EVA‑MA is increased by the incorporation of cellulose. Elevation of
Tg is taken as a measure of the interfacial interaction. The width of the tan δ peak also becomes broader than that of the matrix. This behavior suggests that there are molecular relaxations in the composites that are not present in the pure matrix. Hence the width of the tan δ peak is indicative of the increased volume of the interface [
36].
Figure 16.
Temperature dependence of tan δ values for EVA-GMA, EVA-MA and composites with cellulose.
Figure 16.
Temperature dependence of tan δ values for EVA-GMA, EVA-MA and composites with cellulose.
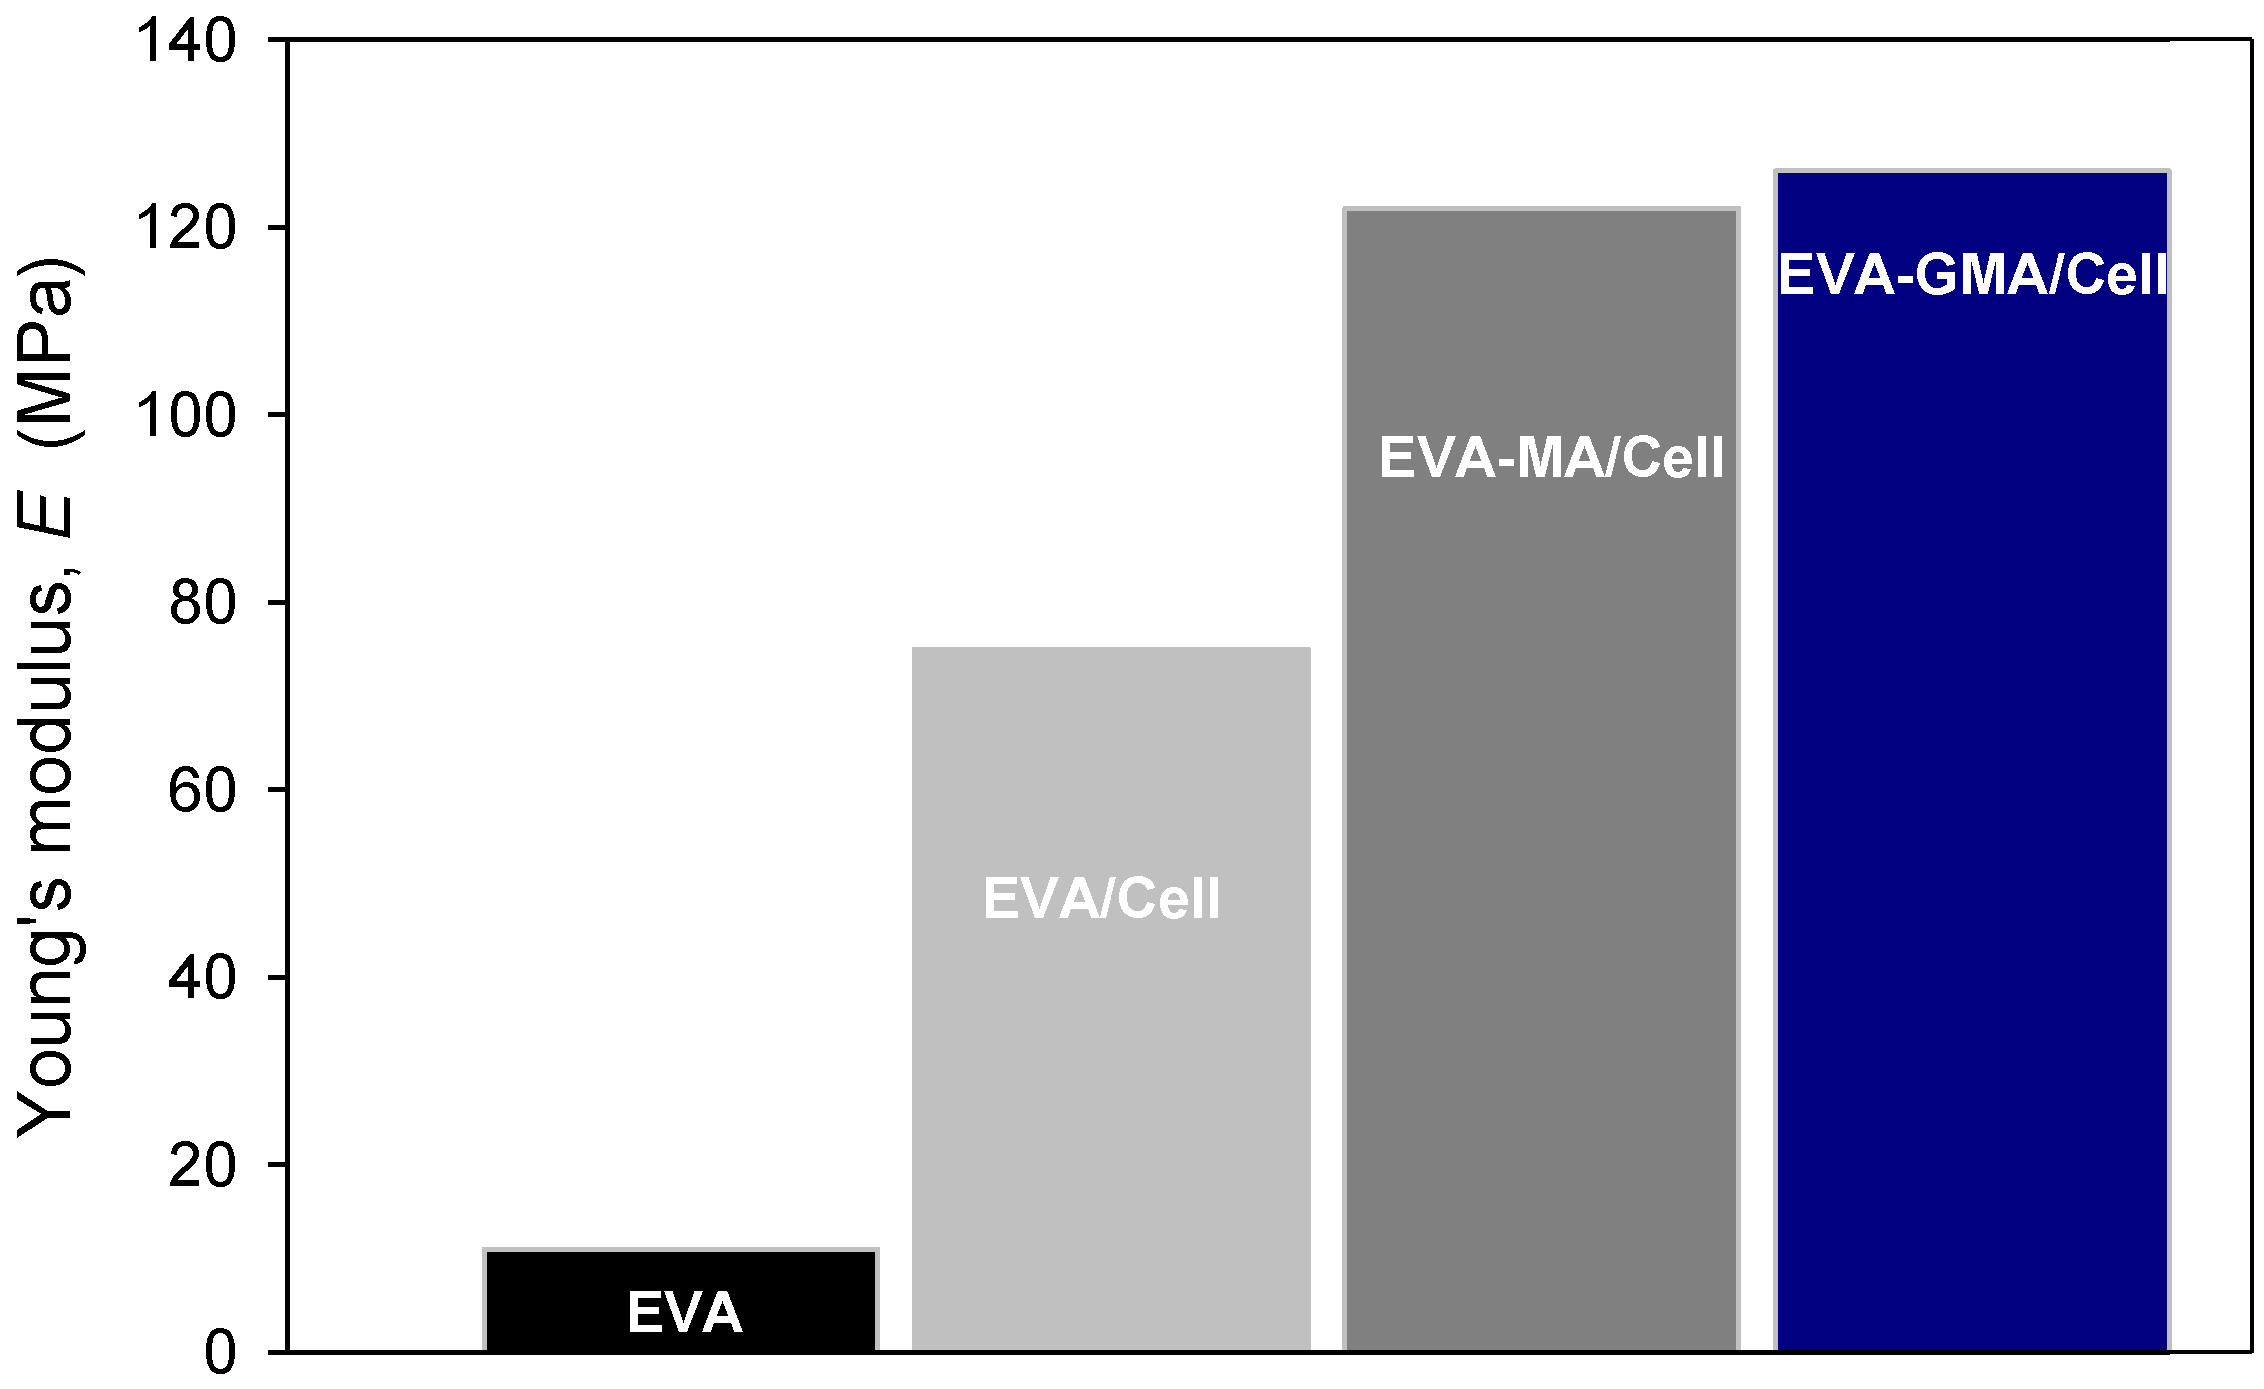
Tensile mechanical properties of polymers and corresponding composites were investigated as a function of fiber length and content.
Figure 17 shows the bar chart of elastic modulus of polymer and composites with 30 wt.% cellulose. Incorporation of cellulose to EVA, EVA-MA and EVA-GMA caused a significant increase of the elastic modulus of the composites compared to plain EVA, due to the higher modulus of cellulose, as observed for other similar systems [
15,
25]. Elongation at break was really reduced in all composites. It was noticed that the failure strength of EVA-GMA/Cell increased compared to EVA/Cell and EVA-MA/Cell. Further, higher values of elongation at break were observed for EVA-GMA composites with respect to EVA-MA based systems.
Figure 17.
Effect of polymer functional groups on the Young modulus of EVA/Cell composites.
Figure 17.
Effect of polymer functional groups on the Young modulus of EVA/Cell composites.
Pure EVA together with EVA-GMA exhibited a clear pseudoplastic behavior (
Figure 18). On the other hand, EVA-GMA/Cell-1 and EVA-GMA/Cell-5 showed a pseudo-solid-like behavior with a pronounced shear thinning parameter. In these cases, Newtonian behavior disappeared at low frequency, suggesting a transition from liquid-like to solid-like viscoelastic behavior. Rheological behavior of neat EVA and EVA-GMA exhibits a Newtonian region at low frequency (<0.1 s
−1) and a shear thinning region at high frequency (>1 s
−1). It is clear that cellulose fibers have a dramatic effect on the rheological behavior: As 30% of fibers are added into the polymer matrix, the Newtonian region of the composites disappears and only the shear thinning region remains in the frequency range of 0.01 to 100 s
−1.
Figure 18.
Melt viscosity of EVA-GMA/Cell composites and plain polymers as a function of frequency.
Figure 18.
Melt viscosity of EVA-GMA/Cell composites and plain polymers as a function of frequency.
3.4. Polyester/Polyolefin/Hemp Ternary Composites
The combination of polyester and polyolefin offers the opportunity of joining the main physico-chemical and mechanical characteristics of different classes of polymer materials: The expected advantages are related to a reduced cost of raw materials, lower environmental impact, and new recycling opportunities.
MaterBi-K (MBK) was selected as biodegradable polymer, PP as polyolefin component and hemp as natural filler. In order to improve the matrix/fiber and MBK/PP compatibility, alkaline treatment of fibers was carried out and a maleated PP (PP-g-MA) was employed as compatibilizer. The thermal, mechanical and rheological properties of both ternary MBK/PP/Hemp (and MBK/PP/PP-g-MA/Hemp) composites, and MBK/PP (and MBK/PP/PP-g-MA) blends, were then investigated. In parallel, binary MBK/hemp composites were prepared and examined [
37].
Blends of MBK and PP displayed poor mechanical properties owing to the incompatibility of both materials. On addition to PP-g-MA, tensile strength increased until reaching a maximum (10 wt.%) due to the compatibilizing effect, as also indicated by SEM analysis. On the other hand, the tensile modulus was generally higher for blends and increased for lower content of PP-g-MA, then decreased due to the lower rigidity of added PP-g-MA, as compared to pure PP. The tensile strength of blends decreased when PP was incorporated to MBK.
As shown in
Table 2, in the case of ternary composites, the tensile strength, σ, increased with the addition of PP and fibers incorporation. The modulus,
E, remained almost constant for all studied composites, being twice that of corresponding MBK/PP/PP-g-MA blends. SEM analysis revealed a good adhesion between fibers and matrix, which in turn contributed to the enhanced mechanical properties. DSC analysis indicated that PP and fibers had little effect on the thermal behavior of MBK, whereas in the presence of PP-g-MA either in blends or composites, a marked change of crystallization and melting temperature of PP was found. This can be ascribed to the chemical interactions occurring between hydroxyl groups of natural components and MA groups.
Table 2.
Mechanical and thermal properties of MBK/PP/PP-g-MA/Hemp composites.
Table 2.
Mechanical and thermal properties of MBK/PP/PP-g-MA/Hemp composites.
| Matrix composition | σ (MPa) | E (MPa) | Tm(PP) (°C) | Tc(PP) (°C) |
|---|
| MBK/Hemp 60/40 (B) | 15.2 | 1,270 | | |
| B80PP20 | 22.1 | 1,360 | 158.2 | 111.7 |
| B80PP18PPgMA2 | 20.2 | 1,150 | 153.7 | 114.0 |
| B80PP15PPgMA5 | 22.3 | 1,600 | 160.4 | 120.0 |
| B80PP10PPgMA10 | 20.2 | 1,380 | 159.0 | 119.0 |


