1. Introduction
Recent developments in the field of rheological analysis and high-performance processing of polymers have led to the enhanced design and application of these materials in different engineering applications. PEEK-based nanocomposites have been developed for high-efficiency electromagnetic wave absorption over a wide temperature range, demonstrating their potential for advanced functional and high-performance engineering applications [
1]. Polyaryletherketone (PAEK) materials have been developed and are now being used in additive manufacturing, with a higher thermal resistance and mechanical strength that are appropriate for advanced manufacturing techniques [
2]. The concept of compatibilization is essential for improving the mechanical, morphological and rheological properties of polyethylene/polypropylene blends modified by maleic anhydride-grafted polyethylene in a number of studies [
3]. In the same way, polyamide 6-containing cellulose nanocomposites are a material with improved mechanical properties and processability on an industrial scale for melt processing [
4]. The rheological and dynamic mechanical properties of polymers in fused deposition modeling have been studied to gain insights into their printing quality and adhesion between layers [
5]. For industrial uses, some rigid-chain polymers like aromatic polyamides are the subject of research, as they possess superior strength and thermal stability [
6].
Moreover, PEEK exhibits excellent mechanical strength, adhesive performance, and biocompatibility, making it suitable for high-performance engineering and biomedical applications [
7]. The influence of fused deposition modeling (FDM) 3D printing parameters on the mechanical properties and microstructure of Carbon Fiber (CF)/PEEK and Glass Fiber (GF)/PEEK composites was investigated, showing that processing conditions significantly affect the strength and structural performance of printed thermoplastic composites [
8]. The study of Ultra-High-Molecular-Weight Polyethylene (UHMWPE) fiber formation through the gel-spinning method has yielded a greater understanding of polymer physics and processing mechanisms [
9]. Recent studies have demonstrated that material extrusion-based 3D printing techniques can be modified to successfully manufacture functional gradient PEEK components with improved structural performance and process adaptability [
10]. Furthermore, the grafting and long-chain branching of polyamide 6 have improved the crystallization, foaming and mechanical properties of the material [
11]. The incorporation of ceramic fillers in polymer composites has now enhanced their thermal conductivity and rheological properties, in particular for thermal interface materials [
12]. At the same time, sustainable and high-performance materials have become more interesting through the use of bio-based and functional additives. The use of materials derived from lignin as alternatives for plastics has increased interest in this material, and it has been identified as a potential material for the additive manufacturing industry for sustainable material development [
13].
Although considerable advances have been made in the area of rheological modeling, polymer blending and high-performance composite processing, there are still some challenges with the current methods, including incomplete linkage between rheology and processing behavior, inability to accurately predict under industrial conditions and limited integration of simulation with experimental validation. Most studies concentrate on property enhancement and not on a material–process–performance relationship, thus reducing confidence in their reliability in actual manufacturing situations. The key research challenge is therefore not the individual use of rheology or simulation, but the quantitative transfer of experimentally identified flow behavior into process and structural predictions for a specific PEEK bearing geometry. This study focuses on establishing how the experimentally determined shear-thinning response and selected constitutive model influence filling, pressure, thermal and thermo-mechanical predictions within the same processing chain. The proposed framework addresses these gaps with a comprehensive characterization of the rheological properties, modeling at different temperatures, and CAD–FEA-based process simulation for the realistic prediction of polymer behavior. The scientific focus is therefore placed on the PEEK-specific relationship between measured material behavior, processing response and bearing-level performance rather than on re-establishing standard polymer characterization principles. This study is different from traditional approaches as it creates a coupled approach between material properties, flow behavior and process parameters in a single predictive approach. The distinction lies in the explicit traceability of experimentally determined PEEK rheological behavior in the subsequent processing and structural analyses rather than in the availability of integrated simulation software itself. The framework uses comparative experimental model fitting to identify the most representative constitutive response before evaluating its implications for filling, pressure, thermal and structural behavior. The novelty is the integration of advanced rheological models, injection molding simulation and structural analysis of PEEK parts. The novelty is not attributed to the individual use of rheology, injection molding simulation, CAD or FEA, which are established practices in polymer engineering, but to their quantitative material-specific linkage within one PEEK bearing analysis. In particular, experimentally measured flow behavior is comparatively fitted using Power Law, Cross and Carreau–Yasuda models, and the selected constitutive description provides the material basis for subsequent process and thermo-mechanical predictions. More specifically, the contribution lies in quantitatively comparing constitutive descriptions and identifying the Carreau–Yasuda representation as the most suitable description of the measured non-linear PEEK flow response for subsequent processing analysis. The selected rheological representation is then carried through injection molding and thermo-mechanical simulations to connect flow characteristics with filling, pressure, stress and deformation behavior. This allows for an optimization of the processing parameters with mechanical and thermal reliability. The proposed approach offers a comprehensive and scalable high-performance polymer design approach for industrial applications.
Organization of Paper
The rest of this paper is organized as follows:
- ✓
The related works in polymer rheology and high-performance engineering materials are presented in
Section 2.
- ✓
The research gaps explored in this study are presented in
Section 3.
- ✓
Section 4 describes the proposed methodology, including material selection, rheological modeling, processing simulation and FEA.
- ✓
The results and discussions are presented in
Section 5, which includes the rheological behavior, thermal–mechanical properties, and results of simulations.
- ✓
Section 6 concludes the study and discusses future research directions for improving polymer processing and performance.
The article is structured into
Section 1 (Introduction),
Section 2 (Related Works),
Section 3 (Problem Statement),
Section 4 (Proposed Methodology),
Section 5 (Experimental Setup), and
Section 6 (Conclusions), with each section clearly presenting the background and research gap, related studies, problem formulation, proposed methodological workflow, experimental and simulation procedures, and concluding findings, respectively.
2. Related Works
Gul et al. [
14] developed thermally conductive PEEK composites using twin-screw extrusion, rheological analysis, thermal characterization, and conductivity measurements; however, their study was limited by high filler loading complexity and a lack of scalability validation in diverse manufacturing conditions. Rodzén et al. [
15] studied PEKK crystallization in Fused Filament Fabrication (FFF) using temperature control and kinetics analysis; however, their work was limited by a lack of scalability and parameter optimization. Sabet et al. [
16] analyzed composite and nanocomposite polymers using advanced manufacturing processes like polymerization, additive manufacturing and mechanical/thermal characterization, but their study had some limitations in terms of scalability and lack of long-term testing. Jiang et al. [
17] developed Polybutylene Adipate Terephthalate (PBAT)/Thermoplastic Starch (TPS) biodegradable composites using a two-step blending process with Epoxidized Soybean Oil (ESO) compatibilization, characterized by Fourier Transform Infrared Spectroscopy (FT-IR), Gel Permeation Chromatography (GPC), and mechanical testing; however, their study was limited by cost concerns and a lack of long-term biodegradation analysis.
Xiong et al. [
18] developed mathematical prediction models using DSC and tensile analysis to study the crystallization and mechanical properties of PEEK/CF–PEEK; however, their work was limited by model accuracy constraints and a lack of complex processing condition validation. Maloney et al. [
19] reviewed FFF processing of PEEK and PEKK focusing on process–structure–property relationships without a specific predictive model; however, their study was limited by a lack of experimental validation and insufficient analysis of PEKK processing behavior. Lucio et al. [
20] studied polyurethane curing kinetics using rotational viscometry, dynamic rheometry, and kinetic modeling (first-order, autocatalytic, isoconversional), but practical industrial processing validation and scalability analysis were not performed. Lee et al. [
21] developed a set of Conjugated Polymer (CP)-based ones with supramolecular/photochemical crosslinking and thermal–mechanical characterization, though their work still lacked large-scale recycling validation and long-term performance assessment.
Gavande et al. [
22] manufactured a polymer blend of UHMWPE using melt blending and performed a rheological study and mechanical/thermal characterization; however, their work was limited in its discussion of mechanical/elongation properties and lacked large-scale processing validation. Li et al. [
23] investigated the effect of hot compression molding parameters on PEEK using experimental analysis without a predictive model; however, their work was limited by a lack of advanced modeling and real-time process optimization. Herzog et al. [
24] established analytical surrogate models to simulate melt conveying in single-screw extrusion, but the approximation assumptions made in the study and the resulting approximate accuracy limit the applicability under the very complex real industrial conditions. Baniasadi et al. [
25] developed bio-based Polyamide–Functionalized Graphene Oxide (PA–FGO) nanocomposites using in situ polymerization, rheological testing, and mechanical/electrical characterization; however, the study was limited by a low filler concentration range and a lack of large-scale processing validation. Li et al. [
26] have further demonstrated the mechanical performance of PEEK under advanced manufacturing conditions, supporting its suitability for demanding load-bearing applications and reinforcing the importance of processing–property relationships in PEEK components. Zheng et al.’s [
27] studies on resin-based engineering composites have also demonstrated the importance of combining performance evaluation with predictive modeling for demanding mechanical and tribological applications. Xiang et al.’s [
28] polymer composite processing studies have further shown that manufacturing conditions can strongly influence the resulting mechanical and structural properties, highlighting the importance of linking processing parameters with material performance. Li et al.’s [
29] previous polymer failure studies have demonstrated that temperature, loading rate and stress state can significantly influence the predicted tensile response, emphasizing the importance of appropriate loading and thermal conditions in structural simulations. Duan et al. [
30] showed that the tribological performance of polymer-based self-lubricating materials is strongly influenced by material architecture and lubrication mechanisms, highlighting the importance of considering friction and wear alongside mechanical integrity in bearing applications. Wen et al. [
31] developed EMFF-2025, a neural network-based potential system for modeling energetic materials containing C, H, N, and O elements. The study demonstrated the applicability of machine learning for efficient and accurate material property prediction. Su et al. [
32] investigated the combined effects of wettability gradients and pore structures in thermoresponsive polymer-functionalized fabrics. Their findings highlighted the potential of polymer-based structures for adaptive thermal and moisture regulation. Xie et al. [
33] proposed a rapid aerodynamic analysis approach integrating the panel method with boundary-layer theory. The method enabled the efficient prediction of steady and unsteady aerodynamic characteristics. Pang et al. [
34] applied machine learning to investigate pore-permeability evolution in fuel-related copolymers. The study demonstrated the usefulness of data-driven approaches for predicting complex material transport properties. Roy et al. [
35] examined ballistic impact resistance in 3D-woven hybrid composites by considering damage confinement and layer architecture. The results emphasized the role of composite structural design in reducing backface deformation. Roy et al. [
36] reconstructed ballistic impact temperatures in UHMWPE composites using morphology-calibrated thermal libraries. The approach provided an effective framework for estimating impact-induced thermal responses in composite materials. Cai et al. [
37] developed a neural network model for predicting aerodynamic parameters of airfoils. The study demonstrated the effectiveness of neural networks in providing rapid aerodynamic predictions compared with conventional computational approaches.
The previous studies showed remarkable advances in polymer composites, rheological analysis, nanocomposites, biodegradable materials, and the simulation of processing using methods of extrusion, in situ polymerization, rheometry, thermal analysis, and numerical simulation. Most of the existing ones are, however, limited by their high processing complexity, limited optimization of the filler, limited industrial-scale validation, inadequate long-term performance analysis, and reduced accuracy of simplified models or experiment-only models under actual processing conditions. A further limitation is that experimental rheological observations are often not quantitatively traced through to component-level processing and structural responses within a single analysis chain. The present framework addresses this issue by using measured PEEK behavior and comparative constitutive fitting as the material basis for the subsequent flow and thermo-mechanical simulations of the bearing geometry. The proposed work will address these challenges by combining detailed rheological characterization, selection of optimized processing parameters and advanced simulation-based analysis using CAD and FEA software tools. The unresolved issue addressed here is therefore the quantitative consistency between experimentally obtained constitutive behavior and the predicted response of a specific PEEK component under processing and service-related conditions. Rather than treating rheological fitting, mold filling and structural analysis as separate outputs, the proposed sequence uses the experimentally supported flow representation as the basis for interpreting downstream process and performance responses. This hybrid method allows for precise material characterization, increases scalability and enables reliable performance evaluation in realistic injection molding conditions for high-performance engineering polymers.
3. Problem Statement
High-performance semicrystalline polymers showed a strong dependency on crystallization control during 3D printing, but lacked consistent control strategies across PEKK and PEEK grades, leading to unstable mechanical performance and limited process repeatability in additive manufacturing applications [
15]. The prediction of crystallinity and mechanical behavior under non-isothermal molding was addressed, but existing models were limited by accuracy constraints under varying cooling rates and lacked robustness for complex reprocessing conditions in CF/PEEK systems [
18]. Process–structure–property relationships in FFF-based PEKK and PEEK were explored, but insufficient quantitative modeling and limited processing window optimization restricted their applicability for reliable industrial-scale additive manufacturing [
19]. The mechanical behavior of PEEK plates under different hot compression molding conditions was analyzed, but the study lacked predictive simulation integration and did not fully capture multi-parameter interactions affecting final material performance [
23].
The suggested approach overcomes these challenges by combining rheological characterization, process simulation based on CAD models, and multiphysics analysis performed by FEA to provide a realistic prediction of the behavior of the material in actual processing conditions. This experimental–computational strategy helps to achieve a heightened degree of scalability, higher accuracy of the model, and more reliable performance prediction for high-performance engineering polymers in industrial applications. Simulation-derived filling, stress and deformation responses require experimental confirmation before their predictive capability can be established for practical manufacturing conditions. Therefore, the present analysis distinguishes experimentally measured material and rheological quantities from simulation-derived component responses and evaluates prediction reliability through quantitative error and correlation metrics.
Objectives
Investigate the rheological behavior and processing characteristics of PEEK for high-performance aircraft bearing applications to understand its flow and deformation behavior under industrial conditions.
Utilize PEEK as the selected material for aircraft bearing systems, considering its superior thermal stability, mechanical strength, and suitability for high-load engineering applications.
Evaluate the material through systematic material characterization, rheological testing, and rheological model fitting to determine its thermal properties, flow behavior, and predictive rheological parameters.
Simulate the complete manufacturing process using injection molding simulation, CAD-based PEEK bearing modeling, and FEA to analyze flow behavior, structural integrity, and thermo-mechanical performance.
4. Proposed Methodology
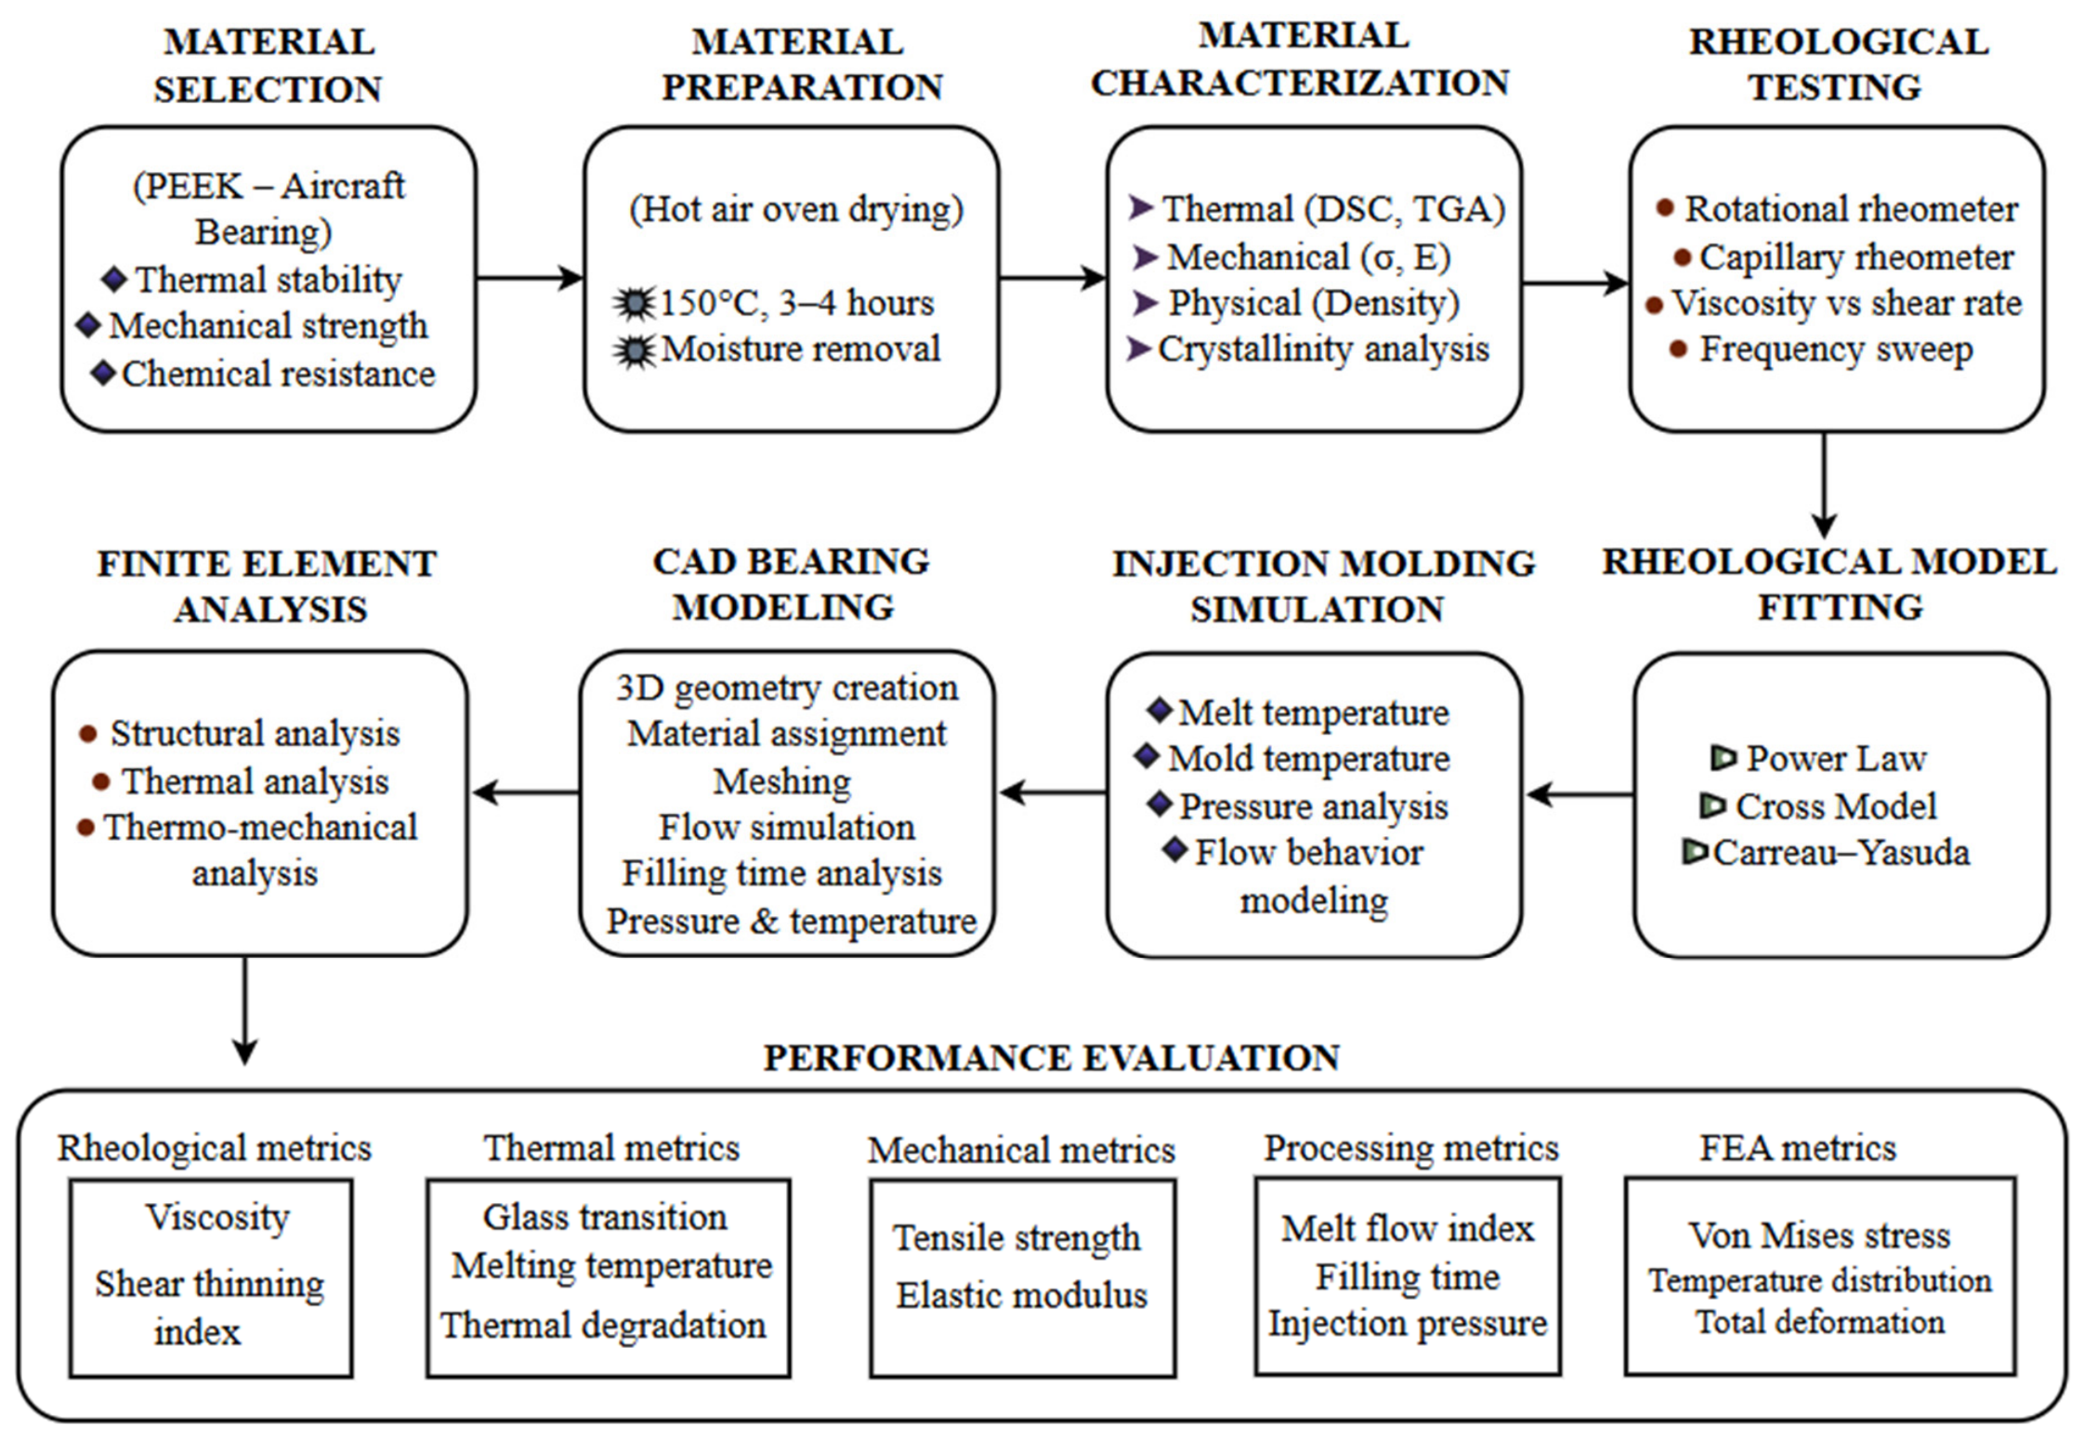
The proposed methodology is a systematic approach to analyzing the rheological behavior and processing performance of high-performance engineering polymers, applied to the processing of aircraft bearing application with PEEK. In this study, the experimental investigation is specifically focused on Polyether Ether Ketone (PEEK) as the selected material for aircraft bearing applications. Accordingly, the material characterization, rheological analysis, processing simulation and FEA results are interpreted specifically for PEEK rather than for high-performance polymers as a general class. PEEK is first chosen for its excellent thermal, mechanical and chemical properties for use in the aerospace industry, and is then processed through a controlled material preparation process that includes hot-air oven drying to eliminate moisture and avoid defects during molding. Then, material characterization is conducted to assess various thermal properties (Tg, Tm, stability), mechanical strength, density and crystallinity to ensure suitability for high-performance applications. Rheological testing then takes place via the use of rotational and capillary rheometers to study viscosity, shear stress, and viscoelastic properties under various conditions. The experimental results are also fitted to the Power Law, Cross and Carreau–Yasuda equations in order to accurately model the flow behavior. The fitted constitutive response is used as the material-level basis for subsequent injection molding analysis, thereby maintaining continuity between measured rheology and simulated processing behavior. Model selection is based on the agreement between experimental and predicted viscosity responses, with the best-performing representation subsequently considered for process-level interpretation. Injection molding simulation is performed to predict the melt flow, filling behavior, pressure and temperature distribution under given injection molding conditions. A detailed CAD model of the PEEK bearing is created and coupled with simulations to study flow patterns, filling time and defect formation. Finally, FEA is used to assess structural, thermal and thermo-mechanical performance, including stress distribution, deformation and temperature variation, to achieve a comprehensive understanding of the material behavior and to ensure the optimal design and processing conditions.
Figure 1 provides a concise visual overview of the experimental-to-computational workflow, while the subsequent sections focus only on the parameters and results necessary to reproduce and interpret each stage. The detailed scientific emphasis is placed on experimentally measured rheology, comparative constitutive-model fitting, injection molding predictions and thermo-mechanical FEA rather than repeating the workflow description.
Table 1 provides the principal experimental parameters used to characterize the PEEK material, including the parallel-plate rheometer configuration, thermal analysis conditions, ASTM D638 tensile-test parameters and Carreau–Yasuda model fitting criterion. The rheological measurements were performed over 360–400 °C and a shear rate range of 1–3000 s
−1, while the tensile properties were obtained from five specimens under the specified ASTM D638 conditions.
4.1. Material Selection
High-performance thermoplastics are chosen due to their excellent mechanical, thermal and chemical characteristics, which support difficult engineering tasks. Of these, PEEK is selected for its outstanding performance properties. PEEK is a semi-crystalline high-performance engineering polymer that has high thermal stability, good mechanical properties and resistance to chemical and wear degradation.
These are the key features that have led to the choice of PEEK:
Good thermal stability at high temperature;
Excellent mechanical strength and stiffness;
Excellent wear and chemical resistance;
Suitability for aerospace applications such as aircraft bearing components.
The properties make PEEK very attractive for use in aerospace application, being favored for aircraft bearings and other components. Additionally, its high-temperature resistance and load-bearing capacity guarantee its reliability and durability in industrial settings.
4.2. Material Preparation
The pre-processing of polymers before manufacturing is known as material preparation. This primarily involves removing moisture and impurities to avoid defects in the production process which occur at high temperatures.
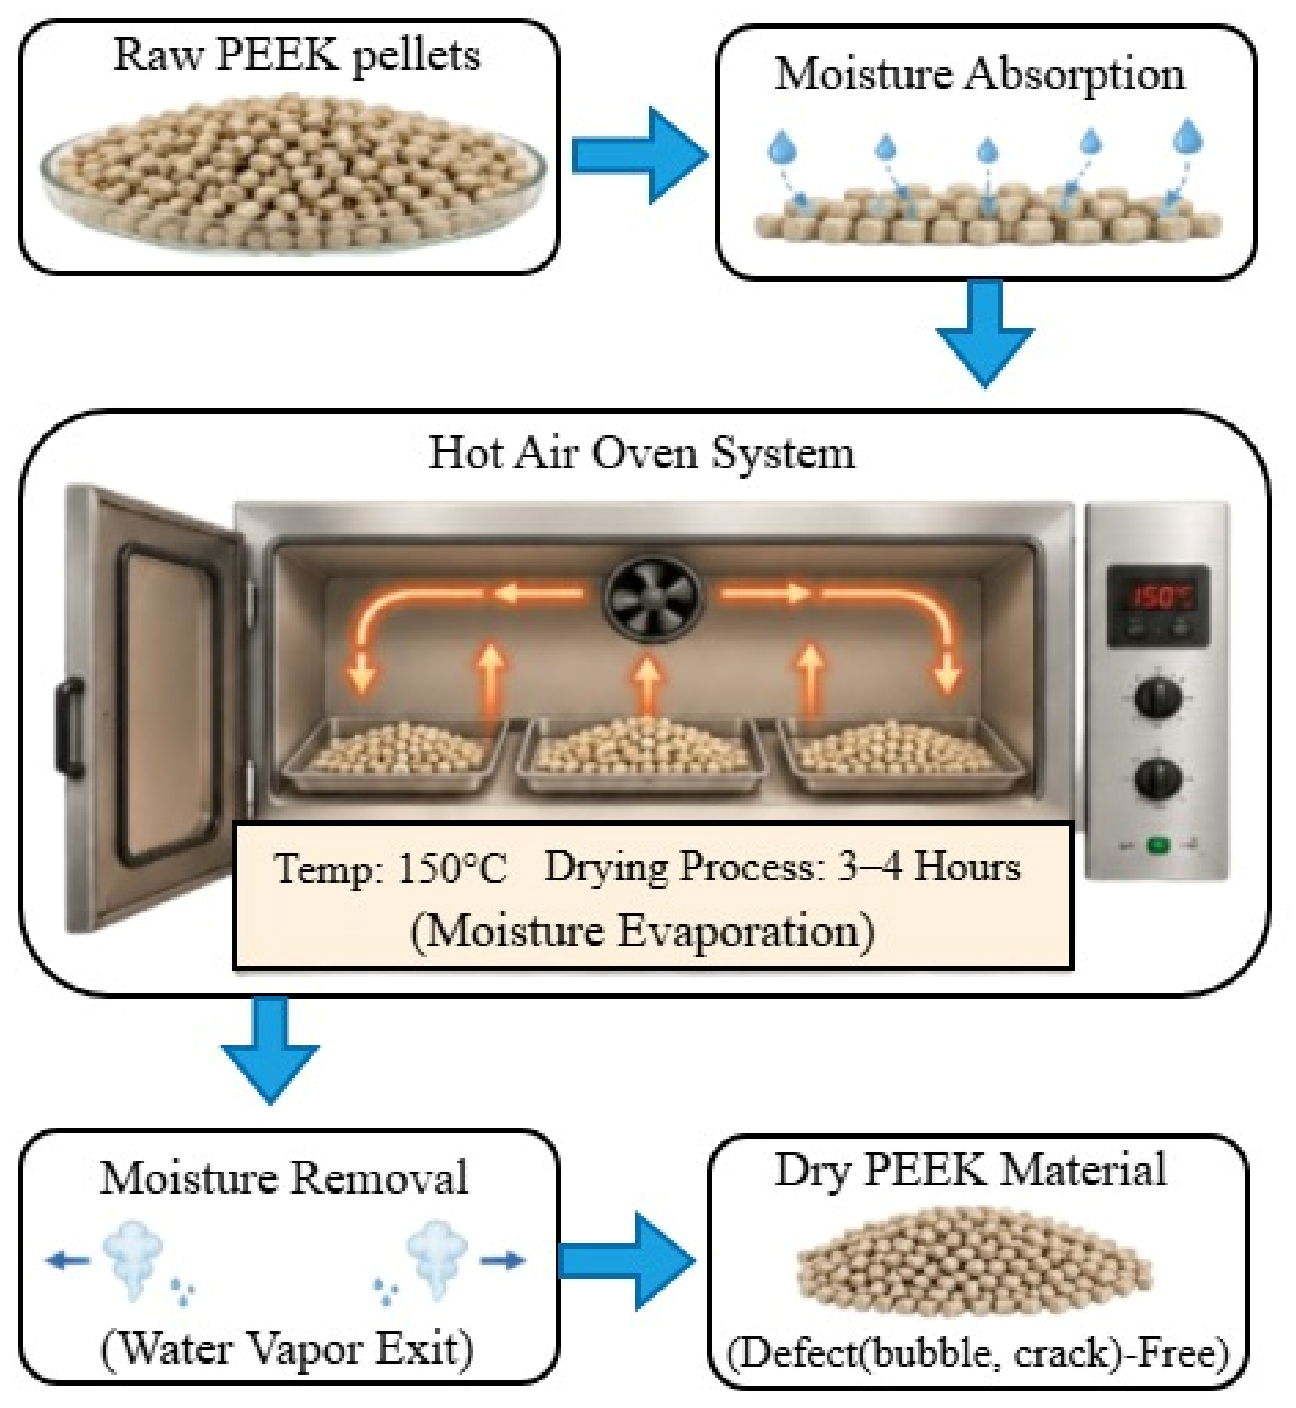
Figure 2 shows the material preparation process of PEEK using a hot-air oven drying.
The first step is to gather the PEEK pellets in their raw state, and these can have moisture absorbed by the ambient air. This is eliminated by putting the pellets in a hot-air oven and drying them under controlled conditions for 4 h at 150 °C. In the oven, heated air is constantly circulated around the pellets to help distribute heat evenly and to help the moisture evaporate. The higher the temperature, the more the moisture absorbed by the PEEK pellets is removed from the product. This process guarantees the complete drying of the polymer, giving defect-free material for further processing. Water removal is important to prevent defects like voids, bubbles and thermal degradation in the subsequent injection molding process, improving the overall material stability and product quality. For the investigated PEEK bearing application, moisture control is particularly important because processing occurs at elevated temperatures and moisture-related defects can directly affect the reliability of the molded component. The reduction from 0.120% to 0.00099% moisture therefore establishes a controlled material condition before rheological and injection molding evaluation.
4.3. Material Characterization
Material characterization is the process of systematically identifying the thermal, mechanical and physical properties of a material to gain an understanding of its behavior under various conditions. This step ensures that the material selected is suitable in terms of performance parameters for processing and use. The fitted parameters showed narrow 95% confidence intervals, while the high R
2 value of 0.97 and low RMSE and MAE values indicated good agreement between the rheological model and the experimental observations in
Table 2.
The measured melting enthalpy of 72 J·g
−1 corresponded to a crystallinity of 55.385%, indicating the calculated crystalline fraction used for subsequent material analysis in
Table 3.
These material and thermo-mechanical parameters were used to define the PEEK material model and establish the loading and temperature conditions for the subsequent FEA in
Table 4.
The thermo-mechanical response was evaluated by simultaneously considering the applied radial load and temperature-induced thermal effects using the defined material properties and boundary conditions in
Table 5.
4.3.1. Thermal Analysis
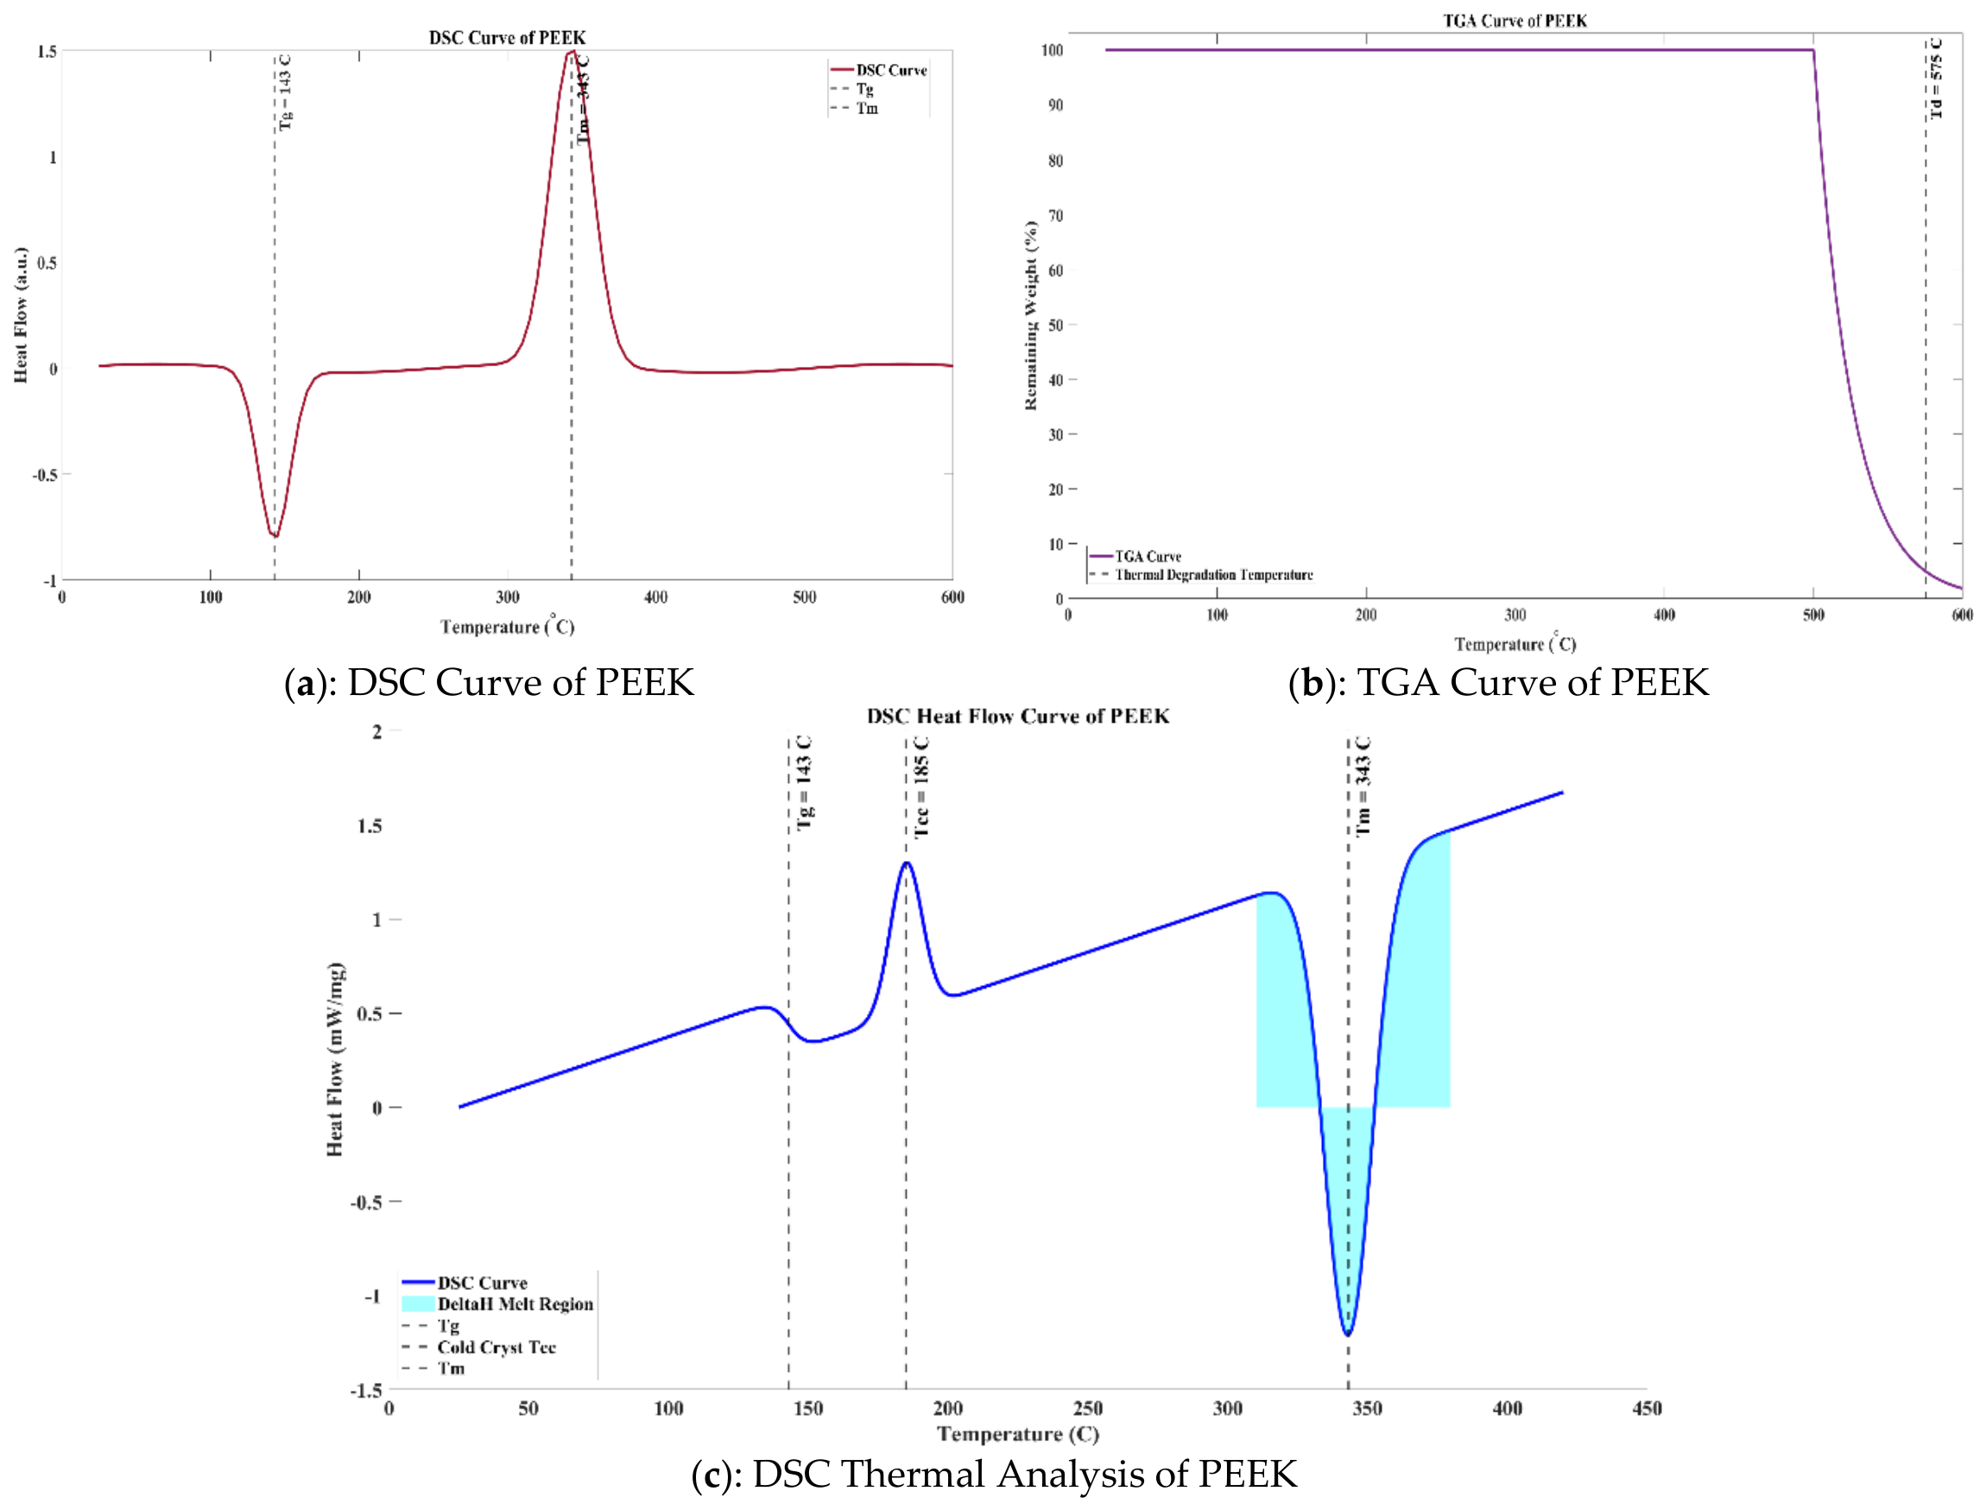
The thermal properties of the PEEK material are investigated using Differential Scanning Calorimetry (DSC) and Thermogravimetric Analysis (TGA). The glass transition temperature (Tg) and melting temperature (Tm) are used to determine the thermal transitions of the polymer and the used DSC method. TGA is employed to assess thermal stability by monitoring the material’s weight loss against temperature, which will indicate the degradation behavior at high temperatures.
4.3.2. Mechanical Properties
Mechanical characterization is performed to evaluate the strength and stiffness of the material. The tensile strength is determined to find the maximum amount of stress that a material can resist before failing, and the elastic modulus is determined to understand the resistance of the material to the applied load.
4.3.3. Physical Properties
Physical characterization includes determining the density of the material, which gives information about the compactness and mass distribution. Density is an important factor in the structural performance and efficiency of materials.
4.3.4. Crystallinity Analysis
Crystallinity analysis is performed to assess the extent of ordered molecular structure in the polymer. The crystallinity will depend greatly on the degree of crystallinity, which is determined by applying the following Equation (1):
In this equation, is the degree of crystallinity, is the measured melting enthalpy, and is the theoretical melting enthalpy. This analysis provides critical insight into the structure–property relationship of the material. For the PEEK bearing application, the measured Tg of 143 °C, Tm of 343 °C and Td of 575 °C define the thermal limits relevant to processing and subsequent service-oriented assessment. These experimentally determined temperatures provide the basis for selecting processing conditions while reducing the risk of interpreting flow and structural behavior outside the material’s stable thermal range.
4.4. Rheological Testing
This is conducted to measure the shearing and deformation characteristics of the molten PEEK material. The rheological measurements are carried out in a rotational and capillary rheometer that can be used to analyze the flow properties of polymer melts across the entire range of shear rates. PEEK material is heated to its melting point or above so that it will be fully molten before it is tested.
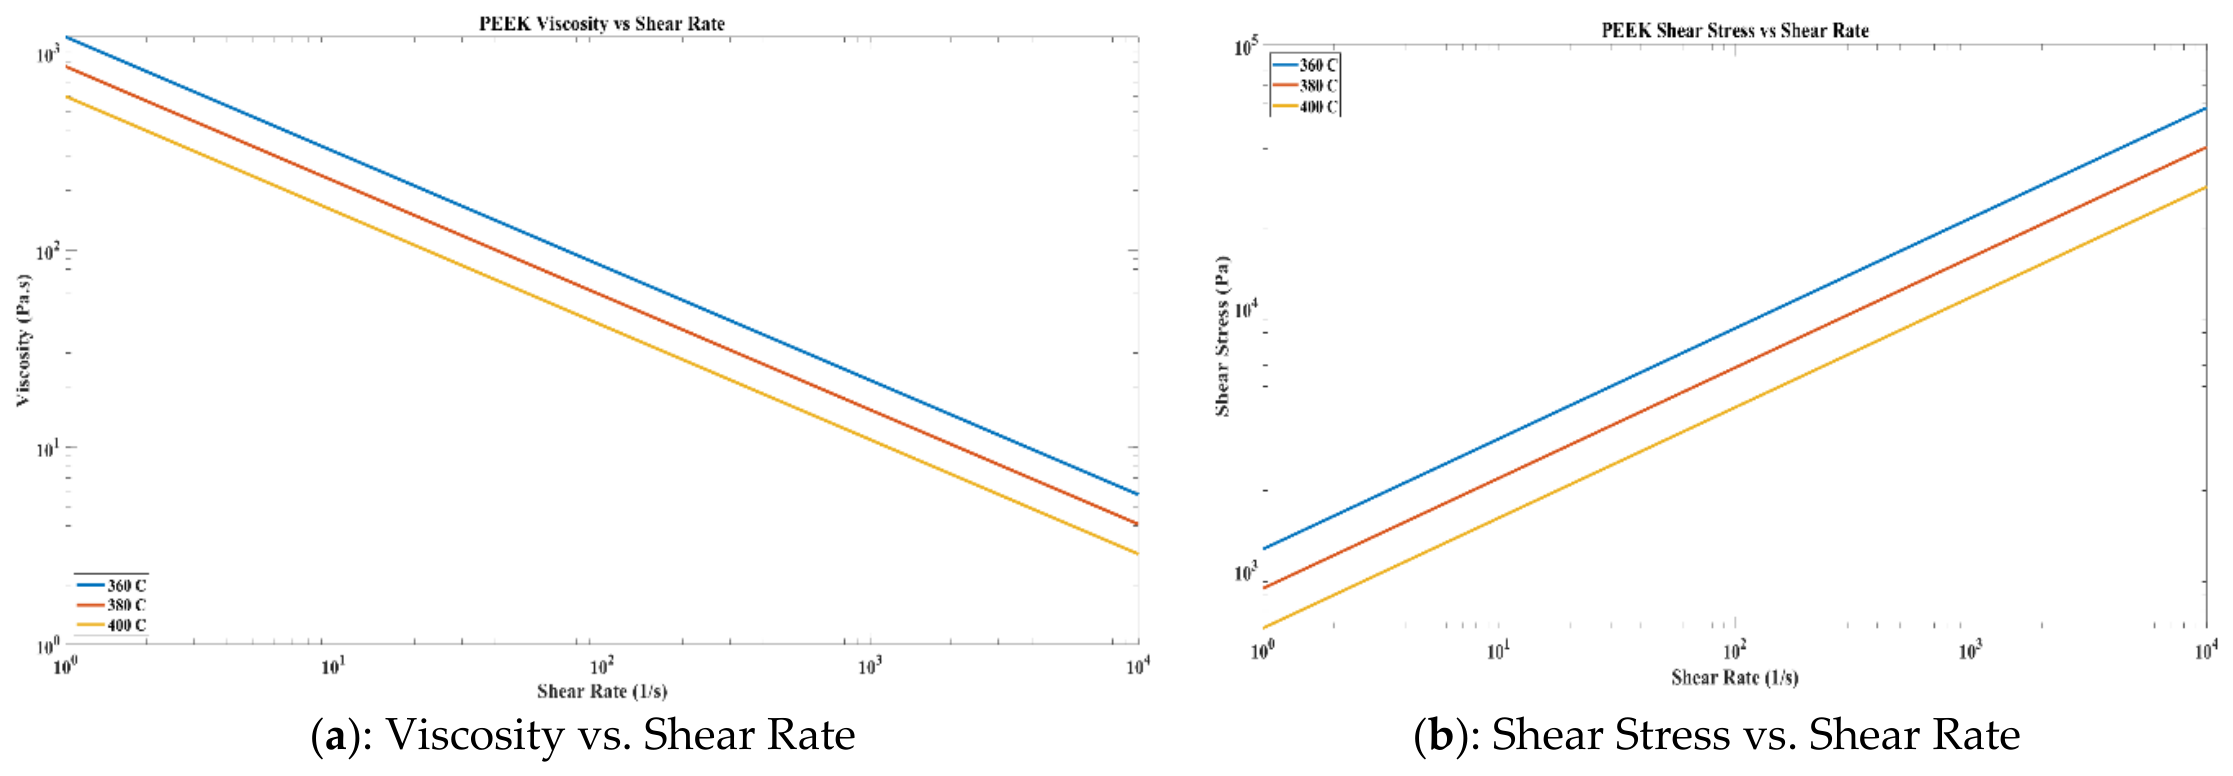
Flow Behavior Analysis: The primary rheological parameters measured include viscosity (η) and shear stress as a function of shear rate. These parameters provide insight into the resistance of the material to flow under applied forces. The variation of viscosity with shear rate is analyzed to determine the shear-thinning behavior of the polymer melt, which is a critical factor in processing performance. In the present PEEK system, this response is particularly relevant because viscosity reduction with increasing shear rate directly influences melt mobility during bearing cavity filling. The measured rheological behavior consequently provides the material-level evidence required to interpret the filling and pressure distributions obtained from injection molding simulation.
Frequency Sweep Analysis: Tests are performed to assess the material’s viscoelastic properties under oscillatory conditions. The analysis can be used to understand the material response in terms of storage modulus and loss modulus over frequencies, and can provide further information on molecular dynamics and structural stability during deformation.
4.5. Rheological Model Fitting
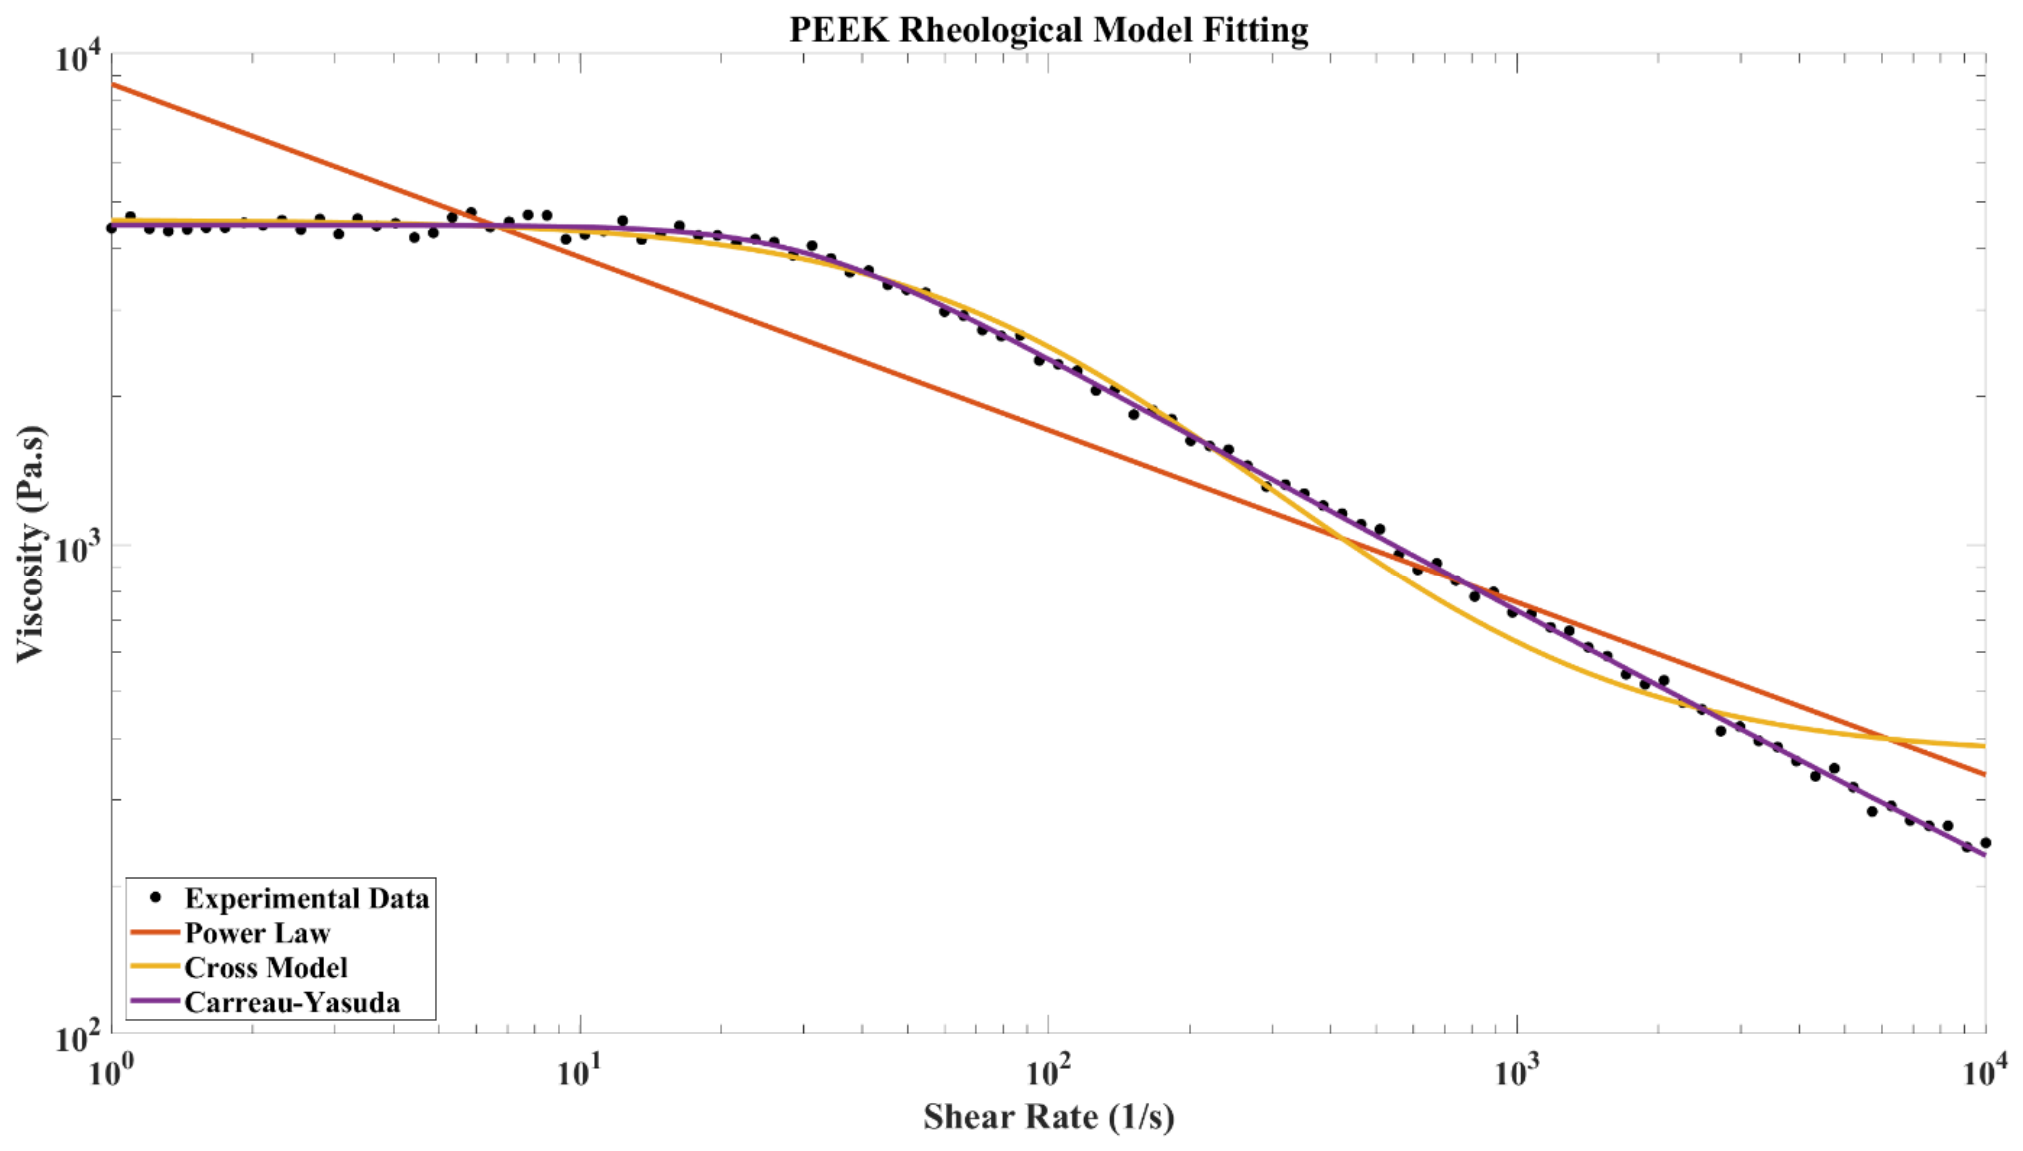
Rheological model fitting is a way of obtaining a mathematical model of the experimentally obtained flow behavior and enabling the description of the viscosity–shear rate relationship of the polymer melt. The three established constitutive models were considered only for comparative identification of the formulation that best represents the measured PEEK viscosity response over the investigated shear rate range. Their standard theoretical definitions are therefore not reproduced in detail, and the analysis focuses on model fitting accuracy and the resulting constitutive selection. By doing so, it is possible to predict the material response when subjected to various processing parameters. The models which are widely used are the Power Law model, the Cross model and the Carreau–Yasuda model. The purpose of comparing these established models is to determine which constitutive representation most closely captures the experimentally observed PEEK response under the investigated processing conditions. The comparison identified the Carreau–Yasuda model as the most accurate representation, achieving an R2 of 0.97 and providing the principal rheological basis for subsequent process interpretation.
The Power Law model describes the non-Newtonian (shear-thinning or shear-thickening) flow behavior of polymer melts. It explains how the viscosity of a material changes with respect to the applied shear rate during flow. This law is defined as Equation (2):
Here, denotes viscosity, denotes the shear rate, denotes the consistency index, and denotes the flow behavior index.
- 2.
Cross Model
The Cross model is an advanced rheological model which is used to describe the viscosity curve of polymer melts in a wide range of shear rates, including low-shear and high-shear regions. It reflects a transition between the Newtonian region at low shear rates and the shear-thinning region at high shear rates. This model is represented by Equation (3):
where
indicates zero-shear viscosity,
indicates a dimensionless term, and
indicates a dimensionless flow parameter.
- 3.
Carreau–Yasuda Model
This model explains the complete flow behavior of polymer melts in the low-, intermediate- and high-shear regions. It is more accurate than simpler models because it models Newtonian and shear-thinning behavior. It is represented by Equation (4):
In this equation, represents infinite-shear viscosity, represents a dimensionless parameter, represents the Yasuda parameter, denotes the flow behavior index, and controls the slope of the shear-thinning region.
4.6. Injection Molding Simulation
This is a numerical study of molten polymer behavior during a melting process inside a mold, used to predict the polymer processing responses and to optimize the processing parameters before polymer production. The choice of processing method for the PEEK material is injection molding, as it is suitable for high-performance parts. The main parameters of processing are determined: melt temperature, 360–400 °C, mold temperature, 160–200 °C; and injection pressure. All of these parameters have a significant impact on flow behavior, filling time and final part quality. To accurately describe the molten polymer flow during injection molding, the generalized momentum conservation Navier–Stokes equation for incompressible non-Newtonian flow is used, as shown in Equation (5):
Here, is the density of the molten polymer, is the velocity vector of flow, t is the time, p is the pressure inside the mold cavity, is the shear stress tensor, and is the body force. The simulation analyzes melt flow progression, filling patterns, pressure distribution, and temperature variation during injection. For the selected aircraft bearing geometry, these outputs provide application-specific indicators of whether the PEEK melt can fill the cavity uniformly while avoiding localized pressure concentrations. The resulting flow-front and pressure patterns therefore translate the experimentally established material response into component-level processing information. These results help in optimizing processing conditions, preventing defects such as air traps and incomplete filling, and ensuring uniform mold filling with improved part quality and process efficiency.
4.7. PEEK Bearing CAD Modeling
This process includes the development of an accurate 3D geometric model of the bearing part in order to simulate and analyze the material flow and the behavior during injection molding. This step allows for the accurate visualization and prediction of the behavior of the molten polymer in the mold cavity.
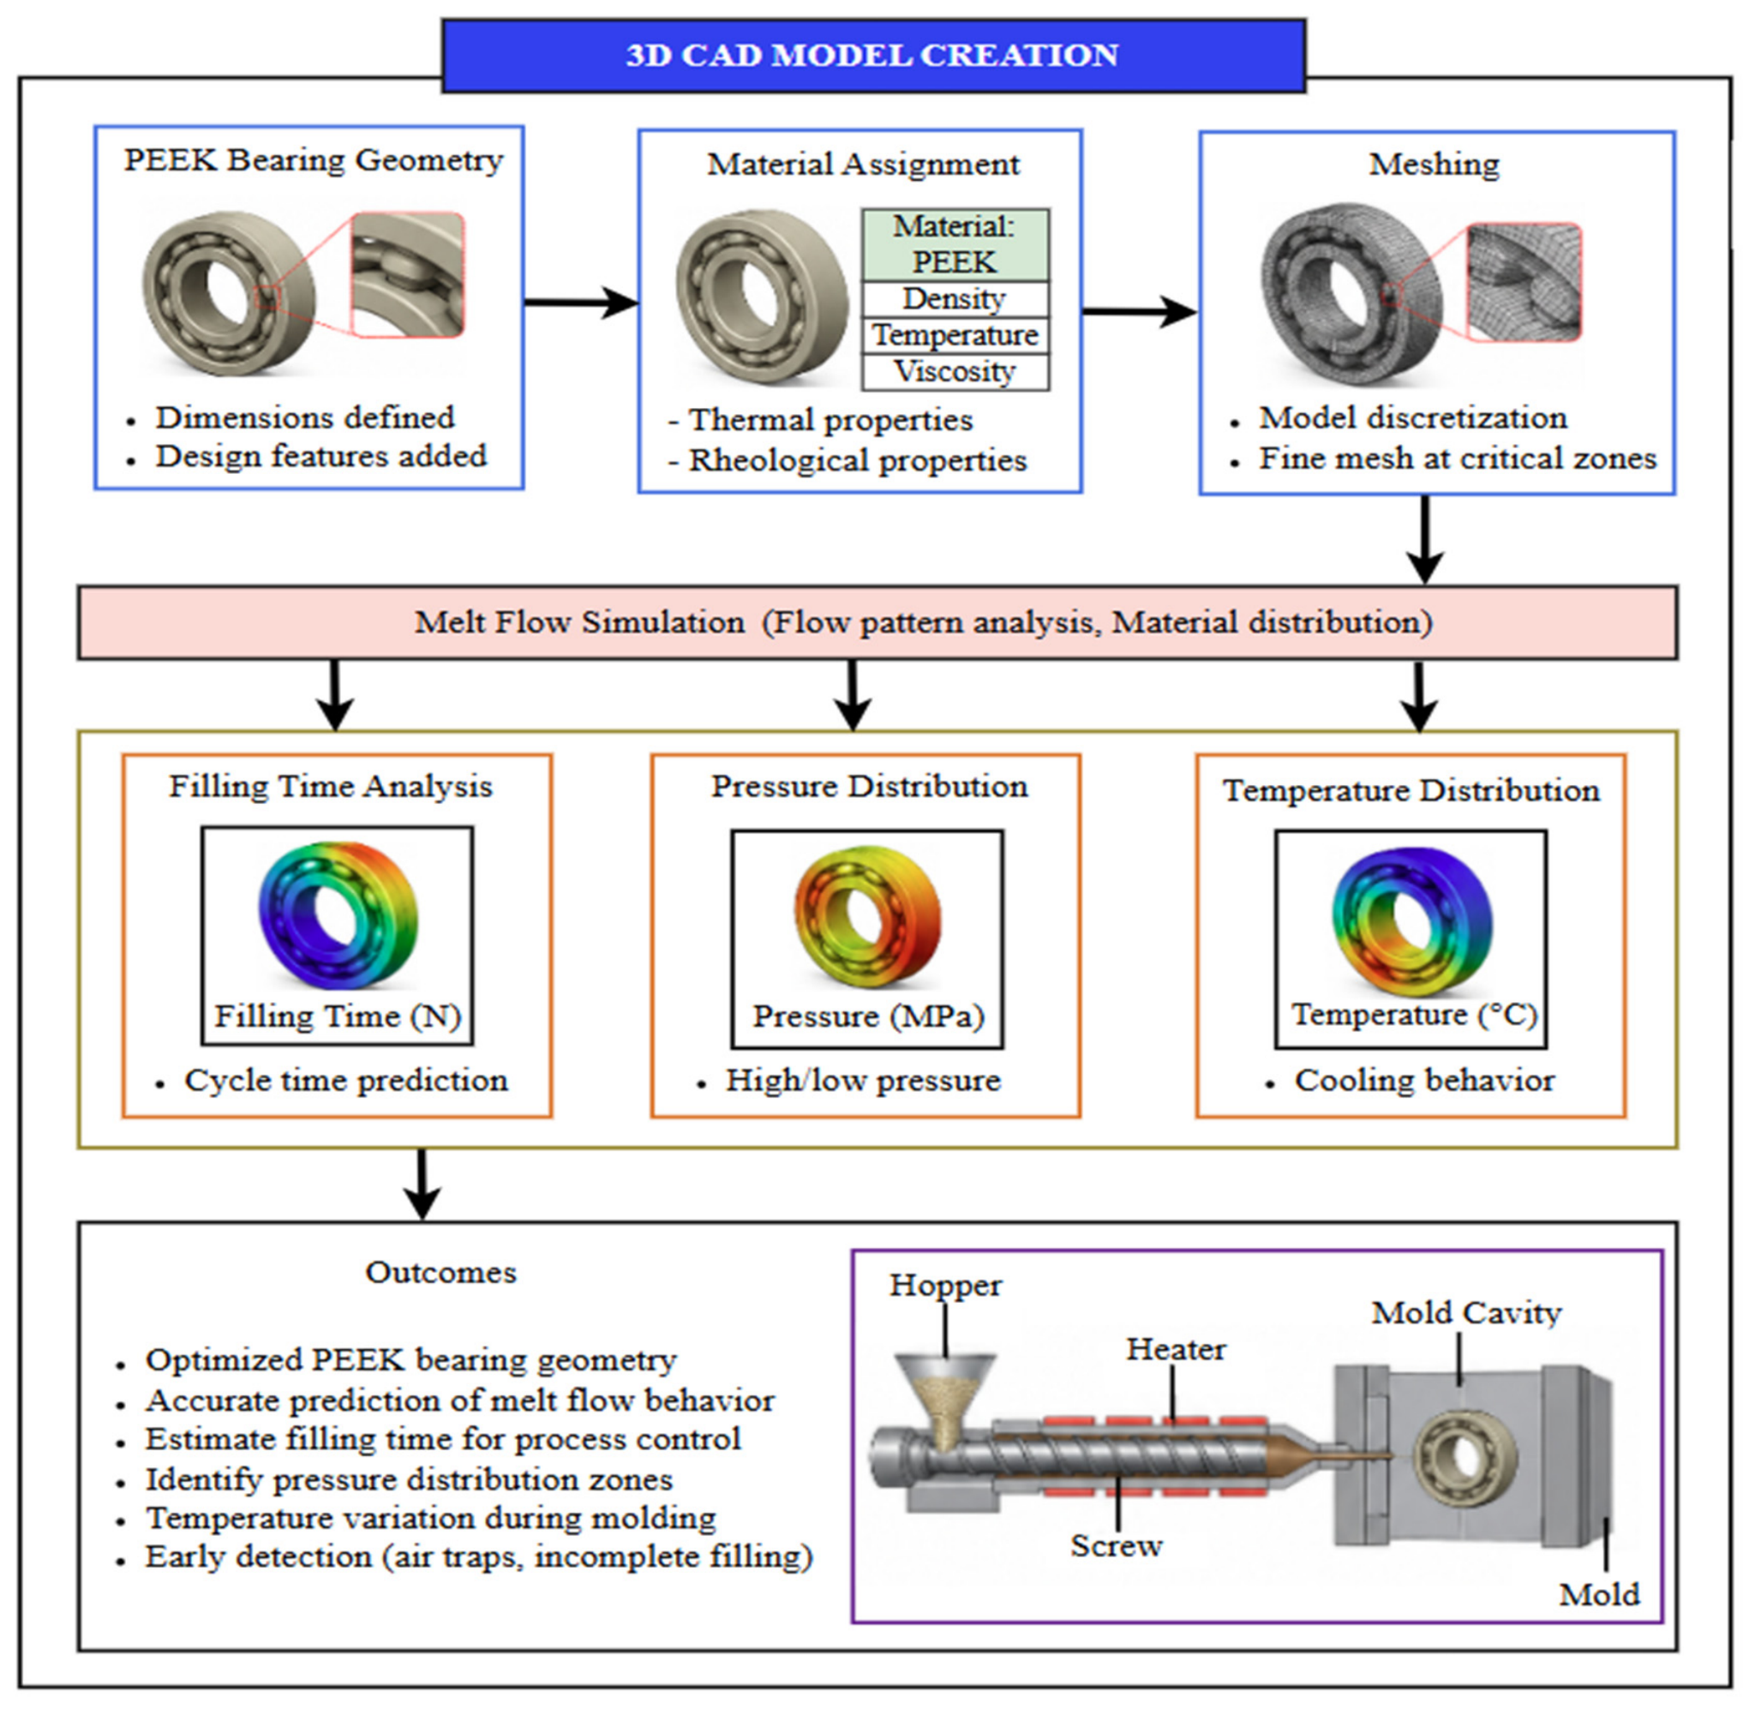
Figure 3 is retained as the CAD-to-injection molding workflow representation.
The first step in the PEEK bearing CAD modeling process is to develop a detailed three-dimensional geometric model of the aircraft bearing part using the proper CAD software, with all of the critical dimensions, shapes and design features correctly defined. Following this, the material properties of PEEK, such as its rheological and thermal properties, are assigned to the model to achieve realistic simulated behavior of the material and to accurately represent the flow of the molten polymer in the mold cavity. The developed model is then divided into finite elements using a meshing process, and a finer mesh is used in the areas that are important for the simulation to increase the accuracy of the simulation. This is followed by melt flow simulation to study the behavior of the molten PEEK flow through the mold to gain insight into the flow and distribution pattern of the material. From this simulation, the filling time needed to fill the entire cavity of the mold is calculated, an important step in optimizing production time. Furthermore, pressure distribution analysis is performed to understand the pressure distribution inside the mold, which can help in finding the high-pressure zone of the mold and possible defects. Lastly, the temperature distribution during the flow and cooling phases are studied to ensure uniform solidification and eliminate various thermal defects, increasing the quality and reliability of the final product.
4.8. FEA
FEA is a numerical simulation method for analyzing the structural and thermal properties of a component by breaking it up into smaller elements and solving the governing physical equations. In this study, FEA is specifically used to determine whether the predicted PEEK bearing response remains structurally and thermally acceptable under the defined loading conditions. The combined stress, deformation and temperature distributions identify the locations most susceptible to mechanical or thermal concentration within the bearing geometry. Based on the CAD geometry, a finite element model of the PEEK bearing component is built. The model is broken down into small elements, and suitable boundary conditions like loads, temperature and constraints are added to the model to mimic practical operating conditions.
The mechanical performance of the bearing is assessed using structural analysis when loads are applied. The stress distribution within the component is calculated using Equation (6):
Here,
indicates stress,
indicates applied force, and
indicates cross-sectional area. The equivalent stress is often represented using the Von Mises criterion; this is defined in Equation (7):
In this equation, is the von Mises stress, and are the principal stresses.
- 2.
Thermal Analysis
This is done to check the temperature distribution in the component under operation. Fourier’s law is used to characterize the behavior of heat transfer, which is represented in Equation (8):
where
is the heat flux vector,
is the thermal conductivity, and
is the temperature gradient.
- 3.
Thermo-Mechanical Analysis
This combines structural and thermal effects to analyze material behavior under multiple thermal and mechanical loadings. Thermal expansion is considered using Equation (9):
Here, denotes stress, denotes young’s modulus, denotes total strain, and denotes the thermal strain component. This is a comprehensive deformation, stress and failure analysis performed by combining the two analyses.
4.9. Computational Implementation and FEA Simulation Configuration
The proposed computational framework was implemented using MATLAB to perform data pre-processing, model development, parameter optimization, prediction, and finite element analysis.
Table S1 summarizes the MATLAB functions, numerical settings, input–output operations, FEA configuration, and validation procedures used to ensure reproducible computational analysis. A detailed breakdown of the MATLAB functions, numerical settings, and FEA simulation configuration is provided in
Table S1 of the Supplementary Materials.
5. Experimental Setup
This section establishes the organized sequence, equipment, parameters, and procedures used to run the simulations and conduct the experiments. This includes establishing testing conditions, choosing test equipment, establishing parameters, and conducting simulations or experiments to obtain reliable results. The moisture content decreased from 0.12 wt.% to 0.00099 wt.%, corresponding to a 99.175% reduction after the treatment in
Table 6.
The repeatability of the processing conditions and numerical responses was evaluated using the mean, standard deviation, standard error, coefficient of variation, and 95% confidence interval shown in
Table 7.
5.1. System Configuration
The hardware and software environment that is used to run simulations, modeling and analysis in the study is referred to as the system configuration. The detailed hardware and software specifications used for the realization of the computational and simulation tasks are presented in
Table S2. The MATLAB toolboxes and functions used for simulation, model fitting, statistical validation and visualization are summarized in
Table S3.
5.2. Performance Evaluation Metrics
These metrics evaluate the overall performance and quality of the material and process through the evaluation of the results of the rheological, thermal, mechanical, processing and simulation tests.
5.2.1. Rheological Metrics
Rheological metrics are used to characterize the flow characteristics of polymer melts by examining the relationship between the shear stress, shear rate, and viscosity during processing conditions.
- ➢
Viscosity (η) represents the resistance of a material to flow, that is, how easily the molten polymer flows during the injection molding process. represents the viscosity, is the pre-exponential function, is the activation energy for flow, and is the temperature effect.
- ➢
The shear-thinning index (n) represents the change in the viscosity of a material with shear rate and aids in the classification of the flow behavior of a polymer melt. It is expressed by Equation (10):
Here, indicates the flow behavior index, indicates shear stress, indicates the shear rate, and indicates the log scale.
5.2.2. Thermal Metrics
These metrics are used to analyze the temperature-dependent behavior of polymers during transition, melting and degradation processes in relation to the thermal loading.
- ➢
The glass transition temperature (Tg) is the temperature at which a polymer transitions from a rigid glassy state to a flexible rubbery state, as measured by the change in heat capacity from DSC. This is denoted in Equation (11):
where
denotes glass transition temperature,
denotes the heat capacity of the material, and
denotes heat flow supplied to the material.
- ➢
The melting temperature (Tm) is the temperature at which the crystalline part of the polymer is melted (as detected by the maximum heat flow during DSC). This is defined in Equation (12):
Here,
indicates melting temperature,
indicates heat flow,
indicates time, and
indicates the rate of heat flow.
- ➢
The thermal degradation temperature (Td) is the temperature at which the polymer begins to decompose, determined from the TGA peak of the maximum mass loss coefficient. It is represented by Equation (13):
where
is the thermal degradation temperature,
is the mass of the material, and
is the rate of mass loss.
5.2.3. Mechanical Metrics
These metrics are used to evaluate the strength and stiffness of materials by analyzing their response to applied forces and deformation.
- ➢
Tensile strength: A material’s strength is the maximum stress that it can endure (without failing) when it is being stressed. This is expressed in Equation (14):
Here,
indicates ultimate tensile strength,
indicates maximum applied force before fracture, and
indicates the original cross-sectional area.
- ➢
Elastic modulus: The elastic modulus is a measure of the stiffness of a material, which is resistance to elastic deformation when subjected to stress. This is expressed in Equation (15):
In this equation,
is the elastic modulus, and
is the slope of stress–strain curve.
5.2.4. Processing Metrics
These are used to analyze the parameters which control mold filling, pressure and manufacturing efficiency during polymer manufacturing to evaluate flow behavior and manufacturing performance.
- ➢
The melt flow index (MFI) refers to the ease with which the molten polymer flows under normal conditions. This is represented in Equation (16):
where
is the mass of extruded polymer,
is time, and
is a conversion factor (10 min = 600 s).
- ➢
The filling time is the time taken to fill the mold cavity with molten polymer. This is defined in Equation (17):
In this equation,
denotes filling time,
denotes flow length, and
denotes flow velocity.
- ➢
The injection pressure calculates the molding force for producing the molded polymer. This is expressed in Equation (18):
Here,
indicates injection pressure,
indicates volumetric flow rate,
indicates channel thickness, and
indicates channel width.
5.2.5. FEA Metrics
FEA metrics are used to analyze a component’s response to simulated loading and operating conditions to assess its structural, thermal and deformation behavior.
- ➢
The Von Mises stress is the equivalent stress that can be used to predict yielding of a material under complex loading. This is expressed in Equation (19):
where
denotes the Von Mises stress, and
denotes the second invariant of the deviatoric stress tensor.
- ➢
Total deformation describes how much the component is displaced when a load is applied. This is represented in Equation (20):
Here,
represents deformation,
represents the applied force,
represents the original length,
represents the cross-sectional area, and
represents Young’s modulus.
- ➢
Temperature distribution describes the change in temperature in the component with time. This is defined in Equation (21):
where
denotes rate of change in temperature with respect to time,
denotes thermal diffusivity, and
denotes the laplacian of temperature.
5.3. Results
The results show that PEEK has a high degree of thermal stability, mechanical strength and shear-thinning properties which are appropriate for high-performance applications. The Carreau–Yasuda fit with R2 = 0.97 provides a quantitative material-level basis for the subsequent flow analysis, while the simulated filling, pressure and FEA responses extend this evidence to the bearing component. The validation of flow behavior under processing conditions by the rheological analysis and model fitting is accurate. Efficient mold filling, uniform pressure distribution and optimized design performance are demonstrated with injection molding and CAD simulations. Finally, FEA and statistical validation ensure reliability, minimal deformation and high accuracy, even for practical engineering applications.
5.3.1. Material Preparation Results
Pre-processing in this section includes heating the PEEK material to remove absorbed moisture prior to further processing. It guarantees process stability and ensures that the material is free of defects like voids, bubbles and degradation during high-temperature processing.
The drying process parameters of PEEK are displayed in
Table S4, which displays the controlled thermal conditions to which PEEK needs to be subjected to remove moisture before processing. The findings have confirmed that the drying treatment process can successfully decrease the moisture content from 0.120% to 0.00099%; the moisture-free polymer is helpful for high-quality manufacturing application.
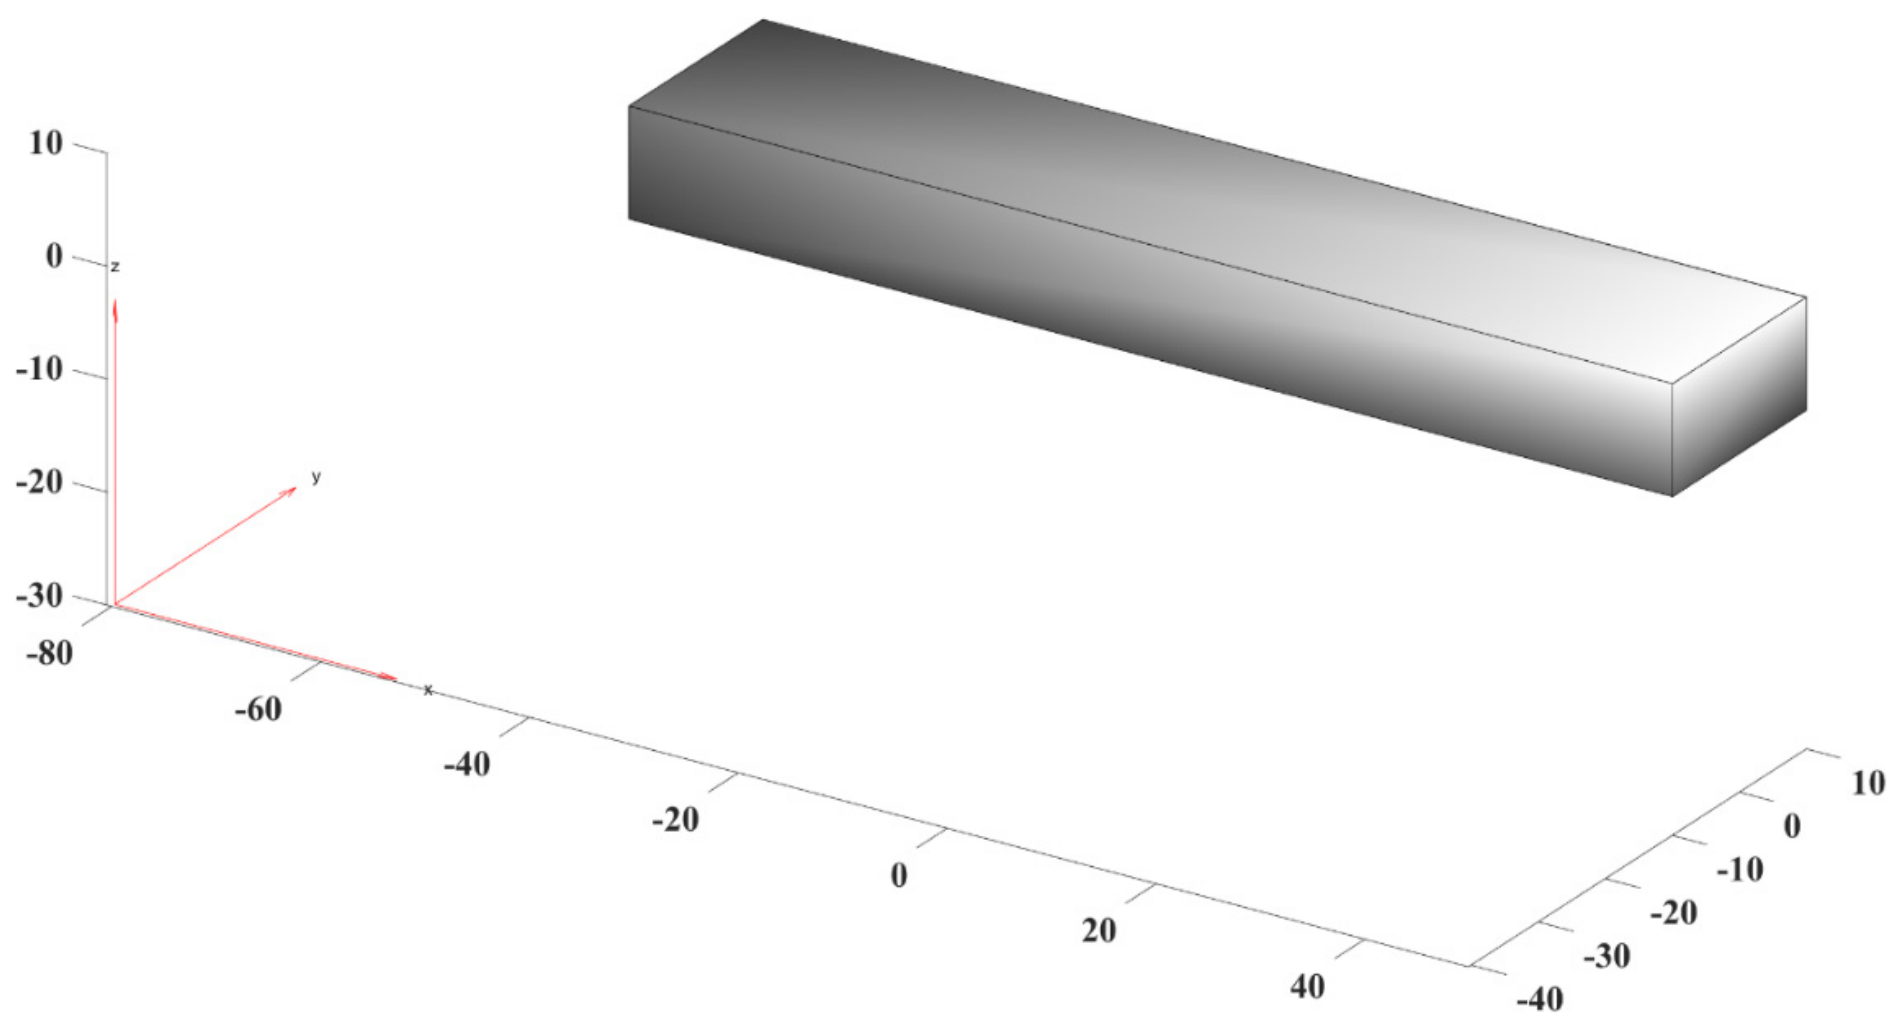
The moisture-free PEEK material that is poured after drying occurs is modeled as a 3D solid geometry, as seen in
Figure 4. The uniform structure ensures defect-free material for further processing due to successful moisture removal. This is a validation of the efficiency of material drying in enhancing the quality and stability of the materials.
5.3.2. Material Characterization Results
This section systematically evaluates the thermal, mechanical and physical properties of the selected polymer in order to understand its behavior under processing and service conditions. It offers fundamental input parameters like transition temperatures, strength parameters and properties of the structure needed for simulating and analyzing its performance correctly.
As can be seen in
Table 8, PEEK has a high thermal stability, making it an ideal material for use at high temperatures. The results demonstrate the ability of PEEK to retain structural integrity, which is enabled by its high melting and degradation temperatures.
Table 9 shows a progressive reduction in viscosity with increasing temperature and shear rate, confirming the temperature-dependent shear-thinning behavior of the material.
The rheological characterization of PEEK was performed using rotational and capillary rheometers to obtain viscosity data over the required temperature and shear rate ranges in
Table S5.
The DSC and TGA measurements were conducted under controlled thermal conditions, with the test parameters and principal thermal characteristics summarized in
Table S6. The specified sample masses, temperature ranges, heating rates, nitrogen atmosphere and gas-flow conditions define the experimental conditions used for evaluating the thermal behavior of PEEK.
The material properties and geometric dimensions of the PEEK specimen for analysis are exhibited in detail in
Table 10. The values reflect high mechanical properties and heat stability, suitable for structural and high-performance engineering applications.
The DSC curve of PEEK (
Figure 5a) depicts glass transitions and melting characteristics, and the melting temperature (Tm) is clearly visible as the endothermic peak. This confirms its thermal transition properties, showing that the material has a semi-crystalline nature. The thermal stability of PEEK is demonstrated in
Figure 5b by the lack of weight loss at high temperatures, followed by an accelerated loss of weight. This means that the material has a high thermal resistance and is suitable for use in high-temperature applications.
Figure 5c shows the DSC curve of PEEK, highlighting its glass transition at 143 °C, cold crystallization at 185 °C, and sharp melting peak at 343 °C.
5.3.3. Rheological Testing Results
This section explains the deformation and flow behavior of PEEK, which are related to its viscoelastic properties (storage modulus, loss modulus, viscosity and shear response). This analysis enables us to understand the material’s flow behavior and processability in conditions such as injection molding.
The rheological properties of PEEK are given in
Table 11, with the storage modulus indicating the elastic properties of the material and the loss modulus indicating the viscous properties. The frequency-dependent storage modulus (G′) and loss modulus (G″) are additionally presented over the investigated frequency range to show the evolution of the elastic and viscous contributions with oscillation frequency. The frequency response is discussed together with the reported average values to provide a more complete representation of the viscoelastic behavior of PEEK. The results show a balanced viscoelastic behavior, which is indicative of good energy storage and dissipation properties under deformation.
As seen in
Figure 6a, the viscosity curve has a downward trend for PEEK at different temperatures, which means that PEEK is shear-thinning at these temperatures. This means that the polymer melt has enhanced flowability during processing at high shear rates. The non-Newtonian flow behavior of PEEK is demonstrated in
Figure 6b of the shear stress vs. shear rate curve, with a linear increase. This means that a higher shear rate would result in more stress for the processing, as this is significant for control.
5.3.4. Rheological Model Fitting Results
This section compares the shear rate–viscosity relationship for the experimental data with the predictions of various constitutive models. This is useful for the identification of the model that best describes the non-linear flow behavior of the polymer melt under various processing conditions.
The experimental values and several models, such as the Power Law, Cross, and Carreau–Yasuda models, were compared over a wide shear rate range, as shown in
Figure 7. The Carreau–Yasuda model is able to give a close prediction for the polymer flow behavior when compared to the experimental data and shows a higher accuracy in predicting the non-linear viscosity variation. The experimental identification of the constitutive representation most consistent with the measured PEEK response before its use in process-level interpretation represents an important contribution. The obtained R
2 of 0.97 indicates that the Carreau–Yasuda formulation provides a substantially suitable representation of the measured non-linear viscosity behavior within the investigated conditions. The superior agreement of the Carreau–Yasuda formulation indicates that the measured PEEK response cannot be represented equally well by simpler constitutive descriptions across the investigated shear rate range. This finding is important because the constitutive choice directly determines the viscosity response supplied to the subsequent processing simulation and therefore affects predicted flow and pressure development.
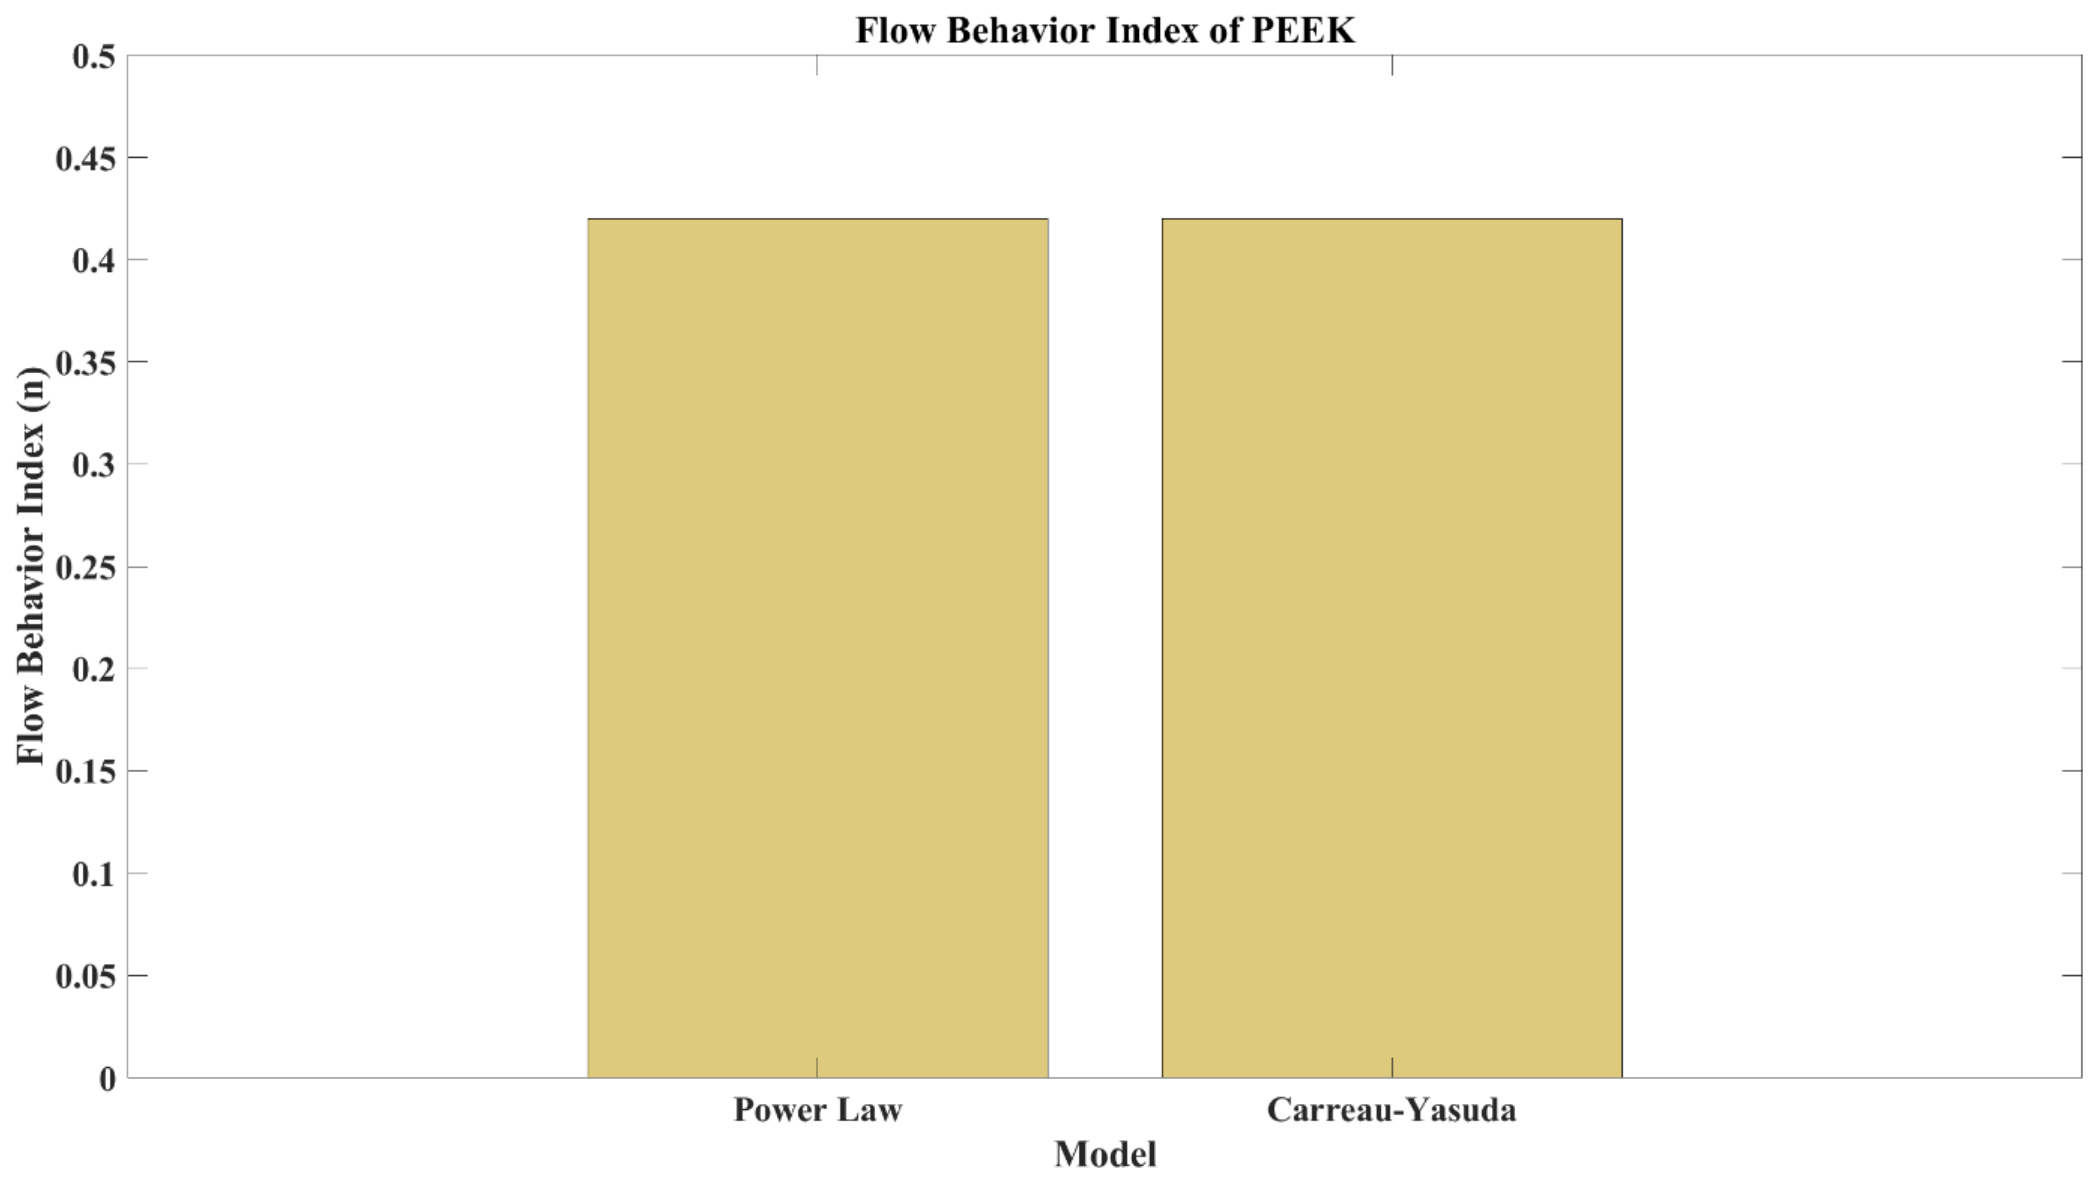
Figure 8 shows the flow behavior index values for different models, which are less than 1, confirming the shear-thinning nature of PEEK. The consistency between the models indicates stable rheological behavior and the reliable prediction of processing performance.
Table 12 defines the melt temperature, mold temperature, injection pressure, filling time, and thermal boundary conditions used in the processing simulation, while the Carreau–Yasuda model was used to describe the material viscosity.
Table 13 presents the rheological parameters, processing conditions, material properties, and mechanical and thermal boundary conditions which were integrated to establish the numerical simulation model.
The experimentally obtained rheological, thermal, and mechanical parameters were incorporated into the numerical model to define the constitutive behavior, processing conditions, and thermo-mechanical properties shown in
Table 14.
5.3.5. Injection Molding Simulation Results
Melt flow, filling and pressure distribution were modeled in the cavity to determine the suitability of the material for efficient and defect-free processing.
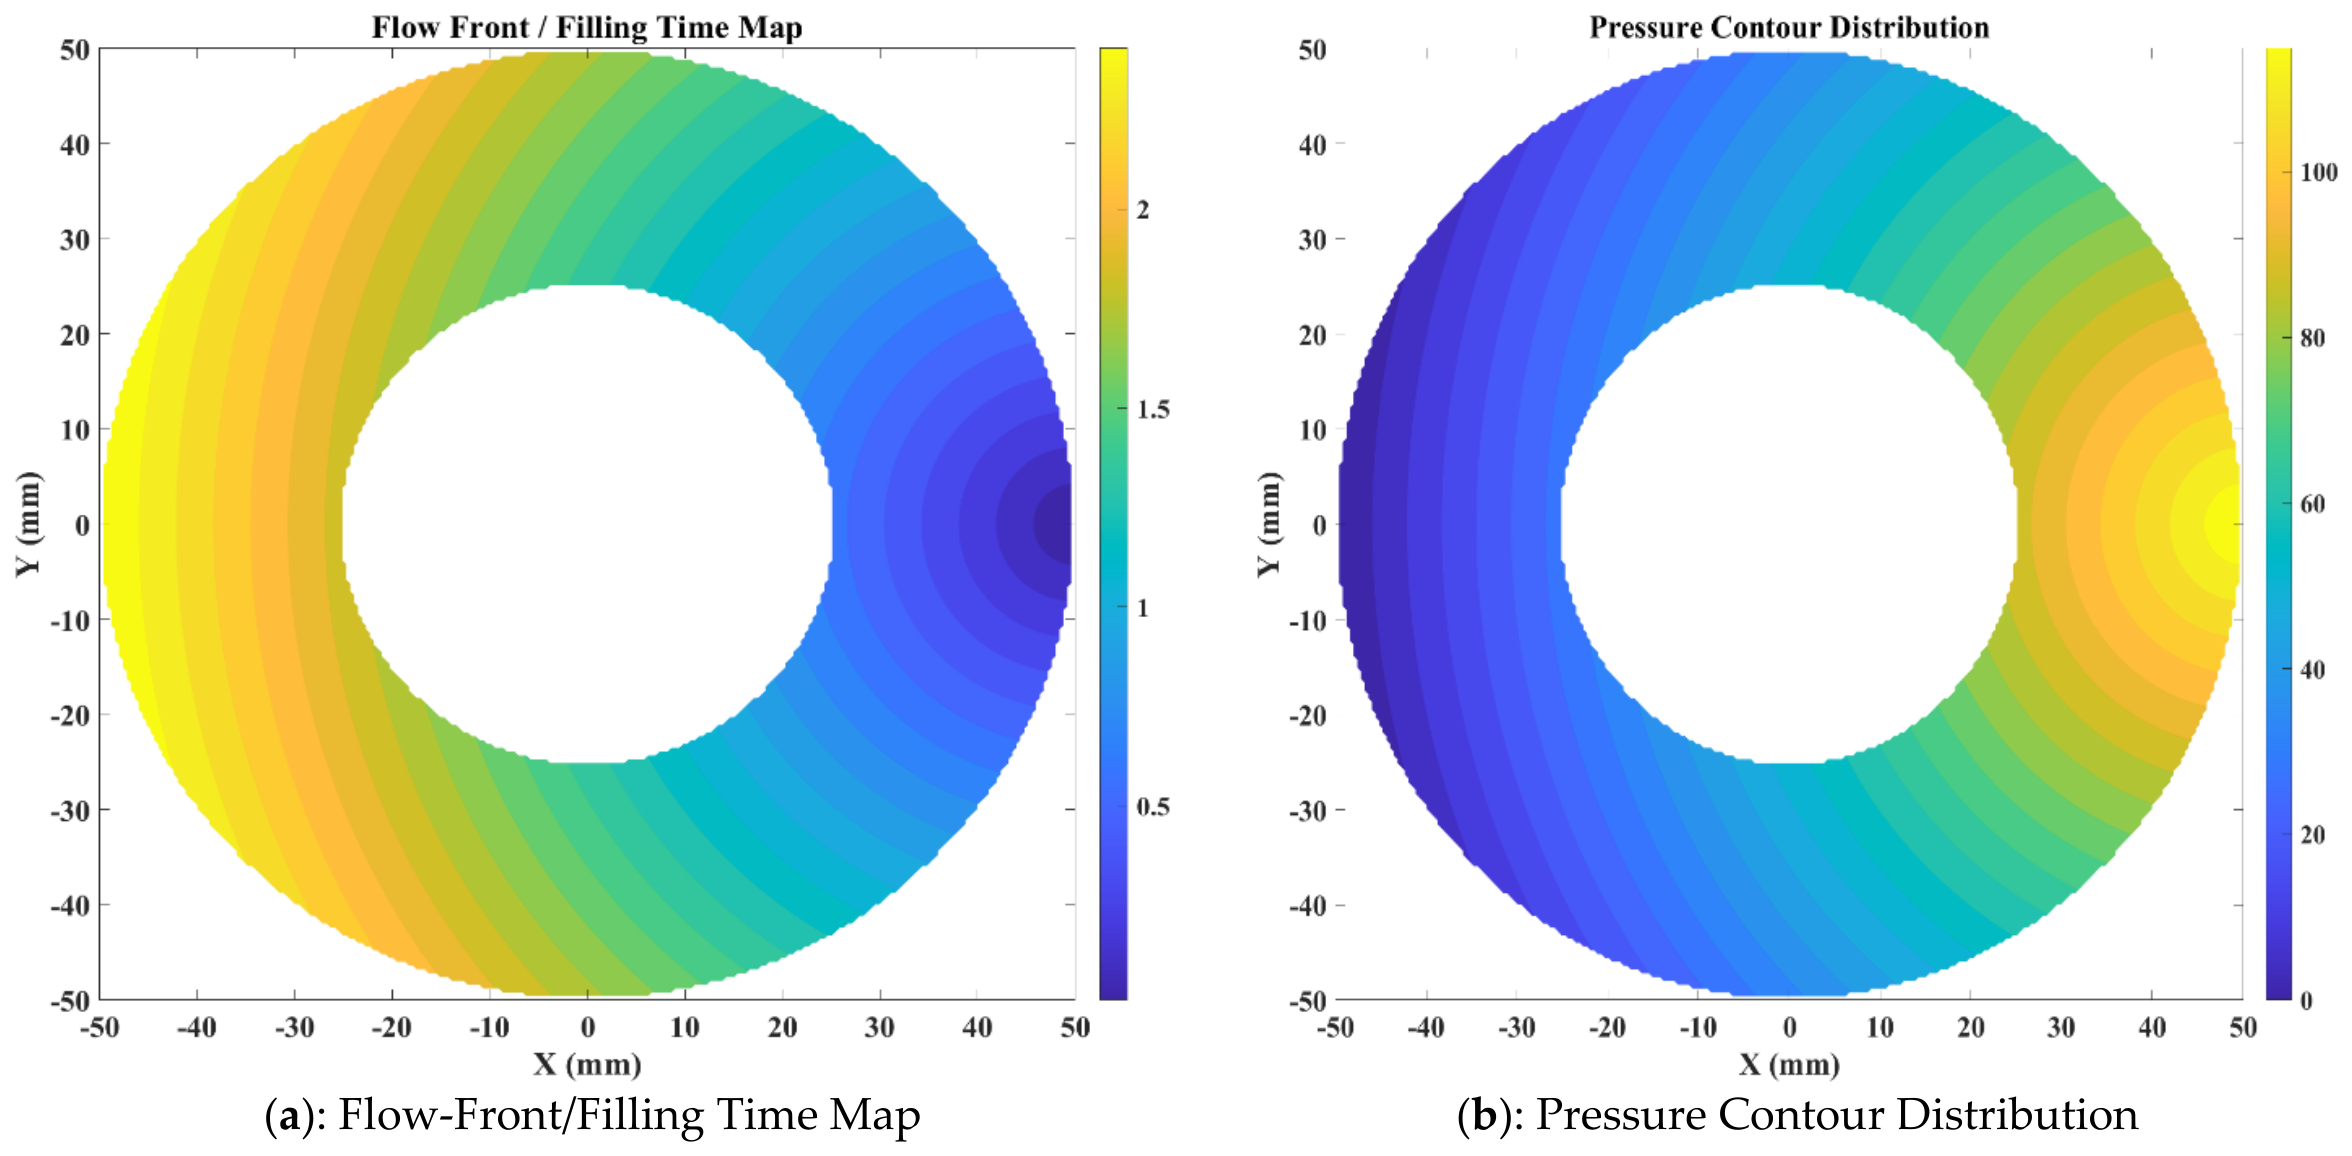
In the mold cavity, the flow-front and filling time distribution are displayed in
Figure 9a, which represents the filling process of the molten PEEK. The uniform gradient shows efficient and complete filling behavior. The pressure contour distribution throughout the mold is shown in
Figure 9b, which reveals the areas of high and low injection pressure. This is useful for determining critical zones and optimizing processing conditions to prevent defects. The relatively uniform flow-front progression indicates that the selected processing conditions provide consistent cavity filling without pronounced flow imbalance in the analyzed bearing geometry. The pressure distribution further identifies regions where localized pressure accumulation may influence defect formation, and therefore provides a direct process-level consequence of the selected material-flow description.
Table S7 shows that the simulation employed a single edge gate with a 4 mm gate width, 1.5 mm gate thickness and 2.5 mm gate length, together with an injection pressure of 80 MPa and melt and mold temperatures of 380 °C and 180 °C, respectively. Under these conditions, the predicted filling ratio was 0.96 with a fill imbalance of 0.04, while the maximum predicted warpage and stress were 0.05 mm and 6.85 MPa, respectively.
5.3.6. CAD Modeling Results
This section describes a geometric representation and the meshed structure of the PEEK bearing to provide accurate material flow, stress distribution and thermal simulation.
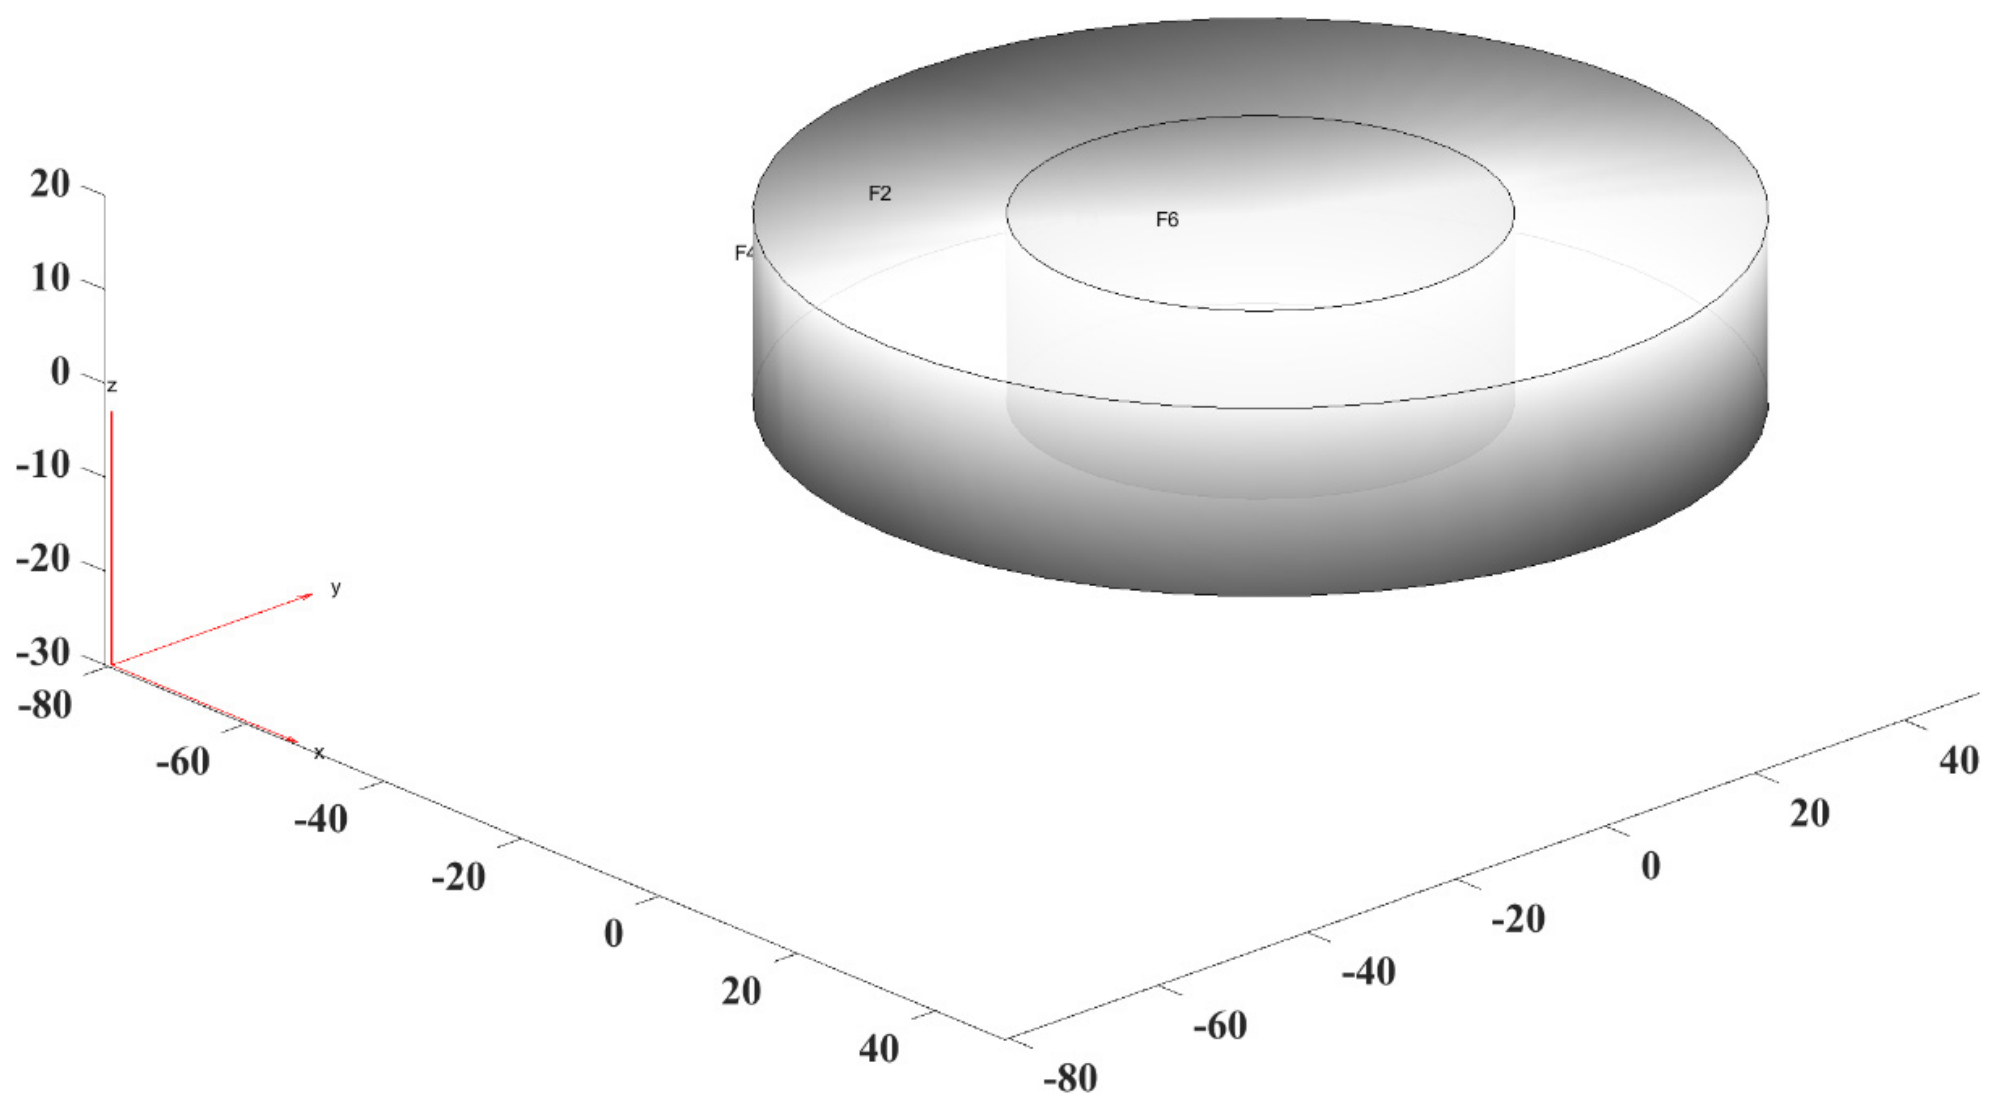
Figure 10 displays the 3D CAD model of an aerospace bearing made of PEEK, which has a cylindrical shape with two surfaces labeled F2 and F6 for orientation and analysis purposes. The CAD representation is included to identify the component geometry, analysis surfaces and coordinate reference used consistently in the subsequent injection molding and FEA analyses. The F2 and F6 surfaces provide geometric references for interpreting the predicted flow and structural responses rather than serving only as visual illustrations. The coordinate axes are used to give the spatial reference for the simulation, which is important for representing the flow and the stress distribution. This model is used as the basis of injection molding and FEA for assessing structural and thermal performance.
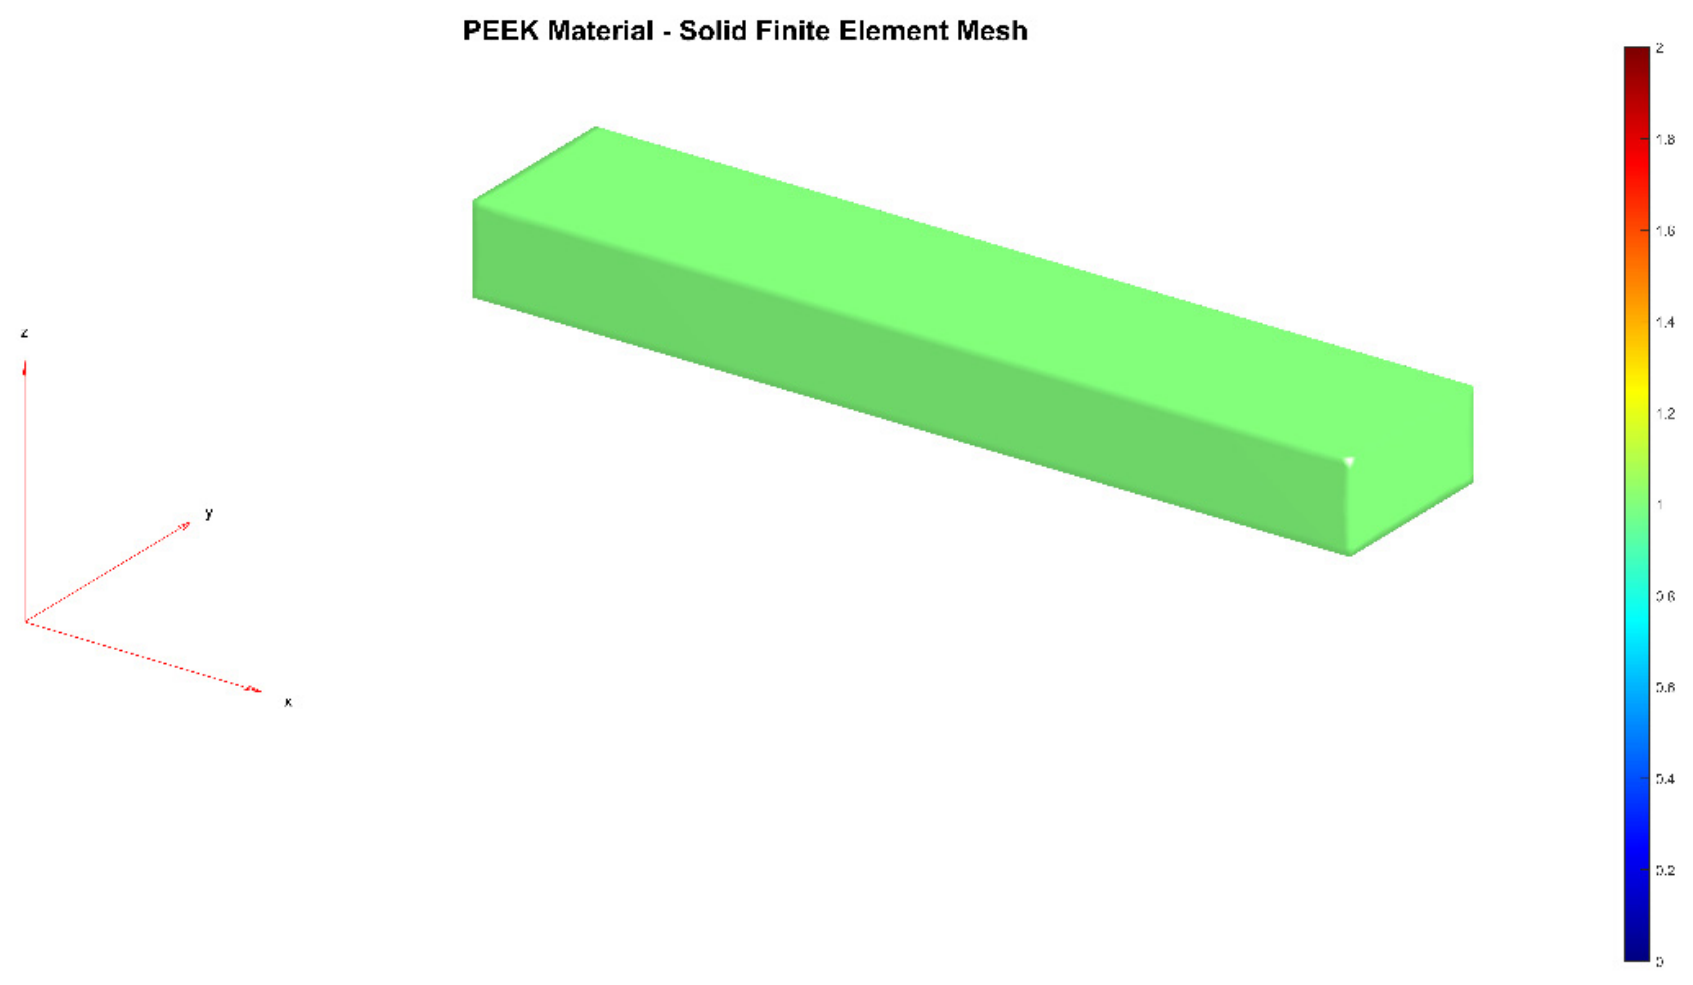
The finite element mesh structure of the PEEK material is shown in
Figure 11; the block is divided into elements to make it possible to simulate the stress and thermal behavior. The mesh representation is provided specifically to demonstrate the discretization used for calculating the stress, deformation and thermal fields reported in the FEA results. Its technical purpose is therefore to establish a numerical representation of the bearing geometry rather than to provide an additional visual description of the component. The color scale shows the variation in a physical property (such as stress or strain) from cell to cell in the mesh. This visualization is used as a basis for the correct FEA of PEEK parts in practical operating conditions. The 1.0 mm mesh was selected as the converged configuration because the stress and deformation changes decreased to 0.159% and 0.232%, respectively, in
Table S8.
As shown in
Table S9, the selected optimized conditions consisted of a melt temperature of 380 °C, mold temperature of 180 °C, injection pressure of 80 MPa, injection speed of 50 mm·s
−1, holding pressure of 55 MPa and cooling time of 25 s. Under these conditions, the predicted dimensional deviation, warpage, maximum stress and deformation were 0.025 mm, 0.05 mm, 6.85 MPa and 0.019 mm, respectively.
5.3.7. FEA Results
This section evaluates the structural, thermal and thermo-mechanical response of the PEEK bearing to determine stress distribution, deformation and the temperature change in its operation.
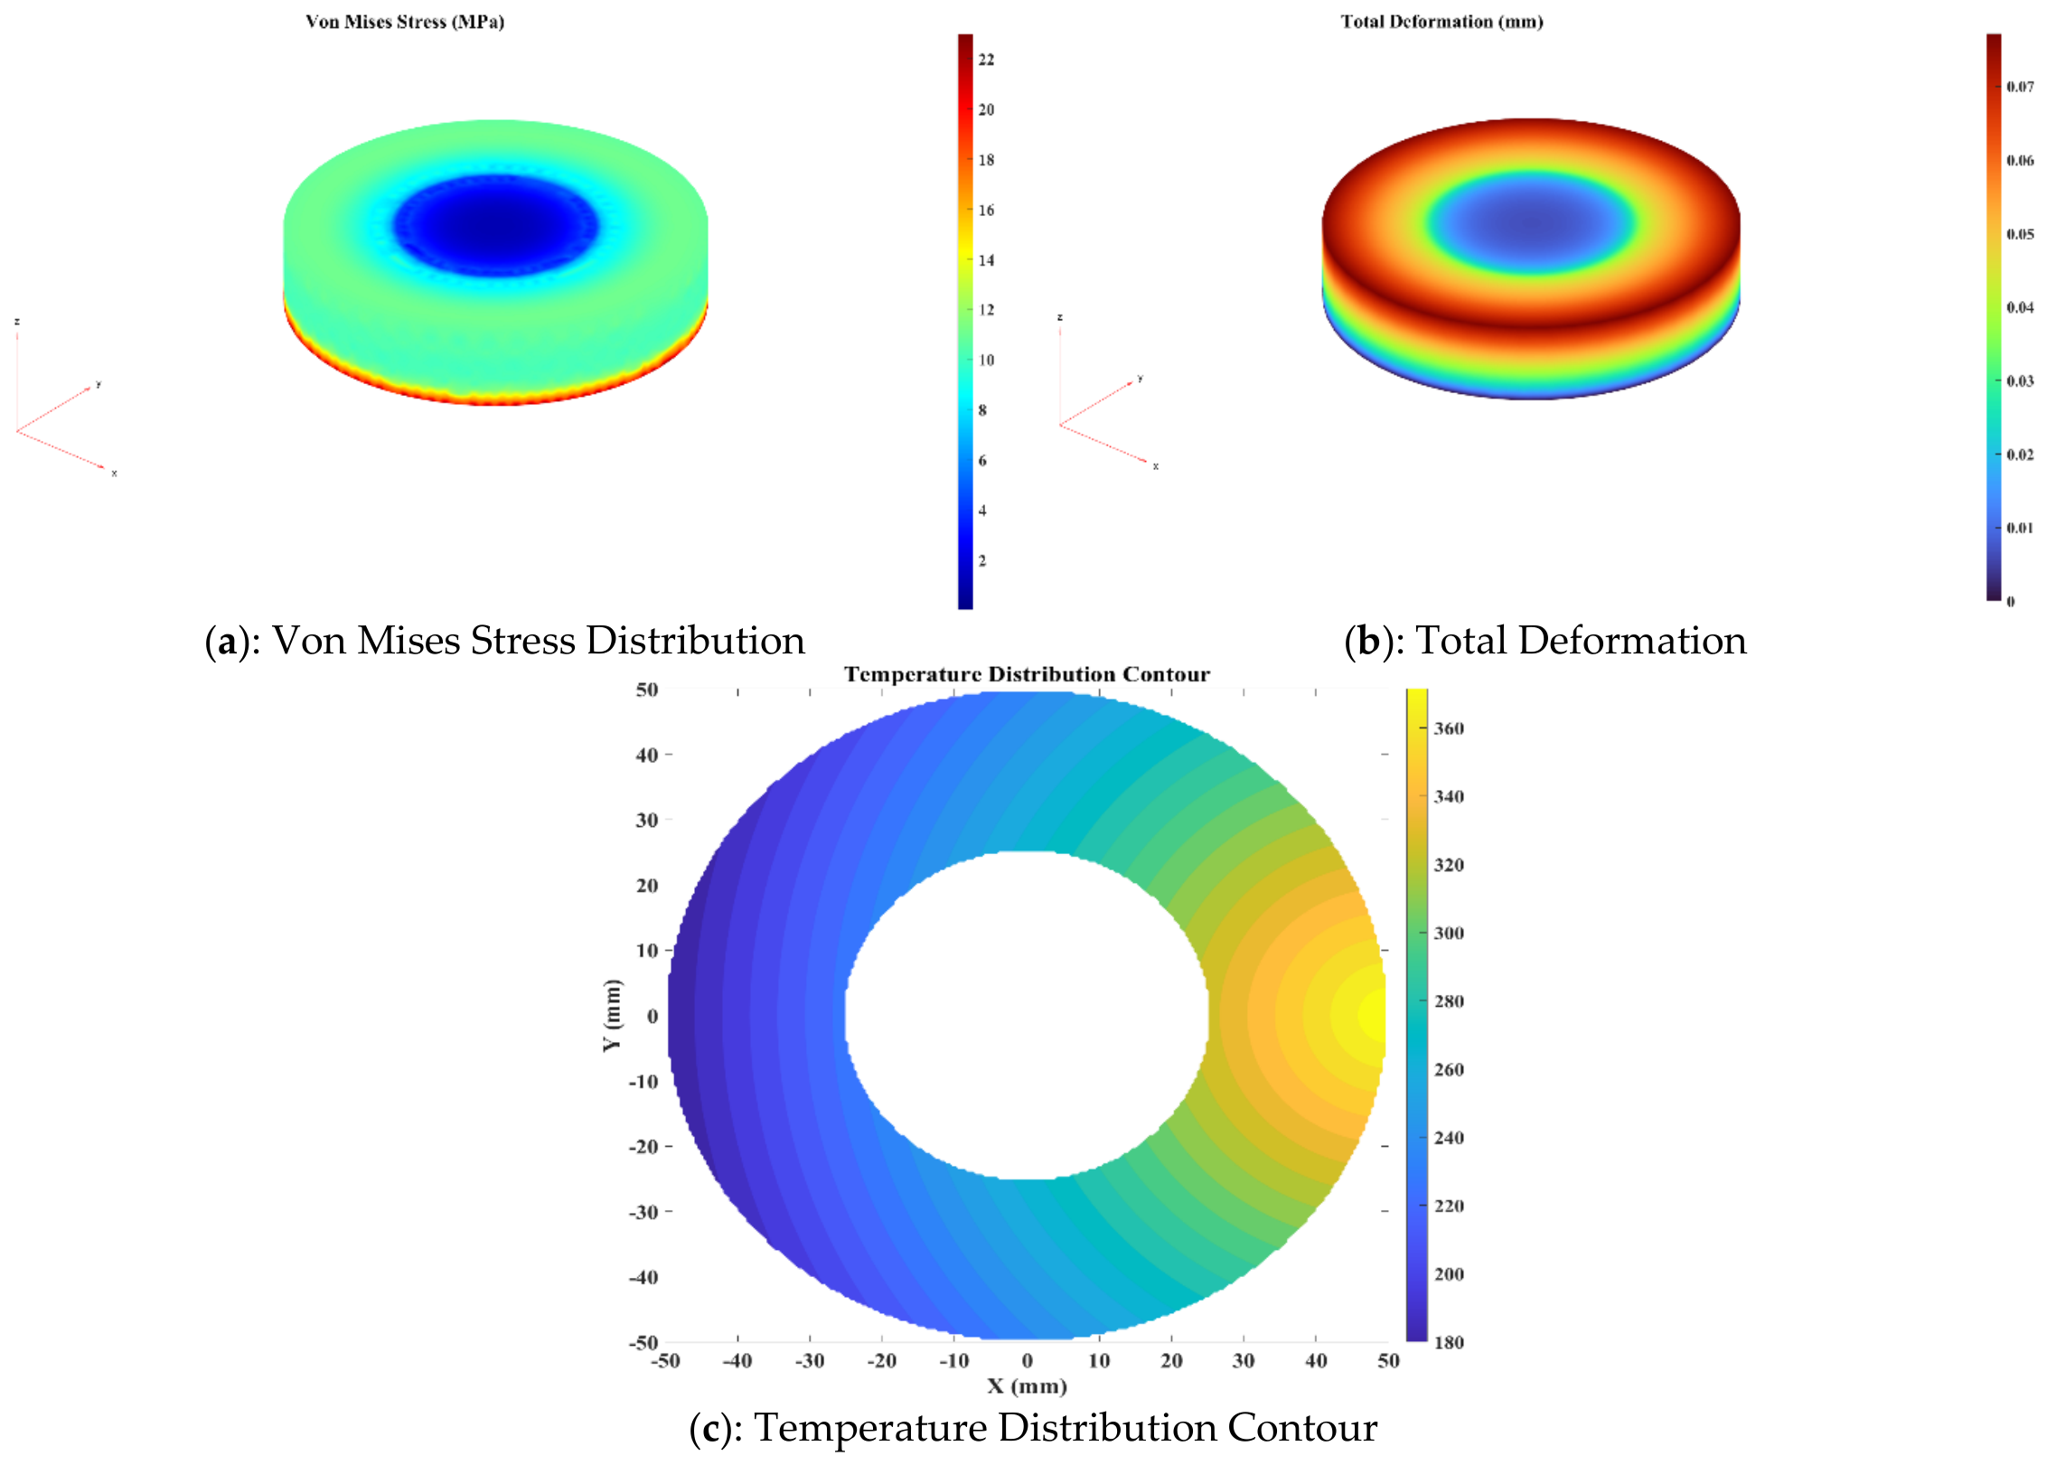
Figure 12a presents the Von Mises stress distribution throughout the component, with red indicating the areas of maximum stress concentration and blue indicating the areas of minimum stress. Unlike the geometric illustrations,
Figure 12 provides direct simulation outputs that quantify the structural and thermal response of the PEEK bearing under the defined analysis conditions. The corresponding stress and deformation statistics provide numerical evidence beyond the color contours, including a mean stress of 7.5999 MPa and mean deformation of 0.025451 mm. The total deformation contour is shown in
Figure 12b, with red areas corresponding to high deformation and blue areas to low deformation. The temperature distribution contour in
Figure 12c depicts the variation in temperature within the structure, ranging from cooler blue areas to warmer yellow areas.
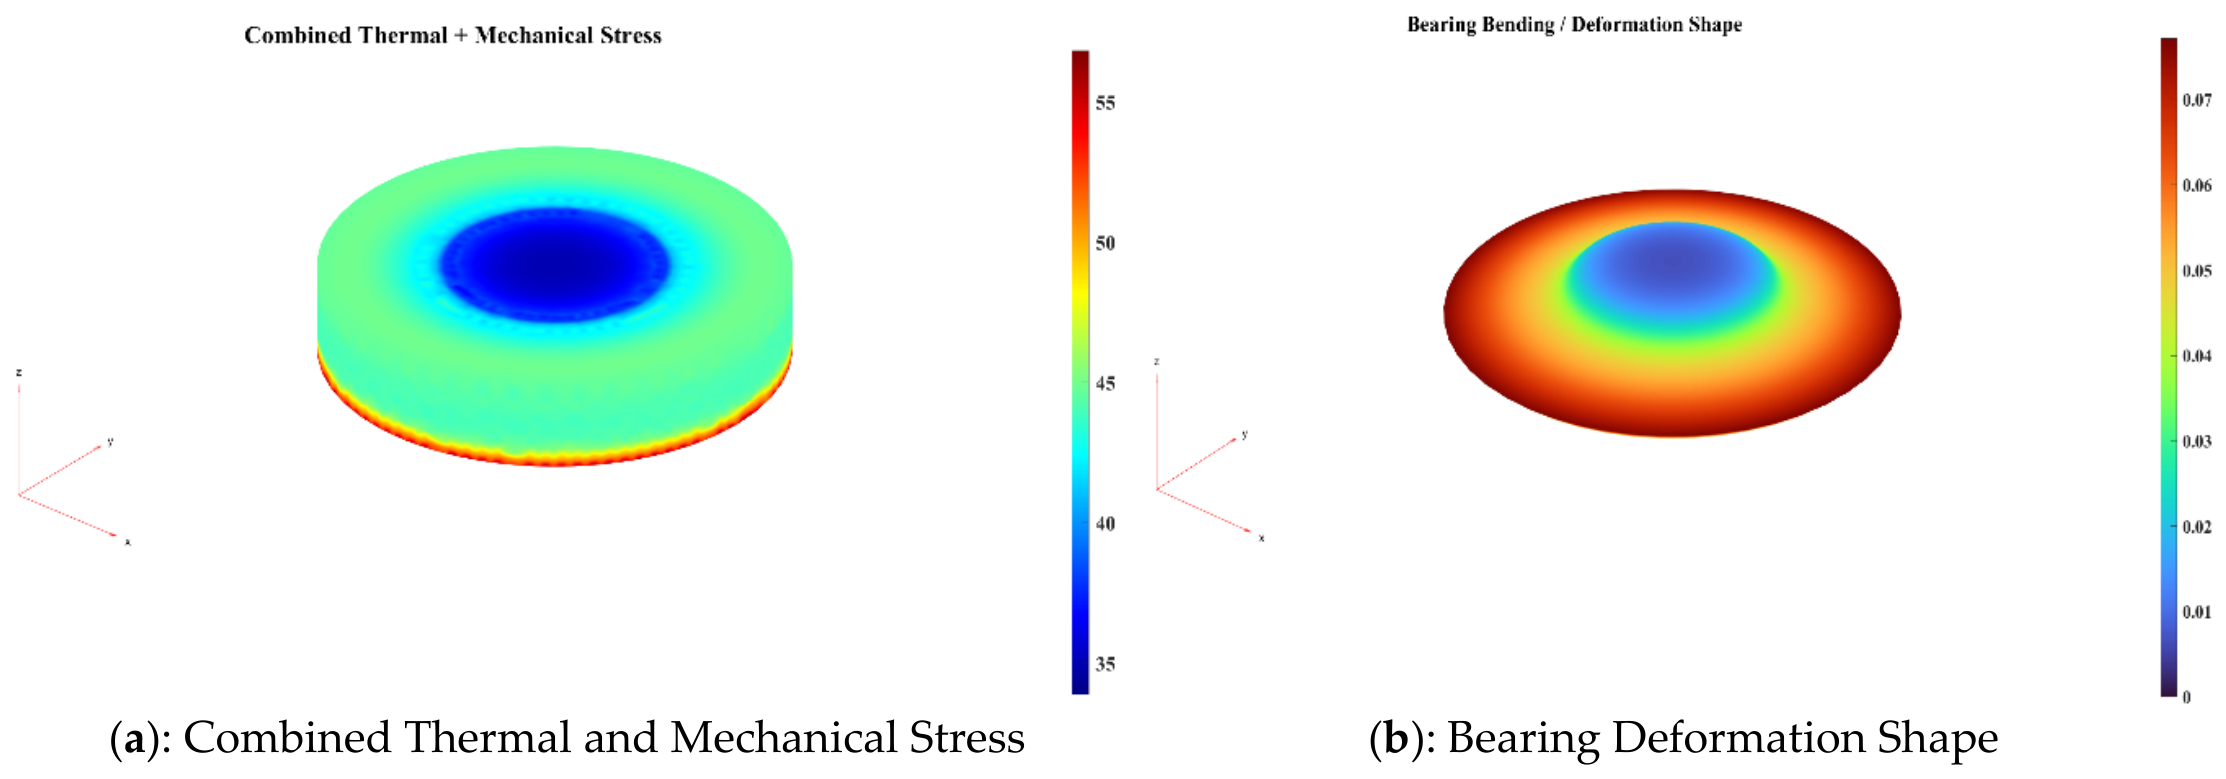
The combined thermal and mechanical stresses are displayed in
Figure 13a, with red areas representing high stresses and blue areas representing low stresses of the bearing.
Figure 13b illustrates the shape of the deformation of the bearings when under load, with red areas indicating maximum bending and blue areas indicating minimal deformation.
Table 15 summarizes the principal inputs and outputs used in the structural and thermo-mechanical assessment of the PEEK radial bearing, including the 5000 N applied radial load, fixed-support condition and operating temperature of 180 °C. Under these conditions, the calculated mean von Mises stress was 7.5999 MPa and the total deformation was 0.025451 mm, corresponding to an 8% stress utilization and an 87.4001 MPa stress margin relative to the reported tensile strength. The FEA model was defined using the loading, displacement constraints, contact conditions, material properties and thermal conditions summarized in
Table 6. A uniform radial load of 5000 N was applied to the bearing inner surface, while the outer surface was fixed and the specified radial, axial and rotational constraints were imposed.
The final finite element model was generated using a quadratic tetrahedral mesh, and the principal mesh characteristics and quality indicators are summarized in
Table S10.
The 1.0 mm mesh was selected in
Table S11 as the converged configuration because the stress and deformation changes decreased to 0.159% and 0.232%, respectively.
The material properties and thermo-mechanical parameters defined in
Table 16 were subsequently used for mesh generation, loading application, and numerical FEA simulation.
The specified PEEK grade, drying conditions, initial and final moisture contents, and DSC/TGA measurement conditions were used consistently throughout the subsequent material characterization, and are shown in
Table S12.
In
Table 17, the numerical simulation results are compared with the corresponding experimental measurements to quantitatively assess the predictive accuracy of the proposed model.
5.3.8. Statistical Validation
The statistical validation assesses the accuracy and reliability of the predicted results by comparing the predicted results with the expected results based on error metrics and correlation measures.
Table 18 shows the statistical analysis of stress and deformation; the mean value represents the overall performance, and the deviation from the mean value represents the variation in the results. Therefore, this is retained as a key quantitative result because it reports prediction error and correlation measures rather than repeating descriptive information presented elsewhere. The stress and deformation RMSE, MAE and R
2 values provide a compact numerical assessment of prediction consistency. The low RMSE and MAE values confirm the high prediction accuracy of the model. Strong correlation and excellent model reliability are shown, with high R
2 values (0.97). The statistical assessment provides quantitative evidence of agreement between the evaluated predicted and reference responses, with RMSE, MAE and R
2 jointly indicating low prediction error and strong correspondence. Nevertheless, these metrics should be interpreted as computational validation rather than a substitute for direct experimental validation of the simulated bearing responses under physical injection molding conditions.
Table 19 shows that the investigated PEEK material maintained favorable thermal and mechanical characteristics, with a glass transition temperature of 143 °C, melting temperature of 343 °C, thermal degradation temperature of 575 °C, Young’s modulus of 3.6 GPa, and tensile strength of 95 MPa.
An independent FEA validation dataset was used to evaluate the predictive performance of the numerical model for von Mises stress and total deformation, and this dataset is shown in
Table S13.
The validation results demonstrated good agreement between the experimental measurements and numerical predictions, with R
2 values ranging from 0.952 to 0.962, as shown in
Table S14.
Table S15 indicates that the proposed integrated framework achieved the lowest reported RMSE and MAE values of 0.482 and 0.351, respectively, while providing an R
2 value of 0.958 across the evaluated comparison. In contrast, the rheology-only and FEA-only approaches provided narrower analytical coverage, whereas the integrated approaches incorporated multiple stages of material and process analysis.
The numerical predictions shown in
Table S16 showed a strong agreement with the reference values, with the maximum relative error limited to 2.19%, confirming the validity of the computational model.
5.4. Discussion
The results have shown that the proposed framework was able to capture the rheological behavior, thermal stability, and mechanical performance of PEEK, which are suitable for application in high-performance engineering fields. The key scientific findings are therefore concentrated in the experimentally measured rheological response, the comparative constitutive-model performance, the predicted filling and pressure behavior, and the quantified thermo-mechanical response. Beyond confirming the established properties of PEEK, the analysis shows that the experimentally observed shear-thinning response and constitutive-model selection provide a direct material basis for interpreting the subsequent processing and structural predictions. The principal finding is therefore the quantitative continuity from measured rheological behavior through simulated filling and pressure development to predicted thermo-mechanical response, rather than the individual confirmation of well-known PEEK properties. Moisture-free conditions for the material preparation stage would definitely improve the quality of processing and help to avoid defects. Thermal and mechanical characterization was also performed and showed that PEEK has a high stability and strength, and is thus suitable for an application as a bearing in the aerospace sector. The Carreau–Yasuda model is used to accurately predict the non-linear flow properties, with strong shear-thinning behavior revealed by rheological testing and model fitting, which leads to reliable processing insights. The established theoretical equations and characterization procedures are therefore treated as analytical tools, while the research contribution arises from their application to the experimentally characterized PEEK bearing system. The uniform flow-front distribution, together with the identified pressure variations, indicates that the selected processing conditions provide effective cavity filling while highlighting regions requiring process control. Injection molding simulation reveals uniform flow and optimized pressure distribution, which show the efficient molding of the mold and the reduction in the formation of defects. CAD modeling and FEA results provide an understanding of structural integrity and where stress, deformation and temperature distributions are within acceptable limits, ensuring the reliability of the component being used under operational conditions. Finally, the statistical validation, indicated by high R2 values and low error measures, ensures the accuracy and robustness of the proposed approach.
These existing studies (Gul et al. [
14] and Herzog et al. [
24]) showed that the thermal conductivity of the material was enhanced, and the thermo-mechanical behavior was predicted with good accuracy by using extrusion-based processing and surrogate modeling techniques, though with high processing complexity and limited validation in real manufacturing scenarios. In contrast, the proposed framework incorporates advanced experimental characterization, experimental rheological modeling, injection molding simulation, CAD-based design and FEA into a single streamline approach that subsequently allows for better prediction of flow, structure, and thermal properties. The contribution should therefore not be interpreted as a claim that coupling these computational tools is unprecedented, since similar integrated capabilities are established in polymer engineering practice. Instead, the research value lies in connecting experimentally measured PEEK rheology and comparative constitutive-model selection with the predicted behavior of the investigated aircraft bearing geometry. This is a combination of two things which makes the system more reliable, reduces the number of processing defects, and also gives a complete solution with a scalable model for practical industrial applications, outperforming the limitations found in the existing works. The research contribution is consequently positioned as a quantitative material-to-component analysis rather than as a simple combination of established software procedures. In particular, comparative rheological fitting identifies the constitutive representation used to interpret the processing response, while the subsequent simulations quantify how that material behavior manifests in filling, pressure, stress and deformation.
Limitations
There was limited experimental validation under practical industrial manufacturing conditions.
In particular, the simulated filling patterns, pressure fields, stress distributions and deformation responses were not directly compared with measurements obtained from physically molded PEEK bearing specimens.
This study is computationally dependent on simulations, which results in the need for more time and resources.
6. Conclusions
This study successfully investigates the rheological behavior and processing characteristics of PEEK for high-performance aircraft bearing applications through a novel integrated experimental–computational framework. The proposed methodology uniquely combines four key components—material characterization, rheological testing with multi-model fitting, injection molding simulation, and multiphysics FEA—into a coupled predictive approach that bridges the critical gap between laboratory-scale material analysis and industrial-scale processing optimization. The principal scientific outcome is the establishment of a continuous quantitative pathway from experimentally measured PEEK rheology to constitutive-model selection and subsequently to process and thermo-mechanical predictions for an aircraft bearing geometry.
The major findings and novel contributions of this work are summarized as follows:
Comprehensive material characterization confirmed PEEK’s exceptional thermal stability (Tg = 143 °C, Tm = 343 °C, Td = 575 °C) and mechanical strength (tensile strength = 95 MPa, elastic modulus = 3.60 GPa), validating its suitability for demanding aerospace bearing applications.
Rheological testing revealed pronounced shear-thinning behavior, with viscosity decreasing significantly with increasing shear rate across all tested temperatures, demonstrating enhanced processability under high-shear injection molding conditions.
Comparative rheological model fitting established the Carreau–Yasuda model as the most accurate predictor of PEEK’s non-linear flow behavior (R2 = 0.97), outperforming Power Law and Cross models, providing a robust mathematical foundation for processing simulation.
The key novelty of this work—the integrated rheology–simulation framework—enabled the accurate prediction of mold filling behavior, pressure distribution, and temperature profiles during injection molding, with simulation results confirming homogeneous flow patterns and optimized processing conditions.
Multiphysics FEA incorporating thermo-mechanical coupling (σ = E(ε − αΔT)) provided comprehensive assessment of bearing performance under operational loads, with von Mises stress analysis and deformation patterns remaining within acceptable limits for aerospace applications.
Rigorous statistical validation confirmed the reliability of the proposed framework, with low error metrics (RMSE: 0.6854 MPa for stress, 0.003220 mm for deformation; MAE: 0.4850 MPa for stress, 0.002037 mm for deformation) and high correlation coefficients (R2 = 0.97), demonstrating excellent predictive accuracy.
The significant novelty of this work compared to existing literature lies in the following: (a) The seamless integration of experimental rheological characterization with advanced multiphysics simulation creates a truly coupled material–process–performance prediction platform. The novelty is consequently positioned in the material-specific quantitative linkage rather than in the generic integration of established simulation technologies. The framework traces experimentally measured PEEK rheology through constitutive-model comparison and selection to filling, pressure, stress and deformation predictions for the aircraft bearing configuration. (b) The application of comprehensive model comparison identifies the optimal rheological model for PEEK under injection molding conditions. (c) The thermo-mechanical coupling in FEA captures the combined effects of thermal expansion and mechanical loading on bearing performance. (d) The quantitative statistical validation establishes the framework’s reliability and transferability to other high-performance polymer systems.
The proposed framework has practical implications in industrial manufacturing, including less trial-and-error in tuning processing parameters, higher manufacturing efficiencies due to fewer defects through the prediction of possible defects, and improved part quality and reliability for aerospace applications; the approach can be expanded for other high-performance polymers or with complex geometries.
Future Work
While this study establishes a robust foundation for integrated polymer processing analysis, several promising directions for future research emerge:
Advanced Material Development: Investigate PEEK-based hybrid polymers and nanocomposites incorporating functional fillers (e.g., carbon nanotubes, graphene, hexagonal boron nitride) to enhance thermal conductivity, mechanical strength, and multifunctional performance for next-generation aerospace applications.
Artificial Intelligence Integration: Introduce AI/ML-based predictive models (using neural networks or support vector regression (SVR)) for accelerated rheological parameter prediction, on-line processing condition optimization and reduced computation cost of multiphysics simulations.
Process Optimization: The developed framework can further be extended in optimizing injection molding parameters (melt temperature, mold temperature, injection pressure and cooling rate) to multiple industrial applications for products such as automotive, biomedical and electronic components, in addition to bearings.
Multi-Material Systems: Expand the methodology to multi-material and functionally graded PEEK components, addressing the growing demand for tailored property distributions in advanced engineering structures.
Long-Term Performance Assessment: Integrate fatigue analysis, creep behavior and environmental degradations such as moisture absorption, UV exposure and chemical resistance into FEA simulation for long-term durability and service life prediction of PEEK components under actual operating conditions.
Experimental Validation Under Industrial Conditions: Conduct detailed experimental trials with actual manufacturing conditions to further validate the predictive capabilities of the proposed framework and make it robust for industrial use.
Sustainability Integration: Consider environmentally responsible PEEK processing routes: recycling, bio-based precursors, and less energy-demanding manufacture. Meet sustainability goals while maintaining high-performance characteristics.
In summary, this work delivers a comprehensive, validated, and industrially relevant framework for high-performance polymer processing, significantly advancing the state of the art in integrated experimental–computational materials engineering. The demonstrated methodology produces immediate benefits for the manufacture of PEEK bearings and could be translated as a platform for application across other advanced polymer processing challenges and designs.




 ,
,