Research on Bi-Objective Optimization of Injection Molding Process and Mechanical Anisotropy of Glass Fiber-Reinforced Polypropylene Fan Face Shell Based on RSM and NSGA-II

Abstract
1. Introduction
2. Materials and Methods
2.1. Experimental Objects and Material Properties
2.1.1. Structural Parameters of the Fan Face Shell
2.1.2. Material Selection
2.2. Establishment of Numerical Model for Injection Molding
2.2.1. Mesh Generation
2.2.2. Design of Gating System
Determination of Gate Number
Dimension Calculation of the Gating System
2.2.3. Design of Cooling System
2.3. Bi-Objective Optimization Method for Injection Molding Process Parameters
2.3.1. Establishment of Response Surface Model Based on Central Composite Design
2.3.2. Solution of the Bi-Objective Optimization Model Based on NSGA-II
2.4. Co-Simulation Method for Mechanical Properties of Plastic Parts Considering Molding History
2.4.1. Theoretical Basis of Anisotropic Mechanics for Fiber-Reinforced Composites
2.4.2. Data Mapping Method for Moldflow-Ansys Co-Simulation
- (1)
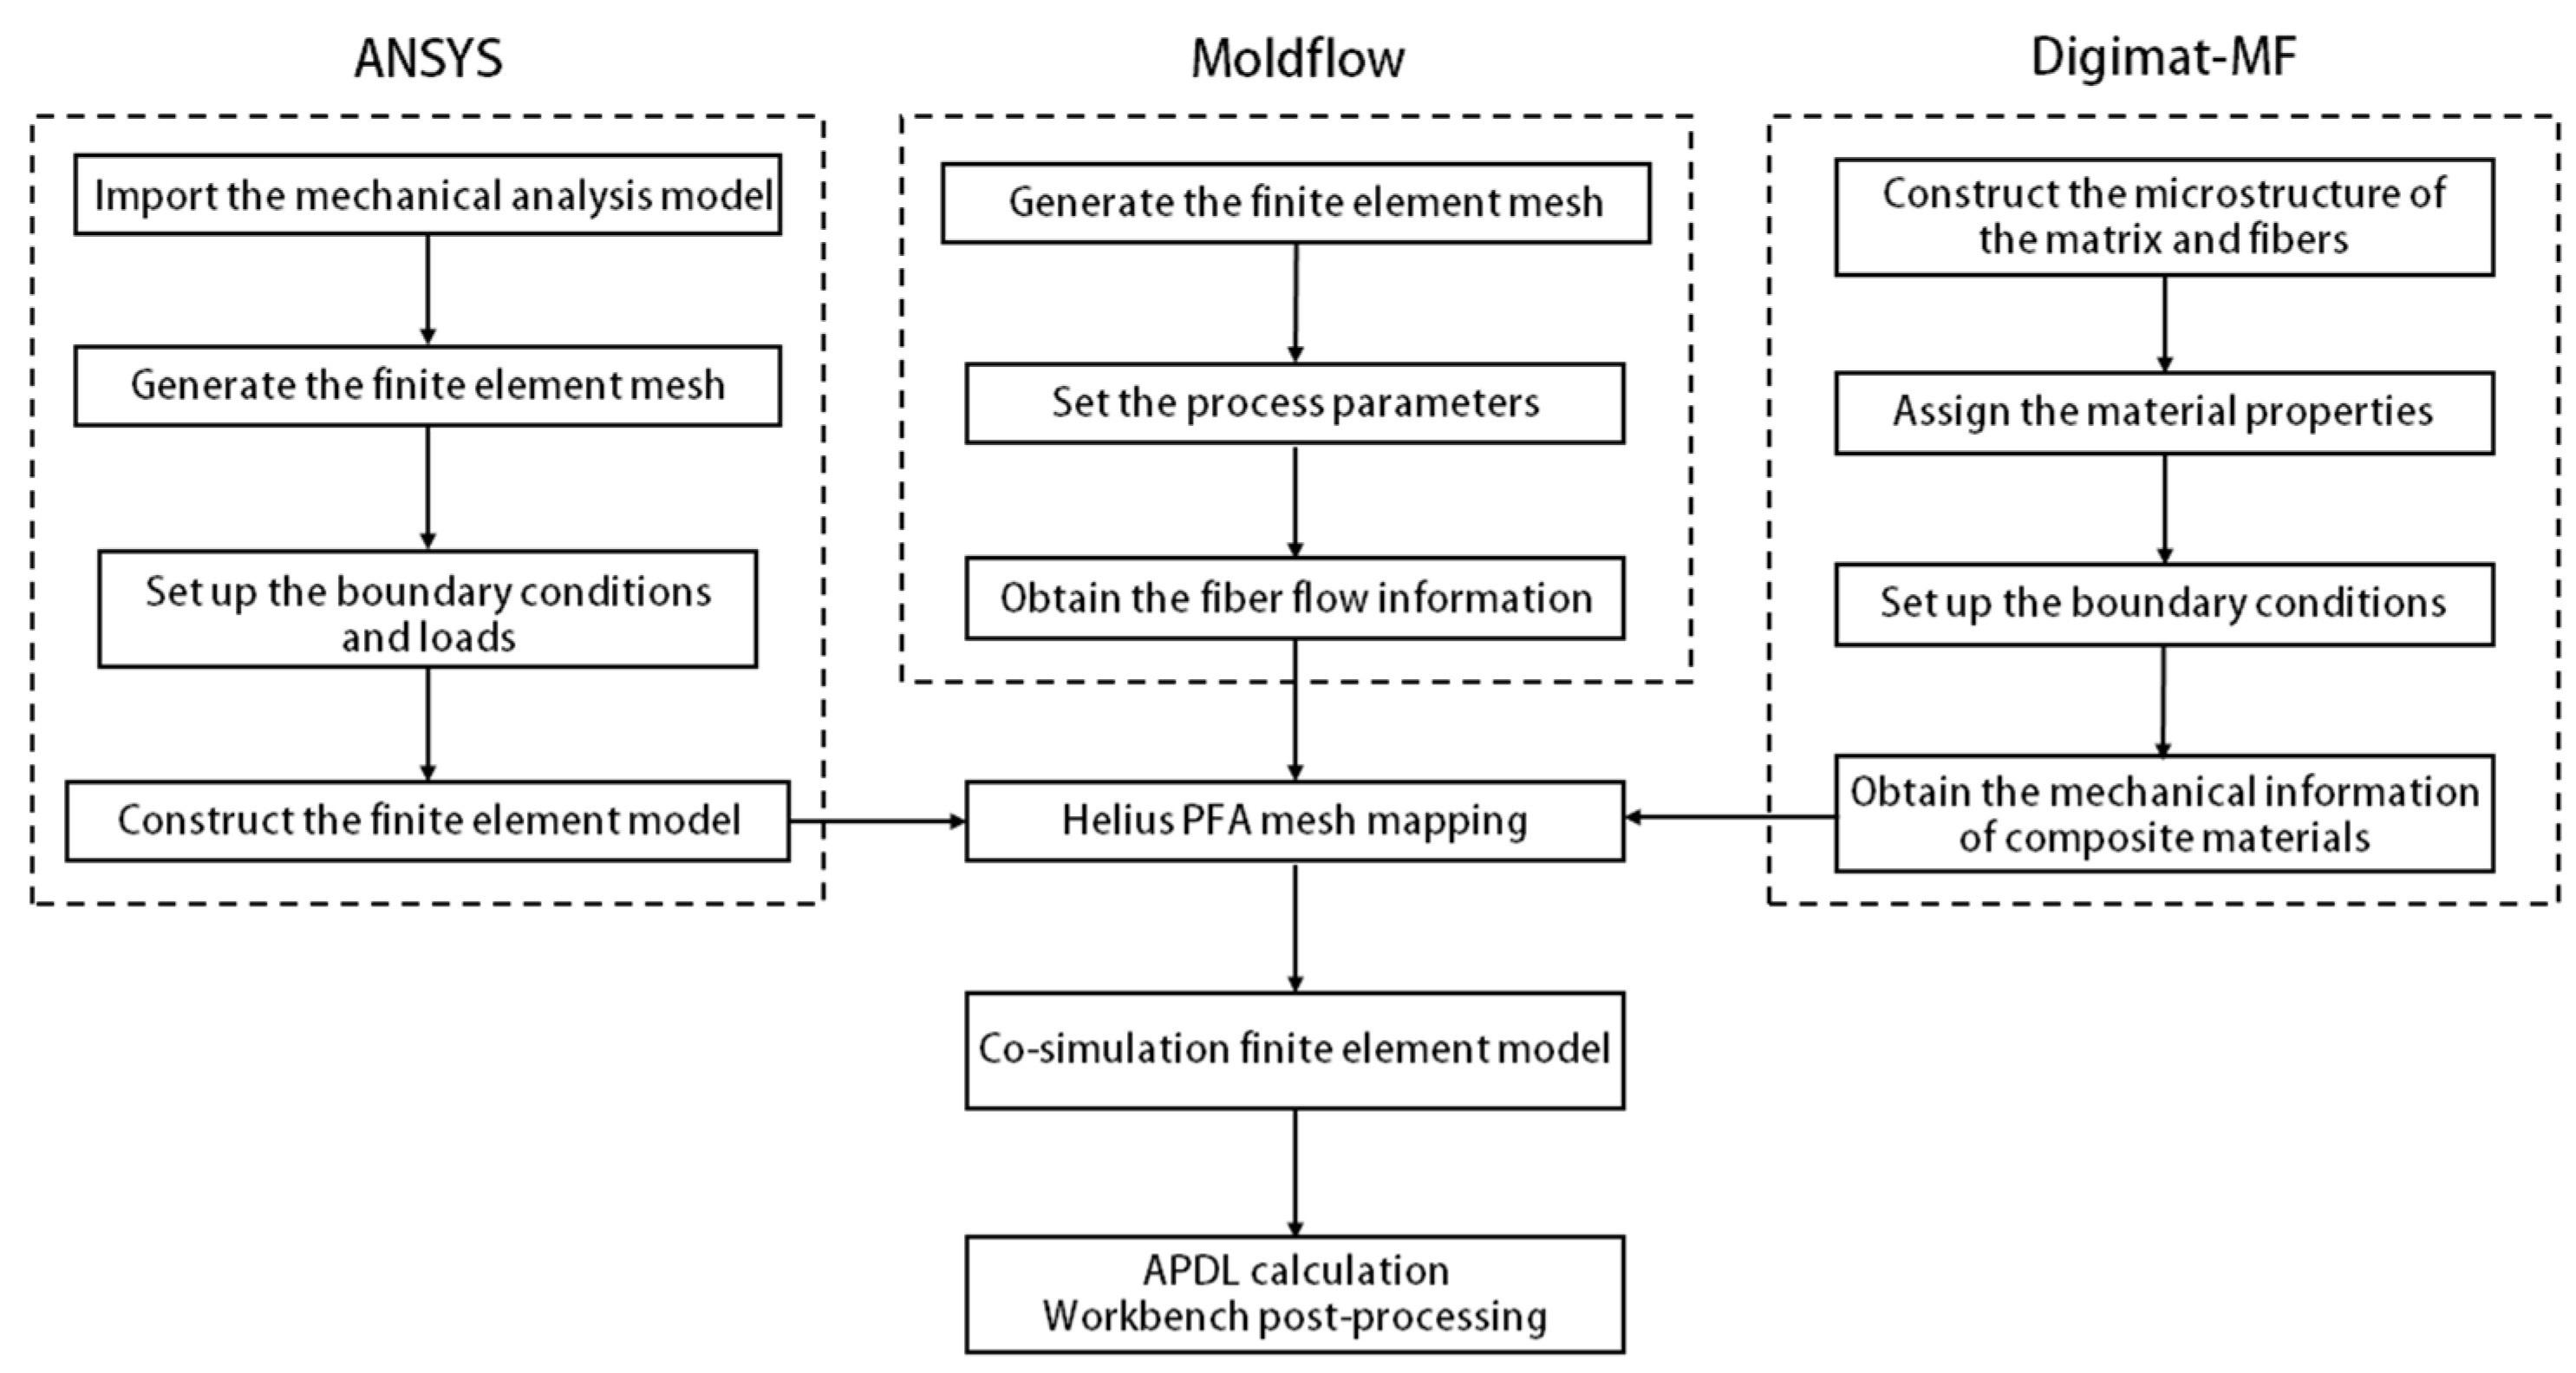
- Based on the simulation results of the optimal process by Moldflow 2023 described above, the result file in .sdy format containing fiber orientation tensor, residual stress distribution, and weld line positions was extracted.
- (2)
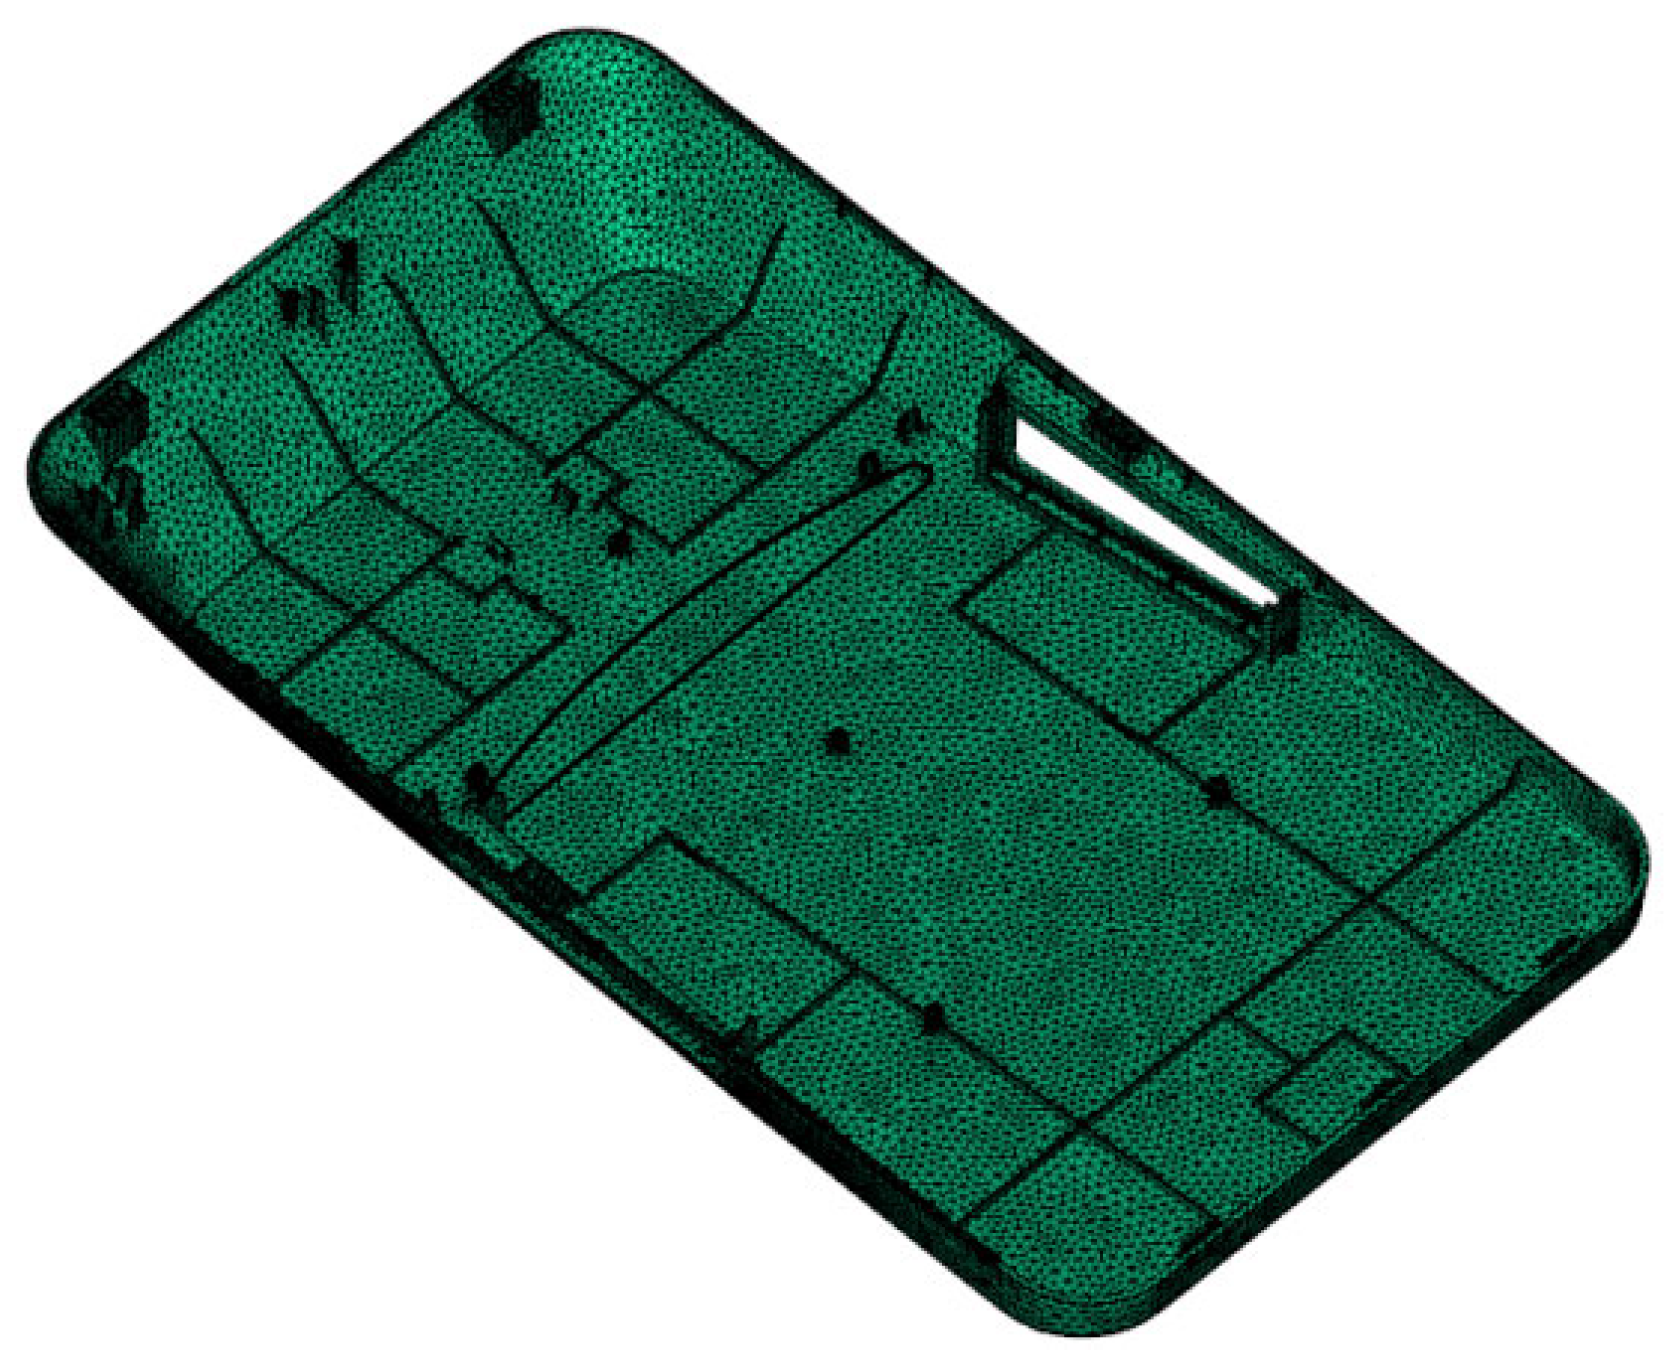
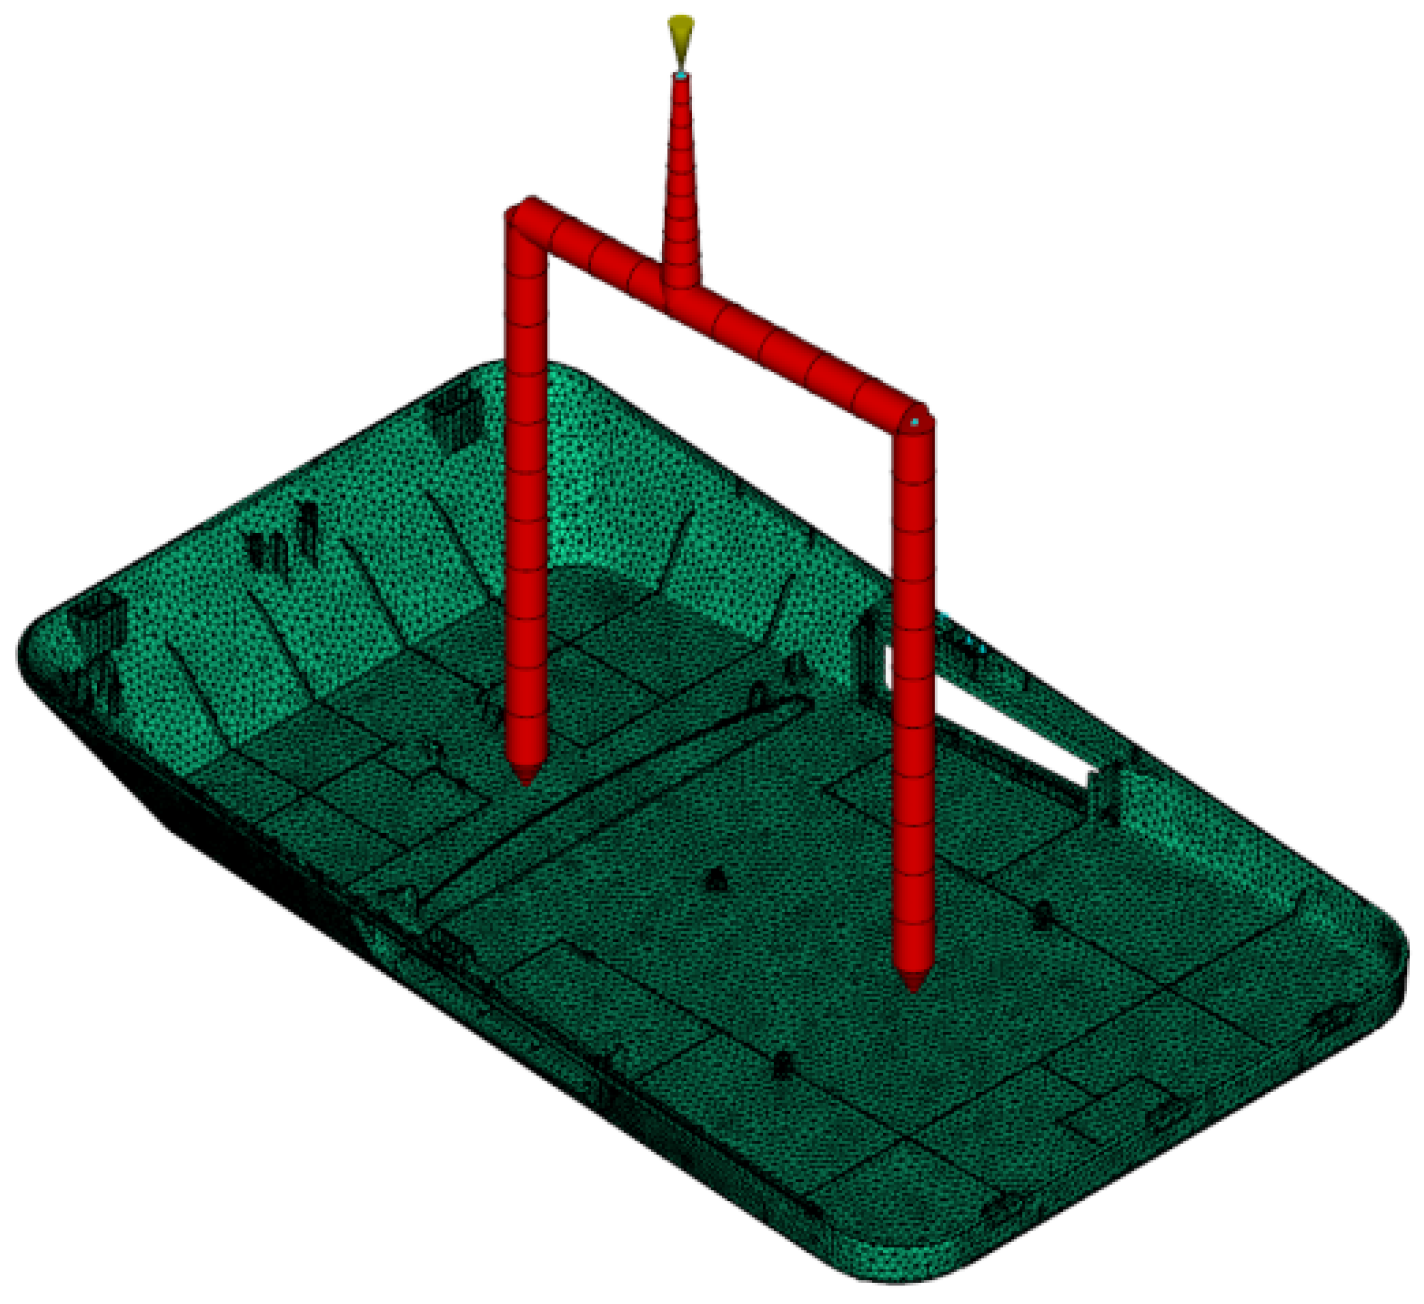
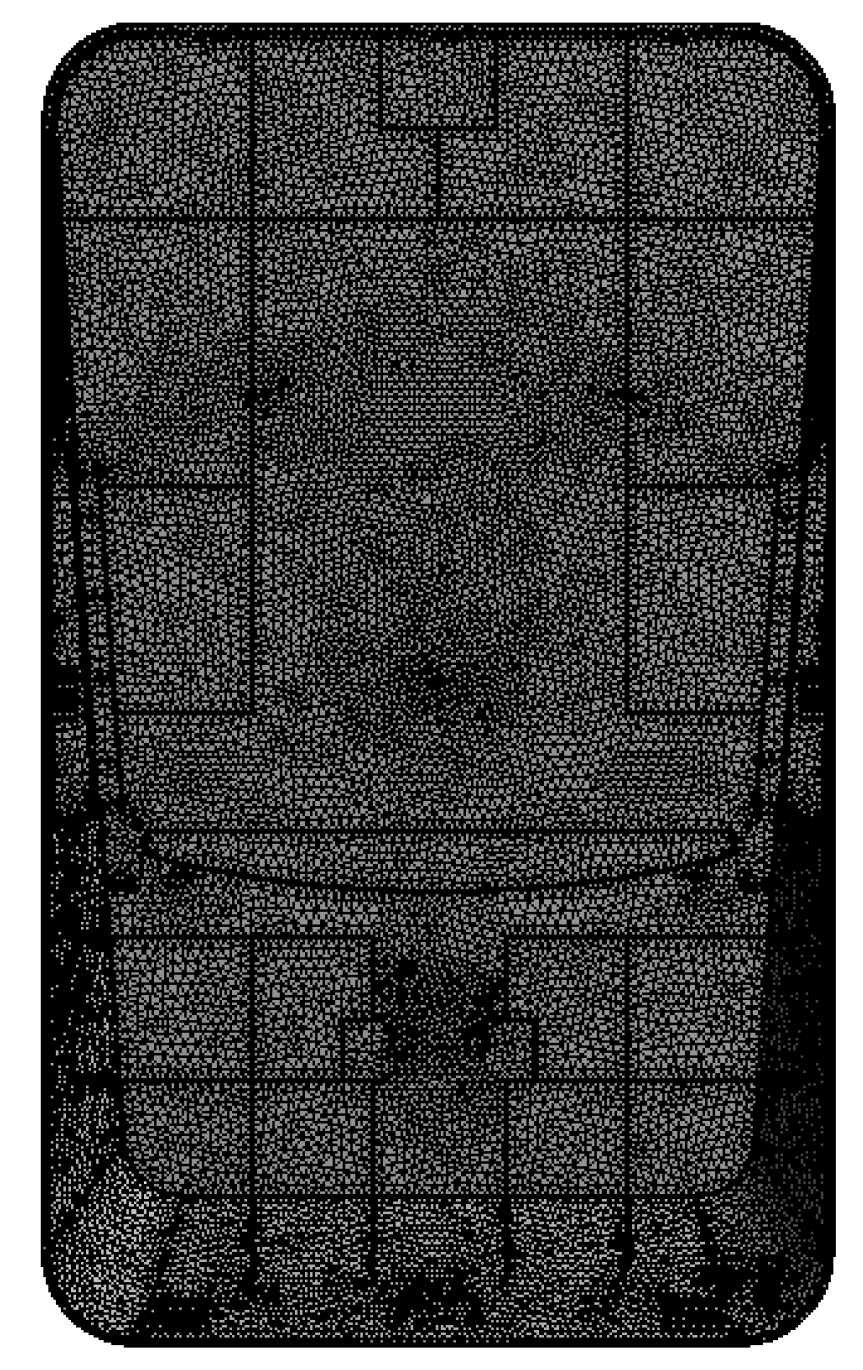
- A high-precision structural mesh matching the Moldflow mesh was established in Ansys Workbench 2023 R2, and the mesh element size was uniformly set equivalent to the wall thickness of the plastic part (3 mm), as shown in Figure 12, to ensure the accurate mapping of molding information, and the mesh file in .inp format was output.
- (3)
- The above two types of files were imported into the Advanced Material Exchange module of Helius PFA 2023, and mesh matching was completed by combining automatic alignment with interactive fine-tuning to guarantee the mapping accuracy of molding information at Gaussian points.
- (4)
- After the mapping of fiber orientation, residual stress and weld line information was completed, files in .inp, .hin and .sif formats containing anisotropic material properties were exported. Mechanical calculations were performed using the Mechanical APDL solver, and finally, the stress and strain results were extracted in Workbench.
2.4.3. Boundary Conditions and Load Settings for Mechanical Property Analysis
2.5. Injection Molding Experimental Equipment and Mold Trial Scheme
3. Results and Discussion
3.1. Analysis of Initial Simulation Results
3.2. Significance and Accuracy Verification Results of the Response Surface Model
3.3. Pareto Solution Set and Optimal Process Scheme for Bi-Objective Optimization
3.4. Simulation Verification
3.5. Analysis of Microstructure and Mechanical Behavior of Plastic Parts
3.5.1. Fiber Orientation Distribution Characteristics of Plastic Parts
3.5.2. Anisotropy of Tensile Modulus Induced by Fiber Orientation
3.5.3. Comparison of Mechanical Behaviors Between Co-Simulation and Traditional Simulation
3.6. Mold Trial Verification
4. Conclusions
- (1)
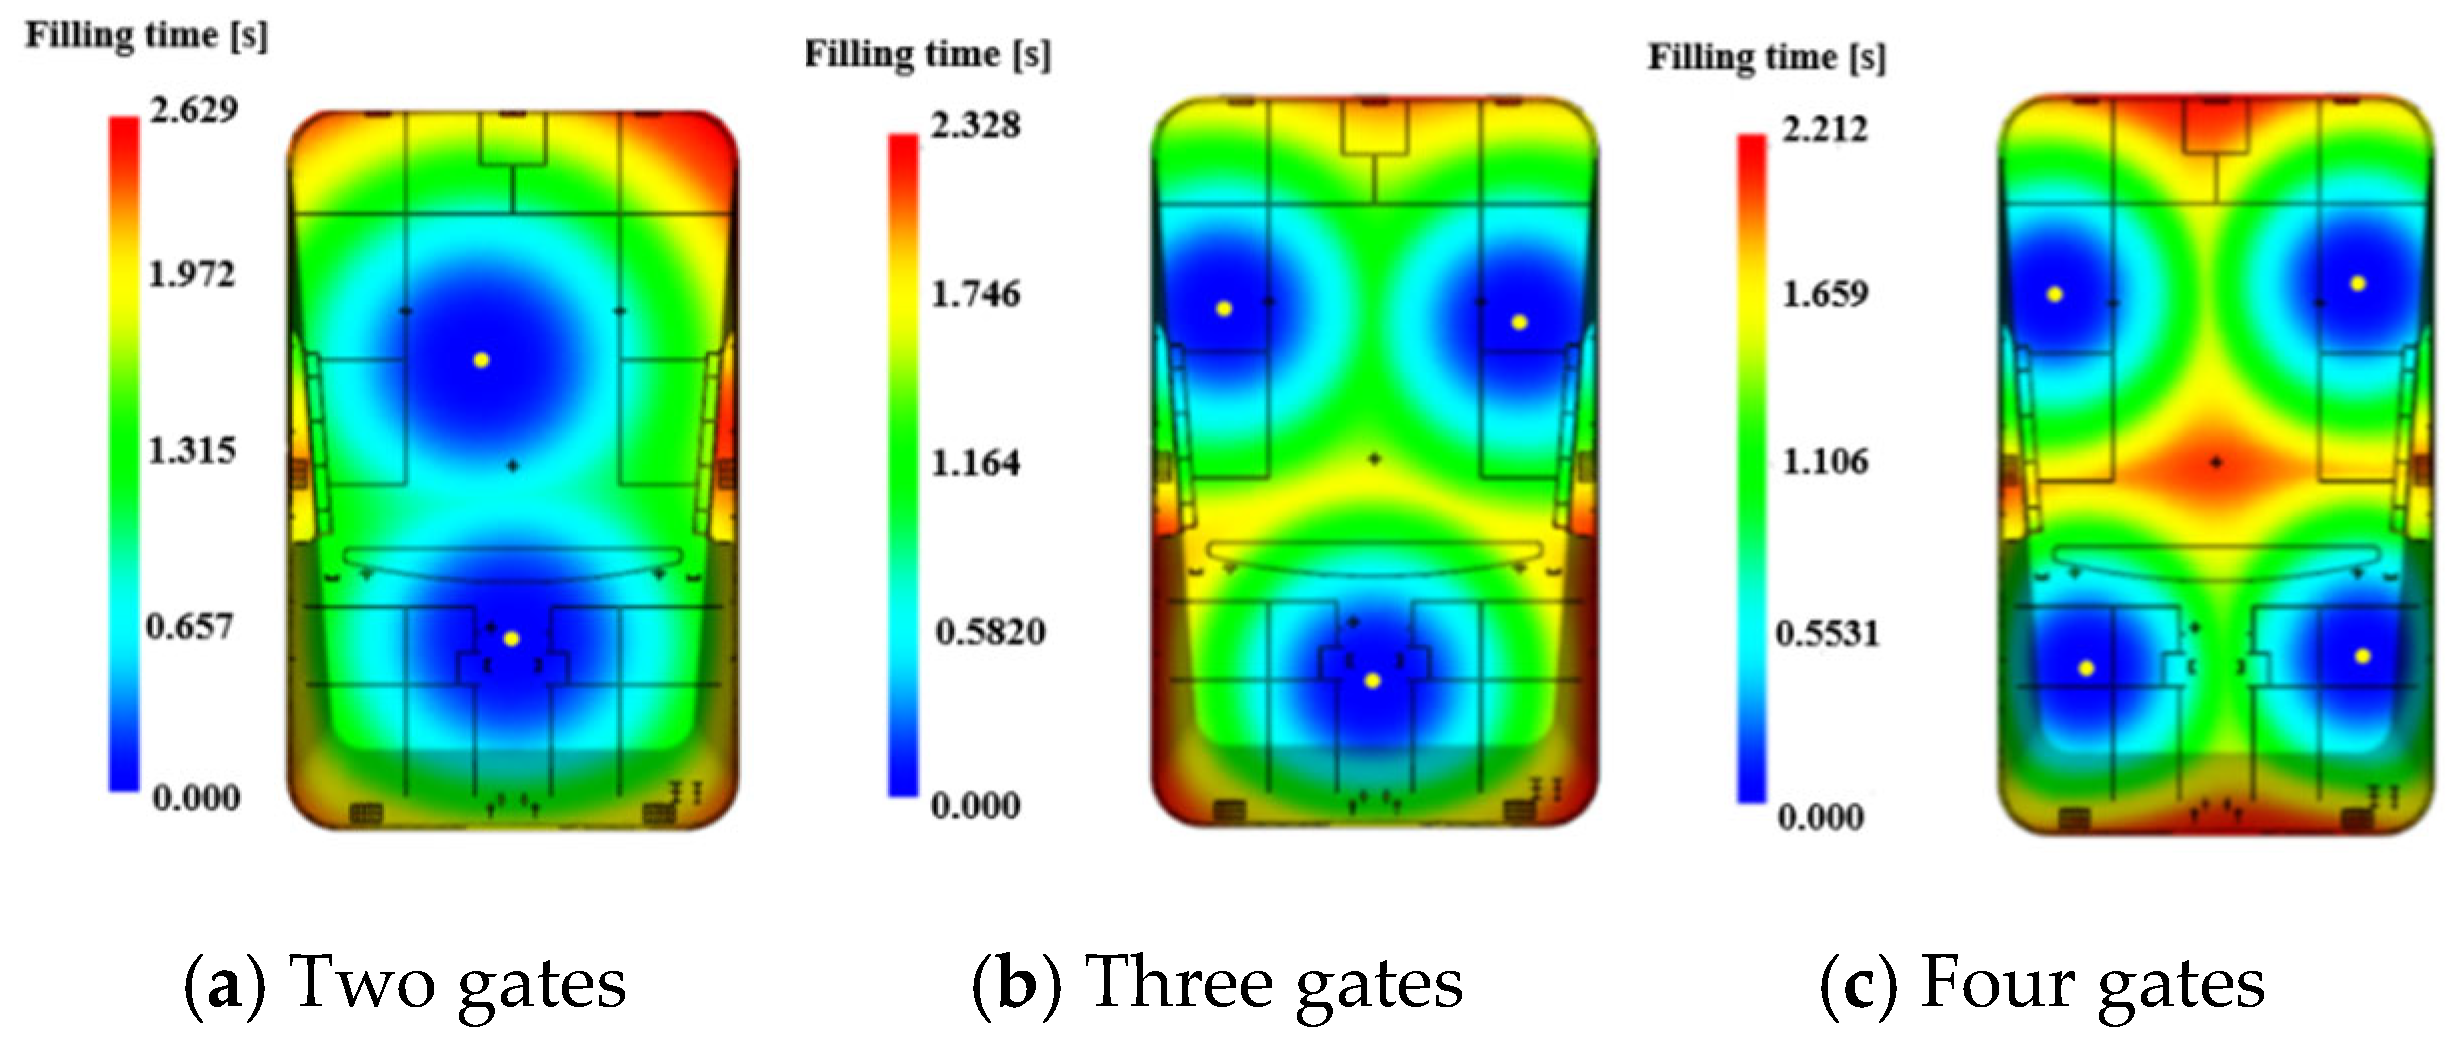
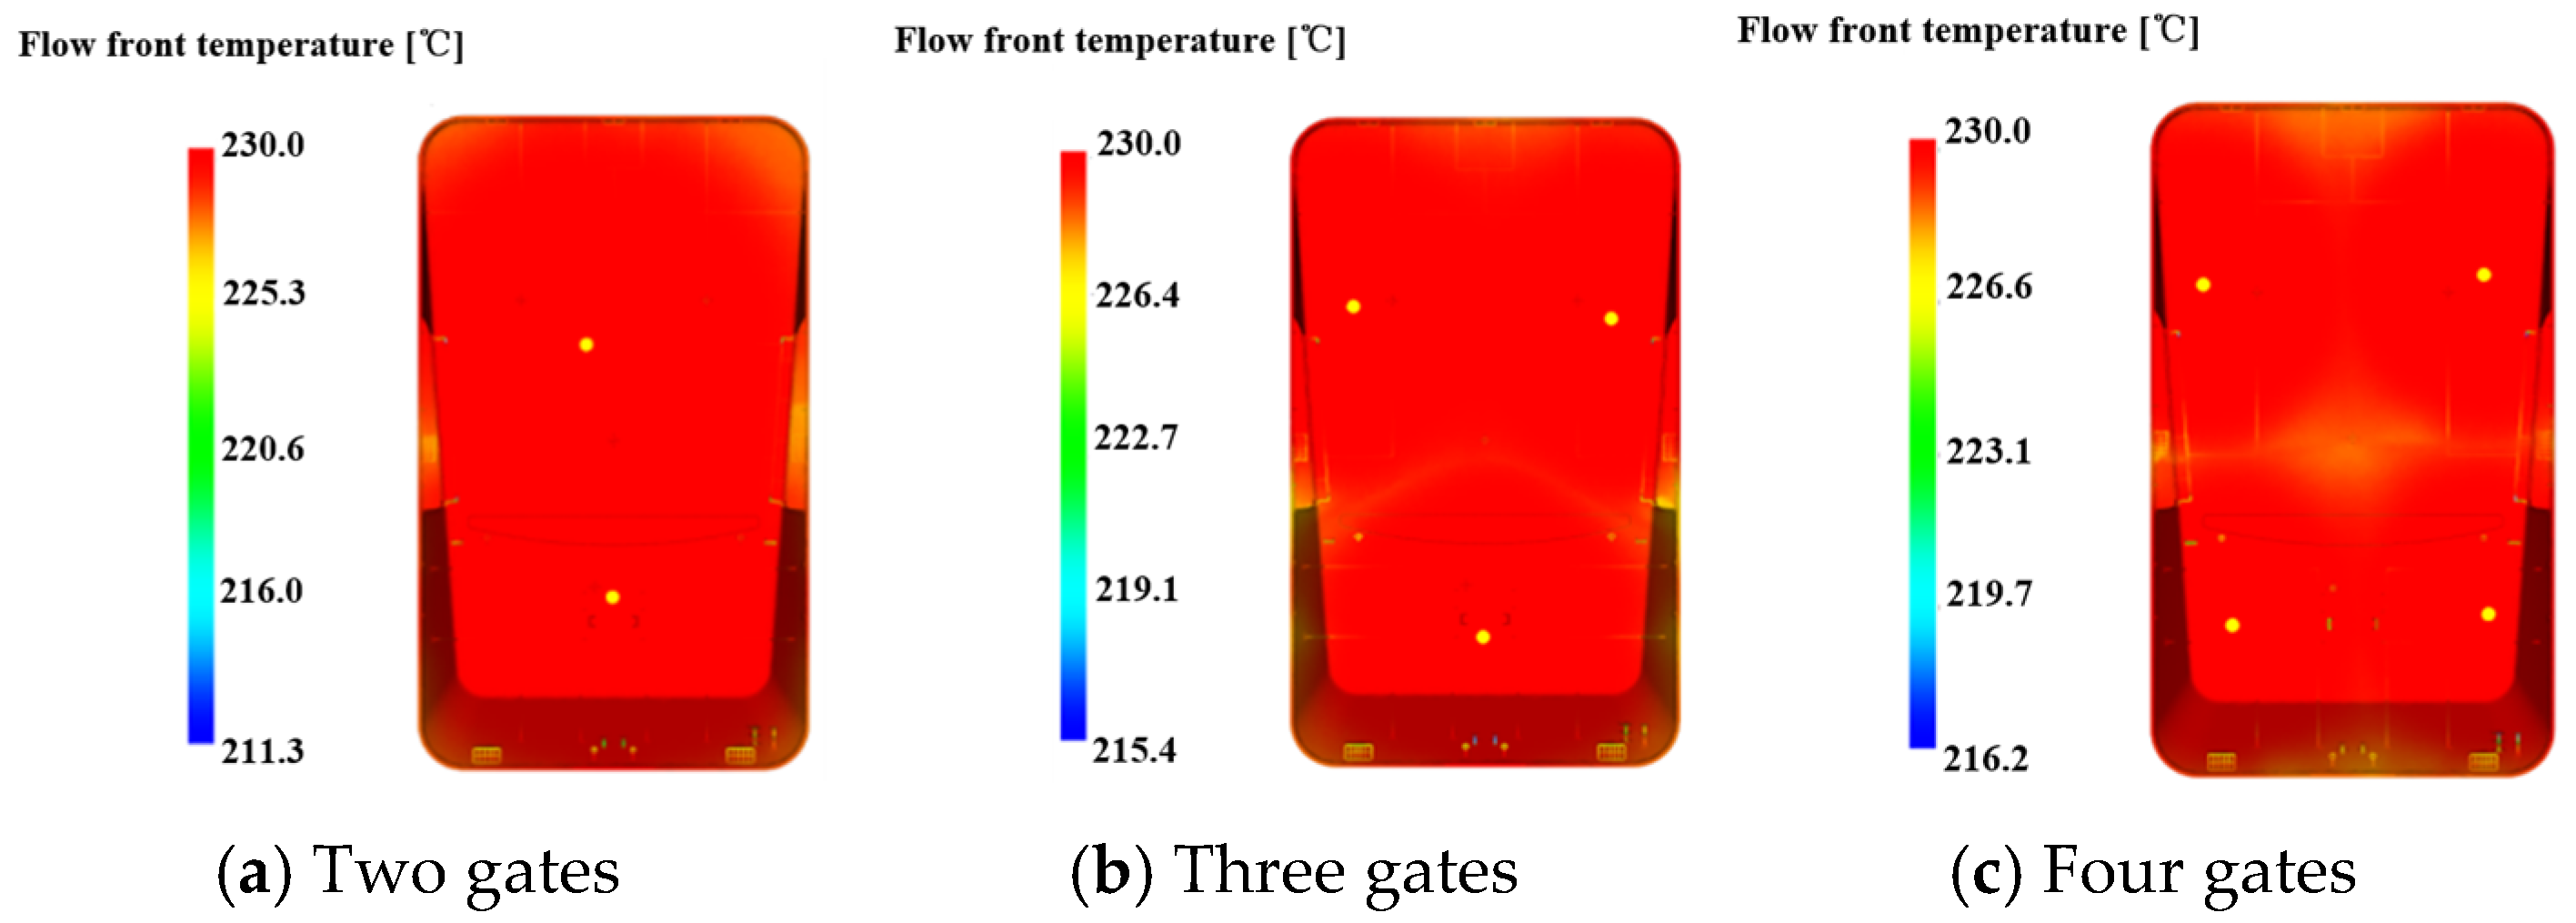
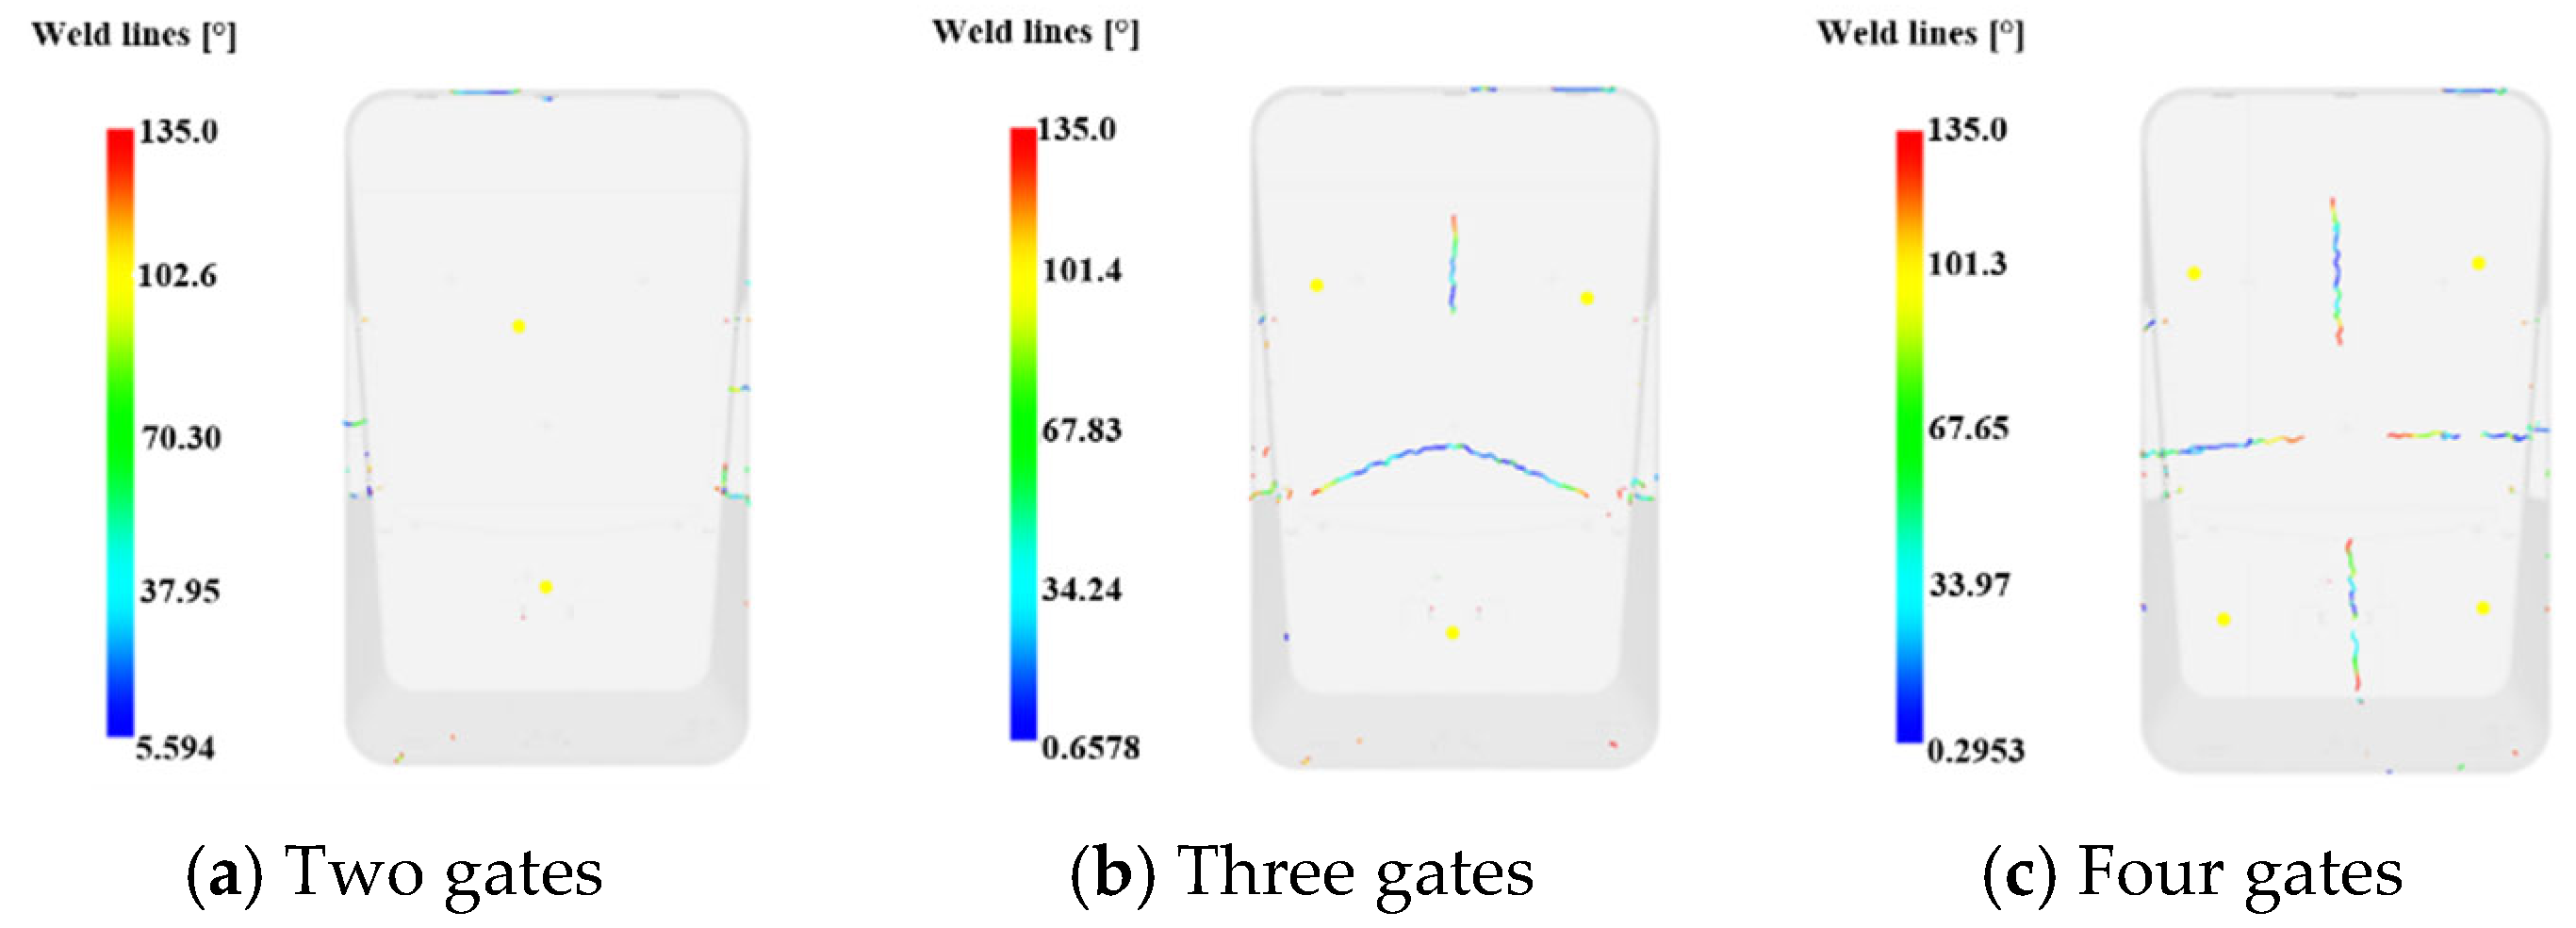
- The gating system optimization results for the large-scale flat fan face shell demonstrate that the dual-gate configuration achieves balanced melt filling, with a filling time of 2.629 s and a flow front temperature drop of 4.7 °C, which is within the reasonable control range of 2–5 °C. Moreover, the weld line defects on the outer surface of the plastic part are significantly fewer than those of the triple-gate and quadruple-gate schemes, which effectively ensures the appearance quality and molding uniformity of the plastic part and lays a foundation for the subsequent optimization of molding quality.
- (2)
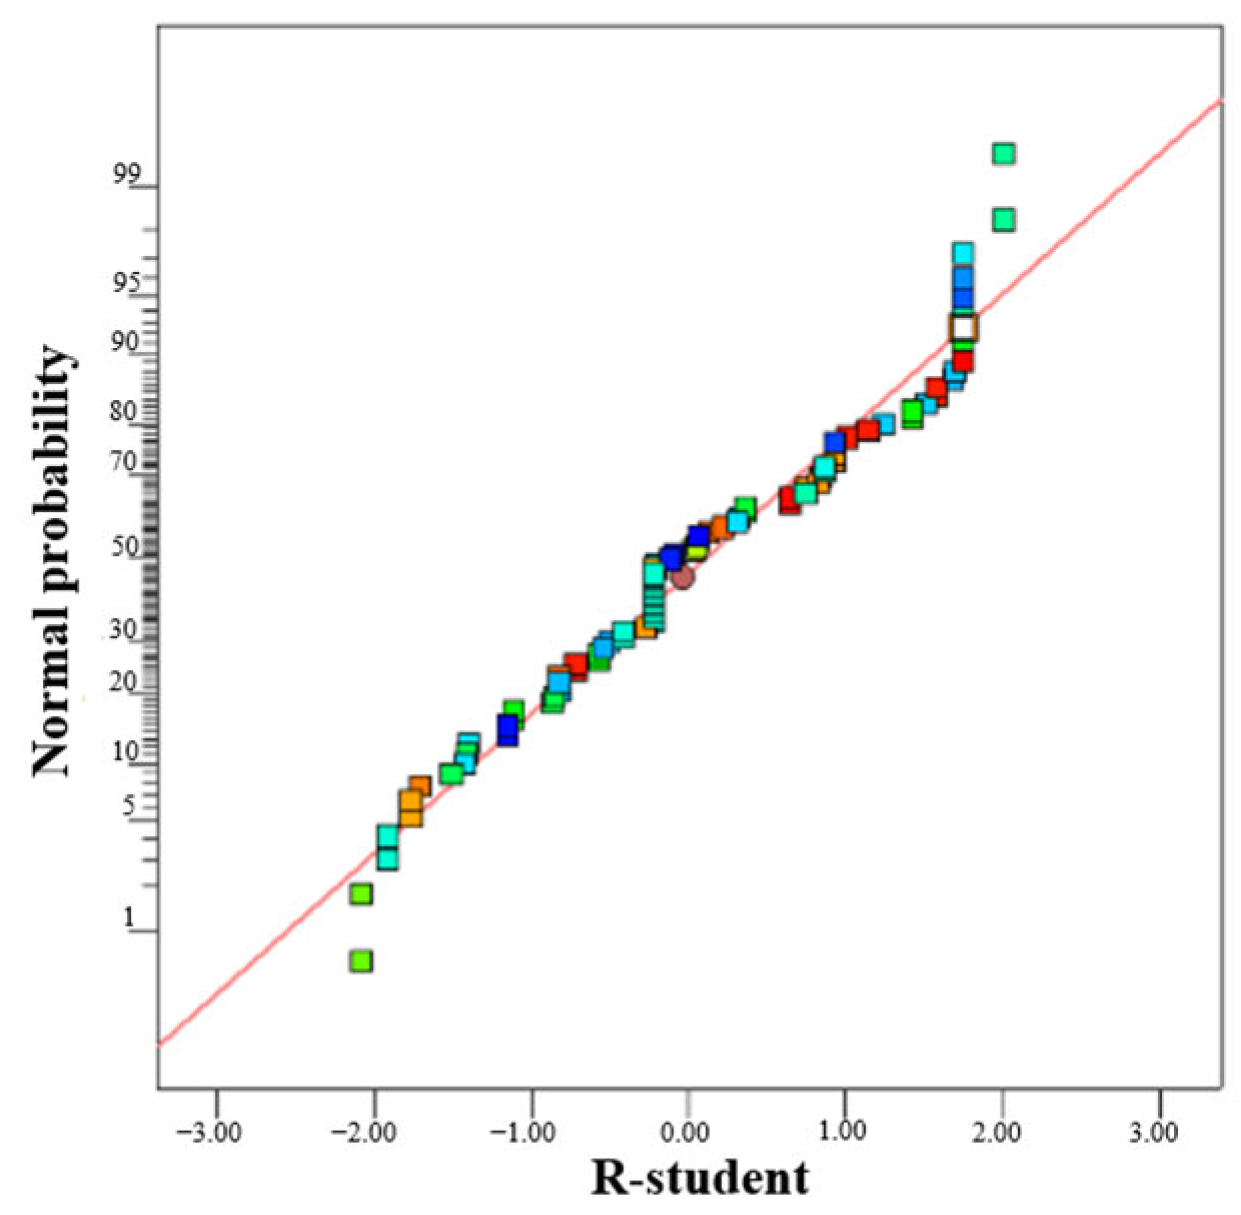
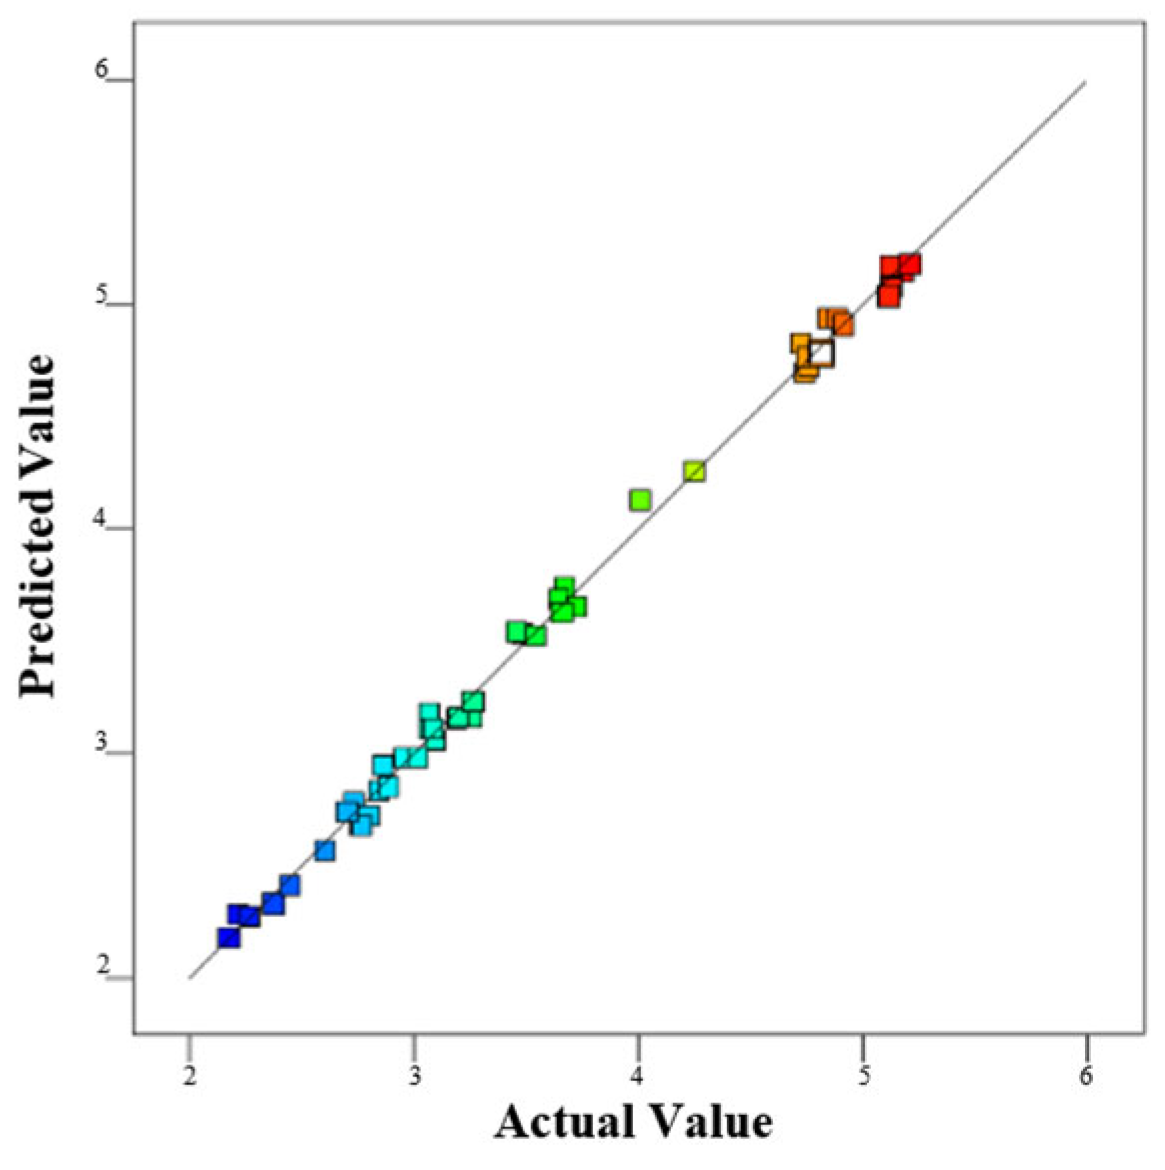
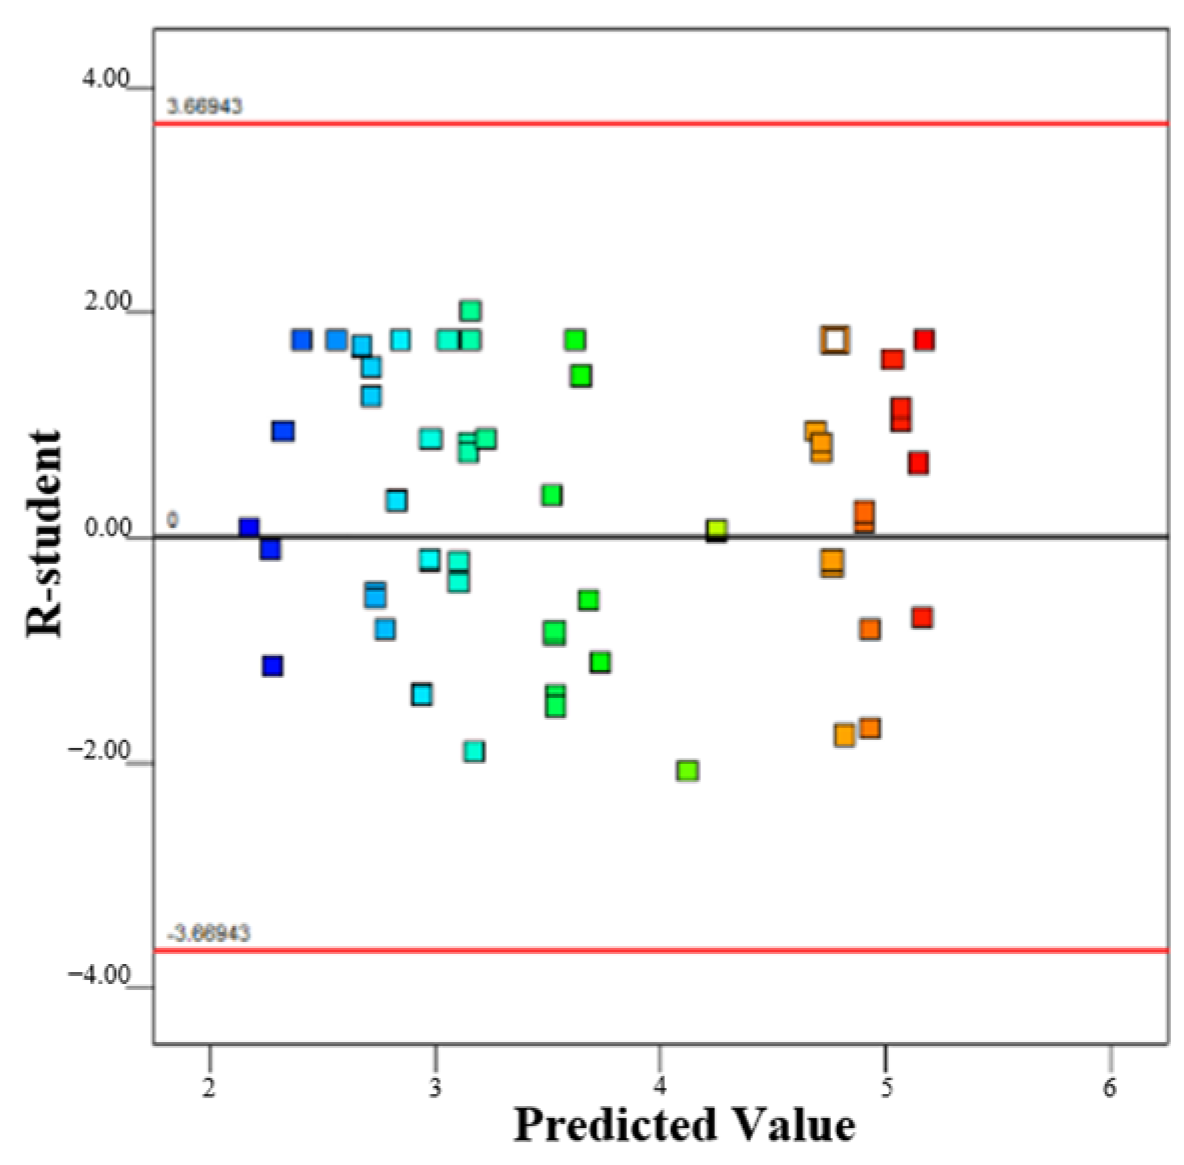
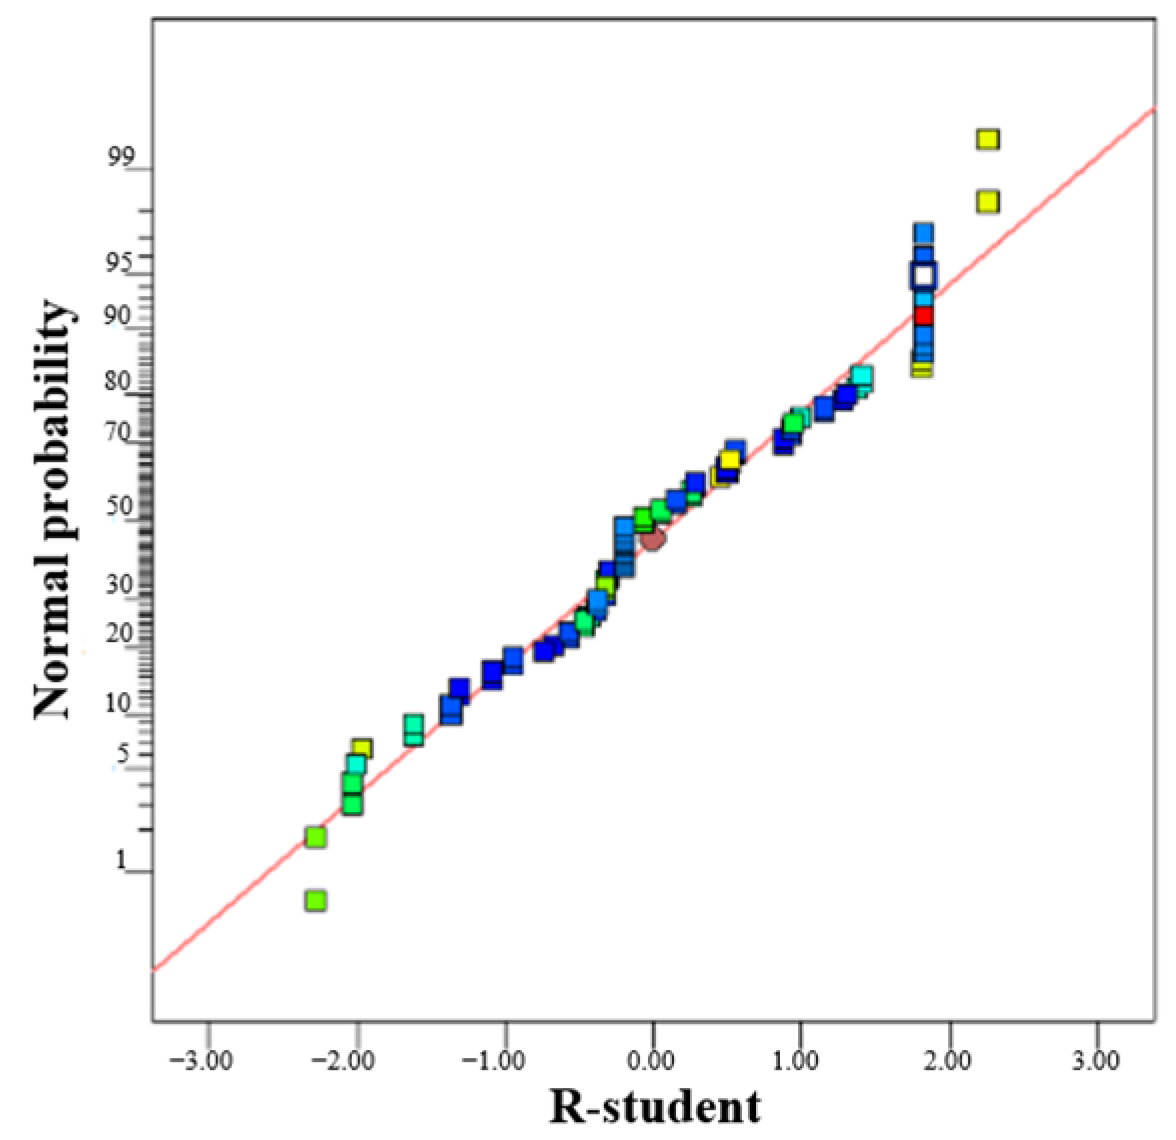
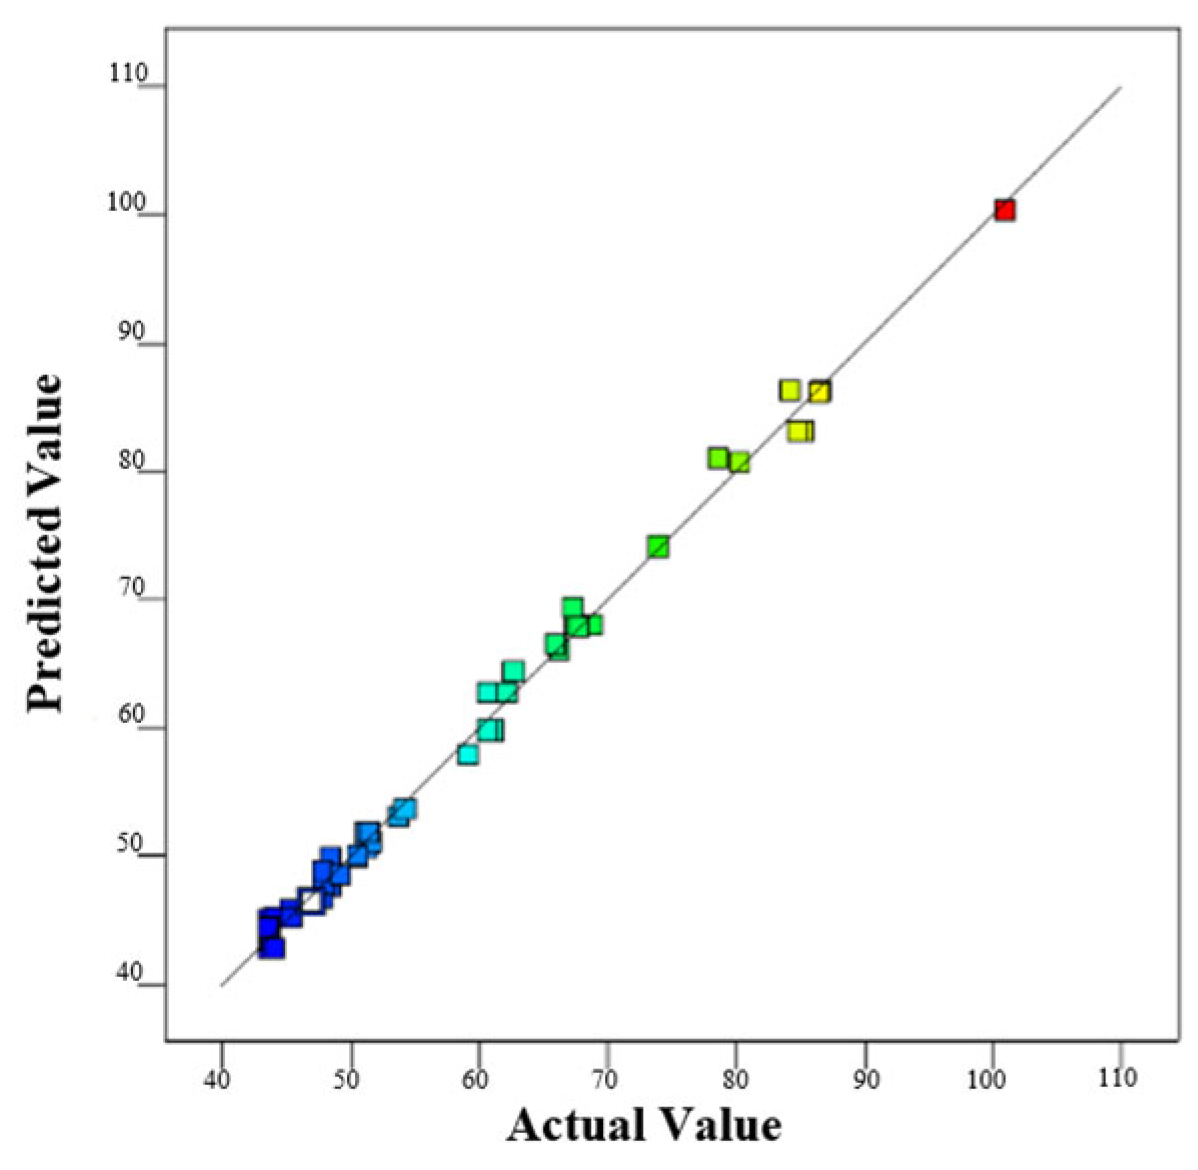
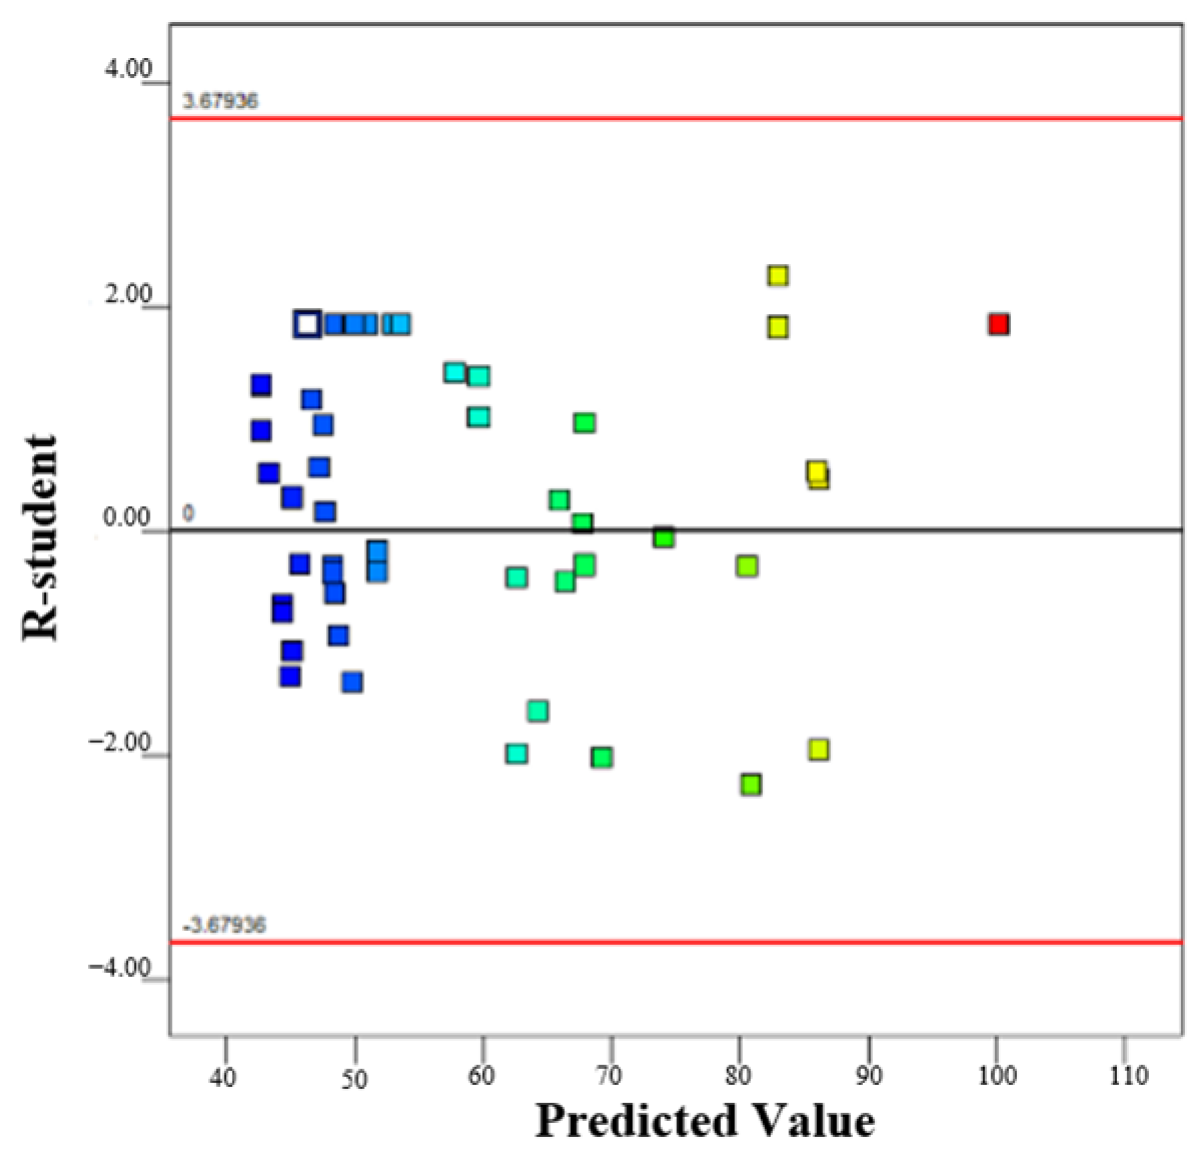
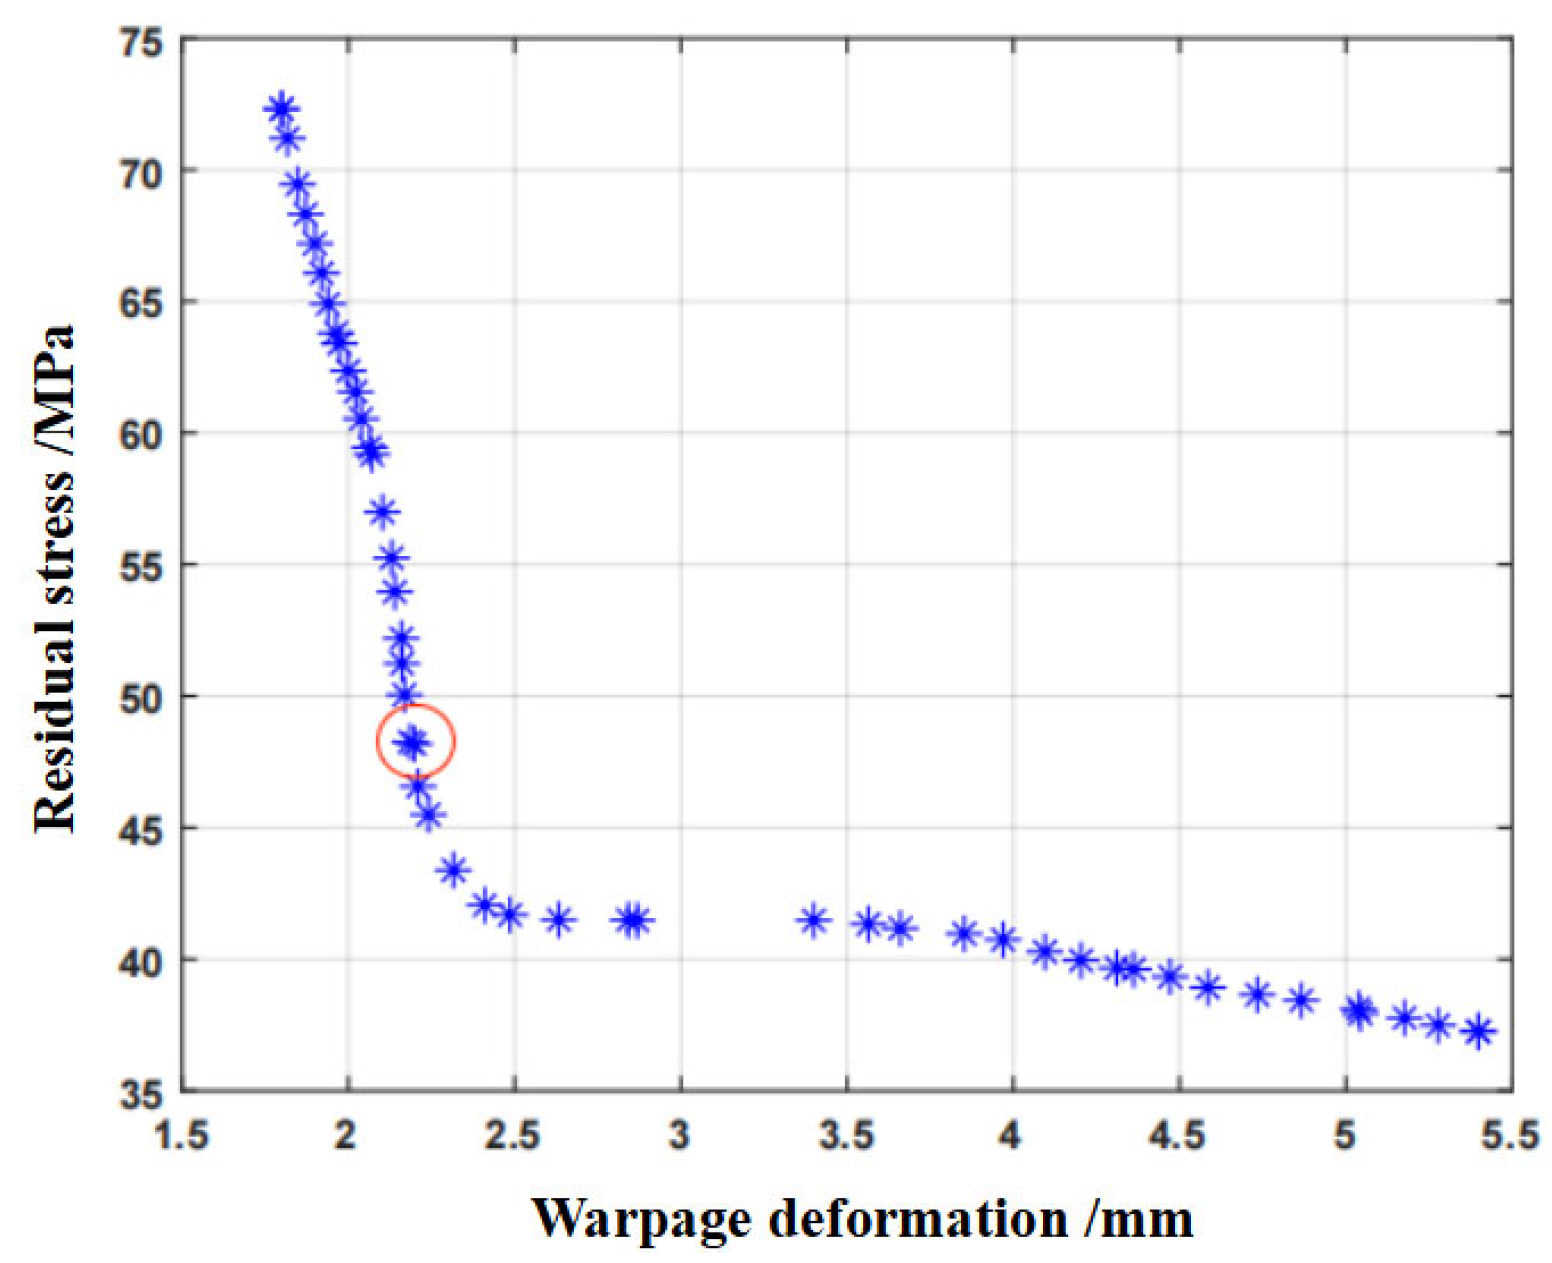
- The second-order response surface models of warpage deformation and residual stress established based on CCD experiments reach an extremely significant level (p < 0.0001). The coefficient of determination R2 of the warpage deformation model is 0.9965, and that of the residual stress model is 0.9947. Both models can explain more than 99% of the variation in response values, and have extremely high fitting accuracy and prediction reliability for the nonlinear mapping relationship between process parameters and molding quality indexes. The Pareto optimal solution set for bi-objective optimization is obtained by the NSGA-II algorithm. Combined with the engineering assembly requirements (warpage deformation ≤ 2.5 mm) and mechanical performance control requirements of the plastic part, the optimal combination of process parameters is screened out: melt temperature of 260 °C, mold temperature of 22 °C, holding pressure of 55 MPa, holding time of 30 s, and injection time of 3 s.
- (3)
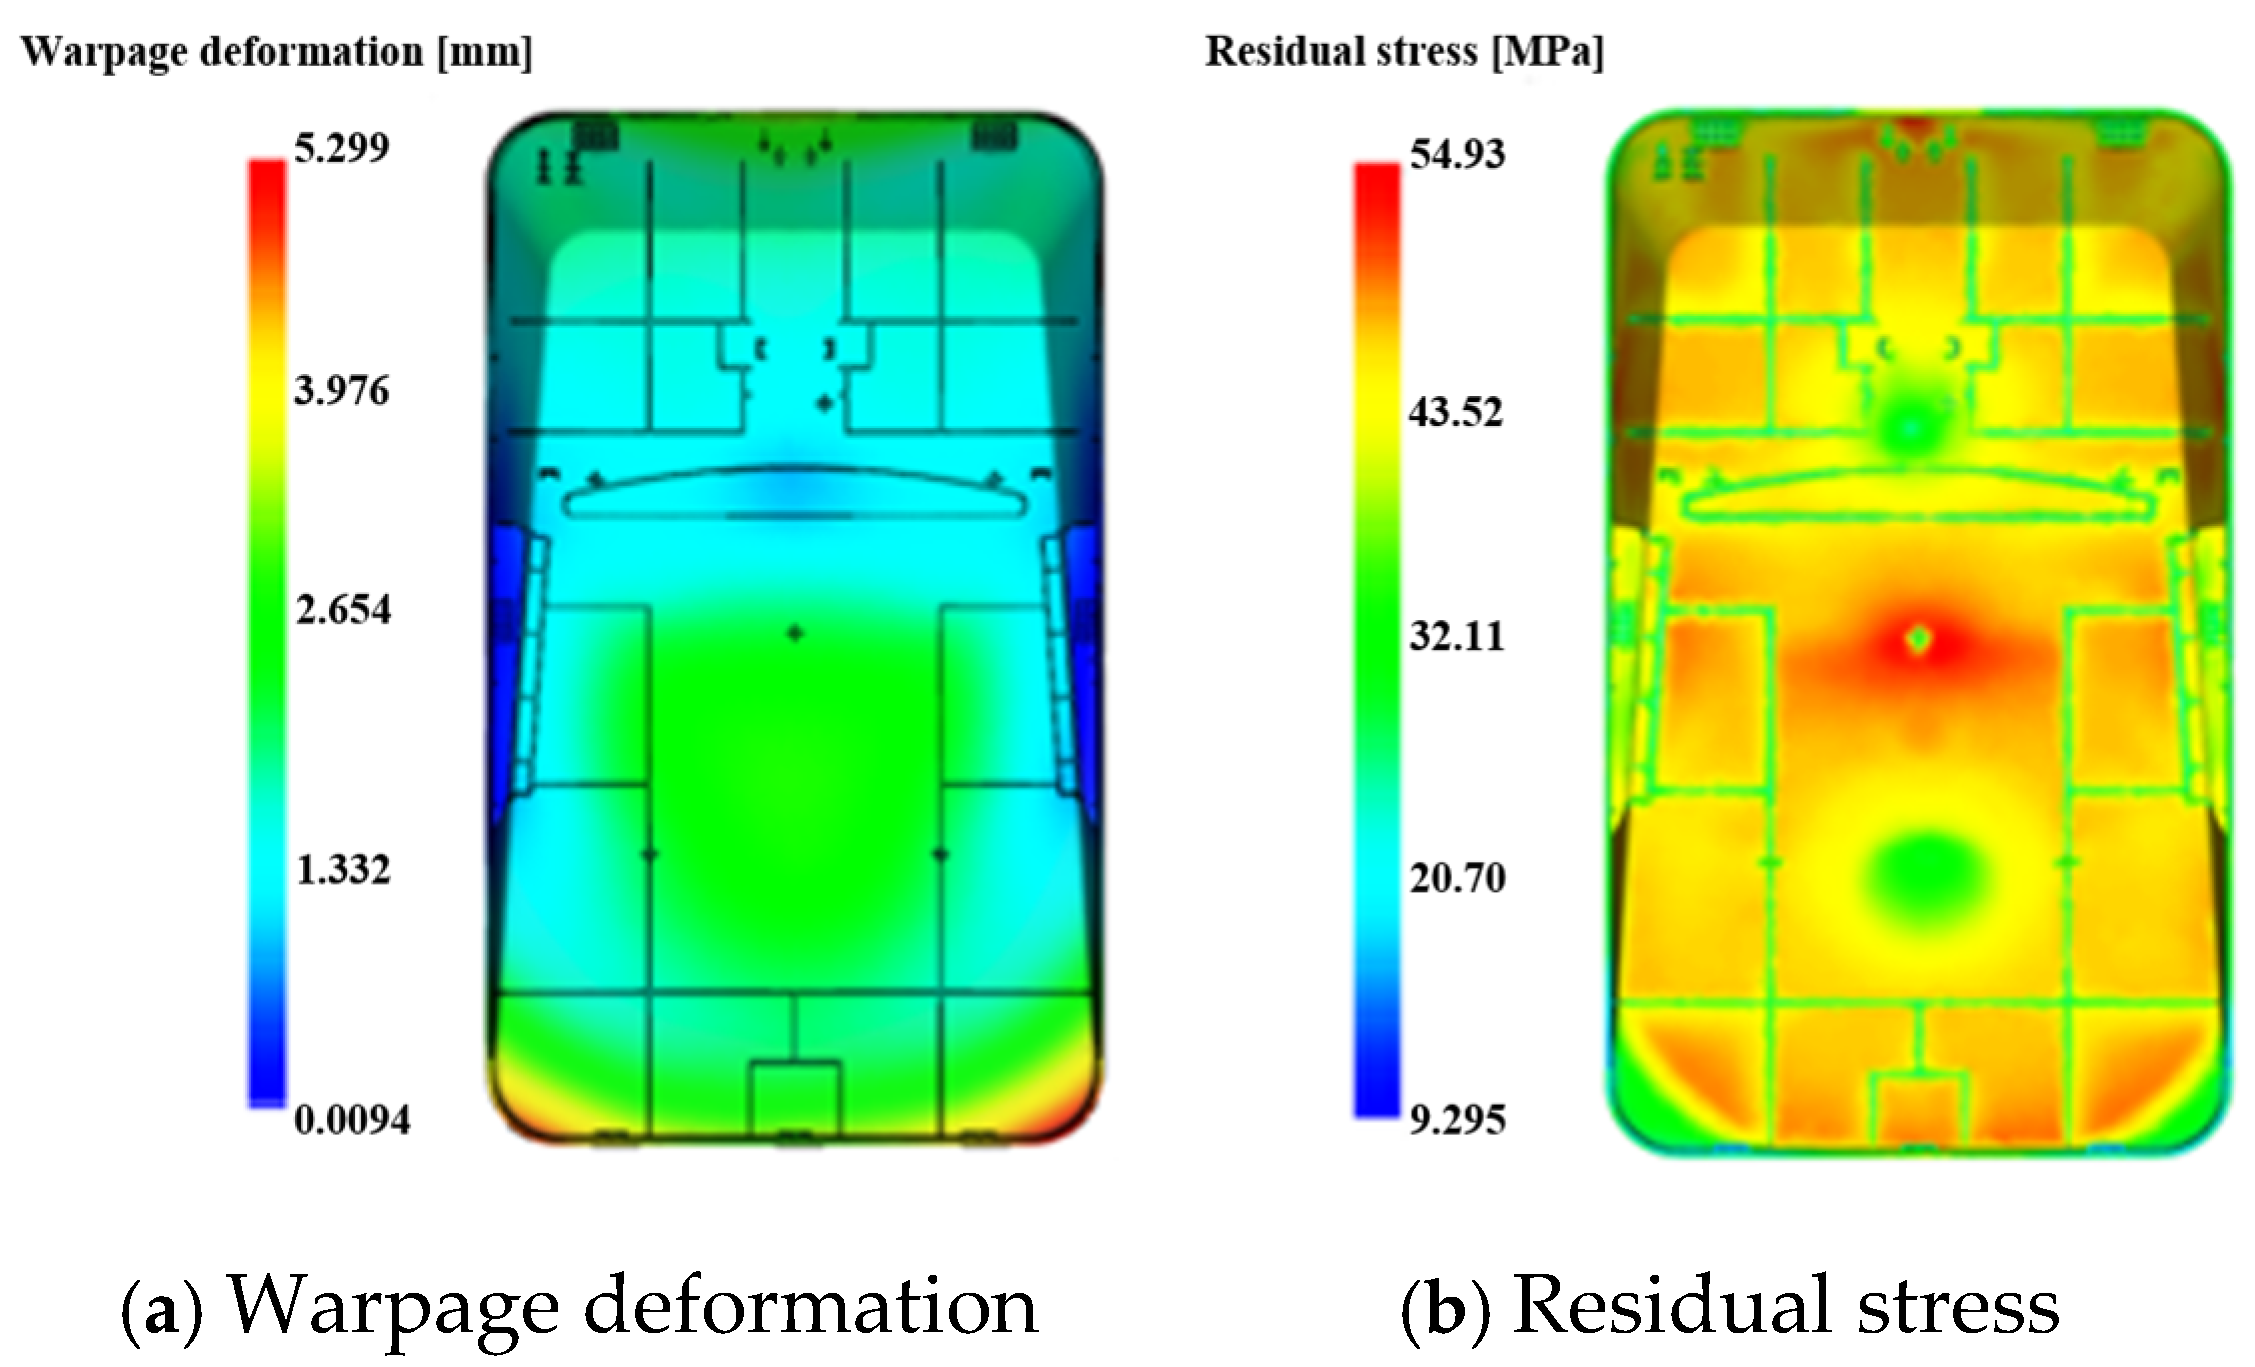
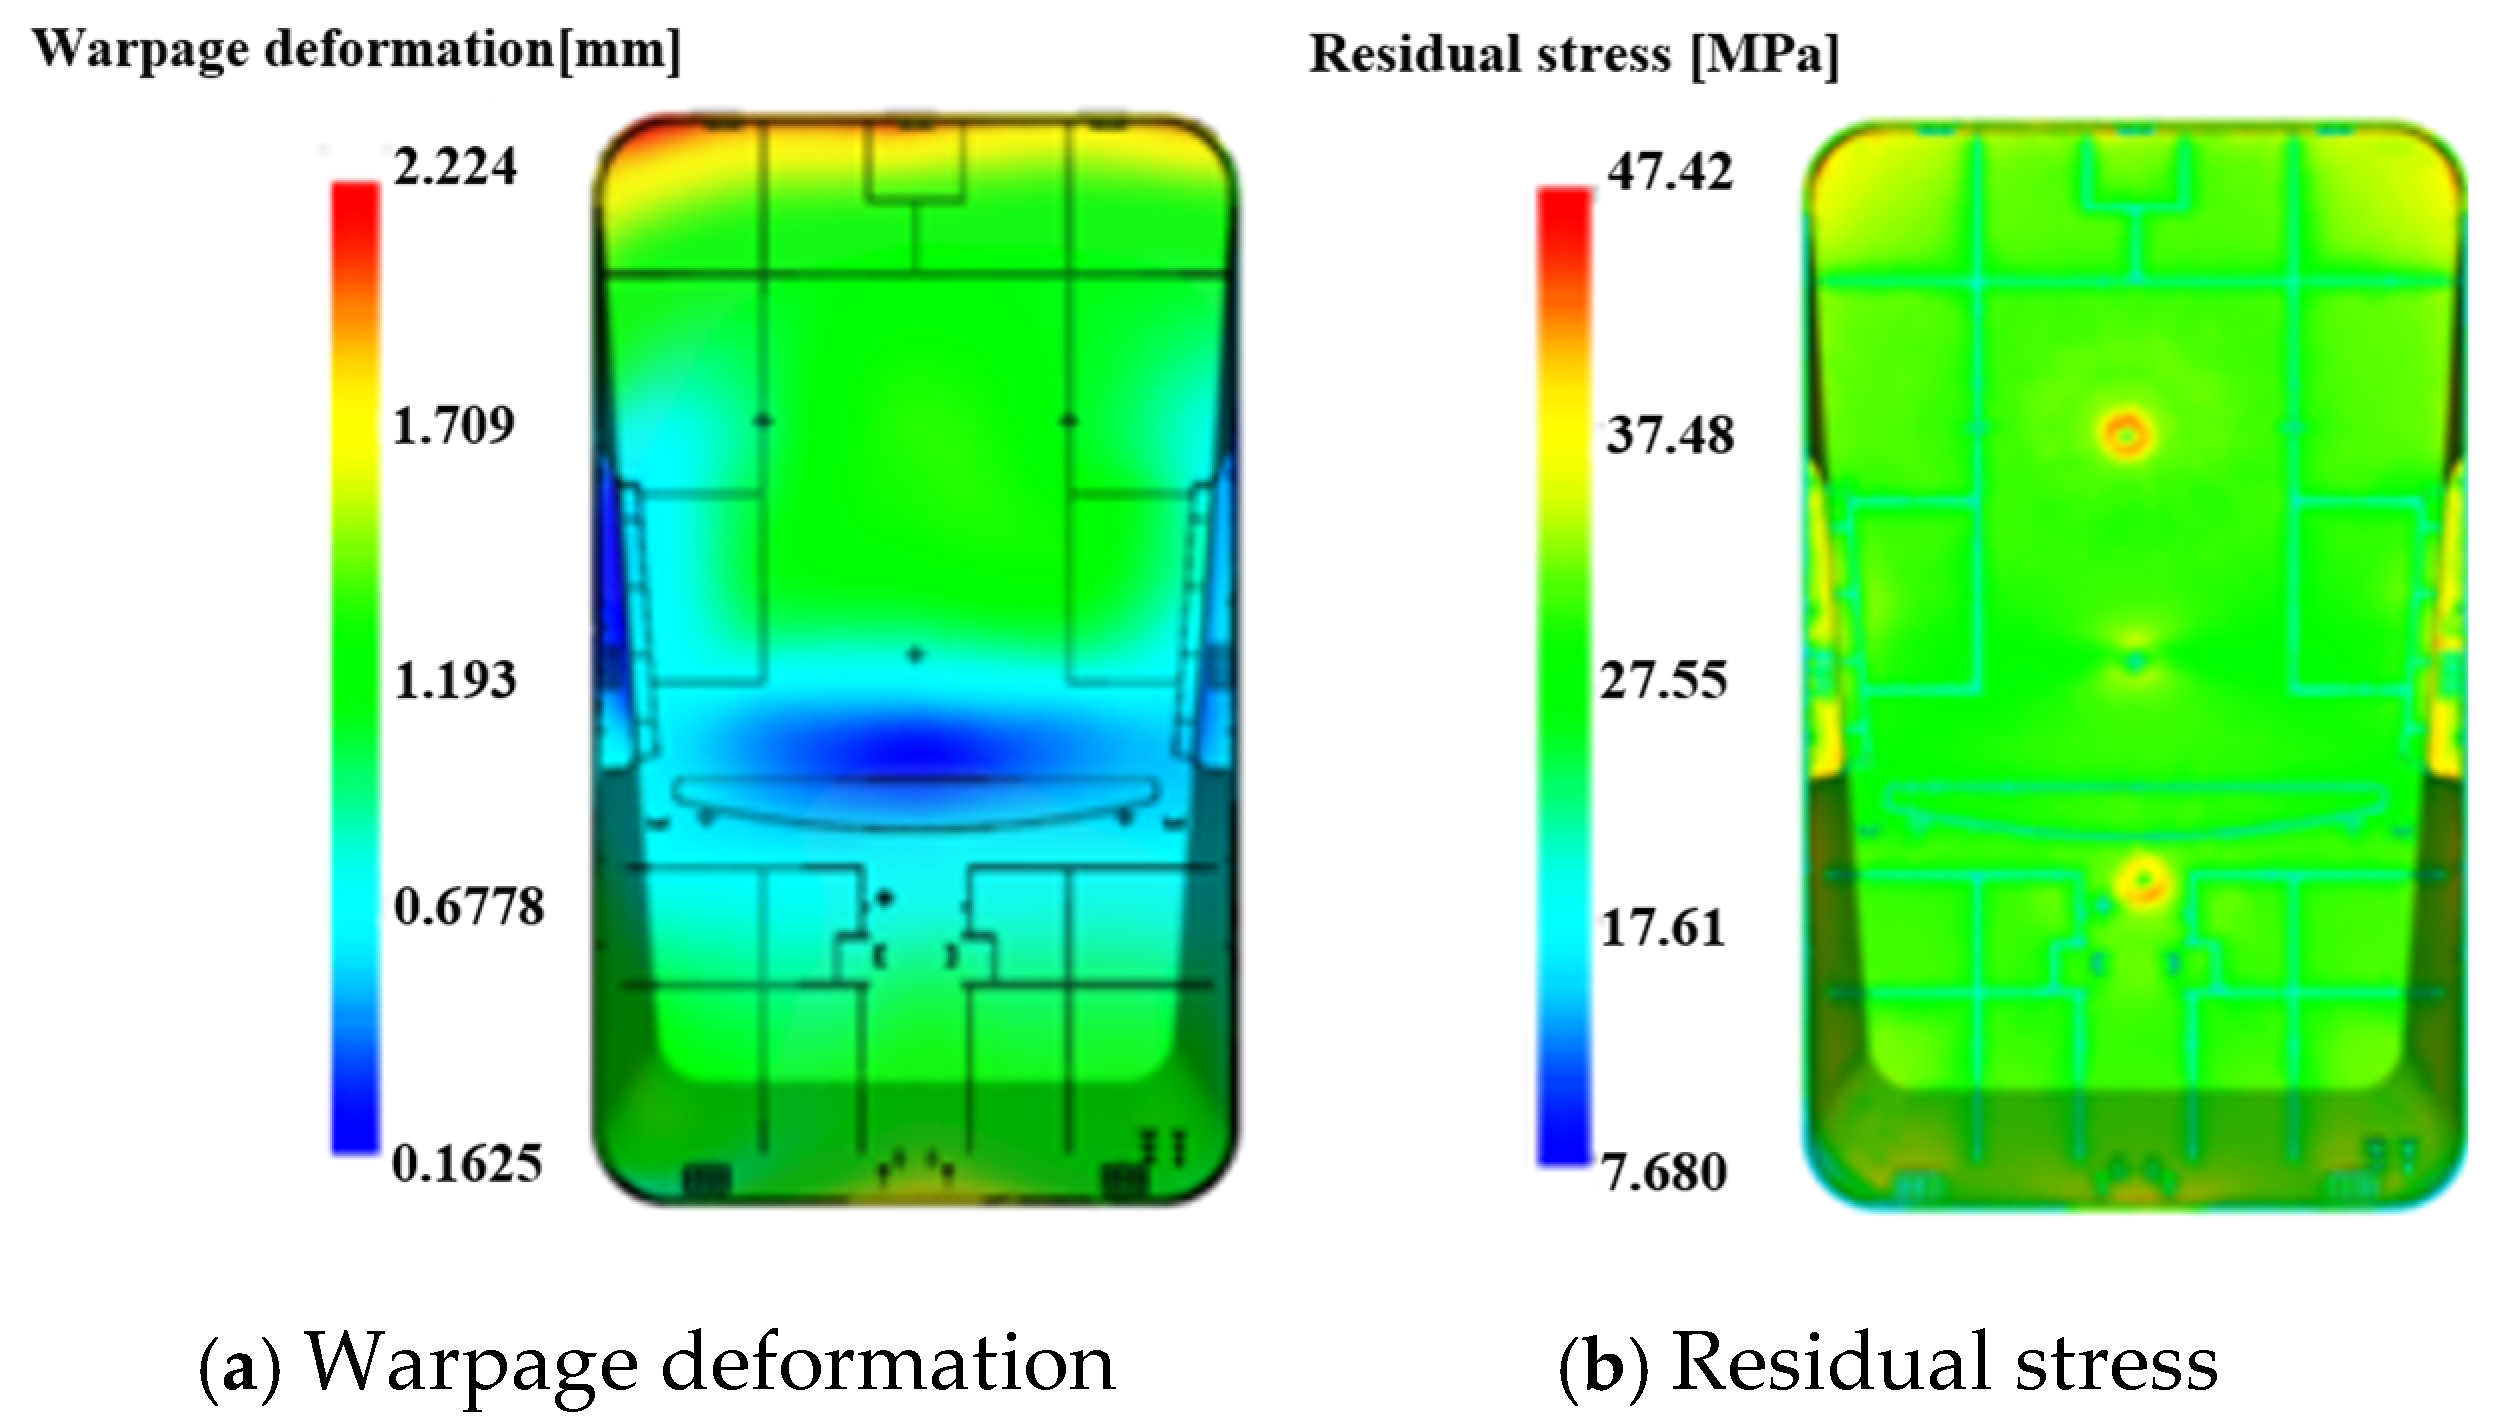
- Optimized numerical simulation verification results demonstrate that the maximum warpage deformation of the molded part under the optimal process is 2.224 mm, a 58.03% reduction compared to 5.299 mm under the initial process; the maximum residual stress is 47.42 MPa, a 13.67% reduction compared to 54.93 MPa under the initial process. Both core molding quality indexes are significantly improved and fully meet the engineering application requirements of the plastic part. The relative errors between the numerical simulation results and the algorithm-predicted values are all less than 2%, which verifies the prediction accuracy of the surrogate model and optimization algorithm.
- (4)
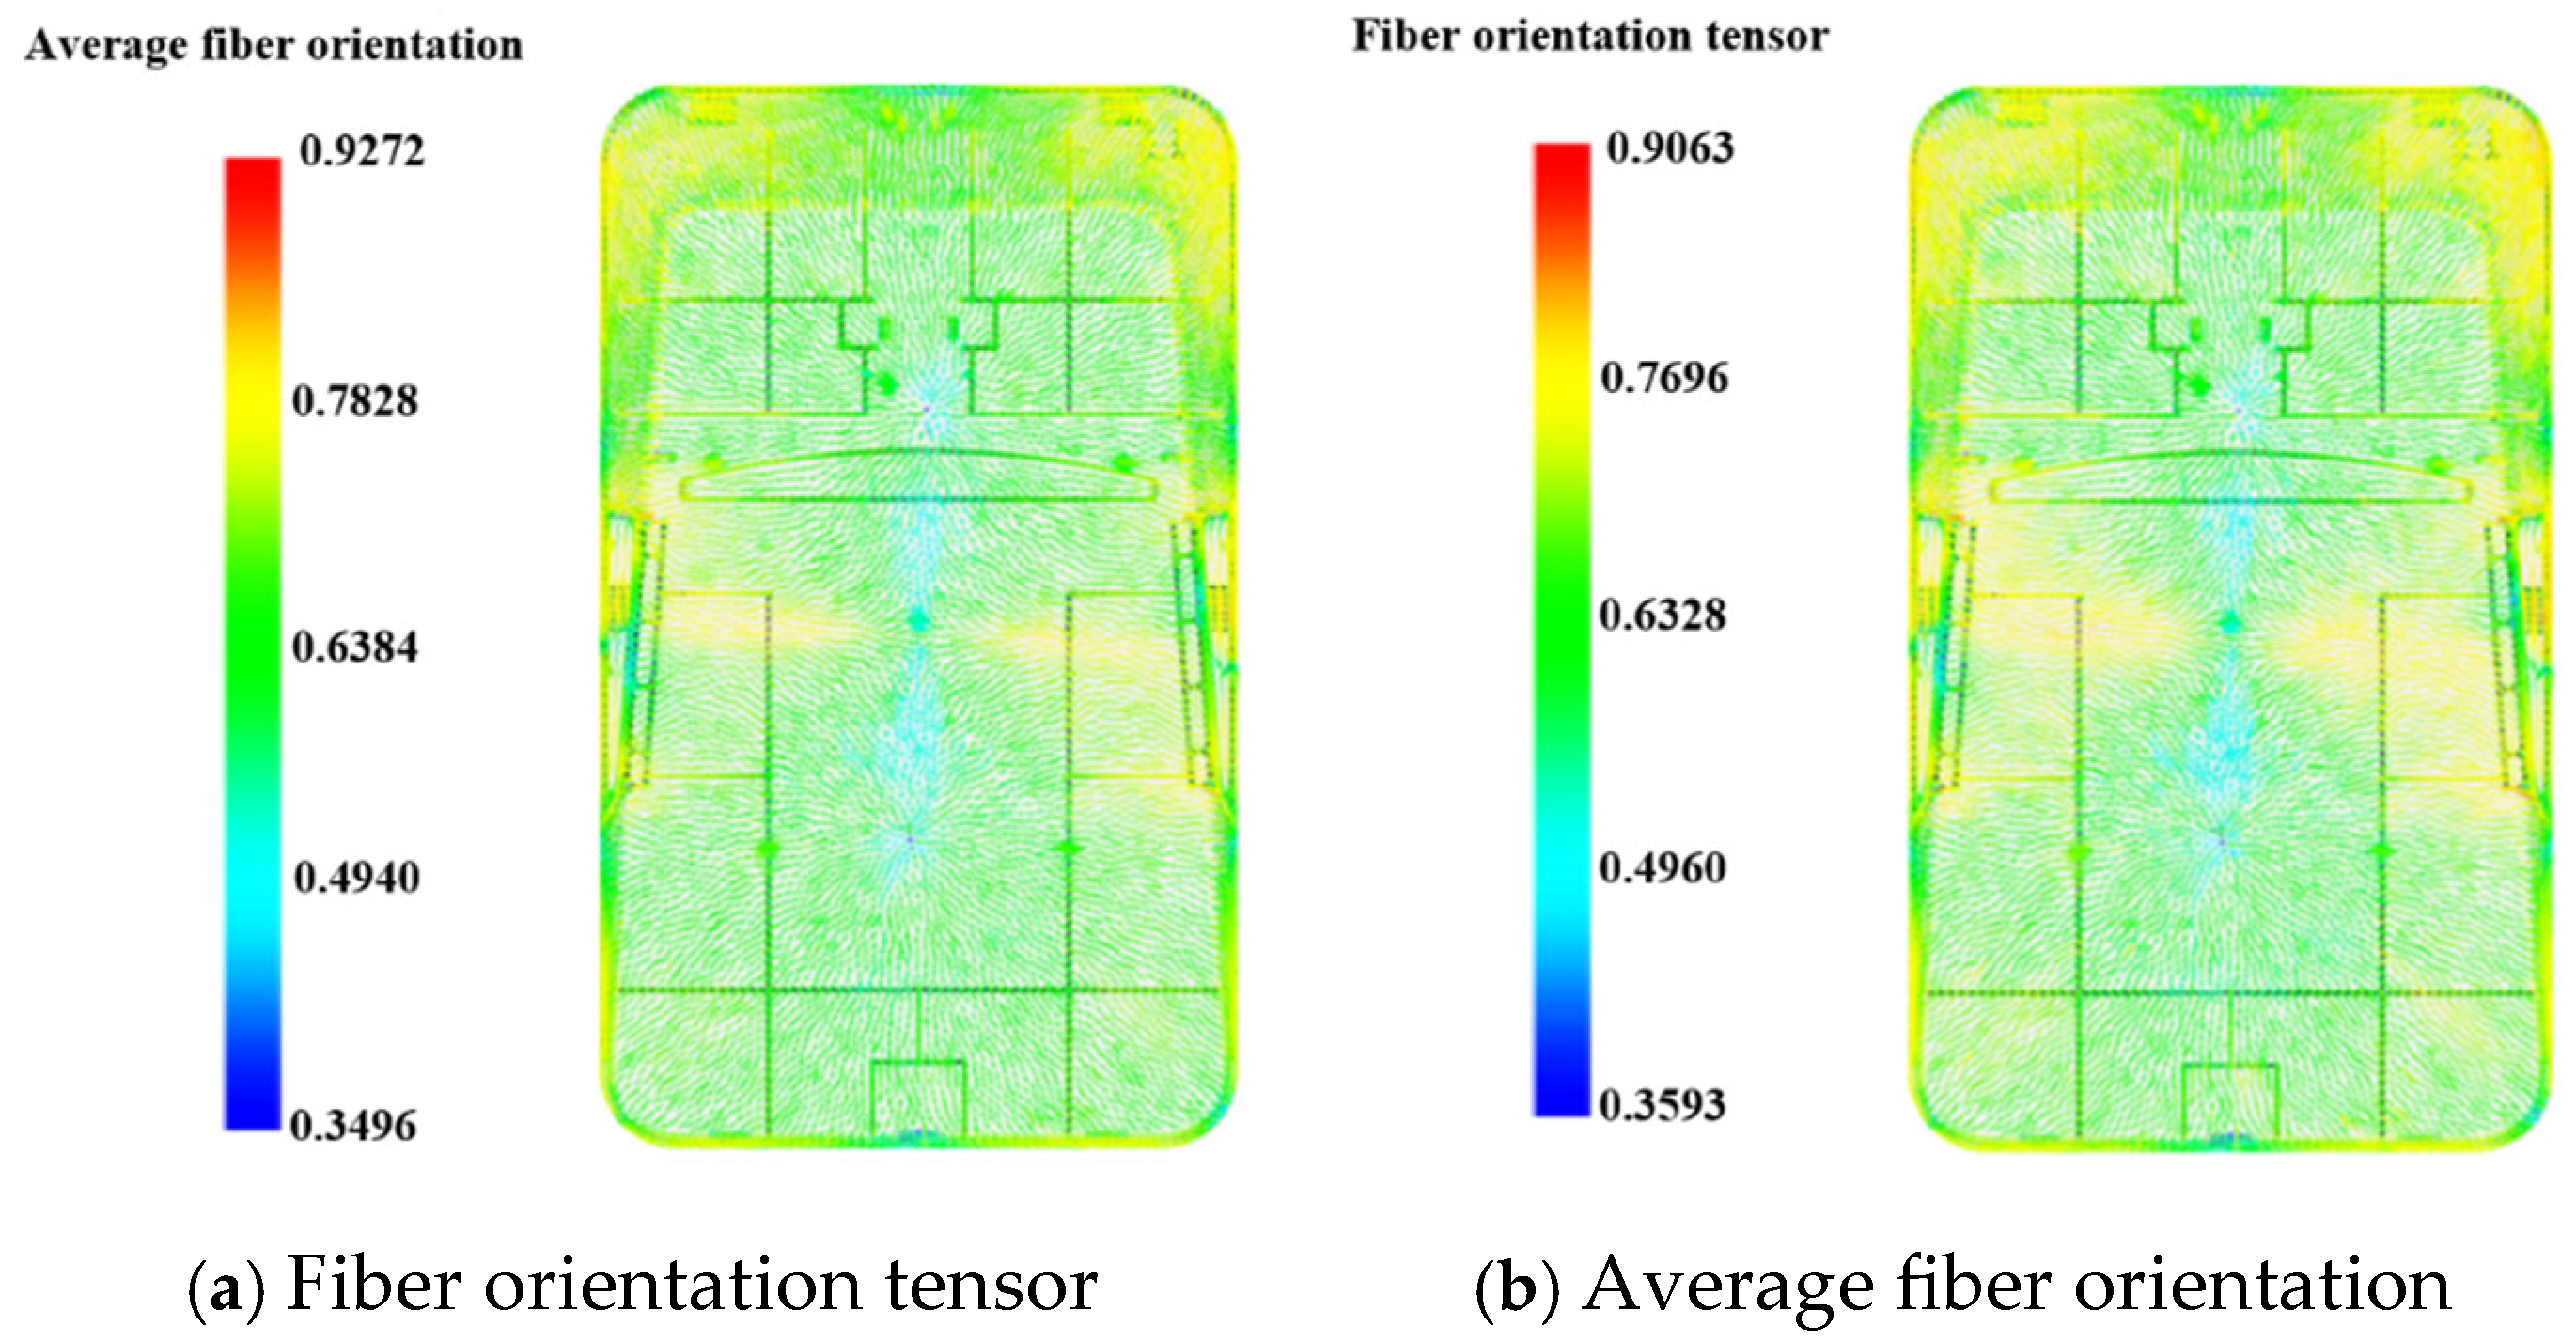
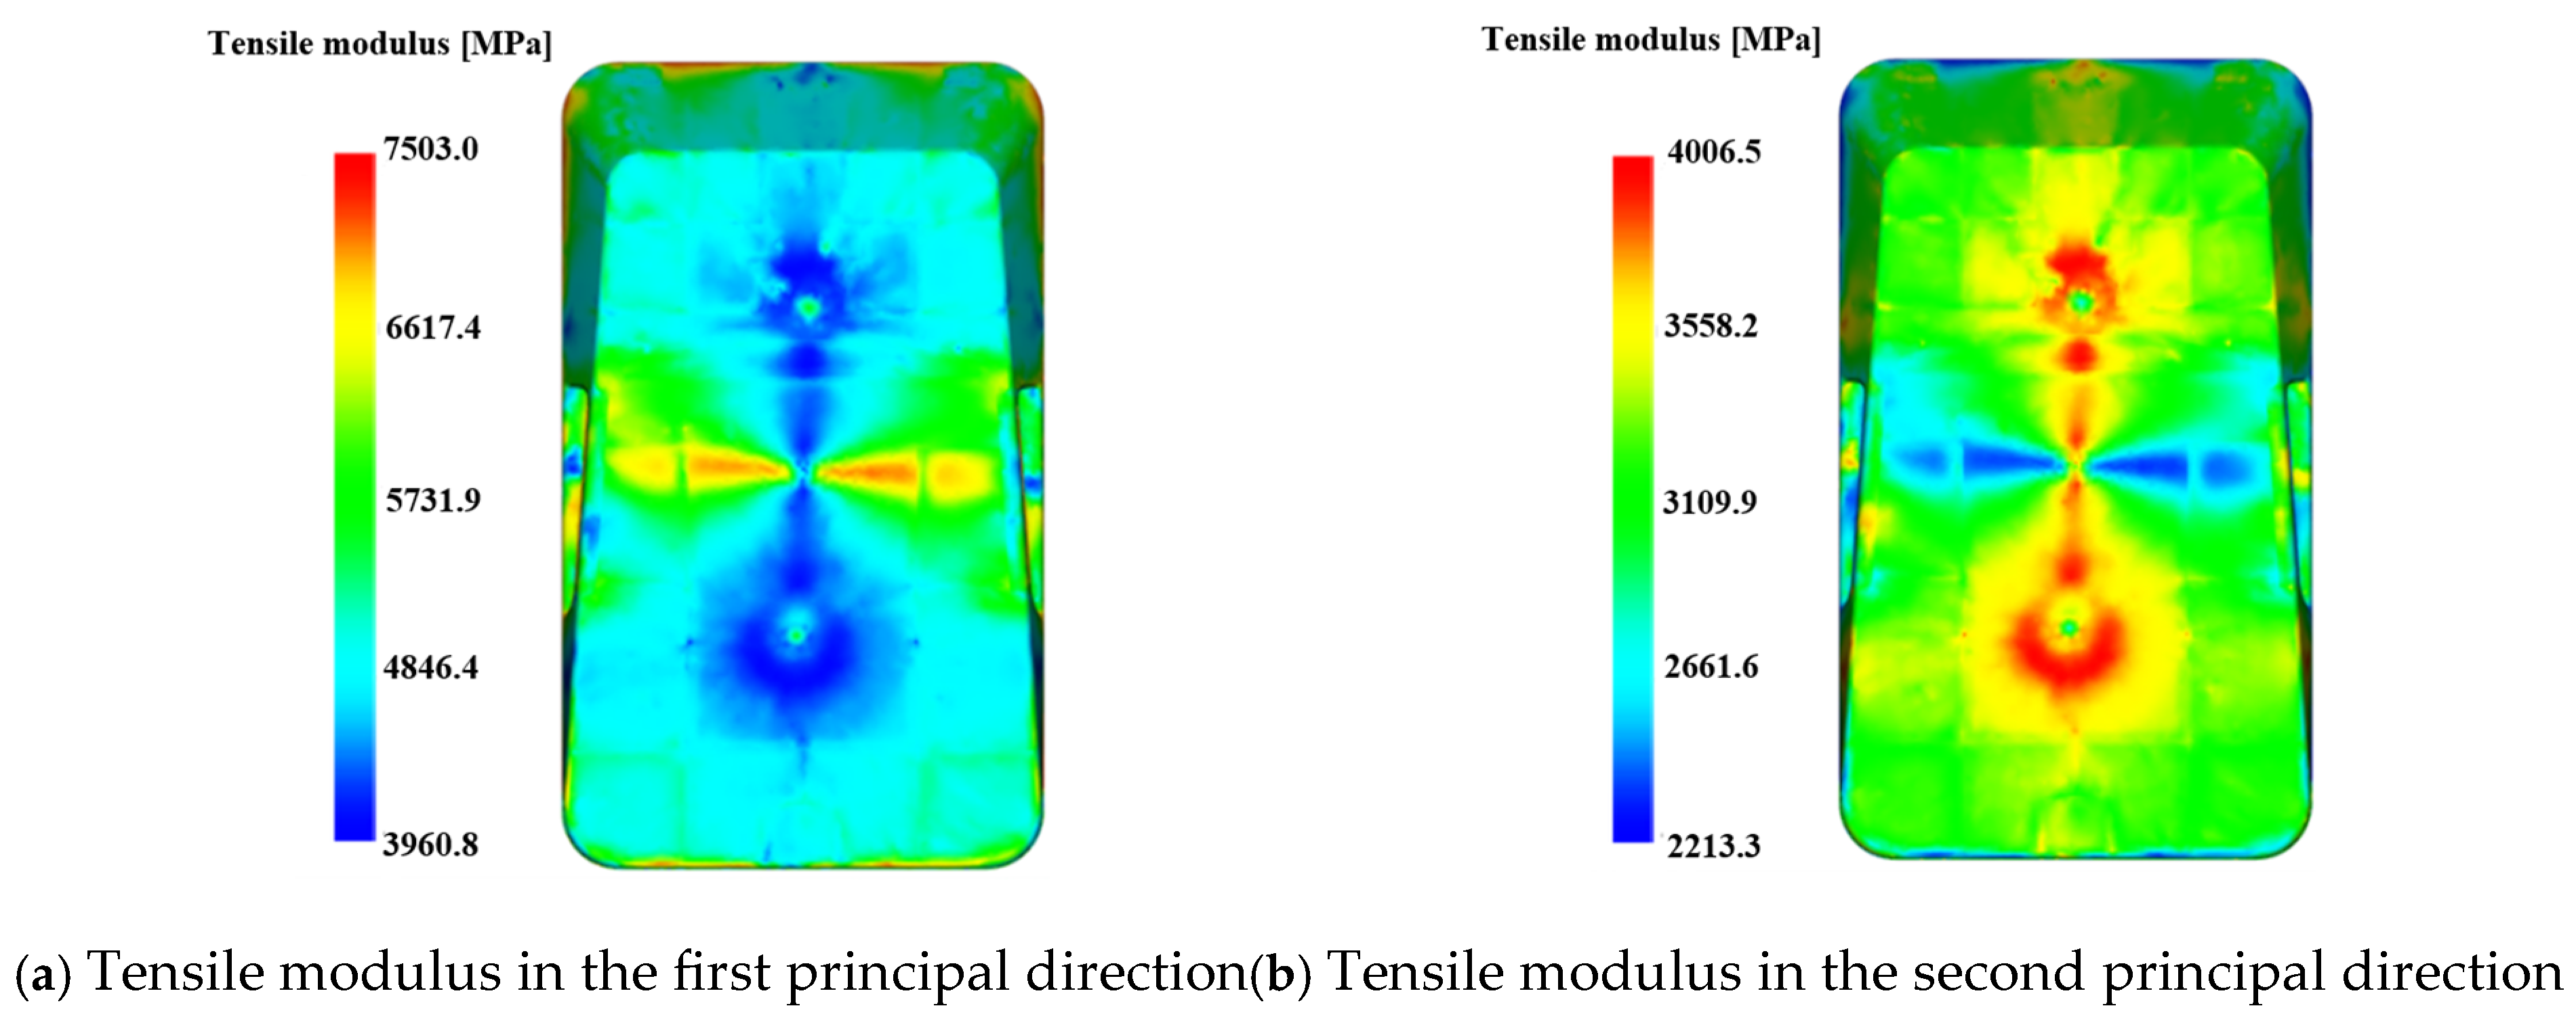
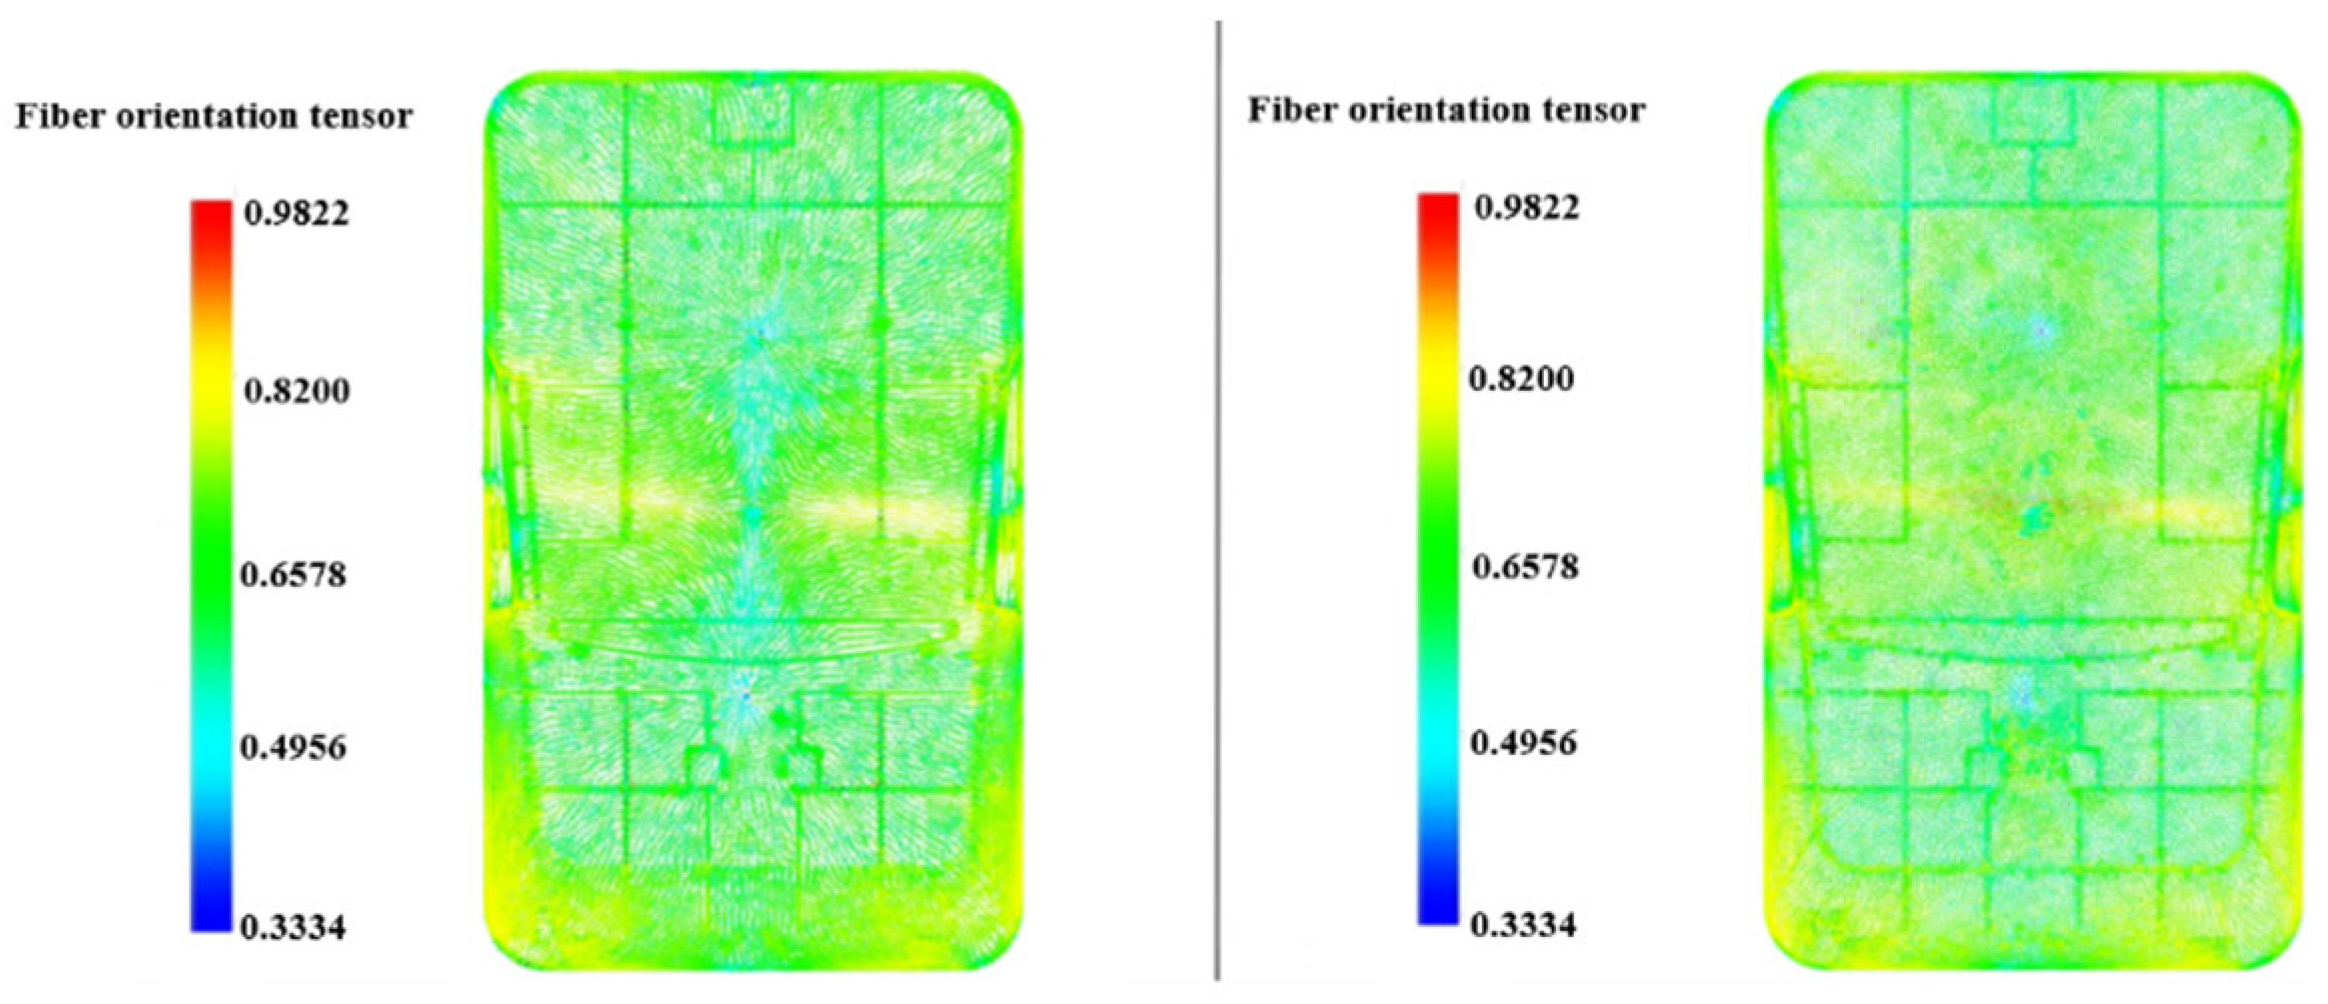
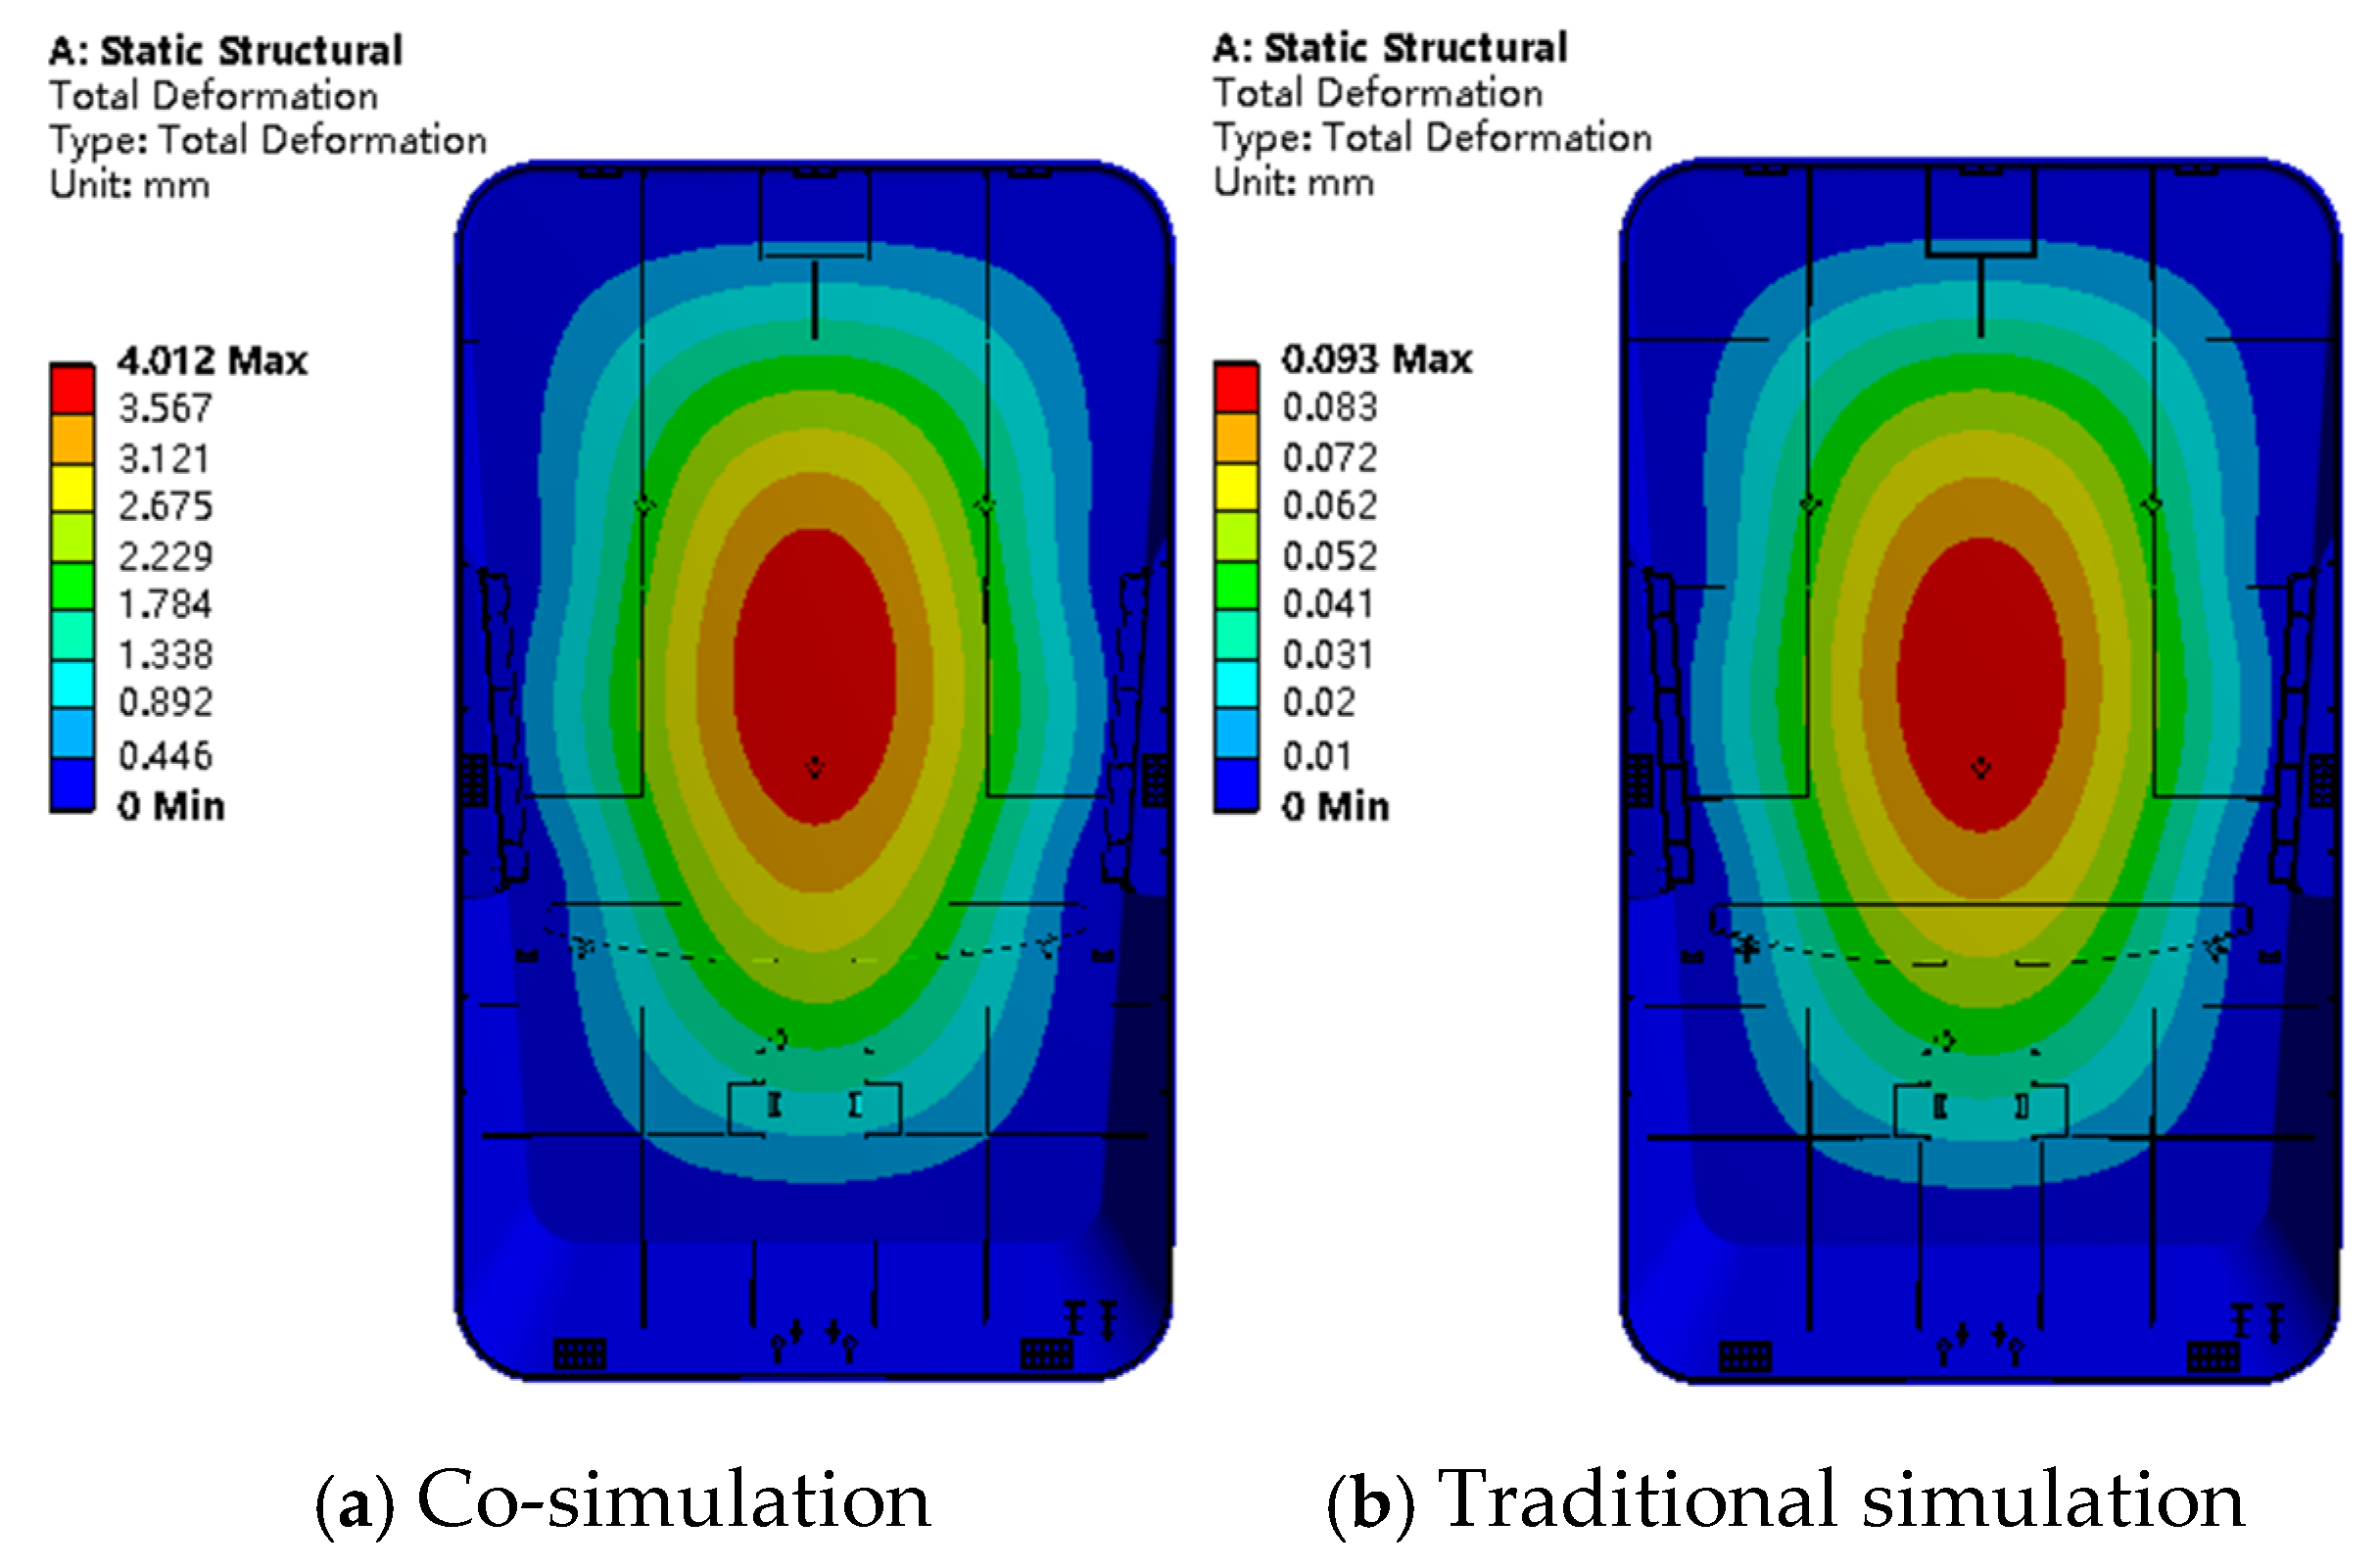
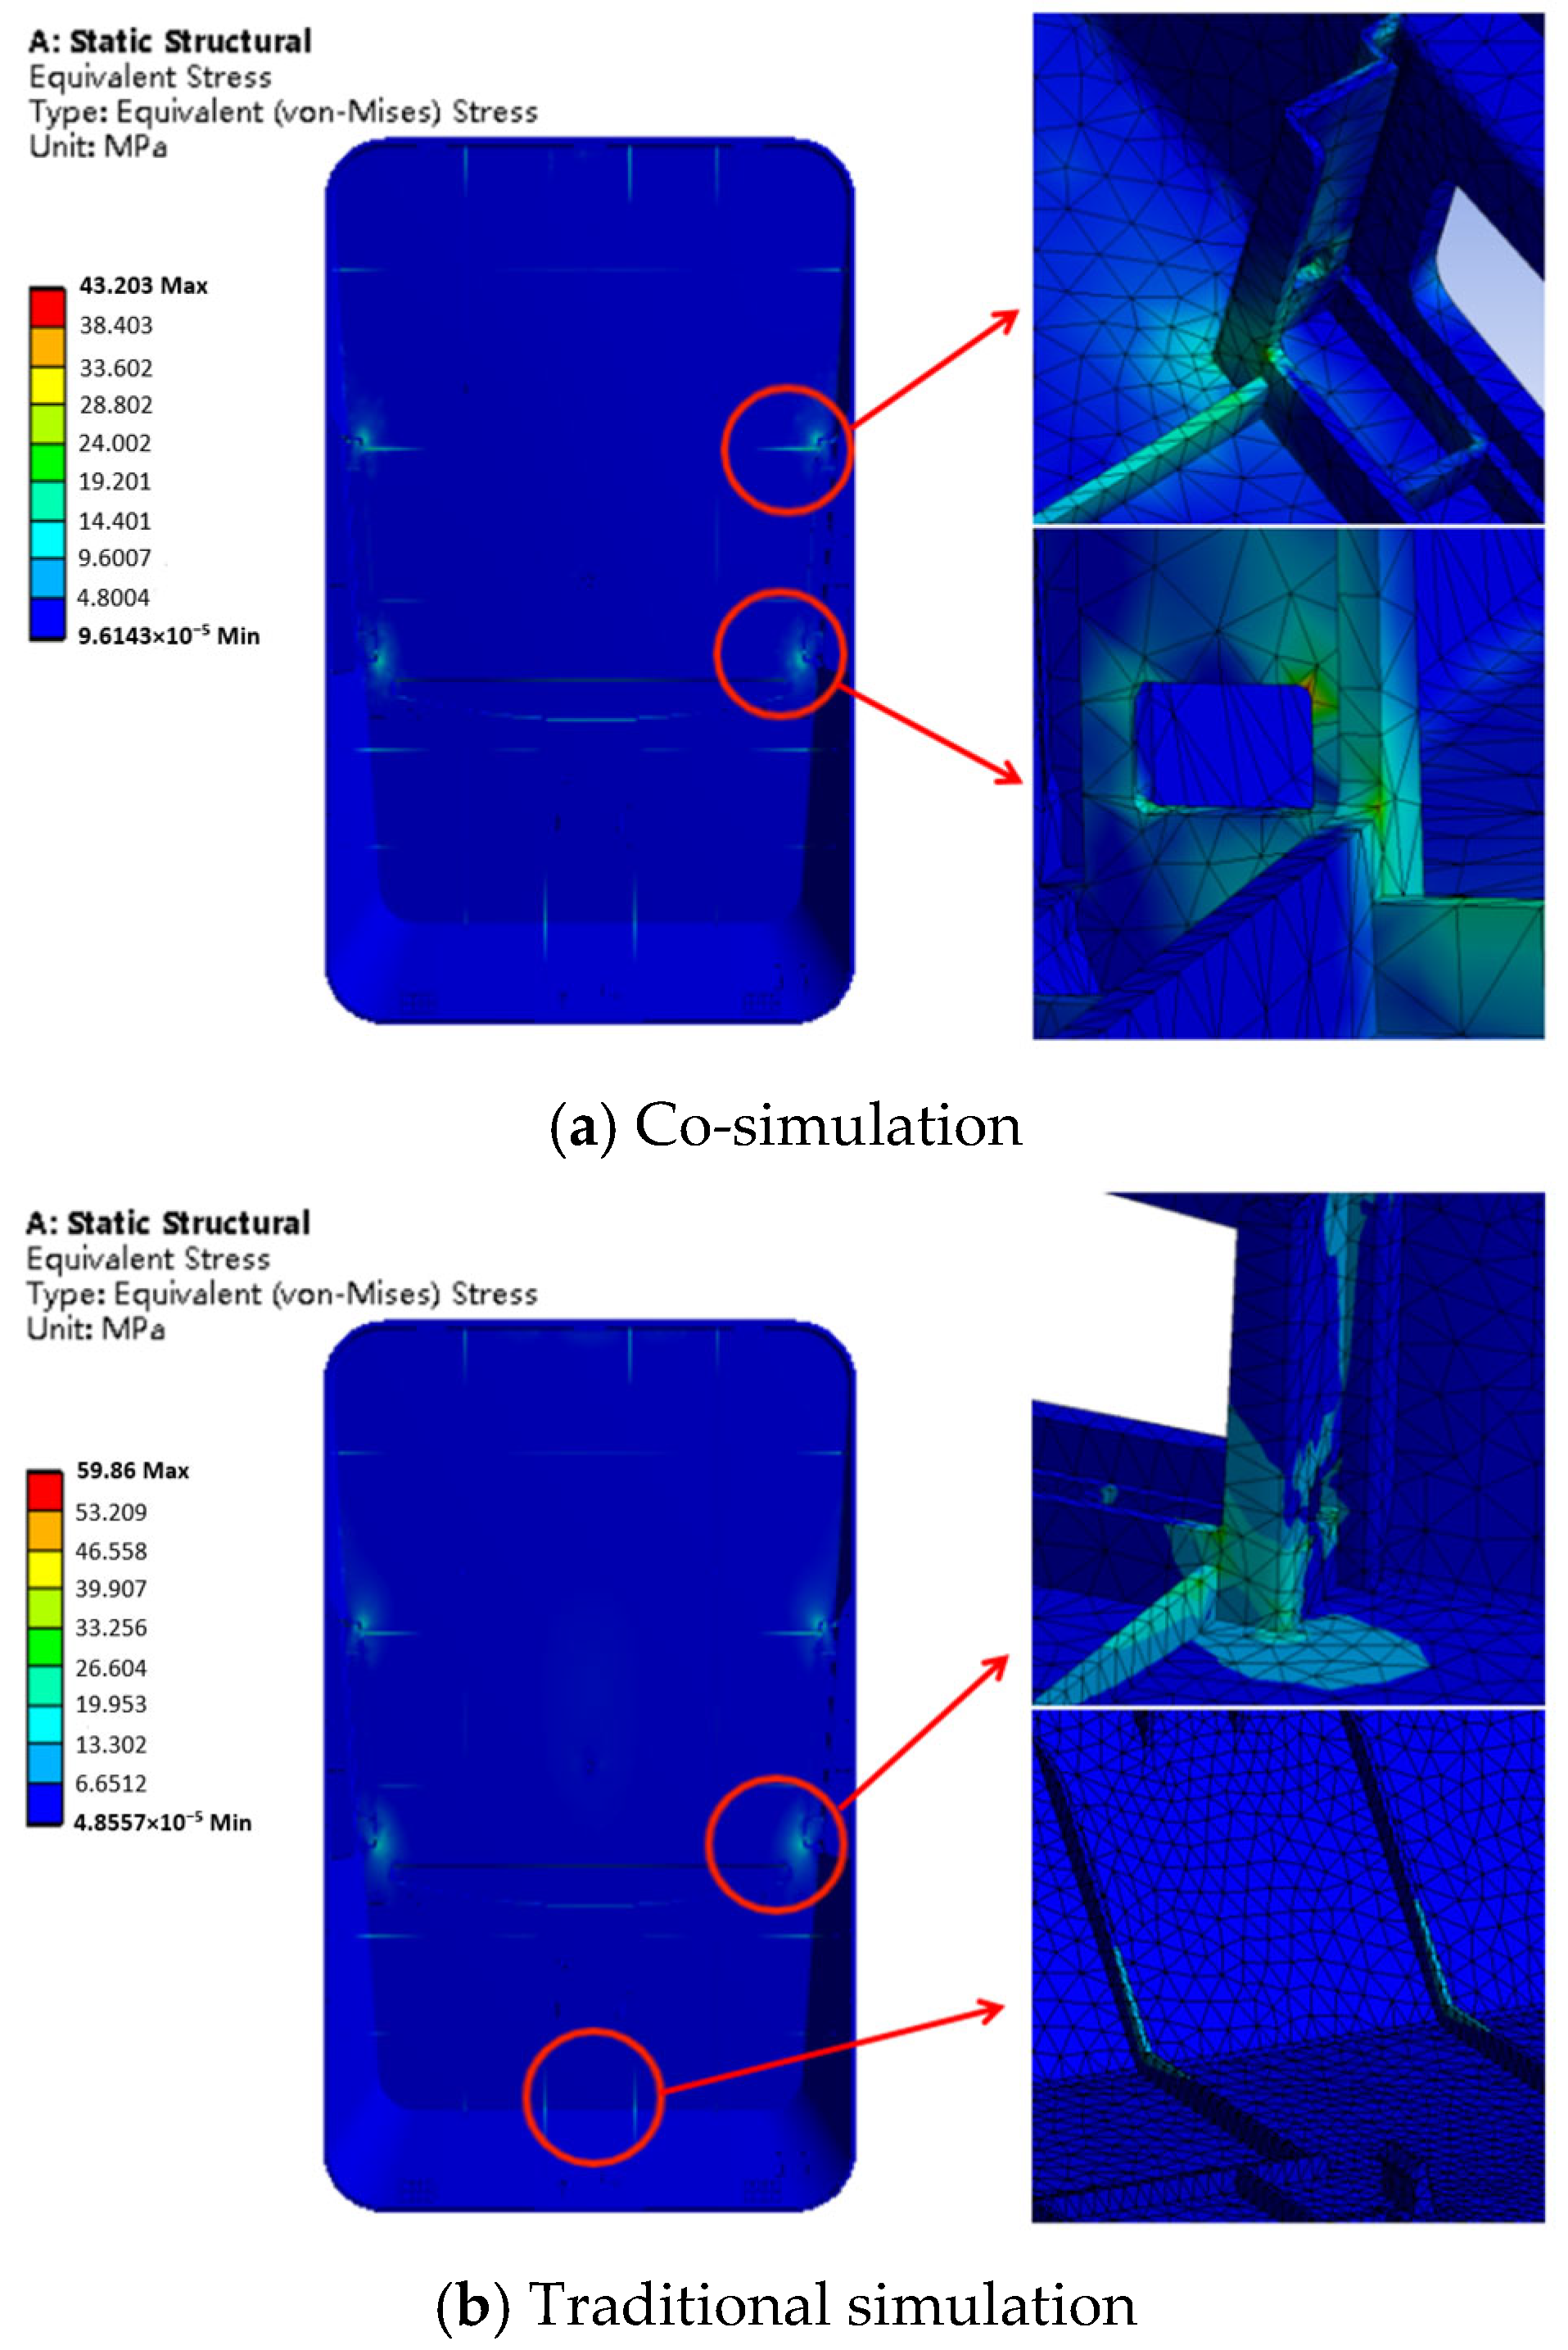
- The co-simulation results based on Moldflow-Ansys indicate that the average fiber orientation degree in the main area of the plastic part under the optimal process is about 0.7, and the average tensile modulus along the melt flow direction is 1.85 times that perpendicular to the flow direction. The material exhibits significant mechanical anisotropy, and the spatial distribution of tensile modulus is highly consistent with the fiber orientation distribution. Compared to the traditional isotropic simulation, the co-simulation considering molding history can accurately reflect the regulatory effect of fiber orientation on stress distribution and deformation behavior. The predicted maximum deformation of 4.01 mm and maximum equivalent stress of 43.20 MPa are more consistent with the actual service state of the plastic part. In addition, the deformation and stress of the plastic part under an extreme load of 150 N are far lower than the allowable thresholds, with a sufficient safety margin.
- (5)
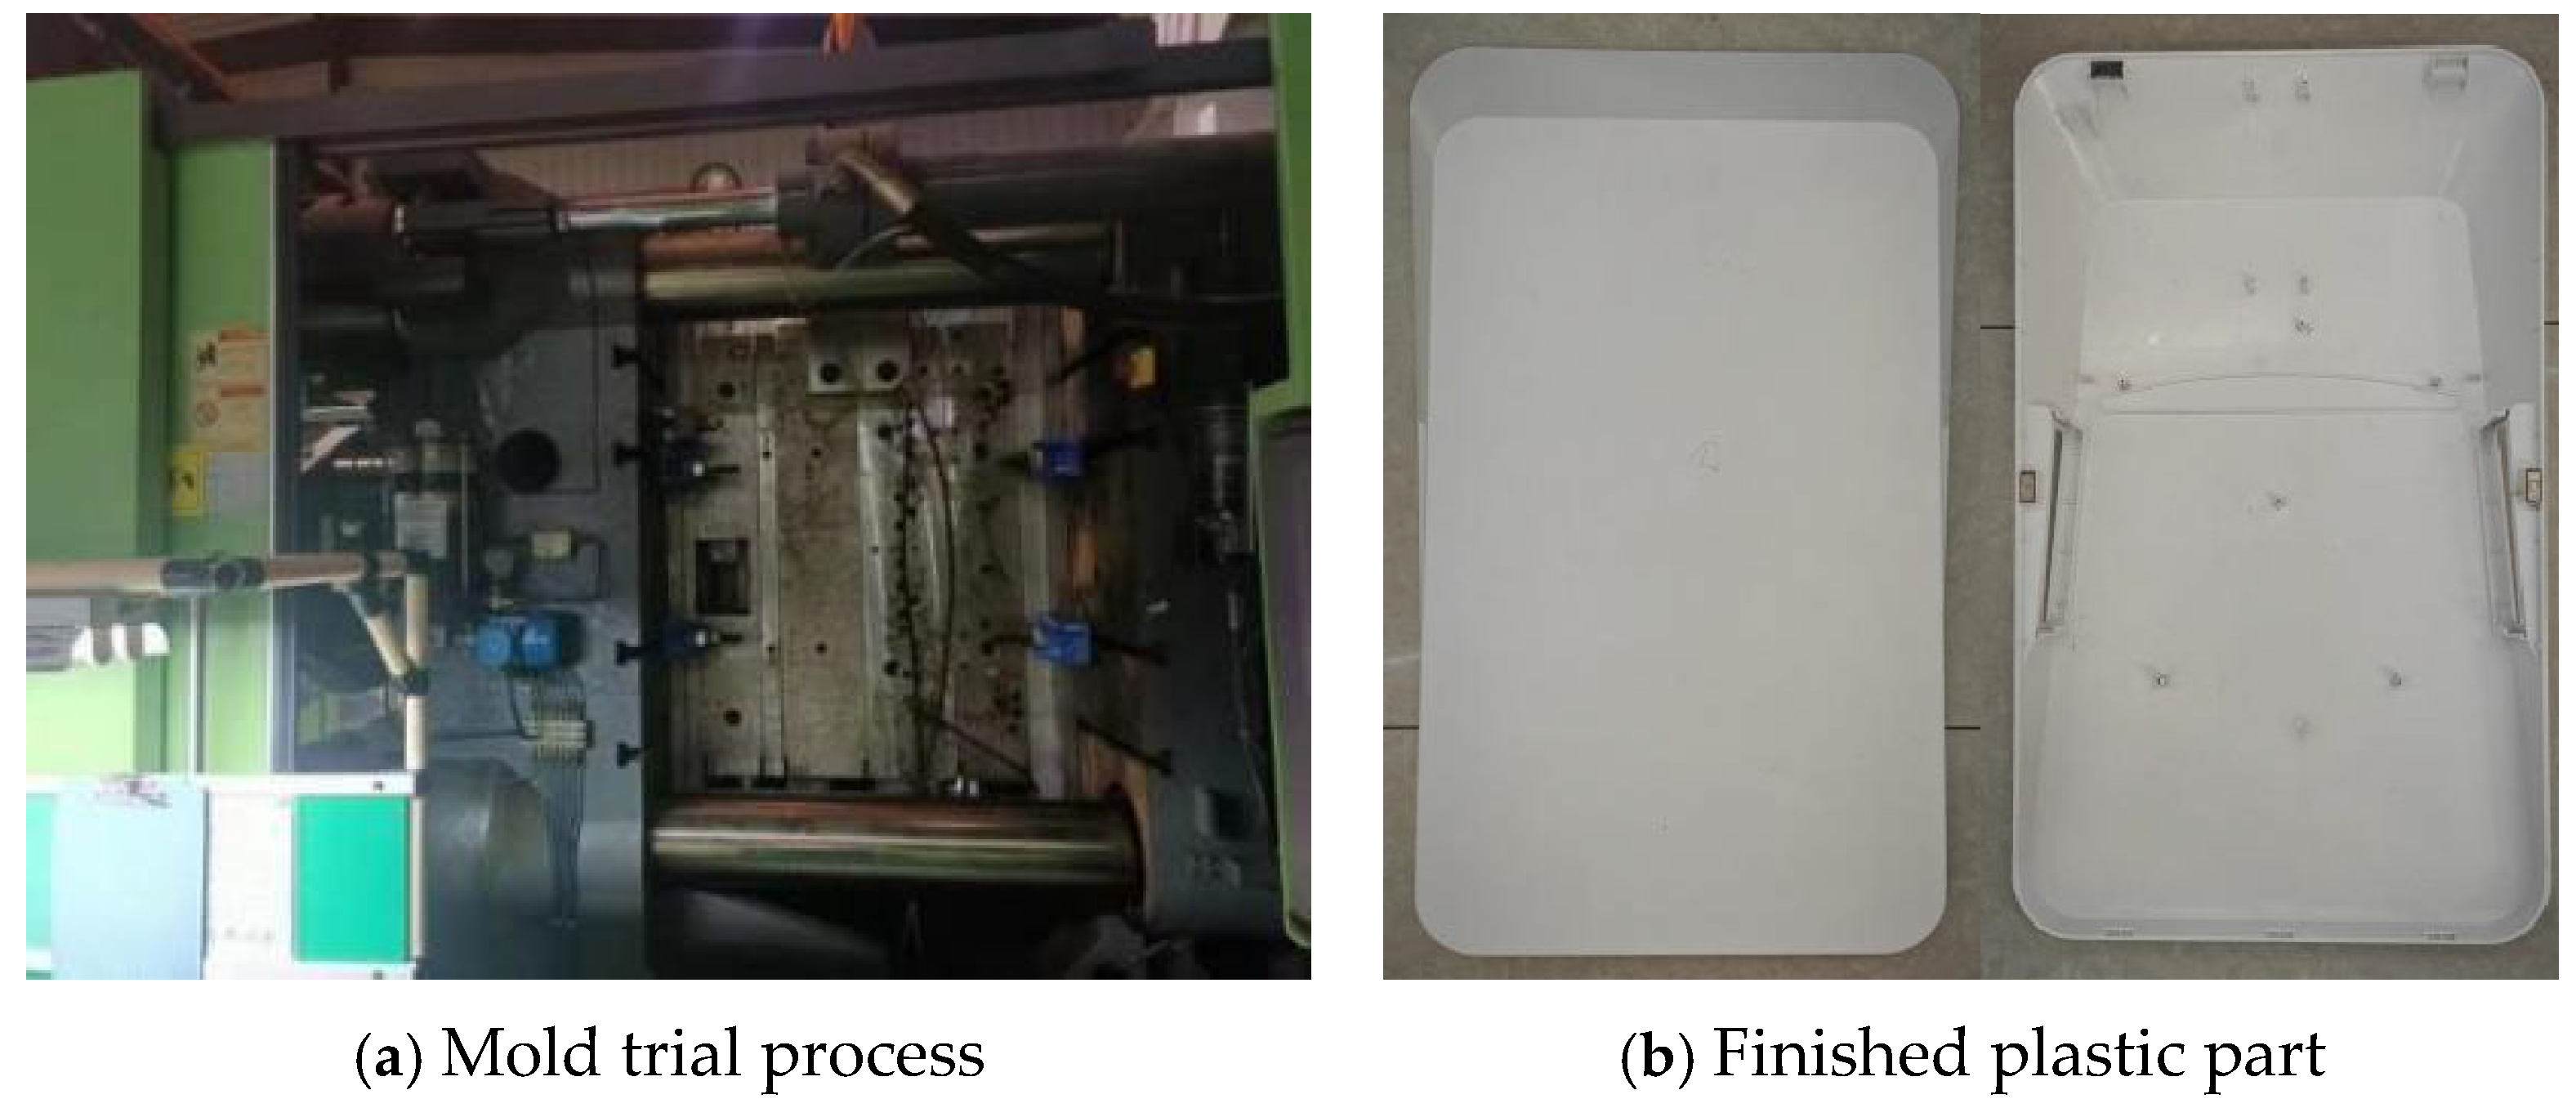
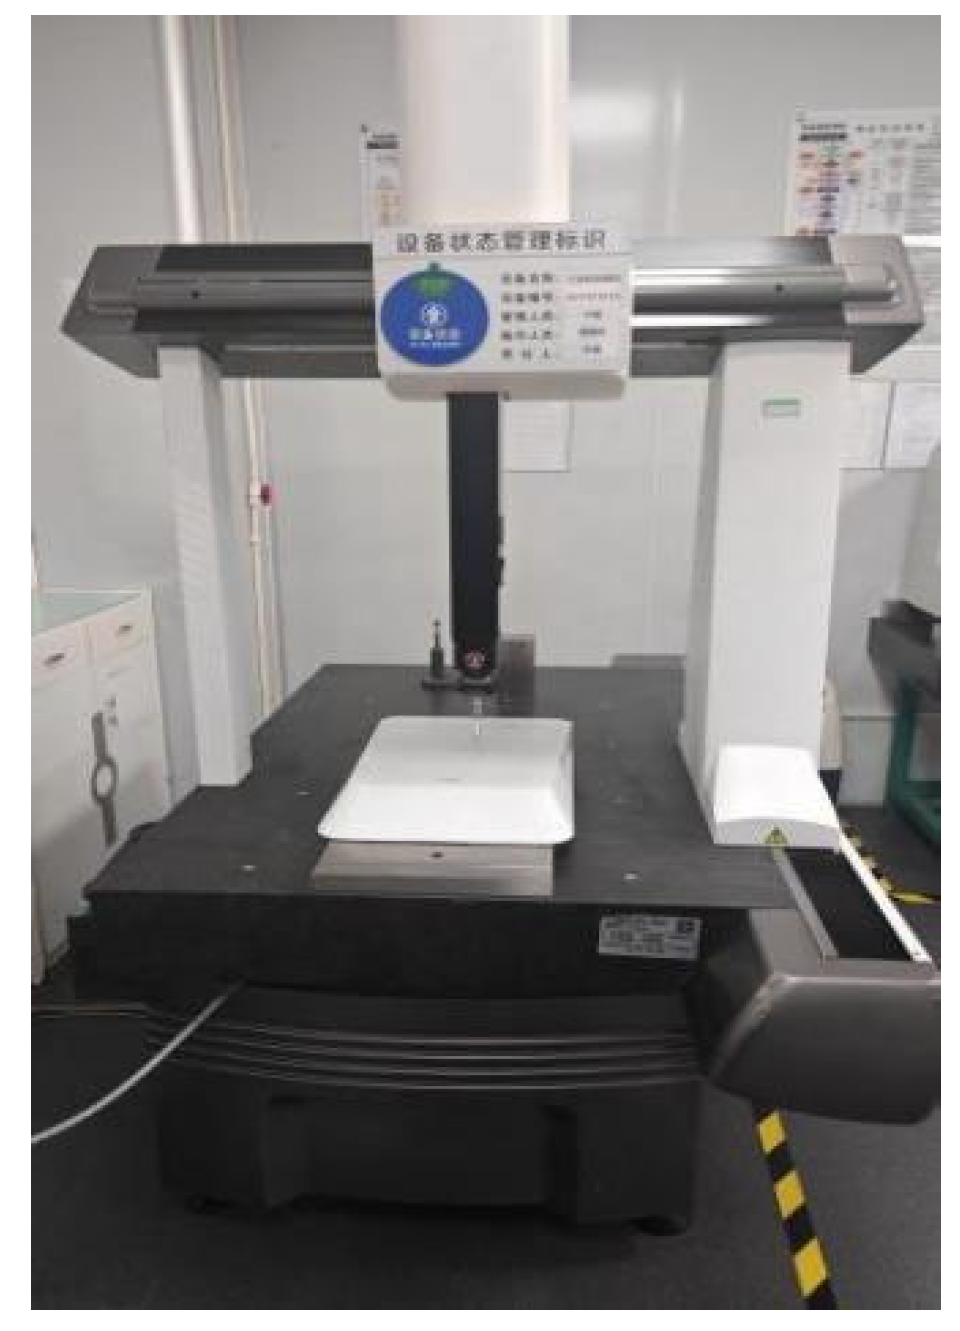
- The injection mold trial experimental results demonstrate that the fan face shell produced with the optimized process parameters has good appearance quality without obvious molding defects. The average warpage deformation of eight samples measured by a coordinate measuring machine (CMM) is 2.044 mm, with a relative error of 7.583% compared to the algorithm-predicted value, which further verifies the engineering accuracy and applicability of the process optimization method proposed in this paper.
Supplementary Materials
Author Contributions
Funding
Data Availability Statement
Conflicts of Interest
References
- Qiao, Y.; Fring, L.D.; Pallaka, M.R.; Simmons, K.L. A review of the fabrication methods and mechanical behavior of continuous thermoplastic polymer fiber-thermoplastic polymer matrix composites. Polym. Compos. 2023, 44, 694–733. [Google Scholar] [CrossRef]
- Han, S. Optimization of plastic speed meter housing for automobiles: Injection molding simulation, Taguchi method and machine learning. Mater. Plast. 2023, 60, 58–72. [Google Scholar] [CrossRef]
- Cao, P.; Xie, J.Z.; Ma, Y.T.; Zhao, B.; Yang, W.M.; Xie, P.C. Emerging approaches to process control in injection molding: A comprehensive review. Int. J. Adv. Manuf. Technol. 2025, 140, 4483–4502. [Google Scholar] [CrossRef]
- Gaspar-Cunha, A.; Melo, J.; Marques, T.; Pontes, A. A review on injection molding: Conformal cooling channels, modelling, surrogate models and multi-objective optimization. Polymers 2025, 17, 919. [Google Scholar] [CrossRef]
- Zhao, N.Y.; Lian, J.Y.; Wang, P.F.; Xu, Z.B. Recent progress in minimizing the warpage and shrinkage deformations by the optimization of process parameters in plastic injection molding: A review. Int. J. Adv. Manuf. Technol. 2022, 120, 85–101. [Google Scholar] [CrossRef]
- Zhao, P.; Zhang, J.F.; Dong, Z.Y.; Huang, J.Y.; Zhou, H.W.; Fu, J.Z.; Turng, L.S. Intelligent Injection Molding on Sensing, Optimization, and Control. Adv. Polym. Technol. 2020, 2020, 7023616. [Google Scholar] [CrossRef]
- Wilczynski, K.; Narowski, P. A strategy for problem solving of filling imbalance in geometrically balanced injection molds. Polymers 2020, 12, 805. [Google Scholar] [CrossRef]
- Azdast, T.; Hasanzadeh, R. Experimental assessment and optimization of shrinkage behavior of injection molded polycarbonate parts. Mater. Res. Express 2020, 6, 115334. [Google Scholar] [CrossRef]
- Nguyen, T.K.; Hwang, C.J.; Lee, B.K. Numerical investigation of warpage in insert injection-molded lightweight hybrid products. Int. J. Precis. Eng. Man. 2017, 18, 187–195. [Google Scholar] [CrossRef]
- Chuang, M.T.; Yang, Y.K.; Hsiao, Y.H. Modeling and optimization of injection molding process parameters for thin-shell plastic parts. Polym.-Plast. Technol. Eng. 2009, 48, 745–753. [Google Scholar] [CrossRef]
- Berti, G.; Monti, M. A virtual prototyping environment for a robust design of an injection moulding process. Comput. Chem. Eng. 2013, 54, 159–169. [Google Scholar] [CrossRef]
- Tzeng, C.J.; Yang, Y.K.; Lin, Y.H.; Tsai, C.H. A study of optimization of injection molding process parameters for SGF and PTFE reinforced PC composites using neural network and response surface methodology. Int. J. Adv. Manuf. Technol. 2012, 63, 691–704. [Google Scholar] [CrossRef]
- Li, K.; Yan, S.L.; Zhong, Y.C.; Pan, W.F.; Zhao, G. Multi-objective optimization of the fiber-reinforced composite injection molding process using Taguchi method, RSM, and NSGA-II. Simul. Model. Pract. Theory 2019, 91, 69–82. [Google Scholar] [CrossRef]
- Zhao, G.; Li, K. Undeterministic analysis and process optimization for short-fiber composite injection molding. Mater. Chem. Phys. 2022, 289, 126470. [Google Scholar] [CrossRef]
- Tian, M.S.; Gong, X.Y.; Yin, L.; Li, H.Z.; Ming, W.Y.; Zhang, Z.; Chen, J.H. Multi-objective optimization of injection molding process parameters in two stages for multiple quality characteristics and energy efficiency using Taguchi method and NSGA-II. Int. J. Adv. Manuf. Technol. 2017, 89, 241–254. [Google Scholar] [CrossRef]
- Wu, W.Q.; He, X.S.; Li, B.B.; Shan, Z.Y. An effective shrinkage control method for tooth profile accuracy improvement of micro-injection-molded small-module plastic gears. Polymers 2022, 14, 3114. [Google Scholar] [CrossRef]
- Isaincu, A.; Dan, M.; Ungureanu, V.; Maravina, L. Numerical investigation on the influence of fiber orientation mapping procedure to the mechanical response of short-fiber reinforced composites using Moldflow, Digimat and Ansys software. Mater. Today Proc. 2021, 45, 4304–4309. [Google Scholar] [CrossRef]
- Chai, W.; Liu, X.; Shan, Y.; Wan, X.; Jiang, E. Research on simulation of the bending fatigue test of automotive wheel made of long glass fiber reinforced thermoplastic considering anisotropic property. Adv. Eng. Softw. 2018, 116, 1–8. [Google Scholar] [CrossRef]
- Chen, Z.M.; Guo, P.C.; Tan, L.J.; Ye, T.; Li, L.X. Process-structure co-optimization of glass fiber-reinforced polymer automotive front-end module. Materials 2025, 18, 3121. [Google Scholar] [CrossRef]
- Fujita, Y.; Noda, S.; Takahashi, J.; Greenhalgh, E.S.; Pimenta, S. Predicting failure in injection-moulded short-fibre subcomponents under varied environmental conditions through fracture mechanics. Compos. Part B Eng. 2024, 275, 111343. [Google Scholar] [CrossRef]
- Kohar, R.; Miskolci, J.; Pompas, L.; Kucera, L.; Stevko, P.; Petru, M.; Mishra, R.K. Computational Analysis of Mechanical Properties in Polymeric Sandwich Composite Materials. Polymers 2024, 16, 673. [Google Scholar] [CrossRef]
- Perin, M.; Lim, Y.; Berti, G.A.; Lee, T.; Jin, K.; Quagliato, L. Single and Multiple Gate Design Optimization Algorithm for Improving the Effectiveness of Fiber Reinforcement in the Thermoplastic Injection Molding Process. Polymers 2023, 15, 3094. [Google Scholar] [CrossRef]
- Kufel, A.; Para, S.; Kuciel, S. Basalt/glass fiber polypropylene hybrid composites: Mechanical properties at different temperatures and under cyclic loading and micromechanical modelling. Materials 2021, 14, 5574. [Google Scholar] [CrossRef]
- Jones, D.R.; Schonlau, M.; Welch, W.J. Efficient global optimization of expensive black-box functions. J. Glob. Optim. 1998, 13, 455–492. [Google Scholar] [CrossRef]
- Bezerra, M.A.; Santelli, R.E.; Oliveira, E.P.; Villar, L.S.; Escaleira, L.A. Response surface methodology (RSM) as a tool for optimization in analytical chemistry. Talanta 2008, 76, 965–977. [Google Scholar] [CrossRef]
- Deb, K.; Pratap, A.; Agarwal, S.; Meyarivan, T. A Fast and Elitist Multiobjective Genetic Algorithm: NSGA-II. IEEE Trans. Evol. Comput. 2002, 6, 182–197. [Google Scholar] [CrossRef]
- Peydró, M.A.; Parres, F.; Crespo, J.E.; Juárez, D. Study of Rheological Behavior During the Recovery Process of High Impact Polystyrene Using Cross-WLF Model. J. Appl. Polym. Sci. 2011, 120, 2400–2410. [Google Scholar] [CrossRef]



| Glass Fiber Mass Fraction | Fiber Aspect Ratio | Density | Maximum Shear Stress | Maximum Shear Rate | Mold Temperature | Melt Temperature |
|---|---|---|---|---|---|---|
| 30% | 25 | 1.14 g/cm3 | 0.25 MPa | 100,000 s−1 | 20–60 °C | 200–260 °C |
| Number of Elements | Maximum Aspect Ratio | Average Aspect Ratio | Minimum Aspect Ratio | Matching Percentage/% | Number of Free Edges |
|---|---|---|---|---|---|
| 67,440 | 19.03 | 2.17 | 1.16 | 93.4 | 0 |
| Cooling Pipe Diameter d/mm | Minimum Velocity v/(m·s−1) | Volume Flow Rate V/(m3·min−1) |
|---|---|---|
| 8 | 1.66 | <5.0 × 10⁻³ |
| 10 | 1.32 | 5.0 × 10⁻³~6.2 × 10⁻³ |
| 12 | 1.10 | 6.2 × 10⁻³~7.4 × 10⁻³ |
| 15 | 0.87 | 7.4 × 10⁻³~9.2 × 10⁻³ |
| Factor | Level 1 (Low) | Level 2 (Center) | Level 3 (High) |
|---|---|---|---|
| A/°C | 200 | 230 | 260 |
| B/°C | 20 | 40 | 60 |
| C/MPa | 20 | 50 | 80 |
| D/s | 10 | 20 | 30 |
| E/s | 1 | 2 | 3 |
| F/s | 15 | 20 | 25 |
| Item | Parameter |
|---|---|
| Screw diameter/mm | 90 |
| Theoretical injection volume/cm3 | 2799 |
| Injection pressure/MPa | 165 |
| Injection rate/(cm3·s−1) | 651 |
| Plasticizing capacity/(g·s−1) | 93 |
| Ejection stroke/mm | 300 |
| No. | A | B | C | D | E | F | Warpage Deformation/mm | Residual Stress/MPa | Run Type |
|---|---|---|---|---|---|---|---|---|---|
| 2 | 230 | 40 | 50 | 20 | 2 | 20 | 3.088 | 51.51 | Center Point |
| 8 | 230 | 40 | 50 | 20 | 2 | 20 | 3.088 | 51.51 | Center Point |
| 10 | 230 | 40 | 50 | 20 | 2 | 20 | 3.088 | 51.51 | Center Point |
| 23 | 230 | 40 | 50 | 20 | 2 | 20 | 3.088 | 51.51 | Center Point |
| 66 | 230 | 40 | 50 | 20 | 2 | 20 | 3.088 | 51.51 | Center Point |
| 3 | 183.047 | 40 | 50 | 20 | 2 | 20 | 3.198 | 53.75 | Axial Point |
| 38 | 276.953 | 40 | 50 | 20 | 2 | 20 | 3.098 | 49.22 | Axial Point |
| 78 | 230 | 71.302 | 50 | 20 | 2 | 20 | 3.662 | 54.29 | Axial Point |
| 80 | 230 | 8.698 | 50 | 20 | 2 | 20 | 2.603 | 50.57 | Axial Point |
| 35 | 230 | 40 | 96.952 | 20 | 2 | 20 | 2.447 | 101.00 | Axial Point |
| 1 | 260 | 60 | 80 | 30 | 1 | 25 | 2.799 | 68.90 | Factorial Point |
| 4 | 260 | 20 | 20 | 10 | 1 | 25 | 4.742 | 43.71 | Factorial Point |
| 9 | 200 | 60 | 80 | 10 | 1 | 15 | 5.129 | 85.34 | Factorial Point |
| 13 | 200 | 20 | 20 | 10 | 1 | 15 | 3.675 | 47.90 | Factorial Point |
| 16 | 200 | 20 | 20 | 30 | 3 | 25 | 3.074 | 47.96 | Factorial Point |
| Source | Sum of Squares (SS) | Degrees of Freedom (DF) | Mean Square (MS) | F-Value | p-Value |
|---|---|---|---|---|---|
| Model | 72.41 | 33 | 2.19 | 443.92 | <0.0001 |
| A | 0.005 | 1 | 0.005 | 1.01 | 0.3192 |
| B | 0.5607 | 1 | 0.5607 | 113.45 | <0.0001 |
| C | 2.81 | 1 | 2.81 | 568.67 | <0.0001 |
| D | 2.71 | 1 | 2.71 | 548.23 | <0.0001 |
| E | 0.03 | 1 | 0.03 | 6.07 | 0.0171 |
| AB | 0.8628 | 1 | 0.8628 | 174.56 | <0.0001 |
| AC | 0.0605 | 1 | 0.0605 | 12.23 | 0.001 |
| AD | 2.42 | 1 | 2.42 | 489.91 | <0.0001 |
| AE | 0.0203 | 1 | 0.0203 | 4.1 | 0.048 |
| BC | 0.03 | 1 | 0.03 | 6.06 | 0.0171 |
| BD | 0.9489 | 1 | 0.9489 | 191.98 | <0.0001 |
| BE | 0.1398 | 1 | 0.1398 | 28.28 | <0.0001 |
| CD | 1.68 | 1 | 1.68 | 340.01 | <0.0001 |
| CE | 0.0005 | 1 | 0.0005 | 0.1036 | 0.7489 |
| DE | 0.4292 | 1 | 0.4292 | 86.83 | <0.0001 |
| A2 | 0.0001 | 1 | 0.0001 | 0.0114 | 0.9155 |
| B2 | 0.0003 | 1 | 0.0003 | 0.0571 | 0.812 |
| C2 | 0.5885 | 1 | 0.5885 | 119.07 | <0.0001 |
| D2 | 2.03 | 1 | 2.03 | 409.86 | <0.0001 |
| ABC | 0.1503 | 1 | 0.1503 | 30.4 | <0.0001 |
| ABD | 1.31 | 1 | 1.31 | 264.26 | <0.0001 |
| ABE | 0.0331 | 1 | 0.0331 | 6.69 | 0.0125 |
| ACD | 0.0083 | 1 | 0.0083 | 1.68 | 0.2006 |
| ACE | 0.0067 | 1 | 0.0067 | 1.36 | 0.2481 |
| ADE | 0.0207 | 1 | 0.0207 | 4.19 | 0.0458 |
| BCD | 0.002 | 1 | 0.002 | 0.3984 | 0.5307 |
| BDE | 0.0985 | 1 | 0.0985 | 19.93 | <0.0001 |
| CDE | 0.0101 | 1 | 0.0101 | 2.05 | 0.1583 |
| A2B | 0.0307 | 1 | 0.0307 | 6.2 | 0.016 |
| A2C | 1.38 | 1 | 1.38 | 279.15 | <0.0001 |
| A2D | 0.0028 | 1 | 0.0028 | 0.5599 | 0.4577 |
| A2E | 0.003 | 1 | 0.003 | 0.6073 | 0.4394 |
| AB2 | 0.0726 | 1 | 0.0726 | 14.68 | 0.0003 |
| Residual | 0.257 | 52 | 0.0049 | ||
| Lack of Fit | 0.257 | 43 | 0.006 |
| Source | Sum of Squares (SS) | Degrees of Freedom (DF) | Mean Square (MS) | F-Value | p-Value |
|---|---|---|---|---|---|
| Model | 16,747.56 | 35 | 478.5 | 265.99 | <0.0001 |
| A | 10.26 | 1 | 10.26 | 5.7 | 0.0207 |
| B | 6.92 | 1 | 6.92 | 3.85 | 0.0554 |
| C | 1458 | 1 | 1458 | 810.46 | <0.0001 |
| D | 0.0313 | 1 | 0.0313 | 0.0174 | 0.8957 |
| E | 0.5513 | 1 | 0.5513 | 0.3064 | 0.5823 |
| AB | 33.76 | 1 | 33.76 | 18.76 | <0.0001 |
| AC | 259.53 | 1 | 259.53 | 144.27 | <0.0001 |
| AD | 39.82 | 1 | 39.82 | 22.13 | <0.0001 |
| AE | 0.021 | 1 | 0.021 | 0.0117 | 0.9143 |
| BC | 819.1 | 1 | 819.1 | 455.32 | <0.0001 |
| BD | 54.32 | 1 | 54.32 | 30.19 | <0.0001 |
| BE | 61.39 | 1 | 61.39 | 34.12 | <0.0001 |
| CD | 105.99 | 1 | 105.99 | 58.92 | <0.0001 |
| CE | 14.4 | 1 | 14.4 | 8.01 | 0.0067 |
| DE | 125.44 | 1 | 125.44 | 69.73 | <0.0001 |
| A2 | 2.15 | 1 | 2.15 | 1.19 | 0.2797 |
| B2 | 0.0001 | 1 | 0.0001 | 0.0001 | 0.9941 |
| C2 | 1103.36 | 1 | 1103.36 | 613.33 | <0.0001 |
| D2 | 2.52 | 1 | 2.52 | 1.4 | 0.2418 |
| E2 | 3.78 | 1 | 3.78 | 2.1 | 0.1536 |
| ABC | 46.89 | 1 | 46.89 | 26.06 | <0.0001 |
| ABD | 1.56 | 1 | 1.56 | 0.8651 | 0.3568 |
| ABE | 2.67 | 1 | 2.67 | 1.48 | 0.2293 |
| ACD | 21.32 | 1 | 21.32 | 11.85 | 0.0012 |
| ACE | 0.7098 | 1 | 0.7098 | 0.3946 | 0.5328 |
| ADE | 8.57 | 1 | 8.57 | 4.76 | 0.0338 |
| BCD | 32.35 | 1 | 32.35 | 17.98 | <0.0001 |
| BCE | 79.52 | 1 | 79.52 | 44.2 | <0.0001 |
| BDE | 39.47 | 1 | 39.47 | 21.94 | <0.0001 |
| CDE | 127.97 | 1 | 127.97 | 71.14 | <0.0001 |
| A2B | 31.45 | 1 | 31.45 | 17.48 | 0.0001 |
| A2C | 80.8 | 1 | 80.8 | 44.91 | <0.0001 |
| A2D | 9.13 | 1 | 9.13 | 5.07 | 0.0287 |
| A2E | 2.74 | 1 | 2.74 | 1.52 | 0.223 |
| AB2 | 11.07 | 1 | 11.07 | 6.15 | 0.0165 |
| Residual | 89.95 | 50 | 1.8 | ||
| Lack of Fit | 89.95 | 41 | 2.19 |
| Validation Point Type | Response Index | Predicted Mean Value | Observed Value | Relative Error | 95% Prediction Interval | Interval Coverage |
|---|---|---|---|---|---|---|
| Center Replicate Point (5 replicates) | Warpage Deformation (mm) | 3.103 | 3.088 | 0.484% | [2.958, 3.249] | Yes |
| Residual Stress (MPa) | 51.760 | 51.51 | 0.483% | [48.974, 54.545] | Yes |
| Measured Maximum Warpage Deformation of Samples/mm | Average Value/mm | Predicted Value/mm | Relative Error/% | |||||||
|---|---|---|---|---|---|---|---|---|---|---|
| 1 | 2 | 3 | 4 | 5 | 6 | 7 | 8 | |||
| 2.041 | 2.111 | 2.224 | 2.112 | 1.852 | 1.947 | 1.851 | 2.215 | 2.044 | 2.199 | 7.583 |
Disclaimer/Publisher’s Note: The statements, opinions and data contained in all publications are solely those of the individual author(s) and contributor(s) and not of MDPI and/or the editor(s). MDPI and/or the editor(s) disclaim responsibility for any injury to people or property resulting from any ideas, methods, instructions or products referred to in the content. |
© 2026 by the authors. Licensee MDPI, Basel, Switzerland. This article is an open access article distributed under the terms and conditions of the Creative Commons Attribution (CC BY) license.
Share and Cite
Yang, M.; Yan, S.; Liu, J.; Li, F.; Yao, J.; Li, Y. Research on Bi-Objective Optimization of Injection Molding Process and Mechanical Anisotropy of Glass Fiber-Reinforced Polypropylene Fan Face Shell Based on RSM and NSGA-II. Polymers 2026, 18, 1373. https://doi.org/10.3390/polym18111373
Yang M, Yan S, Liu J, Li F, Yao J, Li Y. Research on Bi-Objective Optimization of Injection Molding Process and Mechanical Anisotropy of Glass Fiber-Reinforced Polypropylene Fan Face Shell Based on RSM and NSGA-II. Polymers. 2026; 18(11):1373. https://doi.org/10.3390/polym18111373
Chicago/Turabian StyleYang, Ming, Sailong Yan, Jubao Liu, Feng Li, Jianfeng Yao, and Yasheng Li. 2026. "Research on Bi-Objective Optimization of Injection Molding Process and Mechanical Anisotropy of Glass Fiber-Reinforced Polypropylene Fan Face Shell Based on RSM and NSGA-II" Polymers 18, no. 11: 1373. https://doi.org/10.3390/polym18111373
APA StyleYang, M., Yan, S., Liu, J., Li, F., Yao, J., & Li, Y. (2026). Research on Bi-Objective Optimization of Injection Molding Process and Mechanical Anisotropy of Glass Fiber-Reinforced Polypropylene Fan Face Shell Based on RSM and NSGA-II. Polymers, 18(11), 1373. https://doi.org/10.3390/polym18111373