Figure 1.
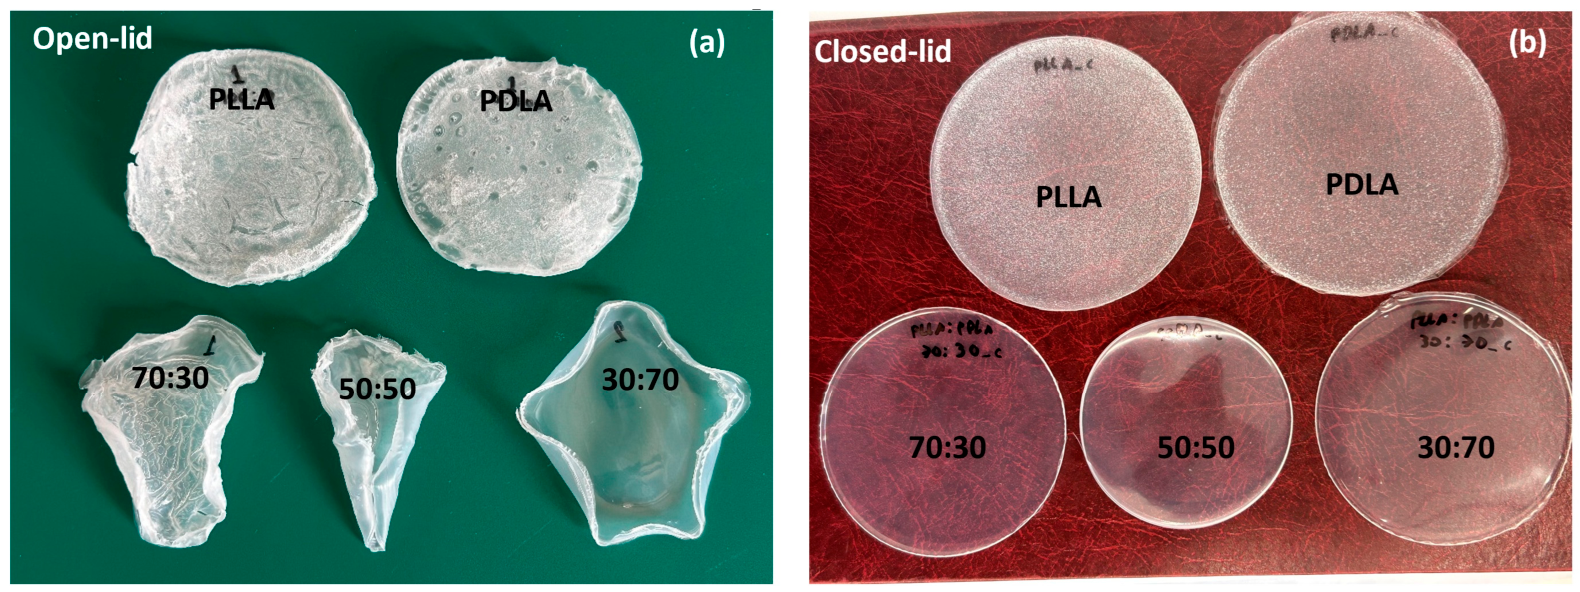
Visual comparison of solvent-cast PLLA/PDLA films prepared under (a) open-lid and (b) closed-lid solvent evaporation conditions at different blend ratios, demonstrating the influence of evaporation kinetics on film morphology and optical clarity.
Figure 1.
Visual comparison of solvent-cast PLLA/PDLA films prepared under (a) open-lid and (b) closed-lid solvent evaporation conditions at different blend ratios, demonstrating the influence of evaporation kinetics on film morphology and optical clarity.
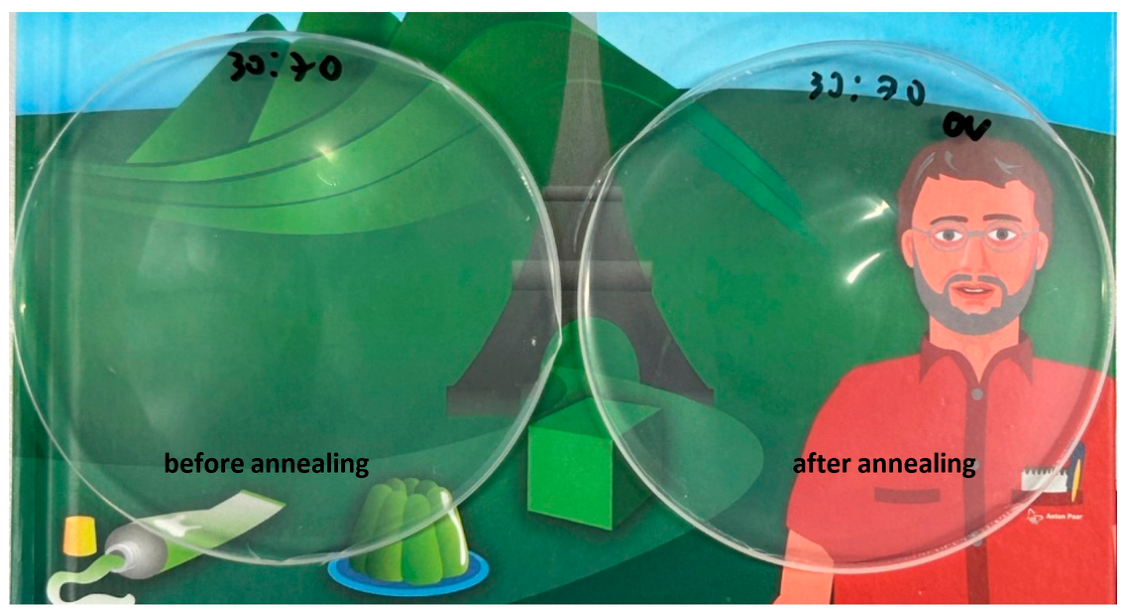
Figure 2.
Optical appearance of PLLA/PDLA blend films (30:70) before (left) and after annealing at 100 °C for 30 min (right), showing no significant visual change in clarity or color.
Figure 2.
Optical appearance of PLLA/PDLA blend films (30:70) before (left) and after annealing at 100 °C for 30 min (right), showing no significant visual change in clarity or color.
Figure 3.
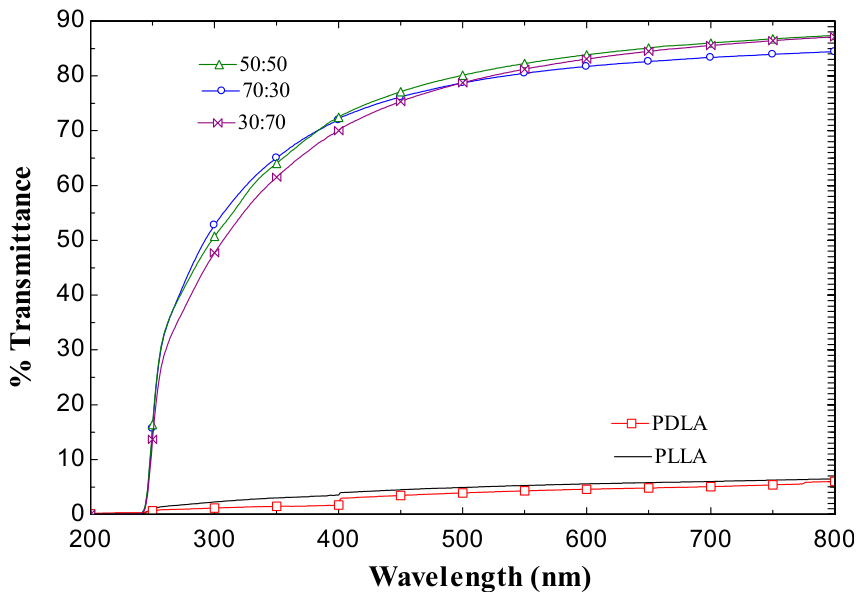
UV–Vis transmittance spectra of PLLA, PDLA, and PLLA/PDLA blend films with different weight ratios (70:30, 50:50, and 30:70). Measurements were independently repeated at least three times, and representative spectra are presented.
Figure 3.
UV–Vis transmittance spectra of PLLA, PDLA, and PLLA/PDLA blend films with different weight ratios (70:30, 50:50, and 30:70). Measurements were independently repeated at least three times, and representative spectra are presented.
Figure 4.
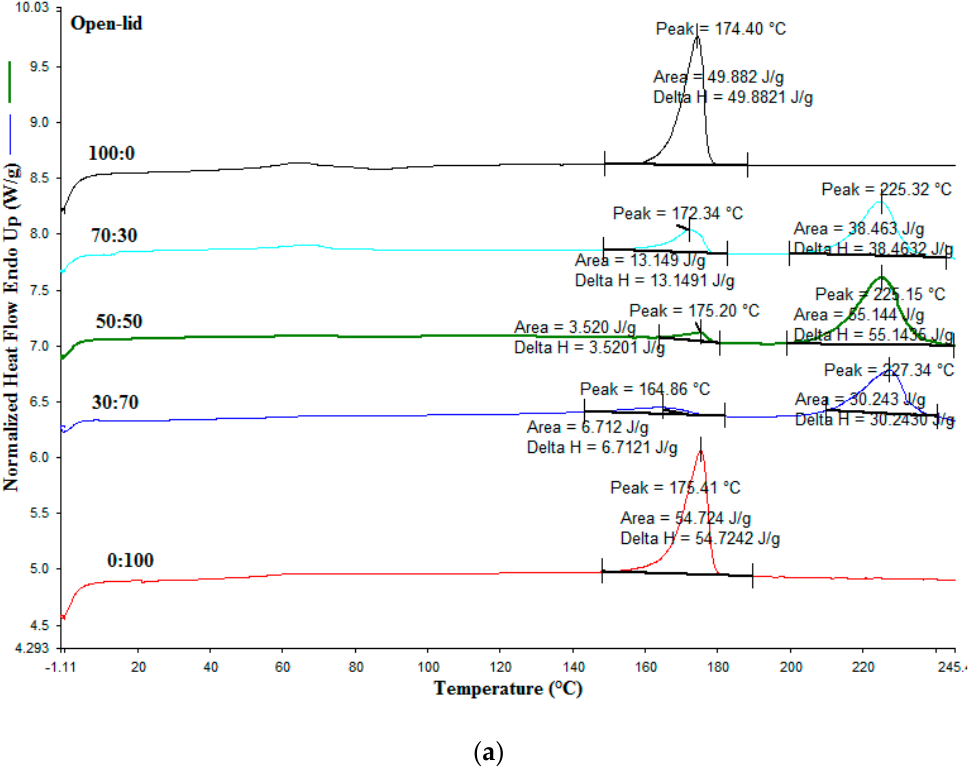
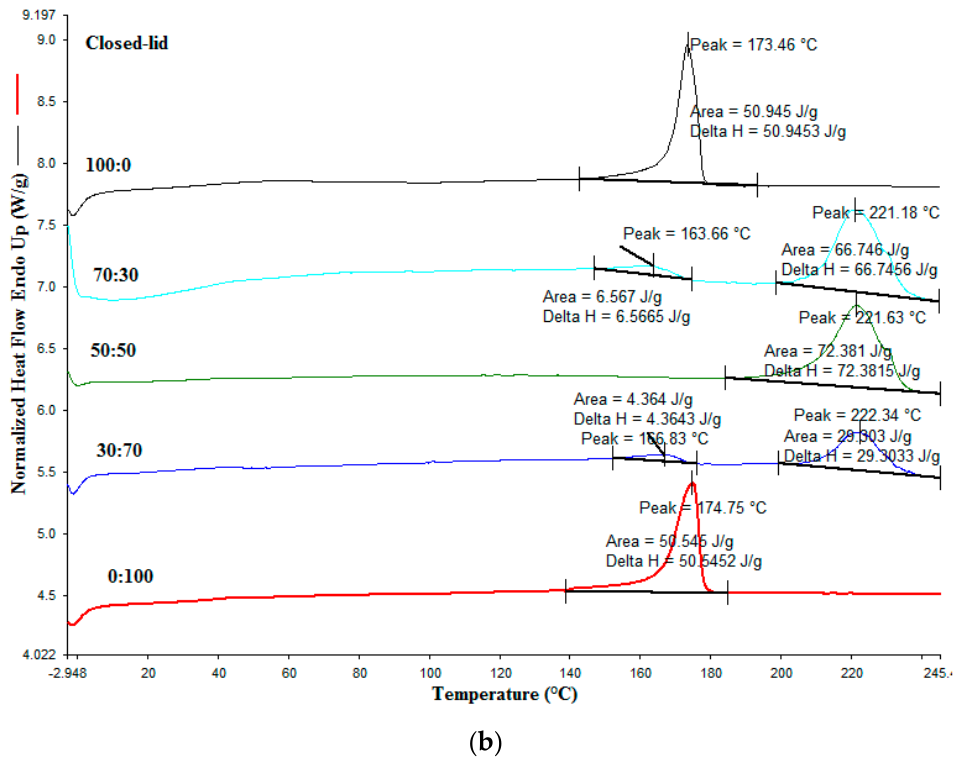
Representative DSC thermograms of PLLA, PDLA, and PLLA/PDLA blend films prepared under (a) open-lid (fast solvent evaporation) and (b) closed-lid (slow solvent evaporation) conditions.
Figure 4.
Representative DSC thermograms of PLLA, PDLA, and PLLA/PDLA blend films prepared under (a) open-lid (fast solvent evaporation) and (b) closed-lid (slow solvent evaporation) conditions.
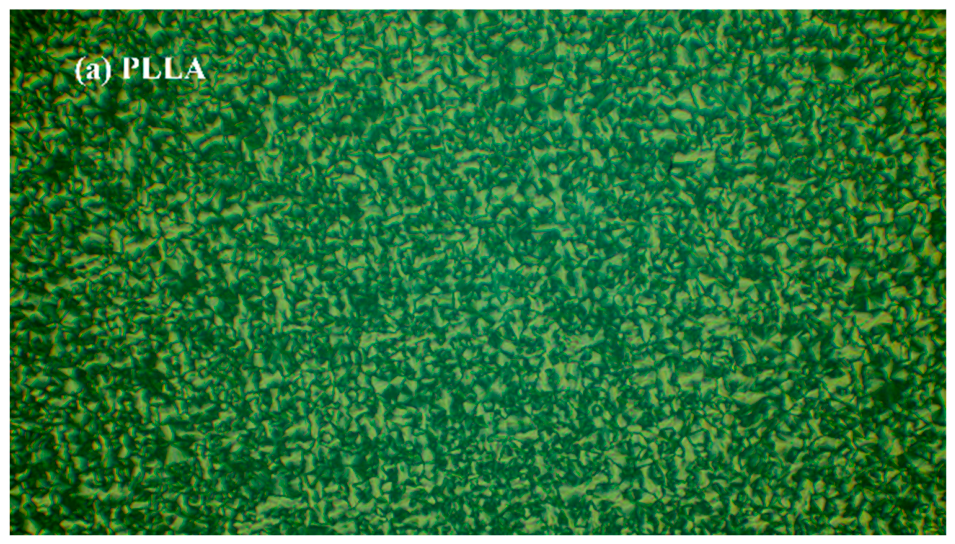
Figure 5.
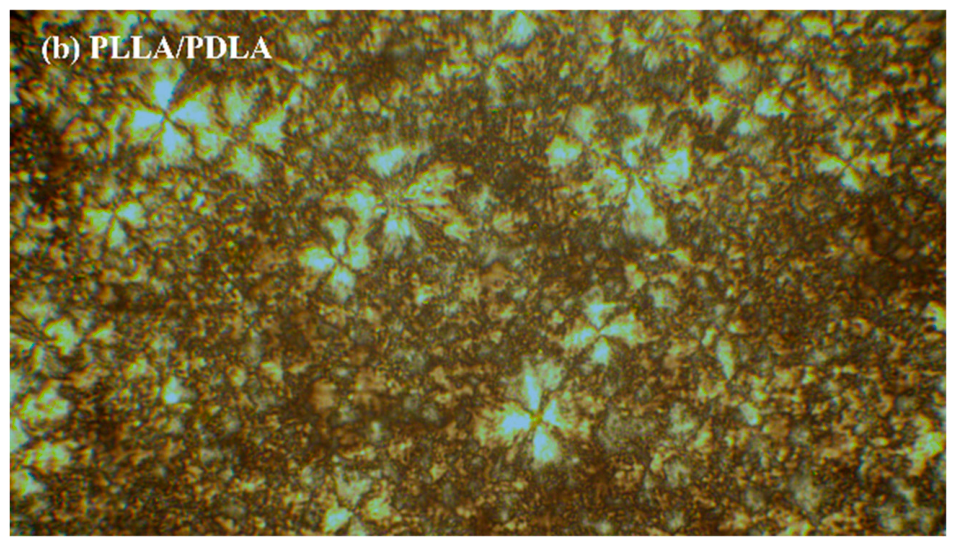
Polarized optical microscopy (POM) images of (a) PLLA and (b) PLLA/PDLA (50:50) blend films, highlighting the formation of stereocomplex crystallites in the blend compared to the homocrystalline structure of neat PLLA.
Figure 5.
Polarized optical microscopy (POM) images of (a) PLLA and (b) PLLA/PDLA (50:50) blend films, highlighting the formation of stereocomplex crystallites in the blend compared to the homocrystalline structure of neat PLLA.
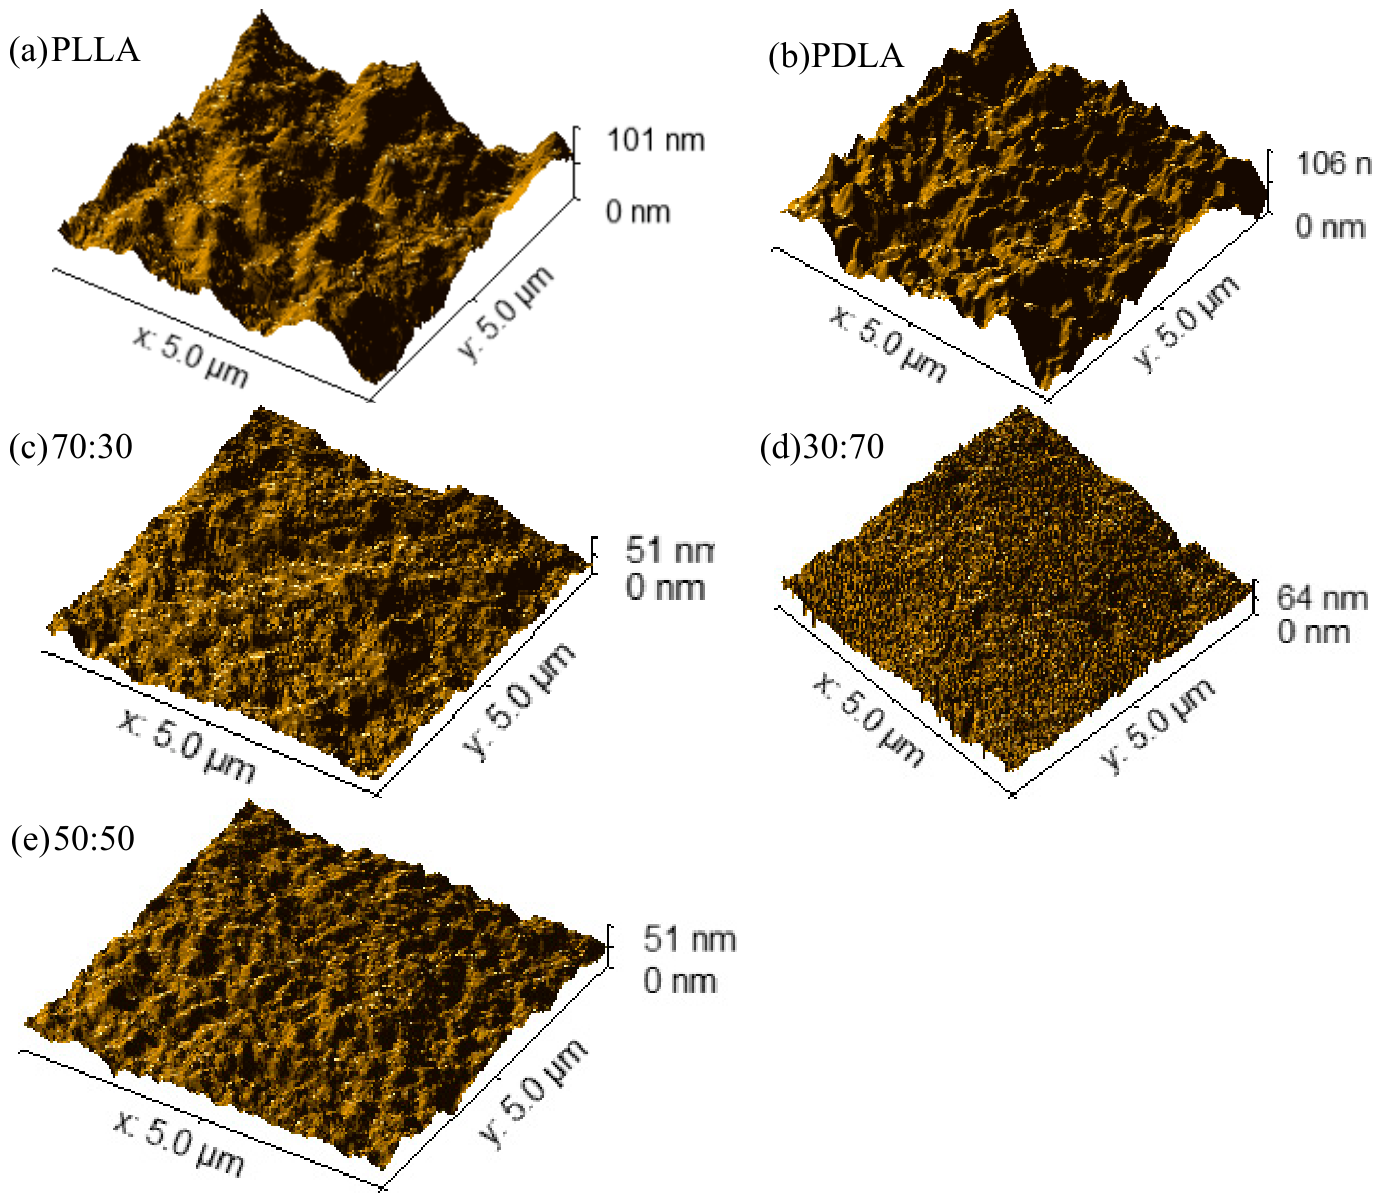
Figure 6.
AFM 3D topographic images of PLLA, PDLA, and PLLA/PDLA blend films with different ratios (scan area: 5 µm × 5 µm), showing surface morphology variations influenced by blend composition.
Figure 6.
AFM 3D topographic images of PLLA, PDLA, and PLLA/PDLA blend films with different ratios (scan area: 5 µm × 5 µm), showing surface morphology variations influenced by blend composition.
Figure 7.
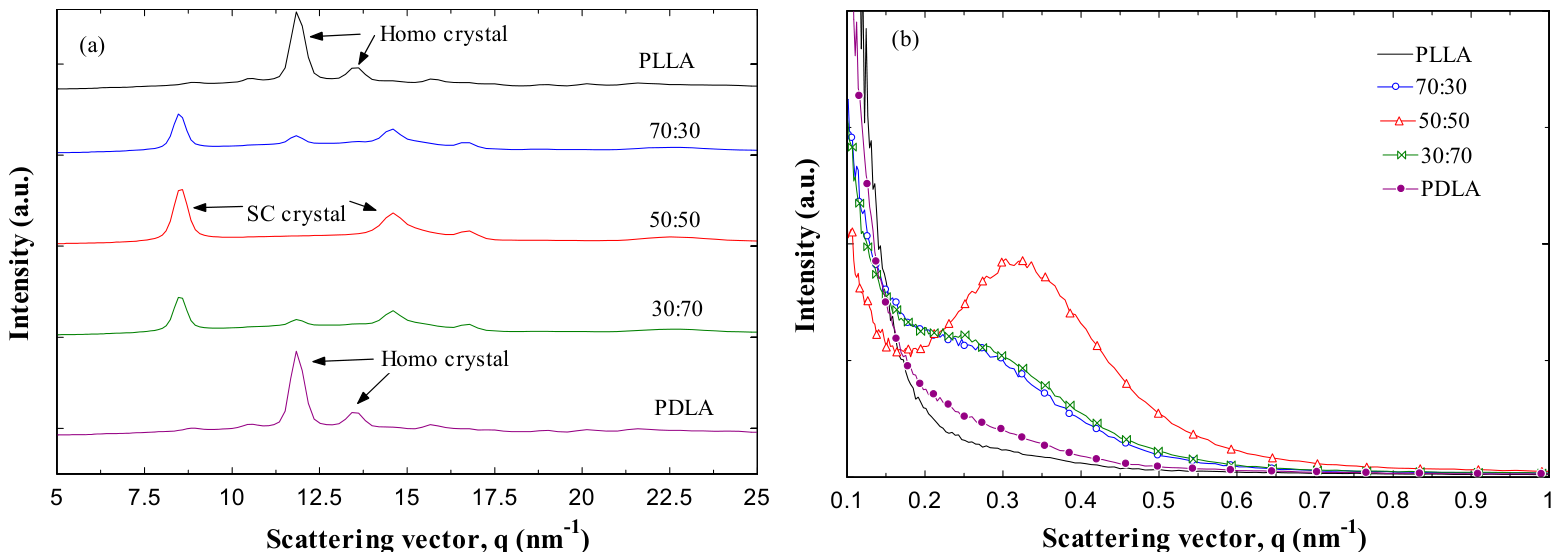
Representative WAXD and SAXS profiles, showing enhanced stereocomplex crystallization and nanoscale structural organization in the 50:50 blend. (a) WAXD patterns showing SC and HC crystal peaks in PLLA, PDLA, and blends. (b) SAXS profiles revealing nanoscale structural differences among compositions.
Figure 7.
Representative WAXD and SAXS profiles, showing enhanced stereocomplex crystallization and nanoscale structural organization in the 50:50 blend. (a) WAXD patterns showing SC and HC crystal peaks in PLLA, PDLA, and blends. (b) SAXS profiles revealing nanoscale structural differences among compositions.
Figure 8.
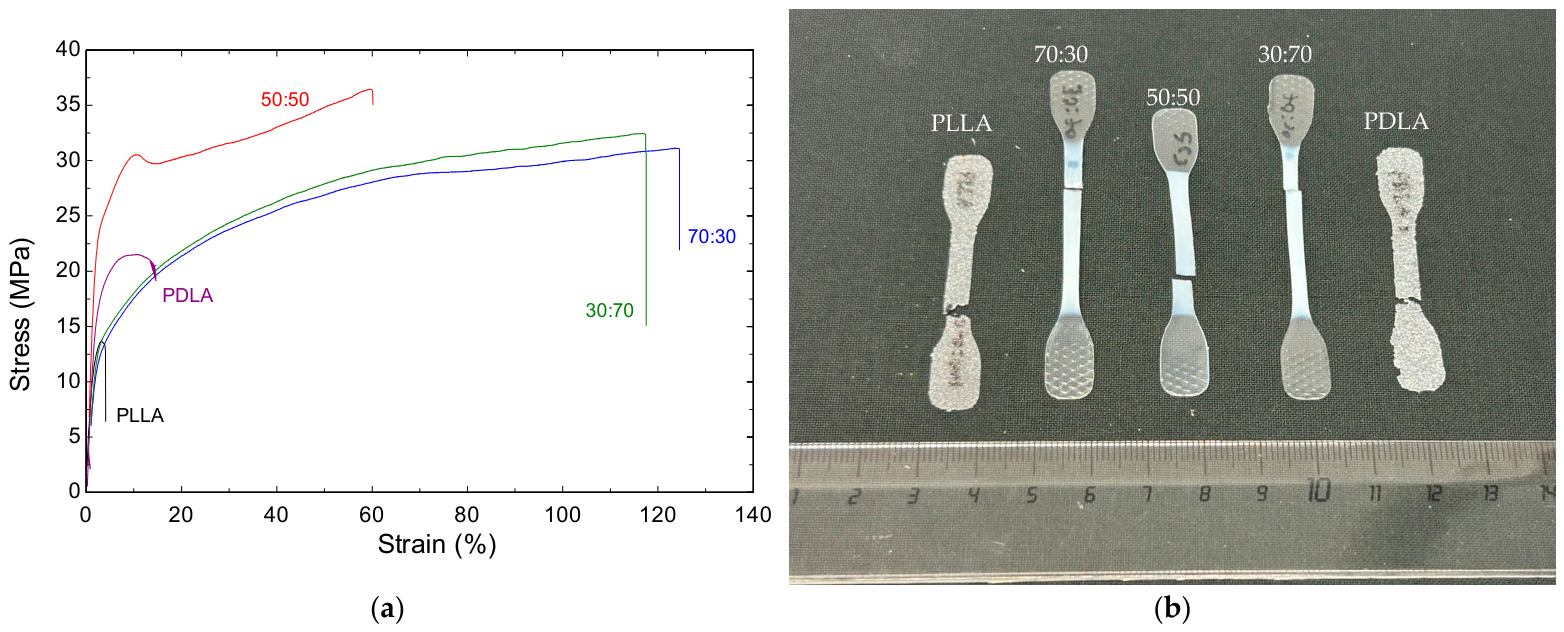
(a) Representative stress–strain curves from at least three independent measurements of PLLA, PDLA, and blends. (b) Fractured specimens after tensile testing.
Figure 8.
(a) Representative stress–strain curves from at least three independent measurements of PLLA, PDLA, and blends. (b) Fractured specimens after tensile testing.
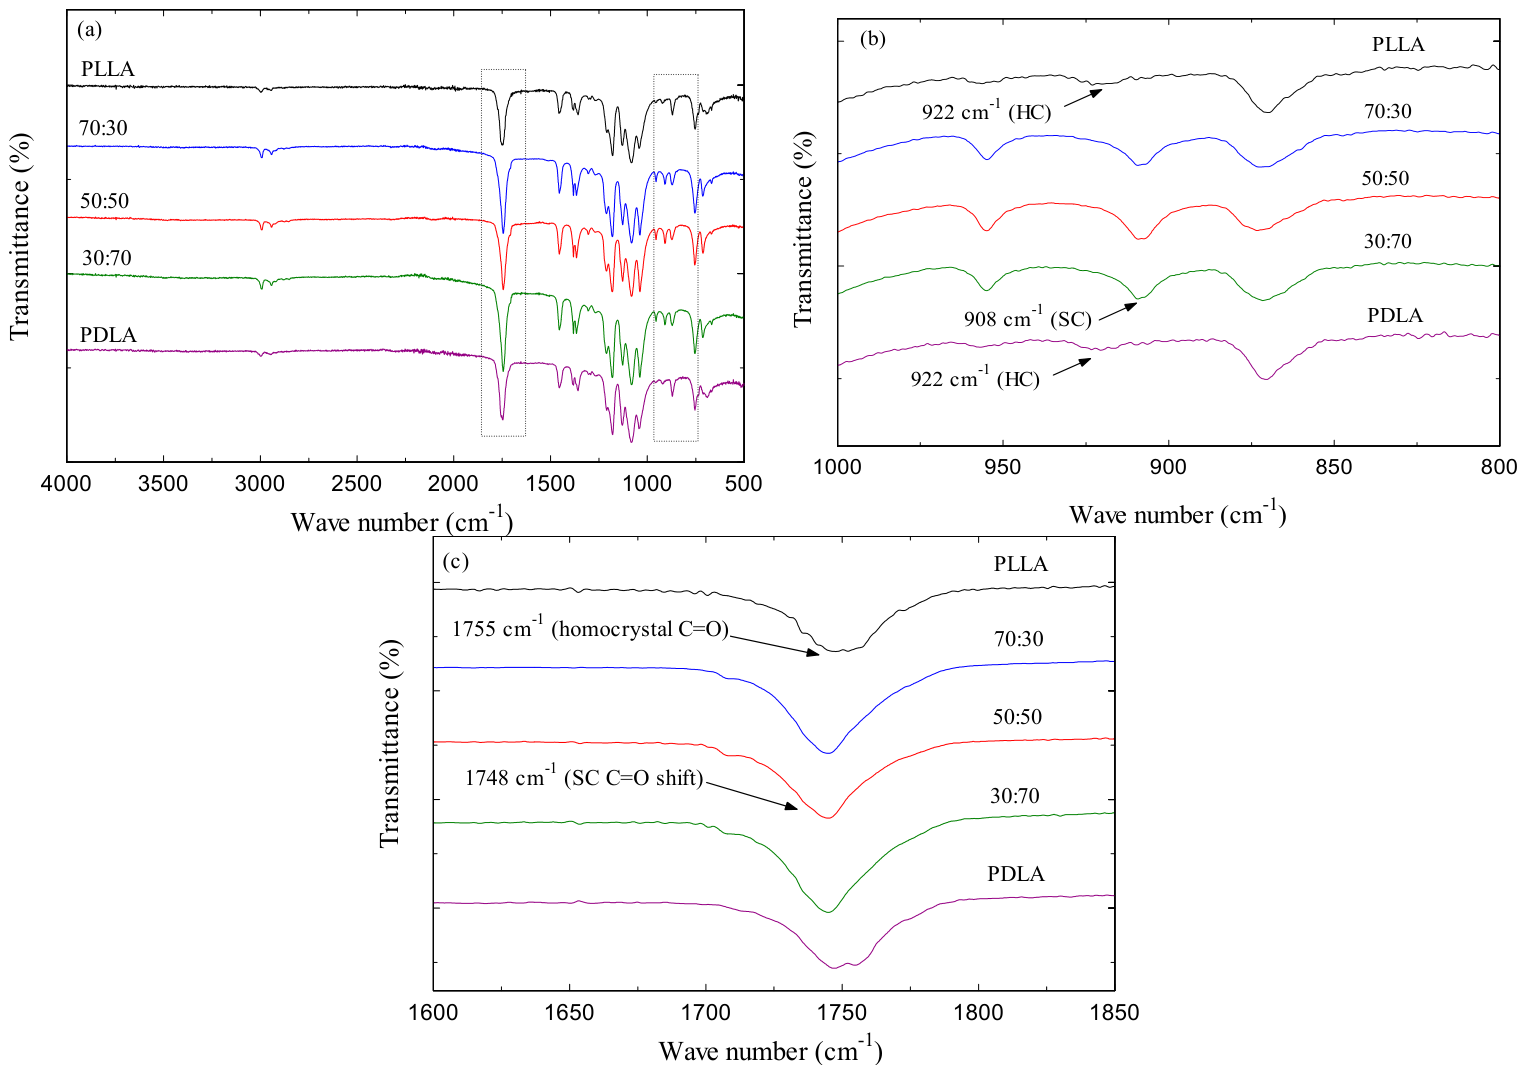
Figure 9.
FTIR spectra of PLLA, PDLA, and blends highlighting SC-related spectral shifts and enhanced intermolecular interactions in PLLA/PDLA blend films: (a) full spectra, (b) fingerprint region highlighting SC and HC peaks at 908 and 922 cm−1, and (c) carbonyl stretching region showing a C=O shift from 1755 to 1748 cm−1 in the PLLA:PDLA blend.
Figure 9.
FTIR spectra of PLLA, PDLA, and blends highlighting SC-related spectral shifts and enhanced intermolecular interactions in PLLA/PDLA blend films: (a) full spectra, (b) fingerprint region highlighting SC and HC peaks at 908 and 922 cm−1, and (c) carbonyl stretching region showing a C=O shift from 1755 to 1748 cm−1 in the PLLA:PDLA blend.
Figure 10.
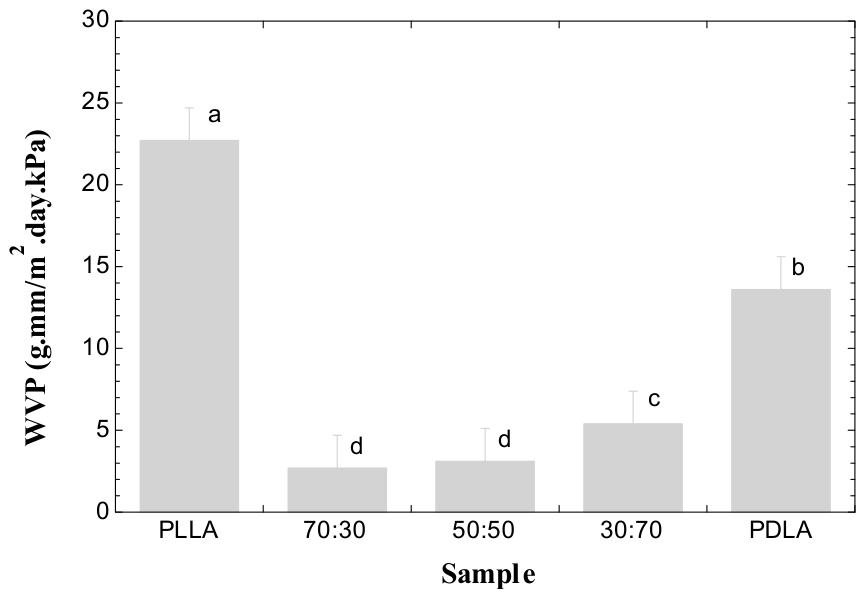
Water vapor permeability (WVP) of PLLA, PDLA, and PLLA/PDLA blend films. The blends exhibit significantly lower WVP compared to neat polymers, indicating enhanced barrier performance associated with stereocomplex formation. Different letters indicate statistically significant differences (p < 0.05).
Figure 10.
Water vapor permeability (WVP) of PLLA, PDLA, and PLLA/PDLA blend films. The blends exhibit significantly lower WVP compared to neat polymers, indicating enhanced barrier performance associated with stereocomplex formation. Different letters indicate statistically significant differences (p < 0.05).
Figure 11.
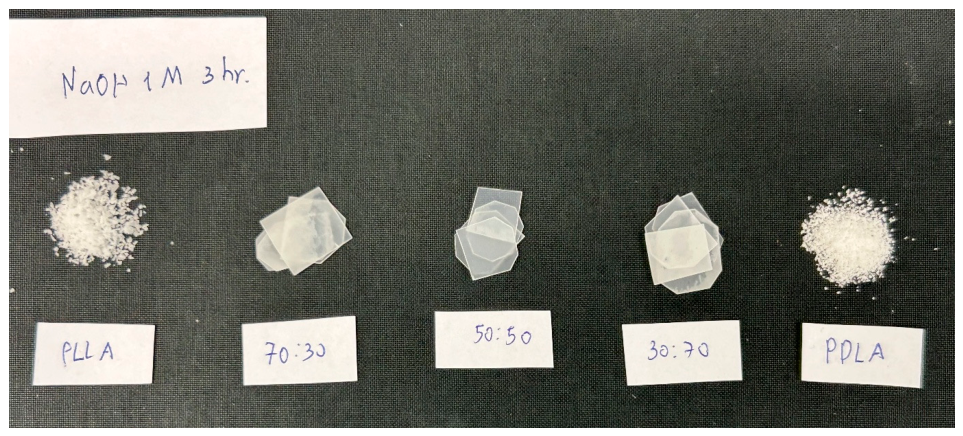
Photographs of PLLA, PDLA, and PLLA/PDLA blend samples after alkaline degradation in 1 M NaOH solution for 3 h.
Figure 11.
Photographs of PLLA, PDLA, and PLLA/PDLA blend samples after alkaline degradation in 1 M NaOH solution for 3 h.
Figure 12.
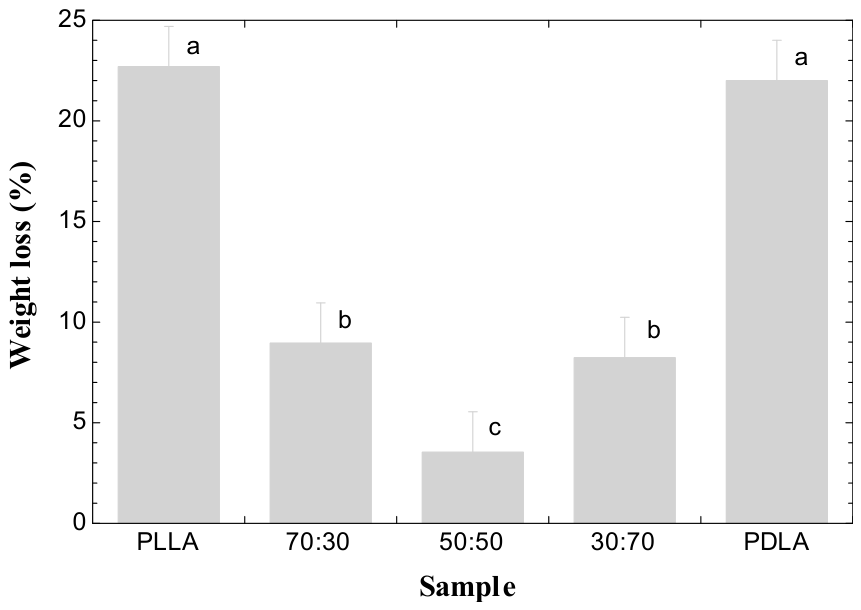
Weight loss (%) of PLLA, PDLA, and PLLA/PDLA blends after degradation in 1 M NaOH for 3 h. Different letters indicate significant differences (p < 0.05).
Figure 12.
Weight loss (%) of PLLA, PDLA, and PLLA/PDLA blends after degradation in 1 M NaOH for 3 h. Different letters indicate significant differences (p < 0.05).
Figure 13.
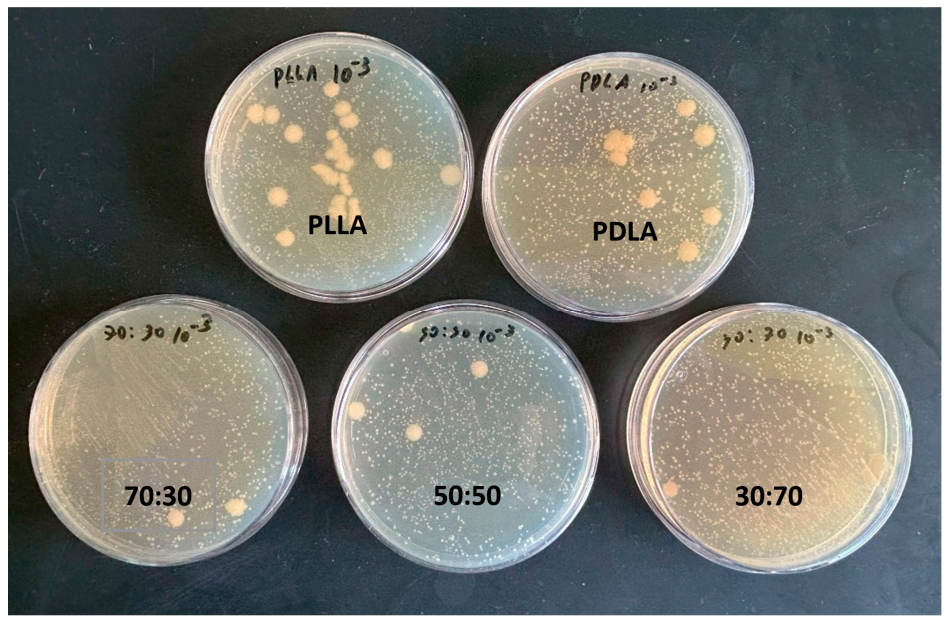
Total plate count (TPC) of samples after 6 days at a dilution of 10−4 using the spread plate method (0.1 mL), showing microbial growth on PLLA, PDLA, and PLLA/PDLA blend films.
Figure 13.
Total plate count (TPC) of samples after 6 days at a dilution of 10−4 using the spread plate method (0.1 mL), showing microbial growth on PLLA, PDLA, and PLLA/PDLA blend films.
Figure 14.
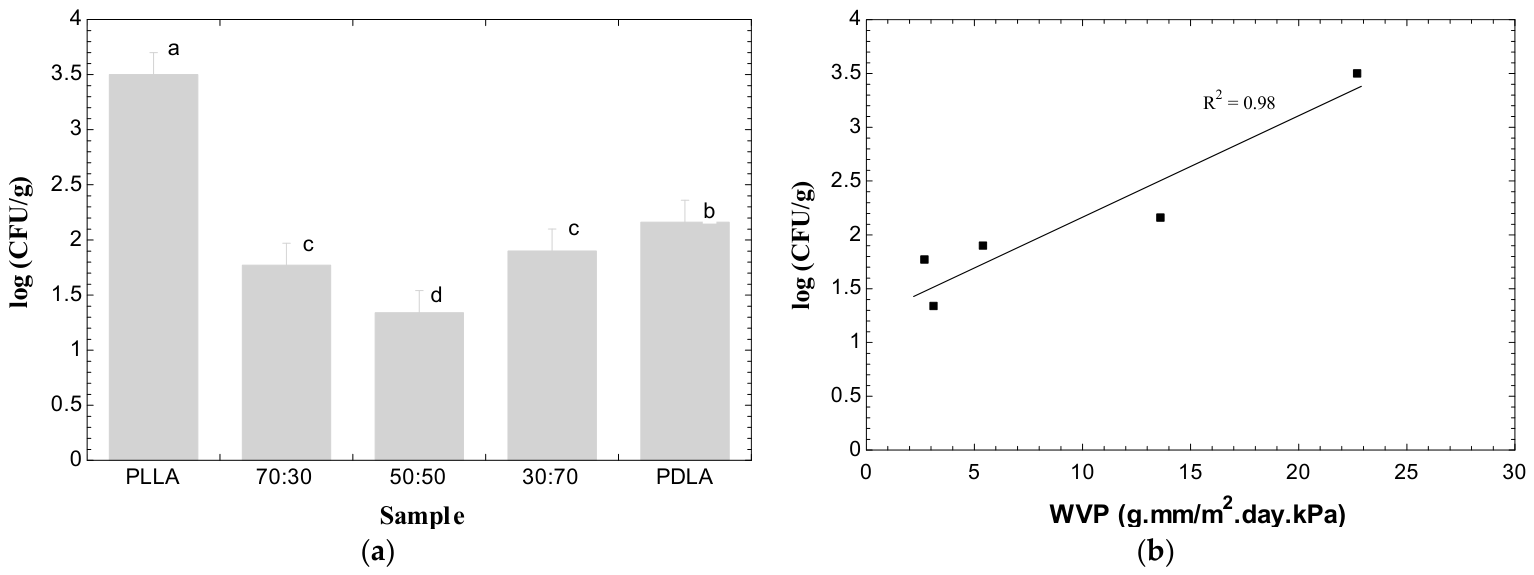
Microbial load of PLLA, PDLA, and PLLA/PDLA blend films after 6 days, presented as (a) log(CFU/g) and (b) correlation between water vapor permeability (WVP) and microbial load. Values represent mean ± standard deviation (n = 3). Different letters indicate statistically significant differences (p < 0.05).
Figure 14.
Microbial load of PLLA, PDLA, and PLLA/PDLA blend films after 6 days, presented as (a) log(CFU/g) and (b) correlation between water vapor permeability (WVP) and microbial load. Values represent mean ± standard deviation (n = 3). Different letters indicate statistically significant differences (p < 0.05).
Table 1.
Average diameter and thickness of PLLA/PDLA blend films.
Table 1.
Average diameter and thickness of PLLA/PDLA blend films.
| Samples | Film Diameter (mm) | Film Thickness (mm) |
|---|
| PLLA | 10.0 ± 0.3 | 0.38 ± 0.03 |
| 70:30 | 9.0 ± 0.3 | 0.45 ± 0.03 |
| 50:50 | 7.8 ± 0.3 | 0.52 ± 0.03 |
| 30:70 | 9.0 ± 0.2 | 0.45 ± 0.03 |
| PDLA | 10.0 ± 0.2 | 0.38 ± 0.03 |
Table 2.
Thermal parameters and crystallinity of PLLA, PDLA, and PLLA/PDLA blend films prepared under open-lid and closed-lid conditions. Representative thermograms are presented, while all measurements were independently repeated to confirm reproducibility.
Table 2.
Thermal parameters and crystallinity of PLLA, PDLA, and PLLA/PDLA blend films prepared under open-lid and closed-lid conditions. Representative thermograms are presented, while all measurements were independently repeated to confirm reproducibility.
| Sample | HC (Homocrystal) | SC (Stereocomplex Crystal) | Xc,total (%) |
|---|
| Tm,HC (°C) | ΔHm,HC (J/g) | Xc,HC (%) | Tm,SC (°C) | ΔHm,SC (J/g) | Xc,SC (%) |
|---|
| Open-lid |
| PLLA | 174.40 | 49.88 | 53.63 | - | - | - | 53.63 |
| 70:30 | 172.34 | 13.14 | 14.13 | 225.32 | 38.46 | 27.08 | 41.21 |
| 50:50 | 175.20 | 3.52 | 3.78 | 225.15 | 55.14 | 38.80 | 42.58 |
| 30:70 | 164.86 | 6.71 | 7.21 | 227.34 | 30.24 | 21.30 | 28.51 |
| PDLA | 175.41 | 54.72 | 58.84 | - | - | - | 58.84 |
| Closed-lid |
| PLLA | 173.46 | 50.94 | 54.77 | - | - | - | 54.77 |
| 70:30 | 163.66 | 6.56 | 7.05 | 221.18 | 66.74 | 47.00 | 54.05 |
| 50:50 | - | - | - | 221.63 | 72.38 | 50.97 | 50.97 |
| 30:70 | 166.83 | 4.36 | 4.69 | 222.34 | 29.30 | 20.63 | 25.32 |
| PDLA | 174.75 | 50.54 | 54.34 | - | - | - | 54.34 |
Table 3.
Surface roughness parameters of PLLA, PDLA, and blends derived from AFM analysis. Values are presented as mean ± SD (n = 3).
Table 3.
Surface roughness parameters of PLLA, PDLA, and blends derived from AFM analysis. Values are presented as mean ± SD (n = 3).
| Sample | Average Height (nm) | RMS Roughness (Sq) (nm) | Mean Roughness (Sa) (nm) | Maximum Height (Sz) (nm) |
|---|
| PLLA | 51.60 ± 0.45 | 14.08 ± 0.14 | 11.36 ± 1.39 | 100.90 ± 10.21 |
| 70:30 | 24.31 ± 0.16 | 6.21 ± 0.55 | 4.90 ± 0.38 | 51.18 ± 0.47 |
| 50:50 | 27.01 ± 0.19 | 5.22 ± 0.47 | 4.12 ± 0.41 | 51.39 ± 0.54 |
| 30:70 | 40.77 ± 0.41 | 6.55 ± 0.56 | 4.77 ± 0.37 | 63.92 ± 0.63 |
| PDLA | 58.20 ± 0.35 | 15.72 ± 1.42 | 12.55 ± 1.11 | 106.10 ± 9.87 |
Table 4.
Diffraction peak parameters (2θ, q, d-spacing) for SC and HC phases observed in PLLA/PDLA blends.
Table 4.
Diffraction peak parameters (2θ, q, d-spacing) for SC and HC phases observed in PLLA/PDLA blends.
| Phase | 2θ (°) | q (nm−1) | d-Spacing (nm) | Assignment |
|---|
| SC | 11.9 | 0.31 | 2.03 | (110) |
| SC | 20.7 | 0.63 | 1.00 | (300) |
| HC | 16.6 | 0.49 | 1.80 | (200)/(100) |
| HC | 18.8 | 0.66 | 1.51 | (203) |
Table 5.
Mechanical properties of PLLA, PDLA, and PLLA/PDLA blends. Data are presented as mean ± SD (n ≥ 3).
Table 5.
Mechanical properties of PLLA, PDLA, and PLLA/PDLA blends. Data are presented as mean ± SD (n ≥ 3).
| Samples | Tensile Strength (MPa) | Elongation at Break (%) | Young’s Modulus (MPa) |
|---|
| PLLA | 18.2 ± 0.5 | 8.5 ± 1.2 | 1150 ± 50 |
| 70:30 | 28.7 ± 0.7 | 124.5 ± 1.5 | 1350 ± 45 |
| 50:50 | 37.0 ± 0.8 | 62.1 ± 2.0 | 1450 ± 60 |
| 30:70 | 26.4 ± 0.6 | 120.7 ± 1.8 | 1300 ± 50 |
| PDLA | 22.4 ± 0.6 | 11.3 ± 1.1 | 1200 ± 40 |
Table 6.
Water vapor permeability (WVP) of different films at 25 °C and 75% RH.
Table 6.
Water vapor permeability (WVP) of different films at 25 °C and 75% RH.
| Samples | ΔWeight/Day (g/Day) | WVP (g·mm/m2·Day·kPa) |
|---|
| PLLA | 0.10 ± 0.01 | 22.7 ± 2.0 a |
| 70:30 | 0.01 ± 0.00 | 2.69 ± 0.2 d |
| 50:50 | 0.01 ± 0.00 | 3.11 ± 0.3 d |
| 30:70 | 0.02 ± 0.00 | 5.39 ± 0.5 c |
| PDLA | 0.06 ± 0.00 | 13.6 ± 1.2 b |
Table 7.
Microbial load of PLLA, PDLA, and PLLA/PDLA blend films after 6 days.
Table 7.
Microbial load of PLLA, PDLA, and PLLA/PDLA blend films after 6 days.
| Sample | Colony Count | CFU/g (×107) |
|---|
| PLLA | 350 ± 30 a | 3.5 ± 0.30 a |
| 70:30 | 177 ± 15 c | 1.77 ± 0.15 c |
| 50:50 | 134 ± 10 d | 1.34 ± 0.10 d |
| 30:70 | 190 ± 12 c | 1.90 ± 0.12 c |
| PDLA | 216 ± 19 b | 2.16 ± 0.19 b |



 ,
,