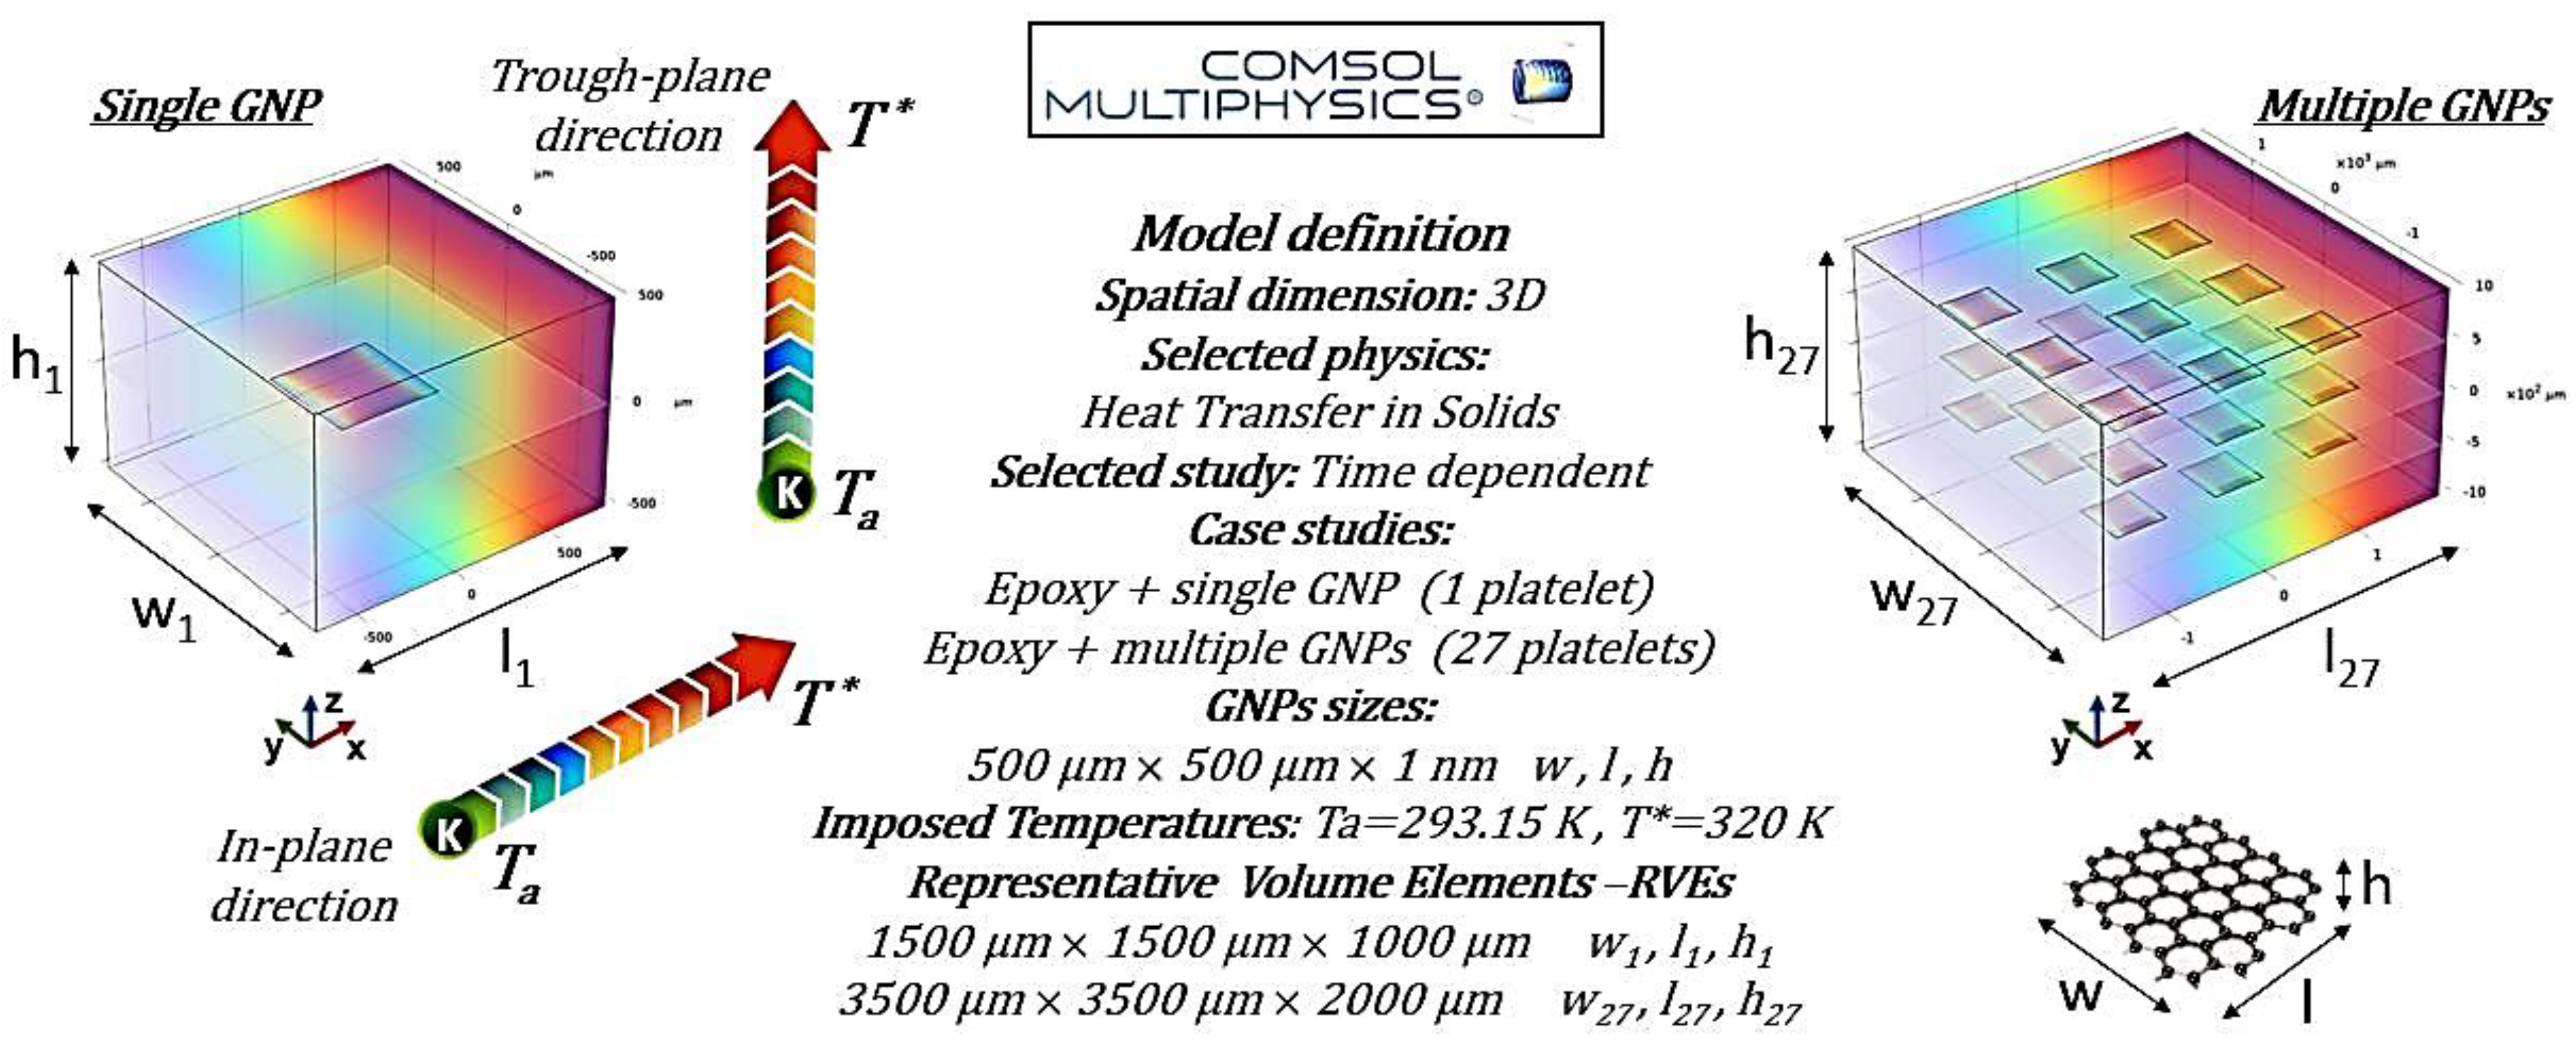
This section presents multiphysics simulation results examining the influence of the number and orientation of graphene platelets within the matrix on the thermal properties of the resulting materials. The analysis focuses on heat flux, thermal conductivity, and the spatial-temporal temperature distribution, offering insights into the heat transfer mechanisms governing these composites.
3.3.1. Case Study of a Single Graphene Platelet Parallel to the xy-Plane
The preliminary results presented in this subsection highlight the influence of a single graphene nanoplatelet (GNP) embedded in a resin matrix. The orientation of the GNP is set to 0 radians, meaning that it lies parallel to the x-y plane.
Figure 8a presents the evolution of the temperature with time. The temperature decreases in both directions, but it is slower in the in-plane direction (x-direction) than in the through-plane direction (z-direction).
Figure 8b illustrates the evolution of the total heat flux components with time along the in-plane (x-direction) and through-plane (z-direction) directions. Initially, during the transient phase, both flux components decayed sharply in accordance with the temperature decrease in the same directions, and then each component was shown to asymptote to a different constant value once the equilibrium conditions were reached. Specifically, the flux in the z-direction decayed faster than the x-direction and reached a steady-state value (Q
z = −6304.2 W/m
2) after about 2 s, which is higher than the one reached along the x-direction after about 3 s (Q
x = −4451.6 W/m
2) because the temperature gradient along z was much higher than the gradient in the x-direction, even though the thermal conductivity in the plane was higher than that across the plane.
On the other hand, considering the balance equations for each component in a single direction, it is possible to determine the characteristic time of the conductive phenomenon in a particular direction:
where α
gj and α
pj and L
igj and L
ipj represent the thermal diffusivity and length of the graphene and polymer subdomain in the j-direction. In particular, the characteristic times of the conductive phenomenon are longer along the x-direction for both the graphene and polymer considered separately so that the characteristic time of the overall conductive phenomenon in the entire composite domain appears slower in the x-direction than in the z-direction.
This implies that an increase in material length leads to a lower heat flux, as the heat requires more time to propagate through the material. This effect is more pronounced in directions where the characteristic conduction time is larger, such as in the
x-direction. In brief, the heat flux decreases with increasing length, as a longer thermal pathway results in extended thermal equilibration times. The numerically calculated thermal conductivity of the resulting structure in the x-direction (λ
x = 0.2487 W/mK) is slightly higher than the intrinsic thermal conductivity of the pure resin (0.235 W/mK). This increase suggests that even a single graphene nanoplatelet enhances the in-plane heat transfer, albeit modestly. However, the thermal conductivity in the z-direction (λ
z = 0.2350 W/mK) remains almost identical to that of pure resin, indicating that the presence of the graphene platelet does not significantly impact heat transport in this direction. All numerically calculated thermal data are reported in
Table 2.
The two graphs in
Figure 9 illustrate the temperature evolution along the symmetrical axes in both the in-plane direction in panel (a) and the through-plane direction in panel (b) of the composite material over time.
In the in-plane direction, the temperature distribution shows sharp discontinuities at approximately 500 µm and 1000 µm, corresponding to the resin–graphene platelet interfaces. Within the graphene region, the temperature remains constant, forming a plateau-like profile due to the platelet’s high thermal conductivity, whereas a gradual temperature gradient emerges in the surrounding resin. These discontinuities arise from the stark contrast in thermal properties, as the resin’s lower conductivity restricts heat conduction. Conversely, in the direction of the through plane, the temperature distribution follows a smooth gradient without significant jumps. The thin nature of the graphene platelet limits its influence on heat transfer, resulting in higher thermal resistance and less efficient conduction across its thickness compared to its plane. Overall, the results highlight the composite’s strong thermal anisotropy, with superior heat propagation along the graphene plane. This behavior is crucial for designing thermally conductive composites, particularly in applications like electronics, thermal management, and advanced structural materials.
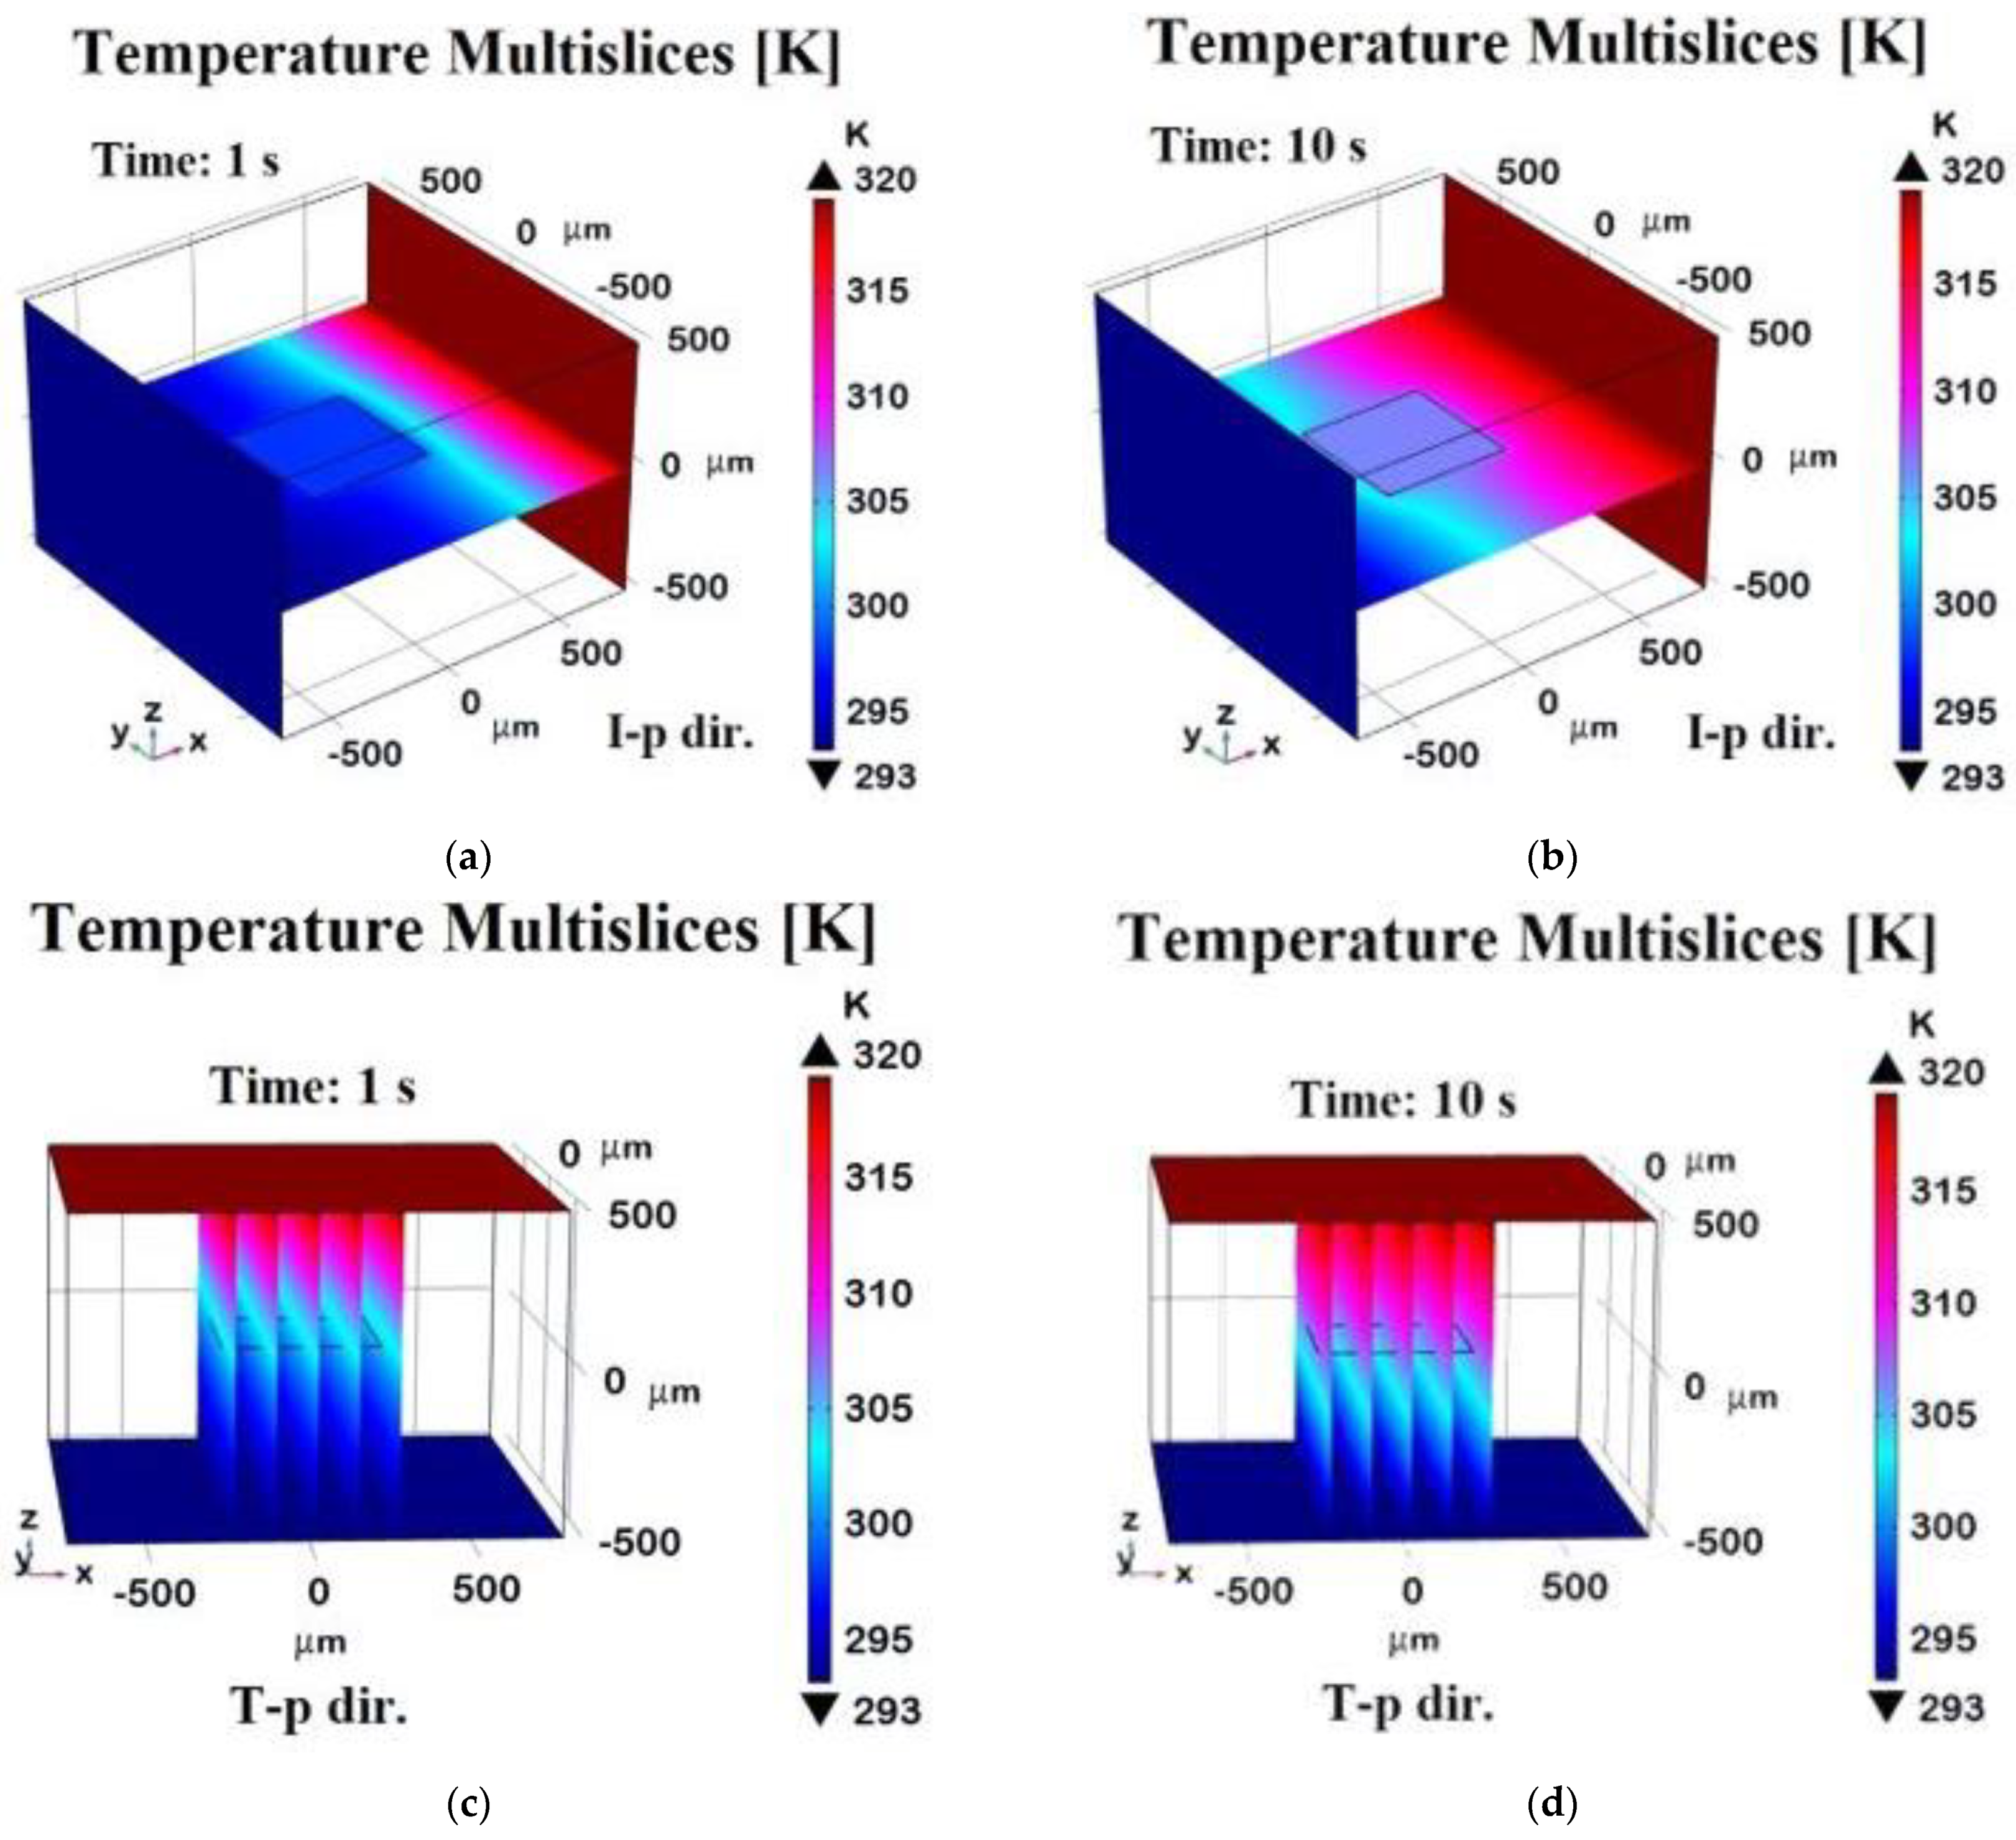
Figure 10 presents a 3D visualization of temperature distribution at t = 1 s and t = 10 s for in-plane (x-direction) and through-plane (z-direction) heat transfer. In detail, such temperature profiles are evaluated on a plane pass for the symmetric axis of the zy-plane distribution in the case of in-plane (I-p dir.) analysis or evaluated along transversal planes with respect to the xy-plane of graphene in the case of through-plane (T-p dir.) investigations. At t = 1 s in the x-direction (
Figure 10a), a strong temperature gradient separates hotter and cooler regions, indicating incomplete heat diffusion. By t = 10 s (
Figure 10b), the system reaches a near-steady state with a uniform thermal profile due to graphene’s high in-plane conductivity. Conversely, in the z-direction, temperature gradients remain more pronounced at t = 1 s (
Figure 10c) and persist at t = 10 s (
Figure 10d), though the gradient is somewhat smooth. This highlights graphene’s anisotropic thermal properties, with much lower conductivity in the through-plane direction.
Figure 11 presents the total heat flux, specifically the x-component for the in-plane direction (a) and the z-component for the through-plane direction (b), evaluated at different time points. In the in-plane direction (panel a), the graphene platelet spans the region from 500 µm to 1000 µm along the x-axis, occupying almost half of the observed length. The curves at different times (up to t = 10 s) reveal that the heat flux increases sharply within this interval, reflecting the high thermal conductivity of graphene compared to the surrounding resin. Over time, the flux profile evolves as heat penetrates the material, but the graphene region consistently exhibits a higher flux, indicating more efficient lateral heat transfer. In the through-plane direction (panel b), the platelet extends by only 1 nm, creating a much thinner conductive layer. The flux, therefore, rises in this narrow band, though less dramatically than in the in-plane case since the path for conduction is limited by the platelet’s small thickness. The inset in the right figure provides a magnified view of this zone, highlighting the local increase in flux as heat crosses the graphene layer. Despite the short distance, the platelet still enhances through-plane conduction relative to the surrounding resin, yet its impact is not as pronounced as it is along the in-plane axis.
To conclude, the four 3D plots in
Figure 12 illustrate the evolution of the heat flux component along different directions at different time points. The top row displays the heat flux in the
x-direction, evaluated on a plane passing through the graphene sheet at t = 1 s (a) and at t = 10 s (b). The bottom row represents the heat flux distribution in the
z-direction, evaluated along a transversal plane at t = 1 s (c) and at a steady state (t = 10 s, d). Compared to the previous 2D plots, these distributions provide insights into the temporal evolution and spatial localization of the heat transport within the domain. In the x-direction, at t = 1 s, the heat flux is concentrated near the graphene sheet, indicating strong in-plane conduction. By t = 10 s, the flux stabilizes at a higher value and spreads more evenly due to graphene’s high in-plane conductivity. In the z-direction, at t = 1 s, a strong gradient near the graphene sheet shows that heat is primarily dissipated through the plane. By t = 10 s, the distribution becomes more uniform.
The next few studies will explore how multiple graphene layers in a 3 × 3 arrangement with varied orientations influence overall thermal conductivity.
3.3.2. Case Study—Influence of Multiple Graphene Platelets Orientation Relative to Heat Flux Direction on Thermal Properties
Given their highly anisotropic thermal conductivity, graphene platelets play a crucial role in determining heat transfer efficiency and the overall thermal performance of the material. Their orientation relative to the heat flux direction significantly influences the distribution and dissipation of thermal energy, affecting key properties such as thermal conductivity, heat flux pathways, and temperature gradients.
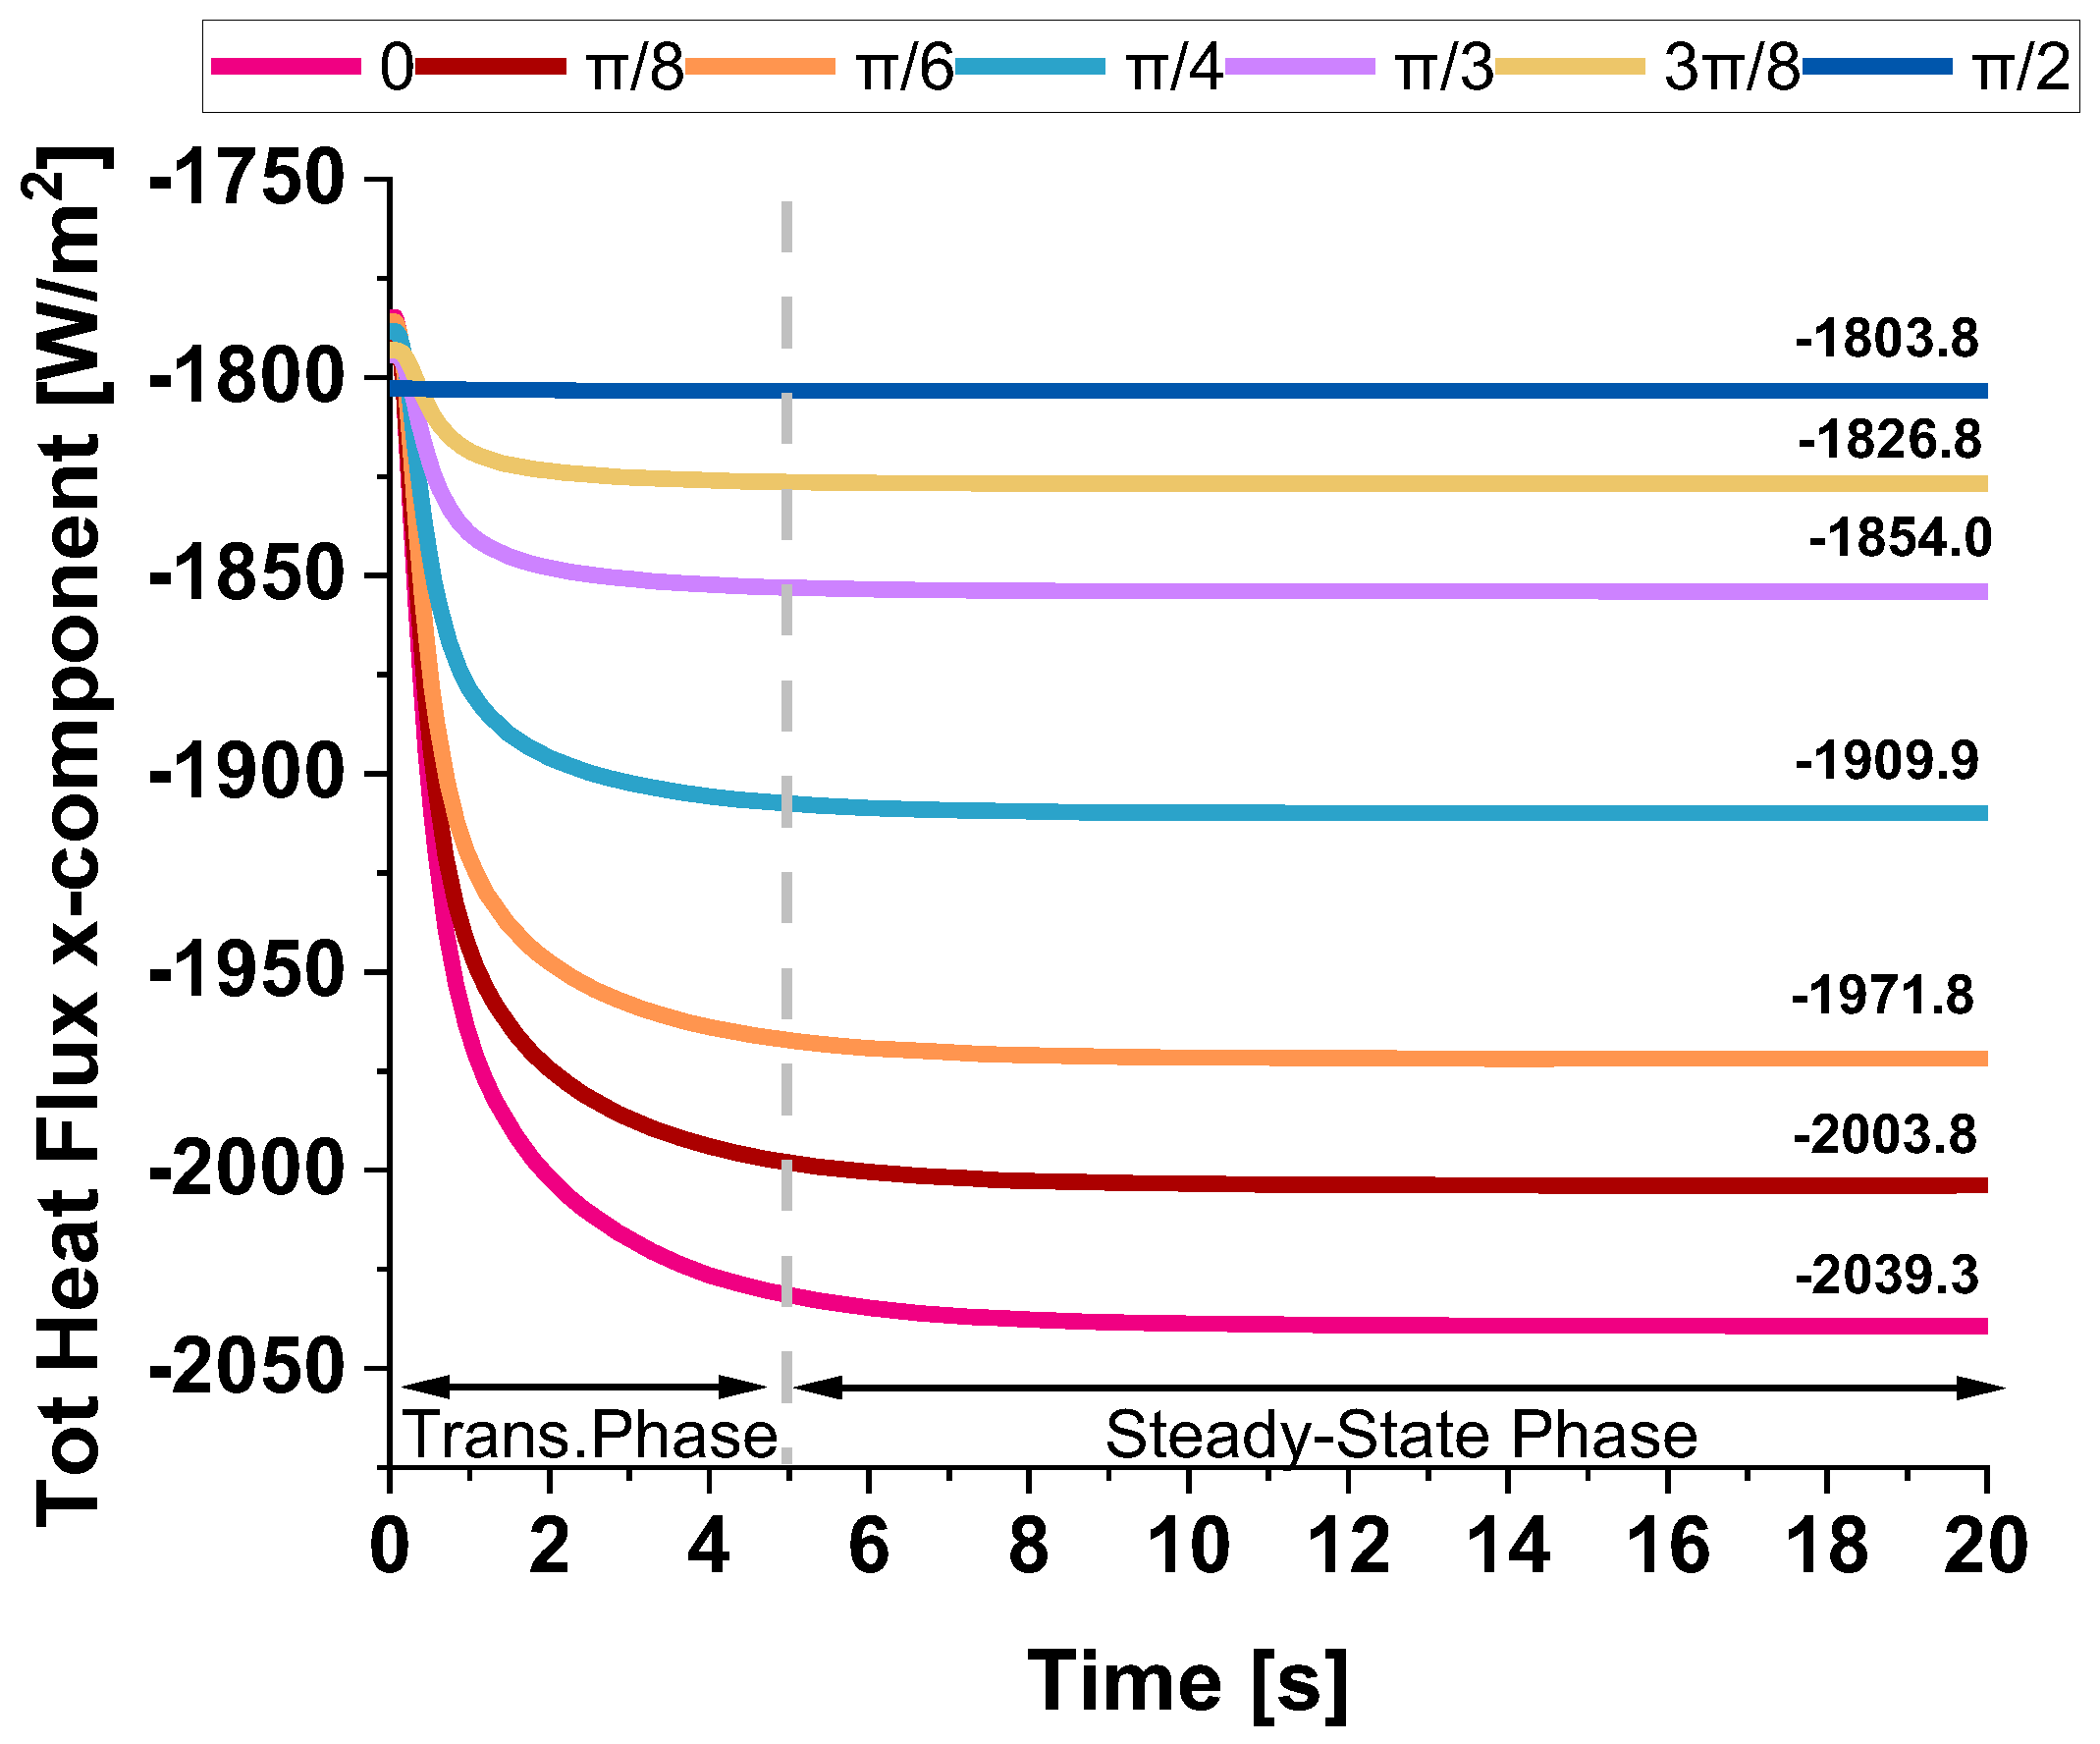
Figure 13 illustrates the evolution of the total heat flux (x-component) evaluated in the in-plane direction over time for different angles between the heat flow and the graphene plane, specifically from 0 up to π/2. The observed behavior reveals two distinct phases. Initially, there is a rapid decrease in heat flux, indicating a transient phase where heat redistributes quickly within the system. This sharp decline suggests that the material promptly reacts to thermal excitation before stabilizing. As time progresses, the flux approaches a steady-state value after approximately 5 s, where the rate of change diminishes, and the system reaches equilibrium. The final flux values depend on the angle, with a clear trend showing that the heat flux decreases as the angle increases.
Table 3 provides a detailed analysis that underscores the significant anisotropy in the thermal transport properties of graphene, encapsulating the previously discussed heat flux values and the newly computed thermal conductivity in the x-direction for various graphene nanoplatelet (GNP) orientations. The data confirmed that graphene exhibits directional dependence in its thermal transport behavior, where heat transfer is most efficient when GNPs are aligned parallel to the heat flux direction. Specifically, at an orientation angle of 0°, the system demonstrates the highest thermal conductivity value of 0.2635 W/mK, accompanied by the highest heat flux of −2039.3 W/m
2, highlighting graphene’s superior in-plane thermal transport properties. As the orientation angle increases, the thermal conductivity and heat flux progressively decrease. This reduction is more noticeable at intermediate angles, specifically at π/4 and π/3, where the values exhibit a more substantial decline, reflecting the inherent anisotropic nature of the material. At the extreme angle of π/2, which represents a perpendicular alignment to the heat flux direction, the thermal conductivity drops to 0.235 W/mK, and the heat flux reaches −1803.8 W/m
2, confirming that a perpendicular alignment significantly impedes heat transfer, further illustrating the material’s anisotropic behavior. These results reinforce the concept that the efficiency of thermal conduction in graphene is highly dependent on its orientation relative to the heat flux direction. The findings also underscore the importance of considering this anisotropy when designing devices or materials that require precise control over thermal management, especially in applications where directional heat dissipation plays a critical role. The pronounced difference in thermal conductivity between the in-plane and through-plane directions reveals graphene’s potential in specific thermal management applications where heat needs to be directed or controlled in particular orientations.
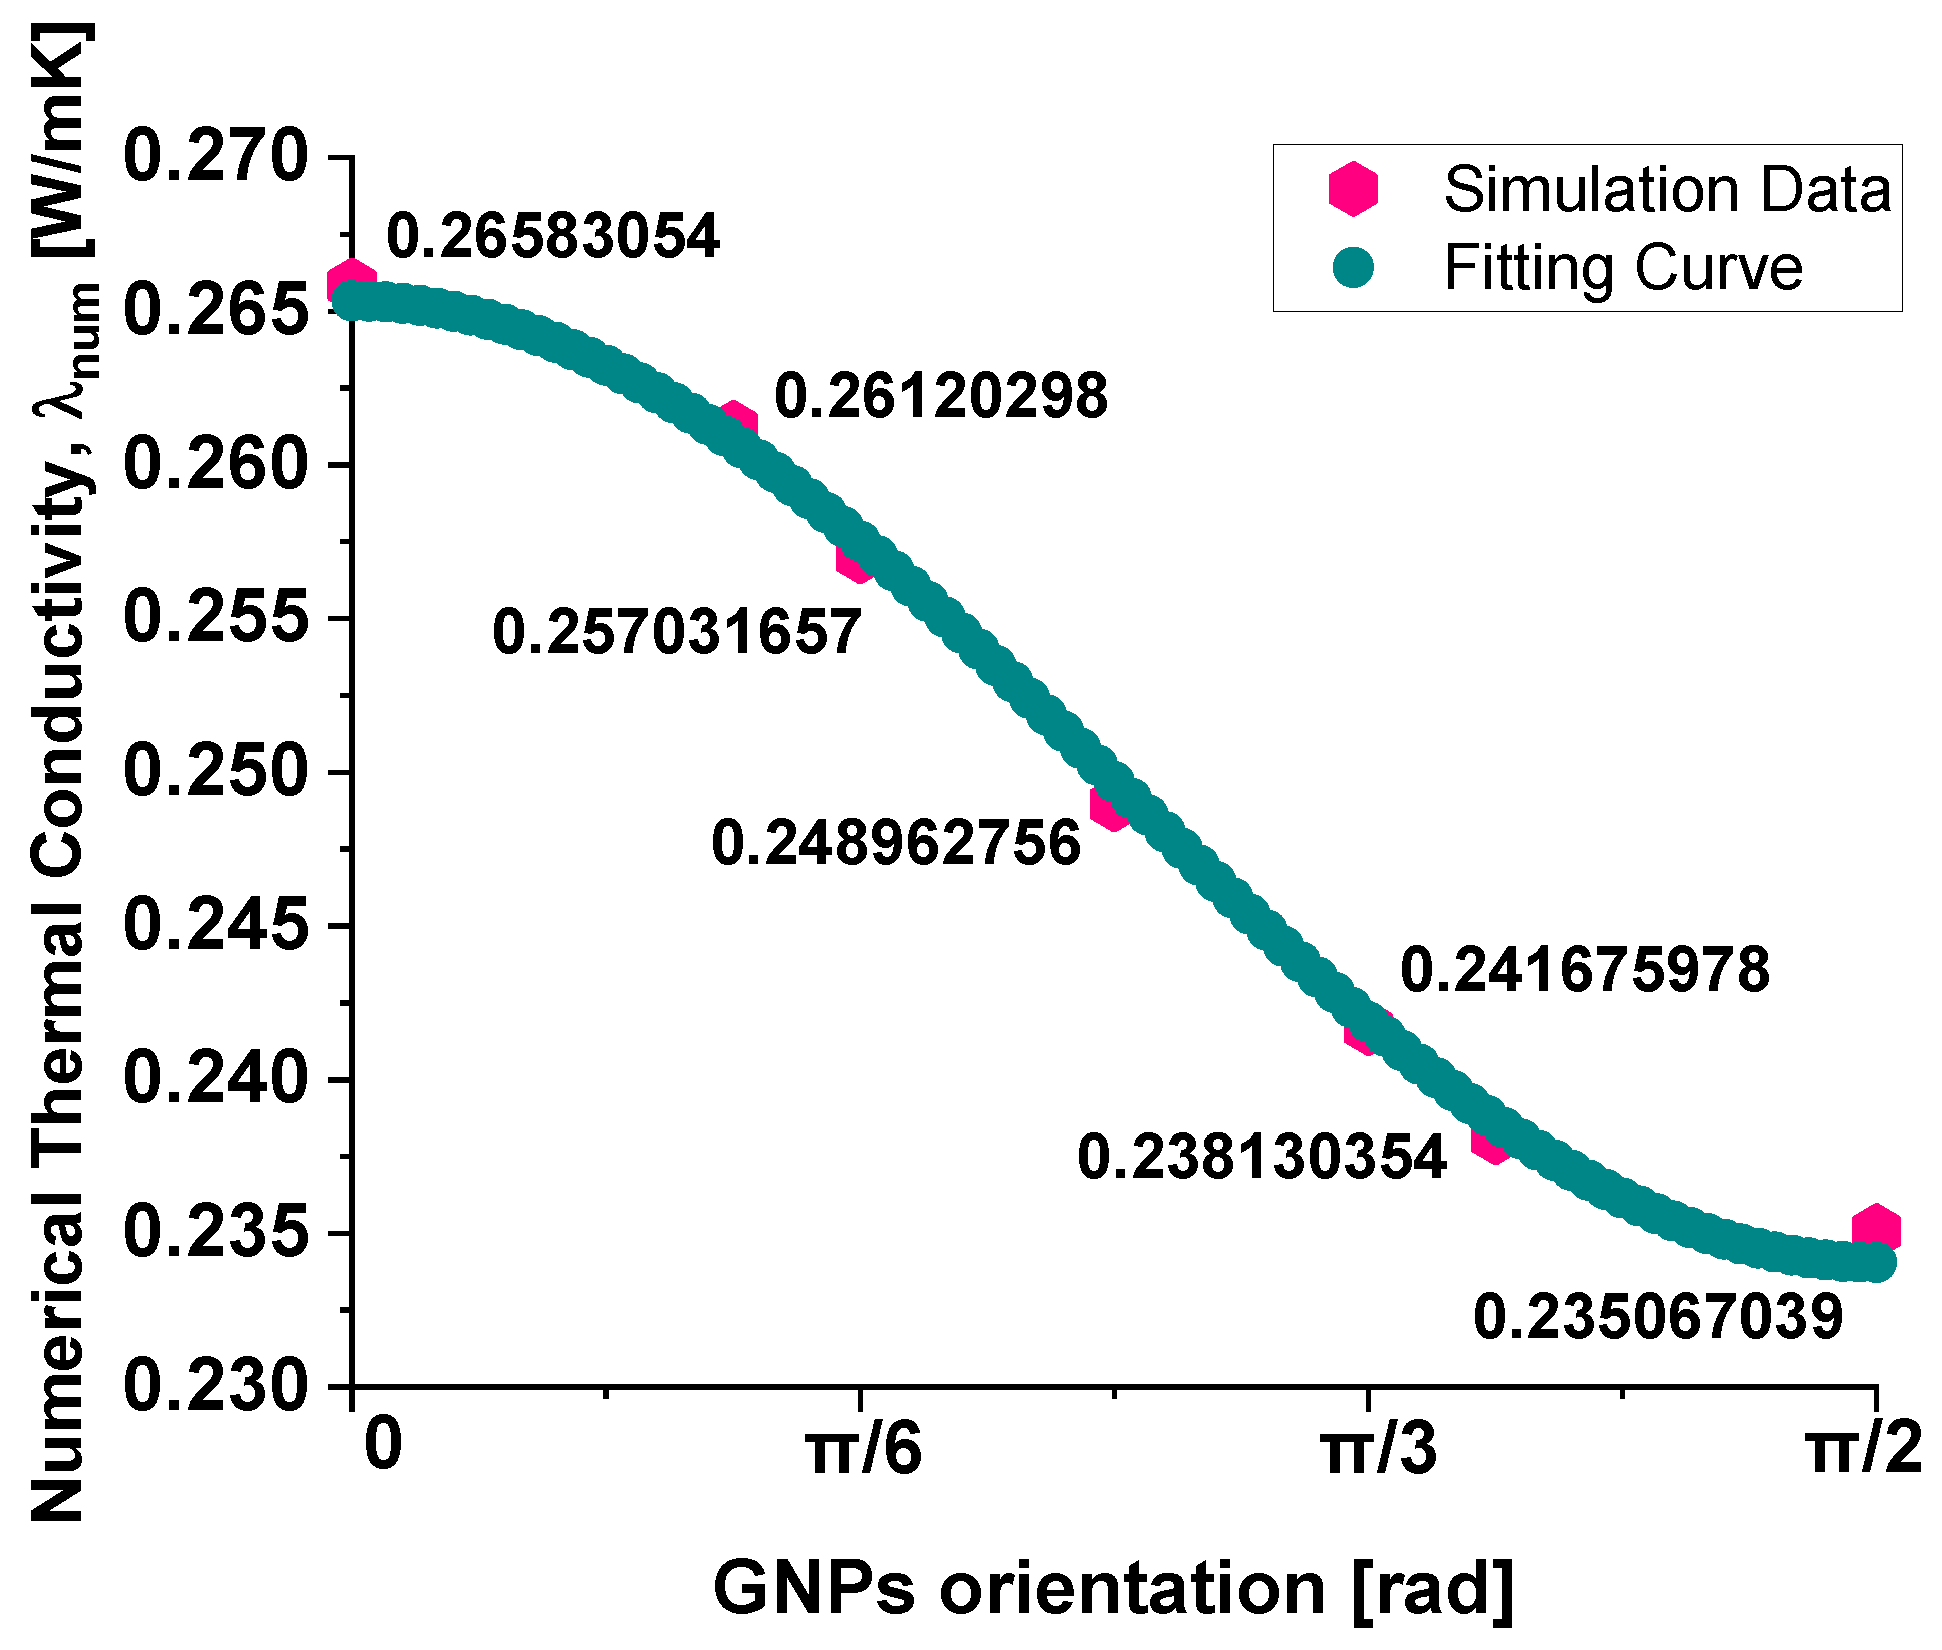
The macroscopic thermal conductivity of the composite appears to follow the empirical law shown in Equation (13), which provides a good interpolation of the numerical data, as evident from the graphical plot in
Figure 14.
This equation expresses conductivity as a function of the sine and cosine squared terms, suggesting a dependency on the angular orientation of the graphene nanoplatelets, i.e.,.
The optimal values for the coefficients A, B, and C, ensuring the best fitting results, are as follows: A = 0.07998, B = −0.15407, and C = 0.18536.
This correlation aligns with the assumption made for the intrinsic thermal conductivity of the individual graphene sheets (
, represented by the following equation:
The above equation models the thermal conductivity of anisotropic graphene, where the conductivity along different directions—denoted by θ, corresponding to the angle between the heat flow direction and the GNP plane—follows a power-law combination of cosine and sine terms.
This formula reflects the anisotropic behavior of graphene, which has the highest thermal conductivity when heat flows along the plane (θ = 0, so λg,intr (0) = λI-p dir.) and the lowest thermal conductivity when heat propagates perpendicular to the plane (θ = 90∘, so λg,intr (90°) = λT-p dir.).
By assuming such a dependence at the microscopic level for the individual GNPs, the macroscopic behavior of the composite naturally follows a similar angular dependency. The key idea is that the macroscopic conductivity results from the averaging of the anisotropic thermal properties of the individual graphene sheets, weighted by their orientation distribution within the composite. The interpolation law in the above Equation (13) thus emerges as a consequence of the orientation-dependent conductivity model used for the graphene inclusions.
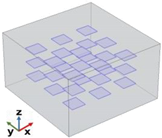
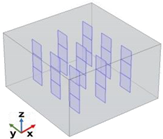
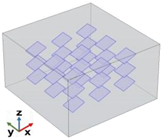
3.3.3. Case Study: Thermal Properties of Multiple Graphene Platelets (27) with Aligned, Random, and Perpendicular Orientations with Respect to the xy-Plane
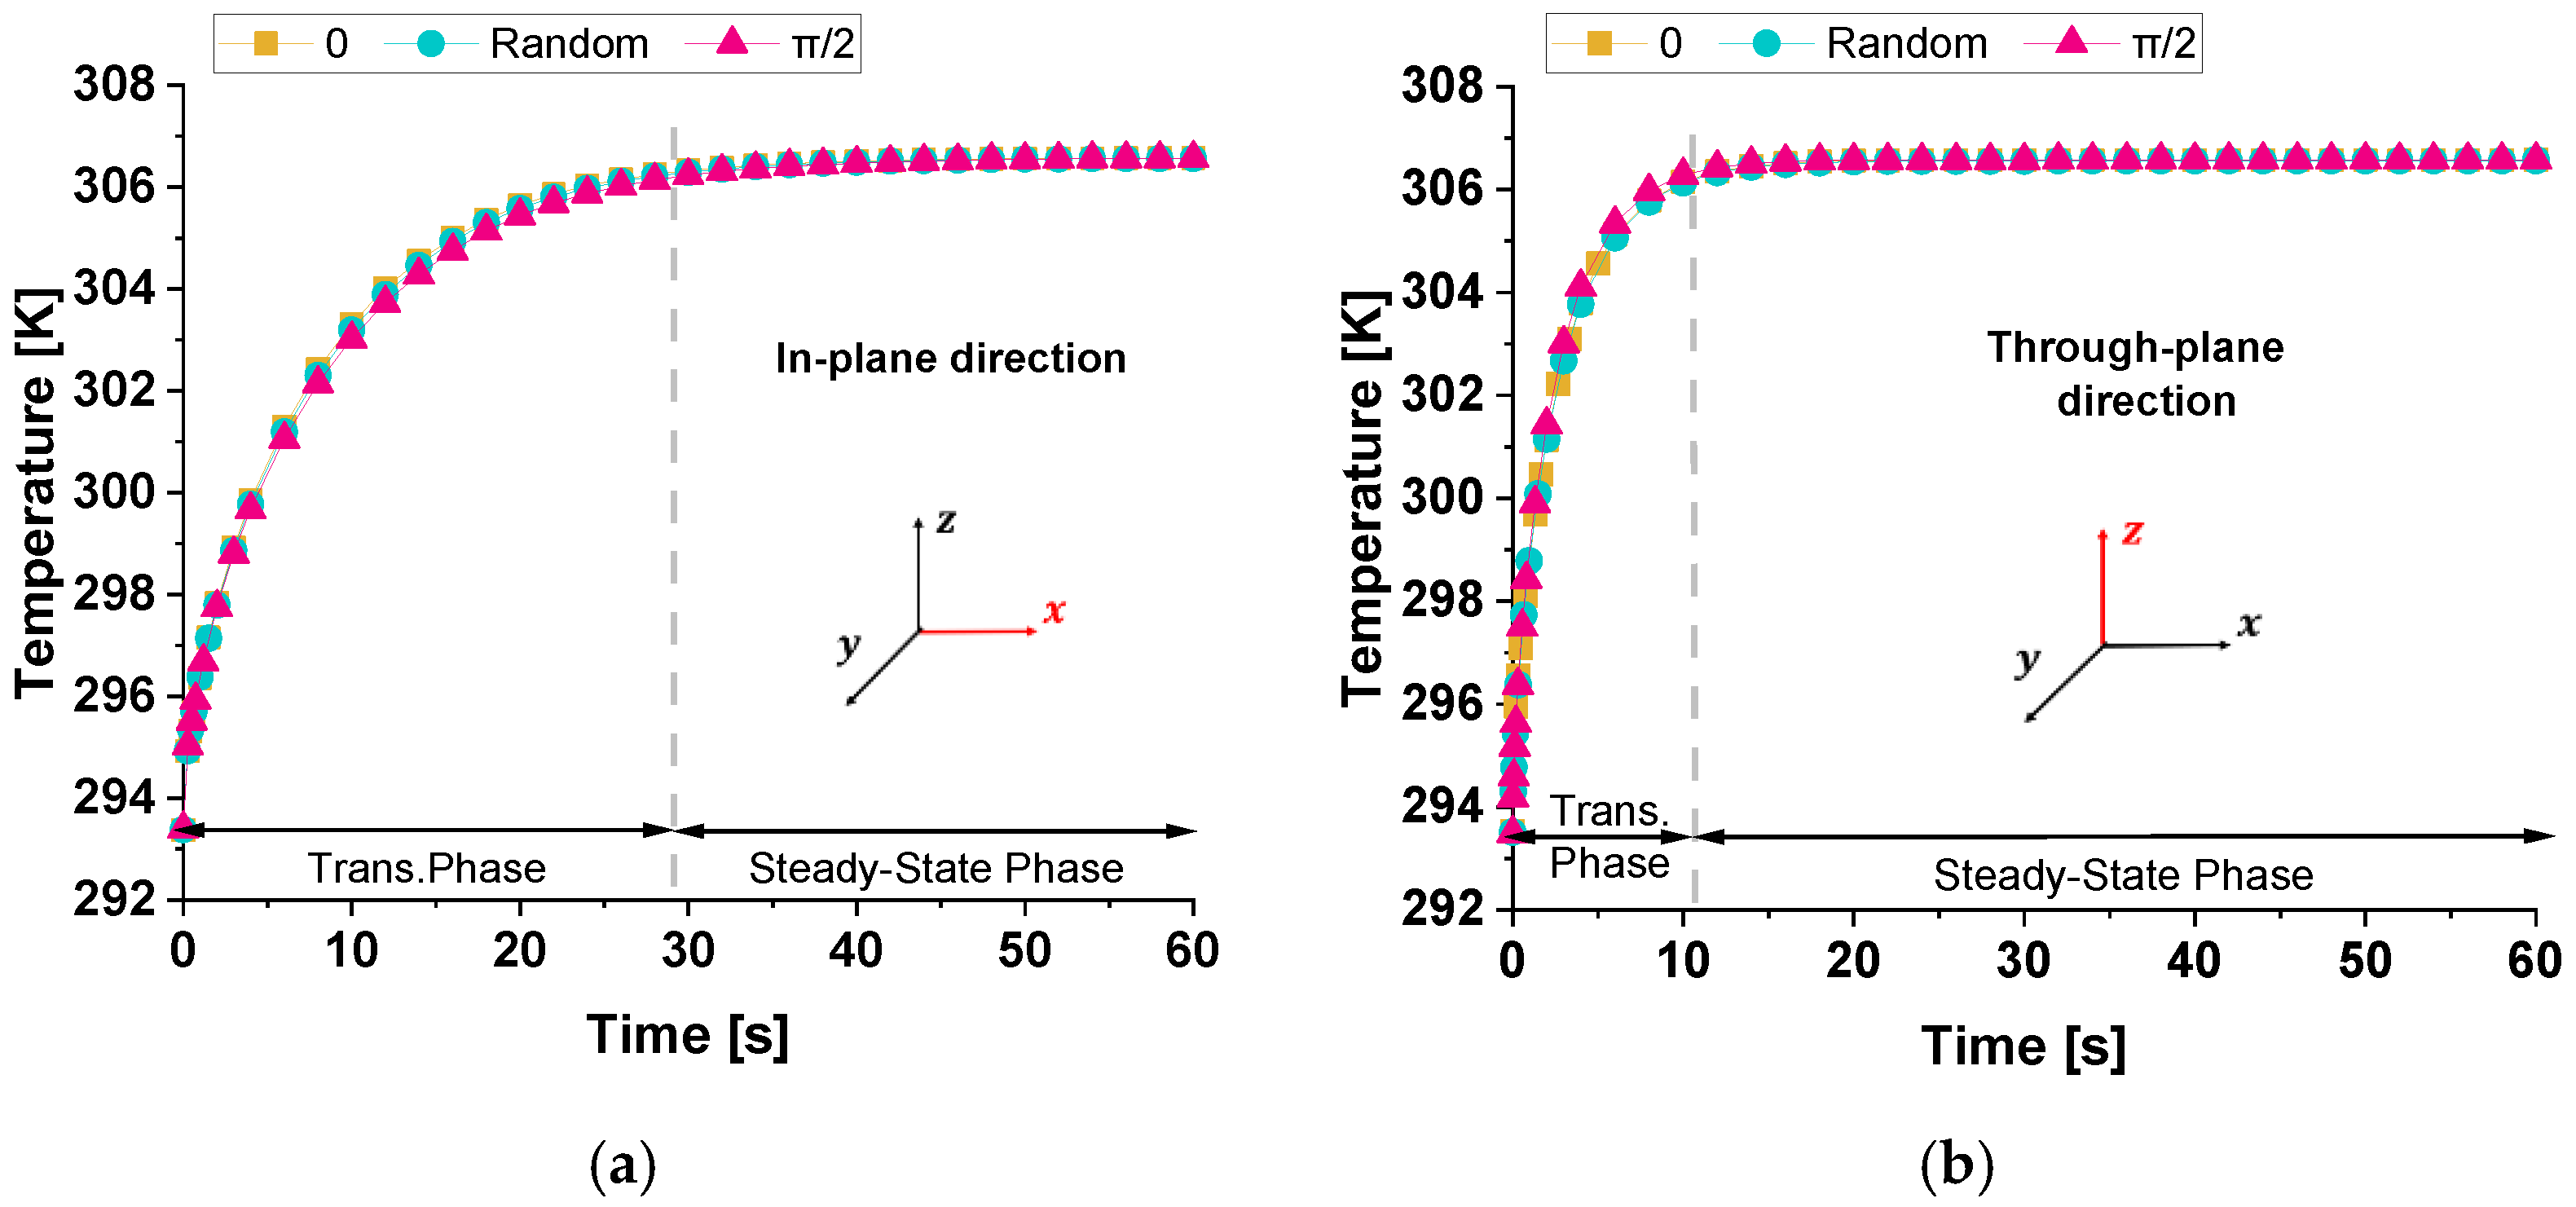
Figure 15 illustrates the time evolution of temperature (probe domain) for three different cases: 0, π/2, and the random orientations of graphene nanoplatelets relative to the xy-plane when the heat flow is in the in-plane direction (panel a) and in the through-plane direction (panel b). In both cases, since the variation in thermal conductivity among the three cases is relatively minor (λ
0 ≈ λ
π/2 ≈ λ
Random), the heat transfer mechanism remains similar, leading to almost indistinguishable temperature responses. The comparison between the two graphs highlights a significantly slower transient in temperature evolution when the temperature difference is applied along the x-direction rather than the z-direction. This slower response (about 30 s against 10 s, respectively) is due to the greater spatial extent in the x-direction, which influences the heat diffusion dynamics. As theoretically expected, the equilibrium temperature remains unchanged.
The two plots in
Figure 16 report the total heat flux (x-component) computed in the in-plane direction (panel a) and in the through-plane direction (panel b) for the three different GNPs orientations—0, random, and π/2—within the low-conductivity resin matrix.
Each curve exhibits a transient phase that transitions into a steady-state regime, although the transient period in the through-plane direction is notably shorter than in the in-plane direction (from about 3 s to about 5 s).
This difference arises because the distance over which the temperature difference that is applied in the z-direction is smaller, allowing the system to reach thermal equilibrium more rapidly.
The orientation of the GNPs, which have much higher thermal conductivity than the resin, plays a key role in determining the steady-state flux.
When GNPs are aligned parallel to the main heat flow (orientation 0), the effective thermal conductivity is higher, leading to a greater flux (−2039.3 W/m2).
Conversely, when they are perpendicular (π/2), the flux is lower (−1803.3 W/m2). In both directions, the random orientation yields intermediate results, reflecting a partial alignment effect.
These observations highlight the importance of anisotropy and the geometric configuration for achieving optimal thermal management in composite materials.
Once again, when comparing the transient phase durations across the temperature evolution (previous
Figure 15) with those in the total heat flux, it is evident that the temperature transient phase is significantly longer. While the heat flux reaches steady-state conditions within a few seconds (approximately 5 s), the temperature requires around 10 or 30 s to stabilize. As previously discussed for a single graphene sheet, the prolonged transient temperature phase is due to the material’s thermal inertia, characterized by its heat capacity and diffusivity, while the rapid stabilization of the heat flux follows Fourier’s law, which depends directly on the imposed thermal gradient.
In summary, the presented numerical results suggest that in practical applications, modifying the orientation of graphene nanoplatelets within this range would not significantly affect the overall temperature field. However, it can still influence the local heat flux distribution, as different orientation values result in different steady-state heat fluxes.
Table 4 compiles the previously discussed heat flux data and the numerical thermal conductivities calculated in both analyzed directions for the different graphene sheet orientation scenarios. In the first configuration, where the graphene sheets are aligned at 0°, the corresponding thermal conductivity values are 0.2658 W/mK in the x-direction and 0.2351 W/mK in the z-direction. This configuration shows better heat transfer along the x-axis due to the alignment of the graphene sheets, but the z-direction conductivity remains relatively low. In the second configuration, the random orientation of GNPs results in more isotropic behavior, with slightly reduced thermal conductivity in the x-direction (0.2540 W/mK), which improves (0.2431 W/mK) in the z-direction compared to the 0° aligned case. In the third and last configuration, where the graphene sheets are aligned at 90°, the thermal conductivity values are 0.2351 W/mK in the x-direction and 0.3734 W/mK in the z-direction. This configuration greatly enhances heat transfer along the z-direction at the expense of reduced conductivity in the x-direction, demonstrating strong anisotropy. Overall, the 0° aligned configuration favors heat transfer in the x-direction, while the random configuration provides a balance between the x and z directions, making it more isotropic. In contrast, the
π/2 aligned configuration enhances heat transfer in the z-direction, making it the best choice for applications requiring efficient vertical heat dissipation.
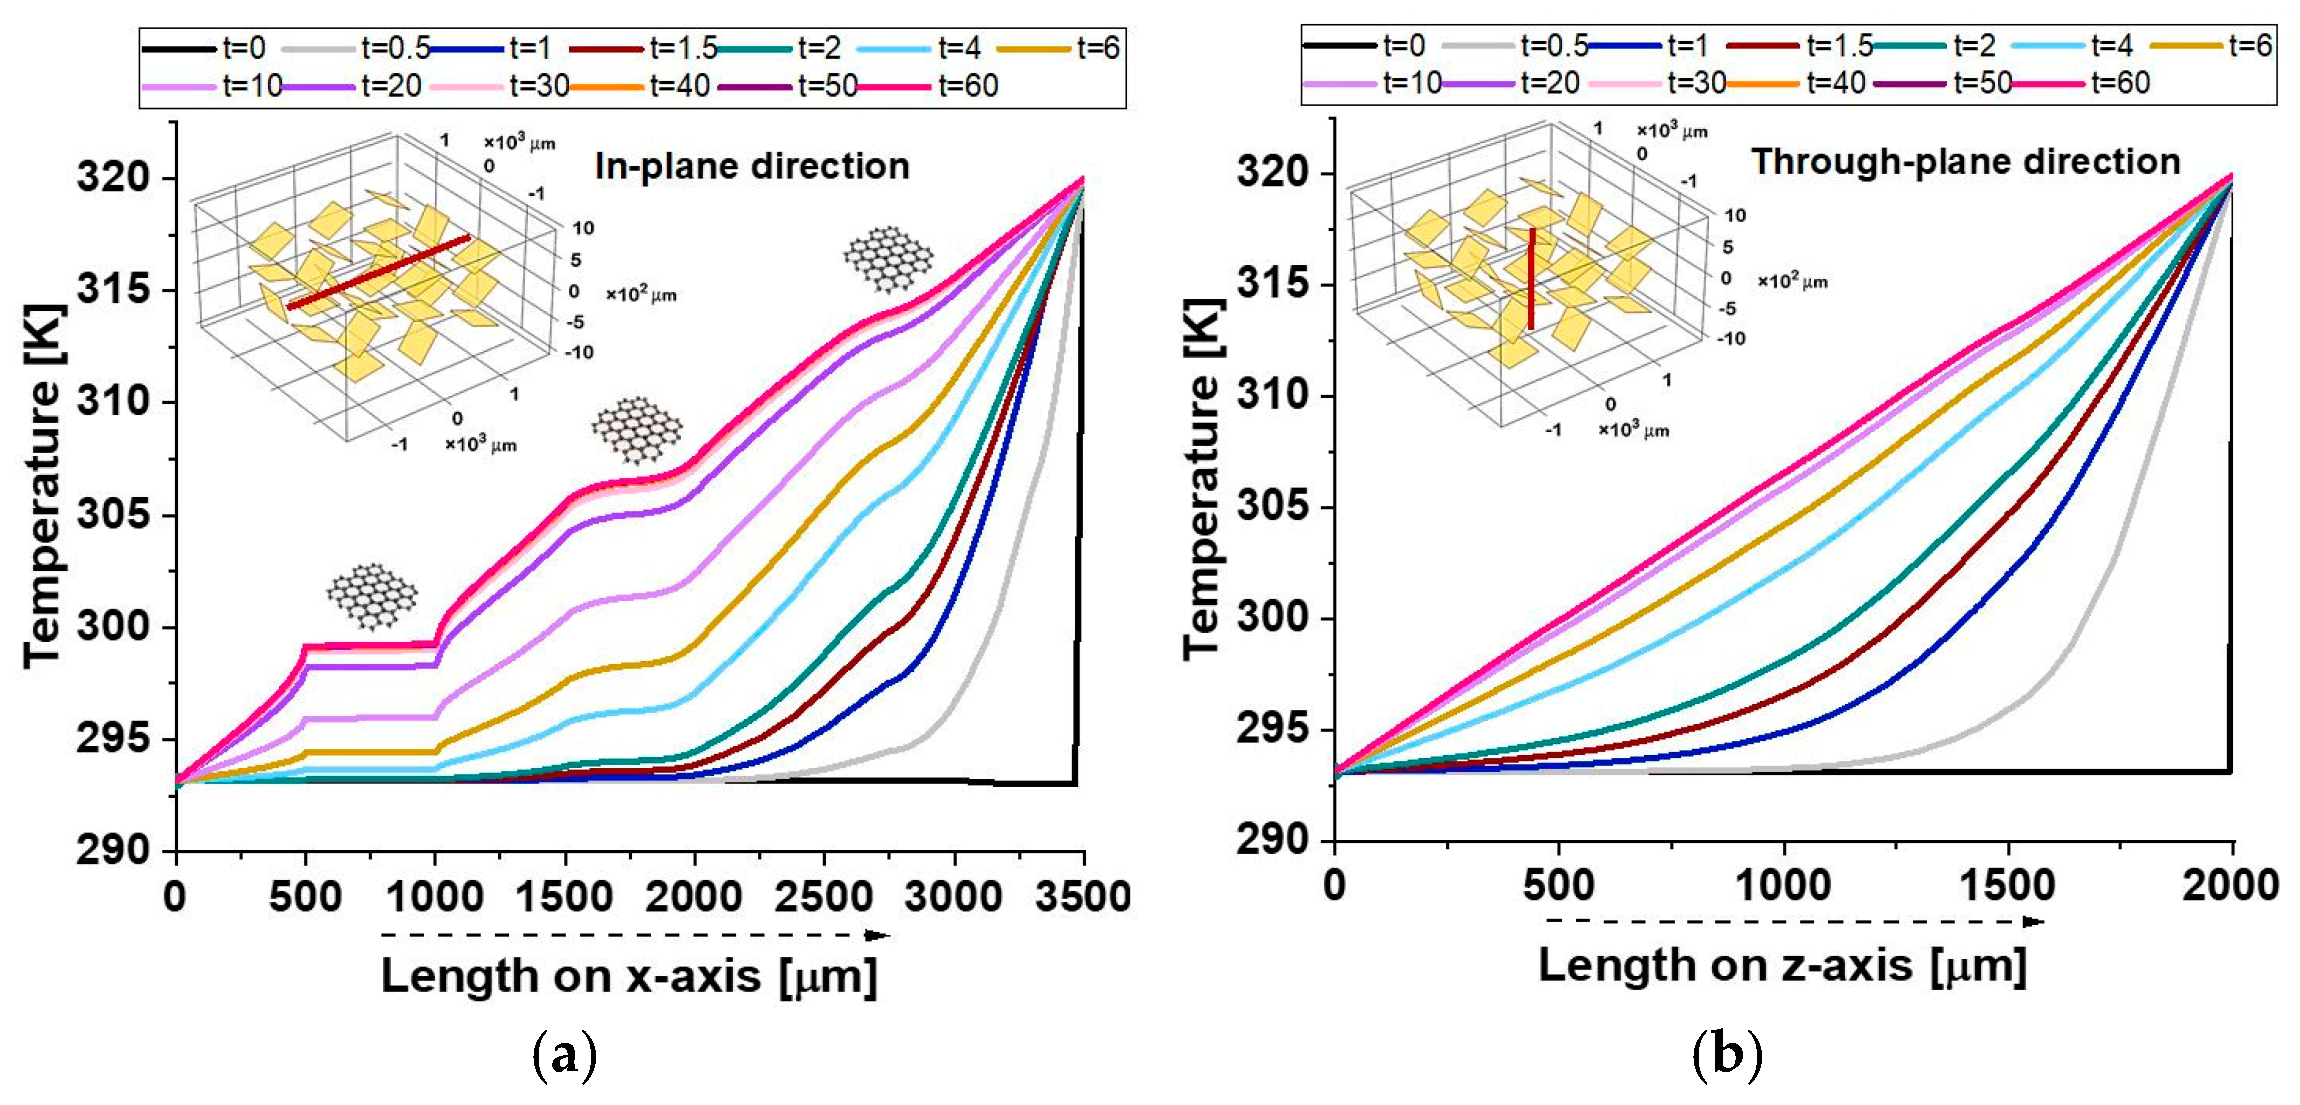
Figure 17 provides additional evidence of the composite’s anisotropic thermal response, as highlighted by the observed temperature distributions.
In the in-plane direction (a), plateaus correspond to the crossing of graphene nanoplatelets (GNPs), which, given their alignment along the analysis axis and their high intrinsic thermal conductivity, facilitate localized thermal equilibrium, reducing temperature gradients within their regions.
As a result, temperature gradients within these regions are minimized, allowing for efficient heat conduction along the plane.
On the other hand, the through-plane profile (b) exhibits a smooth temperature distribution, as the GNPs are only present in their minimal thickness direction. This limits their effectiveness in influencing the heat flow in the through-plane direction.
Consequently, the temperature remains more uniform in the through-plane profile, reflecting the dominance of lateral heat conduction within the composite material.
The relatively poor thermal conductivity in the through-plane direction can be attributed to weak interfacial thermal resistance and limited connectivity between the filler particles, which impede efficient heat transfer.
This stark contrast between the in-plane and through-plane profiles emphasizes the importance of the material’s orientation and structural properties in governing its thermal transport behavior.
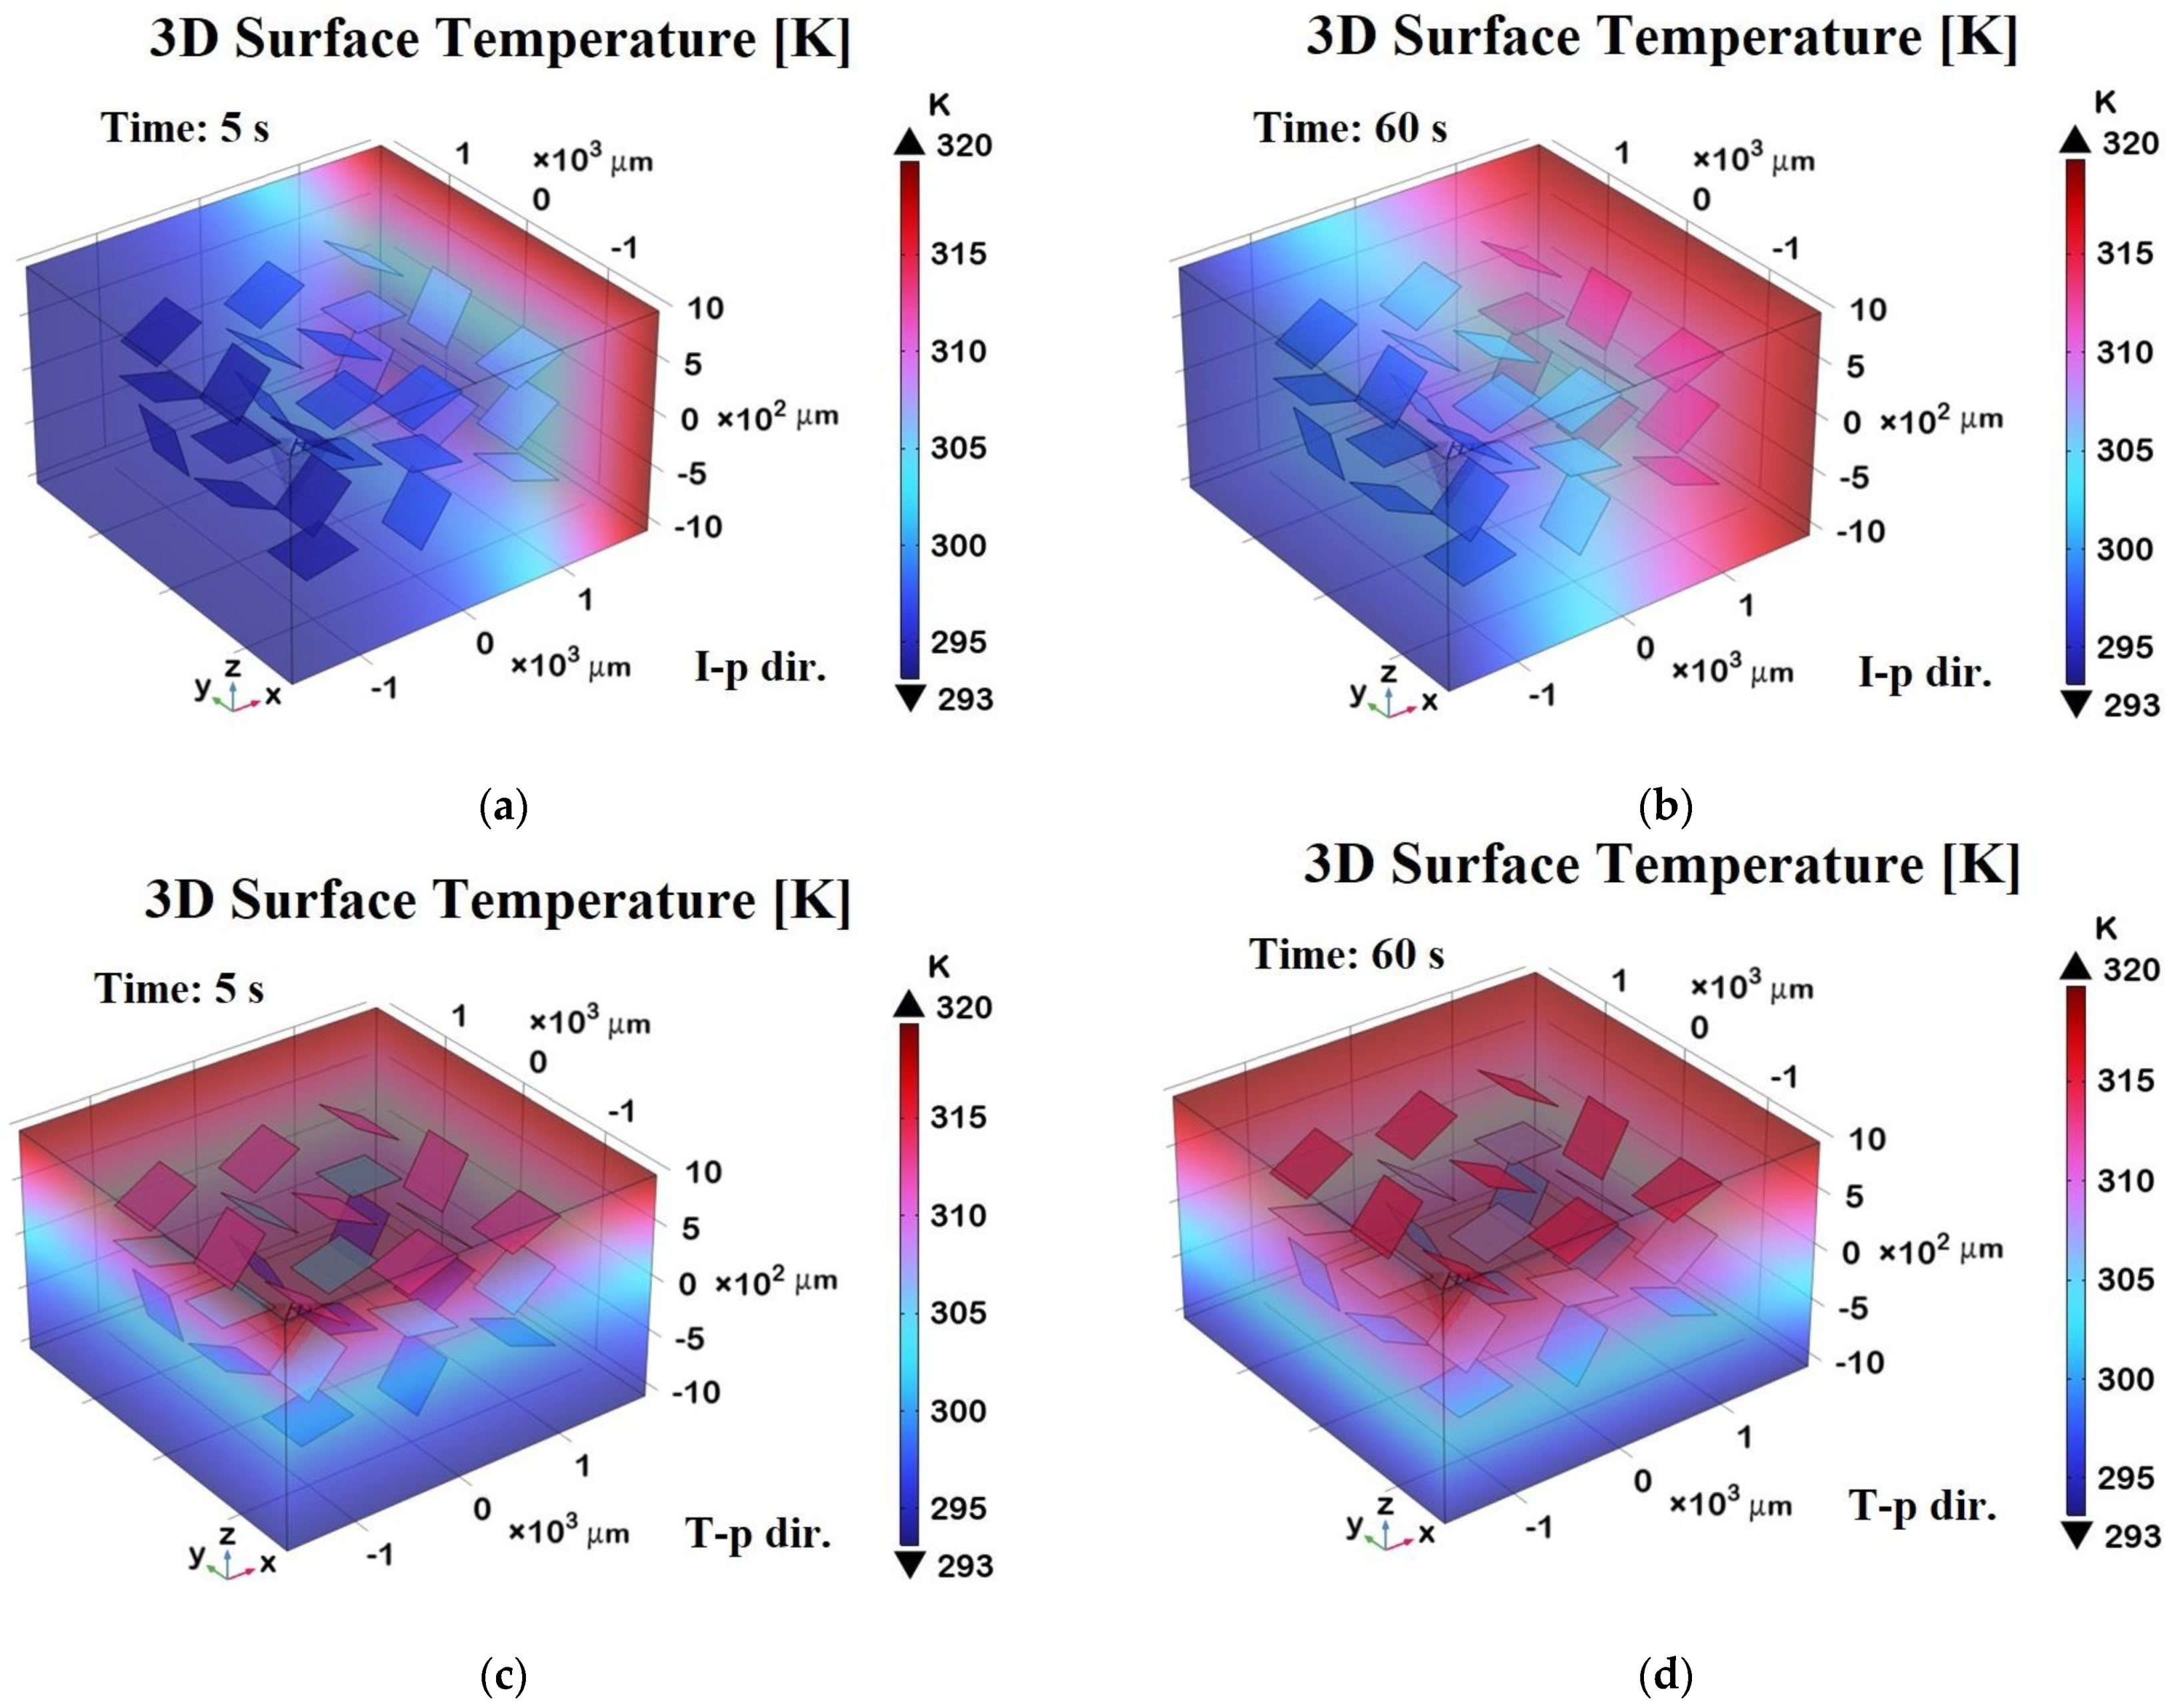
Figure 18 shows 3D surface temperature distributions at two different time points—t = 5 s (transient phase) and t = 60 s (steady state)—along two orthogonal directions relative to the graphene sheets embedded in the composite.
Panels (a) and (b) represent the in-plane (I-p dir.) temperature fields at 5 s and 60 s, respectively, while panels (c) and (d) show the through-plane (T-p dir.) distributions at the same time points.
In panel (a), during the transient regime, the temperature begins to diffuse primarily along the in-plane direction, following the high thermal conductivity pathways defined by the graphene sheets. After 60 s, as shown in panel (b), the temperature distribution becomes more uniform and widespread in-plane, indicating that the thermal equilibrium has been largely reached along this direction.
Panels (c) and (d), corresponding to the through-plane direction, clearly demonstrate a slower heat diffusion process due to the limited thermal conductivity of the resin matrix in the direction orthogonal to the graphene sheets. After 5 s (panel c), the heat penetration is still superficial, while at 60 s (panel d), a more gradual but still non-uniform distribution persists, highlighting the anisotropic thermal response of the composite.
Overall, the 3D representation in these panels offers a richer understanding of the heat propagation dynamics compared to the 2D plots, making the anisotropic effects and the role of graphene’s orientation more visually and quantitatively evident.
In
Figure 19, the heat flux components further illustrate the anisotropic thermal transport in the composite.
In the in-plane direction (a), the flux exhibits periodic dips, aligning with the positions of graphene nanoplatelets (GNPs). This pattern results from the high thermal conductivity of GNPs, which locally redistribute heat, creating non-uniform flux variations. Conversely, in the through-plane direction (b), the flux decreases smoothly as heat encounters significant resistance due to the minimal thickness and weak interconnectivity of GNPs along this axis. Once again, this confirms that heat preferentially propagates along the in-plane direction, while through-plane conduction remains constrained by interfacial limitations.
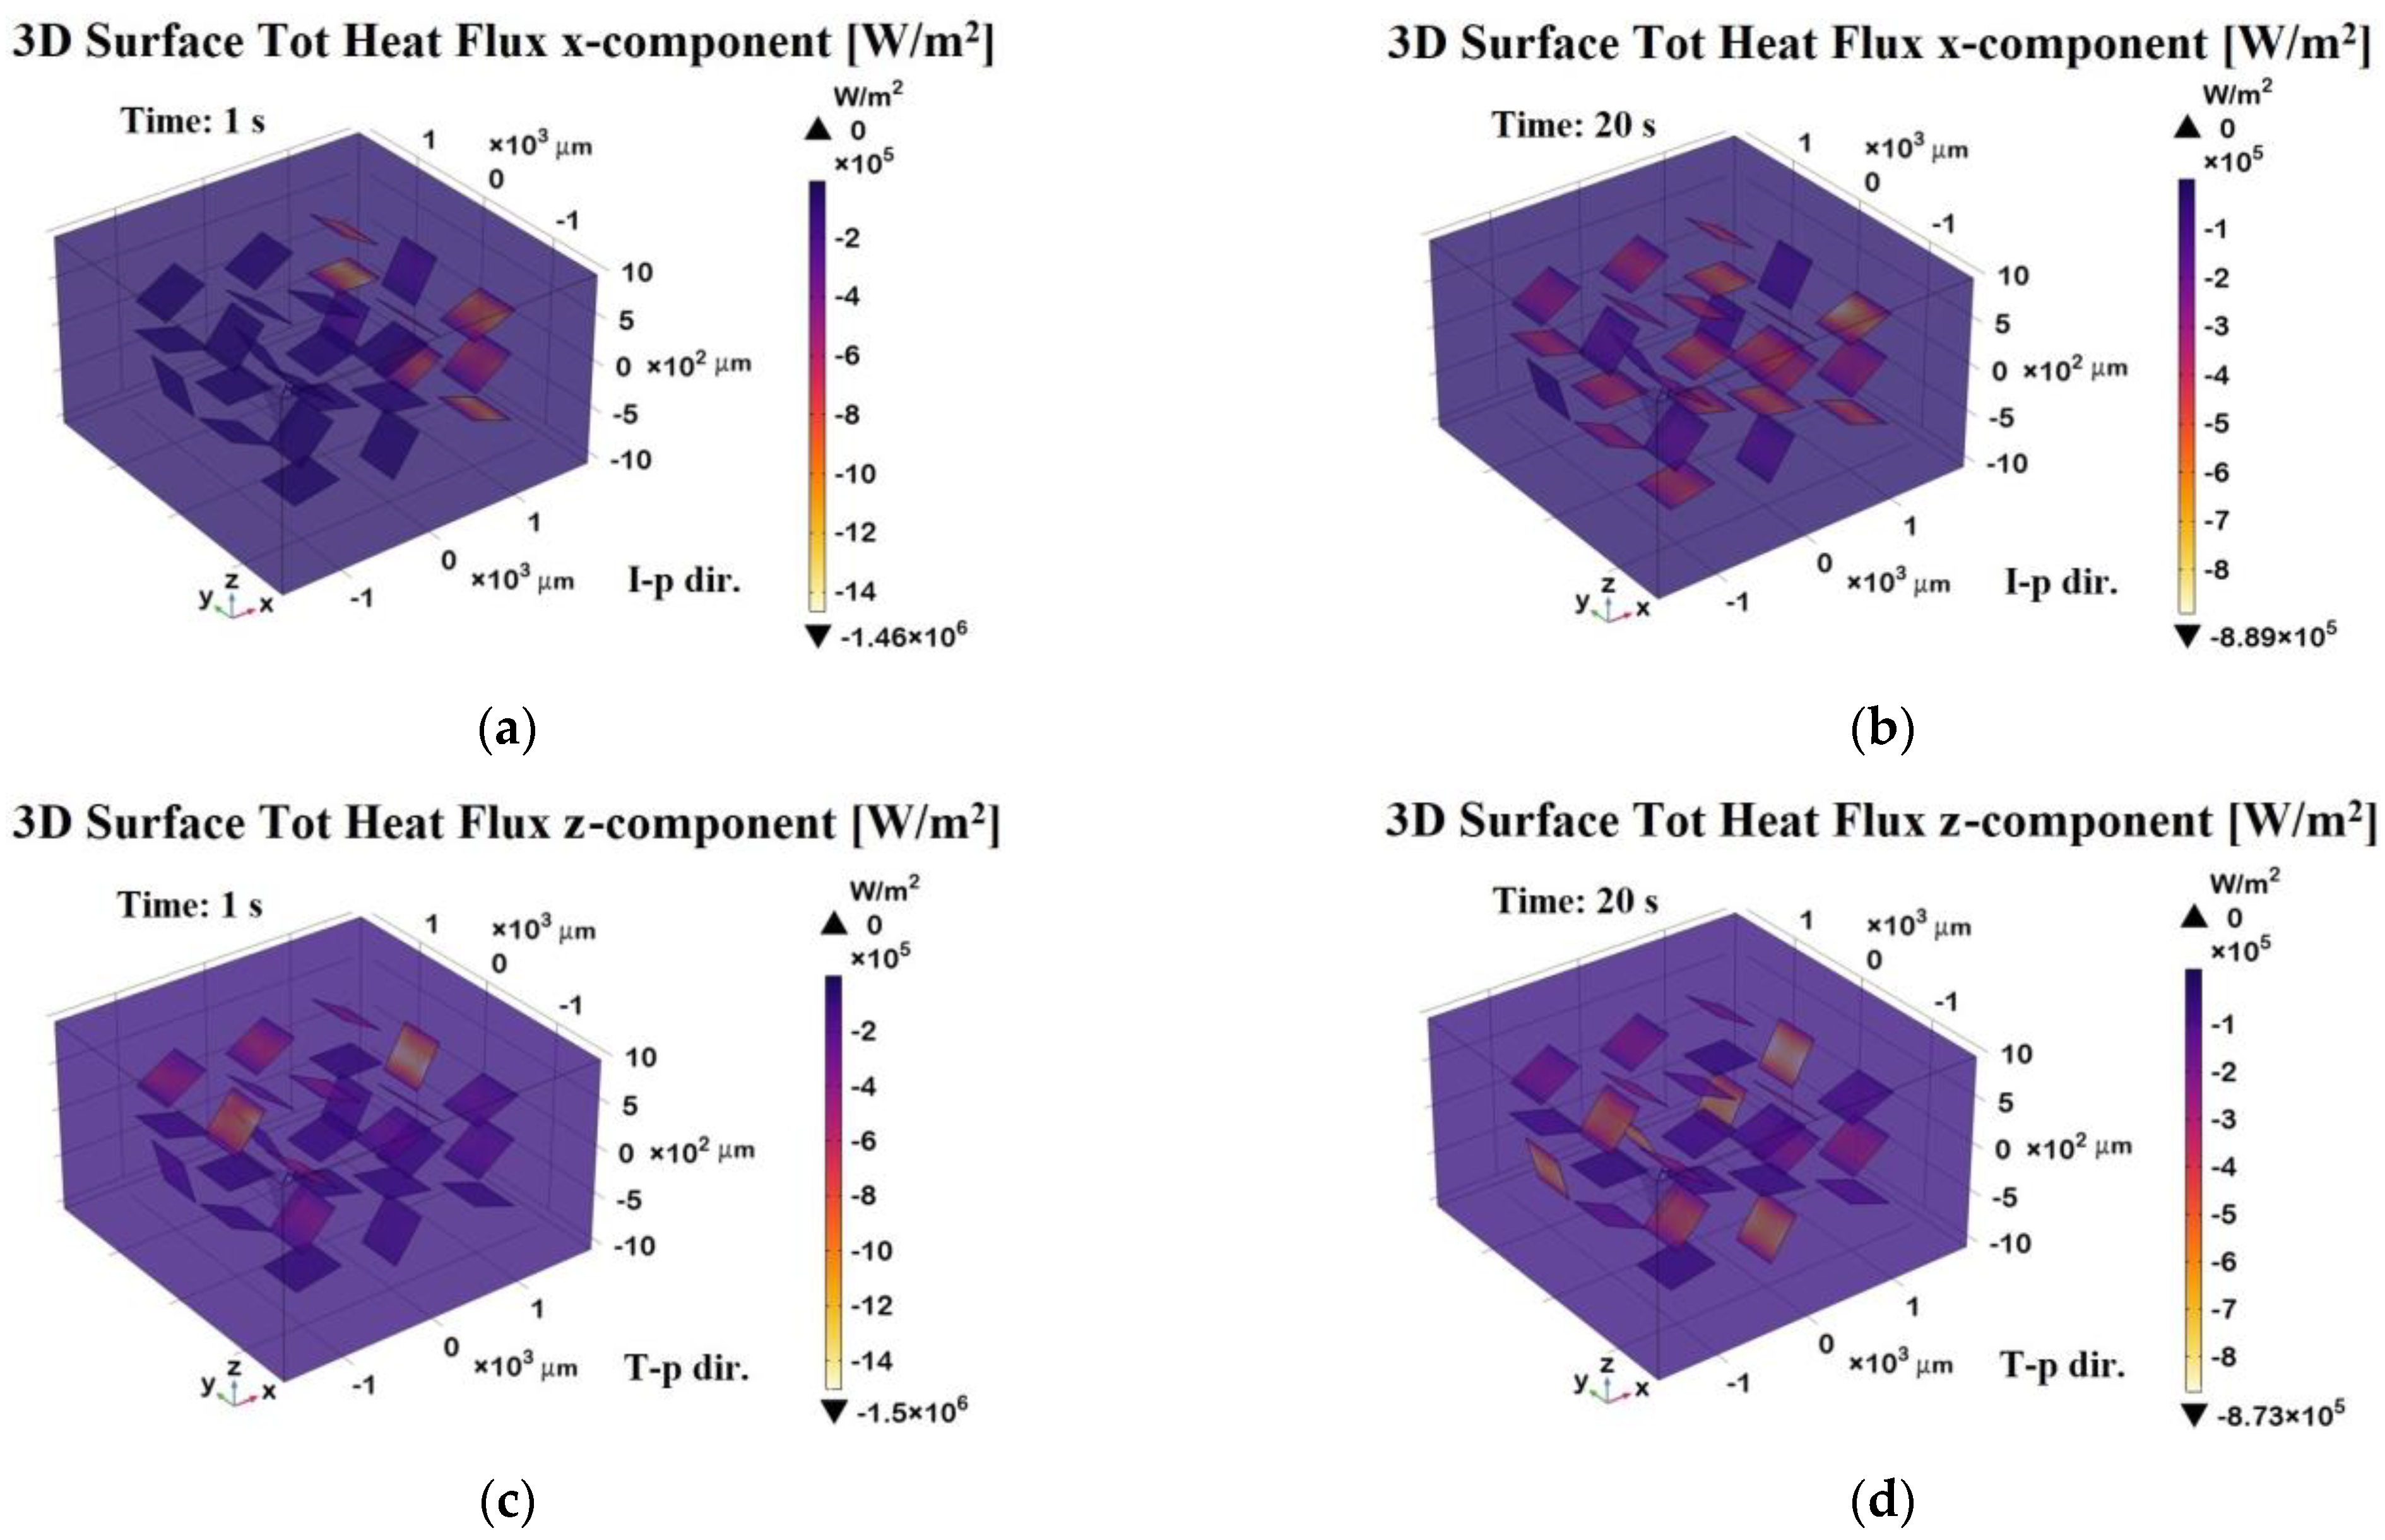
The 3D surface heat flux distributions shown in
Figure 20 complement the total heat flux previously discussed, providing further insight into the thermal behavior of the composite.
Panels (a) and (b) depict the x-component of the total heat flux (surface probe) in the in-plane direction (I-p dir.) at t = 1 s (transient phase) and t = 20 s (steady state), respectively. These plots highlight the preferential heat transport along the graphene sheets, which is consistent with their higher in-plane thermal conductivity. As a result, the heat flux is more highly concentrated in the graphene regions, which act as preferential thermal pathways, while the polymeric areas show lower thermal transport. Panels (c) and (d) illustrate the z-component of the heat flux in the through-plane direction (T-p dir.) at the same time points.
The magnitude of the flux in these panels is notably lower and more uniformly distributed compared to the in-plane direction, reflecting the limited thermal transport across the resin-dominated regions.
Overall, this figure emphasizes the strong anisotropic nature of the material, with heat preferentially propagating along the graphene-aligned in-plane pathways, which is especially evident in the early and steady-state phases. The periodic arrangement of the graphene plates suggests an engineered composite structure designed to enhance heat dissipation or directional thermal transport.
Figure 21 illustrates the thermal response of a composite material with randomly dispersed graphene platelets. Specifically, Figures (a) and (b) show the temperature profiles along the in-plane and through-plane directions, respectively, capturing the spatial distribution of heat.
Contrary to the findings presented in the previously discussed results, in this case of randomly dispersed graphene platelets, which represents the most realistic scenario compared to an ordered arrangement of platelets, in the temperature profiles, a plateau is observed only when a high-thermal-conductivity graphene platelet, relative to the surrounding matrix, is entirely crossed by the cutline. This phenomenon corresponds to a parabolic shape in the heat flux profile. From a temporal perspective, temperature profiles remain briefly stable when the cutline transversely intersects the platelets, leading to the appearance of peaks in the heat flux graphs. These peaks arise due to the strong contrast in conductivity between the matrix and the platelets, causing rapid local variations in heat transport.
Figure 22 illustrates the 3D surface temperature distributions in a composite containing randomly oriented graphene nanoplatelets (GNPs), highlighting the impact of disordered alignment compared to the previously analyzed case with aligned platelets.
Figure 22a and
Figure 22b show the temperature profiles along the in-plane direction (I-p dir.) at t = 5 s (transient phase) and t = 60 s (steady state), respectively.
Compared to the aligned configuration, the temperature distribution here appears less uniform and more scattered, indicating reduced thermal conductivity in the in-plane direction. The heat spreads in a less directional and more diffused manner, underscoring the loss of thermal guidance provided by aligned platelets.
Figure 22c,d display the corresponding temperature distributions in the through-plane direction (T-p dir.) at the same time points. A similar trend was observed, with less efficient heat transfer and more pronounced thermal gradients. The propagation of heat was visibly hindered, and the surface remained cooler relative to the aligned case, especially at early times. Overall, this figure clearly demonstrates that the random orientation of the GNPs weakens the material’s thermal anisotropy, leading to less effective and less directed heat transfer in both the in-plane and through-plane directions. The 3D visualizations are particularly effective in emphasizing these effects, making their contrast with the aligned configuration immediately apparent.
The graphs in
Figure 23 illustrate the total heat flux components in both the in-plane and through-plane directions at various time instants highlighting the flux variations assessed along the corresponding spatial cutlines. Distinct peaks in both components correspond to the regions where the heat flux intersects with graphene platelets, which are embedded in a low thermal conductivity resin. In the in-plane direction (
Figure 23a), the first peak exhibits a complete bell-shaped profile, indicating that the heat flux fully traverses the first platelet. This suggests the favorable alignment of the platelet with respect to the x-direction, allowing uninterrupted conduction across its entire length. In contrast, the subsequent peaks are sharper and narrower, indicating only partial intersection with other platelets. These irregularities arise due to the random orientation of the graphene platelets within the resin. As a result, the heat flux encounters varying cross-sectional areas, leading to reduced and asymmetrical peak shapes. A similar behavior is observed in the through-plane direction (
Figure 23b), where the z-component of the heat flux also displays localized peaks at positions where the flux path intersects the platelets. However, due to orientation and anisotropy, these peaks are generally less intense and more localized than those in the in-plane direction, reflecting the less efficient heat conduction across platelet thickness and through the resin matrix. These results clearly demonstrate the strong dependence of thermal transport behavior on the spatial orientation and distribution of high-conductivity inclusions within a composite material.
The 3D surface distributions shown in
Figure 24 complement the 2D results by providing spatial insights into the total heat flux behavior within the composite containing randomly oriented graphene nanoplatelets (GNPs). Panels (a) and (b) show the x-component (in-plane direction) of the heat flux at two time points: during the transient phase (t = 1 s) and at steady state (t = 20 s). Similarly, panels (c) and (d) depict the z-component (the through-plane direction) at the same time points. These 3D visualizations confirm and expand upon the findings from the 2D plots in
Figure 23. Specifically, they illustrate how heat flux is locally intensified where the flux paths intersect with the platelets. Regions of high flux intensity (marked by peaks or valleys in the surface maps) correspond to areas where the GNPs are more directly aligned with the respective direction of heat flow. This is especially evident in the in-plane direction, where the anisotropic thermal conductivity of the platelets results in stronger and more continuous flux channels at the steady state. In the through-plane direction, the flux distribution appears more scattered and less intense, again reflecting the limited contribution of the GNPs in this orientation due to their thin geometry and poor alignment with the z-axis. Moreover, the differences between the transient and steady-state phases highlight how the redistribution of thermal gradients over time is influenced by the spatial arrangement and orientation of the platelets. Overall, this 3D analysis reinforces the conclusion that platelet orientation plays a critical role in governing thermal transport within the composite and provides a more comprehensive picture of heat flow patterns across all dimensions.


 ,
, 


 π/8
π/8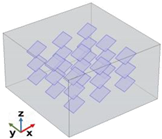 π/6
π/6 π/4
π/4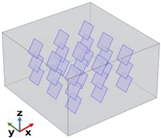 π/3
π/3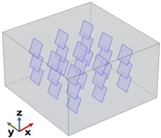 3π/8
3π/8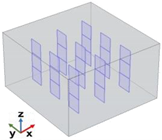 π/2
π/2