
Cellulose Nanocrystal and Polymer Composite Microspheres for Methylene Blue Adsorption

Abstract
1. Introduction
2. Materials and Methods
2.1. Reagents
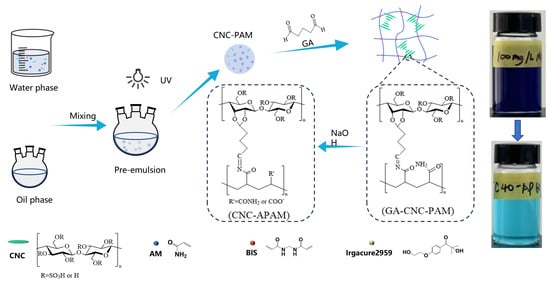
2.2. Synthesis
2.3. Characterization
2.4. Adsorption Investigation
3. Results and Discussion
3.1. Characterization of Composite Microspheres
3.2. Adsorption Behavior of CNC-APAM Composite Microspheres
3.2.1. Effect of pH and Ionic Strength
3.2.2. Effect of CNC Concentration
3.2.3. Effect of Microsphere Size
3.2.4. Reusability
3.3. Adsorption Mechanism
3.3.1. Adsorption Kinetics

| Models | Kinetic Parameters | 70 mg/L | 100 mg/L | 150 mg/L |
|---|---|---|---|---|
| Intraparticle diffusion | K1d (mg·g−1·min−1/2) | 37.9286 | 54.7863 | 92.2263 |
| R2 | 0.9993 | 0.9989 | 0.9934 | |
| K2d (mg·g−1·min−1/2) | 1.6916 | 3.6212 | 2.6779 | |
| C (mg/g) | 149.2161 | 194.5331 | 329.9028 | |
| R2 | 0.2632 | 0.8365 | 0.4912 | |
| Pseudo-first-order | K1 (min−1) | 0.0542 | 0.0424 | 0.0568 |
| qe (mg/g) | 15.7615 | 59.9098 | 41.4302 | |
| R2 | 0.5865 | 0.8832 | 0.8088 | |
| Pseudo-second-order | K2 (g/mg·min) | 0.0024 | 0.0014 | 0.0020 |
| qe (mg/g) | 168.6341 | 235.8491 | 359.7122 | |
| R2 | 0.9981 | 0.9993 | 0.9996 |
3.3.2. Adsorption Isotherm
3.3.3. Adsorption Thermodynamics
3.3.4. Adsorption Mechanism and Comparison
4. Conclusions
5. Patents
Author Contributions
Funding
Institutional Review Board Statement
Data Availability Statement
Conflicts of Interest
References
- Bhatia, D.; Sharma, N.R.; Singh, J.; Kanwar, R.S. Biological Methods for Textile Dye Removal from Wastewater: A Review. Crit. Rev. Environ. Sci. Technol. 2017, 47, 1836–1876. [Google Scholar] [CrossRef]
- Kkaczyk, A.; Mitrowska, K.; Posyniak, A. Synthetic Organic Dyes as Contaminants of the Aquatic Environment and Their Implications for Ecosystems: A Review. Sci. Total Environ. 2020, 717, 137222. [Google Scholar] [CrossRef]
- Dutta, S.; Adhikary, S.; Bhattacharya, S.; Roy, D.; Chatterjee, S.; Chakraborty, A.; Banerjee, D.; Ganguly, A.; Nanda, S.; Rajak, P. Contamination of Textile Dyes in Aquatic Environment: Adverse Impacts on Aquatic Ecosystem and Human Health, and Its Management Using Bioremediation. J. Environ. Manag. 2024, 353, 120103. [Google Scholar] [CrossRef] [PubMed]
- Al-Tohamy, R.; Ali, S.S.; Li, F.H.; Okasha, K.M.; Mahmoud, Y.A.-G.; Elsamahy, T.; Jiao, H.; Fu, Y.; Sun, J.Z. A critical review on the treatment of dye-containing wastewater: Ecotoxicological and health concerns of textile dyes and possible remediation approaches for environmental safety. Ecotox. Environ. Saf. 2022, 23, 113160. [Google Scholar] [CrossRef] [PubMed]
- Oladoye, P.O.; Ajiboye, T.O.; Omotola, E.O.; Oyewola, O.J. Methylene Blue Dye: Toxicity and Potential Elimination Technology from Wastewater. Results Eng. 2022, 16, 100678. [Google Scholar] [CrossRef]
- Kishor, R.; Purchase, D.; Saratale, G.D.; Saratale, R.G.; Ferreira, L.F.R.; Bilal, M.; Chandra, R.; Bharagava, R.N. Ecotoxicological and Health Concerns of Persistent Coloring Pollutants of Textile Industry Wastewater and Treatment Approaches for Environmental Safety. J. Environ. Chem. Eng. 2021, 9, 105012. [Google Scholar] [CrossRef]
- Zhang, J.; Yu, H.; Quan, X.; Chen, S.; Zhang, Y. Ceramic Membrane Separation Coupled with Catalytic Ozonation for Tertiary Treatment of Dyestuff Wastewater in a Pilot-Scale Study. Chem. Eng. J. 2016, 301, 19–26. [Google Scholar] [CrossRef]
- Adenan, N.H.; Lim, Y.Y.; Ting, A.S.Y. Removal of Triphenylmethane Dyes by Streptomyces Bacillaris: A Study on Decolorization, Enzymatic Reactions and Toxicity of Treated Dye Solutions. J. Environ. Manag. 2022, 318, 115520. [Google Scholar] [CrossRef]
- Barton, S.S. The Adsorption of Methylene Blue by Active Carbon. Carbon 1987, 25, 343–350. [Google Scholar] [CrossRef]
- Xu, H.; Liu, B.; Zhang, M. Synthesis of Silver Nanoparticles Composite Mesoporous Microspheres for Synergistic Adsorption-Catalytic Degradation of Methylene Blue. Sep. Purif. Technol. 2023, 324, 124499. [Google Scholar] [CrossRef]
- Liu, X.; Zhang, Y.; Ju, H.; Yang, F.; Luo, X.; Zhang, L. Uptake of Methylene Blue on Divinylbenzene Cross-Linked Chitosan/Maleic Anhydride Polymer by Adsorption Process. Coll. Surf. A 2021, 629, 127424. [Google Scholar] [CrossRef]
- Li, Z.; Wang, Z.; Wang, C.; Ding, S.; Li, F.; Lin, H. Preparation of Magnetic Resin Microspheres M-P(MMA-DVB-GMA) and the Adsorption Property to Heavy Metal Ions. Appl. Surf. Sci. 2019, 496, 143708. [Google Scholar] [CrossRef]
- Wu, H.; Wei, H.; Yang, X.; Jin, C.; Sun, W.; Deng, K.; Rong, X.; Bin, G.; Sun, C. Spherical Activated Carbons Derived from Resin-Microspheres for the Adsorption of Acetic Acid. J. Environ. Chem. Eng. 2023, 11, 109394. [Google Scholar] [CrossRef]
- Wei, E.; Wang, K.; Muhammad, Y.; Chen, S.; Dong, D.; Wei, Y.; Fujita, T. Preparation and Conversion Mechanism of Different Geopolymer-Based Zeolite Microspheres and Their Adsorption Properties for Pb2+. Sep. Purif. Technol. 2022, 282, 119971. [Google Scholar] [CrossRef]
- Su, Q.; He, Y.; Yang, S.; Wan, H.; Chang, S.; Cui, X. Synthesis of NaA-Zeolite Microspheres by Conversion of Geopolymer and Their Performance of Pb (II) Removal. Appl. Clay Sci. 2021, 200, 105914. [Google Scholar] [CrossRef]
- Wan, X.; Rong, Z.; Zhu, K.; Wu, Y. Chitosan-Based Dual Network Composite Hydrogel for Efficient Adsorption of Methylene Blue Dye. Int. J. Biol. Macromol. 2022, 222 Pt A, 725–735. [Google Scholar] [CrossRef]
- Miyah, Y.; Lahrichi, A.; Idrissi, M.; Khalil, A.; Zerrouq, F. Adsorption of Methylene Blue Dye from Aqueous Solutions onto Walnut Shells Powder: Equilibrium and Kinetic Studies. Surf. Interfaces 2018, 11, 74–81. [Google Scholar] [CrossRef]
- Naduparambath, S.; Jinitha, T.V.; Shaniba, V.; Sreejith, M.P.; Balan, A.K.; Purushothaman, E. Isolation and Characterisation of Cellulose Nanocrystals from Sago Seed Shells. Carbohydr. Polym. 2018, 180, 13–20. [Google Scholar] [CrossRef]
- Haldar, D.; Purkait, M.K. Micro and Nanocrystalline Cellulose Derivatives of Lignocellulosic Biomass: A Review on Synthesis, Applications and Advancements. Carbohydr. Polym. 2020, 250, 116937. [Google Scholar] [CrossRef]
- Ching, Y.C.; Ershad Ali, M.; Abdullah, L.C.; Choo, K.W.; Kuan, Y.C.; Julaihi, S.J.; Chuah, C.H.; Liou, N.-S. Rheological Properties of Cellulose Nanocrystal-Embedded Polymer Composites: A Review. Cellulose 2016, 23, 1011–1030. [Google Scholar] [CrossRef]
- Ventura-Cruz, S.; Tecante, A. Nanocellulose and Microcrystalline Cellulose from Agricultural Waste: Review on Isolation and Application as Reinforcement in Polymeric Matrices. Food Hydrocoll. 2021, 118, 106771. [Google Scholar] [CrossRef]
- Bangar, S.P.; Esua, O.J.; Nickhil, C.; Whiteside, W.S. Microcrystalline Cellulose for Active Food Packaging Applications: A Review. Food Packag. Shelf Life 2023, 36, 101048. [Google Scholar] [CrossRef]
- Razani, S.; Dadkhah Tehrani, A. Development of New Organic-Inorganic, Hybrid Bionanocomposite from Cellulose Nanowhisker and Mg/Al-CO3-LDHfor Enhanced Dye Removal. Int. J. Biol. Macromol. 2019, 133, 892–901. [Google Scholar] [CrossRef]
- Le, V.T.; Joo, S.-W.; Berkani, M.; Mashifana, T.; Kamyab, H.; Wang, C.; Vasseghian, Y. Sustainable Cellulose-Based Hydrogels for Water Treatment and Purification. Ind. Crops Prod. 2023, 205, 117525. [Google Scholar] [CrossRef]
- Zhou, C.; Wu, Q.; Lei, T.; Negulescu, I.I. Adsorption Kinetic and Equilibrium Studies for Methylene Blue Dye by Partially Hydrolyzed Polyacrylamide/Cellulose Nanocrystal Nanocomposite Hydrogels. Chem. Eng. J. 2014, 251, 17–24. [Google Scholar] [CrossRef]
- Li, J.; Zhou, L.; Song, Y.; Yu, X.; Li, X.; Liu, Y.; Zhang, Z.; Yuan, Y.; Yan, S.; Zhang, J. Green fabrication of porous microspheres containing cellulose nanocrystal/MnO2 nanohybrid for efficient dye removal. Carbohydr. Polym. 2021, 270, 118340. [Google Scholar] [CrossRef] [PubMed]
- Li, Z.; Zhao, T.; Lv, W.; Ma, B.; Hu, Q.; Ma, X.; Luo, Z.; Zhang, M.; Yu, Z.-Z.; Yang, D. Nanoscale Polyacrylamide Copolymer/Silica Hydrogel Microspheres with High Compressive Strength and Satisfactory Dispersion Stability for Efficient Profile Control and Plugging. Ind. Eng. Chem. Res. 2021, 60, 10193–10202. [Google Scholar] [CrossRef]
- Wang, C.; Xu, J.; Zhang, J.; Wu, Y. Swelling Properties of Particles in Amphoteric Polyacrylamide Dispersion. Chem. Pap. 2011, 65, 315–323. [Google Scholar] [CrossRef]
- Lu, T.; Pan, H.; Ma, J.; Li, Y.; Bokhari, S.W.; Jiang, X.; Zhu, S.; Zhang, D. Cellulose Nanocrystals/Polyacrylamide Composites of High Sensitivity and Cycling Performance to Gauge Humidity. Acs Appl. Mater. Interfaces 2017, 9, 18231–18237. [Google Scholar] [CrossRef]
- Chau, A.L.; Pugsley, C.D.; Miyamoto, M.E.; Tang, Y.; Eisenbach, C.D.; Mates, T.E.; Hawker, C.J.; Valentine, M.T.; Pitenis, A.A. pH-Dependent Friction of Polyacrylamide Hydrogels. Tribol. Lett. 2023, 71, 108. [Google Scholar] [CrossRef]
- Yang, Z.; Liu, X.; Liu, X.; Wu, J.; Zhu, X.; Bai, Z.; Yu, Z. Preparation of β-Cyclodextrin/Graphene Oxide and Its Adsorption Properties for Methylene Blue. Coll. Surf. B 2021, 200, 111605. [Google Scholar] [CrossRef] [PubMed]
- Mussa, Z.H.; Al-Ameer, L.R.; Al-Qaim, F.F.; Deyab, I.F.; Kamyab, H.; Chelliapan, S. A Comprehensive Review on Adsorption of Methylene Blue Dye Using Leaf Waste as a Bio-Sorbent: Isotherm Adsorption, Kinetics, and Thermodynamics Studies. Environ. Monit. Assess. 2023, 195, 940. [Google Scholar] [CrossRef]
- Shi, Y.; Song, G.; Li, A.; Wang, J.; Wang, H.; Sun, Y.; Ding, G. Graphene Oxide-Chitosan Composite Aerogel for Adsorption of Methyl Orange and Methylene Blue: Effect of pH in Single and Binary Systems. Coll. Surf. A 2022, 641, 128595. [Google Scholar] [CrossRef]
- Foroutan, R.; Peighambardoust, S.J.; Latifi, P.; Ahmadi, A.; Alizadeh, M.; Ramavandi, B. Carbon Nanotubes/β-Cyclodextrin/MnFe2O4 as a Magnetic Nanocomposite Powder for Tetracycline Antibiotic Decontamination from Different Aqueous Environments. J. Environ. Chem. Eng. 2021, 9, 106344. [Google Scholar] [CrossRef]
- Joynul Abedin, M.; Van Der Schoot, P.; Garnier, G.; Majumder, M. Nematic to Cholesteric Transformation in the Cellulose Nanocrystal Droplet Phase. Langmuir 2023, 39, 6142–6150. [Google Scholar] [CrossRef]
- Popescu, M.-C.; Dogaru, B.-I.; Popescu, C.-M. Effect of Cellulose Nanocrystals Nanofiller on the Structure and Sorption Properties of Carboxymethyl Cellulose–Glycerol–Cellulose Nanocrystals Nanocomposite Systems. Materials 2020, 13, 2900. [Google Scholar] [CrossRef]
- Suekuni, M.T.; Myers, T.R.; McNeil, M.C.; Prisco, A.J.; Shelburne, S.S.; Shepperson, W.A.; Allgeier, A.M. Surface Area Determination of Kevlar Particles in Suspensions Containing Iron Impurities Using Low-Field Nuclear Magnetic Resonance Relaxometry. ACS Appl. Polym. Mater. 2020, 2, 2134–2141. [Google Scholar] [CrossRef]
- Schlumberger, C.; Sandner, L.; Michalowski, A.; Thommes, M. Reliable Surface Area Assessment of Wet and Dry Nonporous and Nanoporous Particles: Nuclear Magnetic Resonance Relaxometry and Gas Physisorption. Langmuir 2023, 39, 4611–4621. [Google Scholar] [CrossRef]
- Han, X.; Wen, H.; Luo, Y.; Yang, J.; Xiao, W.; Xie, J. Effects of Chitosan Modification, Cross-Linking, and Oxidation on the Structure, Thermal Stability, and Adsorption Properties of Porous Maize Starch. Food Hydrocoll. 2022, 124, 107288. [Google Scholar] [CrossRef]
- Sun, Y.; Hao, S.; Pu, Y.; Yang, H.; Wang, J.; Zhou, S.; Li, Q.; Qiao, C. Construction of Hollow Mesoporous Zirconia Nanospheres with Controllable Particle Size: Synthesis, Characterization and Adsorption Performance. J. Environ. Chem. Eng. 2023, 11, 110546. [Google Scholar] [CrossRef]
- Shabbir, M.; Rather, L.J.; Shahid-ul-Islam; Bukhari, M.N.; Shahid, M.; Ali Khan, M.; Mohammad, F. An Eco-Friendly Dyeing of Woolen Yarn by Terminalia Chebula Extract with Evaluations of Kinetic and Adsorption Characteristics. J. Adv. Res. 2016, 7, 473–482. [Google Scholar] [CrossRef] [PubMed]
- Ranjbar, D.; Raeiszadeh, M.; Lewis, L.; MacLachlan, M.J.; Hatzikiriakos, S.G. Adsorptive Removal of Congo Red by Surfactant Modified Cellulose Nanocrystals: A Kinetic, Equilibrium, and Mechanistic Investigation. Cellulose 2020, 27, 3211–3232. [Google Scholar] [CrossRef]
- Zhang, J.; Li, Y.; Dai, Y.; Lin, T.; Shao, H.; Liu, Y.; Liu, X. Three-Dimensional Porous Hydrogel Based on Hyperbranched Polyethyleneimine Functionalized Apple Pomace Derived Cellulose for Efficient Removal of Methyl Orange. Chem. Eng. J. 2023, 456, 140995. [Google Scholar] [CrossRef]
- Valderrama, C.; Gamisans, X.; De Las Heras, X.; Farrán, A.; Cortina, J.L. Sorption Kinetics of Polycyclic Aromatic Hydrocarbons Removal Using Granular Activated Carbon: Intraparticle Diffusion Coefficients. J. Hazard. Mater. 2008, 157, 386–396. [Google Scholar] [CrossRef] [PubMed]
- Plazinski, W.; Dziuba, J.; Rudzinski, W. Modeling of Sorption Kinetics: The Pseudo-Second Order Equation and the Sorbate Intraparticle Diffusivity. Adsorption 2013, 19, 1055–1064. [Google Scholar] [CrossRef]
- Wang, J.; Guo, X. Rethinking of the Intraparticle Diffusion Adsorption Kinetics Model: Interpretation, Solving Methods and Applications. Chemosphere 2022, 309, 136732. [Google Scholar] [CrossRef] [PubMed]
- Bulut, E.; Özacar, M.; Şengil, İ.A. Equilibrium and Kinetic Data and Process Design for Adsorption of Congo Red onto Bentonite. J. Hazard. Mater. 2008, 154, 613–622. [Google Scholar] [CrossRef]
- Wang, X.; Jiang, C.; Hou, B.; Wang, Y.; Hao, C.; Wu, J. Carbon Composite Lignin-Based Adsorbents for the Adsorption of Dyes. Chemosphere 2018, 206, 587–596. [Google Scholar] [CrossRef]
- Mabuza, M.; Premlall, K.; Daramola, M.O. Modelling and Thermodynamic Properties of Pure CO2 and Flue Gas Sorption Data on South African Coals Using Langmuir, Freundlich, Temkin, and Extended Langmuir Isotherm Models. Int. J. Coal. Sci. Technol. 2022, 9, 45. [Google Scholar] [CrossRef]
- Chen, X.; Hossain, M.F.; Duan, C.; Lu, J.; Tsang, Y.F.; Islam, M.S.; Zhou, Y. Isotherm Models for Adsorption of Heavy Metals from Water—A Review. Chemosphere 2022, 307, 135545. [Google Scholar] [CrossRef]
- Vigdorowitsch, M.; Pchelintsev, A.; Tsygankova, L.; Tanygina, E. Freundlich Isotherm: An Adsorption Model Complete Framework. Appl. Sci. 2021, 11, 8078. [Google Scholar] [CrossRef]
- Al-Ghouti, M.A.; Da’ana, D.A. Guidelines for the Use and Interpretation of Adsorption Isotherm Models: A Review. J. Hazard. Mater. 2020, 393, 122383. [Google Scholar] [CrossRef] [PubMed]
- Xu, H.; Boeuf, G.; Jia, Z.; Zhu, K.; Nikravech, M.; Kanaev, A.; Azouani, R.; Traore, M.; Elm’selmi, A. Solvent-Free Synthesized Monolithic Ultraporous Aluminas for Highly Efficient Removal of Remazol Brilliant Blue R: Equilibrium, Kinetic, and Thermodynamic Studies. Materials 2021, 14, 3054. [Google Scholar] [CrossRef] [PubMed]
- Wang, J.; Guo, X. Adsorption Isotherm Models: Classification, Physical Meaning, Application and Solving Method. Chemosphere 2020, 258, 127279. [Google Scholar] [CrossRef]
- Rahmani, Z.; Rashidi, A.M.; Kazemi, A.; Samadi, M.T.; Rahmani, A.R. N-Doped Reduced Graphene Oxide Aerogel for the Selective Adsorption of Oil Pollutants from Water: Isotherm and Kinetic Study. J. Ind. Eng. Chem. 2018, 61, 416–426. [Google Scholar] [CrossRef]
- Khorasani, A.C.; Shojaosadati, S.A. Magnetic Pectin-Chlorella Vulgaris Biosorbent for the Adsorption of Dyes. J. Environ. Chem. Eng. 2019, 7, 103062. [Google Scholar] [CrossRef]
- Hu, X.-S.; Liang, R.; Sun, G. Super-Adsorbent Hydrogel for Removal of Methylene Blue Dye from Aqueous Solution. J. Mater. Chem. A 2018, 6, 17612–17624. [Google Scholar] [CrossRef]
- Hammad, W.A.; Darweesh, M.A.; Zouli, N.; Osman, S.M.; Eweida, B.; Amr, M.H.A. Adsorption of Cationic Dye onto Raphanus Seeds: Optimization, Adsorption Kinetics, Thermodynamic Studies. Sci. Rep. 2024, 14, 17827. [Google Scholar] [CrossRef]
- Benhouria, A.; Islam, M.A.; Zaghouane-Boudiaf, H.; Boutahala, M.; Hameed, B.H. Calcium Alginate–Bentonite–Activated Carbon Composite Beads as Highly Effective Adsorbent for Methylene Blue. Chem. Eng. J. 2015, 270, 621–630. [Google Scholar] [CrossRef]
- Shi, L.; Liu, W.; Zhang, X.; Hu, J. Adsorption of Methylene Blue from Aqueous Solution by Crosslinked Carboxymethyl Cellulose/Organo-Montmorillonite Composite Hydrogels. J. Polym. Res. 2023, 30, 305. [Google Scholar] [CrossRef]
- Liu, H.; Tian, X.; Xiang, X.; Chen, S. Preparation of Carboxymethyl Cellulose/Graphene Composite Aerogel Beads and Their Adsorption for Methylene Blue. Int. J. Biol. Macromol. 2022, 202, 632–643. [Google Scholar] [CrossRef] [PubMed]
- Zhang, Z.H.; Xu, J.Y.; Yang, X.L. MXene/Sodium Alginate Gel Beads for Adsorption of Methylene Blue. Mater. Chem. Phys. 2021, 260, 124123. [Google Scholar] [CrossRef]
- Fu, J.; Yap, J.X.; Leo, C.P.; Chang, C.K. Enhanced Photocatalytic Regeneration of Carboxymethyl Cellulose/Lignin/ZnO Complex Hydrogel after Methylene Blue Adsorption. Int. J. Biol. Macromol. 2024, 274, 133510. [Google Scholar] [CrossRef] [PubMed]
- Peighambardoust, S.J.; Ghergherehchi, E.; Mohammadzadeh Pakdel, P.; Aghdasinia, H. Facile Removal of Methylene Blue Using Carboxymethyl Cellulose Grafted Polyacrylamide/Carbon Black Nanocomposite Hydrogel. J. Polym. Environ. 2023, 31, 939–953. [Google Scholar] [CrossRef]
- Beh, J.H.; Lim, T.H.; Lew, J.H.; Lai, J.C. Cellulose Nanofibril-Based Aerogel Derived from Sago Pith Waste and Its Application on Methylene Blue Removal. Int. J. Biol. Macromol. 2020, 160, 836–845. [Google Scholar] [CrossRef]
- Dai, H.; Huang, Y.; Zhang, Y.; Zhang, H.; Huang, H. Green and Facile Fabrication of Pineapple Peel Cellulose/Magnetic Diatomite Hydrogels in Ionic Liquid for Methylene Blue Adsorption. Cellulose 2019, 26, 3825–3844. [Google Scholar] [CrossRef]
- Dai, H.; Chen, Y.; Ma, L.; Zhang, Y.; Cui, B. Direct Regeneration of Hydrogels Based on Lemon Peel and Its Isolated Microcrystalline Cellulose: Characterization and Application for Methylene Blue Adsorption. Int. J. Biol. Macromol. 2021, 191, 129–138. [Google Scholar] [CrossRef]


| Samples | Diameter (µm) | SR (g·g−1) | Re (%) |
|---|---|---|---|
| CNC0-APAM100 | 59.3 | 120.0 (1.8%) | 86.8 (0.6%) |
| CNC10-APAM90 | 62.3 | 105.8 (1.5%) | 92.4 (0.6%) |
| CNC20-APAM80 | 62.4 | 91.0 (1.3%) | 93.2 (0.2%) |
| CNC30-APAM70 | 61.9 | 62.4 (4.8%) | 93.2 (0.3%) |
| CNC40-APAM60 | 61.3 | 19.9 (2.5%) | 93.4 (0.4%) |
| CNC50-APAM50 | 64.5 | 17.5 (8.6%) | 93.3 (0.5%) |
| Models | Parameter | Value | |||
|---|---|---|---|---|---|
| 303.15 K | 313.15 K | 323.15 K | 333.15 K | ||
| Langmuir | qm (mg/g) | 490.12 | 473.93 | 487.80 | 354.61 |
| KL (L/mg) | 0.1198 | 0.1040 | 0.0809 | 0.1129 | |
| R2 | 0.9985 | 0.9949 | 0.9916 | 0.9905 | |
| Freundlich | KF (L/g) | 165.3923 | 162.0379 | 146.3747 | 154.8954 |
| n | 4.4324 | 4.6486 | 4.2207 | 6.3355 | |
| R2 | 0.9028 | 0.9609 | 0.9810 | 0.9159 | |
| D-R | qm (mg/g) | 472.0713 | 439.2022 | 437.7990 | 338.1840 |
| KD | 0.0023 | 0.0020 | 0.0022 | 0.1911 | |
| R2 | 0.9821 | 0.9566 | 0.9195 | 0.8610 | |
| Temkin | A (L/g) | 3.6412 | 3.9540 | 2.3030 | 13.4753 |
| B | 32.3248 | 36.0253 | 33.8312 | 62.0767 | |
| R2 | 0.9407 | 0.9782 | 0.9789 | 0.8967 | |
| T (K) | Kd | G (kJ/mol) | H (kJ/mol) | |
|---|---|---|---|---|
| 303.15 | 31.8816 | −3.6964 | −12.6456 | −12.1515 |
| 313.15 | 32.3552 | −3.8179 | ||
| 323.15 | 29.2897 | −3.9394 | ||
| 333.15 | 19.7745 | −4.0609 |
| Adsorbents | qm (mg/g) | Ref. |
|---|---|---|
| CNC-APAM composite microspheres | 490.12 | This work |
| HPAM/CNC nanocomposite hydrogels | 326.08 | [26] |
| Graphene oxide–chitosan composite aerogels | 110.9 | [33] |
| CMC/GAs composite aerogel beads | 222.72 | [61] |
| Ti3C2TX/SA beads | 92.17 | [62] |
| CMC/ZnO/lignin hydrogel beads | 276.79 | [63] |
| Hyd/CB nanocomposite hydrogels | 27.32 | [64] |
| SPCNF aerogels | 222.2 | [65] |
| PPC/m-DE composite hydrogels | 101.94 | [66] |
| LPMCC/LPH hydrogels | 57.54 | [67] |
| CCMC/OMMT composite hydrogels | 490.5 | [60] |
Disclaimer/Publisher’s Note: The statements, opinions and data contained in all publications are solely those of the individual author(s) and contributor(s) and not of MDPI and/or the editor(s). MDPI and/or the editor(s) disclaim responsibility for any injury to people or property resulting from any ideas, methods, instructions or products referred to in the content. |
© 2025 by the authors. Licensee MDPI, Basel, Switzerland. This article is an open access article distributed under the terms and conditions of the Creative Commons Attribution (CC BY) license (https://creativecommons.org/licenses/by/4.0/).
Share and Cite
Deng, Y.; Li, Z.; Wang, R.; Shi, Y. Cellulose Nanocrystal and Polymer Composite Microspheres for Methylene Blue Adsorption. Polymers 2025, 17, 1205. https://doi.org/10.3390/polym17091205
Deng Y, Li Z, Wang R, Shi Y. Cellulose Nanocrystal and Polymer Composite Microspheres for Methylene Blue Adsorption. Polymers. 2025; 17(9):1205. https://doi.org/10.3390/polym17091205
Chicago/Turabian StyleDeng, Yaxuan, Zenghui Li, Rui Wang, and Yue Shi. 2025. "Cellulose Nanocrystal and Polymer Composite Microspheres for Methylene Blue Adsorption" Polymers 17, no. 9: 1205. https://doi.org/10.3390/polym17091205
APA StyleDeng, Y., Li, Z., Wang, R., & Shi, Y. (2025). Cellulose Nanocrystal and Polymer Composite Microspheres for Methylene Blue Adsorption. Polymers, 17(9), 1205. https://doi.org/10.3390/polym17091205