4.2. Design of Experiment: Taguchi Method
The majority of research on shrinkage has focused predominantly on the influence of processing parameters [
11,
12]. This focus arises from the necessity of numerous trials to ascertain the material properties that impact shrinkage, which is time-consuming and requires specialized expertise. The process parameters have emerged as critical determinants of product quality under specific material and mold conditions. These parameters include molding time, temperature, pressure, and others, each exerting varying and sometimes contradictory effects on shrinkage. Consequently, it is imperative to study the effects of diverse process parameters on product shrinkage and subsequently devise optimal combinations of these parameters to guarantee product quality.
The volume shrinkage qualitatively represents the linear contraction of a polymer. A smaller variation in volume shrinkage (the difference between the greatest and minimum volume shrinkage values) indicates greater uniformity in the volume shrinkage of the product. Consequently, the change in volume shrinkage is designated as a quality metric in this study.
The average volume shrinkage is defined on the basis of the relaxation density of the polymer during relaxation to ambient temperature at standard atmospheric pressure after the completion of the packing stage, as follows:
where
denotes the density at ambient temperature and standard atmospheric pressure, and
denotes the average density along the thickness.
The Taguchi method [
24] was used to study the effects of the process parameters on shrinkage. It is feasible to identify the optimal processing conditions with considerable precision for reducing shrinkage. It is recognized that the significant parameters affecting the volumetric shrinkage defect in the injection molding process include mold temperature, melt temperature, injection time, packing time, packing pressure, cooling time, cooling temperature, etc. [
12]. In this work, the controllable factors selected were the injection time, melt temperature, packing pressure, and packing time, designated factors A, B, C, and D, respectively. It is presumed that there is no interaction between the factors. For each factor, three levels were uniformly selected within the value range, which basically comes from literature and engineering production trials, as shown in
Table 1.
The L
9 (3
4) orthogonal array was adopted as the test scheme, and the change in the volume shrinkage rate was designated as the quality indicator. The molding process was analyzed using MoldFlow software with version 2015. The layout of the L
9 orthogonal array and the numerical outcomes are presented in
Table 2.
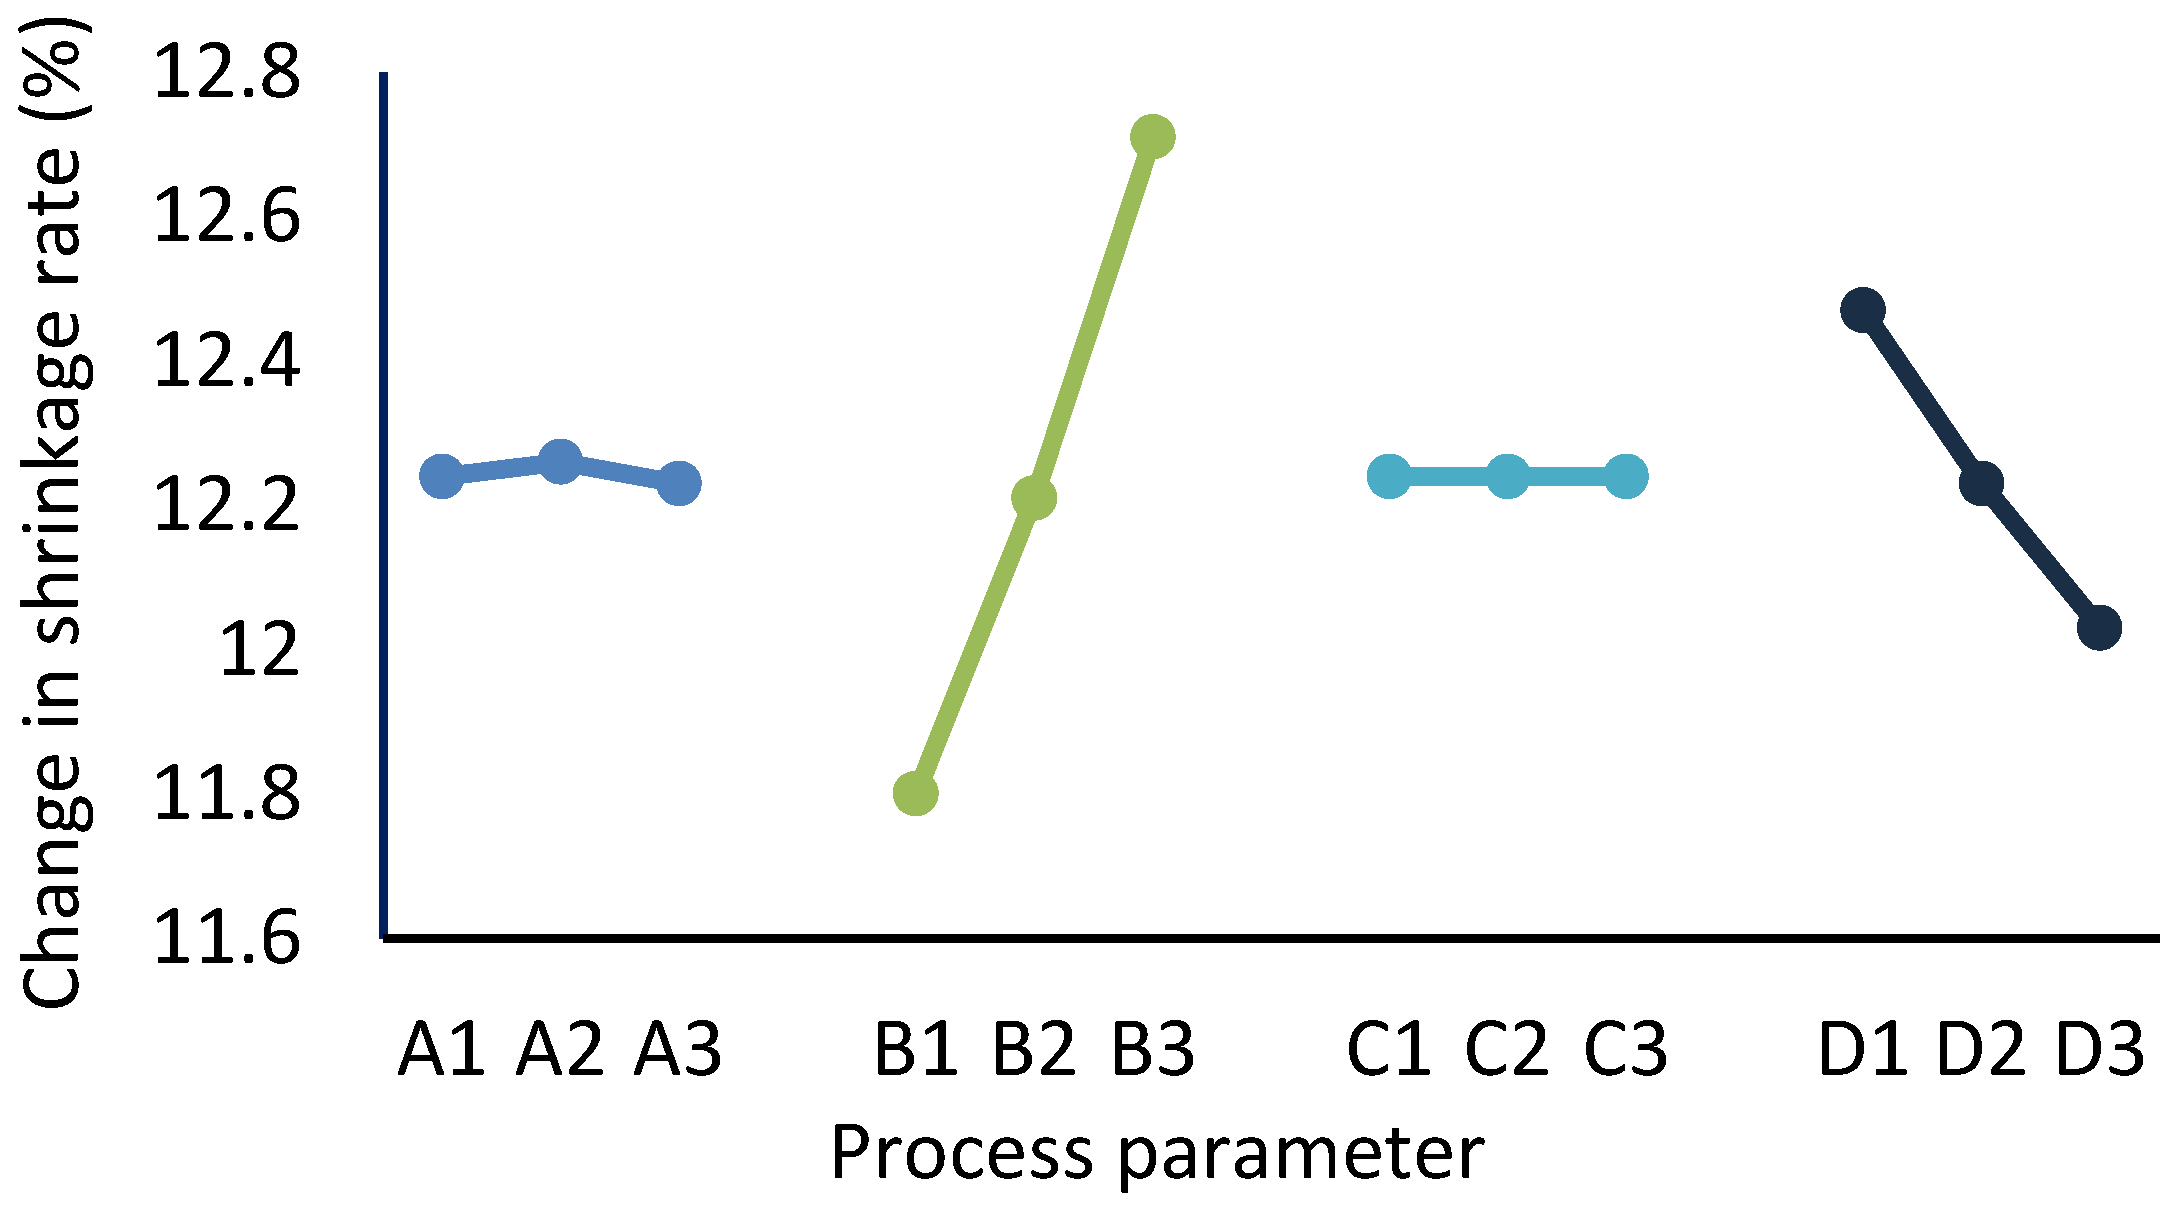
The response to the change in the volume shrinkage rate is given in
Table 3. As indicated by the data in
Table 3,
Figure 5 shows the variations in the volume shrinkage rate with the level of each factor. To minimize sink voids, the change in volume shrinkage should be minimized; therefore, the optimal combination of parameters can be identified by selecting the level with the lowest value for each factor. As a result, the optimal process parameter combination is A3, B1, C2, and D3, corresponding to an injection time of 4 s, a melt temperature of 265 °C, a packing pressure of 80 MPa, and a packing time of 70 s. This optimal parameter combination serves as the process condition for the subsequent simulation analysis and trial production.
Additionally, the impact of process parameters on shrinkage can be accessed via range values R, which represent the difference between the maximum and minimum mean values of the quality metric associated with a factor across different levels, as shown in
Table 3. A higher range value indicates a stronger influence of the factor on the quality metric as the level changes. Consequently, the range value identifies the most significant factor for the shrinkage of the injected parts. According to the data in
Table 3, factor B has the highest R value; consequently, the melt temperature is the most significant factor, followed by the packing time and injection time, whereas variations in the packing pressure within the established level range do not impact the shrinkage of the parts.
4.3. Initial CAE Simulation
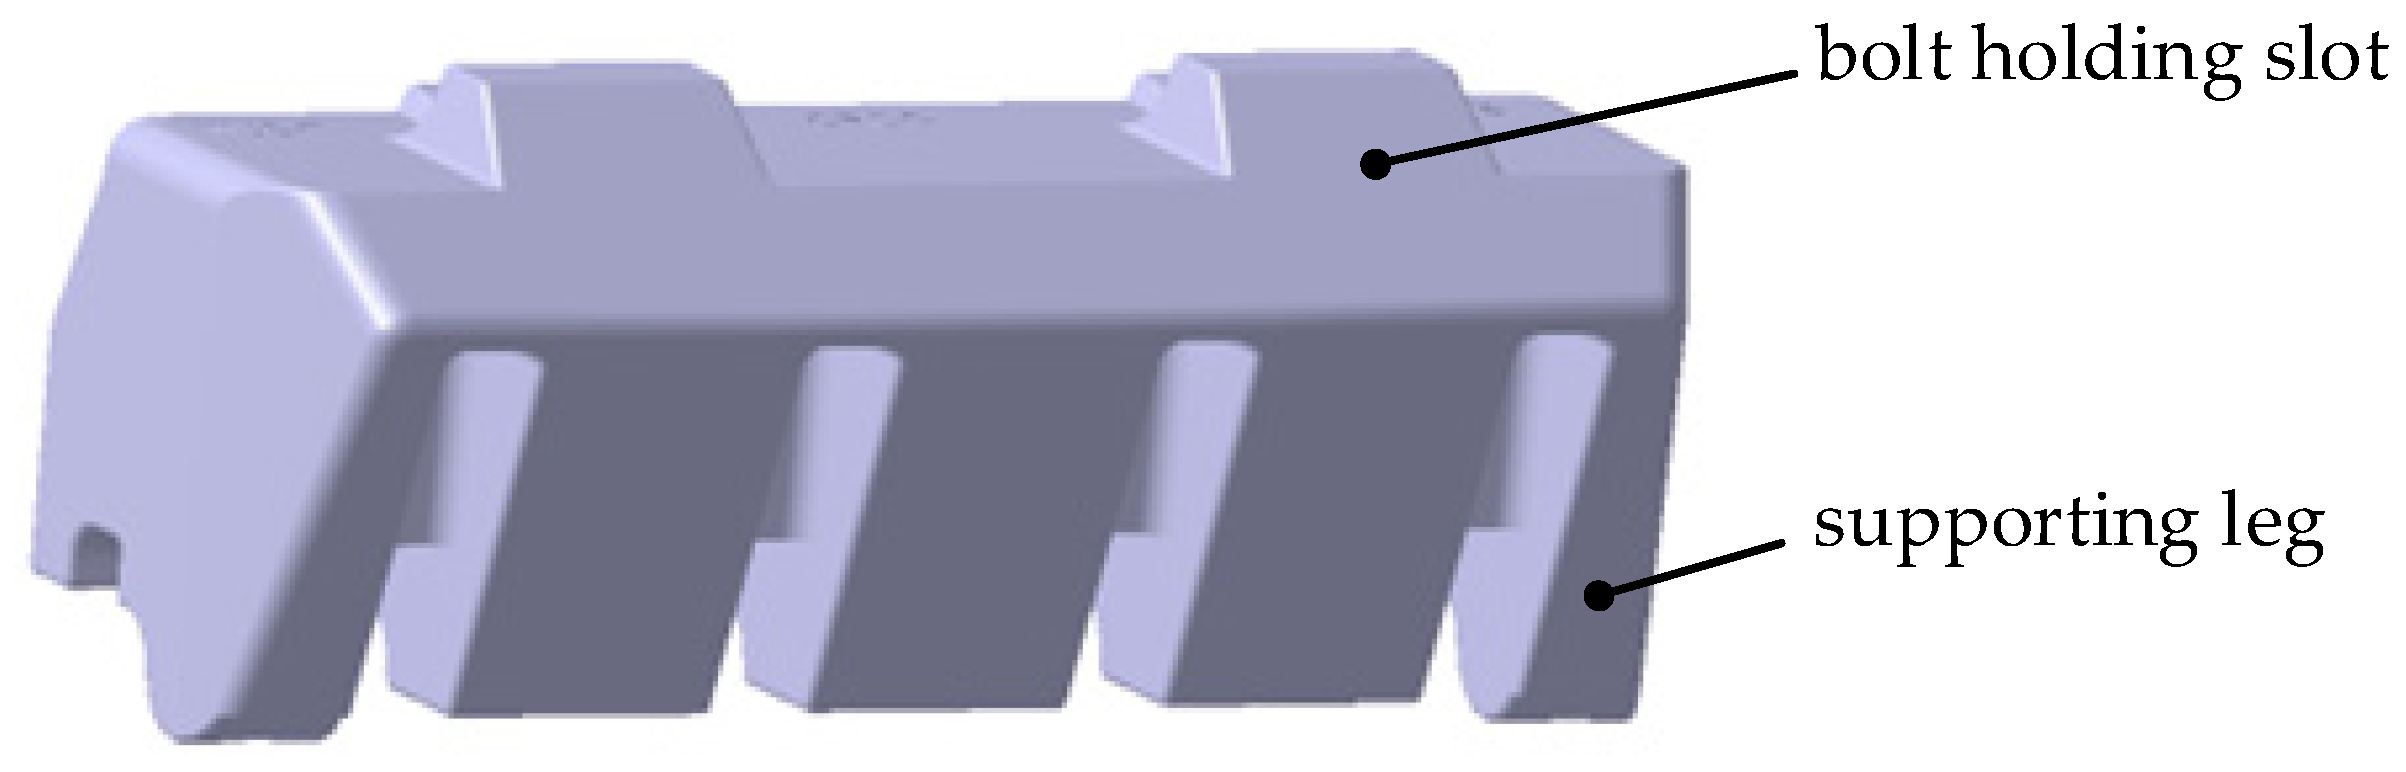
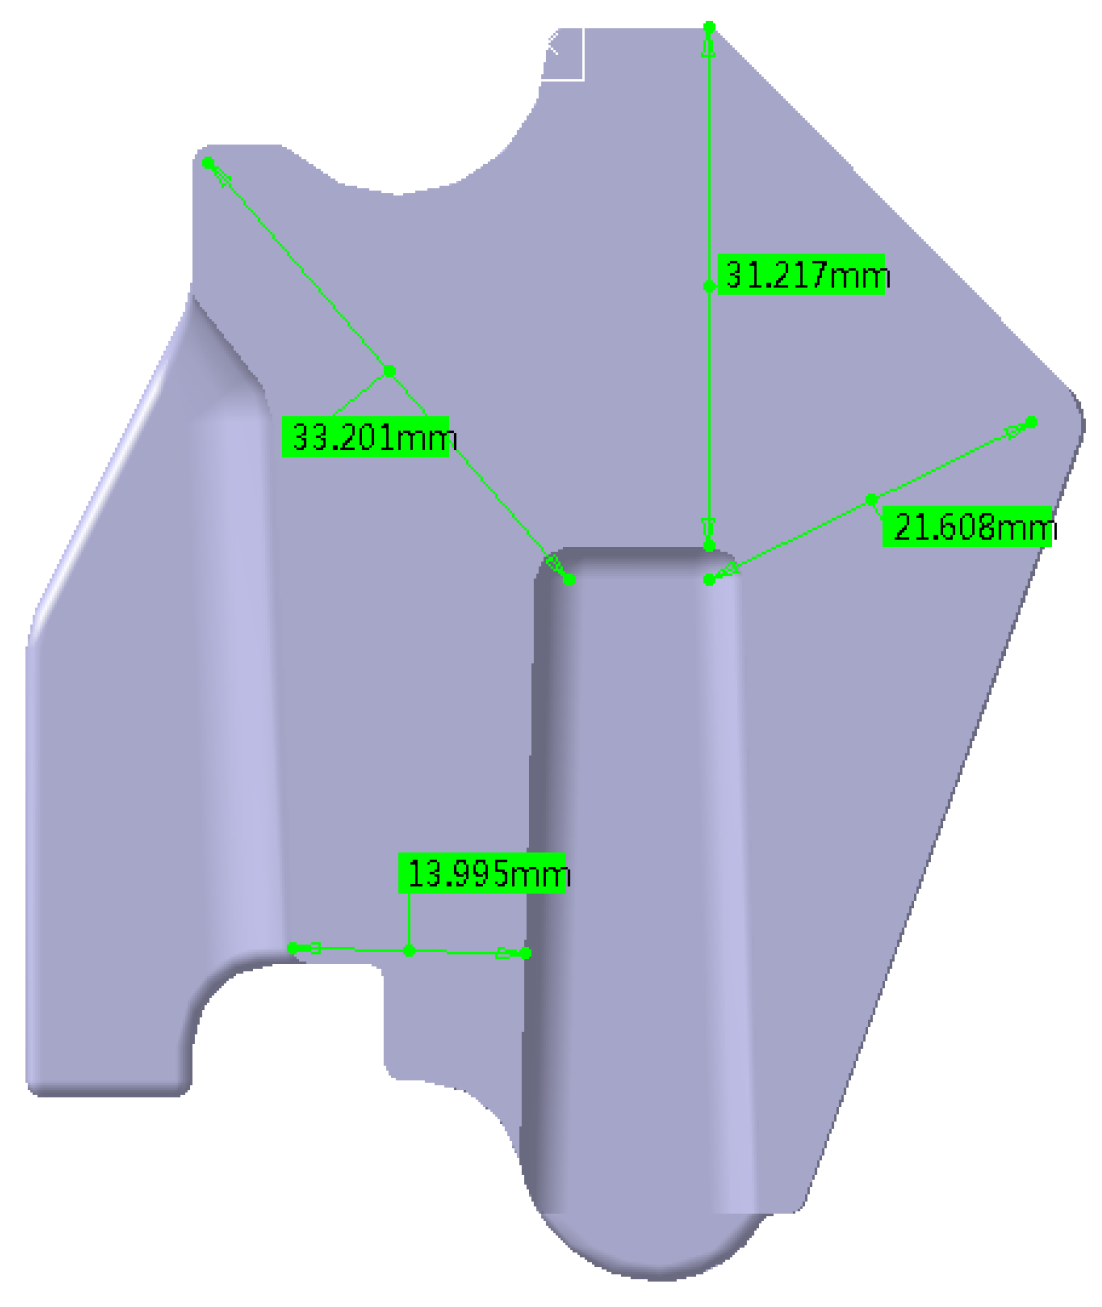
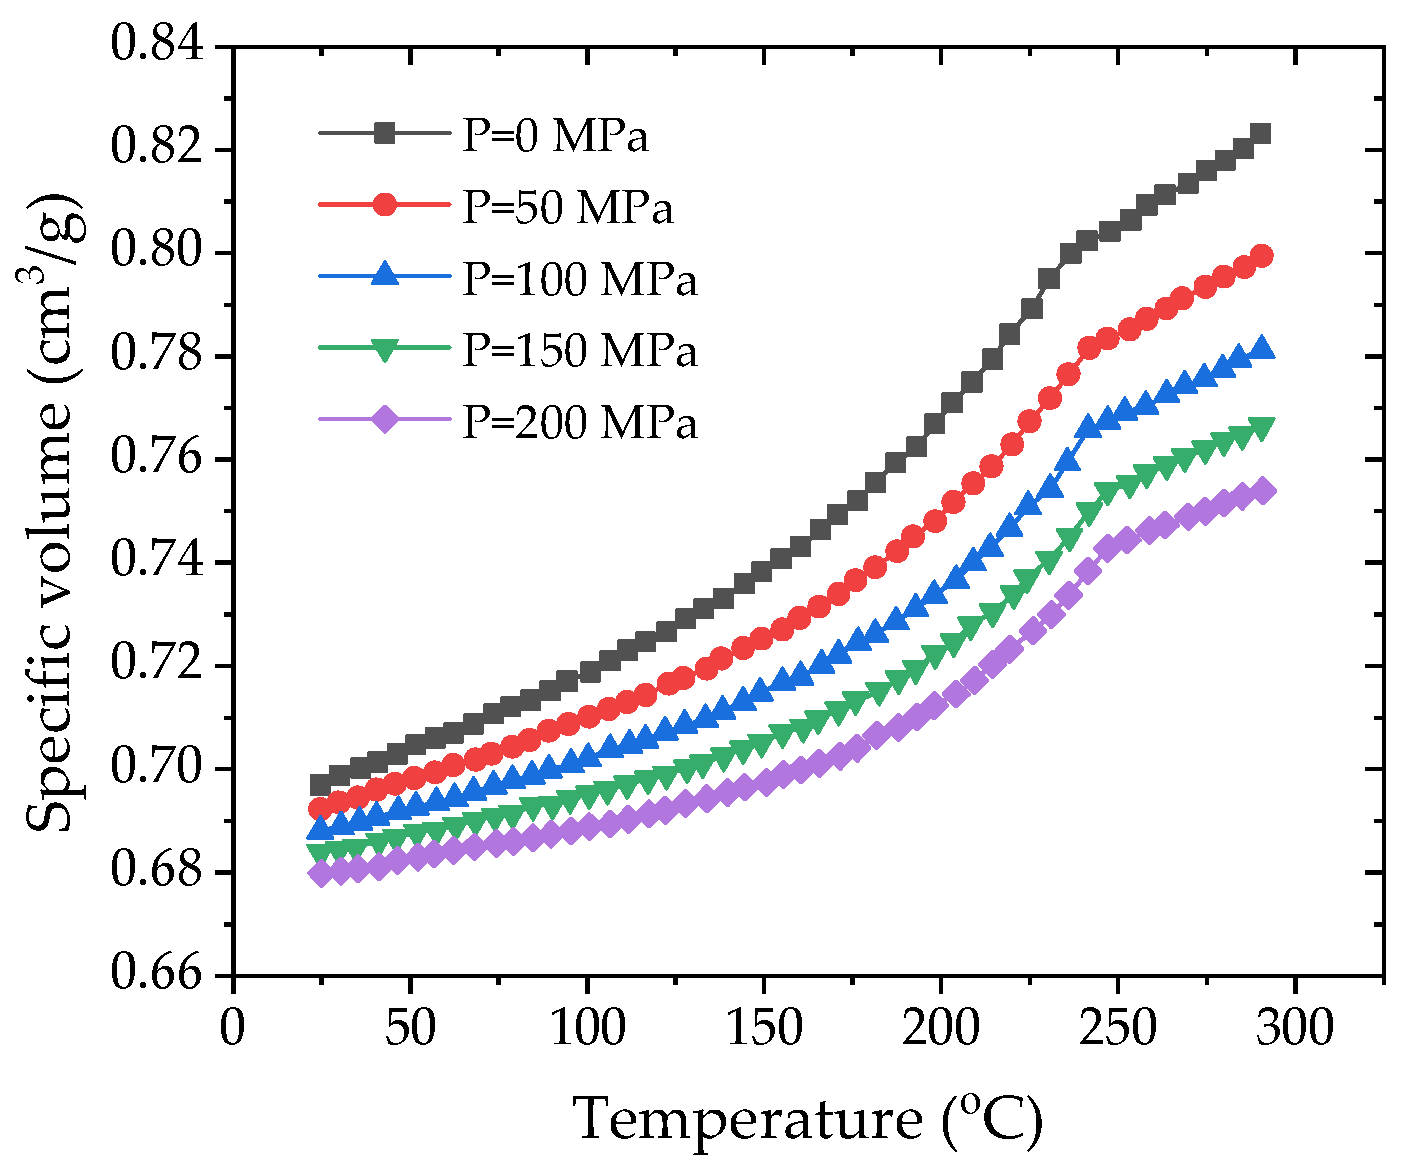
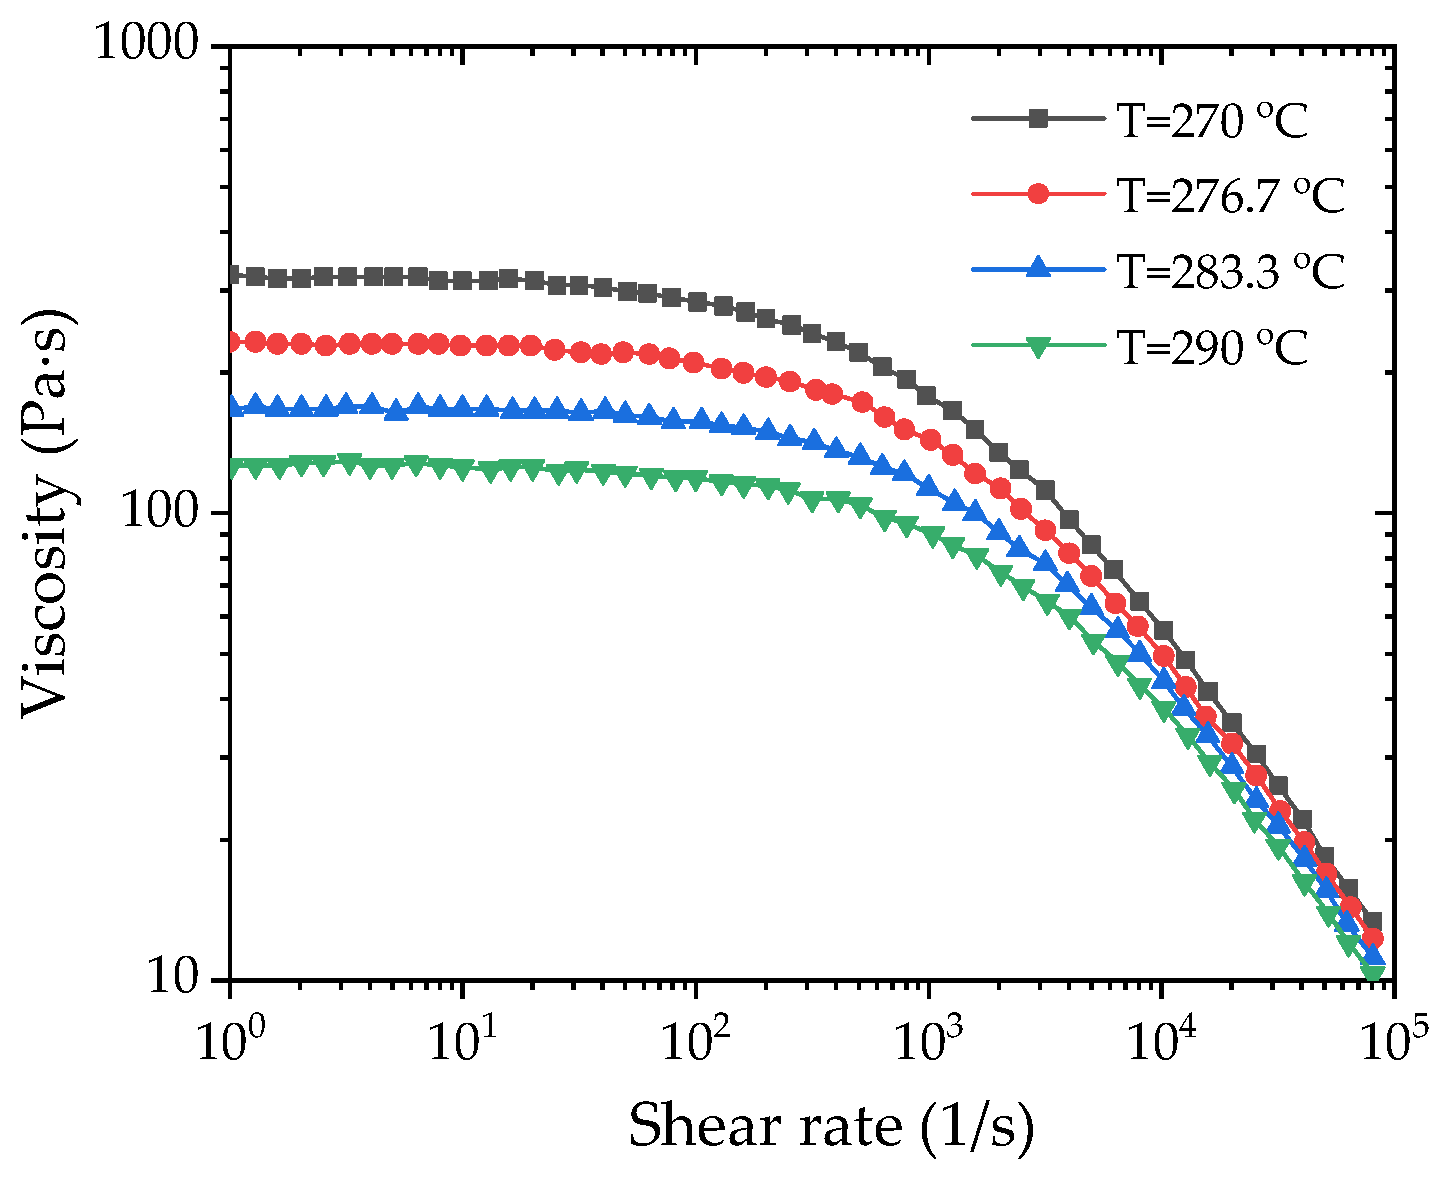
The injection molding process of the gauge plate was numerically simulated via Moldflow software with version 2015 to investigate sink void formation mechanisms. The analysis employed PA66-NPG30BK001 (PA66 reinforced with 30% glass fiber, PA66 + 30GF for short), matching actual production material specifications. The properties of the material are given in
Table 4, in which the PVT and shear viscosity curves are plotted in
Figure 6 and
Figure 7, respectively. The simulation incorporated an optimized process parameter set consisting of a 4-s injection time, a 70-s packing time under 80 MPa packing pressure, and a total cycle time of 140 s, as obtained by the Taguchi method in
Section 4.2 and listed in
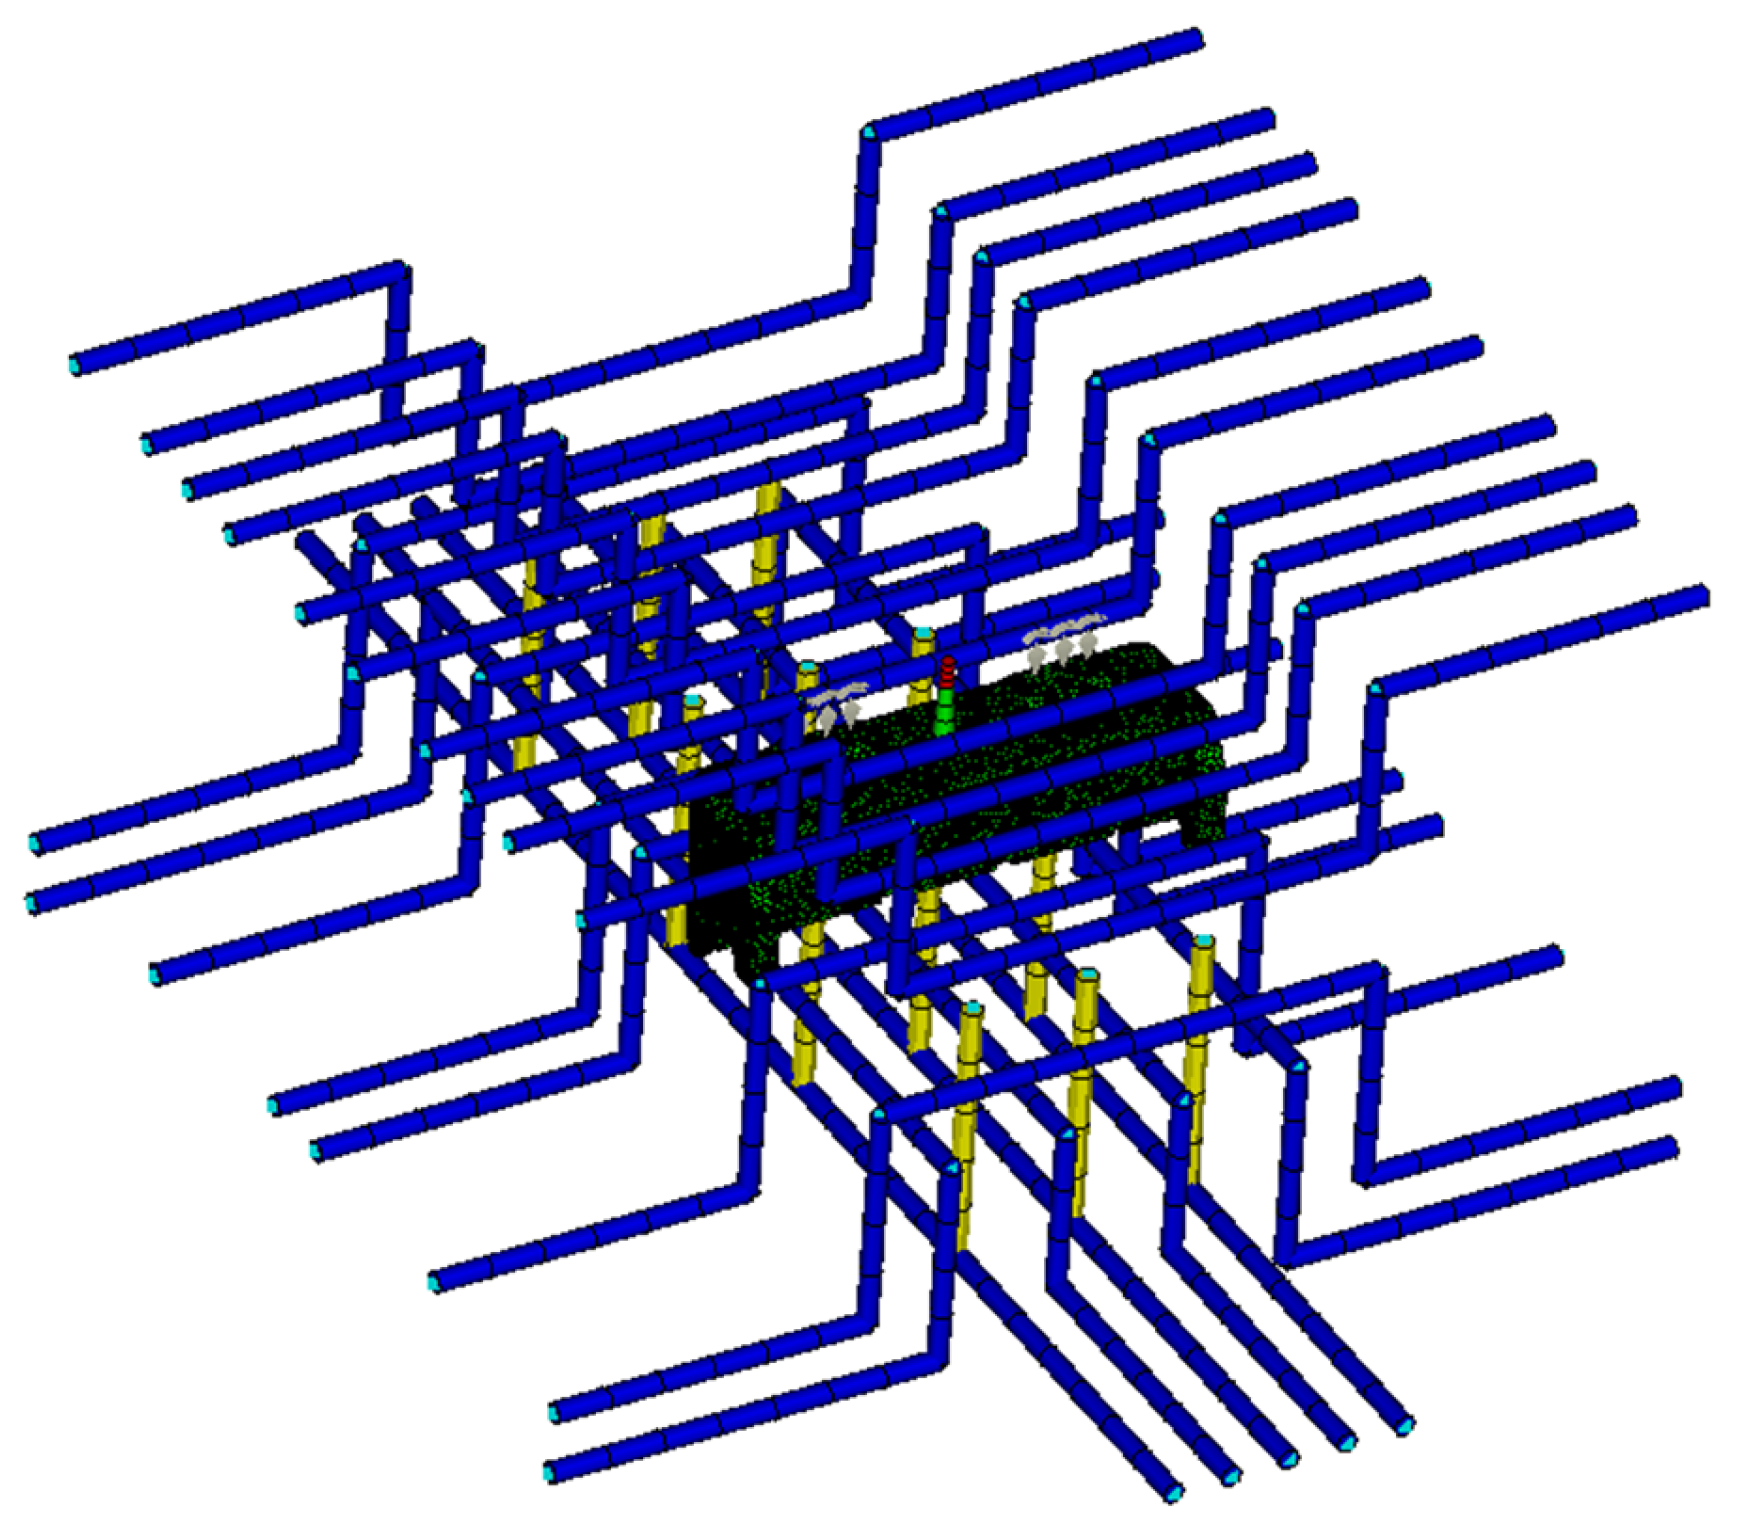
Table 5. A needle-valve-controlled hot runner system was implemented in the finite element model, which comprehensively addressed four critical subsystems: a cooling system, a flow channel system, an exhaust system, and the final part geometry (
Figure 8). For meshing, due to the complex geometry and the varied wall thickness, the 3D meshing technique was used to generate 1,764,928 elements for the analysis. The cooling system and the flow channel system were designated as beam elements.
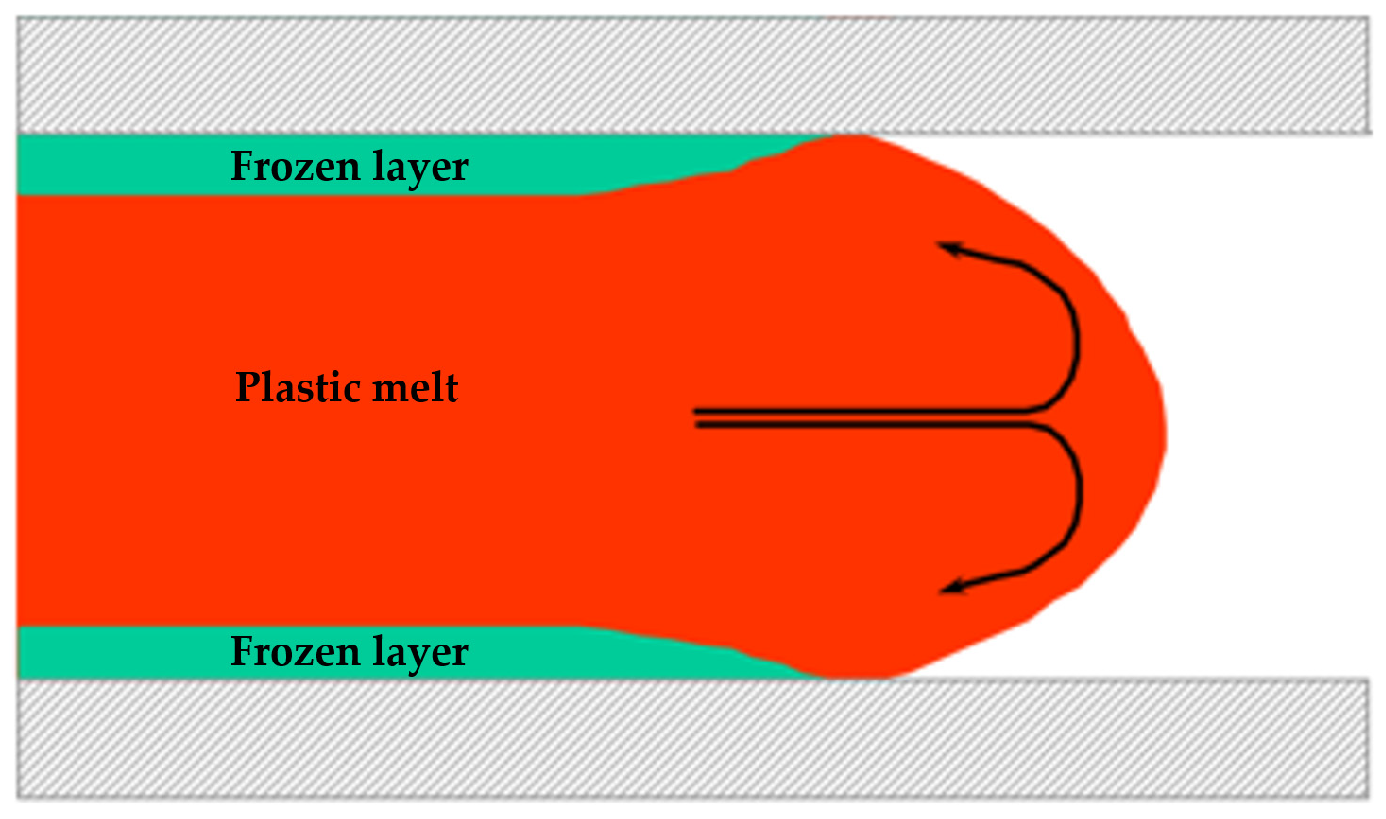
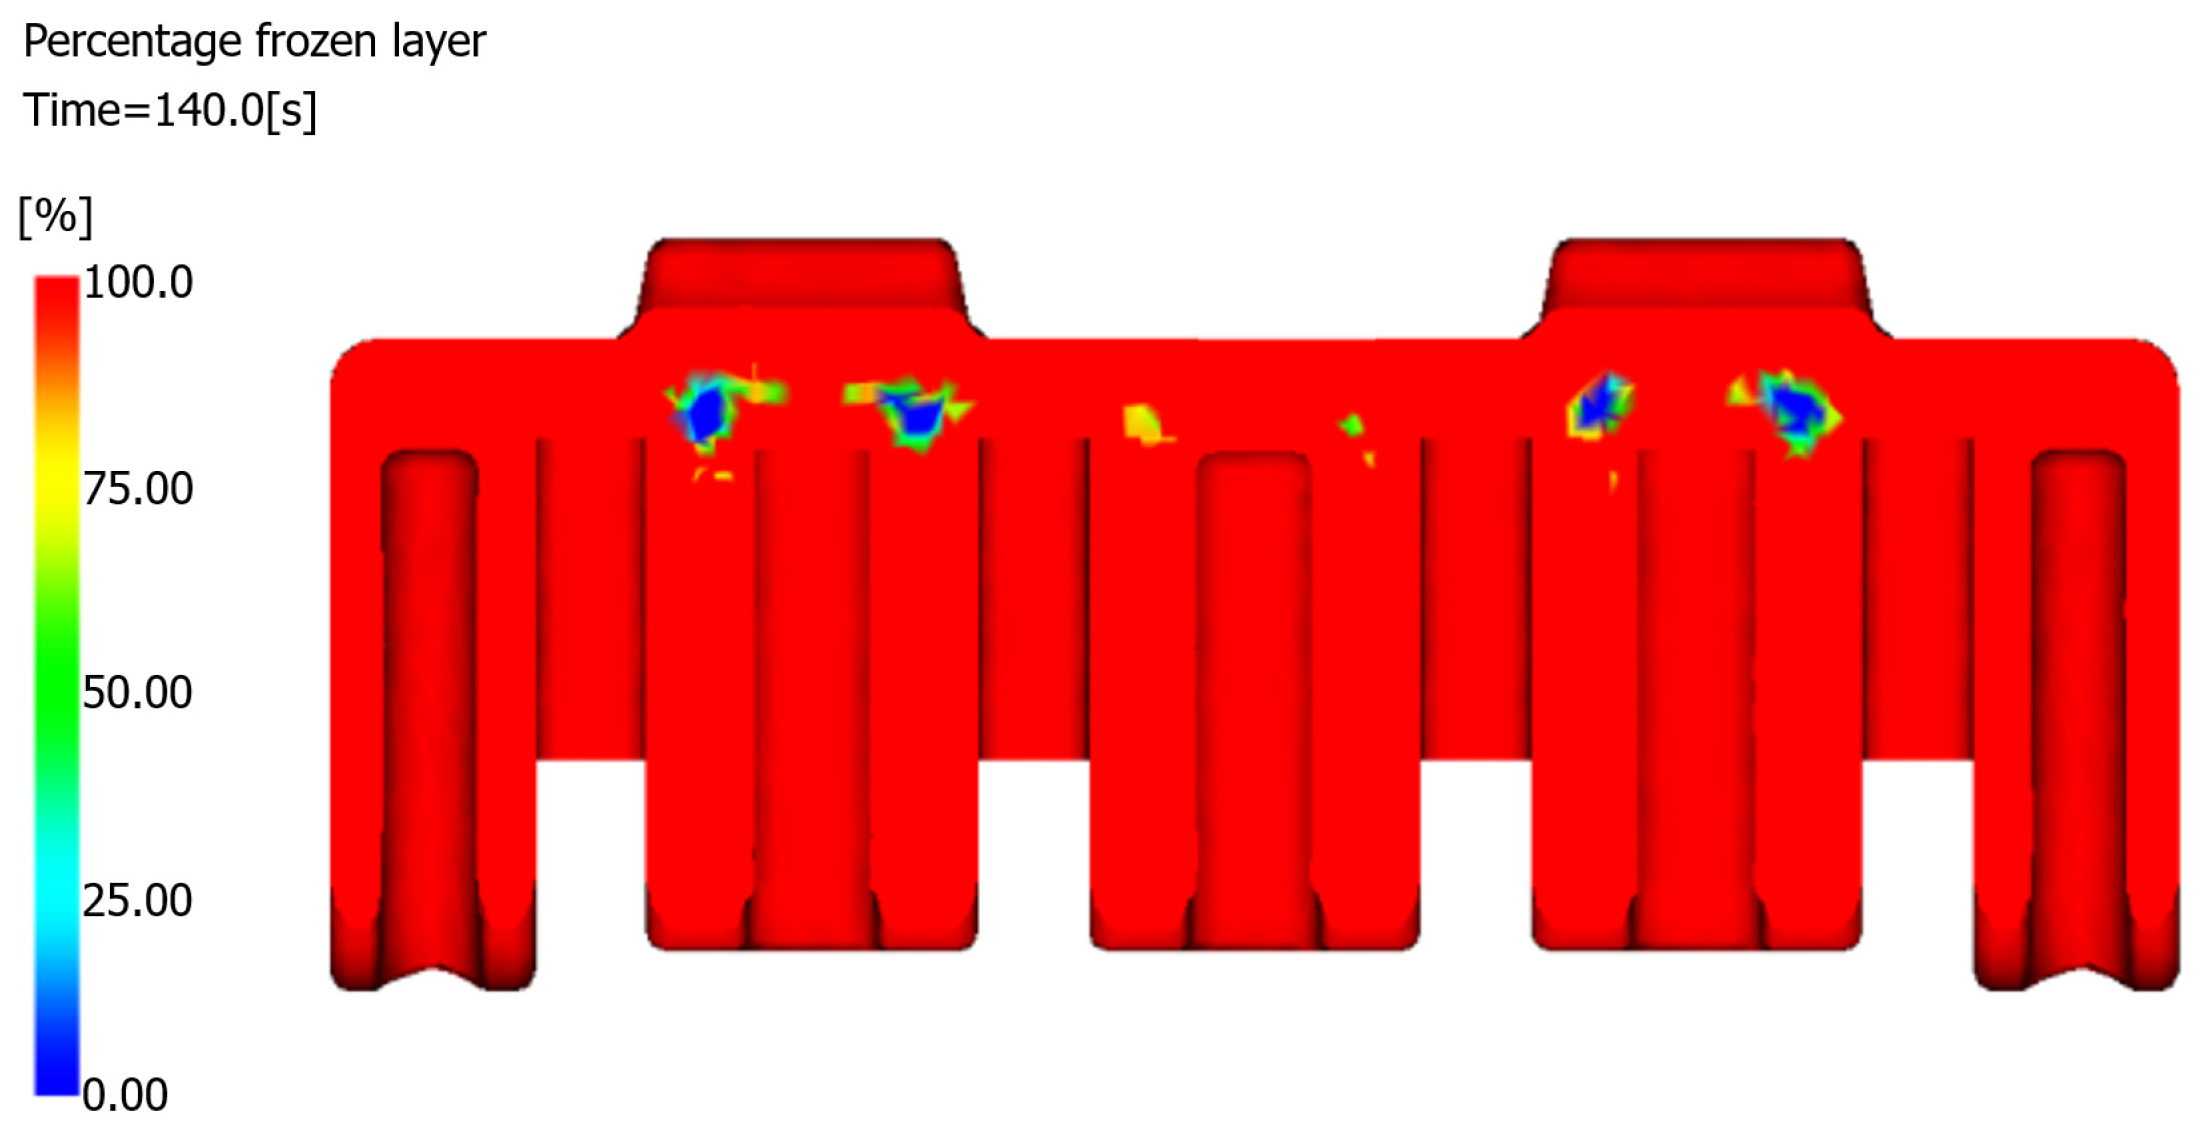
4.3.1. Frozen Layer Fraction
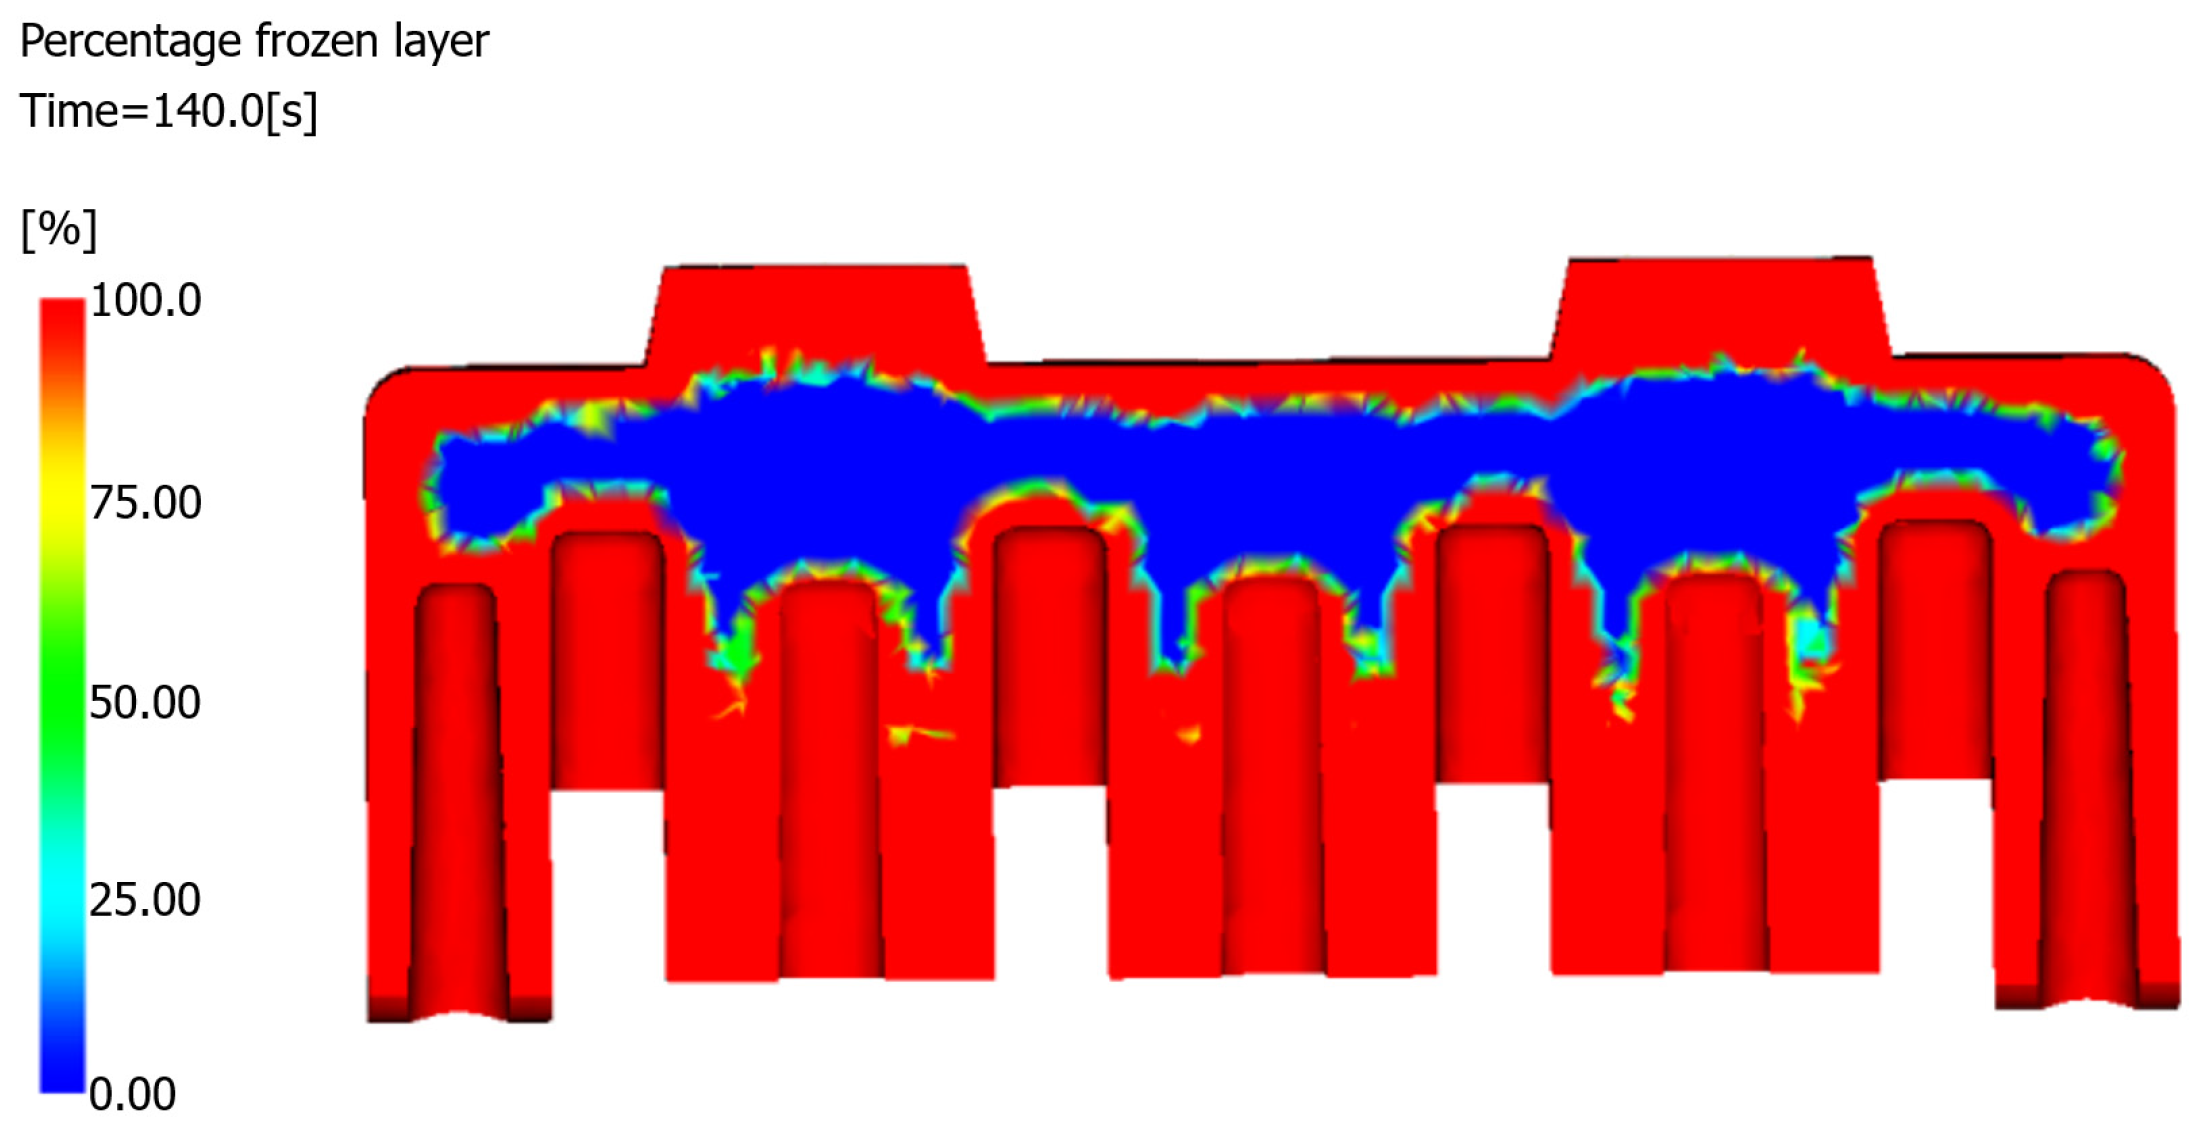
The frozen layer fraction, defined as the ratio of solidified material thickness to total wall thickness, serves as a critical indicator of the volumetric shrinkage potential. As shown in
Table 6, the simulation revealed that at the completion of the packing phase (63.75 s), the frozen layer fraction reached 49.56%, indicating that 50.44% of the component’s 369 cm
3 volume solidified without pressure compensation. This substantial unprescribed solidification creates differential shrinkage patterns that significantly increase sink void risk [
25,
26]. However, in real production, if the packing time is prolonged, it is difficult to seal the product within the specified time, which is not allowed. At the end of the production cycle (at 140 s), the simulation demonstrated a moderate frozen layer fraction of 75%, with residual molten material concentrated in the core region of the product (
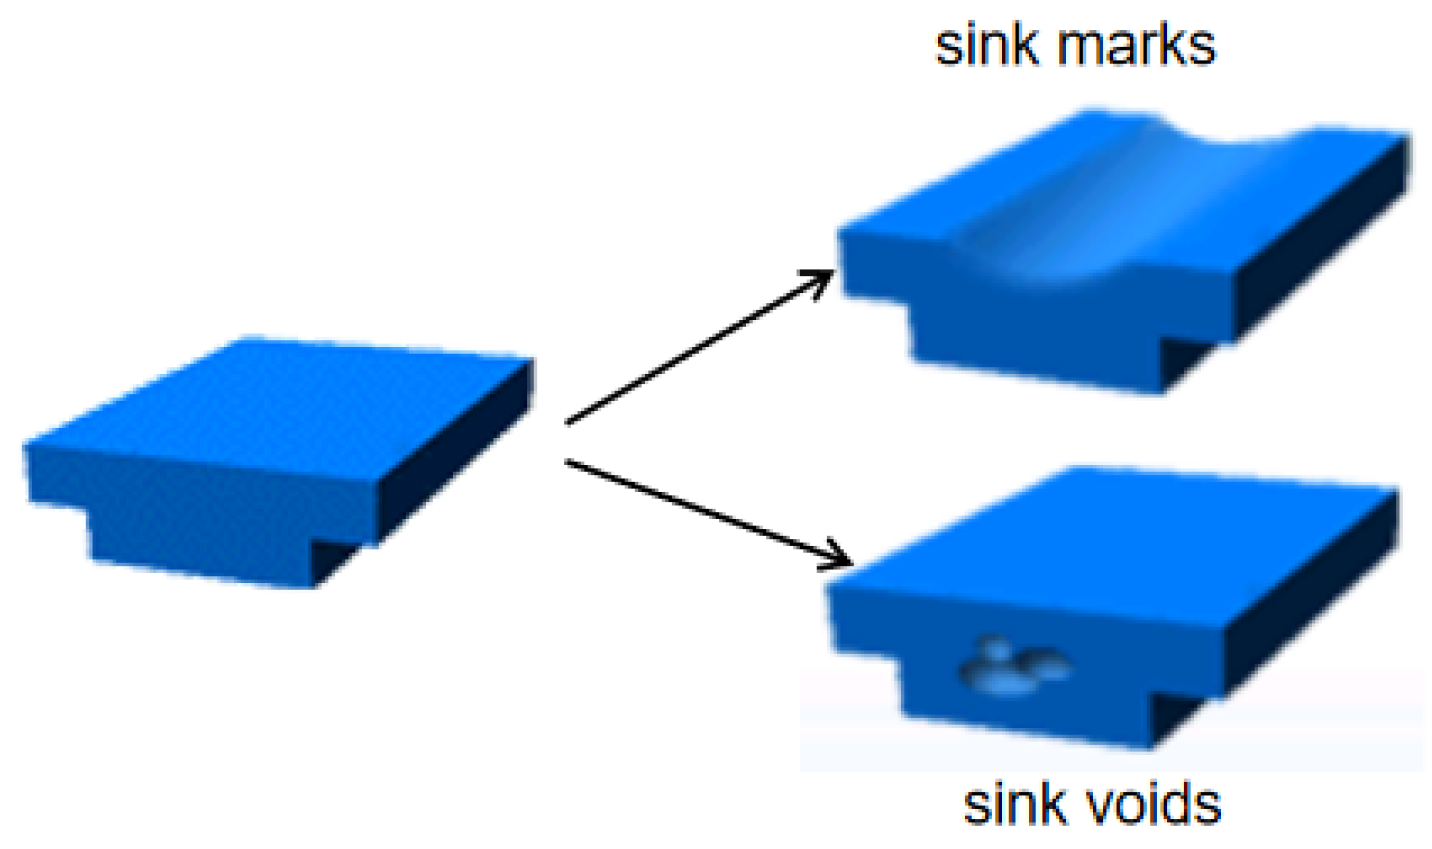
Figure 9). This thermal gradient establishes ideal conditions for sink void formation; the solidified surface layer restricts material flow, whereas the molten core continues contracting. The resulting stress concentration between the constrained surface layers and the shrinking internal material creates tensile forces that promote cavity formation.
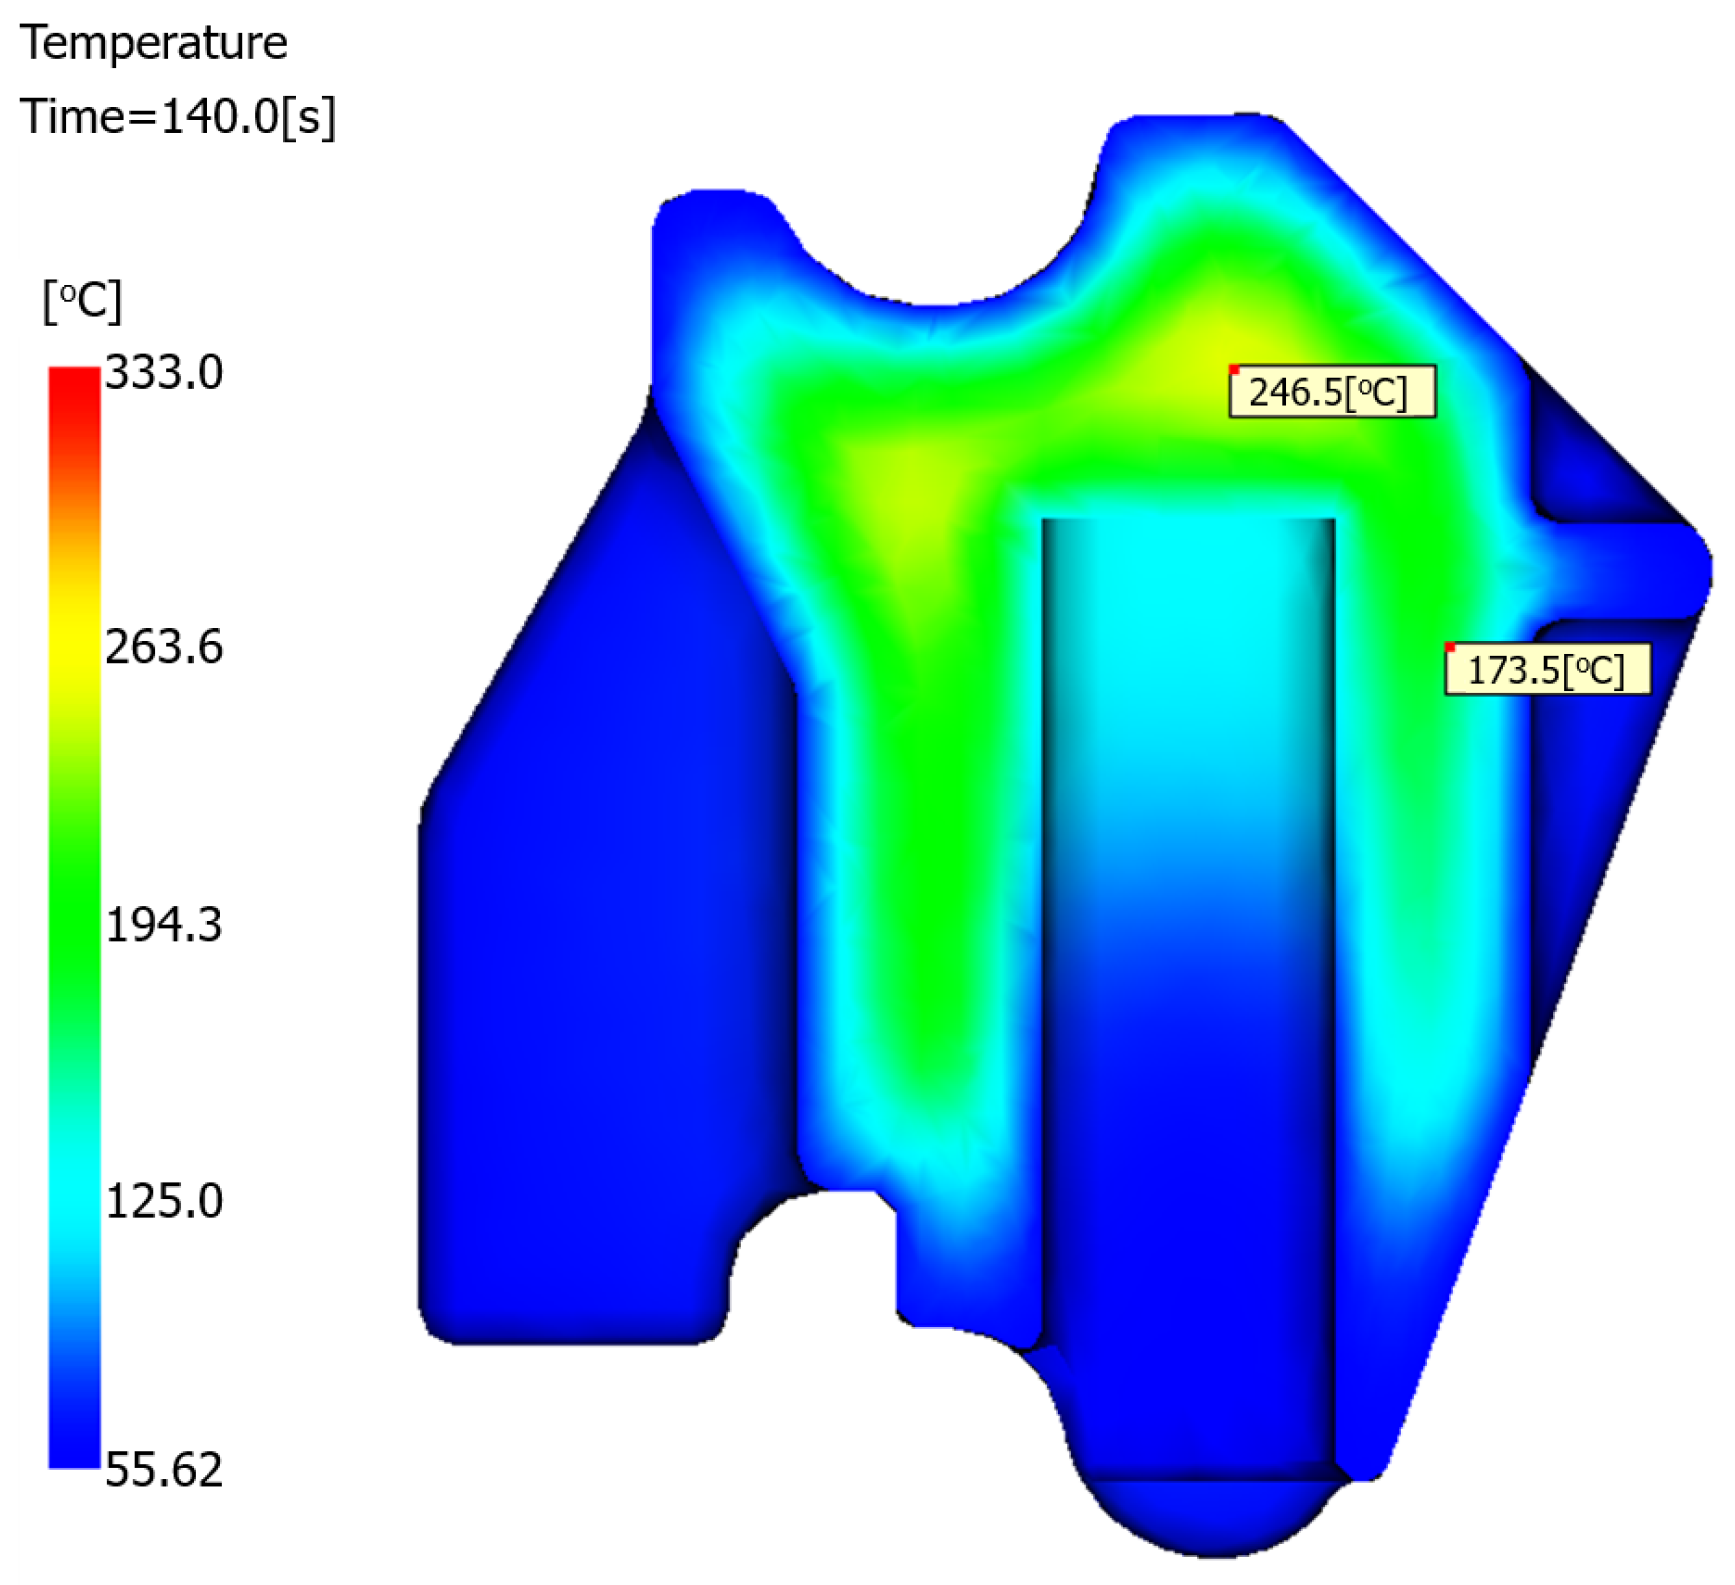
4.3.2. Temperature Distribution
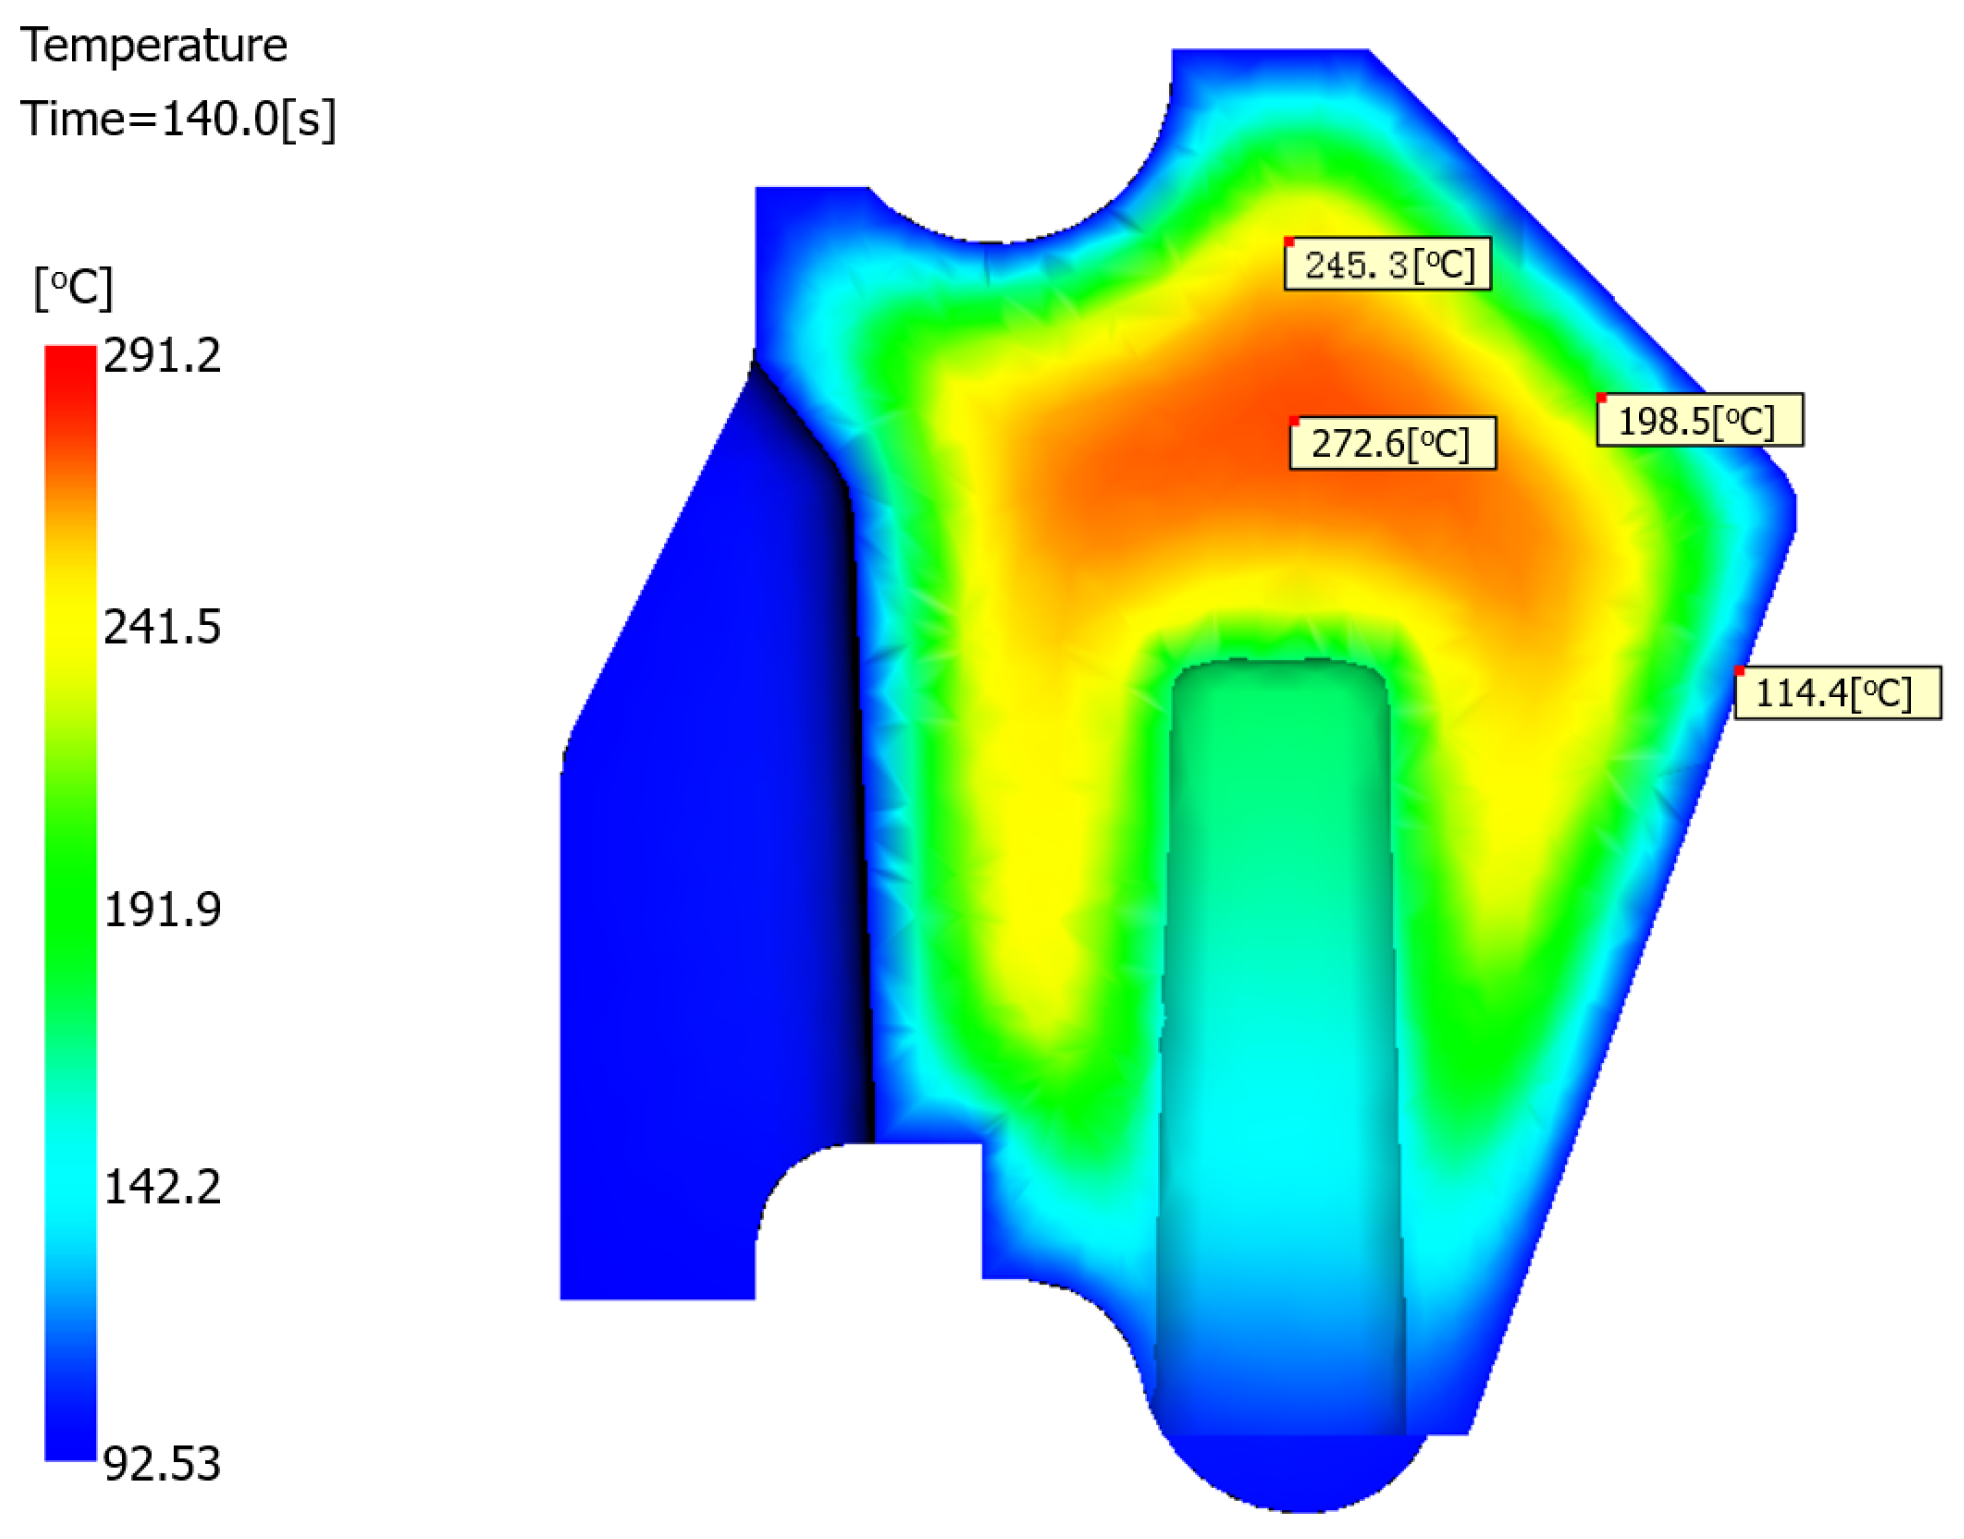
At the conclusion of the production cycle, the mold temperature in the core region of the product reaches 272 °C, as evidenced by the temperature profile shown in
Figure 10. This elevated core temperature persists while the surface material solidifies. During this freezing process, the resultant shrinkage tension is insufficient to draw the surface inward, consequently leading to the formation of sink voids within the product interior.
The above analysis of the frozen layer fraction and the temperature distribution indicates that the conventional gauge plate design presents a significant risk of sink void formation during the molding process.


