
3D-Printed PLA Mechanical and Viscoelastic Behavior Dependence on the Nozzle Temperature and Printing Orientation

 ,
,  ,
, 
Abstract
1. Introduction
2. Materials and Methods
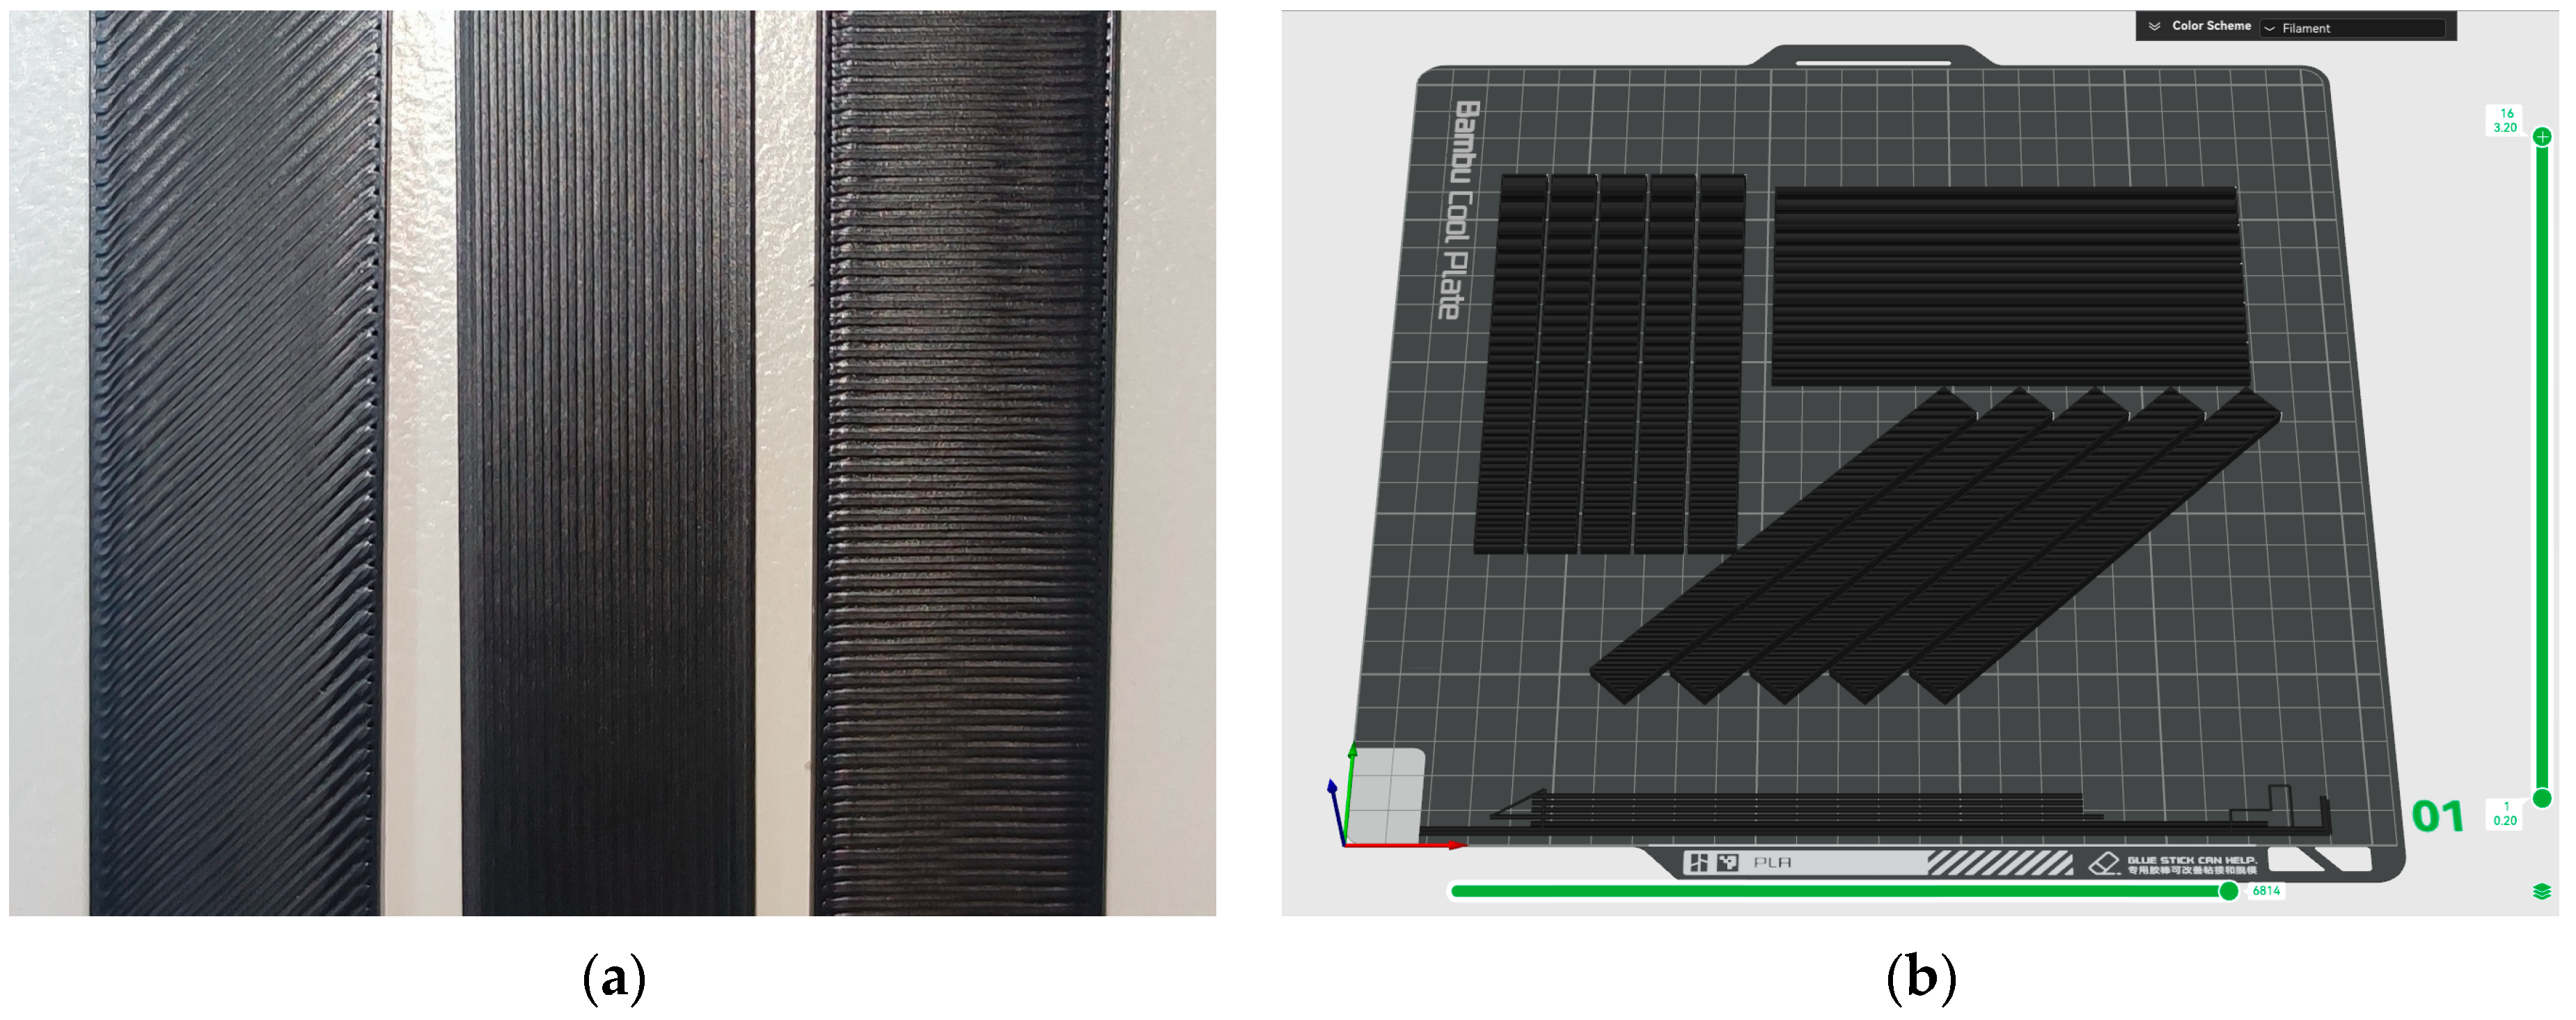
2.1. Materials and 3D-Printing Settings
2.2. Differential Scanning Calorimetry
2.3. Quasi-Static Mechanical Test
2.4. Dynamic Mechanical Analysis
3. Results and Discussion
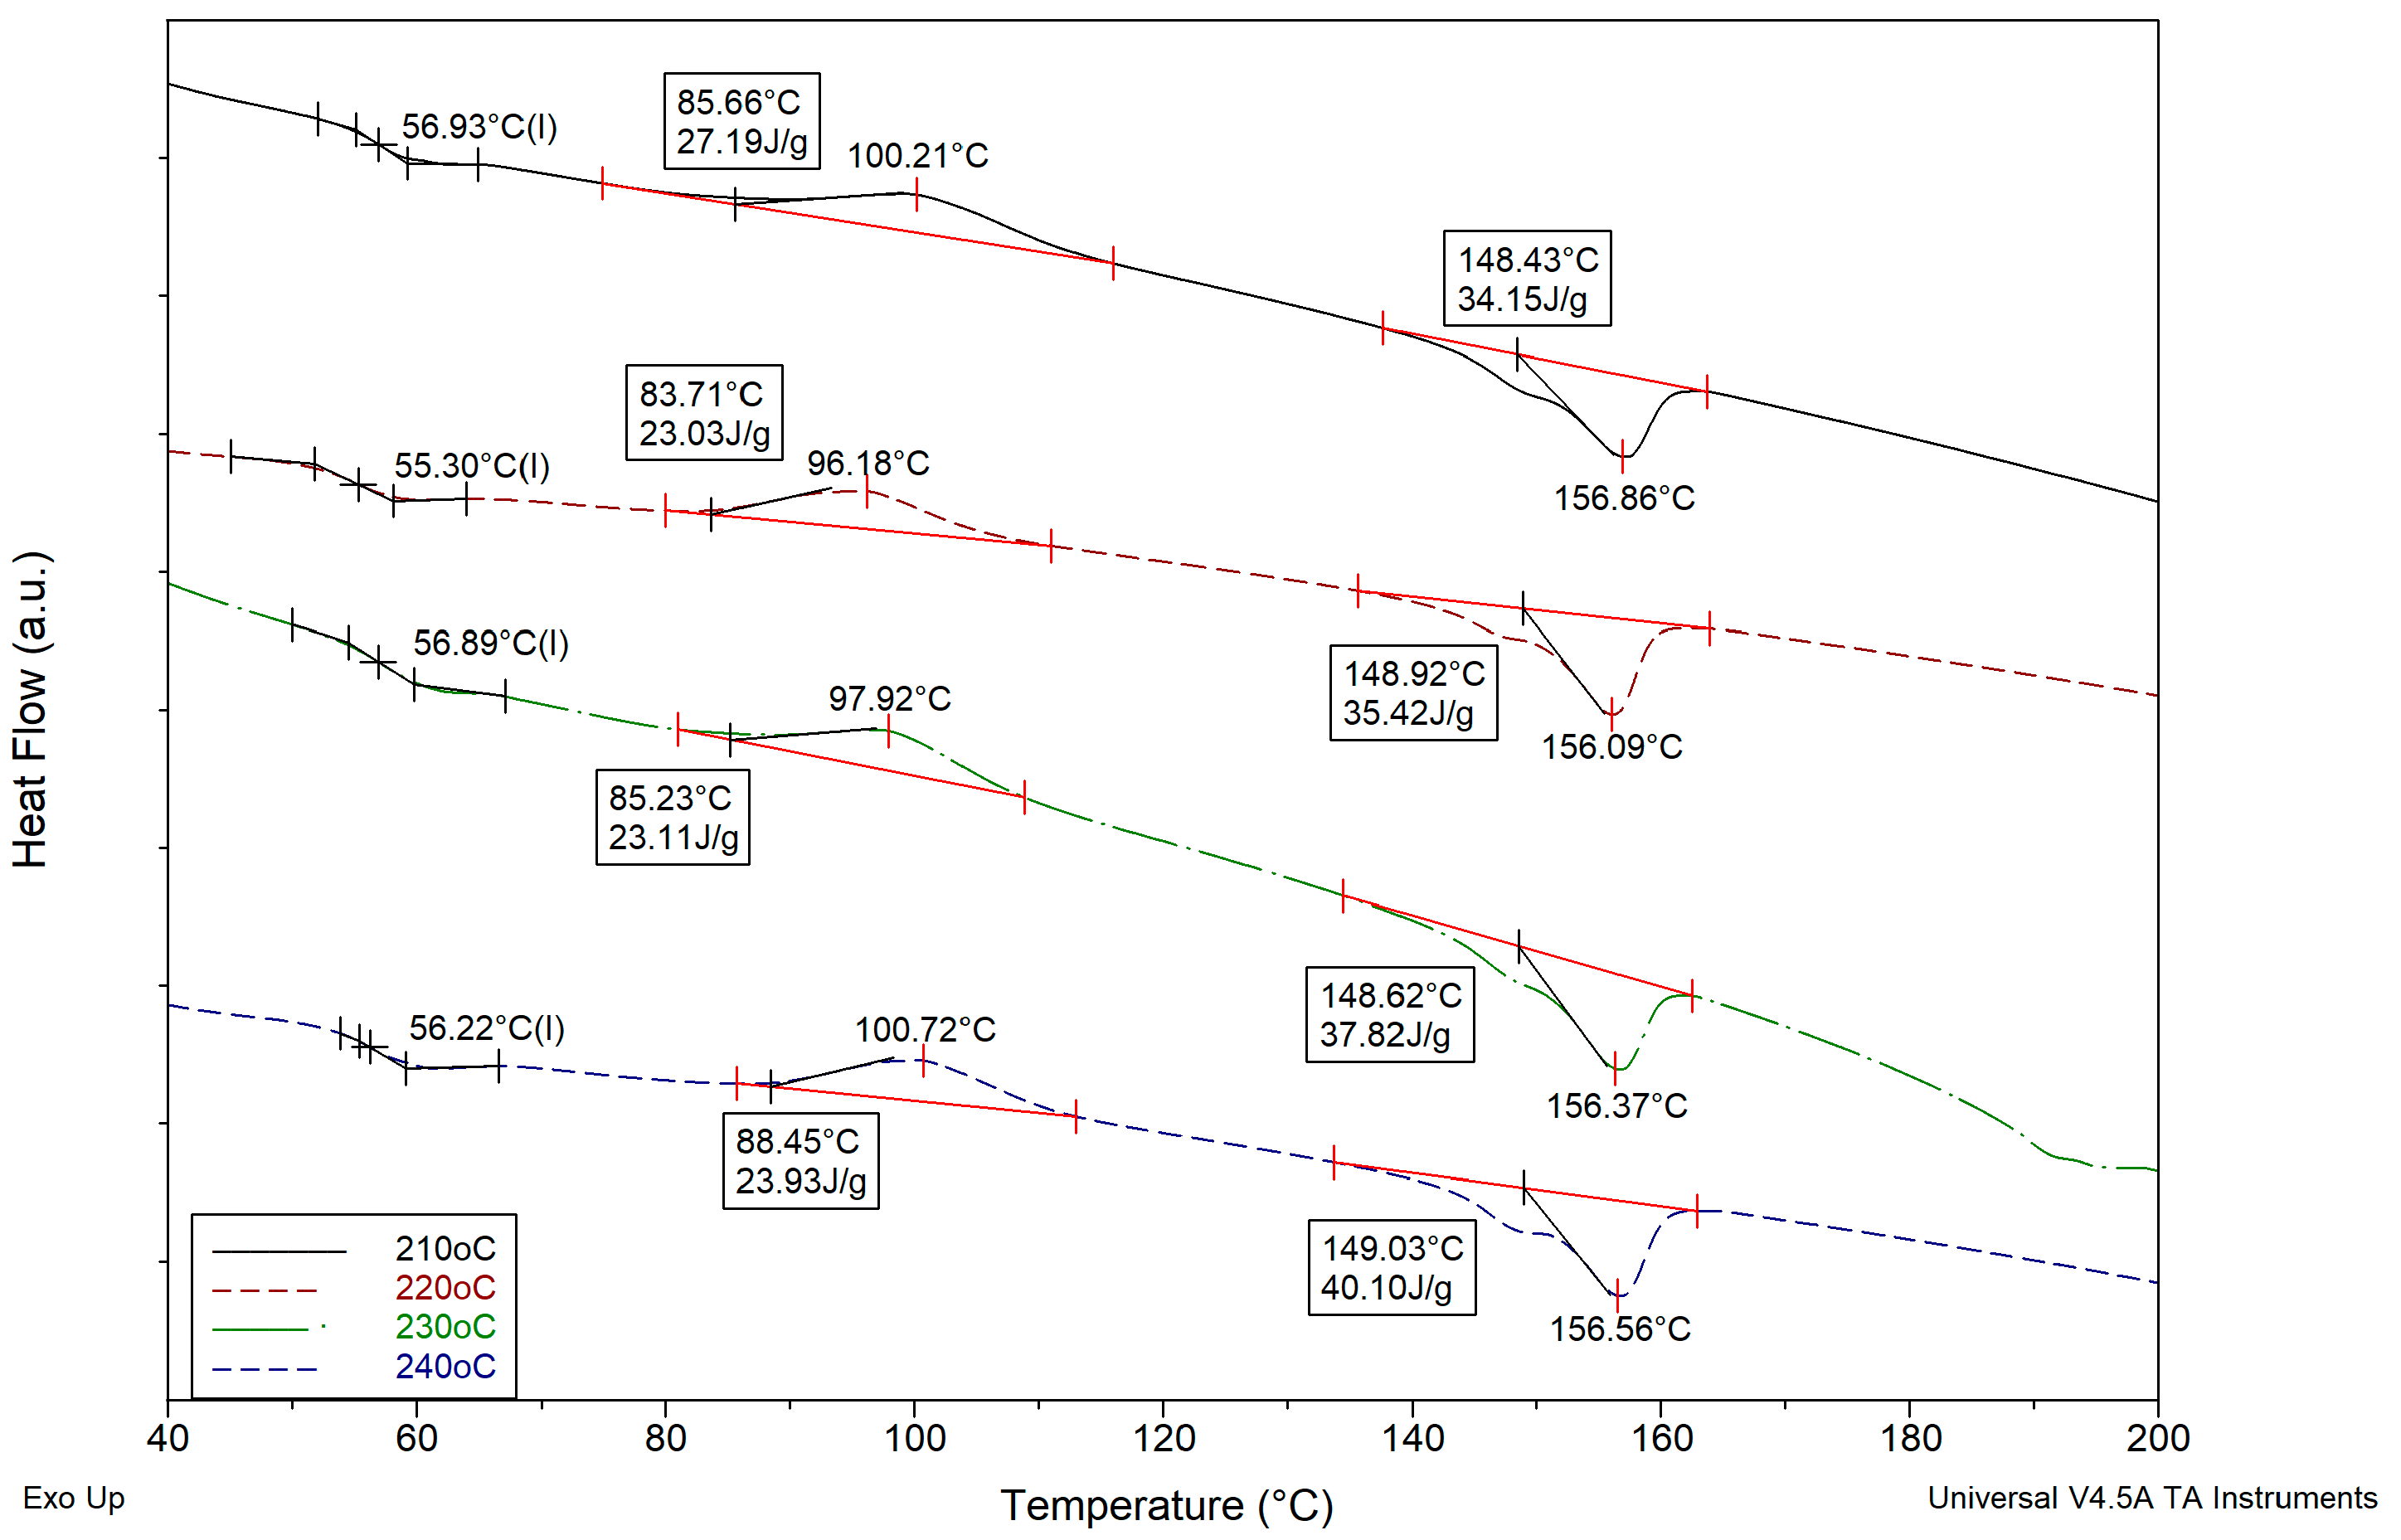
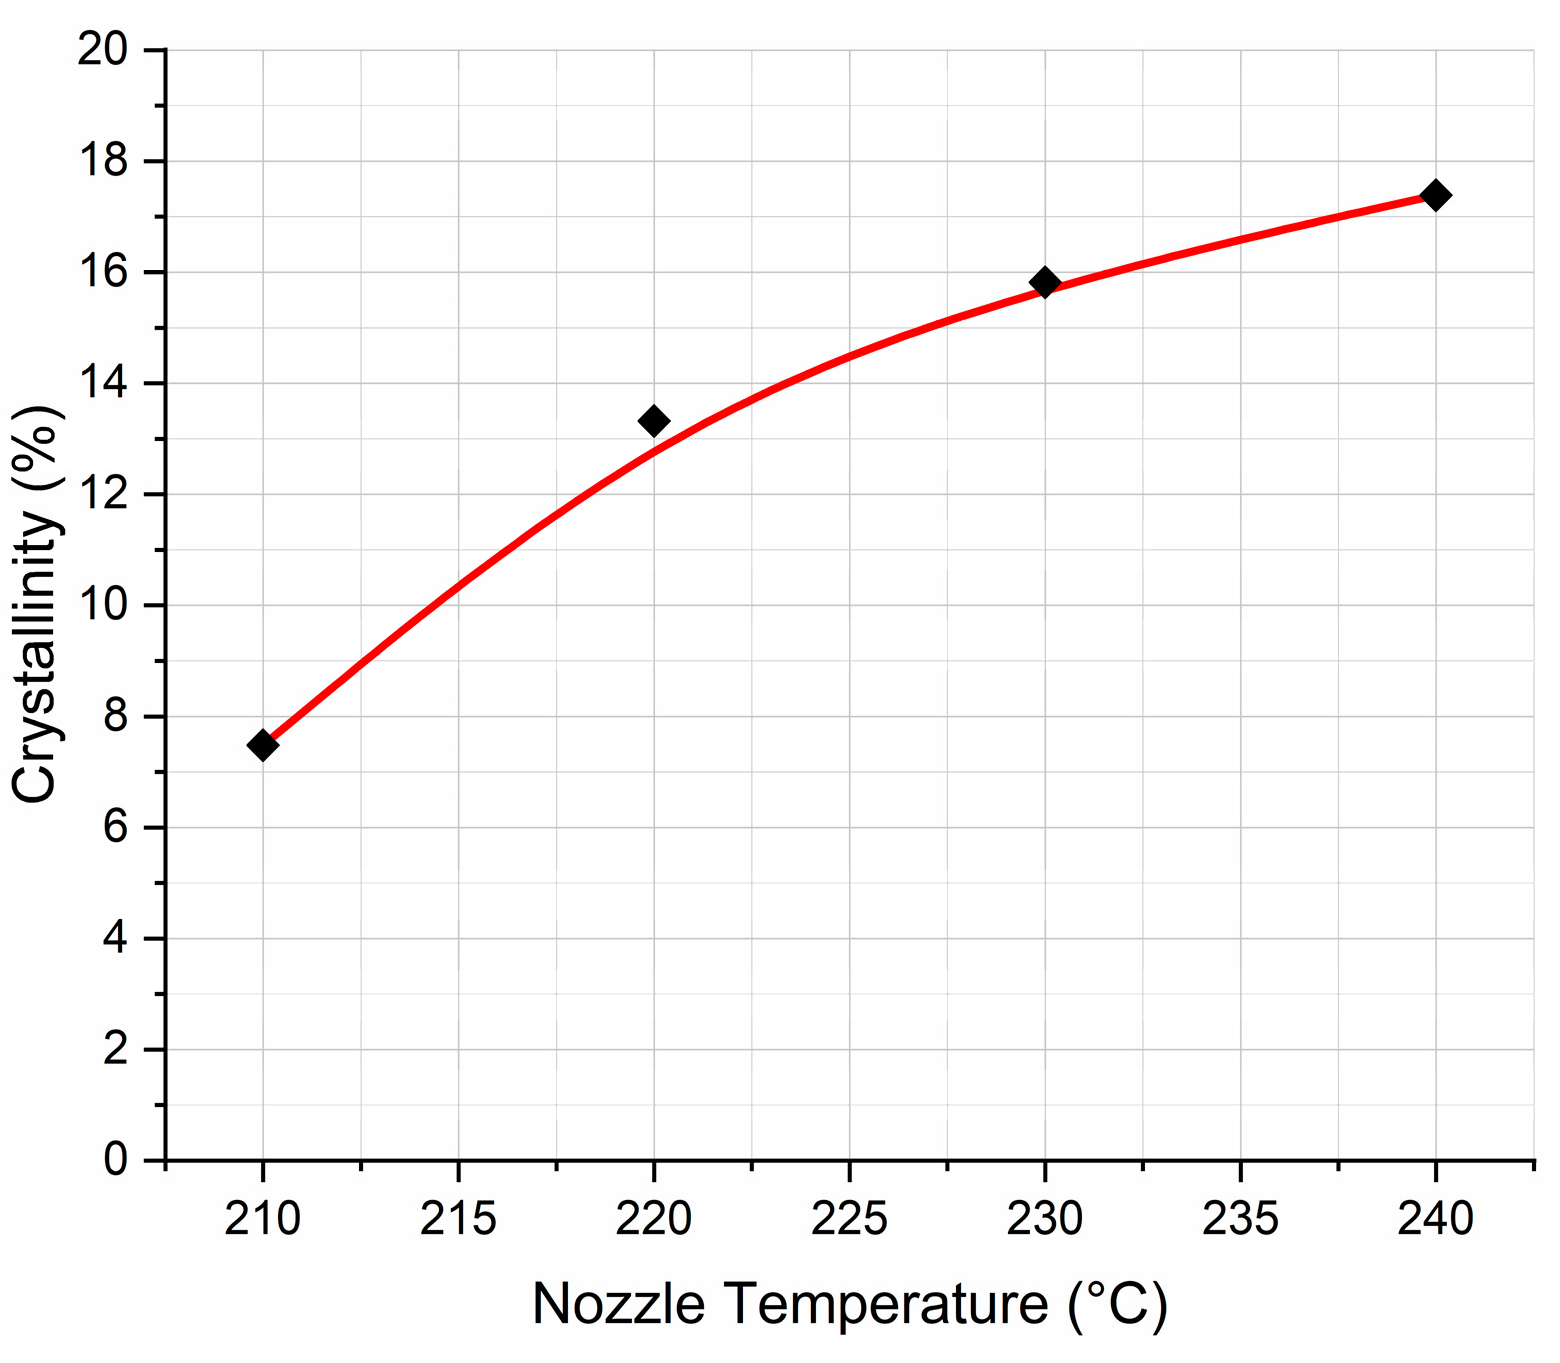
3.1. DSC Analysis of PLA
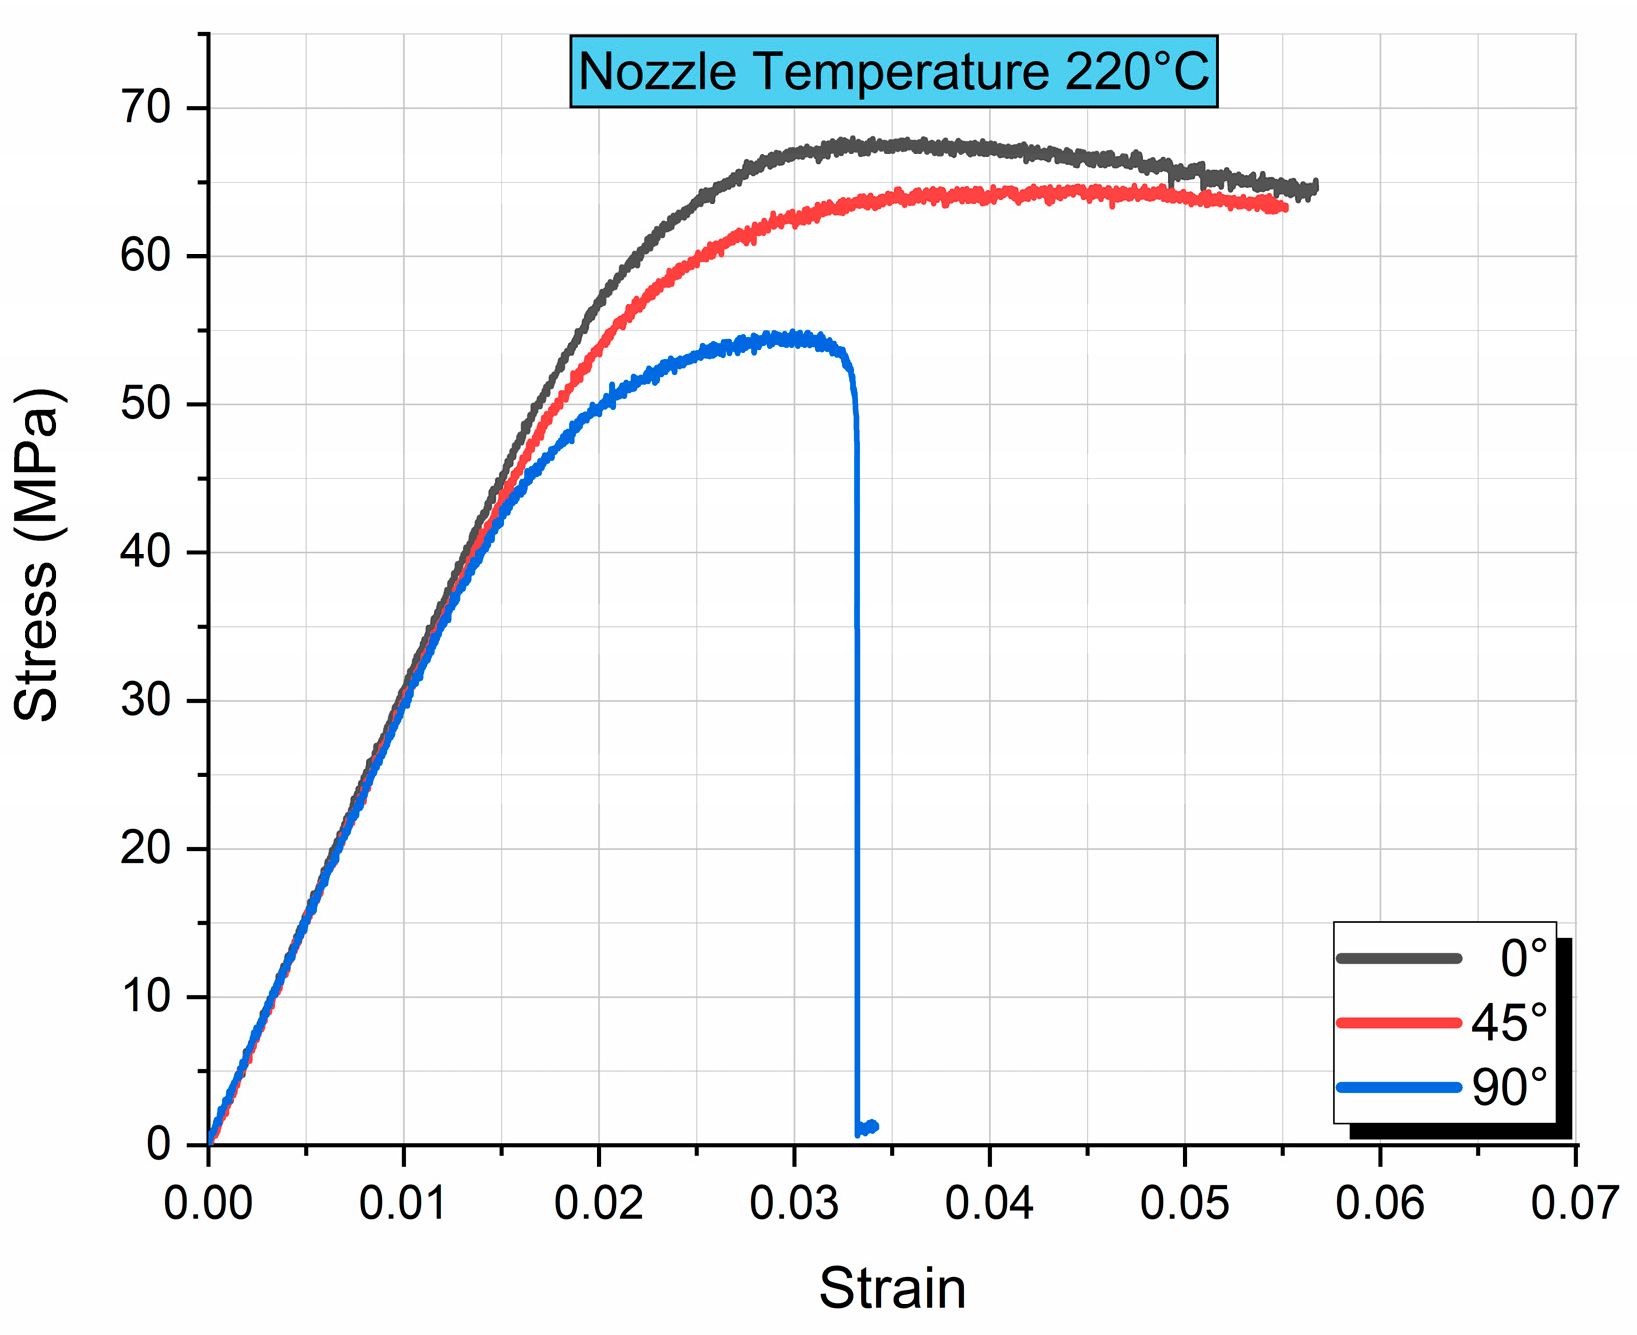
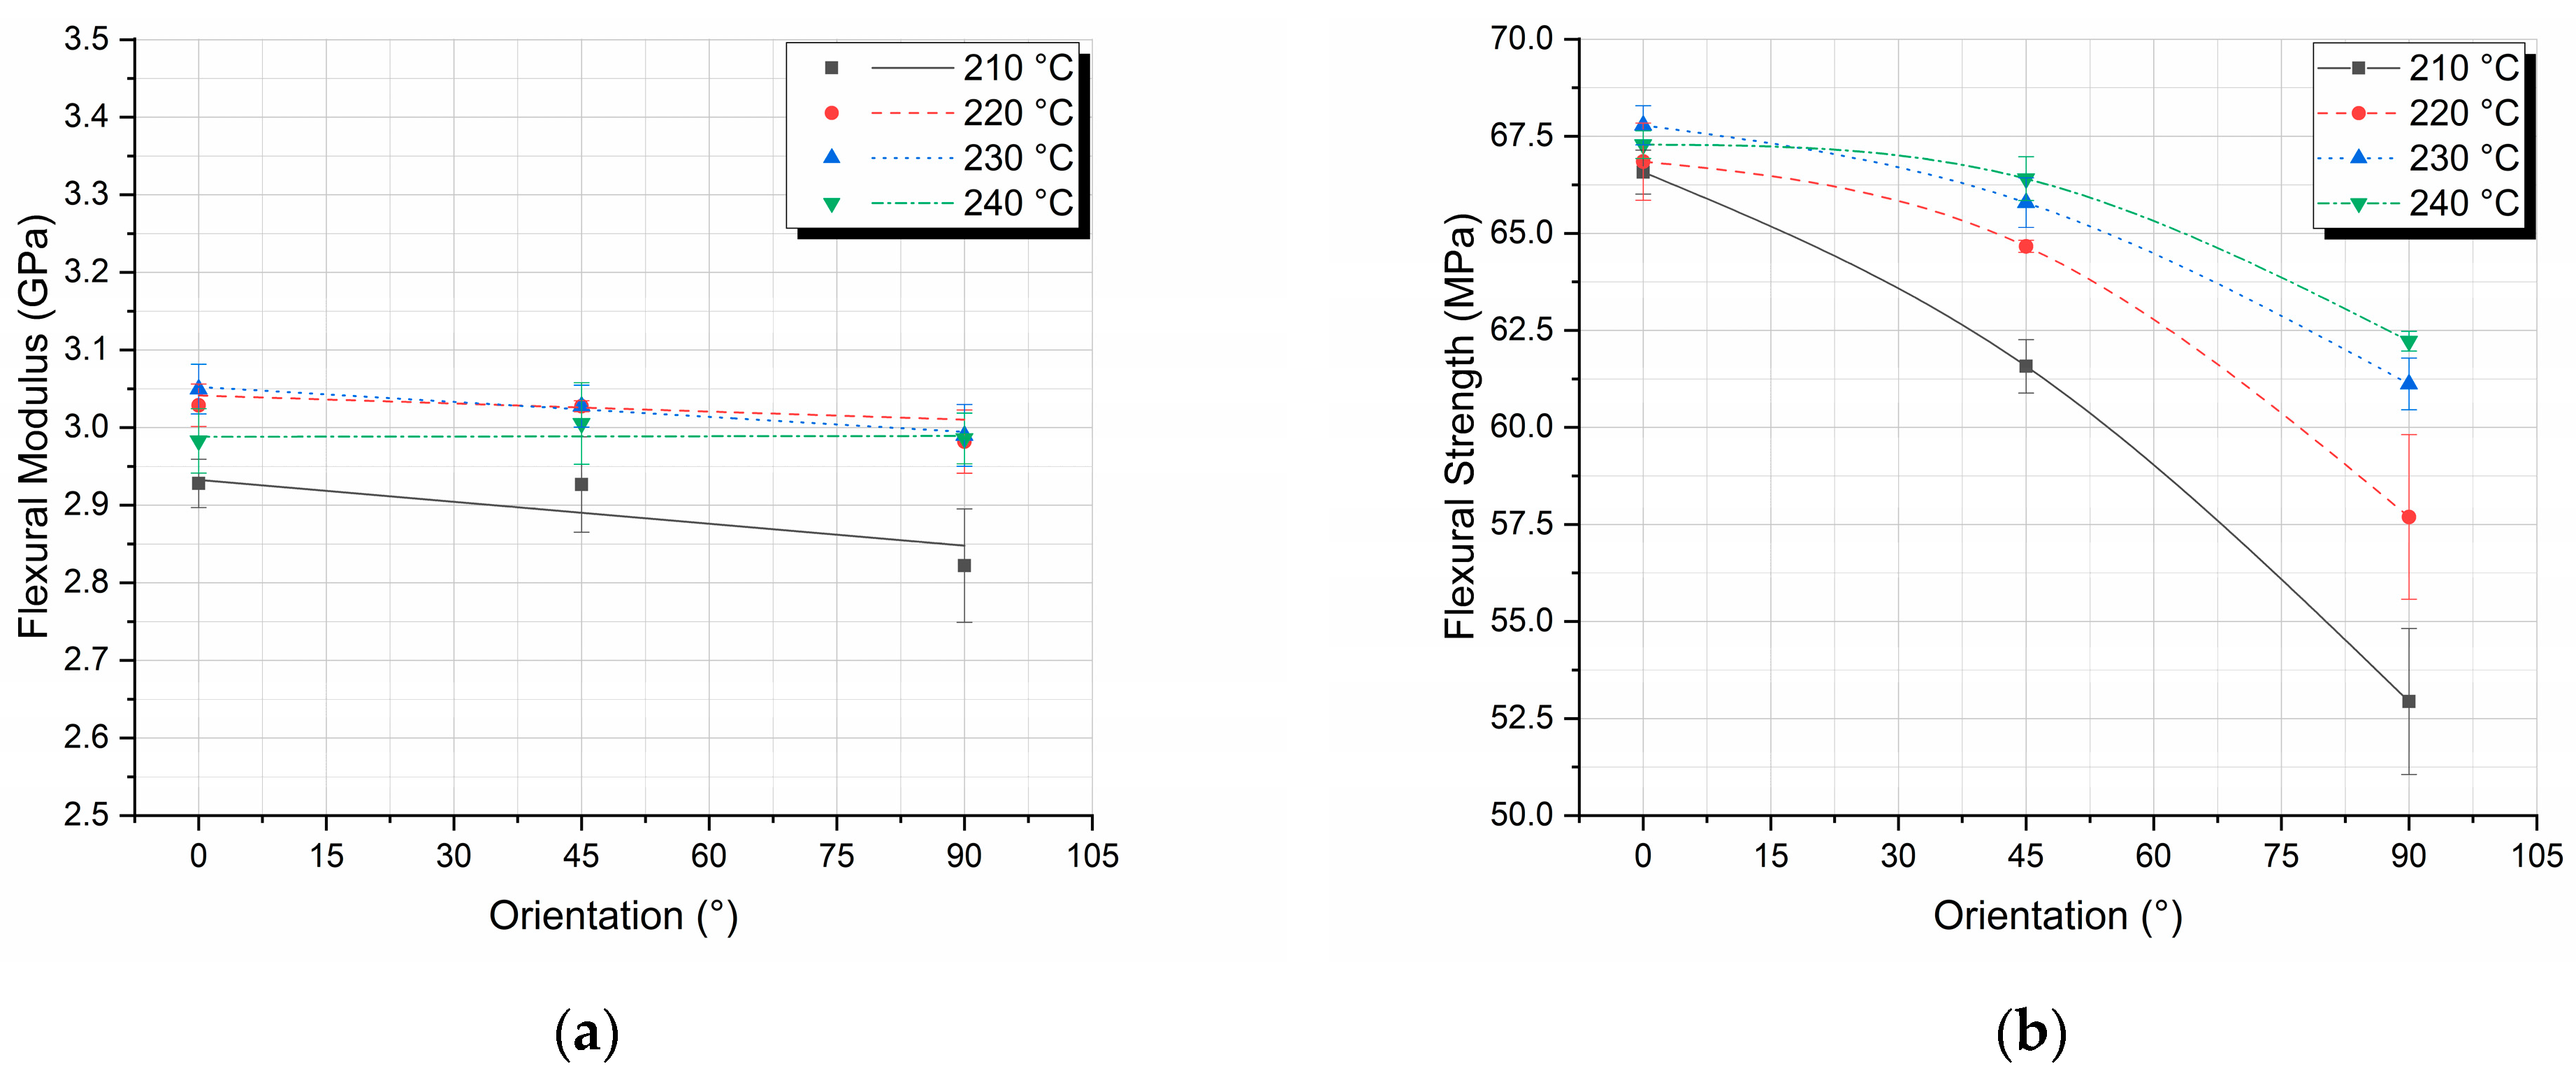
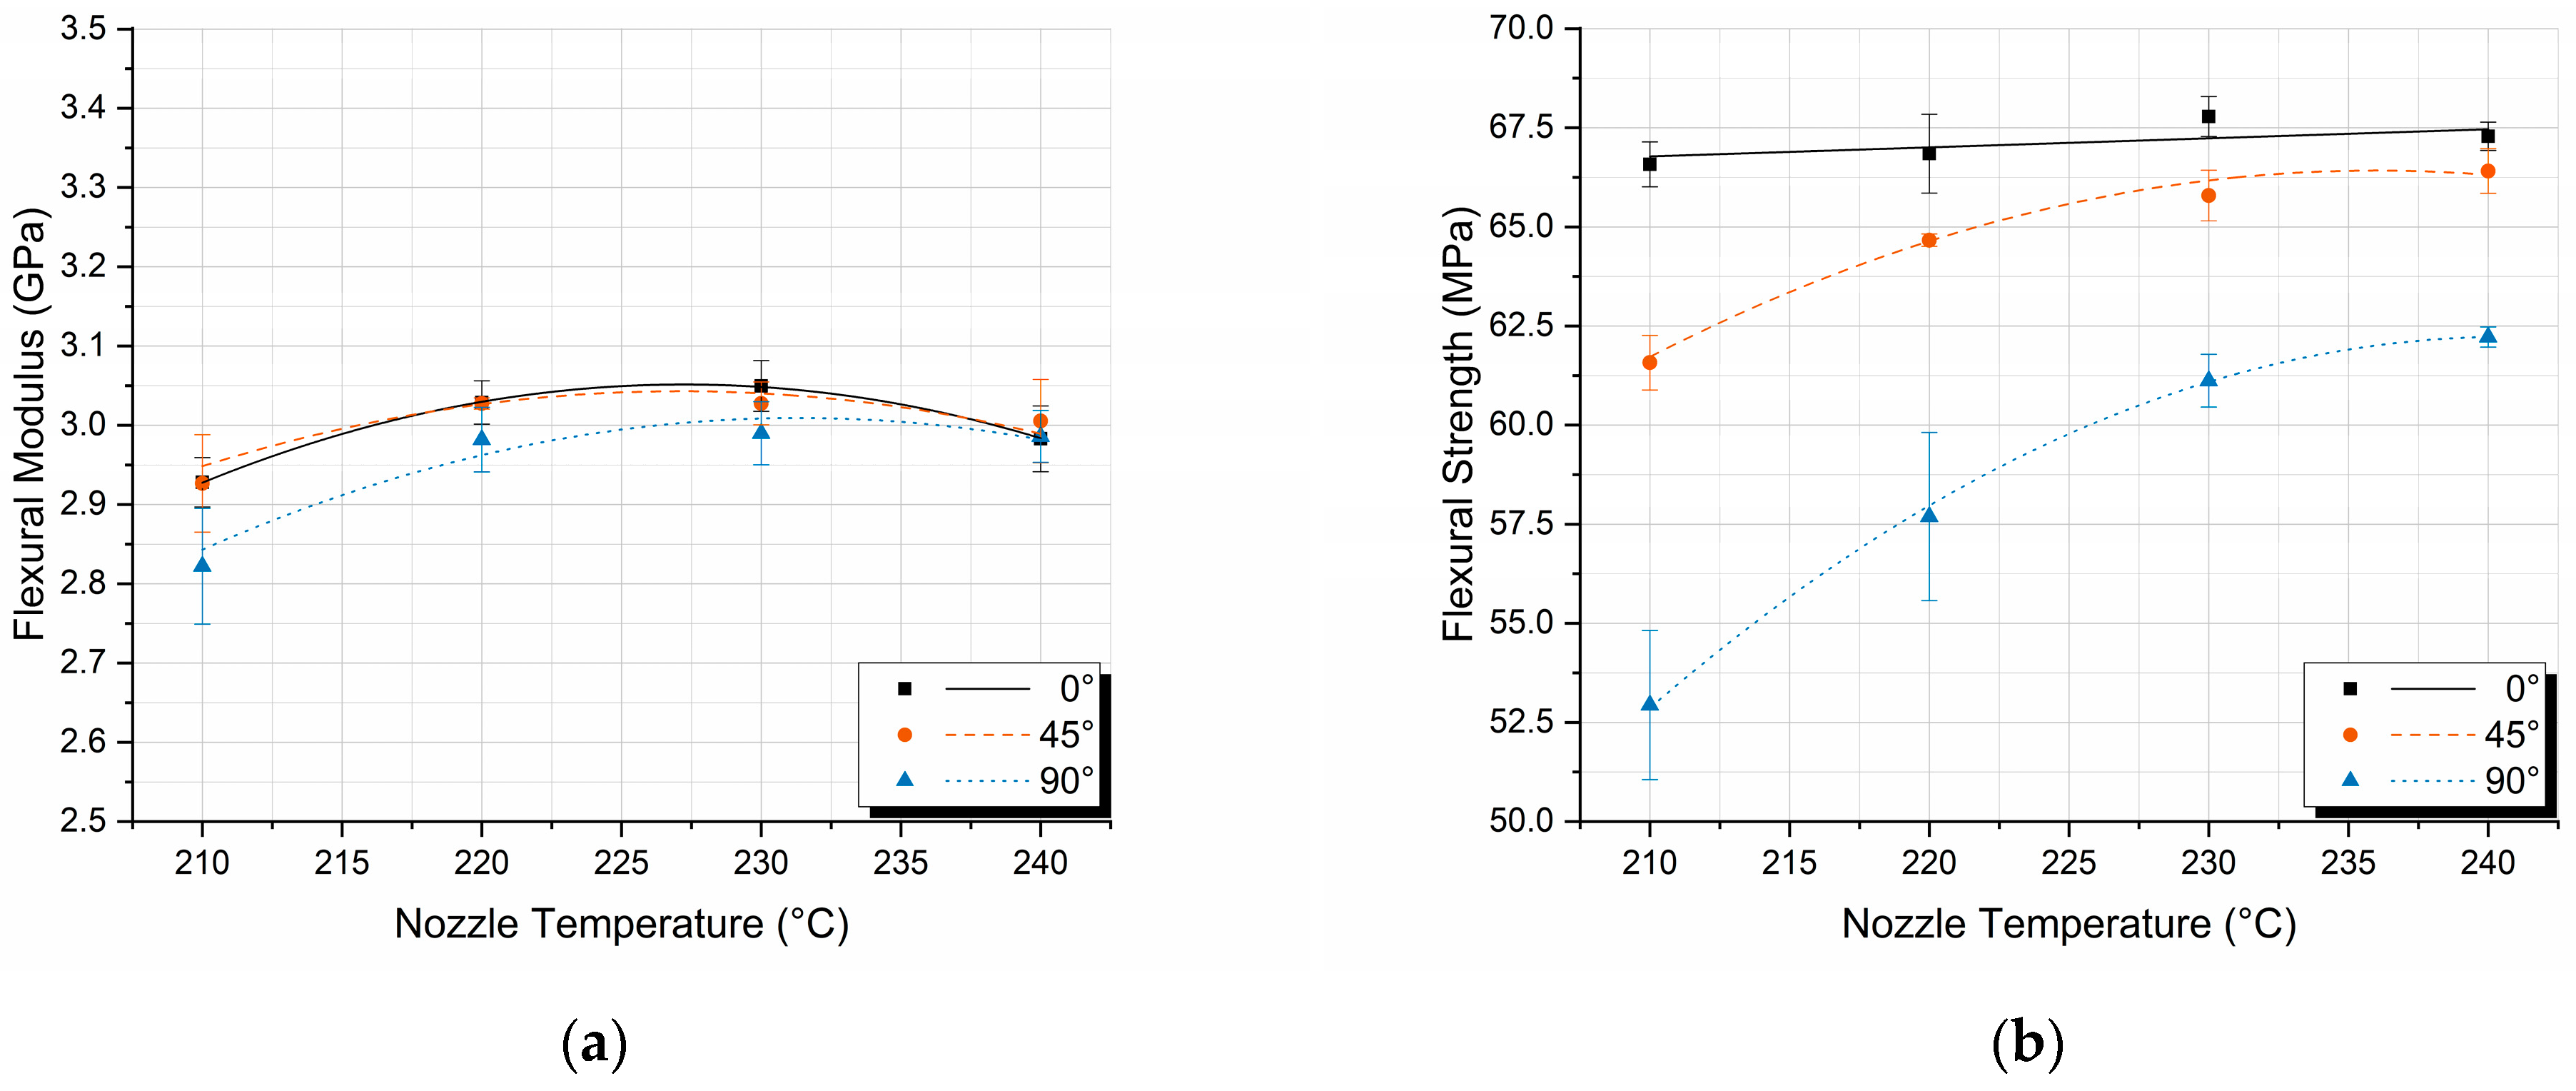
3.2. Quasi-Static Flexural Properties
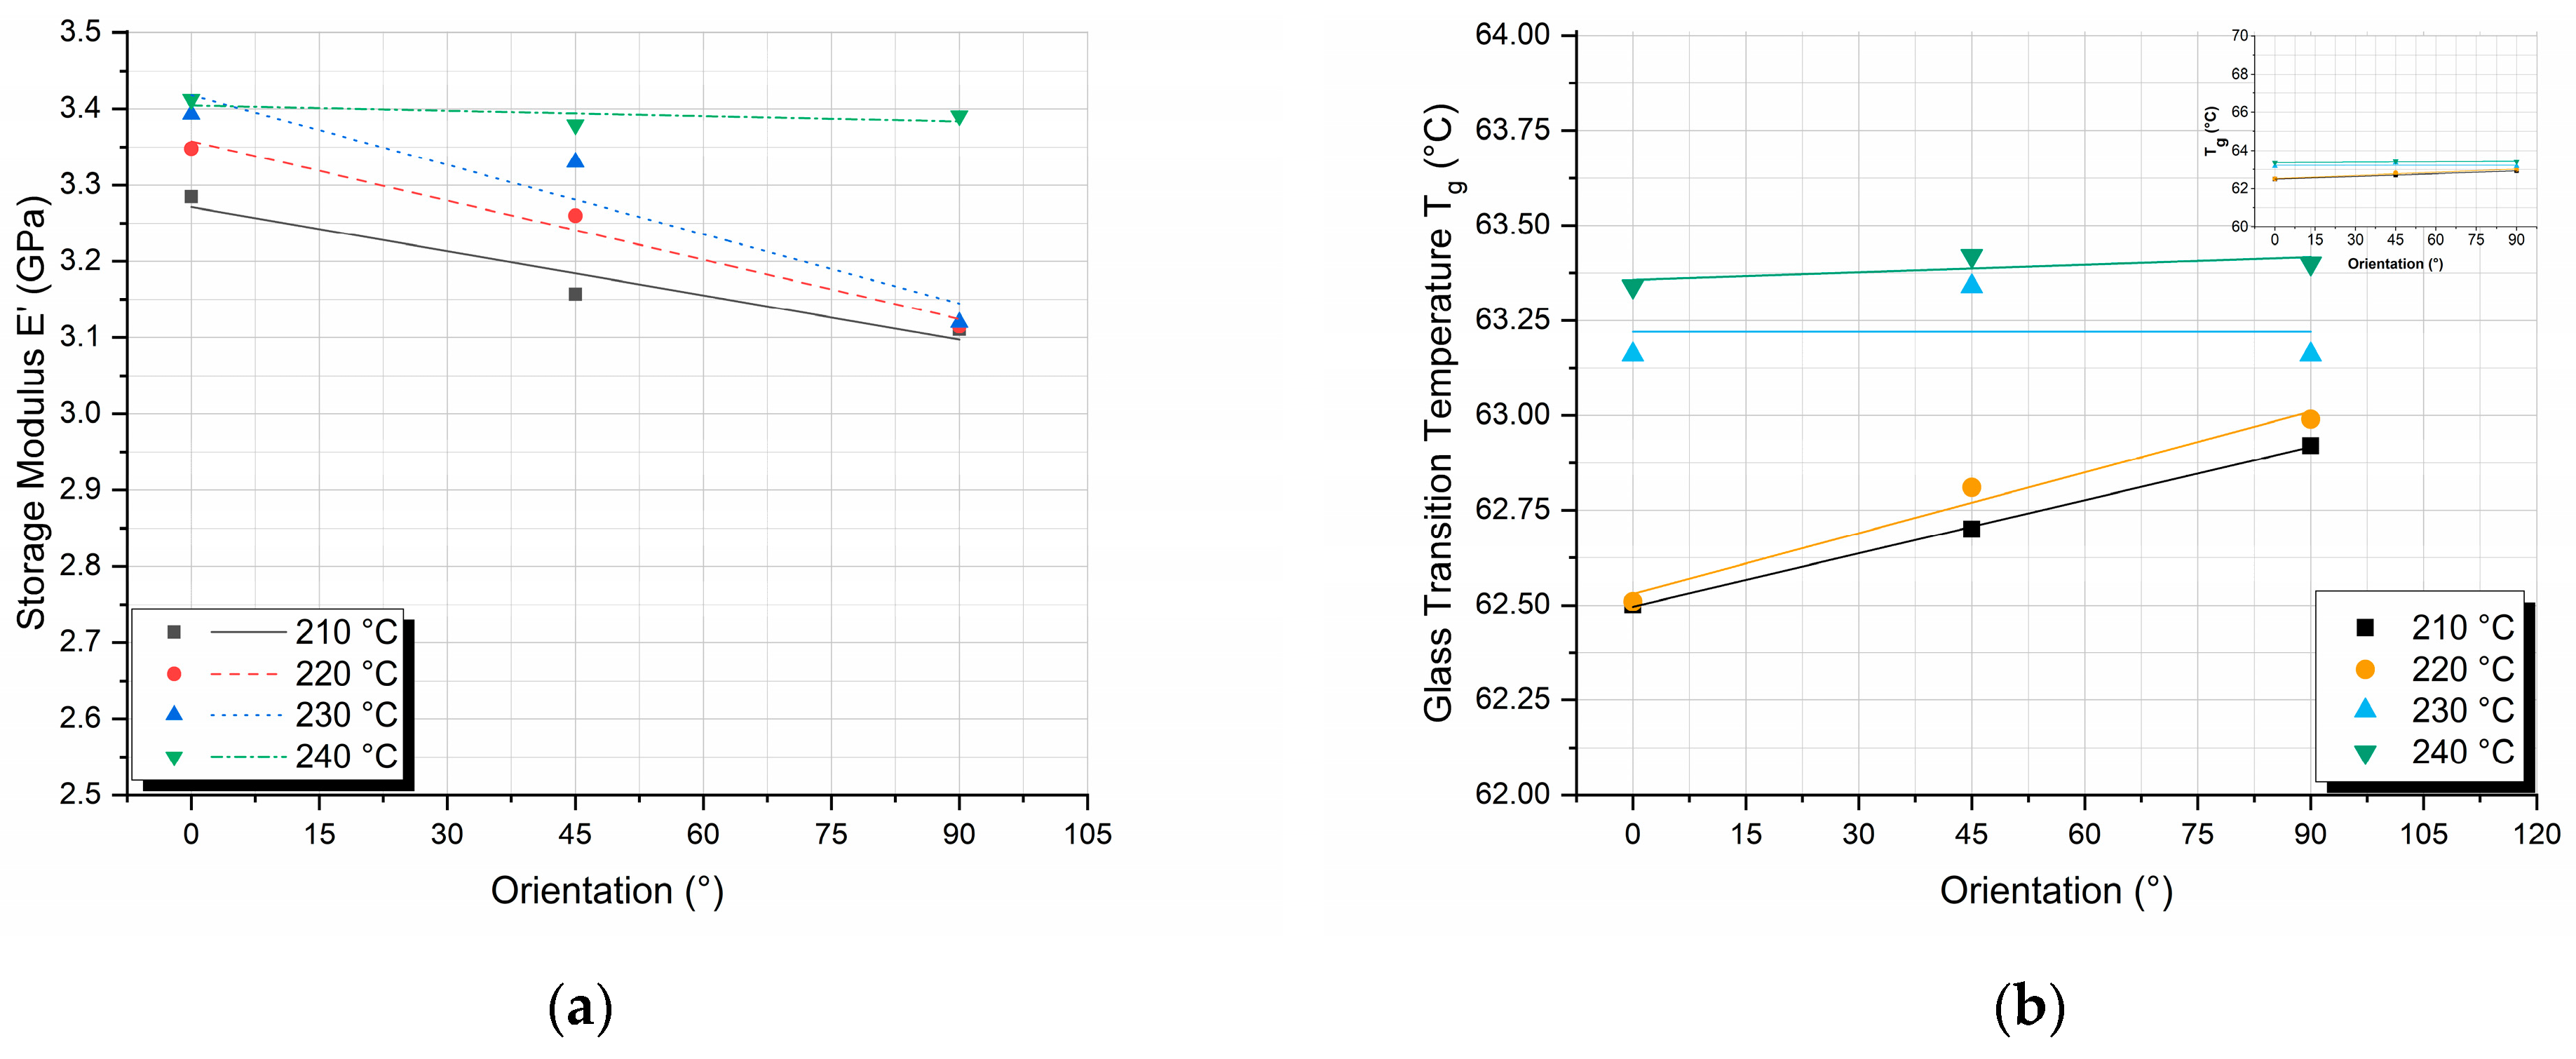
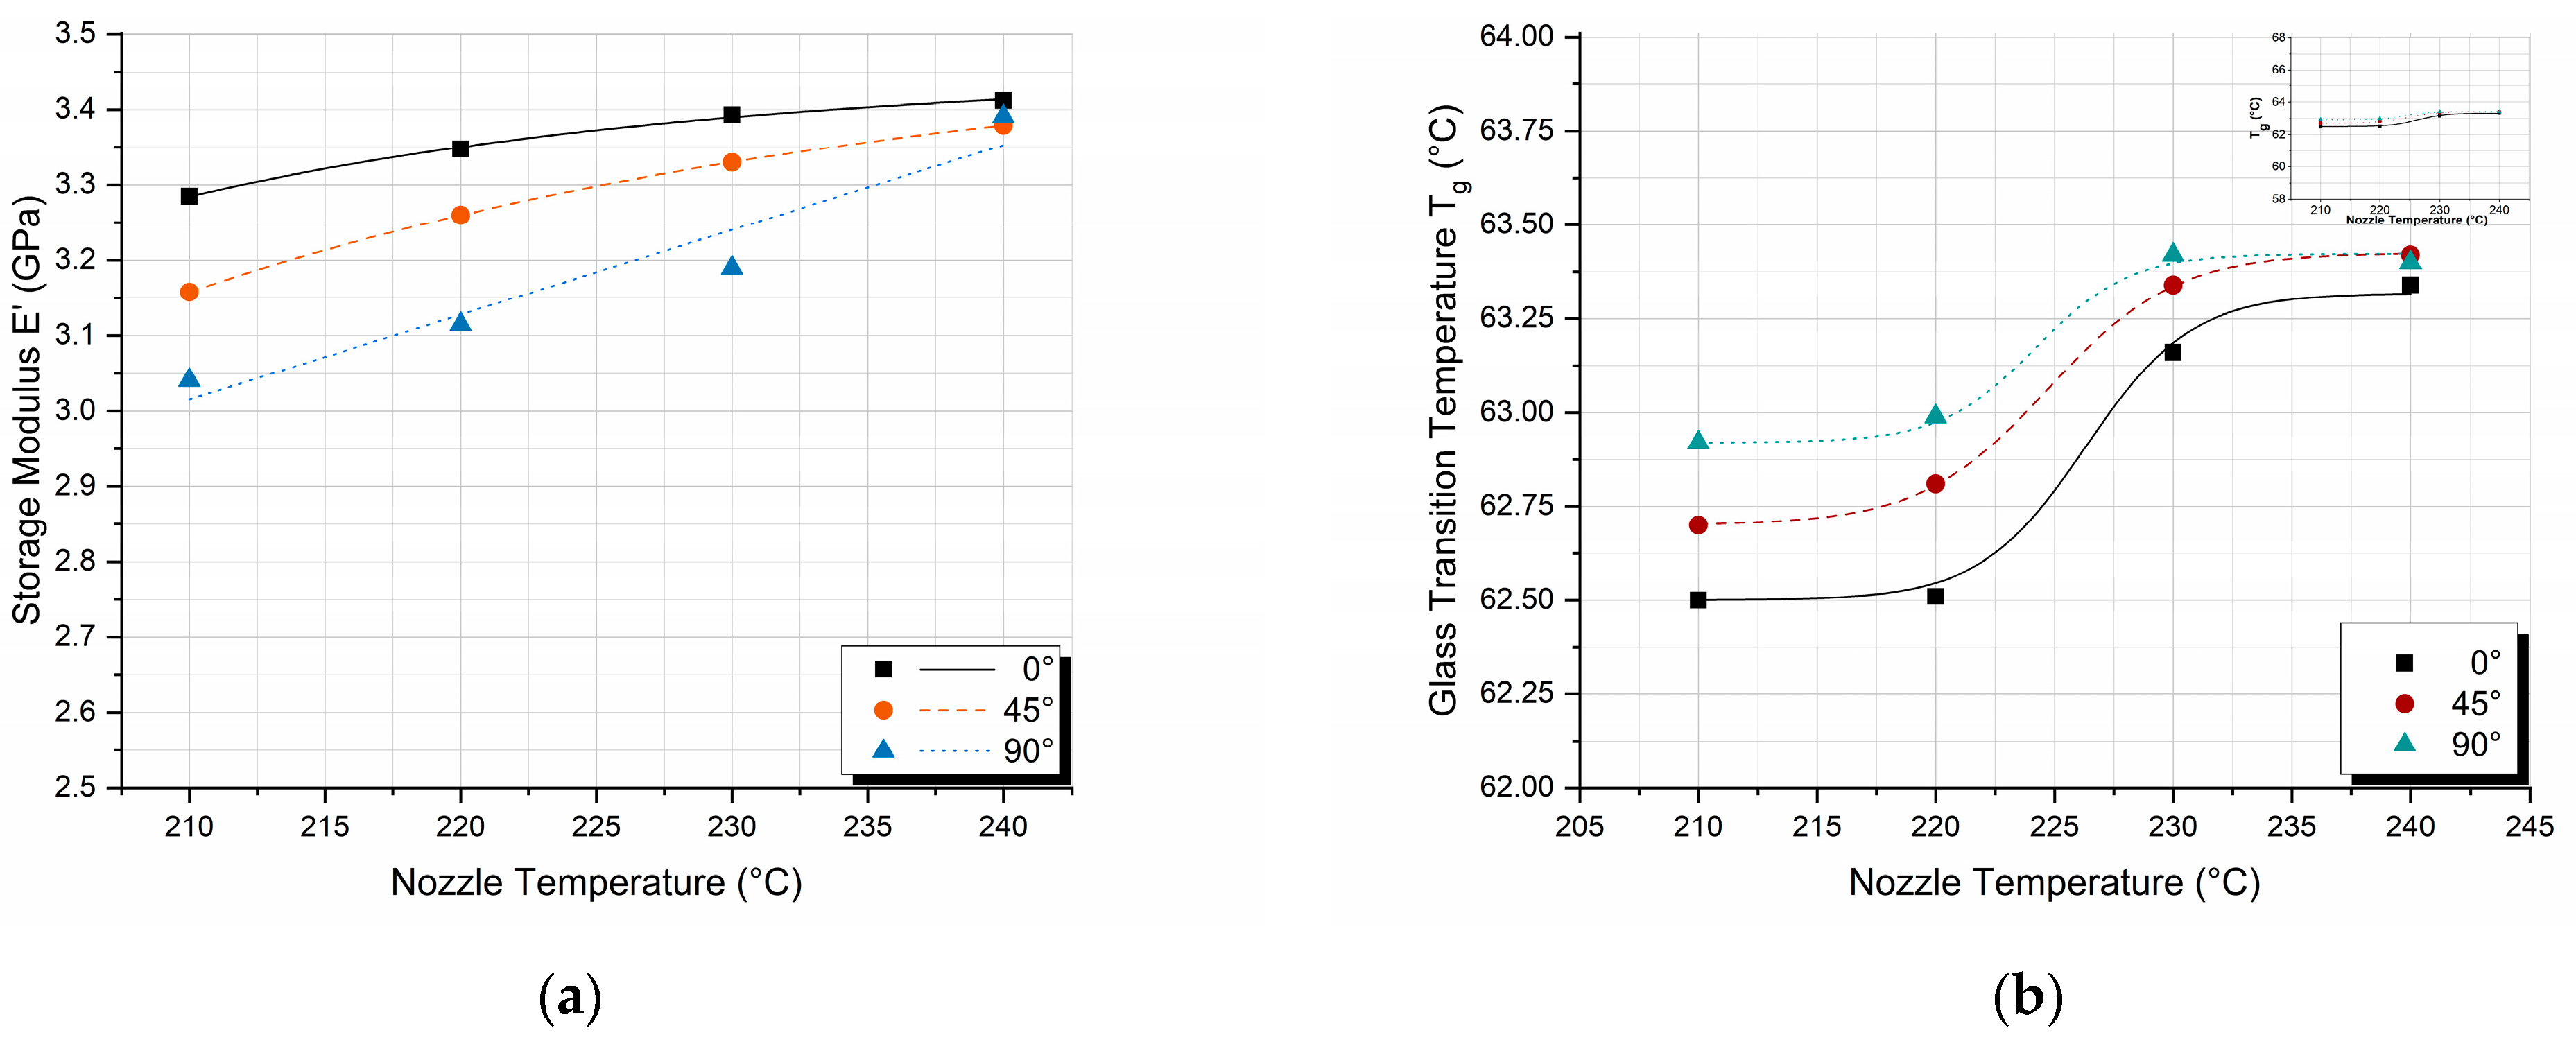
3.3. DMA Results
4. Conclusions
- From DSC results it is concluded that for a fixed plate temperature and printing speed, higher nozzle temperatures lead to slower cooling, enhancing the degree of crystallinity.
- The nozzle temperature of 210 °C results in the lowest flexural moduli for all printing orientations. However, upon reaching the recommended nozzle temperature of 220 °C, the modulus remains almost constant for all the individual printing orientations.
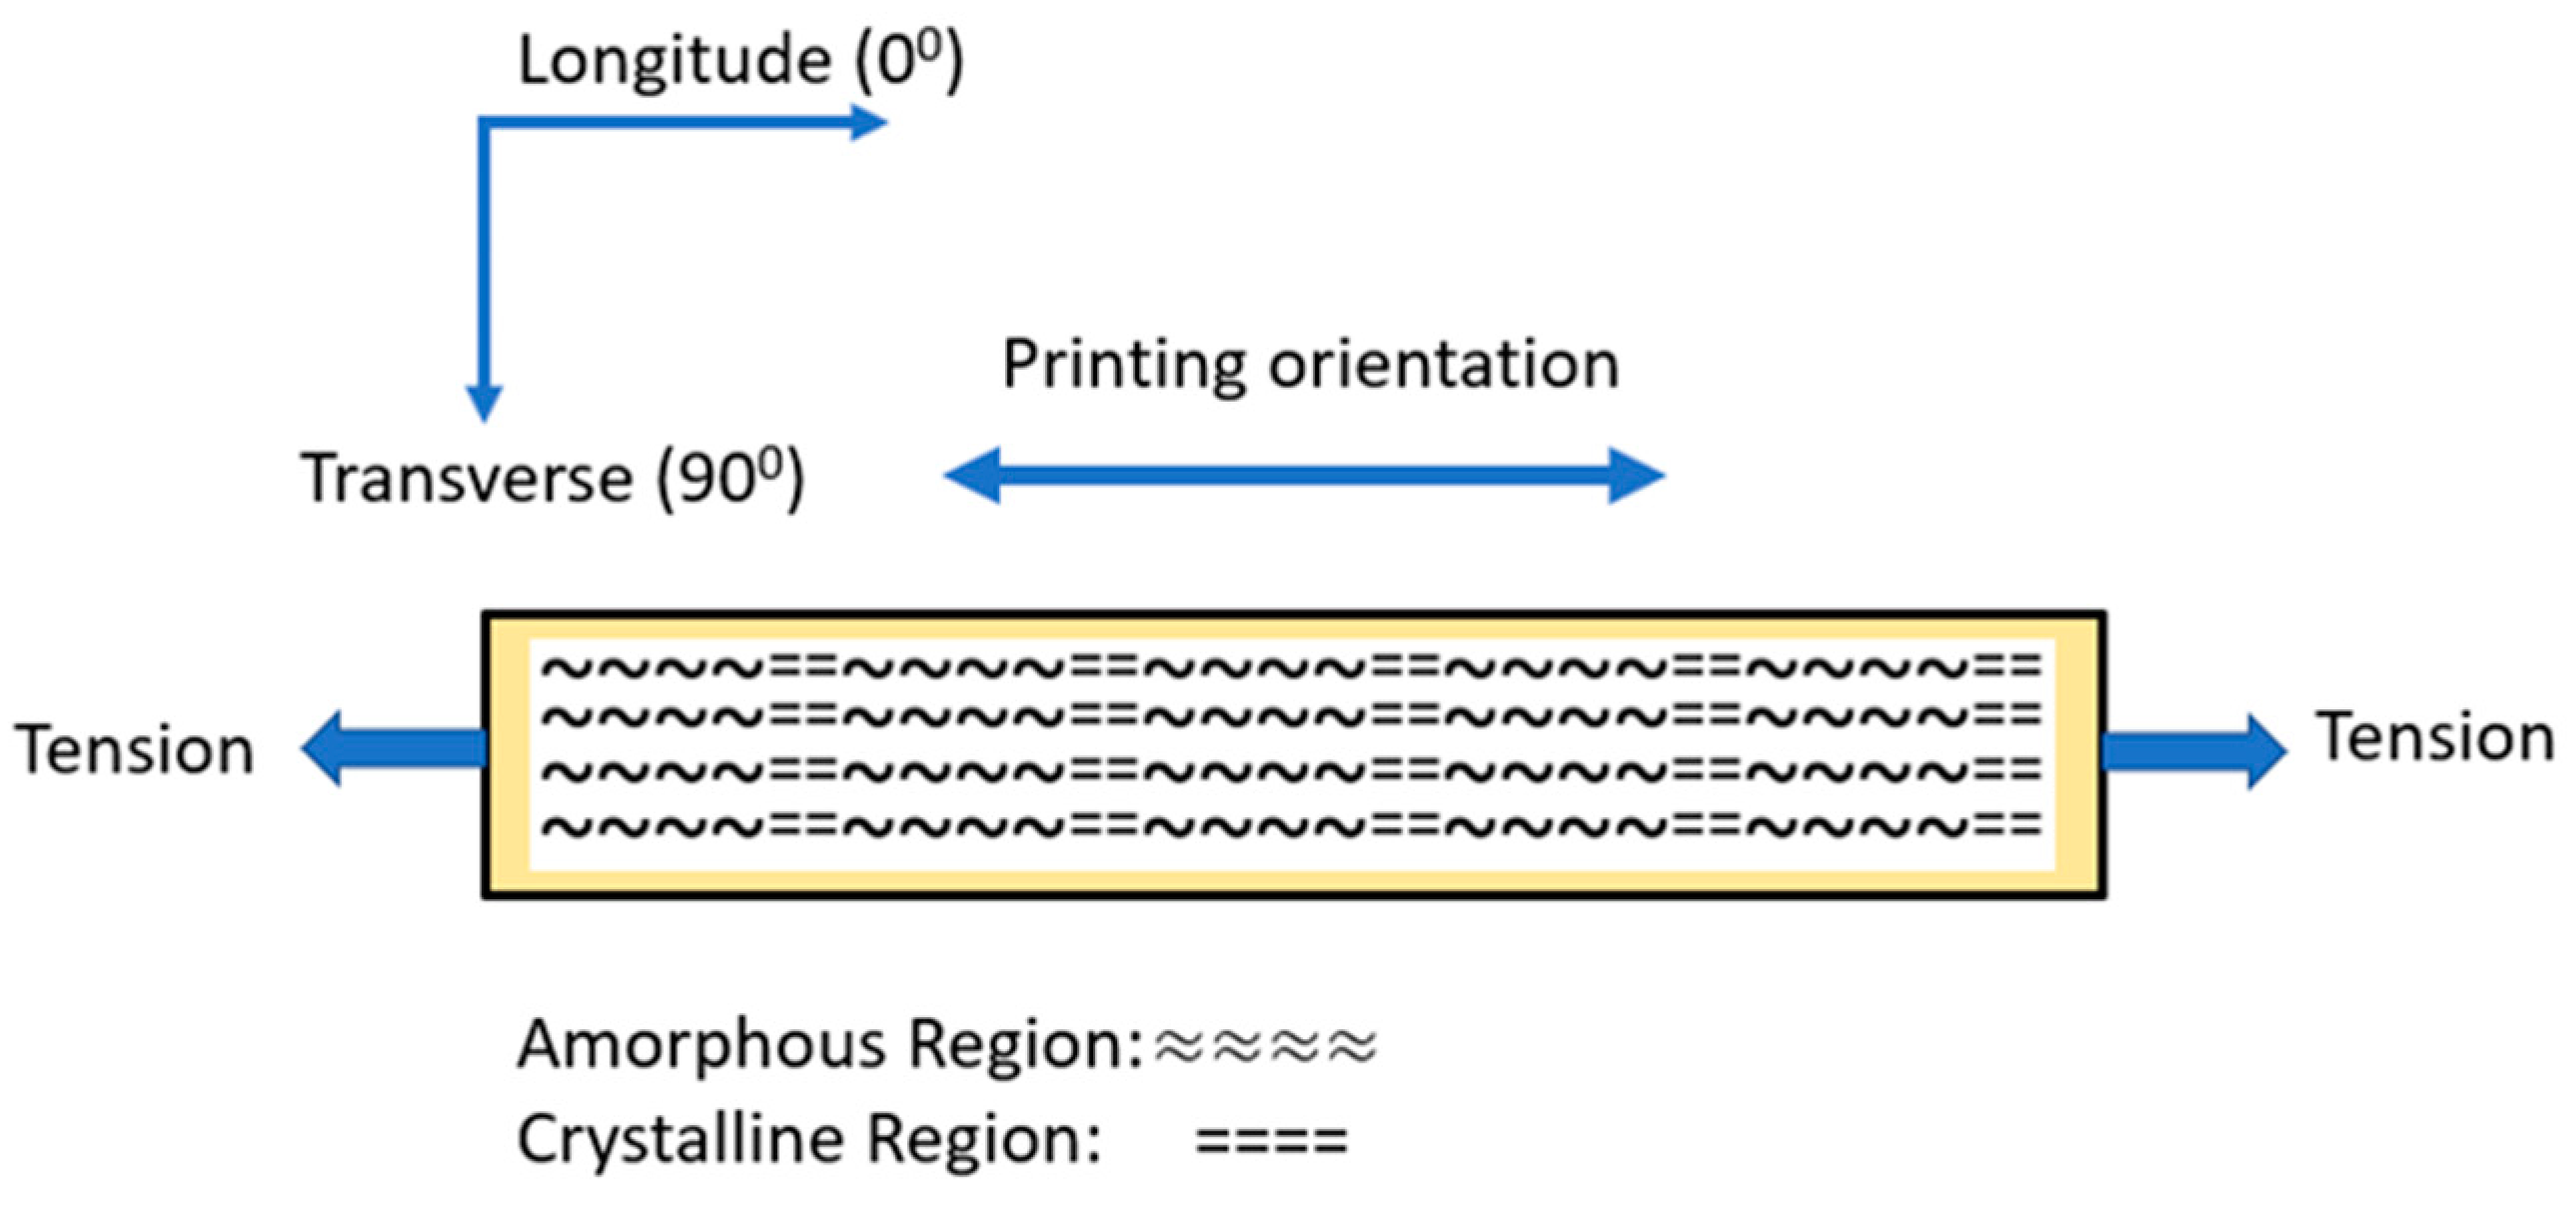
- Concerning the flexural strength, as the printing orientation degrees increase, the flexural strength decreases in all cases of nozzle temperatures. For the off-axis orientations, the higher the nozzle temperature, the higher the flexural strength, and the smaller the strength deviations per specimen, while for 0° orientation, the flexural strength remains constant with nozzle temperature.
- It was observed that as the printing orientation is increased, Tg values increase while storage modulus values decrease; at the same time, in both cases, by increasing nozzle temperature, an increase in Tg and a respective increase in storage modulus values is observed due to the increase in the degree of crystallinity.
Author Contributions
Funding
Data Availability Statement
Conflicts of Interest
Abbreviations
| FDM | Fused deposition modeling |
| PLA | Polylactic acid |
| DSC | Differential scanning calorimetry |
| DMA | Dynamic mechanical analysis |
| Tg | Glass transition temperature |
| E′ | Storage modulus |
References
- Makki, T.; Vattathurvalappil, S.H.; Theravalappil, R.; Nazir, A.; Alhajeri, A.; Azeem, M.A.; Mahdi, E.; Ummer, A.C.; Ali, U. 3D and 4D Printing: A Review of Virgin Polymers Used in Fused Deposition Modeling. Compos. Part C Open Access 2024, 14, 100472. [Google Scholar] [CrossRef]
- Mim, S.; Jamal, M.; Dey, T.K.; Sillanpää, M. Microbioplastics Sources, Mobility, Impact, and Management: A Review. Envrion. Chem. Lett. 2025, 23, 579–609. [Google Scholar] [CrossRef]
- Zhao, X.; Chen, T.; Liu, J.; Wang, X.; Weng, Y. Development of Antifouling Antibacterial Polylactic Acid (PLA)-Based Packaging and Application for Chicken Meat Preservation. Food Chem. 2025, 463, 141116. [Google Scholar] [CrossRef] [PubMed]
- Portan, D.V.; Deligianni, D.D.; Papanicolaou, G.C.; Kostopoulos, V.; Psarras, G.C.; Tyllianakis, M. Combined Optimized Effect of a Highly Self-Organized Nanosubstrate and an Electric Field on Osteoblast Bone Cells Activity. Biomed. Res. Int. 2019, 2019, 7574635. [Google Scholar] [CrossRef]
- Portan, D.; Papaefthymiou, K.; Pirvu, C.; Papanicolaou, G.; Demetrescu, I. Manufacturing and characterization of TIO2 nanotubes on pure titanium surfaces for advanced biomedical applications. Bull. Ser. B 2011, 73, 181–196. [Google Scholar]
- Portan, D.V.; Papanicolaou, G.C.; Jiga, G.; Caposi, M. A Novel Experimental Method for Obtaining Multi-Layered TiO2 Nanotubes through Electrochemical Anodizing. J. Appl. Electrochem. 2012, 42, 1013–1024. [Google Scholar] [CrossRef]
- Portan, D.V.; Deligianni, D.D.; Deligianni, K.; Kroustalli, A.A.; Tyllianakis, M.; Papanicolaou, G.C. Modeling of the Interaction between Osteoblasts and Biocompatible Substrates as a Function of Adhesion Strength. J. Biomed. Mater. Res. A 2018, 106, 621–628. [Google Scholar] [CrossRef] [PubMed]
- Cadete, M.S.; Gomes, T.E.P.; Gonçalves, I.; Neto, V. Influence of 3D-Printing Deposition Parameters on Crystallinity and Morphing Properties of PLA-Based Materials. Prog. Addit. Manuf. 2024, 10, 127–137. [Google Scholar] [CrossRef]
- Lanzotti, A.; Grasso, M.; Staiano, G.; Martorelli, M. The Impact of Process Parameters on Mechanical Properties of Parts Fabricated in PLA with an Open-Source 3-D Printer. Rapid Prototyp. J. 2015, 21, 604–617. [Google Scholar] [CrossRef]
- Portan, D.V.; Ntoulias, C.; Mantzouranis, G.; Fortis, A.P.; Deligianni, D.D.; Polyzos, D.; Kostopoulos, V. Gradient 3D Printed PLA Scaffolds on Biomedical Titanium: Mechanical Evaluation and Biocompatibility. Polymers 2021, 13, 682. [Google Scholar] [CrossRef]
- Kozaniti, F.K.; Deligianni, D.D.; Georgiou, M.D.; Portan, D.V. The Role of Substrate Topography and Stiffness on MSC Cells Functions: Key Material Properties for Biomimetic Bone Tissue Engineering. Biomimetics 2021, 7, 7. [Google Scholar] [CrossRef] [PubMed]
- Kozaniti, F.K.; Manara, A.E.; Kostopoulos, V.; Mallis, P.; Michalopoulos, E.; Polyzos, D.; Deligianni, D.D.; Portan, D.V. Computational and Experimental Investigation of the Combined Effect of Various 3D Scaffolds and Bioreactor Stimulation on Human Cells’ Feedback. Appl. Biosci. 2023, 2, 249–277. [Google Scholar] [CrossRef]
- Portan, D.V.; Bampounis, G.; Koliadima, A.; Patsidis, A.C.; Kontaxis, L.C.; Papanicolaou, G.C. Biodegradation and Thermomechanical Behavior of 3D-Printed PLA Scaffolds Under Static and Stirring Biomimetic Conditions. Biomimetics 2024, 9, 743. [Google Scholar] [CrossRef]
- Kallivokas, S.V.; Kontaxis, L.C.; Psarras, S.; Roumpi, M.; Ntousi, O.; Kakkos, I.; Deligianni, D.; Matsopoulos, G.K.; Fotiadis, D.I.; Kostopoulos, V. A Combined Computational and Experimental Analysis of PLA and PCL Hybrid Nanocomposites 3D Printed Scaffolds for Bone Regeneration. Biomedicines 2024, 12, 261. [Google Scholar] [CrossRef] [PubMed]
- Glaskova-Kuzmina, T.; Dejus, D.; Jātnieks, J.; Aniskevich, A.; Sevcenko, J.; Sarakovskis, A.; Zolotarjovs, A. Effect of Post-Printing Cooling Conditions on the Properties of ULTEM Printed Parts. Polymers 2023, 15, 324. [Google Scholar] [CrossRef]
- Glaskova-Kuzmina, T.; Dejus, D.; Jātnieks, J.; Vīndedze, E.; Bute, I.; Sevcenko, J.; Aniskevich, A.; Stankevich, S.; Boobani, B. The Tensile, Thermal and Flame-Retardant Properties of Polyetherimide and Polyetherketoneketone Processed via Fused Filament Fabrication. Polymers 2024, 16, 336. [Google Scholar] [CrossRef]
- Vīndedze, E.; Glaskova-Kuzmina, T.; Dejus, D.; Jātnieks, J.; Sevcik, S.; Bute, I.; Sevcenko, J.; Stankevich, S.; Gaidukovs, S. Effects of Printing Orientation on the Tensile, Thermophysical, Smoke Density, and Toxicity Properties of Ultem® 9085. Polymers 2025, 17, 145. [Google Scholar] [CrossRef]
- Naveed, N.; Anwar, M.N. Optimising 3D Printing Parameters through Experimental Techniques and ANOVA-Based Statistical Analysis. SPE Polym. 2024, 5, 228–240. [Google Scholar] [CrossRef]
- Afrose, M.F.; Masood, S.H.; Iovenitti, P.; Nikzad, M.; Sbarski, I. Effects of Part Build Orientations on Fatigue Behaviour of FDM-Processed PLA Material. Prog. Addit. Manuf. 2016, 1, 21–28. [Google Scholar] [CrossRef]
- Syaefudin, E.A.; Kholil, A.; Hakim, M.; Wulandari, D.A.; Riyadi; Murtinugraha, E. The Effect of Orientation on Tensile Strength 3D Printing with ABS and PLA Materials. J. Phys. Conf. Ser. 2023, 2596, 012002. [Google Scholar] [CrossRef]
- Vesely, P. Nozzle Temperature Effect on 3D Printed Structure Properties. In Proceedings of the Zborník Príspevkov z Medzinárodnej Konferencie ELEKTROTECHNOLÓGIA, Zuberec, Slovakia, 21–23 May 2019. [Google Scholar]
- Coppola, B.; Cappetti, N.; Maio, L.D.; Scarfato, P.; Incarnato, L. 3D Printing of PLA/Clay Nanocomposites: Influence of Printing Temperature on Printed Samples Properties. Materials 2018, 11, 1947. [Google Scholar] [CrossRef]
- Ansari, A.A.; Kamil, M. Effect of Print Speed and Extrusion Temperature on Properties of 3D Printed PLA Using Fused Deposition Modeling Process. Mater. Today Proc. 2021, 45, 5462–5468. [Google Scholar] [CrossRef]
- Alafaghani, A.; Qattawi, A.; Alrawi, B.; Guzman, A. Experimental Optimization of Fused Deposition Modelling Processing Parameters: A Design-for-Manufacturing Approach. Procedia Manuf. 2017, 10, 791–803. [Google Scholar] [CrossRef]
- Rivera-López, F.; Pavón, M.M.L.; Correa, E.C.; Molina, M.H. Effects of Nozzle Temperature on Mechanical Properties of Polylactic Acid Specimens Fabricated by Fused Deposition Modeling. Polymers 2024, 16, 1867. [Google Scholar] [CrossRef]
- de Freitas, F.; Pegado, H. Impact of Nozzle Temperature on Dimensional and Mechanical Characteristics of Low-Density PLA. Int. J. Adv. Manuf. Technol. 2023, 126, 1629–1638. [Google Scholar] [CrossRef]
- Kuznetsov, V.E.; Tavitov, A.G.; Urzhumtsev, O.D.; Mikhalin, M.V.; Moiseev, A.I. Hardware Factors Influencing Strength of Parts Obtained by Fused Filament Fabrication. Polymers 2019, 11, 1870. [Google Scholar] [CrossRef] [PubMed]
- TA Instruments; Waters Corporation. Thermal Analysis & Rheology Thermal Analysis Application Brief Determination of Polymer Crystallinity by DSC; Number TA-123; TA Instruments: New Castle, DE, USA; Waters Corporation: Rydalmere, NSW, Australia, 2023. [Google Scholar]
- Sichina, W.J. DSC as Problem Solving Tool: Measurement of Percent Crystallinity of Thermoplastics; PerkinElmer: Waltham, MA, USA, 2000. [Google Scholar]
- ASTM D790; Standard Test Methods for Flexural Properties of Unreinforced and Reinforced Plastics and Electrical Insulating Material. ASTM International: West Conshohocken, PA, USA, 2017.
- Syrlybayev, D.; Zharylkassyn, B.; Seisekulova, A.; Akhmetov, M.; Perveen, A.; Talamona, D. Optimisation of Strength Properties of FDM Printed Parts—A Critical Review. Polymers 2021, 13, 1587. [Google Scholar] [CrossRef] [PubMed]
- Vanaei, H.R.; Shirinbayan, M.; Deligant, M.; Khelladi, S.; Tcharkhtchi, A. In-Process Monitoring of Temperature Evolution during Fused Filament Fabrication: A Journey from Numerical to Experimental Approaches. Thermo 2021, 1, 332–360. [Google Scholar] [CrossRef]
- Cowie, J.M.G.; Arrighi, V. The Crystalline State and Partially Ordered Structures. In Polymers: Chemistry and Physics of Modern Materials; CRC Press: Boca Raton, FL, USA, 1991. [Google Scholar]
- Di Lorenzo, M.L.; Silvestre, C. Non-Isothermal Crystallization of Polymers. Prog. Polym. Sci. 1999, 24, 917–950. [Google Scholar] [CrossRef]
- Richardson, M.J. The Glass Transition Region. In Calorimetry and Thermal Analysis of Polymers; Mathot, V.B.F., Benoist, L., Eds.; Hanser Publishers: Munich, Germany; Vienna, Austria; New York, NY, USA, 1994; pp. 169–188. ISBN 1569901260. [Google Scholar]
- Gibbs, J.H.; DiMarzio, E.A. Nature of the Glass Transition and the Glassy State. J. Chem. Phys. 1958, 28, 373–383. [Google Scholar] [CrossRef]
- Wang, Y.T.; Yeh, Y.T. Effect of Print Angle on Mechanical Properties of FDM 3D Structures Printed with POM Material. In Innovative Design and Development Practices in Aerospace and Automotive Engineering; Lecture Notes in Mechanical Engineering; Springer: Singapore, 2017; pp. 157–167. [Google Scholar] [CrossRef]
- Jatti, V.S.; Jatti, S.V.; Patel, A.P.; Jatti, V.S. A Study on Effect of Fused Deposition Modeling Process Parameters on Mechanical Properties. Int. J. Sci. Technol. Res. 2019, 8, 689–693. [Google Scholar]
- Zhou, X.; Hsieh, S.J.; Sun, Y. Experimental and Numerical Investigation of the Thermal Behaviour of Polylactic Acid during the Fused Deposition Process. Virtual Phys. Prototyp. 2017, 12, 221–233. [Google Scholar] [CrossRef]
- Yang, C.; Tian, X.; Li, D.; Cao, Y.; Zhao, F.; Shi, C. Influence of Thermal Processing Conditions in 3D Printing on the Crystallinity and Mechanical Properties of PEEK Material. J. Mater. Process Technol. 2017, 248, 1–7. [Google Scholar] [CrossRef]
- Struik, L.C.E. The Mechanical and Physical Ageing of Semicrystalline Polymers: 1. Polymers 1987, 28, 1521–1533. [Google Scholar] [CrossRef]
- Struik, L.C.E. The Mechanical Behaviour and Physical Ageing of Semicrystalline Polymers: 2. Polymers 1987, 28, 1534–1542. [Google Scholar] [CrossRef]

| Parameter | Value |
|---|---|
| Layer Height | 0.2 mm |
| Line Width | 0.4 mm |
| Wall loops | 1 |
| Infill Pattern | Aligned Rectilinear |
| Infill Density | 100% |
| Top/Bottom Layers | 0 |
| Recommended nozzle temperature | 220 °C |
| Nozzle Temperature (°C) | Tg (°C) | Tm (°C) | ΔHcc (J/g) | ΔHm (J/g) | Degree of Crystallinity (%) |
|---|---|---|---|---|---|
| 210 | 56.93 | 156.86 | 27.19 | 34.15 | 7.48 |
| 220 | 55.30 | 156.09 | 23.03 | 35.42 | 13.32 |
| 230 | 56.89 | 156.37 | 23.11 | 37.82 | 15.82 |
| 240 | 56.22 | 156.56 | 23.93 | 40.10 | 17.39 |
| Nozzle Temperature (°C) | Orientation | Flexural Modulus (GPa) | Coefficients of Variation (%) | Flexural Strength (MPa) | Coefficients of Variation (%) |
|---|---|---|---|---|---|
| 210 | 0° | 2.92 | 1.0 | 66.58 | 0.85 |
| 45° | 2.93 | 2.10 | 61.57 | 1.12 | |
| 90° | 2.82 | 2.59 | 52.94 | 3.55 | |
| 220 | 0° | 3.03 | 0.90 | 66.85 | 1.49 |
| 45° | 3.03 | 0.24 | 64.67 | 0.24 | |
| 90° | 2.98 | 1.37 | 57.69 | 3.67 | |
| 230 | 0° | 3.05 | 1.05 | 67.78 | 0.74 |
| 45° | 3.03 | 0.89 | 65.79 | 0.97 | |
| 90° | 2.99 | 1.33 | 61.12 | 1.09 | |
| 240 | 0° | 2.98 | 1.39 | 67.29 | 0.53 |
| 45° | 3.01 | 1.75 | 66.41 | 0.85 | |
| 90° | 2.99 | 1.10 | 62.22 | 0.41 |
Disclaimer/Publisher’s Note: The statements, opinions and data contained in all publications are solely those of the individual author(s) and contributor(s) and not of MDPI and/or the editor(s). MDPI and/or the editor(s) disclaim responsibility for any injury to people or property resulting from any ideas, methods, instructions or products referred to in the content. |
© 2025 by the authors. Licensee MDPI, Basel, Switzerland. This article is an open access article distributed under the terms and conditions of the Creative Commons Attribution (CC BY) license (https://creativecommons.org/licenses/by/4.0/).
Share and Cite
Kontaxis, L.C.; Zachos, D.; Georgali-Fickel, A.; Portan, D.V.; Zaoutsos, S.P.; Papanicolaou, G.C. 3D-Printed PLA Mechanical and Viscoelastic Behavior Dependence on the Nozzle Temperature and Printing Orientation. Polymers 2025, 17, 913. https://doi.org/10.3390/polym17070913
Kontaxis LC, Zachos D, Georgali-Fickel A, Portan DV, Zaoutsos SP, Papanicolaou GC. 3D-Printed PLA Mechanical and Viscoelastic Behavior Dependence on the Nozzle Temperature and Printing Orientation. Polymers. 2025; 17(7):913. https://doi.org/10.3390/polym17070913
Chicago/Turabian StyleKontaxis, Lykourgos C., Dimos Zachos, Aliona Georgali-Fickel, Diana V. Portan, Stefanos P. Zaoutsos, and George C. Papanicolaou. 2025. "3D-Printed PLA Mechanical and Viscoelastic Behavior Dependence on the Nozzle Temperature and Printing Orientation" Polymers 17, no. 7: 913. https://doi.org/10.3390/polym17070913
APA StyleKontaxis, L. C., Zachos, D., Georgali-Fickel, A., Portan, D. V., Zaoutsos, S. P., & Papanicolaou, G. C. (2025). 3D-Printed PLA Mechanical and Viscoelastic Behavior Dependence on the Nozzle Temperature and Printing Orientation. Polymers, 17(7), 913. https://doi.org/10.3390/polym17070913