
Preparation and Characterization of Submicrometer and Nanometer Cellulose Fiber with Biogenic SiO2


Abstract
1. Introduction
- Cellulose nanocrystals, also known as nanocrystalline cellulose (CNC), are rigid short structures. The geometric dimensions of CNCs can vary widely in diameter from 2 nm to 20 nm and in length from 100 nm to 500 nm [12], and the degree of crystallinity in CNCs ranges from 55% to 88%. The dimensions and crystallinity of a given CNC depend on the source of cellulose and the conditions of extraction [12].
- Cellulose nanofibrils (CNF), also known as nano-fibrillated cellulose (NFC), have a long and flexible structure. CNFs consist of stretched bundles (aggregates) of elementary nanofibers [13], which are made up of alternating crystalline and amorphous regions. CNFs can have a diameter in the range of 20 nm–50 nm and a length in the range of 500 nm–2000 nm and the degree of crystallinity of CNFs ranges from 50% to 60%.
- HCNC is a new type from the group of nanocelluloses synthesized by van de Ven and his colleagues by oxidation of the so-called cellulose periodate (periodate-oxidized cellulose, HlO4). Hairy nanocelluloses consist of a crystalline rod-like body with amorphous loose chains (“hairs”) at both ends, which are more accessible than the crystalline segment for chemical reactions and which also enhance colloidal stability [13].
2. Materials and Methods
2.1. Characterization
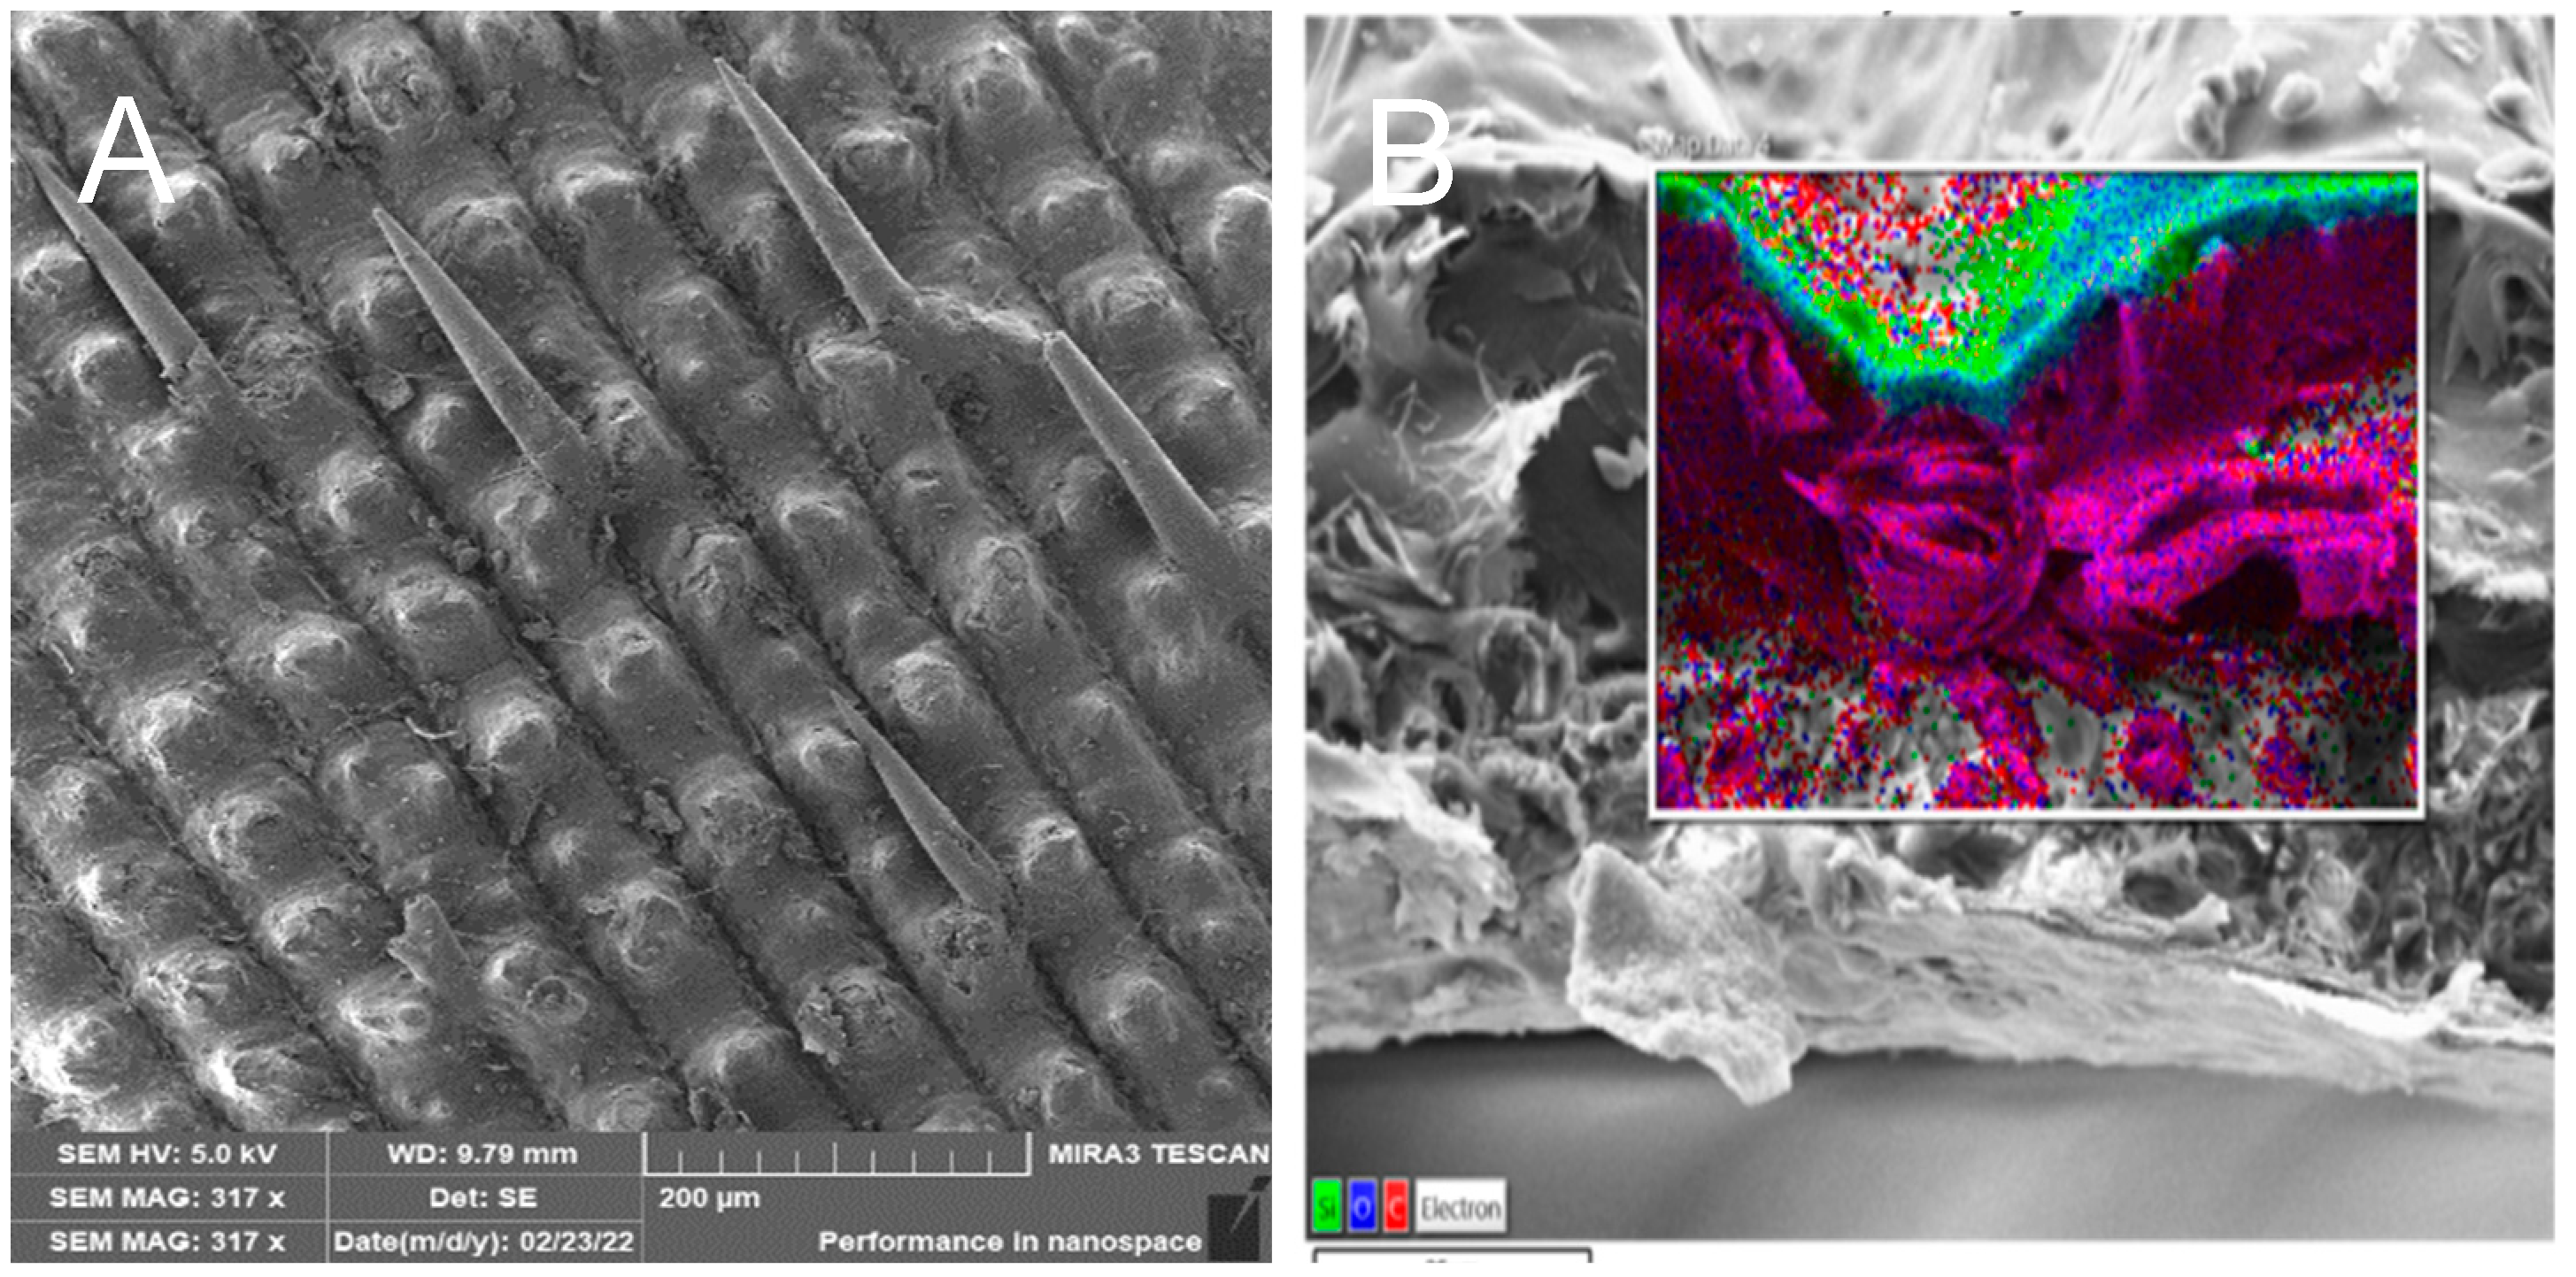
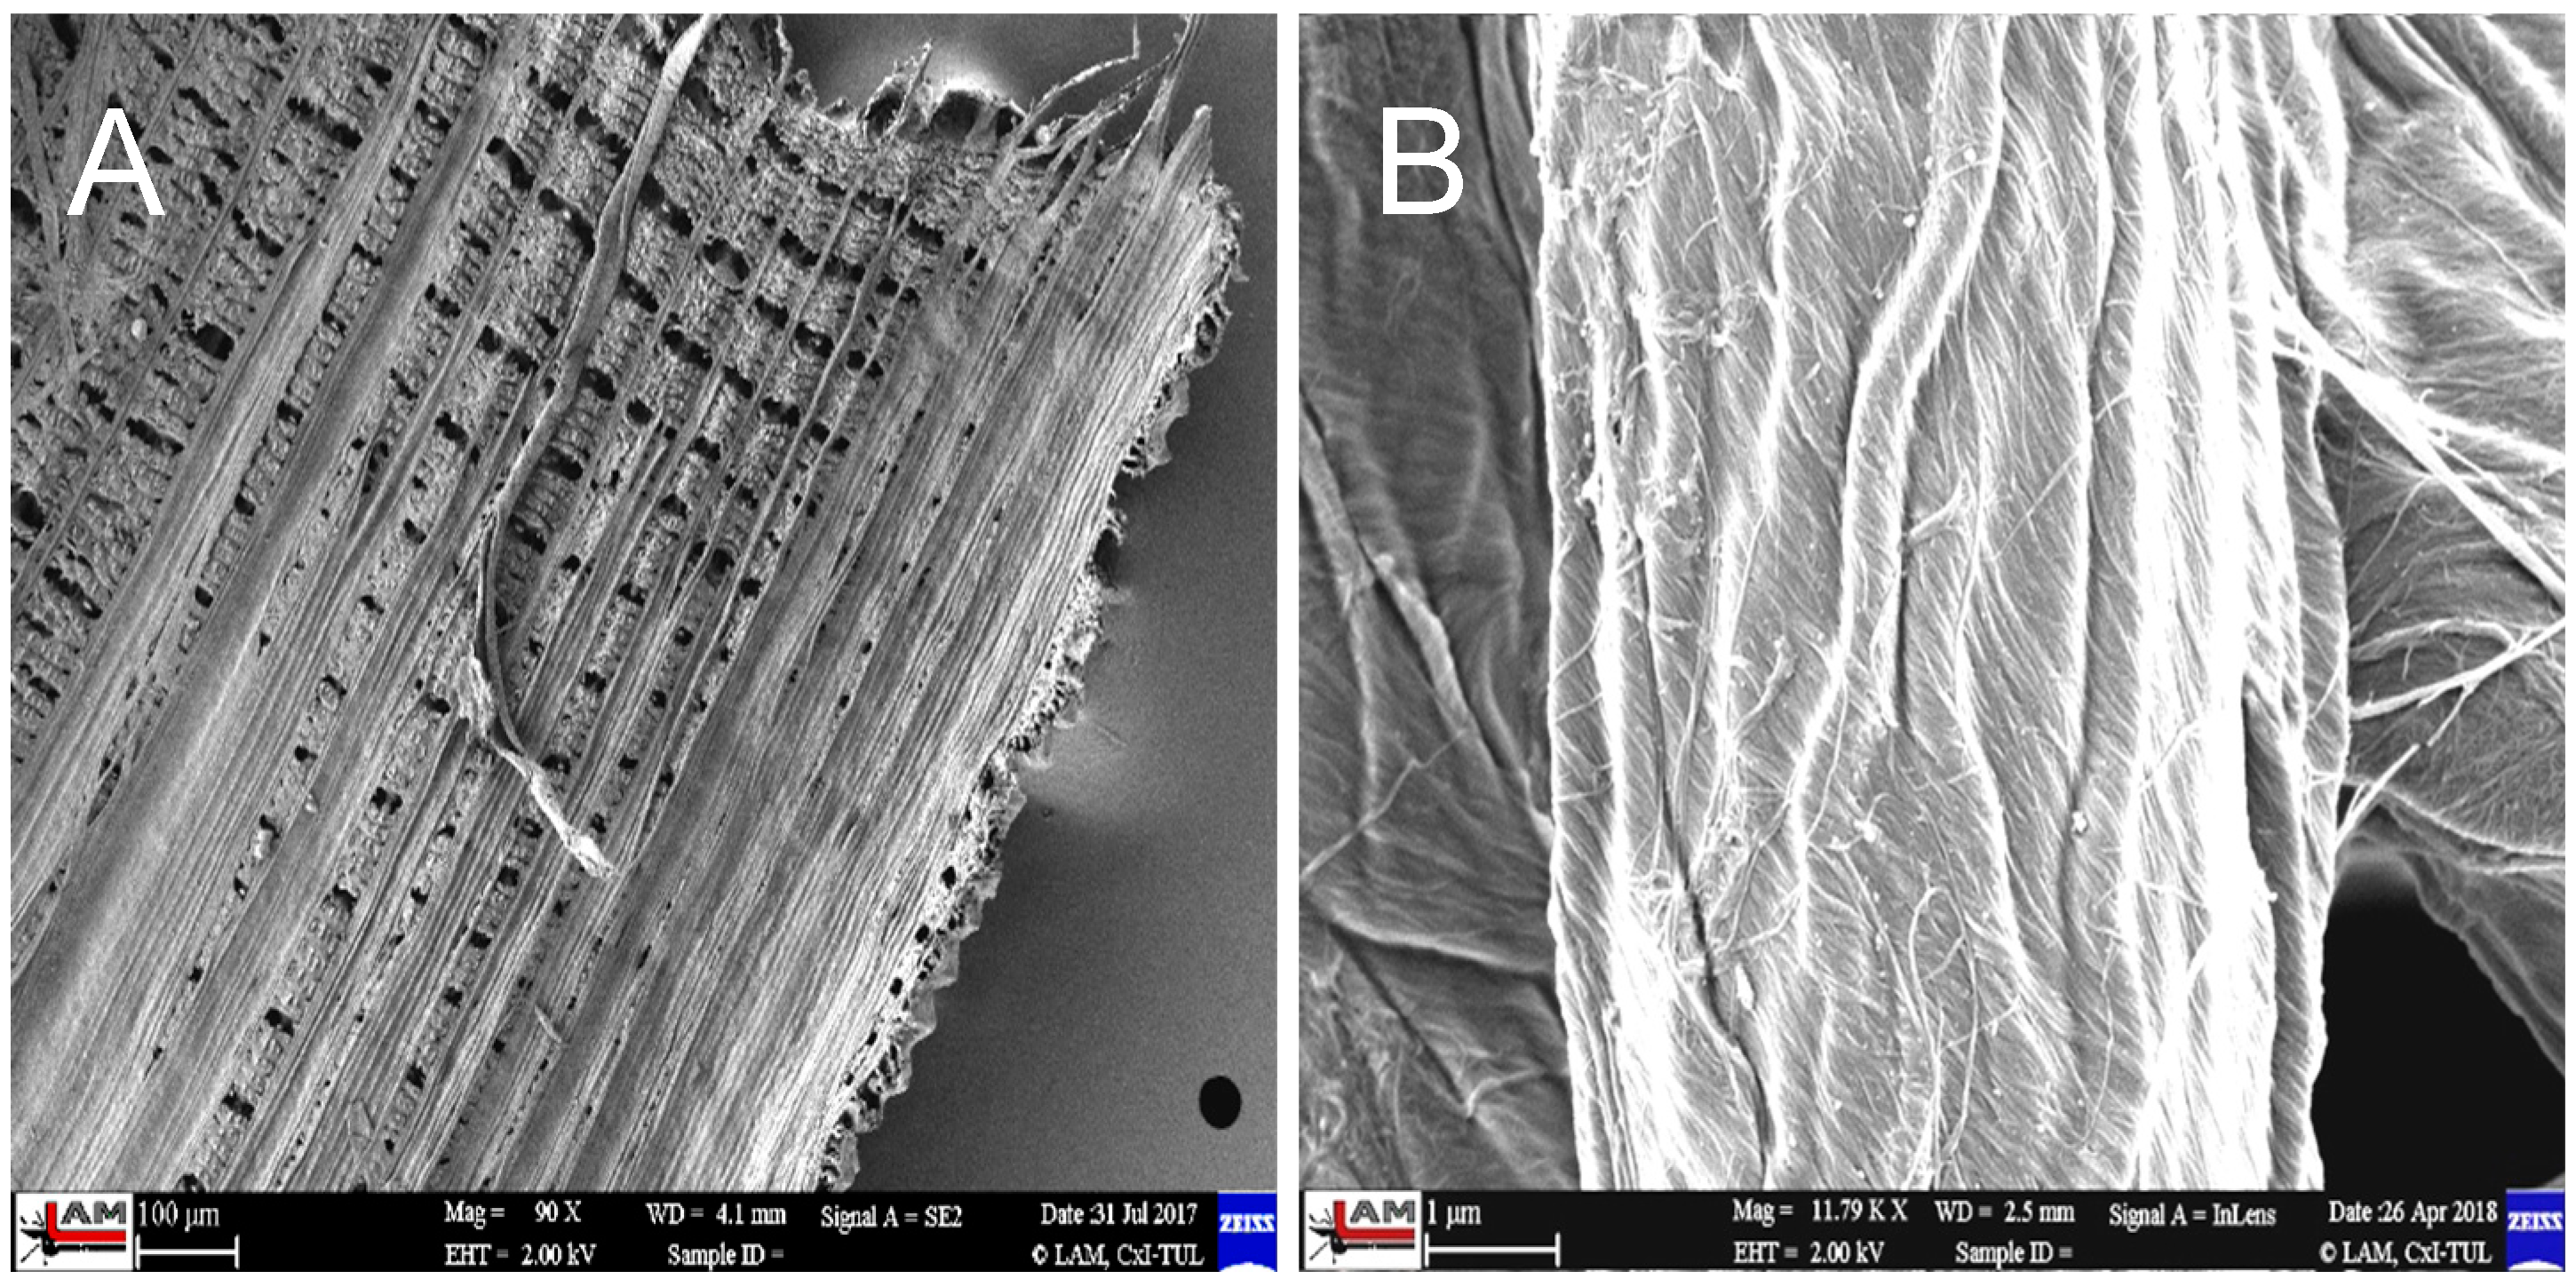
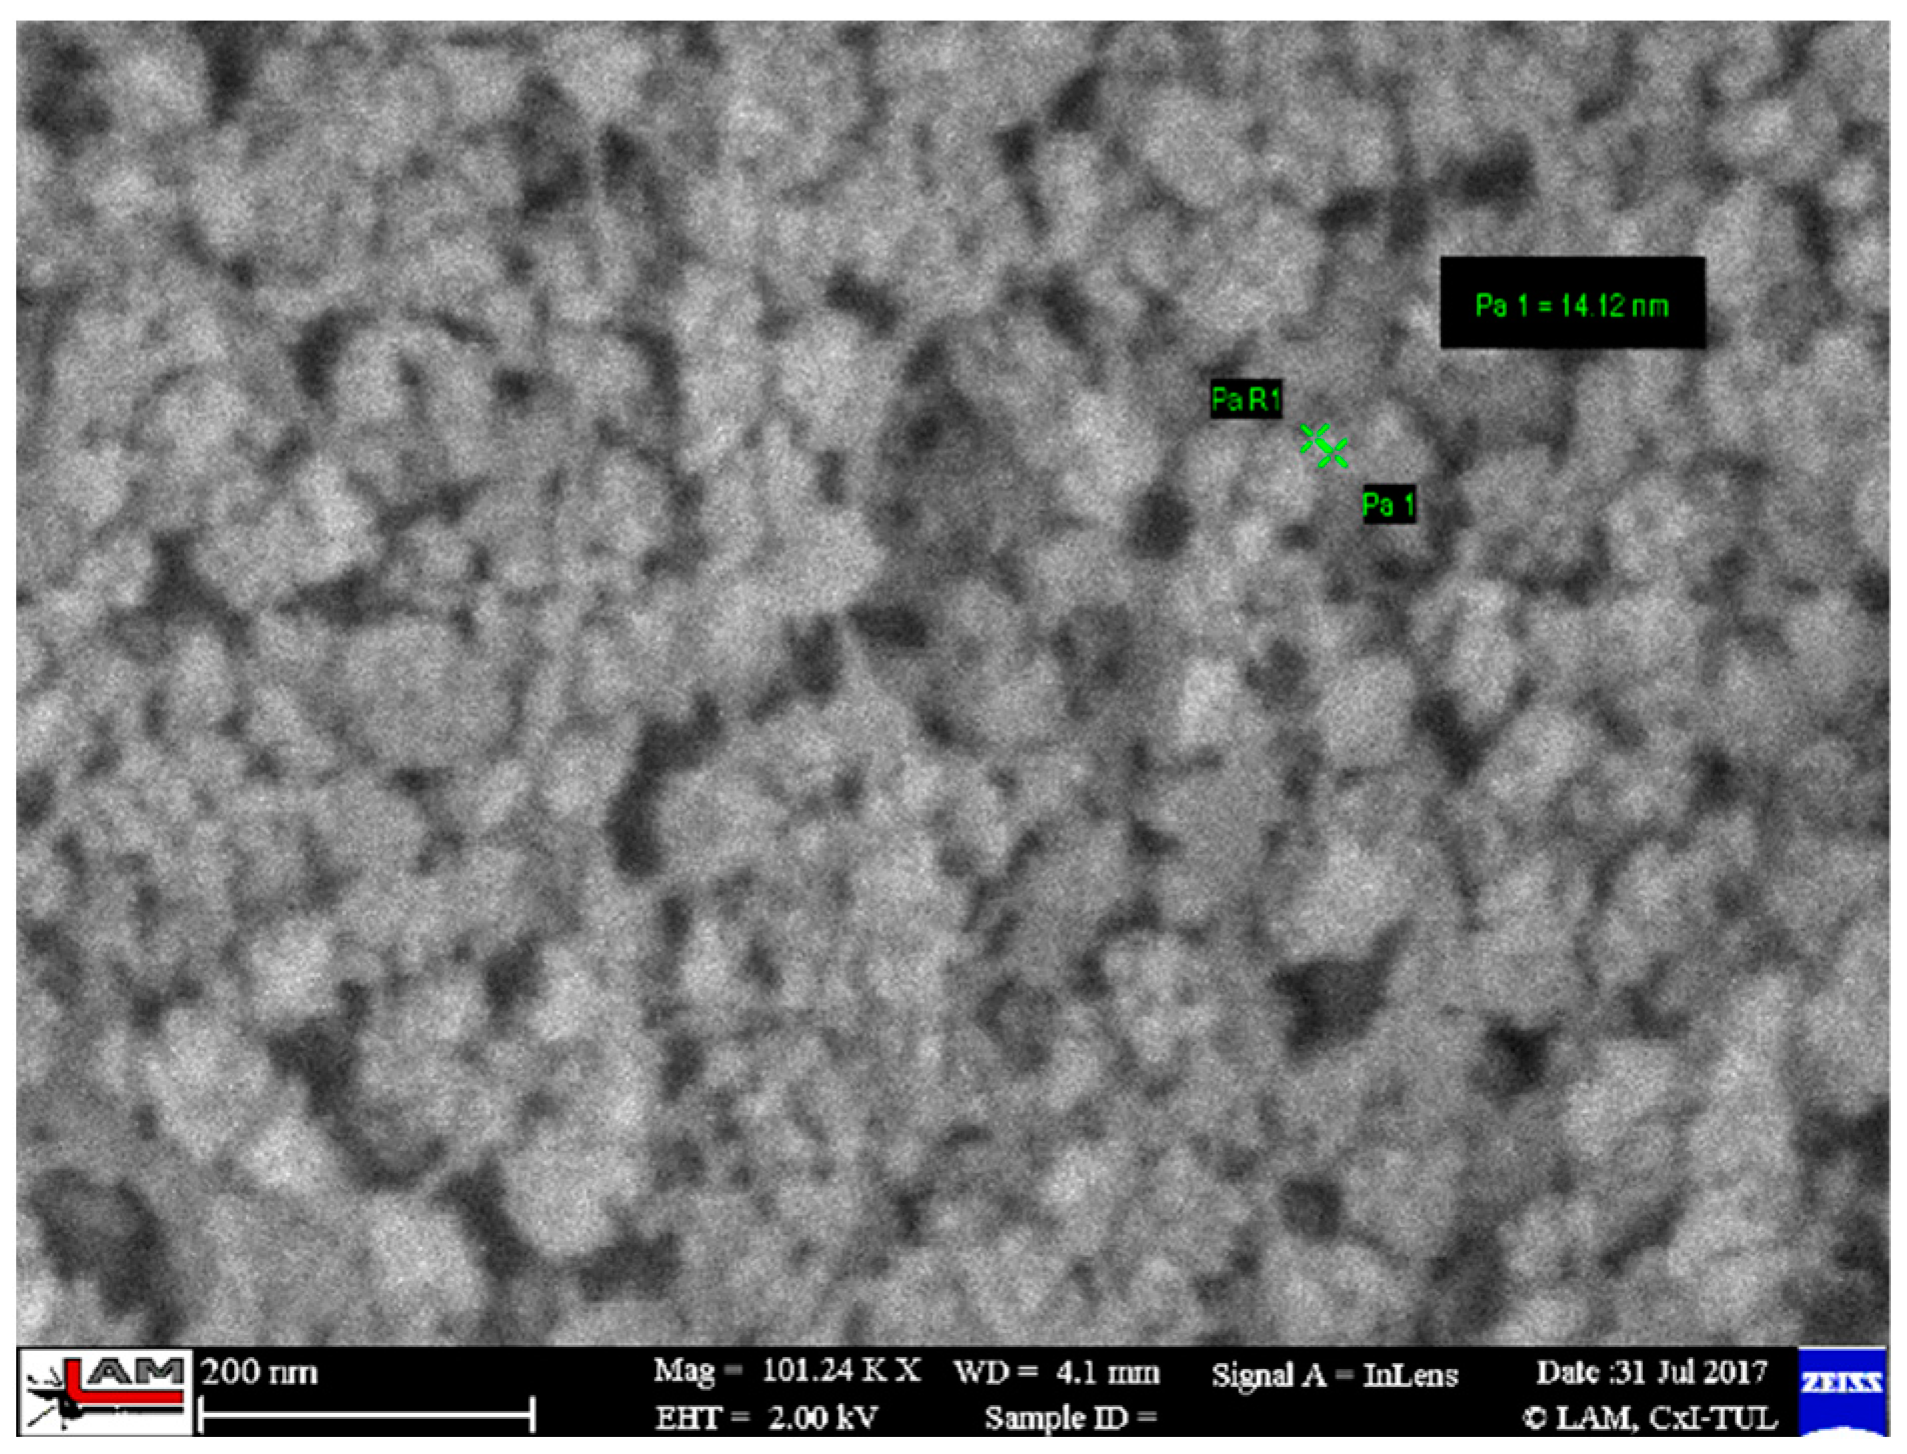
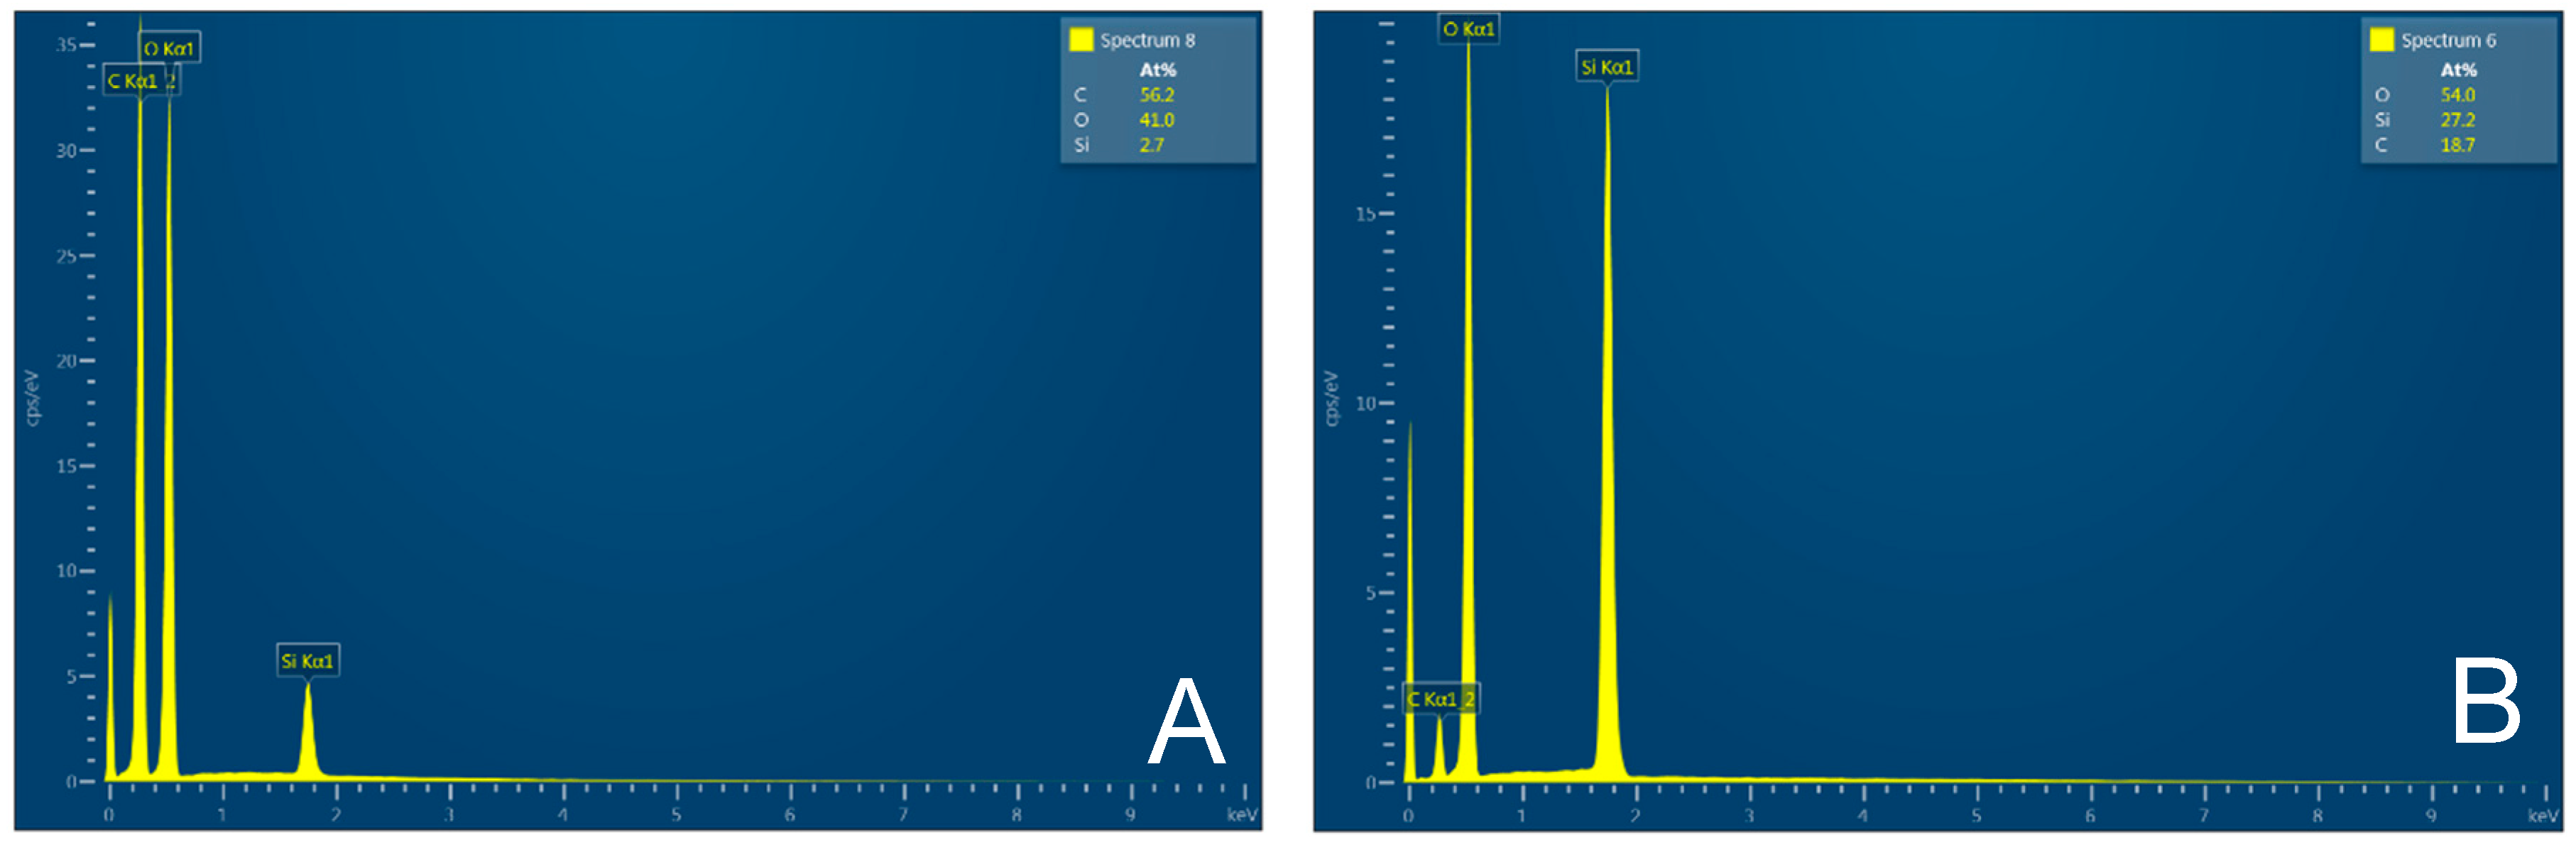
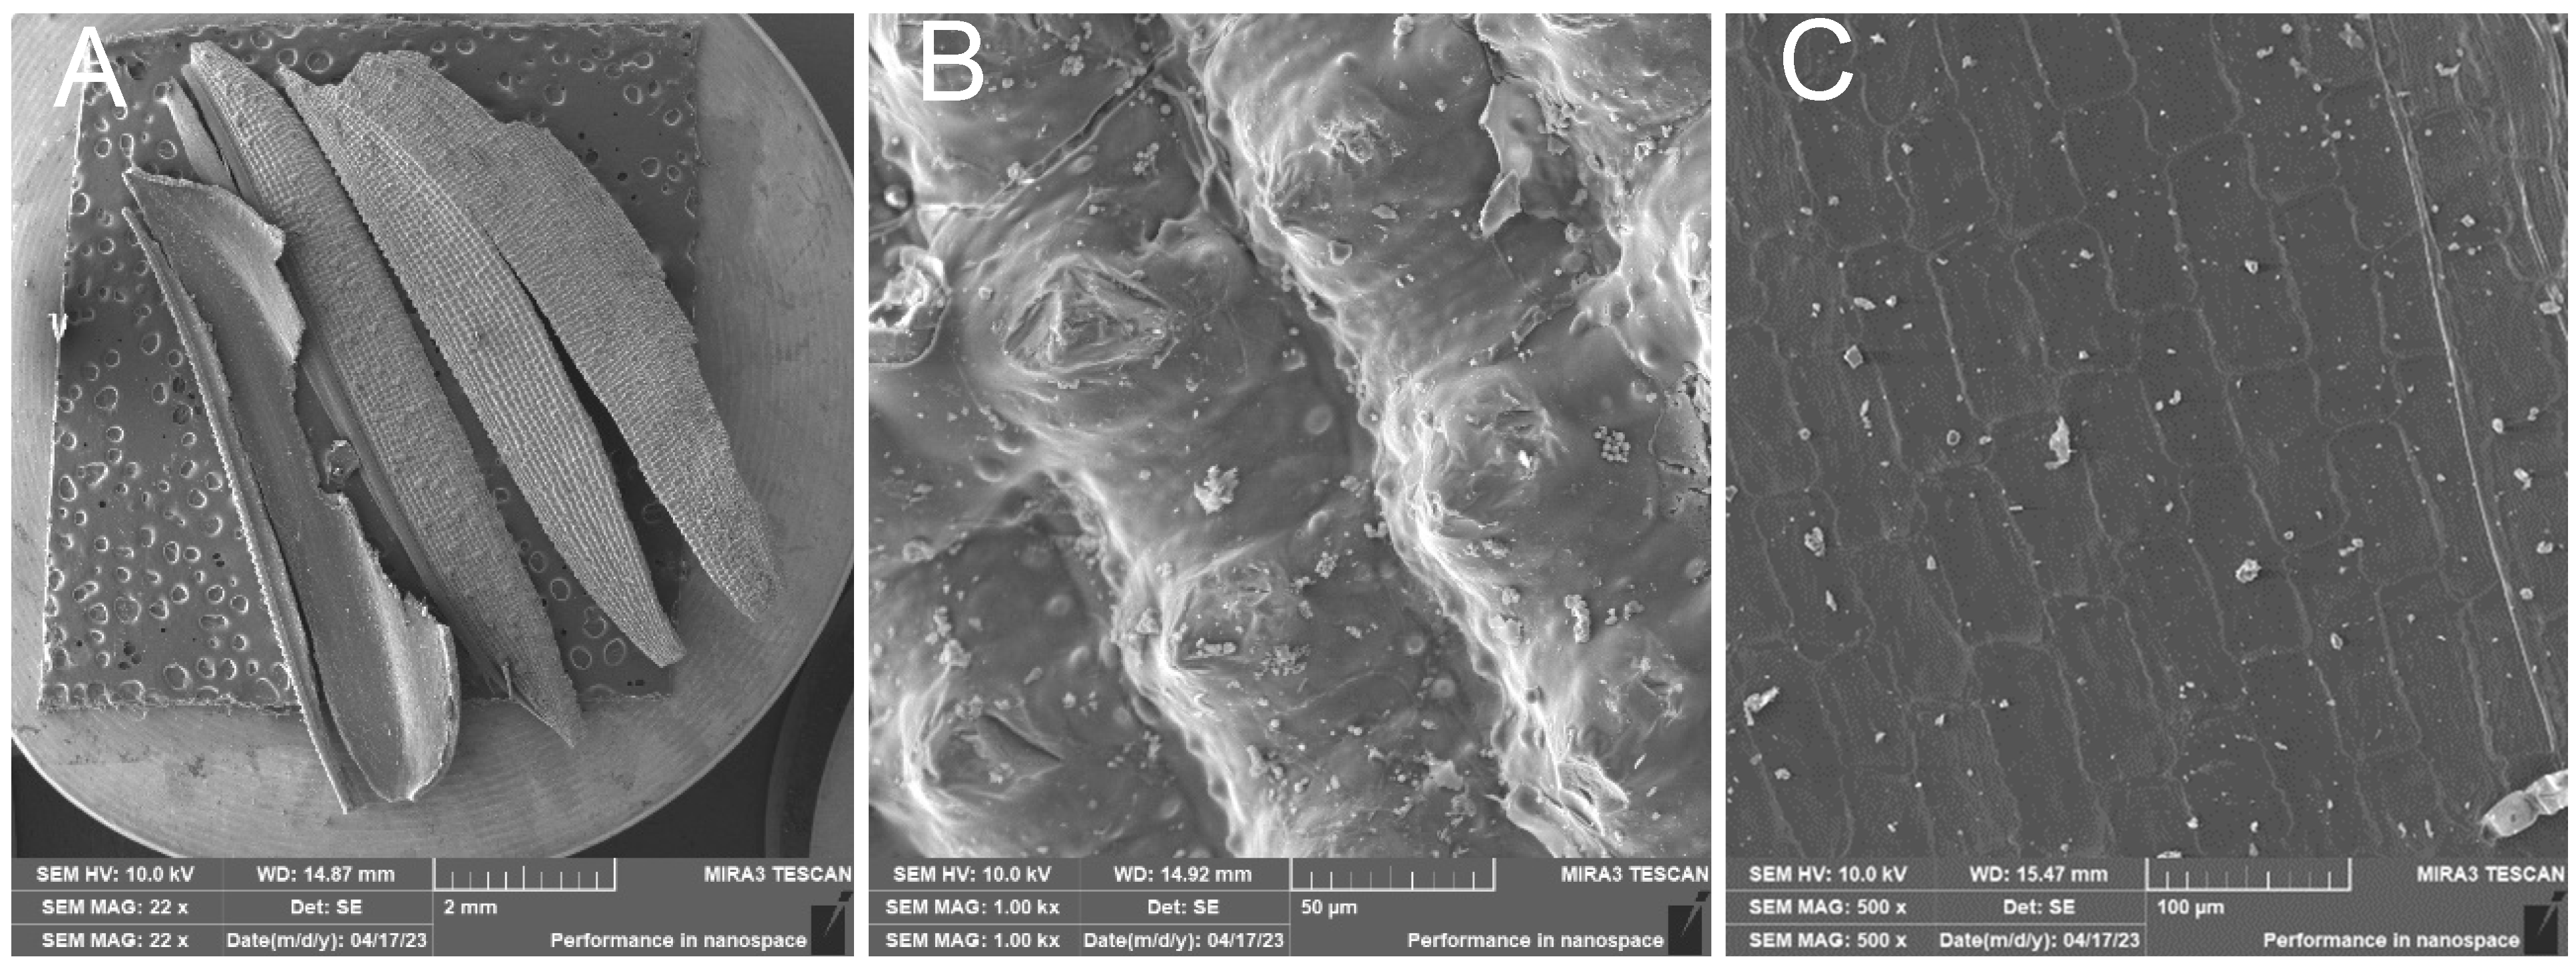
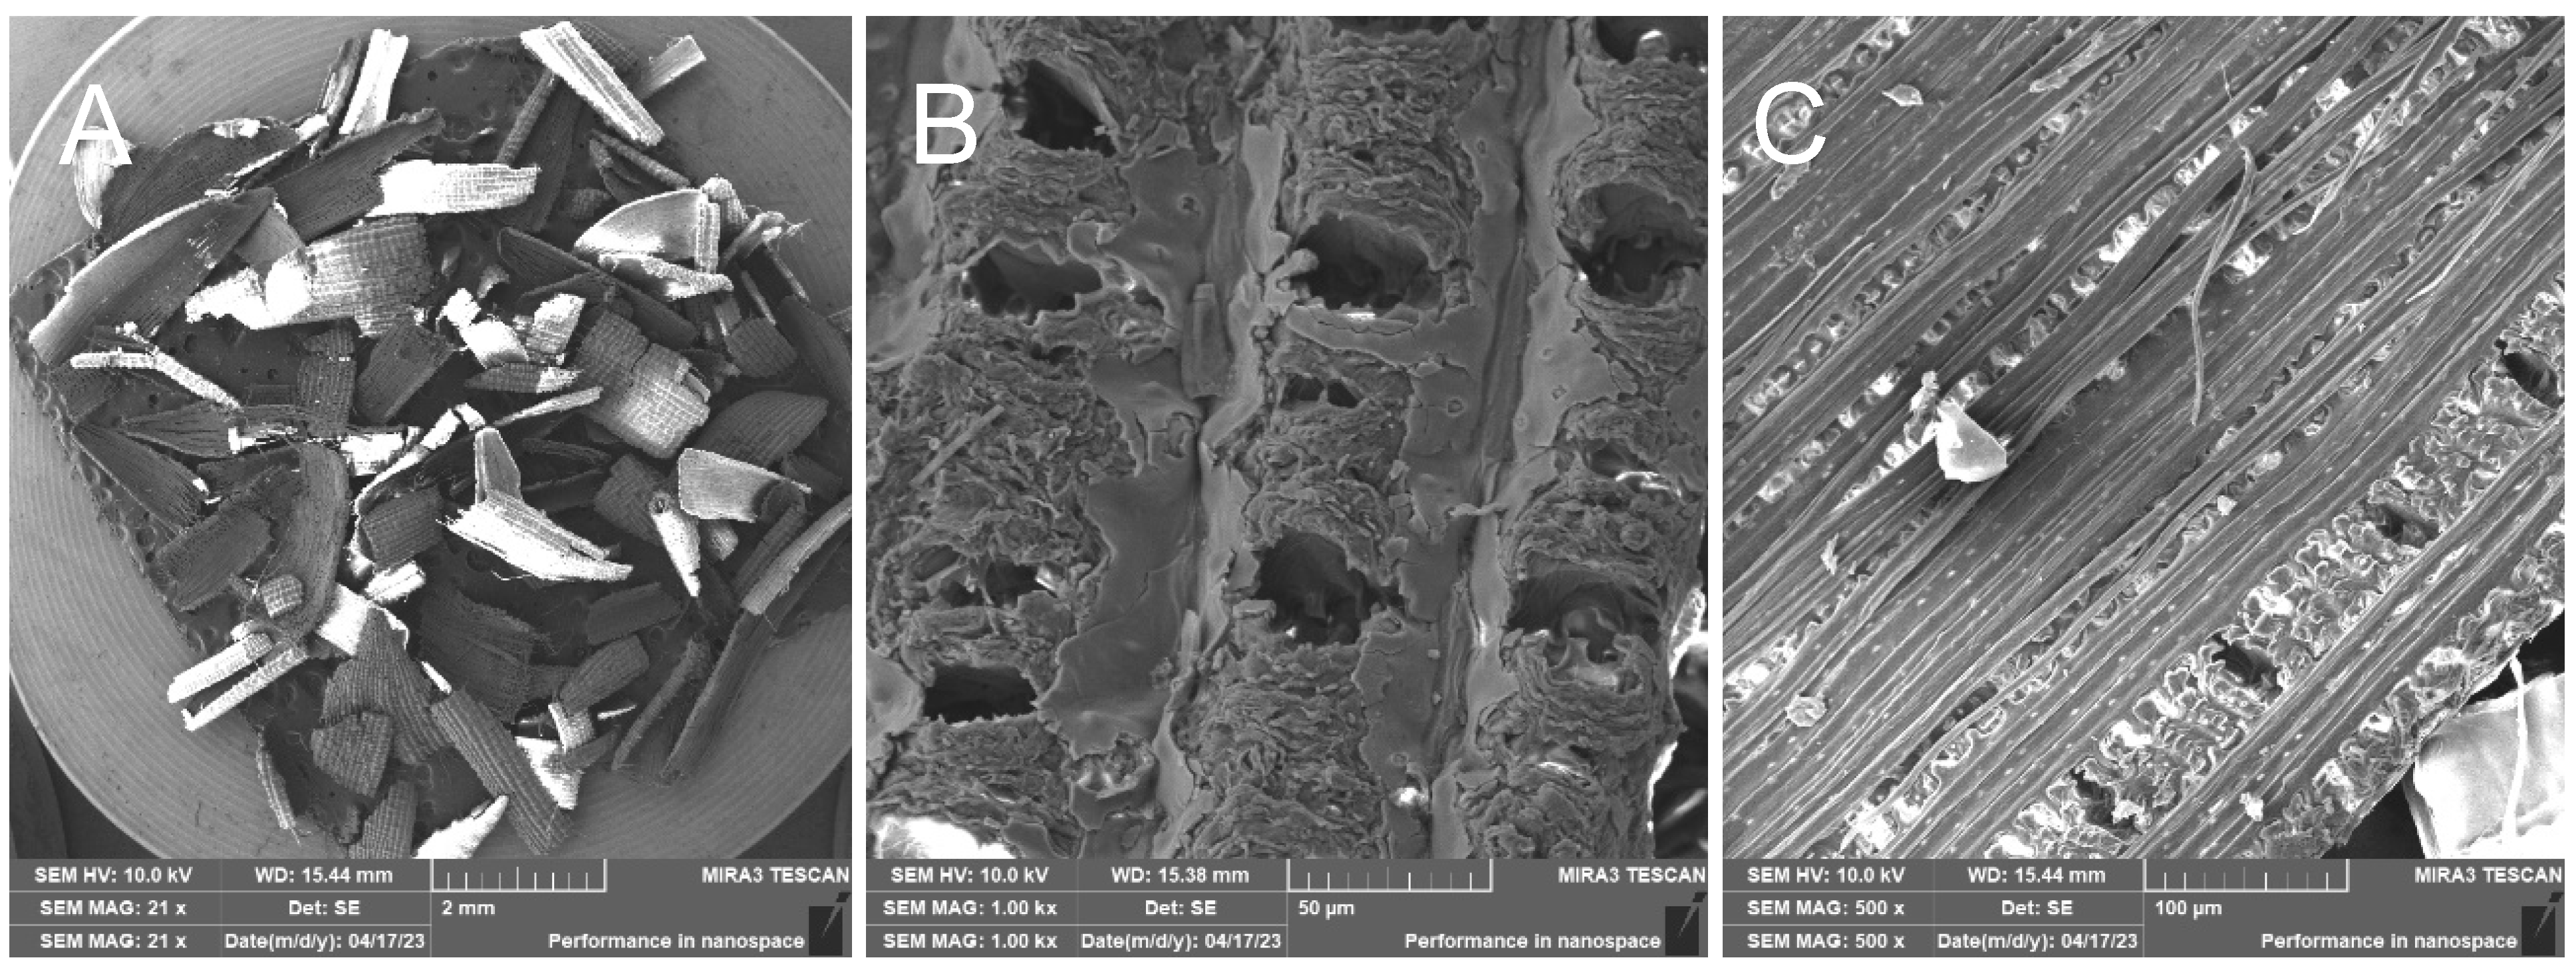
2.1.1. SEM and EDX
2.1.2. TEM
2.1.3. FTIR
2.1.4. Thermal Analysis
3. Results and Discussion
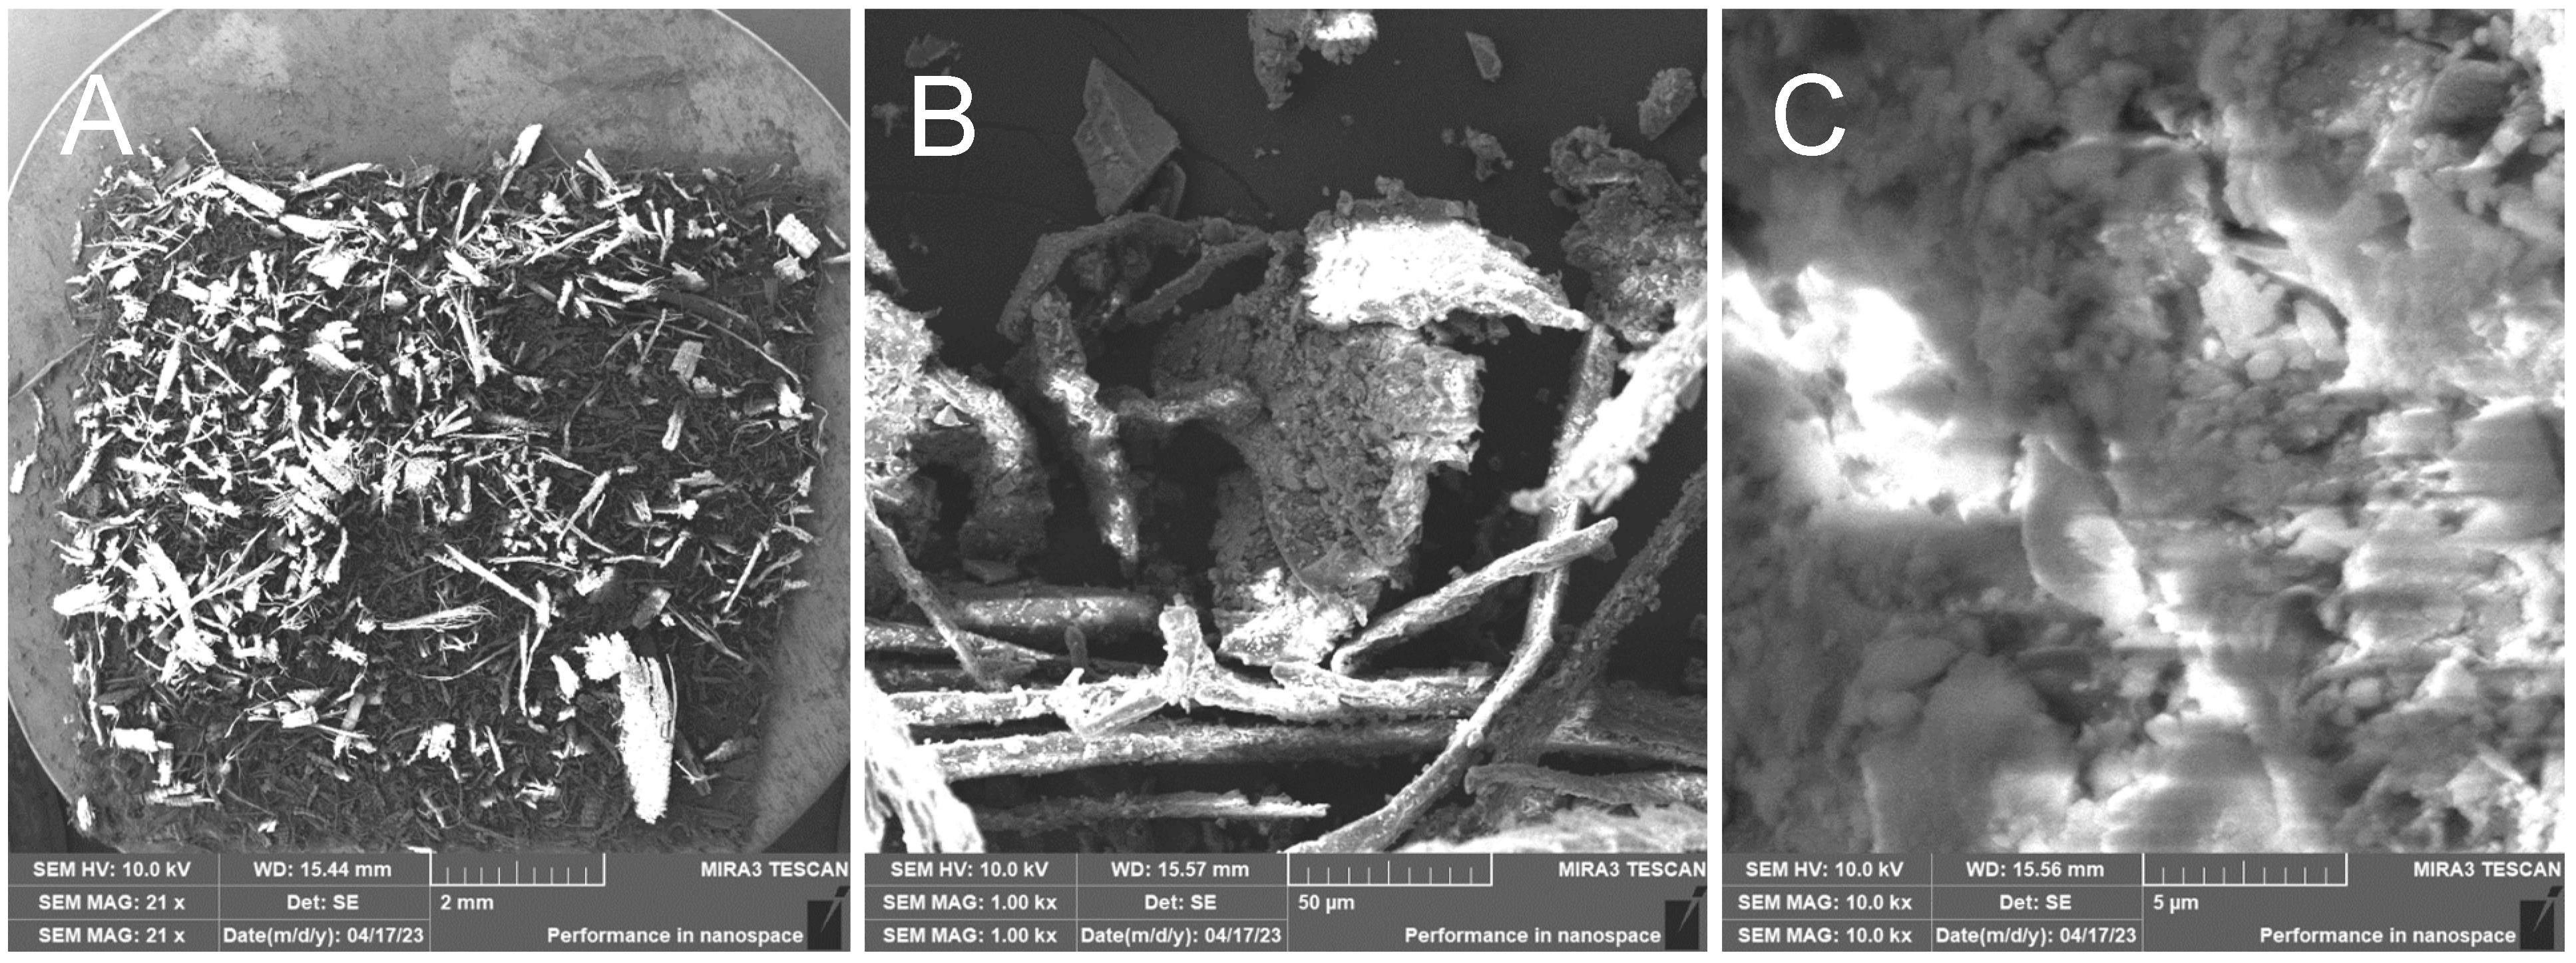
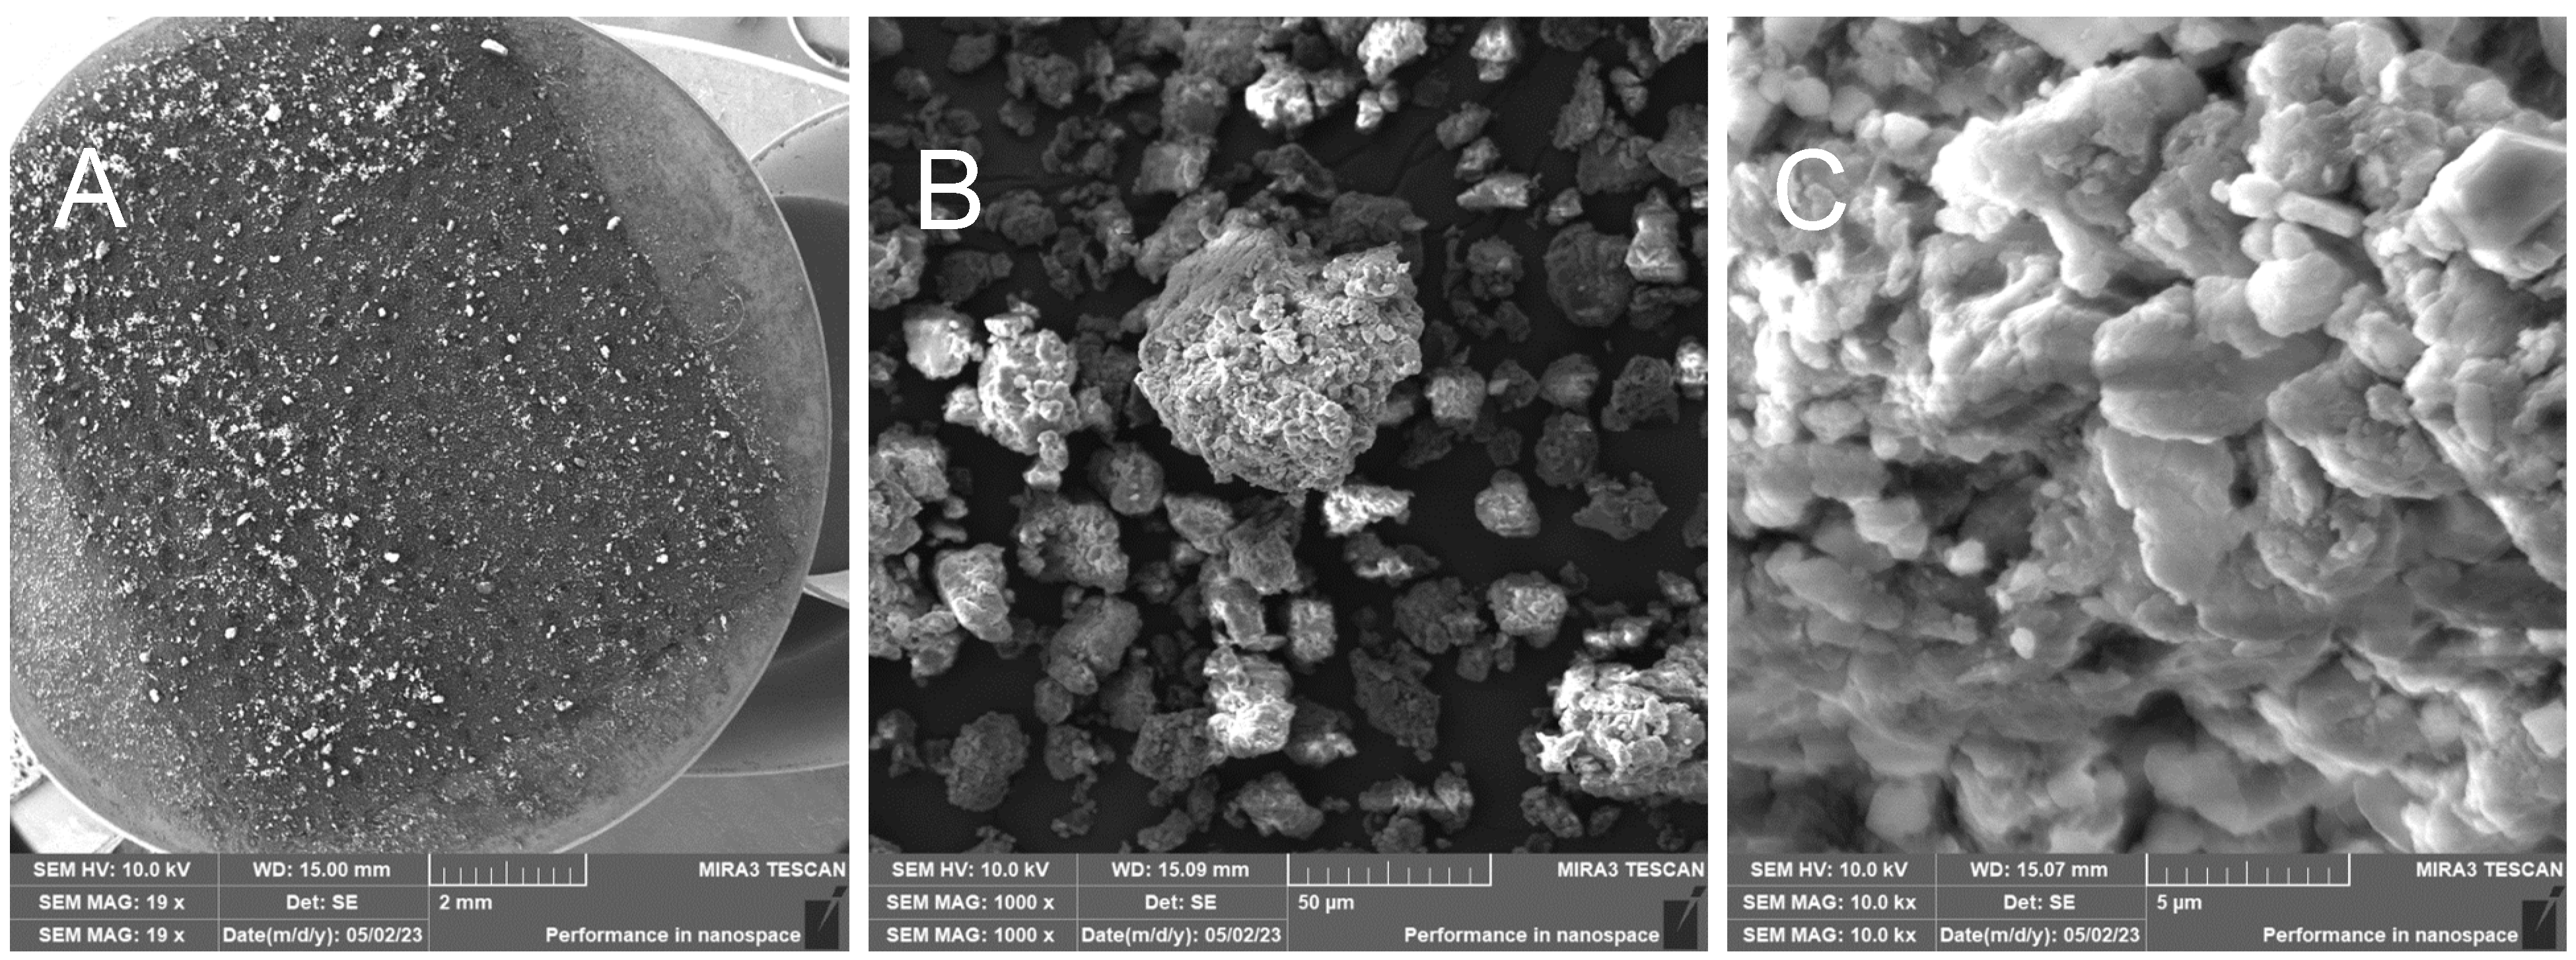
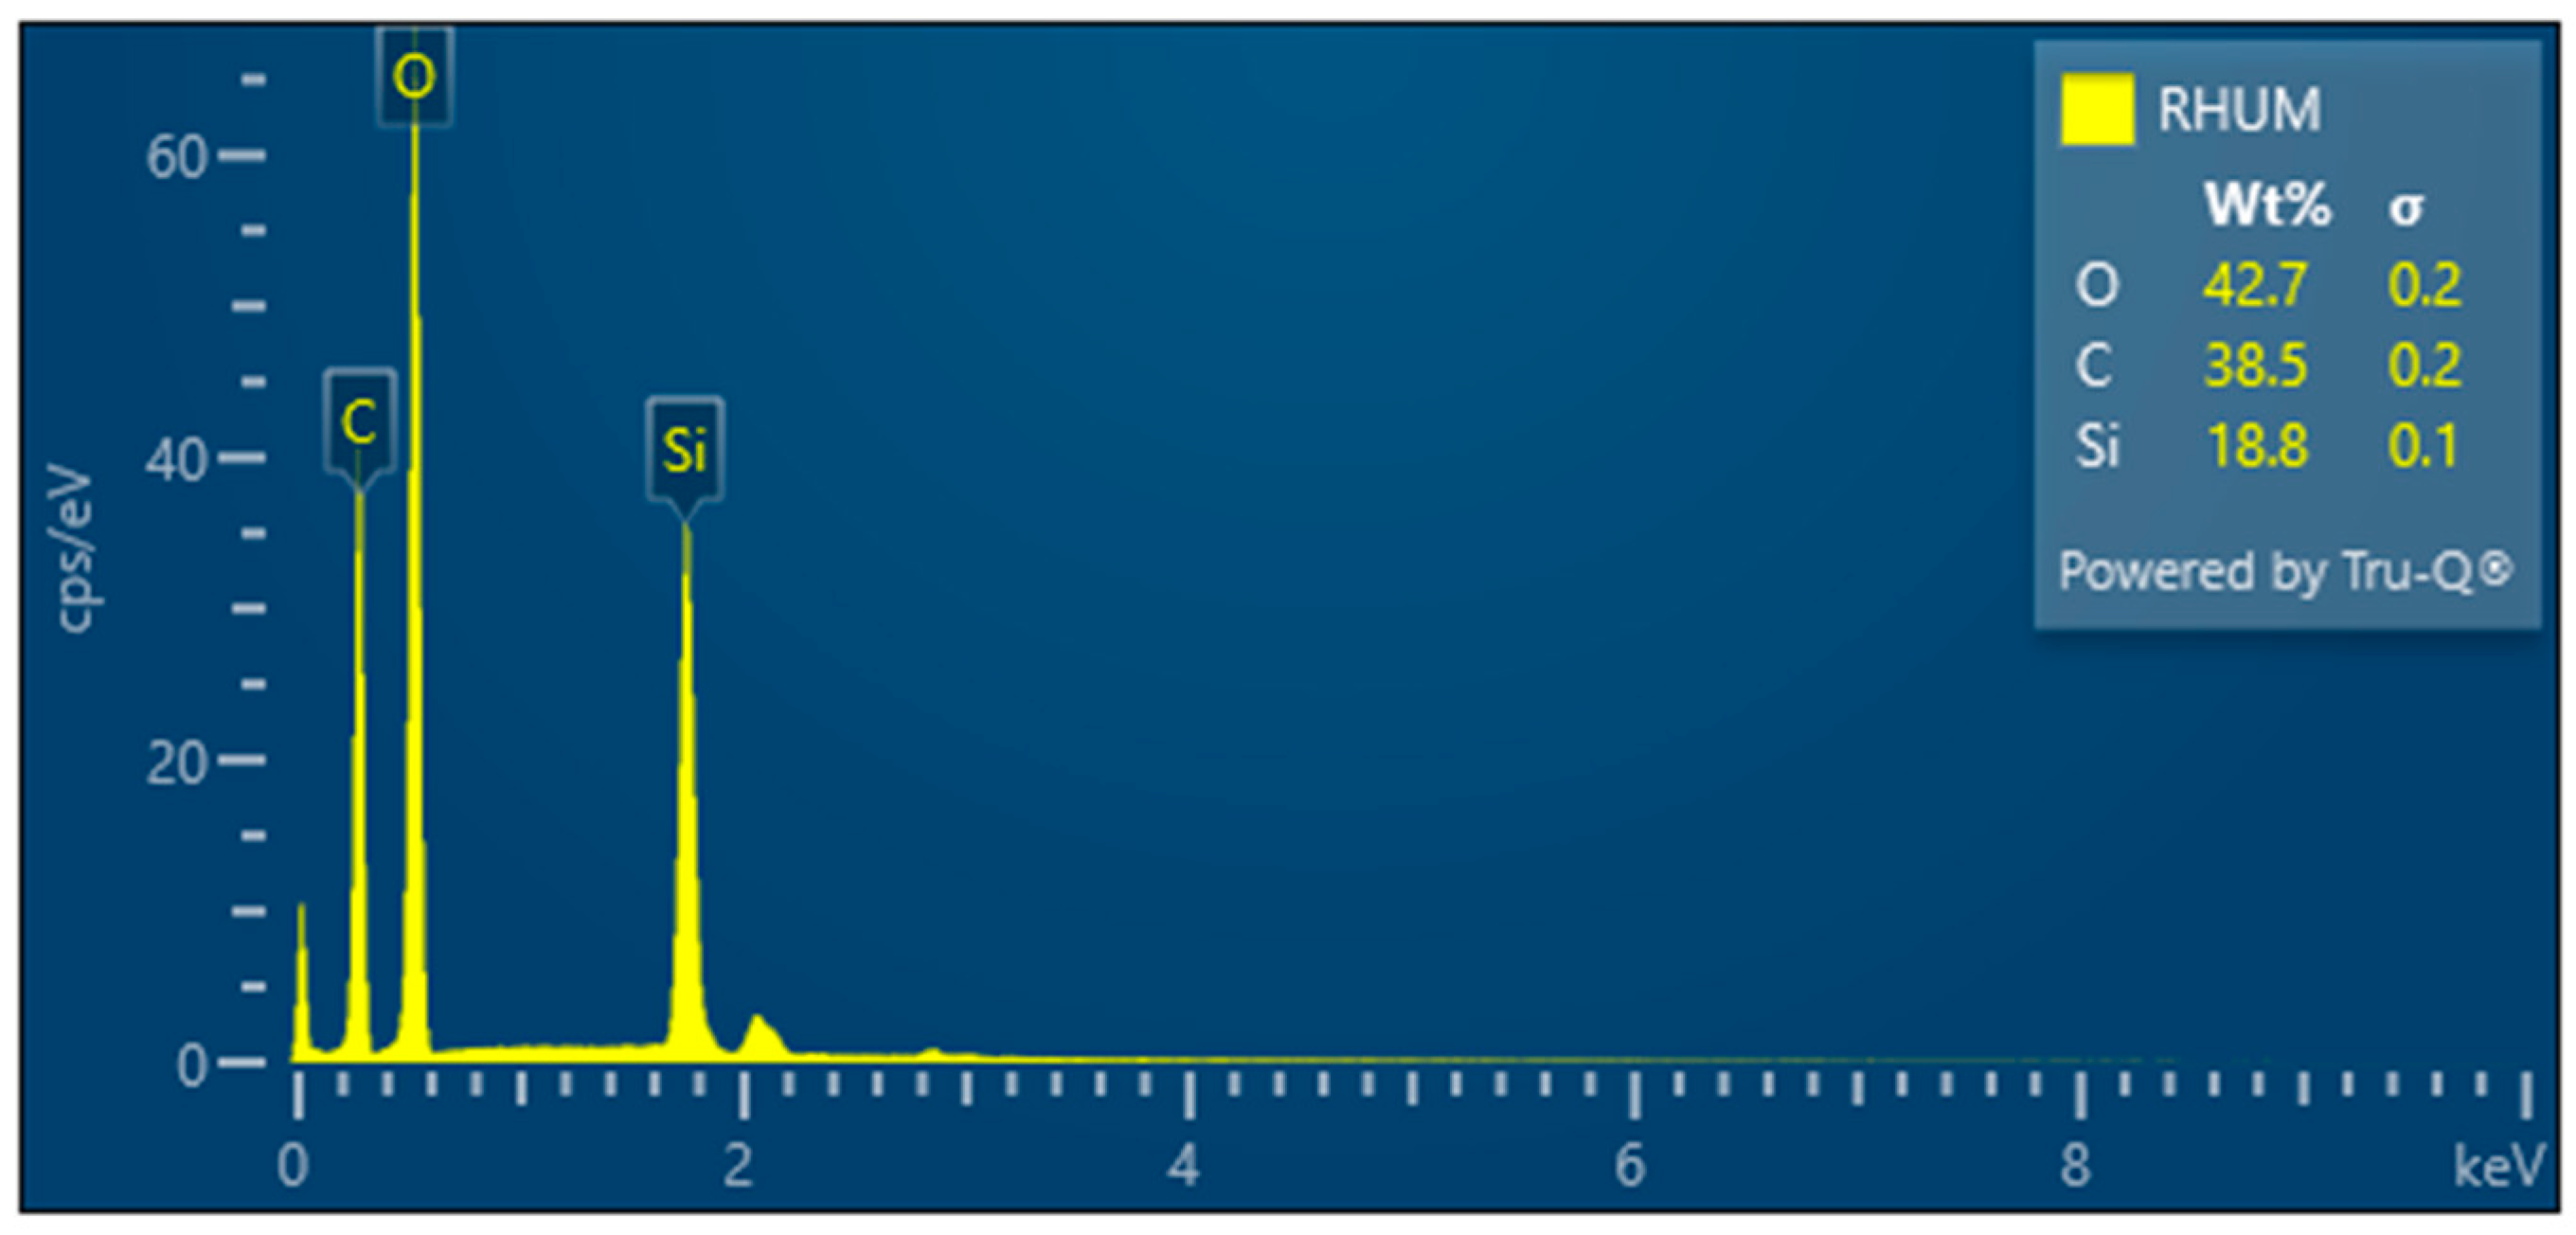
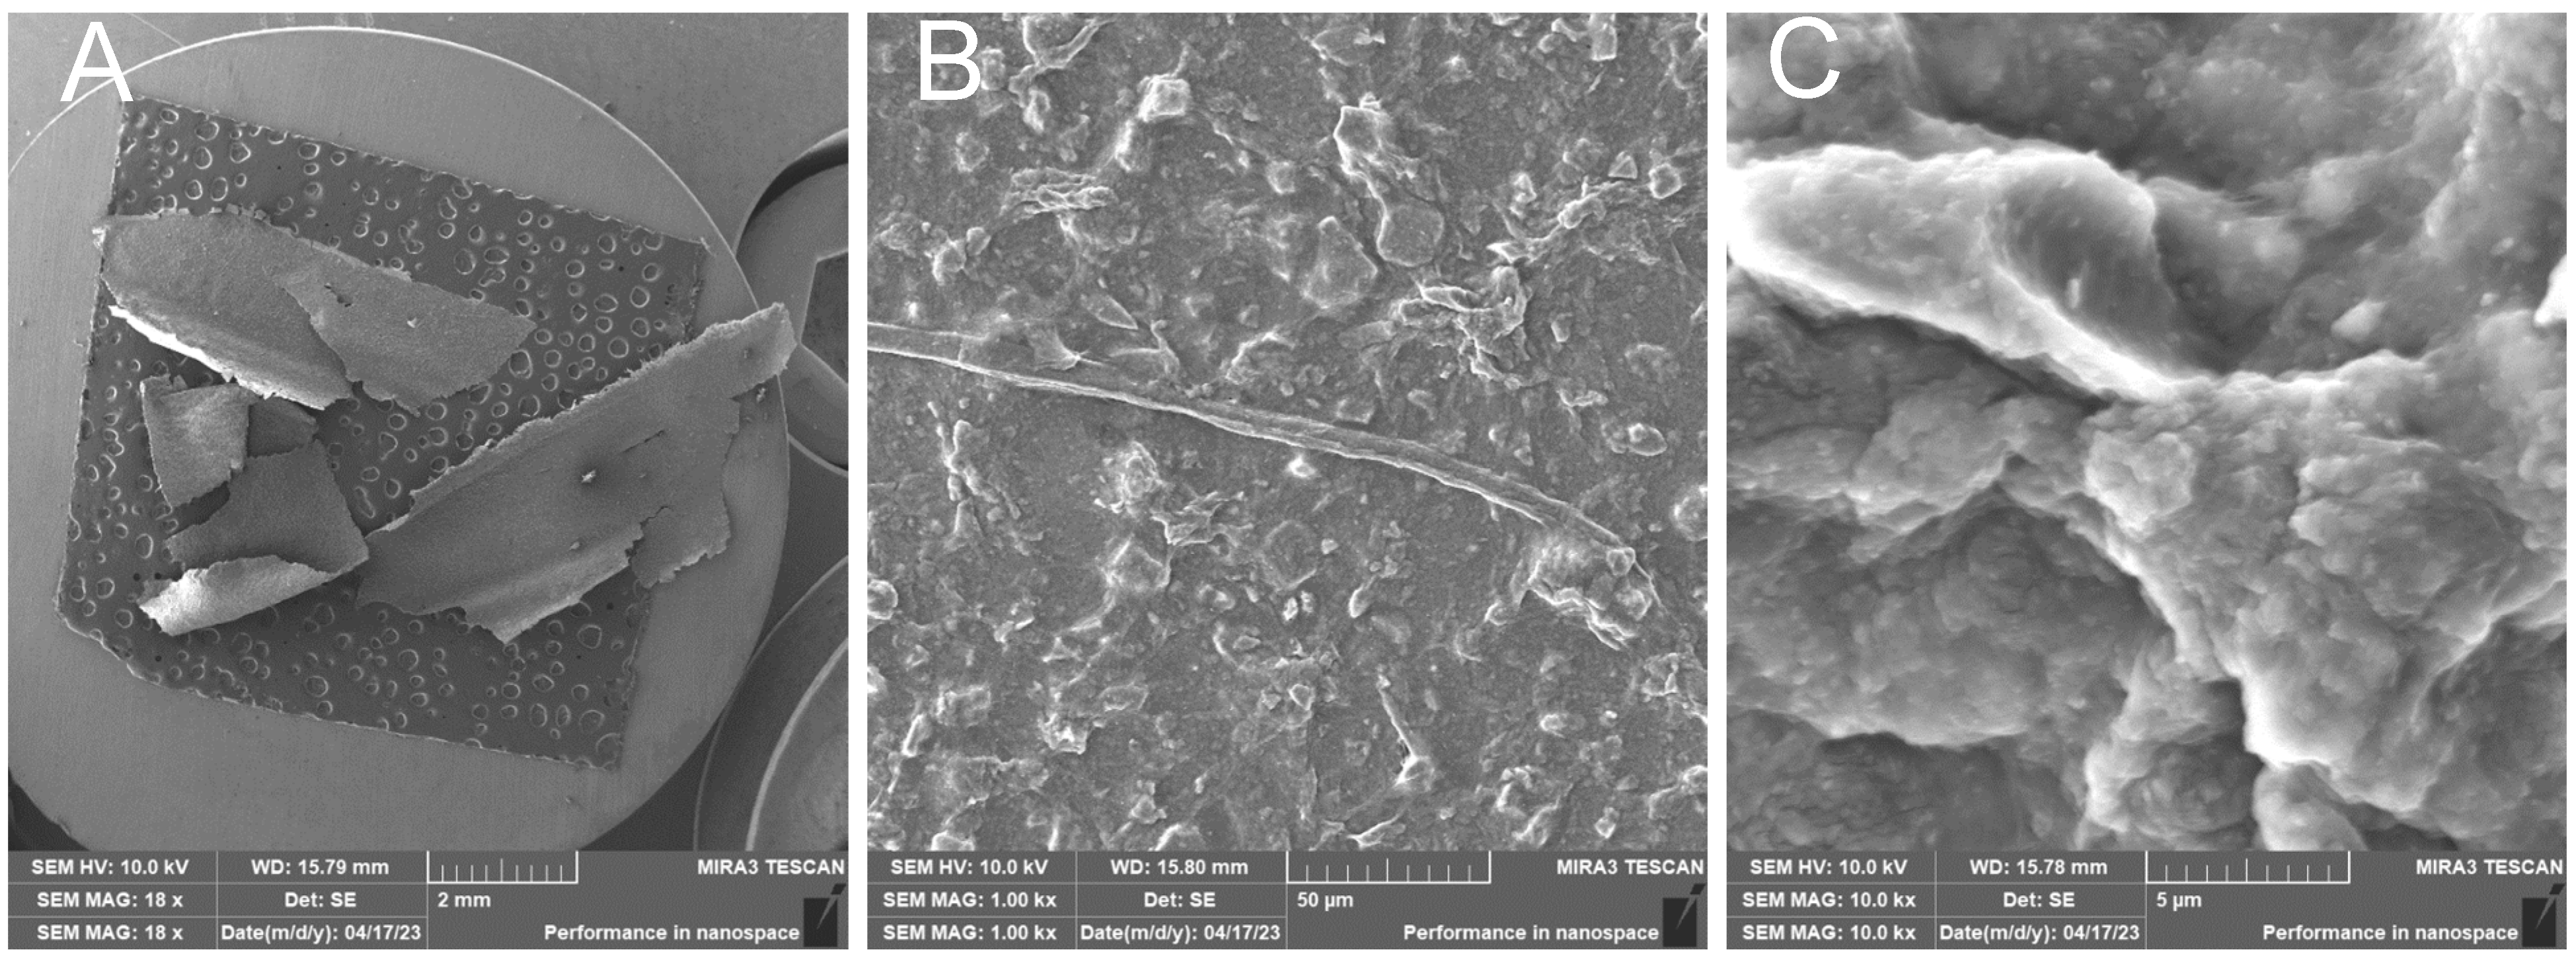
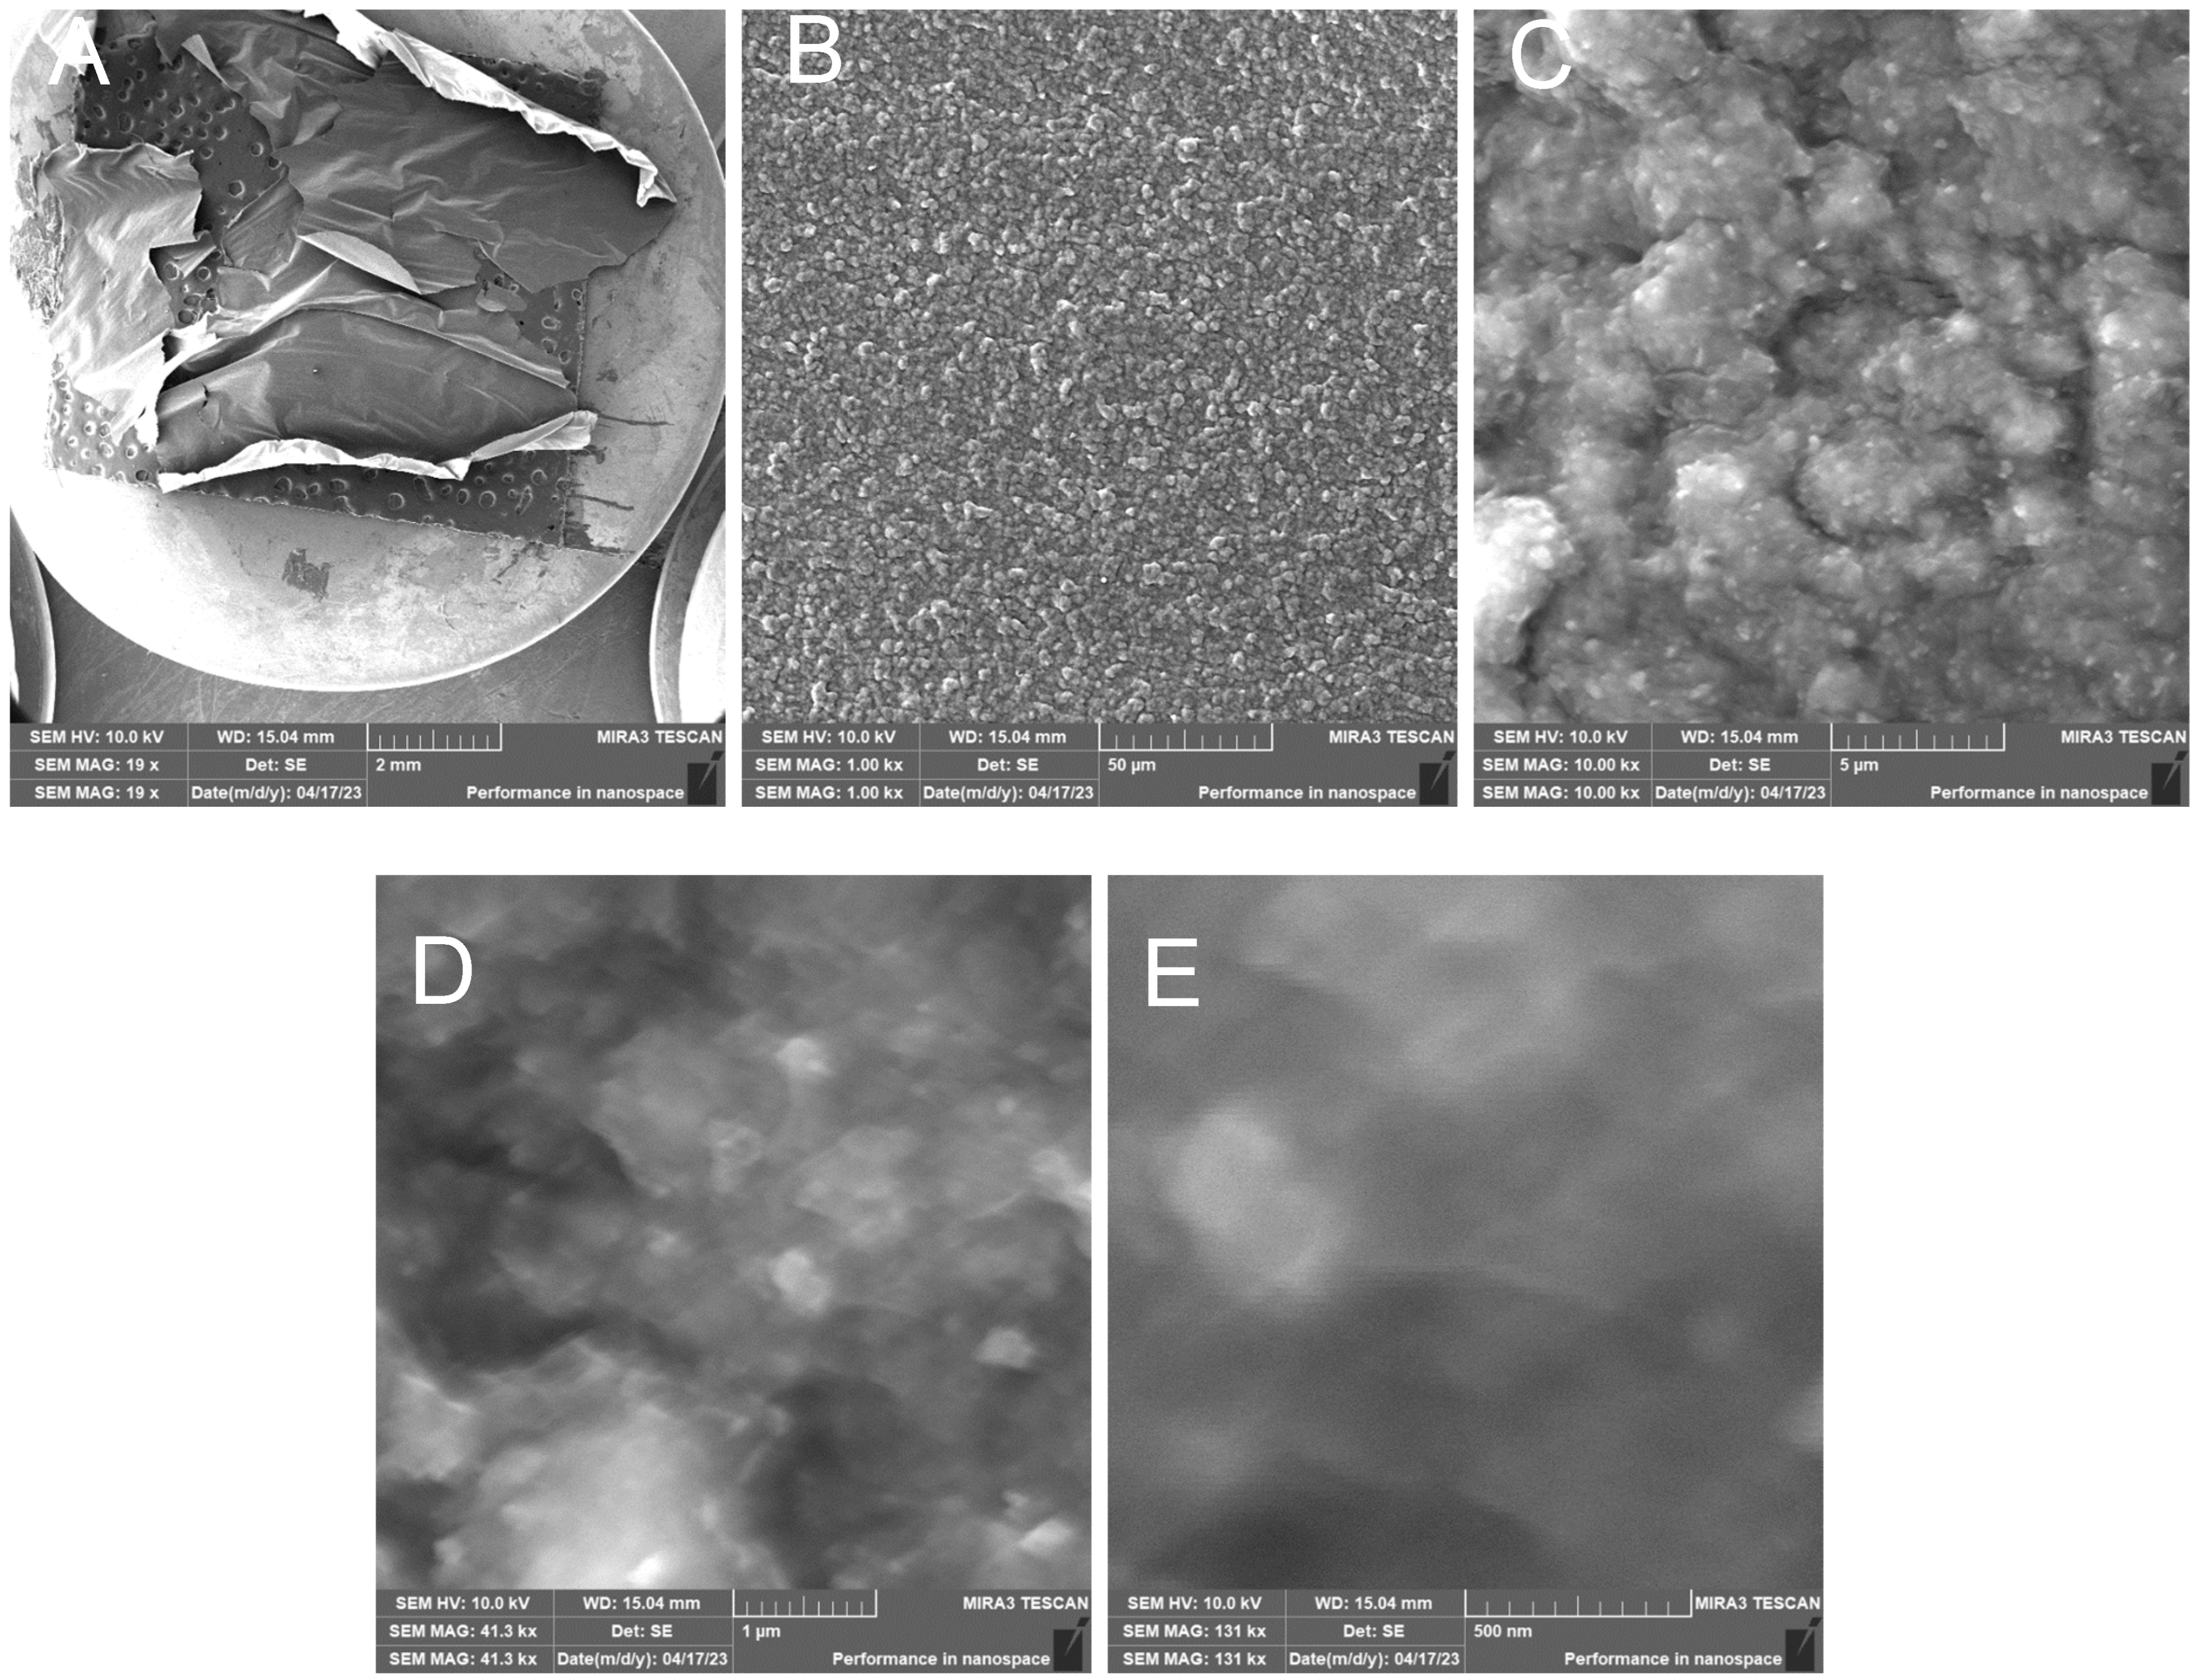
3.1. SEM and EDX
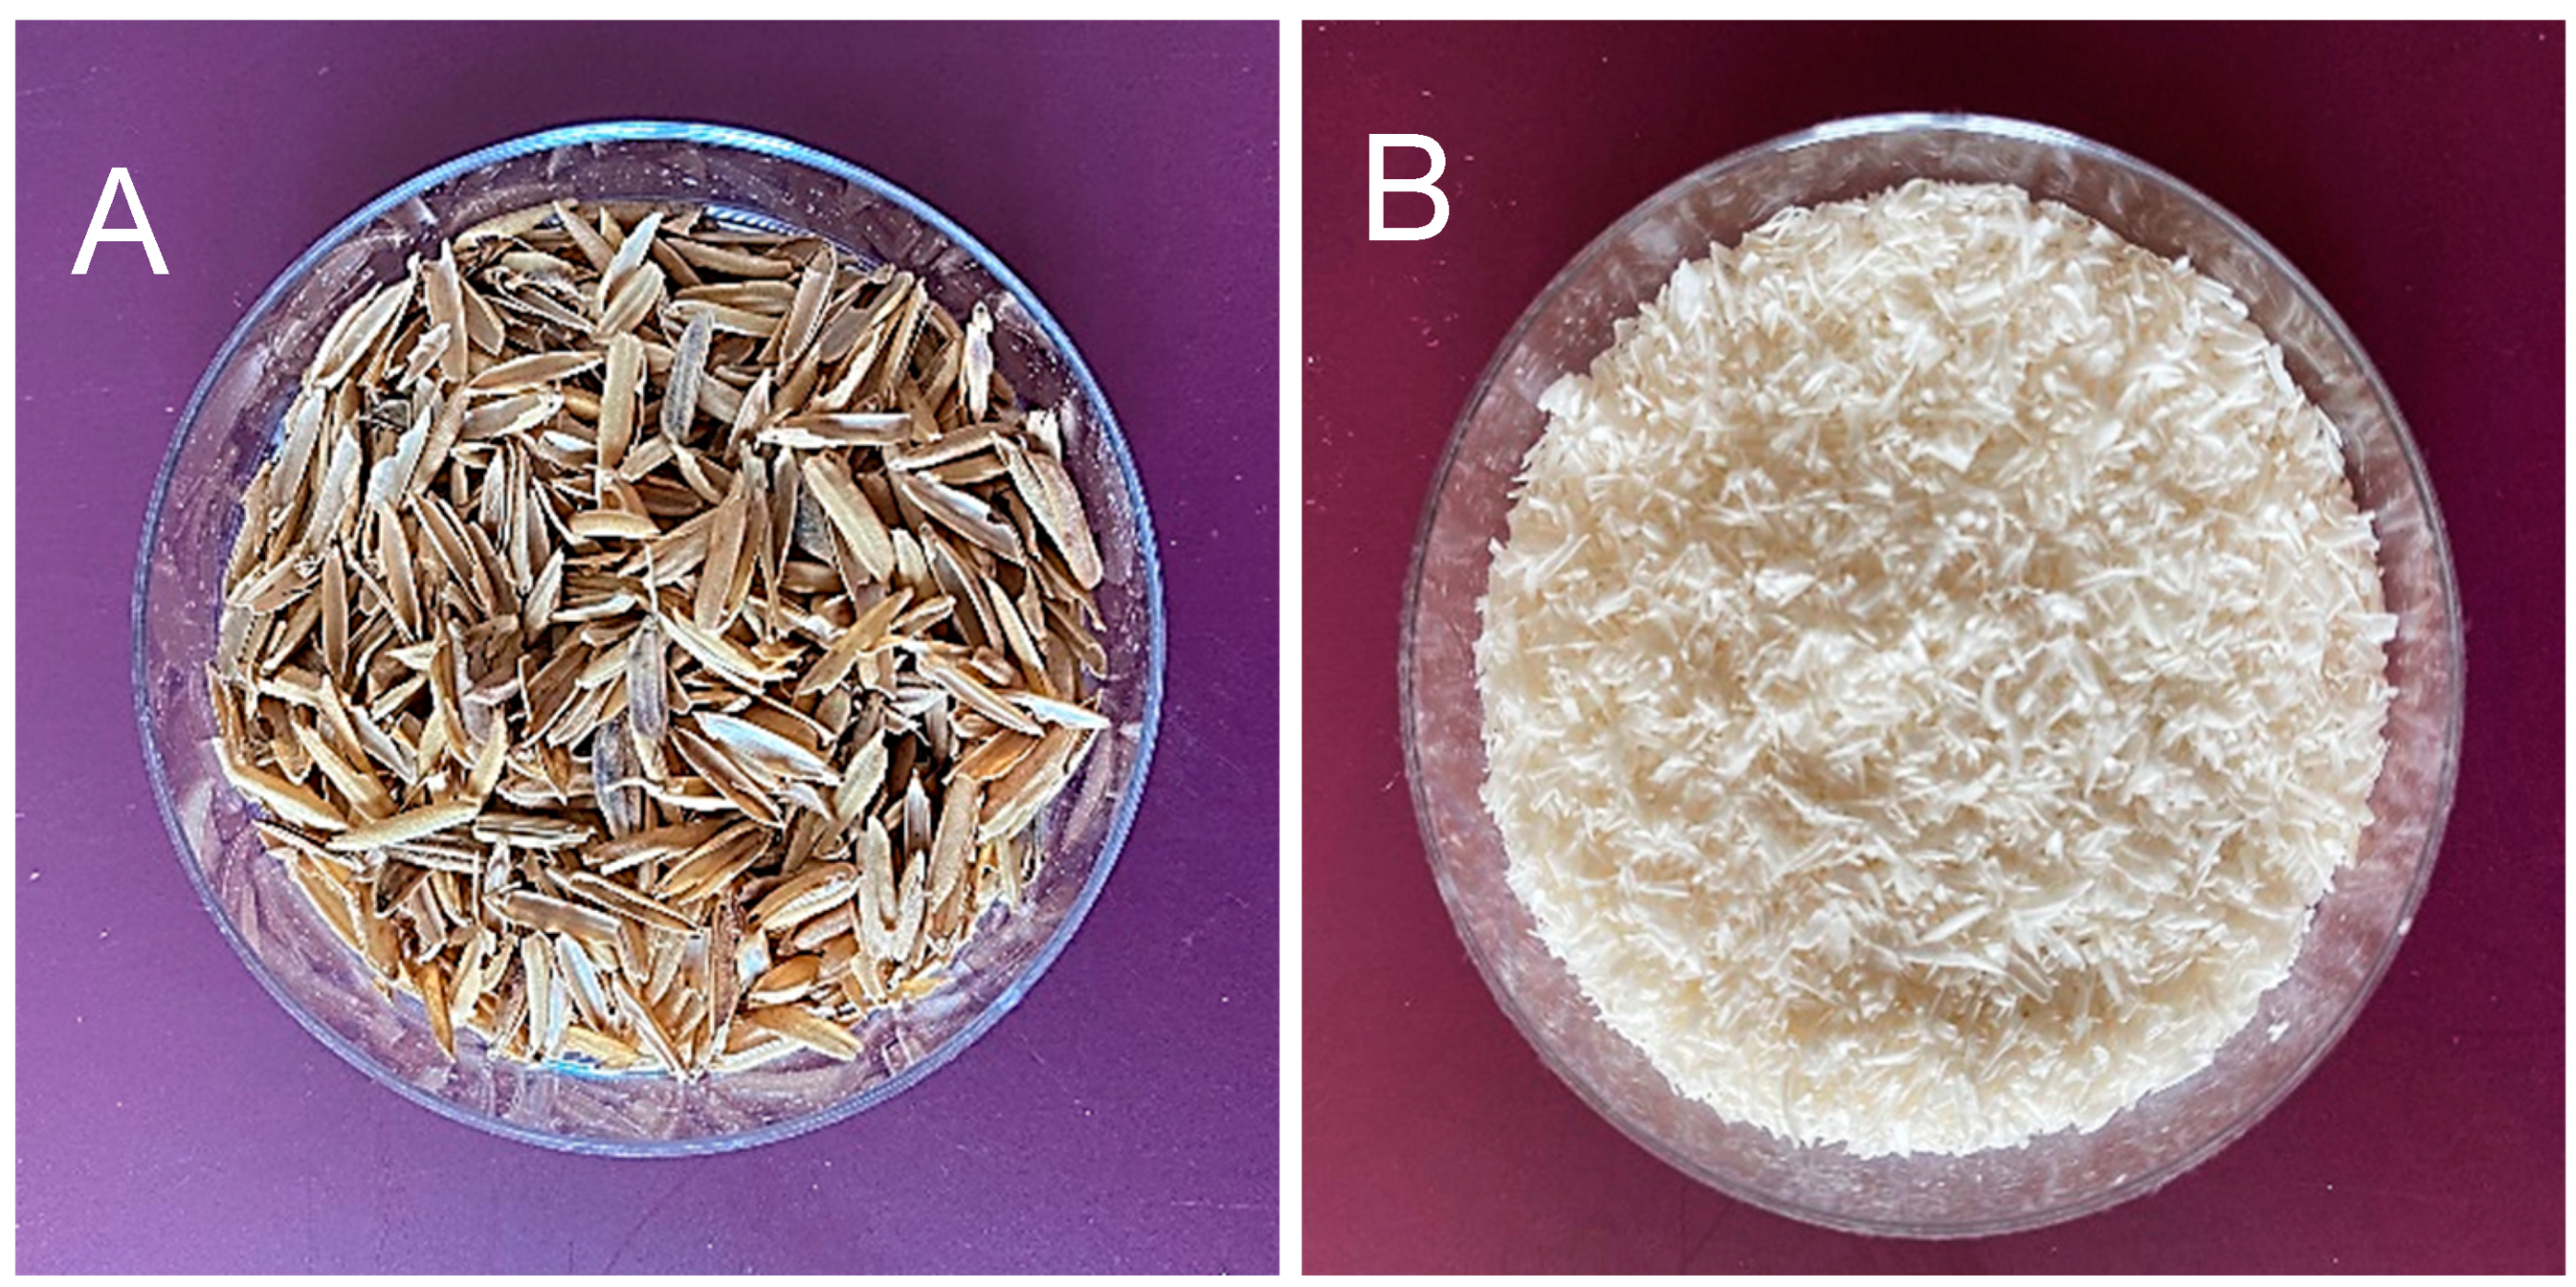
- Raw rice
- RHS—Untreated rice husk
- RHU—Treated rice husk
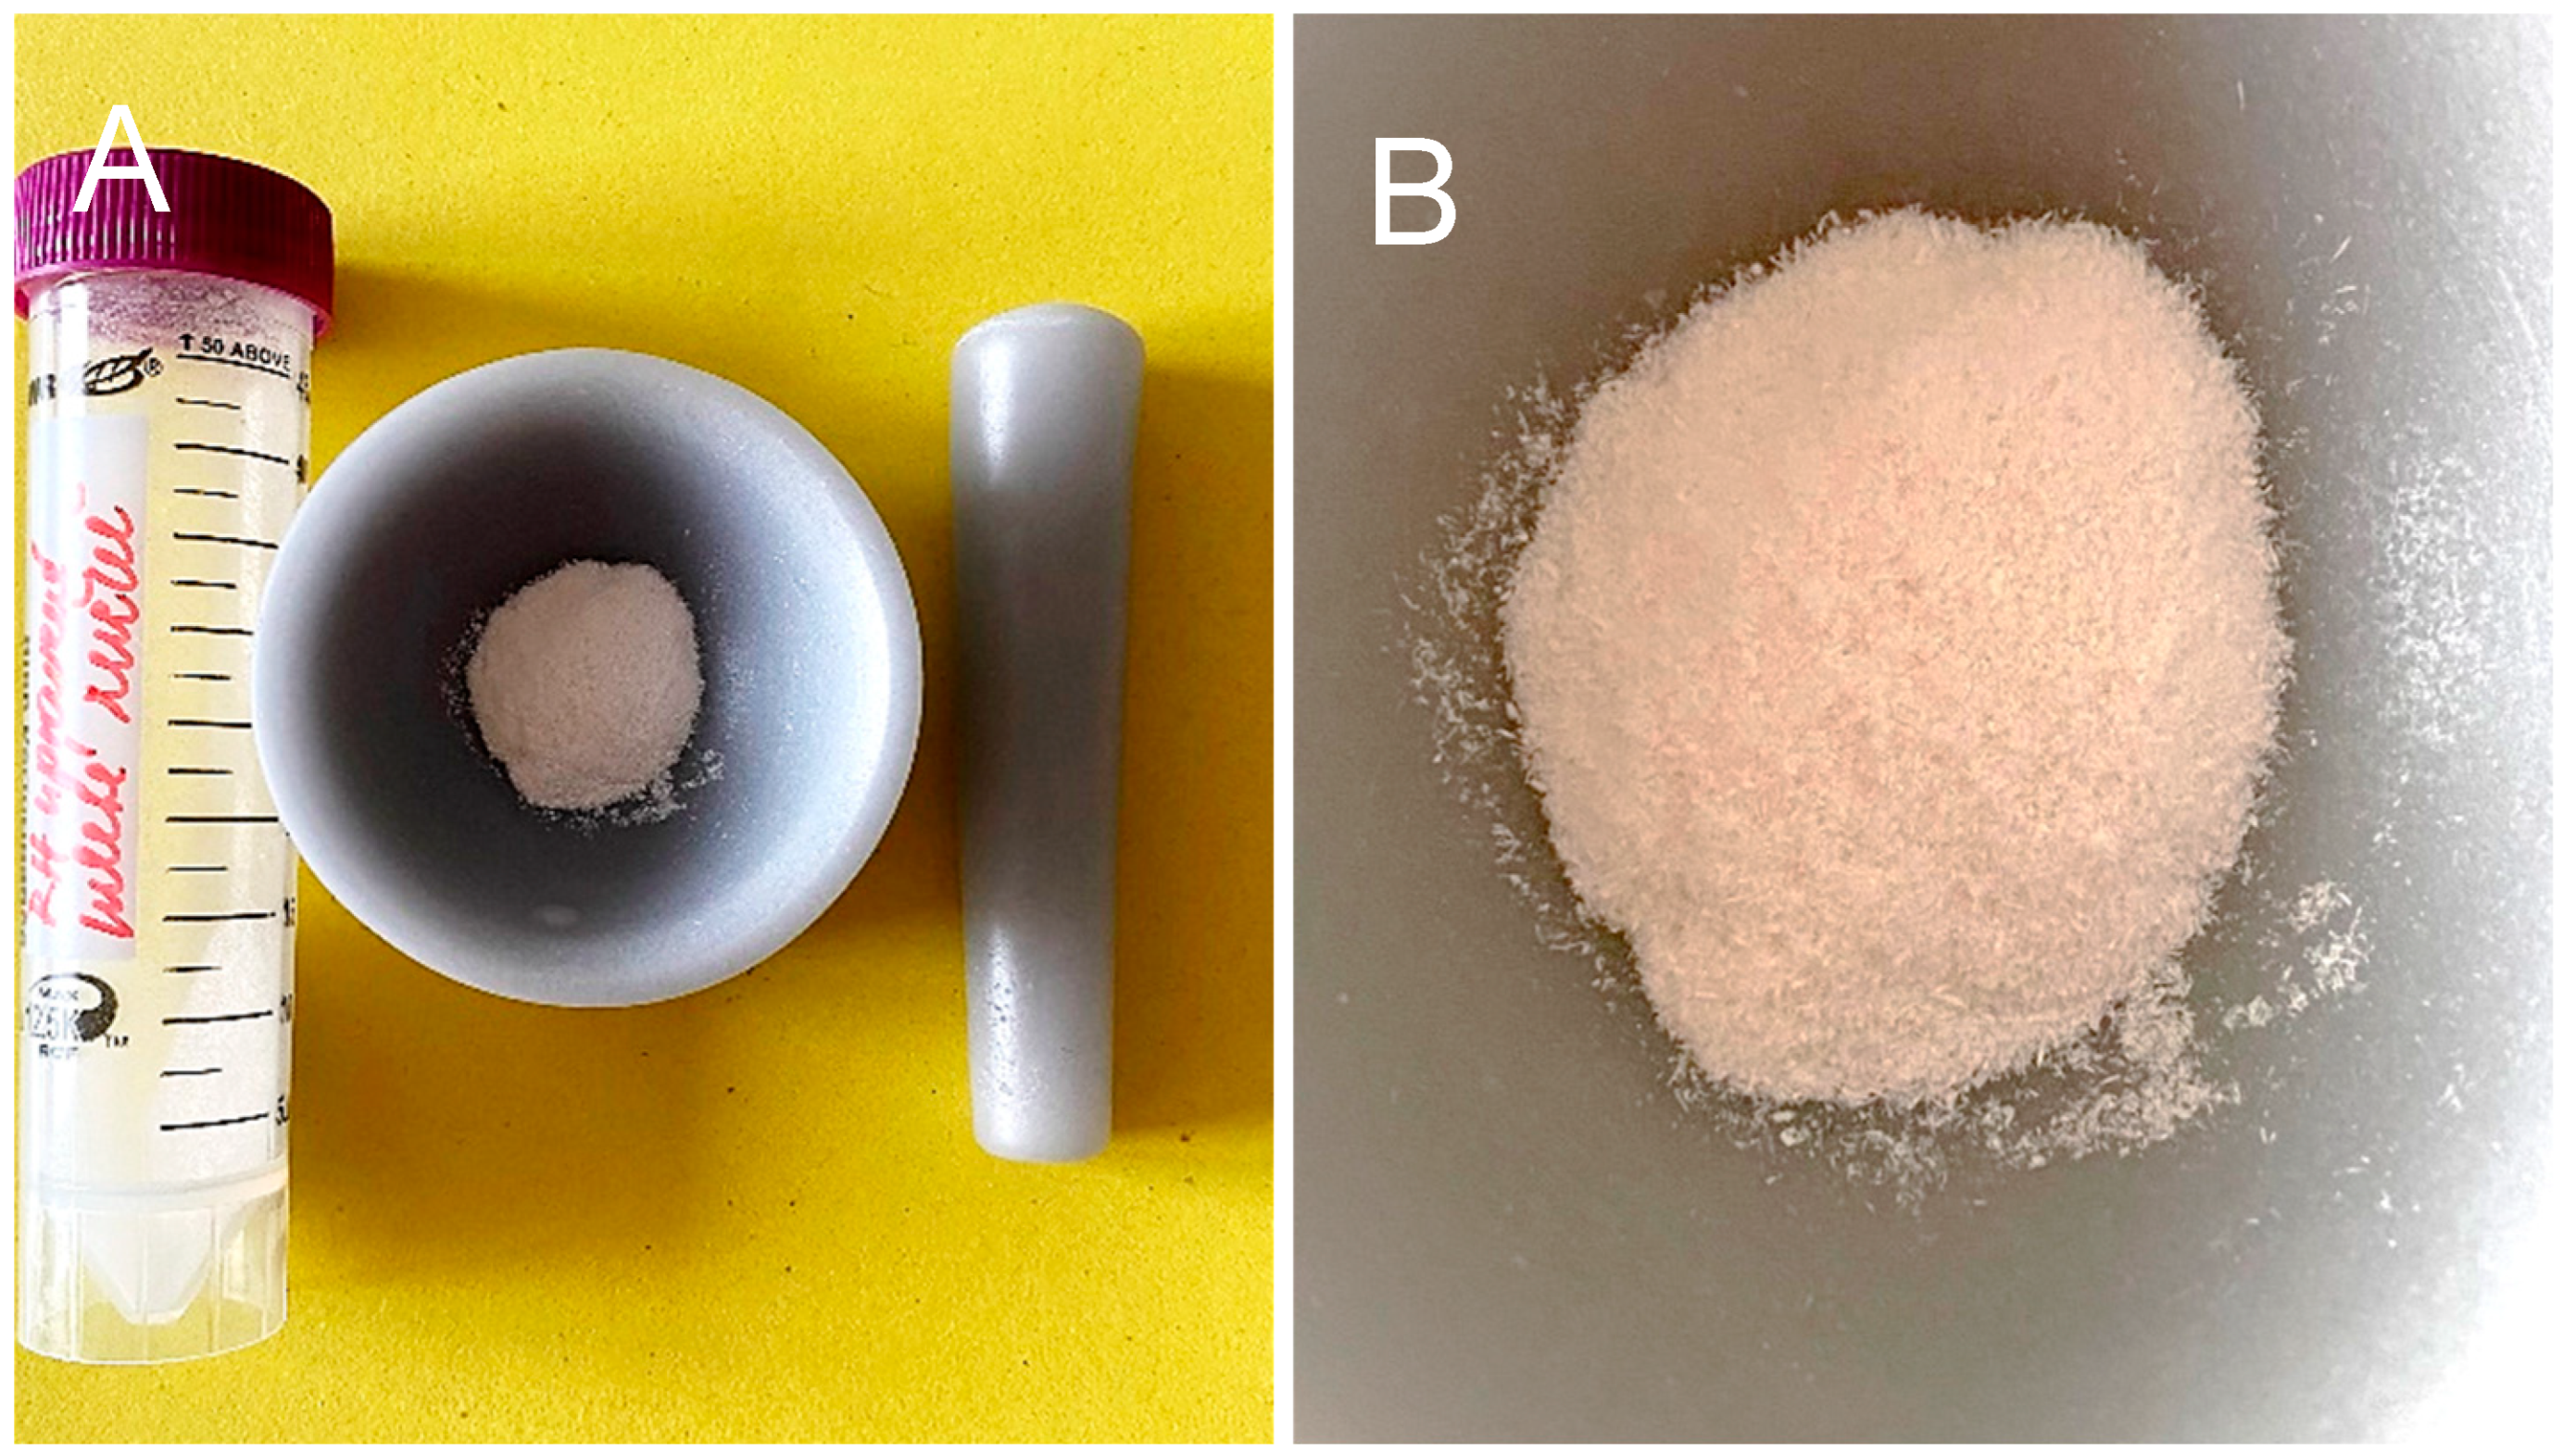
- RHUR—Treated rice husk hand milled
- RHUM—Treated rice husk ball mill milled
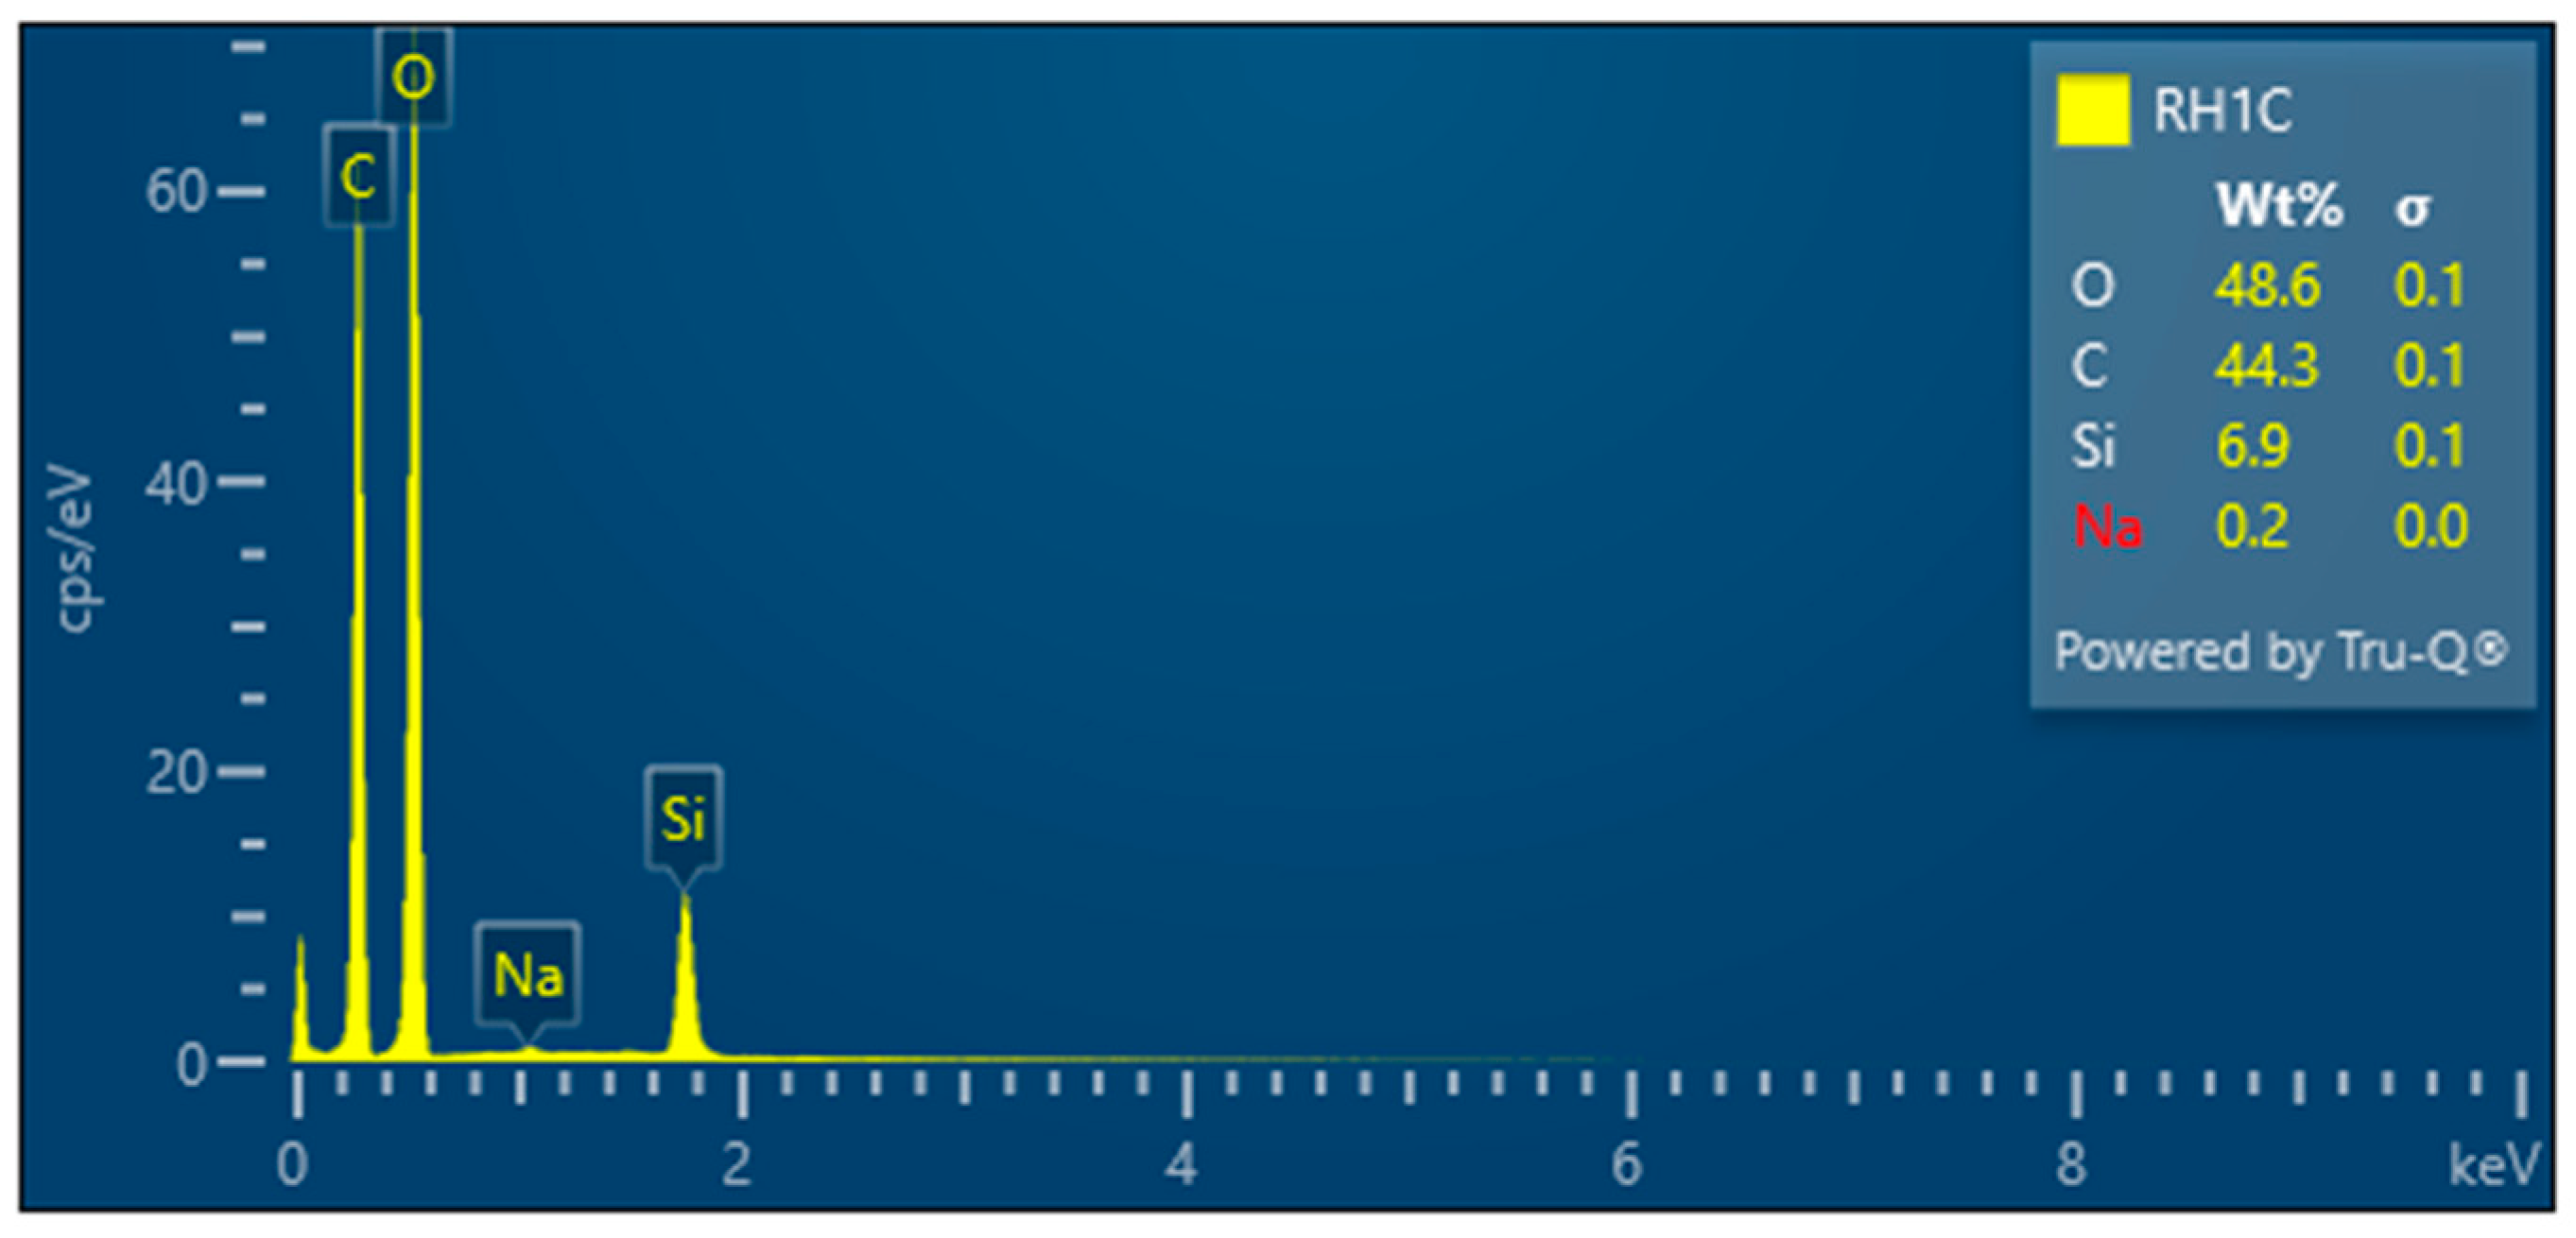
- RH1C—Treated rice husk wet ground, 1 cycle
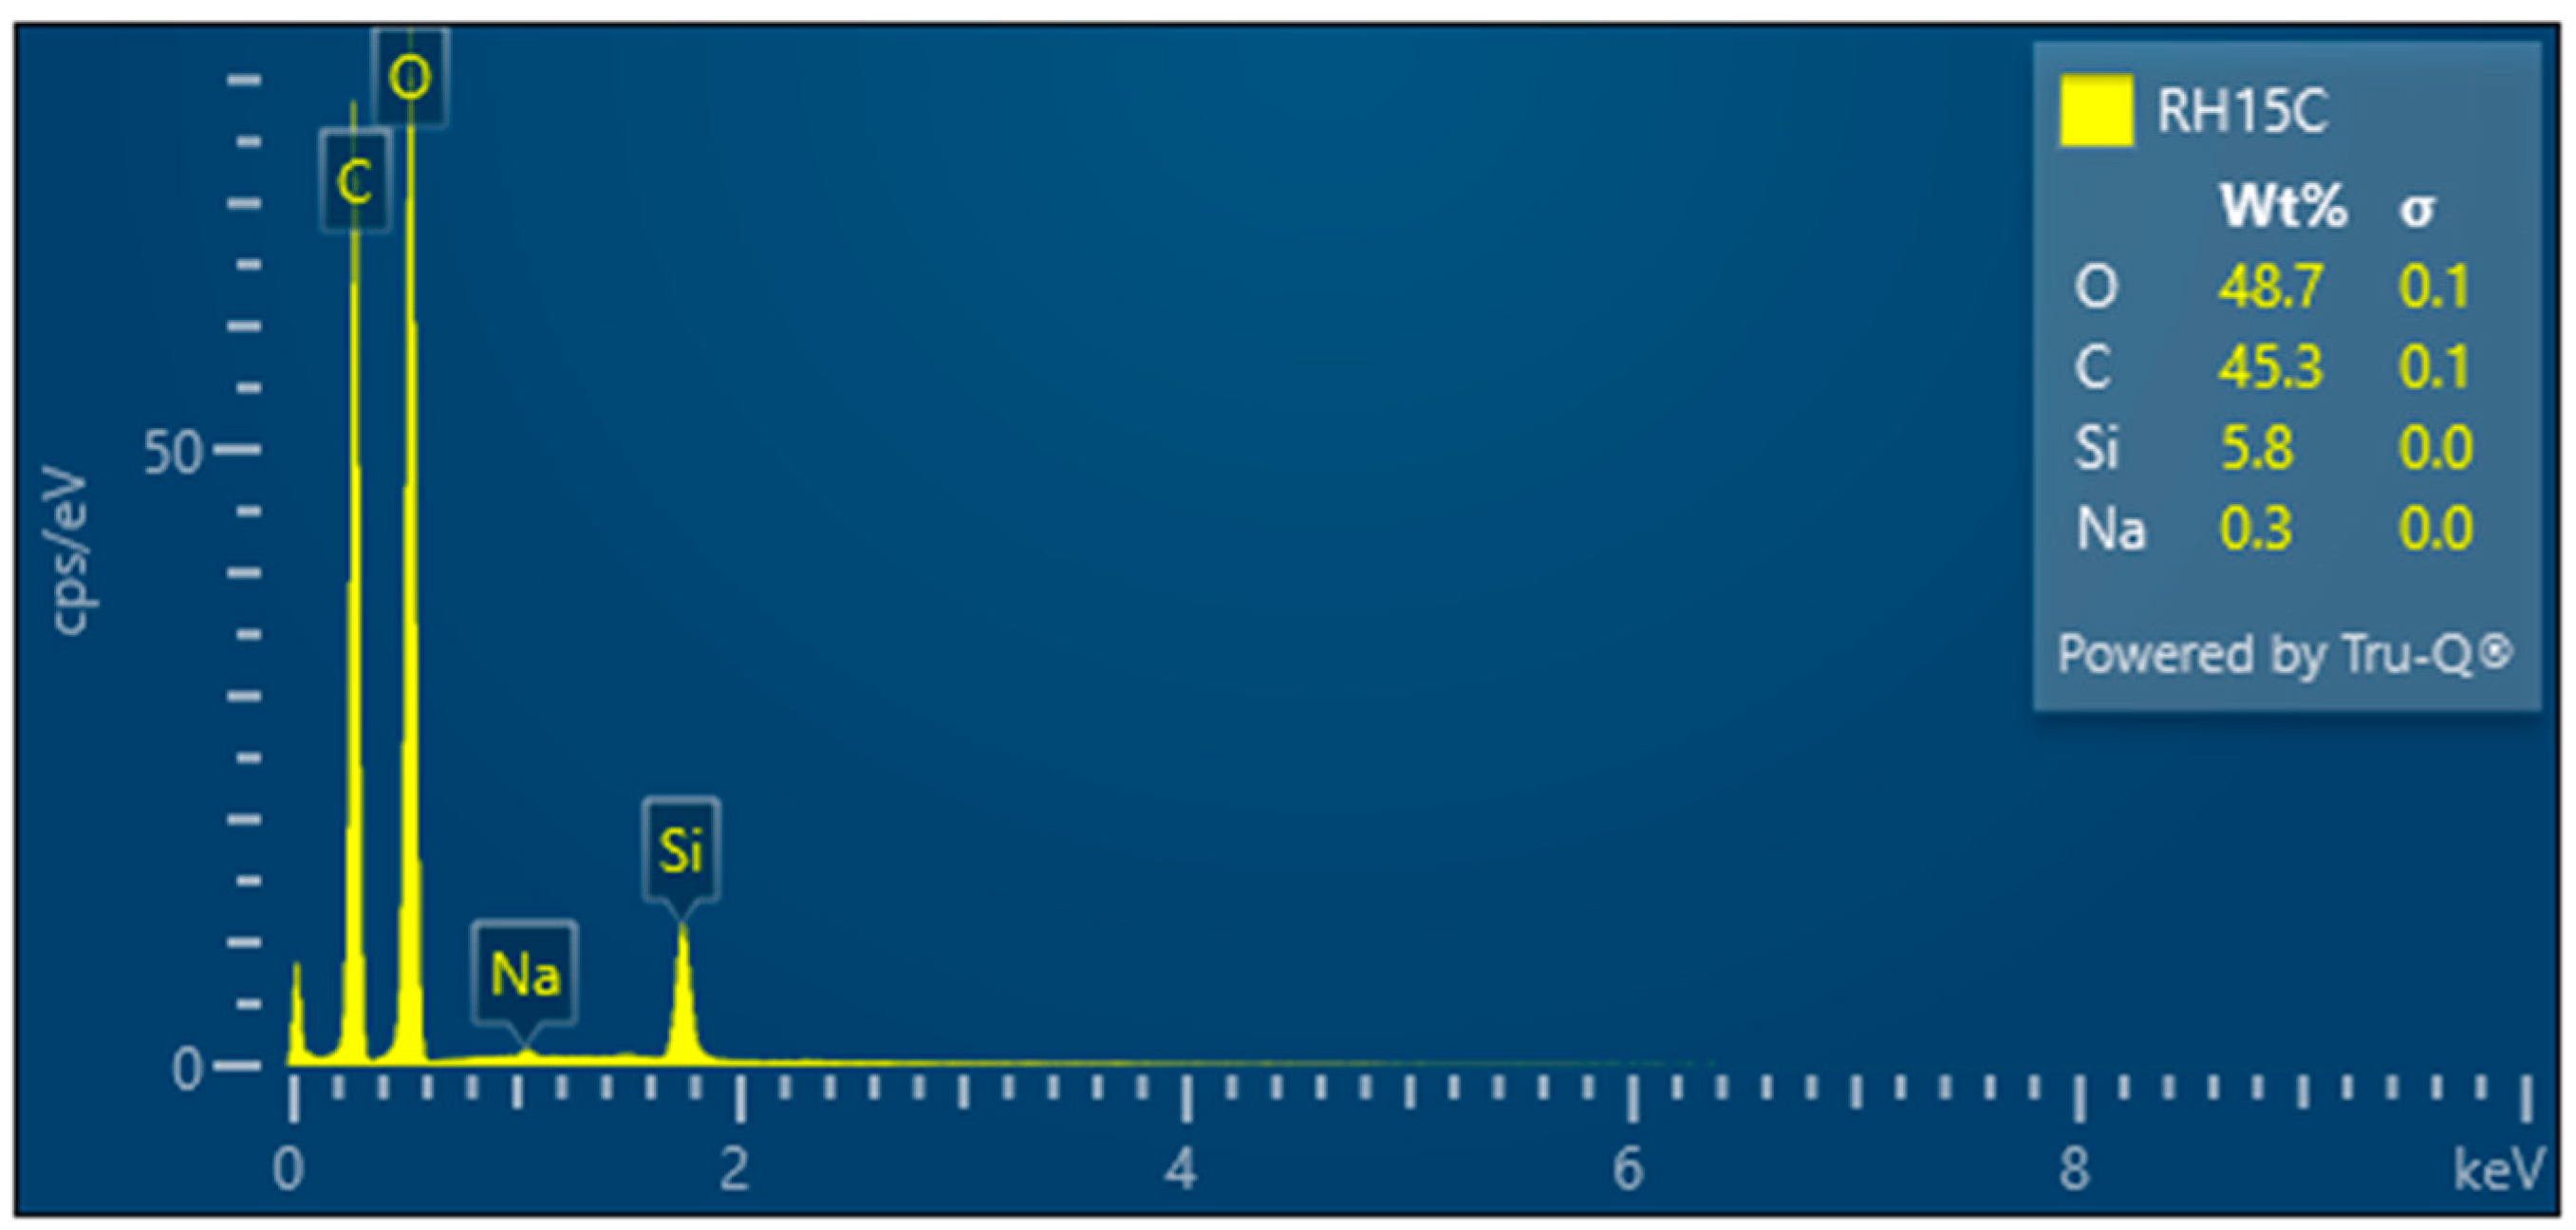
- RH15C—Treated rice husk wet ground, 15 cycles
3.2. TEM
3.3. FTIR
3.4. DSC
3.5. TGA
4. Conclusions
Author Contributions
Funding
Institutional Review Board Statement
Data Availability Statement
Conflicts of Interest
References
- FAOSTAT. Available online: https://www.fao.org/faostat/en/#data/QCL (accessed on 25 August 2024).
- Oliveira, J.P.D.; Bruni, G.P.; Lima, K.O.; Halal, S.L.M.E.; Rosa, G.S.D.; Dias, A.R.G.; Zavareze, E.D.R. Cellulose Fibers Extracted from Rice and Oat Husks and Their Application in Hydrogel. Food Chem. 2017, 221, 153–160. [Google Scholar] [CrossRef]
- Kroisová, D.; Dvořáčková, Š.; Yahya, R.; Kůsa, P. Rice Husks-Potential Source of Cellulose Microfibers/Nanofibers and Biogenic Silicon Dioxide Nanoparticles. In Key Engineering Materials; Trans Tech Publication Ltd.: Wollerau, Swirtzerland, 2022; Volume 927, pp. 149–153. [Google Scholar]
- Thomas, B.; Raj, M.C.; Joy, J.; Moores, A.; Drisko, G.L.; Sanchez, C. Nanocellulose, a Versatile Green Platform: From Biosources to Materials and Their Applications. Chem. Rev. 2018, 118, 11575–11625. [Google Scholar] [CrossRef]
- Marchessault, R.H.; Sundararajan, P.R. Cellulose. In The polysaccharides; Elsevier: Amsterdam, The Netherlands, 1983; pp. 11–95. [Google Scholar]
- Zulaikha, W.; Hassan, M.Z.; Ismail, Z. Recent Development of Natural Fibre for Nanocellulose Extraction and Application. Mater. Today Proc. 2022, 66, 2265–2273. [Google Scholar] [CrossRef]
- Heinze, T. Cellulose: Structure and Properties. In Cellulose Chemistry and Properties: Fibers, Nanocelluloses and Advanced Materials; Springer: Cham, Switzerland, 2015; pp. 1–52. [Google Scholar]
- Mutwil, M.; Debolt, S.; Persson, S. Cellulose Synthesis: A Complex Complex. Curr. Opin. Plant Biol. 2008, 11, 252–257. [Google Scholar] [CrossRef] [PubMed]
- Pinto, J.R. Production of Cellulose-Binding Domains by Proteolysis: Studies on the Adsorption and Modification of Cellulose Fibres. 2007. Available online: https://repositorium.sdum.uminho.pt/handle/1822/8615 (accessed on 25 October 2024).
- Krässig, H.A. Cellulose: Structure, Accessibility and Reactivity; Gordon and Breach Science Publ.: London, UK, 1993; ISBN 2-88124-798-9. [Google Scholar]
- Bhakar, K.; Nemiwal, M.; Kumar, D. Potential Differences between Cellulose Nanocrystal, Microfibrillated Cellulose, and Hairy Cellulose Nanocrystalloid in Water Purification. In Nanocellulose and Its Composites for Water Treatment Application; CRC Press: Boca Raton, FL, USA, 2021; pp. 63–76. ISBN 1-00-304255-4. [Google Scholar]
- Phanthong, P.; Reubroycharoen, P.; Hao, X.; Xu, G.; Abudula, A.; Guan, G. Nanocellulose: Extraction and Application. Carbon Resour. Convers. 2018, 1, 32–43. [Google Scholar] [CrossRef]
- Koshani, R.; Eiyegbenin, J.E.; Wang, Y.; Van De Ven, T.G.M. Synthesis and Characterization of Hairy Aminated Nanocrystalline Cellulose. J. Colloid Interface Sci. 2022, 607, 134–144. [Google Scholar] [CrossRef]
- Kumar, S.; Ngasainao, M.R.; Sharma, D.; Sengar, M.; Gahlot, A.P.S.; Shukla, S.; Kumari, P. Contemporary Nanocellulose-Composites: A New Paradigm for Sensing Applications. Carbohydr. Polym. 2022, 298, 120052. [Google Scholar] [CrossRef] [PubMed]
- Kargarzadeh, H.; Ioelovich, M.; Ahmad, I.; Thomas, S.; Dufresne, A. Methods for Extraction of Nanocellulose from Various Sources. Handb. Nanocellul. Cellul. Nanocompos. 2017, 1, 1–49. [Google Scholar]
- Yahya, R.; Kroisová, D.; Knap, A.; Dvořáčková, Š. Effect of micro–and nano-fillers on the coefficient of thermal expansion of composite systems with potential applications in stomatology. In Proceedings of the 14th International Conference on Nanomaterials—Research & Application, Brno, Czech Republic, 19–21 October 2022; pp. 216–222. [Google Scholar]
- Shen, Y. Rice Husk Silica Derived Nanomaterials for Sustainable Applications. Renew. Sustain. Energy Rev. 2017, 80, 453–466. [Google Scholar] [CrossRef]
- Battegazzore, D.; Bocchini, S.; Alongi, J.; Frache, A.; Marino, F. Cellulose Extracted from Rice Husk as Filler for Poly (Lactic Acid): Preparation and Characterization. Cellulose 2014, 21, 1813–1821. [Google Scholar] [CrossRef]
- Wang, Z.; Han, E.; Ke, W. Effect of Acrylic Polymer and Nanocomposite with Nano-SiO2 on Thermal Degradation and Fire Resistance of APP–DPER–MEL Coating. Polym. Degrad. Stab. 2006, 91, 1937–1947. [Google Scholar] [CrossRef]
- Cruz, G.; Braz, C.E.; Ferreira, S.L.; dos Santos, A.M.; Crnkovic, P.M. Physicochemical Properties of Brazilian Biomasses: Potential Applications as Renewable Energy Source. In Proceedings of the 22nd International Congress of Mechanical Engineering, Ribeirao Preto, Brasil, 3–7 November 2013; pp. 10072–10084. [Google Scholar]
- El Nemr, A.; Eleryan, A.; Mashaly, M.; Khaled, A. Comparative Study of Synthesis of Cellulose Propionate from Different Sources Using NIS as a New Catalyst. Polym. Bull. 2021, 78, 4369–4386. [Google Scholar] [CrossRef]
- Trisnawati, L.; Helmiyati, H. Cellulose-Fe3O4 Nanocomposite Based on Rice Husk as Catalyst for Synthesis of Methyl Ester from Waste Cooking Oil. IOP Conf. Ser. Mater. Sci. Eng. 2020, 763, 012012. [Google Scholar] [CrossRef]
- Prasetyoko, D.; Ramli, Z.; Endud, S.; Hamdan, H.; Sulikowski, B. Conversion of Rice Husk Ash to Zeolite Beta. Waste Manag. 2006, 26, 1173–1179. [Google Scholar] [CrossRef]
- Battegazzore, D.; Bocchini, S.; Alongi, J.; Frache, A. Rice Husk as Bio-Source of Silica: Preparation and Characterization of PLA–Silica Bio-Composites. RSC Adv. 2014, 4, 54703–54712. [Google Scholar] [CrossRef]
- Li, J.; Zhang, L.-P.; Peng, F.; Bian, J.; Yuan, T.-Q.; Xu, F.; Sun, R.-C. Microwave-Assisted Solvent-Free Acetylation of Cellulose with Acetic Anhydride in the Presence of Iodine as a Catalyst. Molecules 2009, 14, 3551–3566. [Google Scholar] [CrossRef]
- Driscoll, K.E.; Guthrie, G.D. Crystalline Silica and Silicosis. In Comprehensive Toxicology; Elsevier: Amsterdam, The Netherlands, 2010; pp. 331–350. ISBN 978-0-08-046884-6. [Google Scholar]
- Di Febo, R.; Casas, L.; Del Campo, Á.A.; Rius, J.; Vallcorba, O.; Melgarejo, J.C.; Capelli, C. Recognizing and Understanding Silica-Polymorph Microcrystals in Ceramic Glazes. J. Eur. Ceram. Soc. 2020, 40, 6188–6199. [Google Scholar] [CrossRef]
- Lee, T.; Othman, R.; Yeoh, F.-Y. Development of Photoluminescent Glass Derived from Rice Husk. Biomass Bioenergy 2013, 59, 380–392. [Google Scholar] [CrossRef]
- Yang, H.; Yan, R.; Chen, H.; Lee, D.H.; Zheng, C. Characteristics of Hemicellulose, Cellulose and Lignin Pyrolysis. Fuel 2007, 86, 1781–1788. [Google Scholar] [CrossRef]
- Zou, Y.; Yang, T. Rice Husk, Rice Husk Ash and Their Applications. In Rice Bran and Rice Bran Oil; Elsevier: Amsterdam, The Netherlands, 2019; pp. 207–246. [Google Scholar]
- Yue, Y. A Comparative Study of Cellulose I and II and Fibers and Nanocrystals; Louisiana State University and Agricultural & Mechanical College: Baton Rouge, LA, USA, 2011; ISBN 9798819303412. [Google Scholar]
- Shimazaki, Y.; Miyazaki, Y.; Takezawa, Y.; Nogi, M.; Abe, K.; Ifuku, S.; Yano, H. Excellent Thermal Conductivity of Transparent Cellulose Nanofiber/Epoxy Resin Nanocomposites. Biomacromolecules 2007, 8, 2976–2978. [Google Scholar] [CrossRef]
- Lu, P.; Hsieh, Y.-L. Preparation and Properties of Cellulose Nanocrystals: Rods, Spheres, and Network. Carbohydr. Polym. 2010, 82, 329–336. [Google Scholar] [CrossRef]


| Abbreviation | Definition | Sample |
|---|---|---|
| RHU | Treated rice husks | SAMPLE 1&2 |
| RHUM | Treated, ball mill milled | SAMPLE 3 |
| RH1C | Treated, wet ground 1 cycle | - |
| RH5C | Treated, wet ground 5 cycles | - |
| RH10C | Treated, wet ground 10 cycles | - |
| RH15C | Treated, wet ground 15 cycles | SAMPLE 4A & 4B & 4C |
| RHUR | Treated, hand-milled | SAMPLE 5 |
| RHS 1 | Untreated rice husks | SAMPLE 6 |
| Sample | Weight Proportion Si [%] |
|---|---|
| RHS | 24.8 |
| RHU | 31.8 |
| RHUR | 34.6 |
| RHUM | 18.8 |
| RH1C | 6.9 |
| RH5C | 6.9 |
| RH10C | 16.6 |
| RH15C | 5.8 |
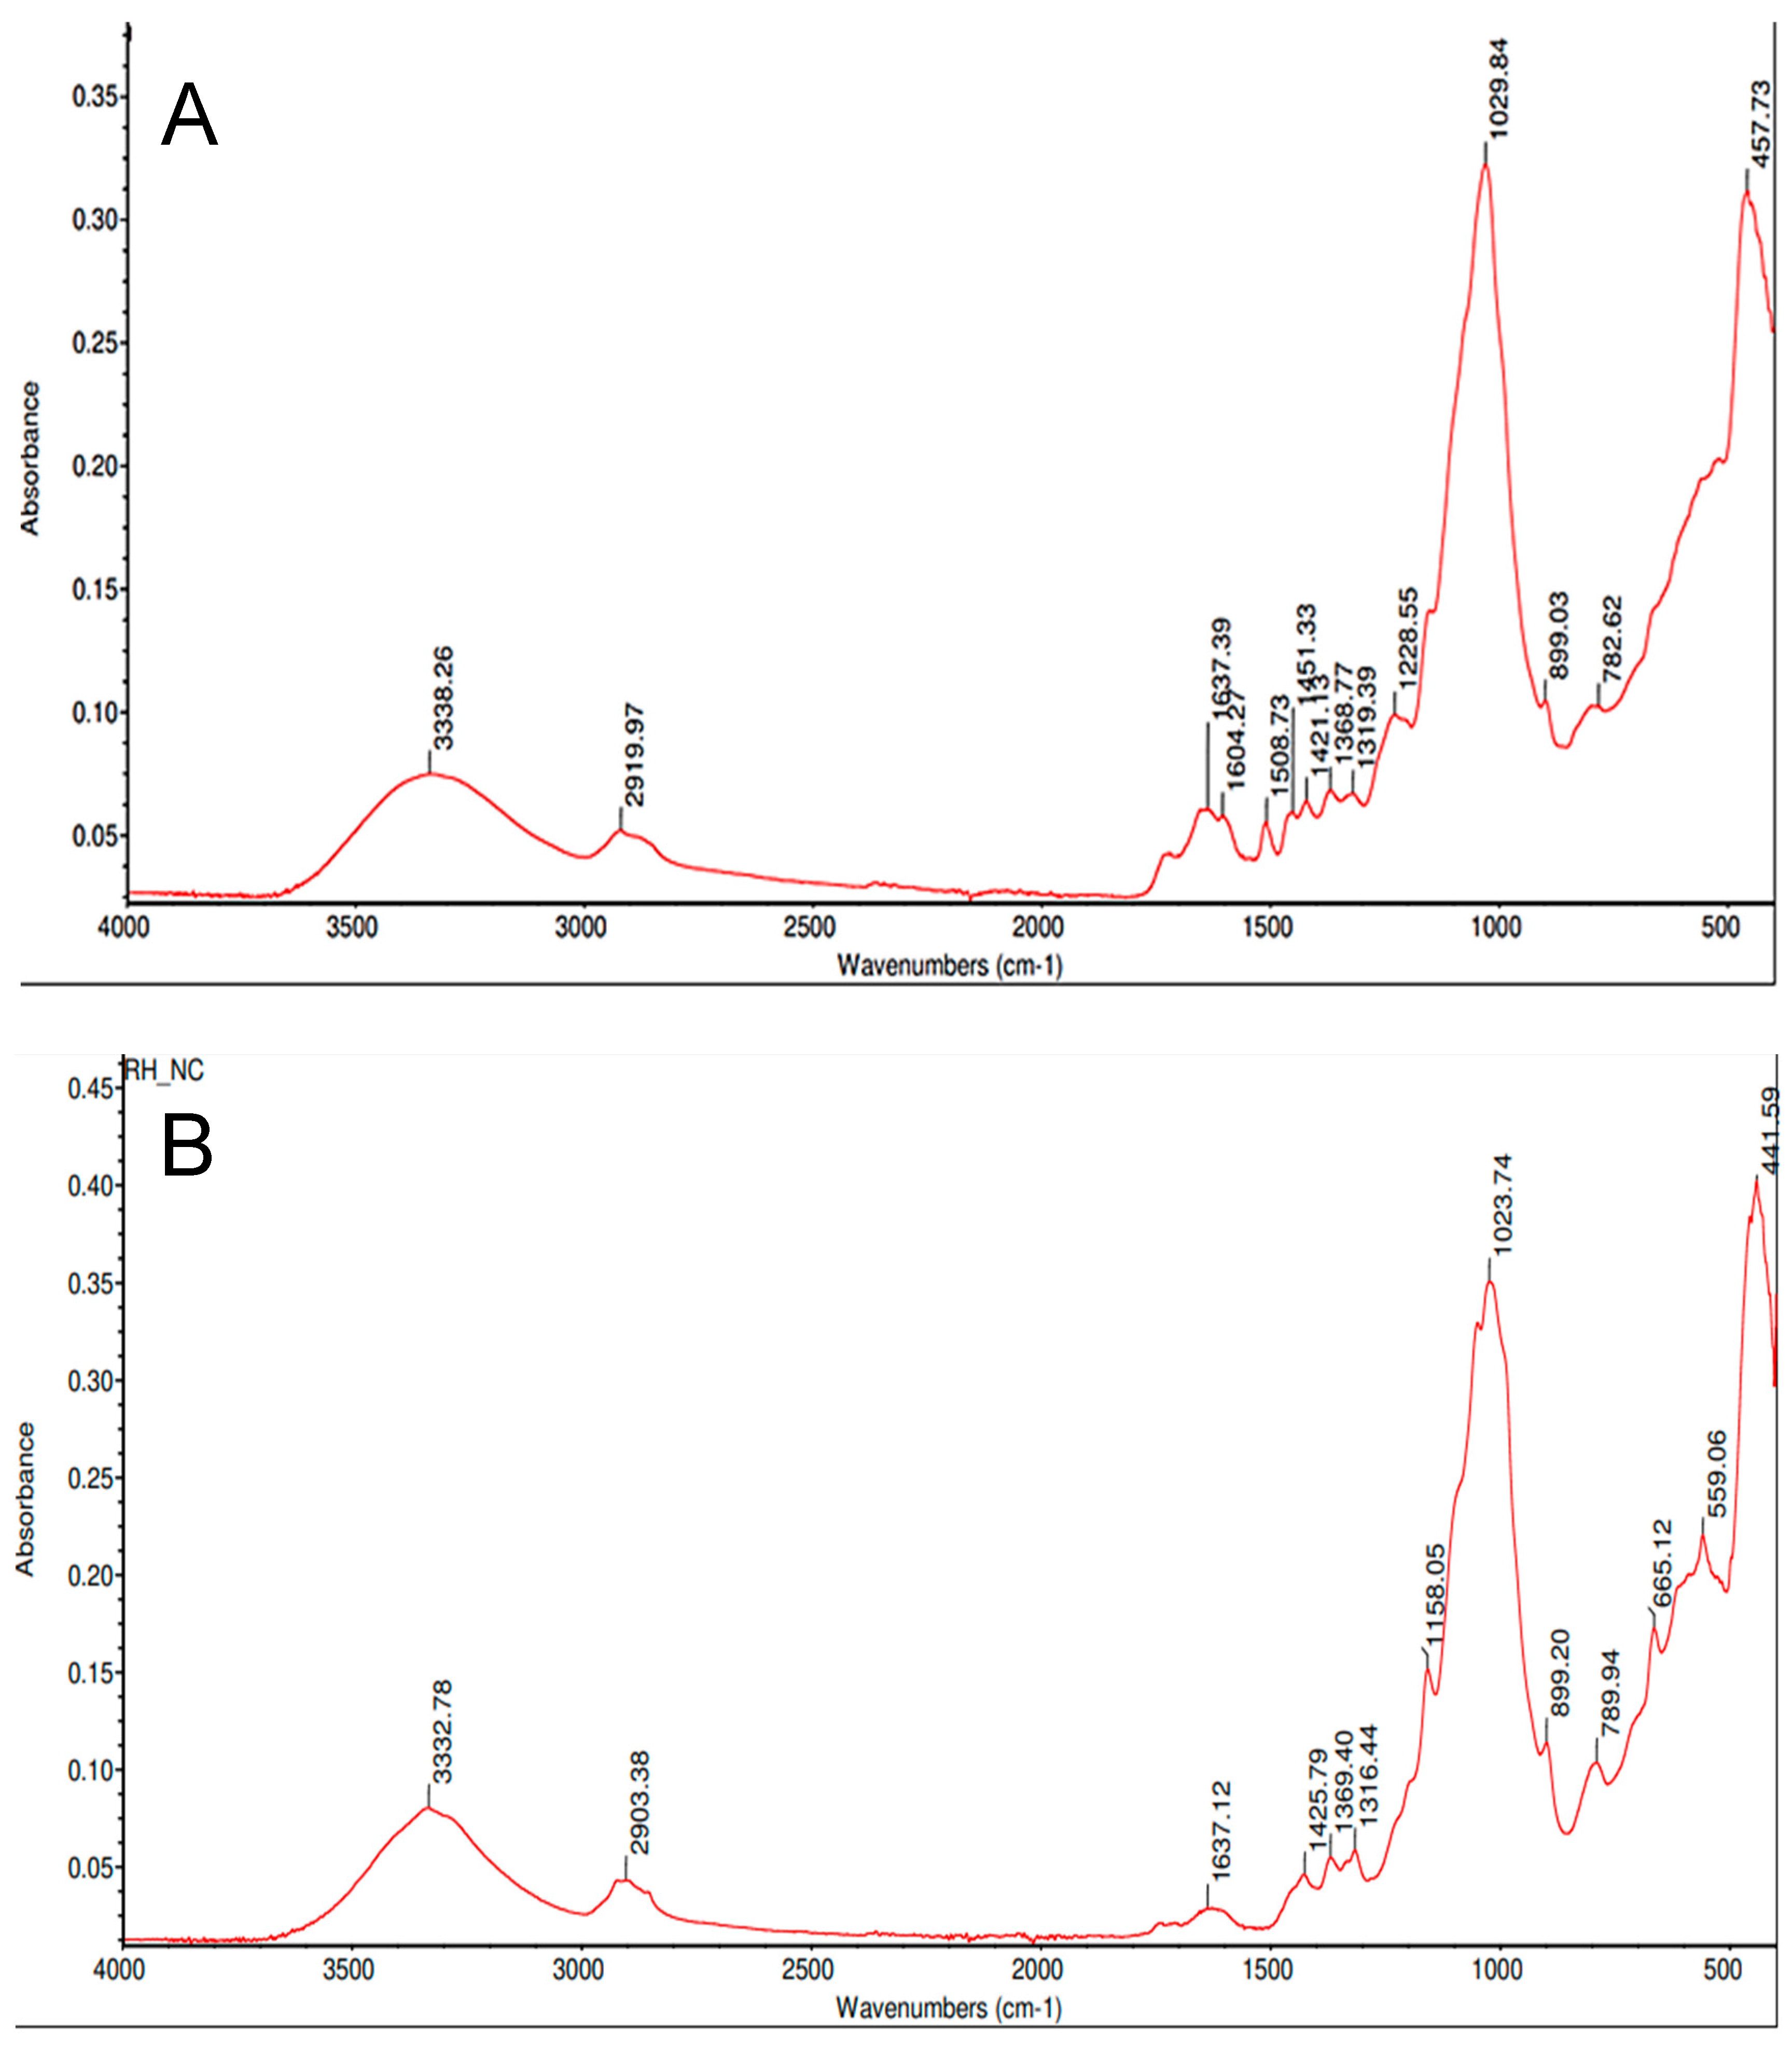
| Absorption Value | Identification |
|---|---|
| 3333 | Stretching of hydroxyl groups |
| 2903 | C-H stretching |
| 1637 | H-O-H bending of absorbed water |
| 1508 | Vibration of C=C bonds in the aromatic rings of lignin |
| 1369 | O-H bending |
| 1158 | C-O antisymmetric bridge stretching |
| 665 | Crystalline cristobalite |
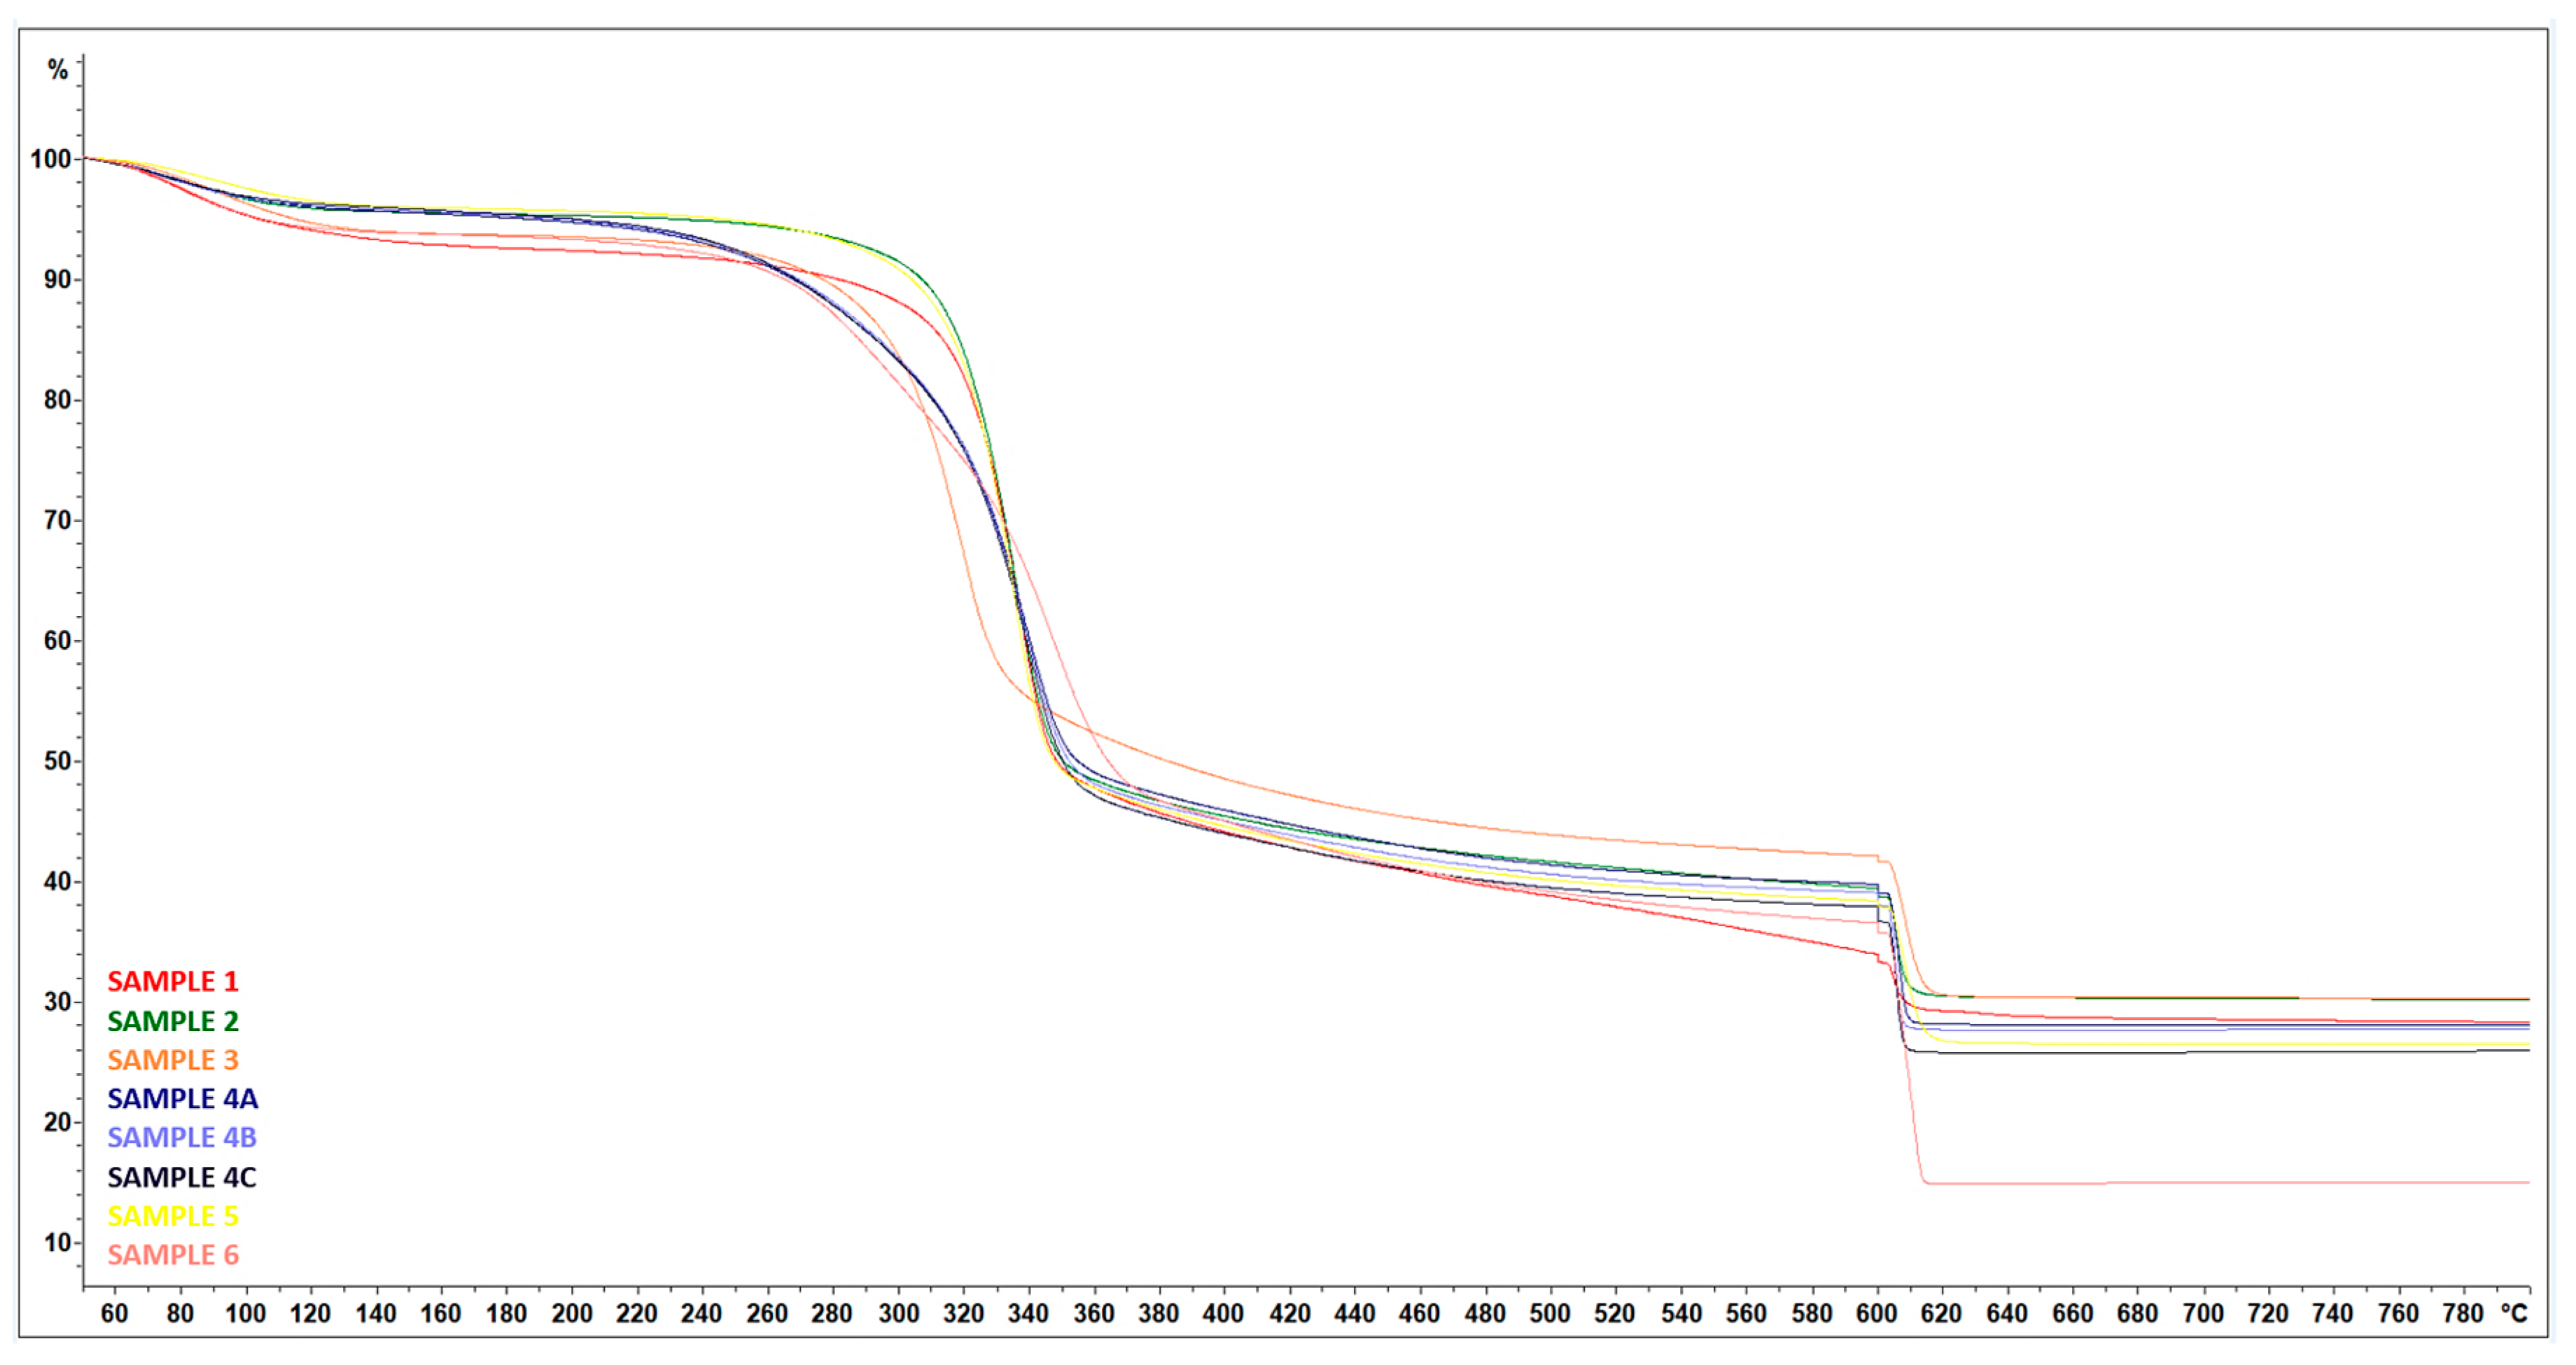
| Samples | Degradation Onset Temperature T0.5 [°C] | Residue [%] |
|---|---|---|
| Untreated | 273.49 | 14.81 |
| Treated | 300.00 | 26.38 |
| SAMPLE 1 | 303.24 | 28.46 |
| SAMPLE 2 | 305.27 | 30.15 |
| SAMPLE 3 | 283.79 | 30.22 |
| SAMPLE 4A | 263.75 | 27.96 |
| SAMPLE 4B | 264.34 | 27.56 |
| SAMPLE 4C | 263.86 | 25.67 |
Disclaimer/Publisher’s Note: The statements, opinions and data contained in all publications are solely those of the individual author(s) and contributor(s) and not of MDPI and/or the editor(s). MDPI and/or the editor(s) disclaim responsibility for any injury to people or property resulting from any ideas, methods, instructions or products referred to in the content. |
© 2025 by the authors. Licensee MDPI, Basel, Switzerland. This article is an open access article distributed under the terms and conditions of the Creative Commons Attribution (CC BY) license (https://creativecommons.org/licenses/by/4.0/).
Share and Cite
Touati, Y.; Kroisová, D.; Yahya, R.; Dvořáčková, Š. Preparation and Characterization of Submicrometer and Nanometer Cellulose Fiber with Biogenic SiO2. Polymers 2025, 17, 761. https://doi.org/10.3390/polym17060761
Touati Y, Kroisová D, Yahya R, Dvořáčková Š. Preparation and Characterization of Submicrometer and Nanometer Cellulose Fiber with Biogenic SiO2. Polymers. 2025; 17(6):761. https://doi.org/10.3390/polym17060761
Chicago/Turabian StyleTouati, Yakoub, Dora Kroisová, Rawaa Yahya, and Štěpánka Dvořáčková. 2025. "Preparation and Characterization of Submicrometer and Nanometer Cellulose Fiber with Biogenic SiO2" Polymers 17, no. 6: 761. https://doi.org/10.3390/polym17060761
APA StyleTouati, Y., Kroisová, D., Yahya, R., & Dvořáčková, Š. (2025). Preparation and Characterization of Submicrometer and Nanometer Cellulose Fiber with Biogenic SiO2. Polymers, 17(6), 761. https://doi.org/10.3390/polym17060761