
Synthesis and Characterization of Novel Non-Isocyanate Polyurethanes Derived from Adipic Acid: A Comprehensive Study


 ,
,  ,
, 
Abstract

1. Introduction
2. Materials and Methods
2.1. Materials
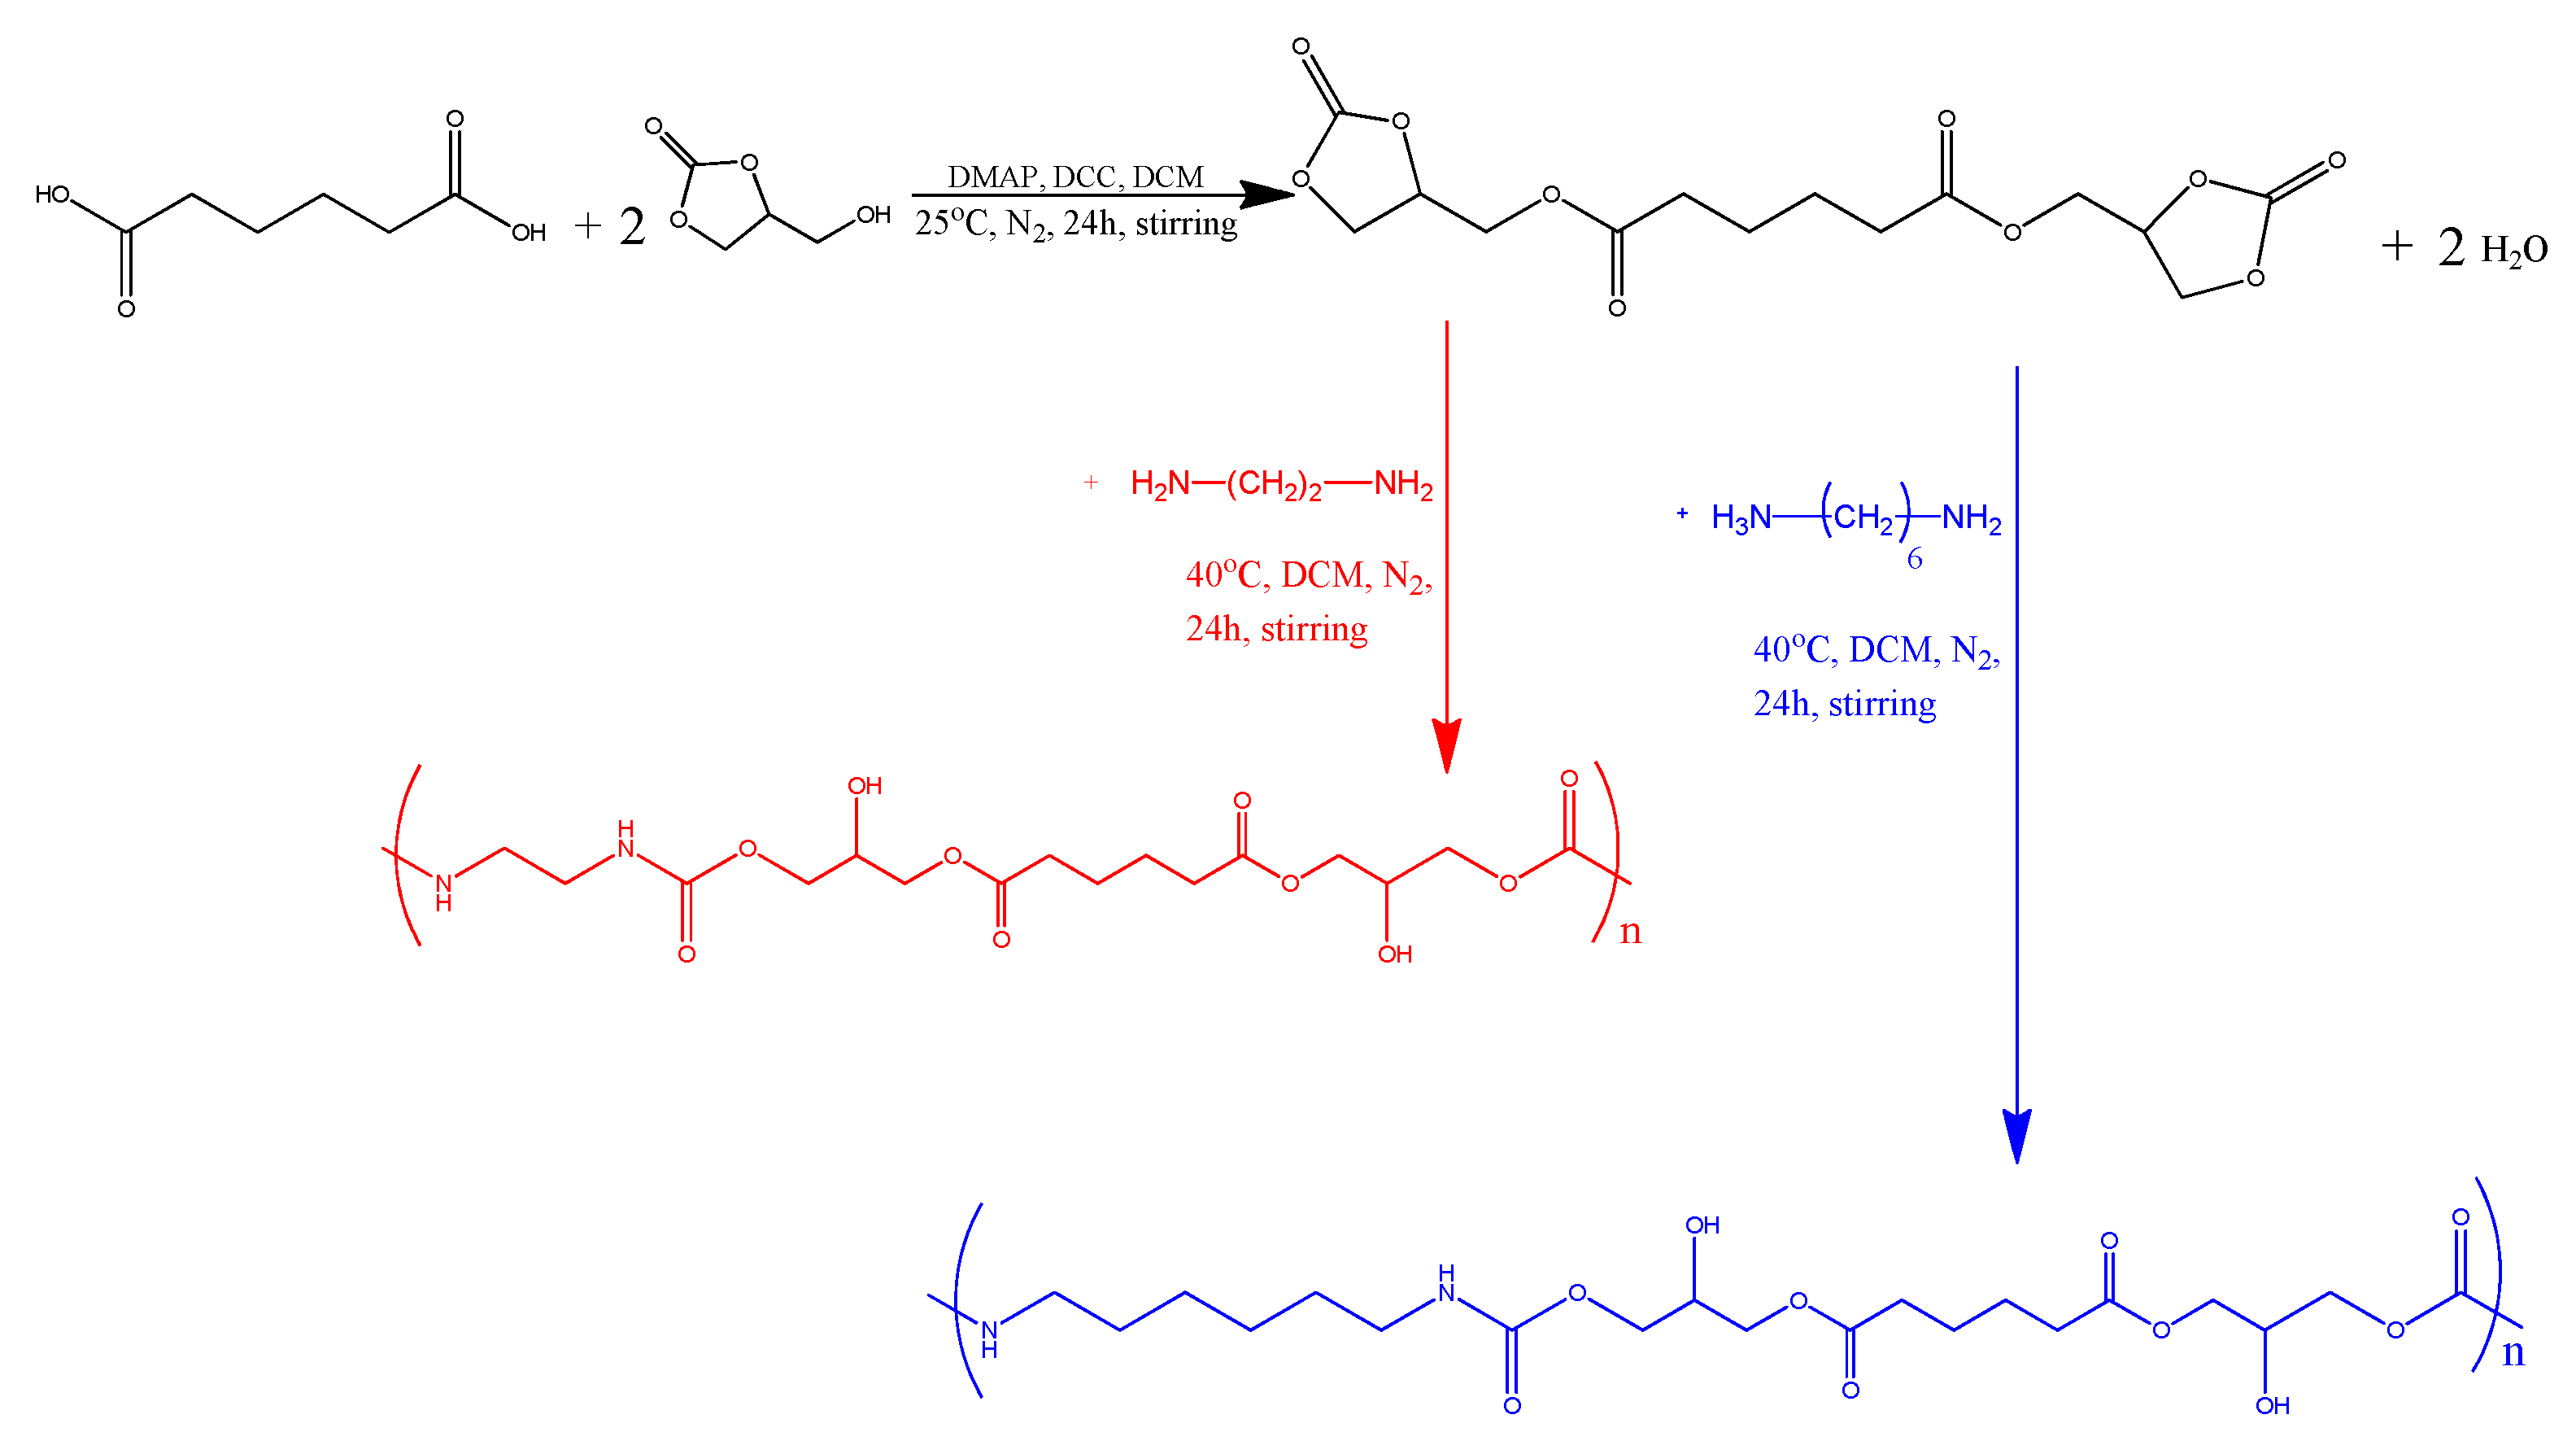
2.2. Synthesis
Synthesis of Adipic-Acid-Based NIPUs
2.3. Characterization of NIPUs
2.3.1. NMR
2.3.2. Fourier-Transform Infrared Spectroscopy (FTIR)
2.3.3. Gel Permeation Chromatography–Size Exclusion Chromatography (GPC/SEC) Analysis
2.3.4. Differential Scanning Calorimetry (DSC)
2.3.5. Broadband Dielectric Spectroscopy
2.3.6. Thermogravimetric Analysis (TGA)
2.3.7. Hydrolysis
2.3.8. Swelling Capacity
2.3.9. Solubility at Various pH Levels
3. Results and Discussion
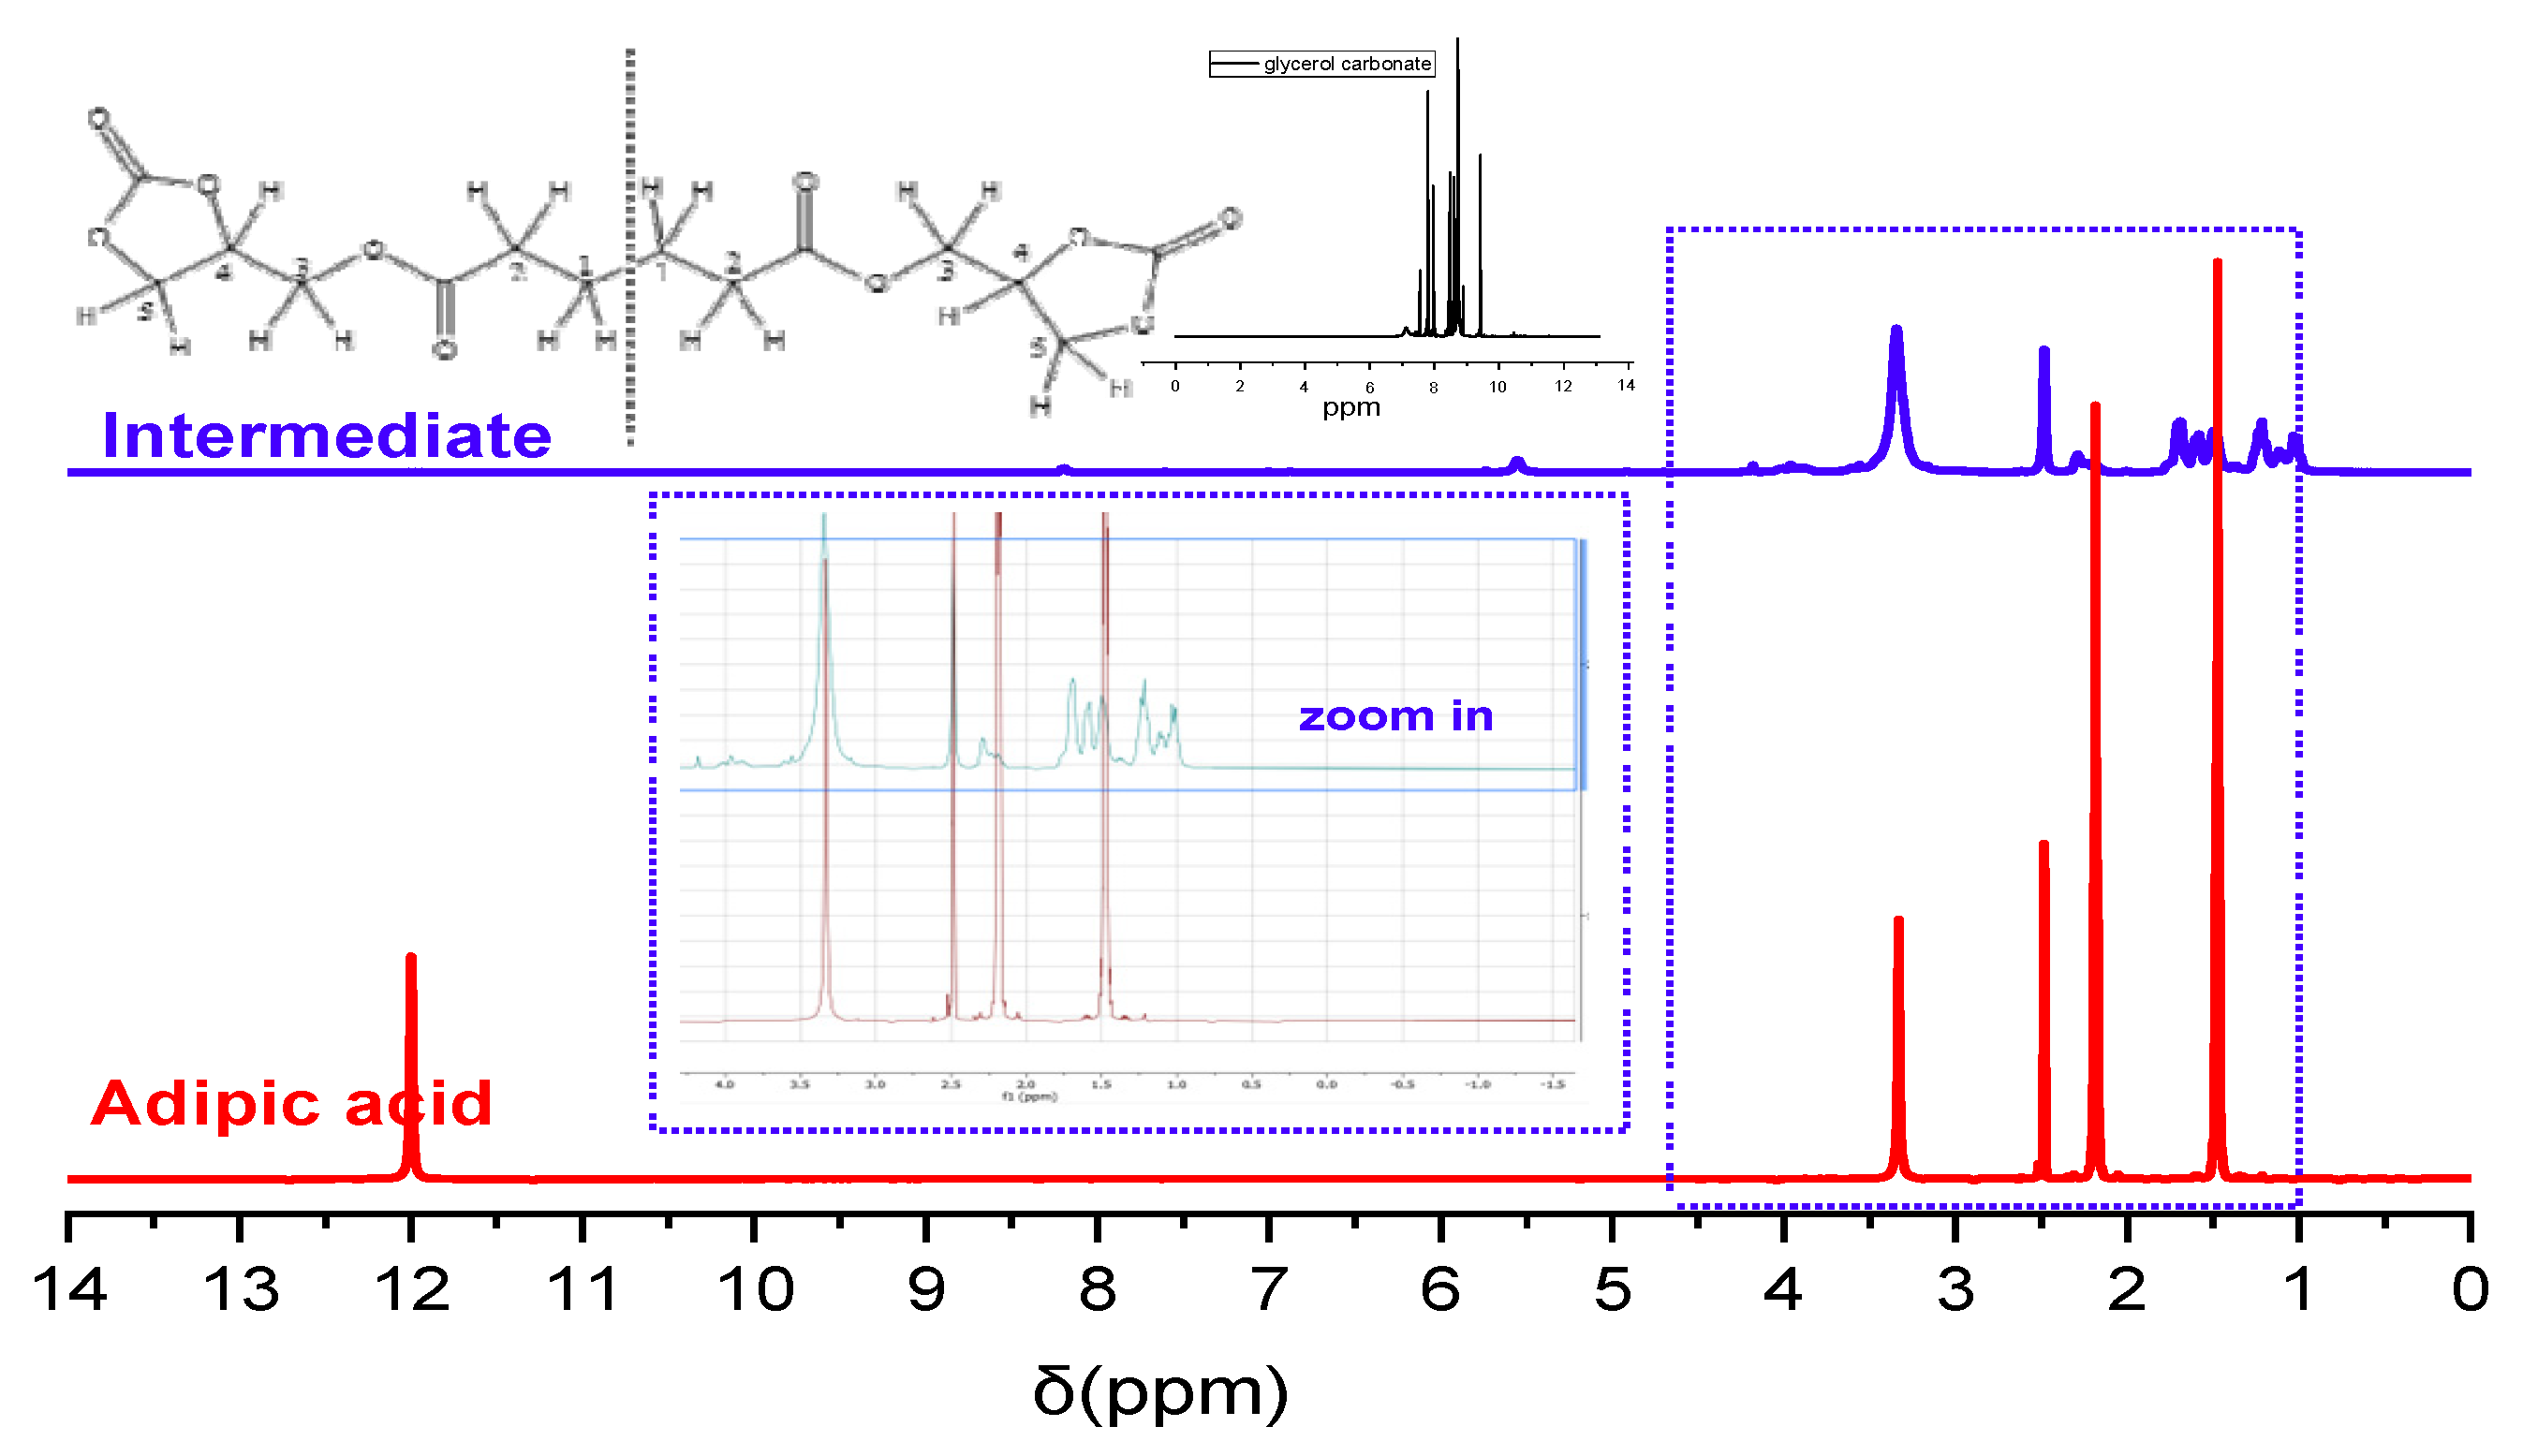
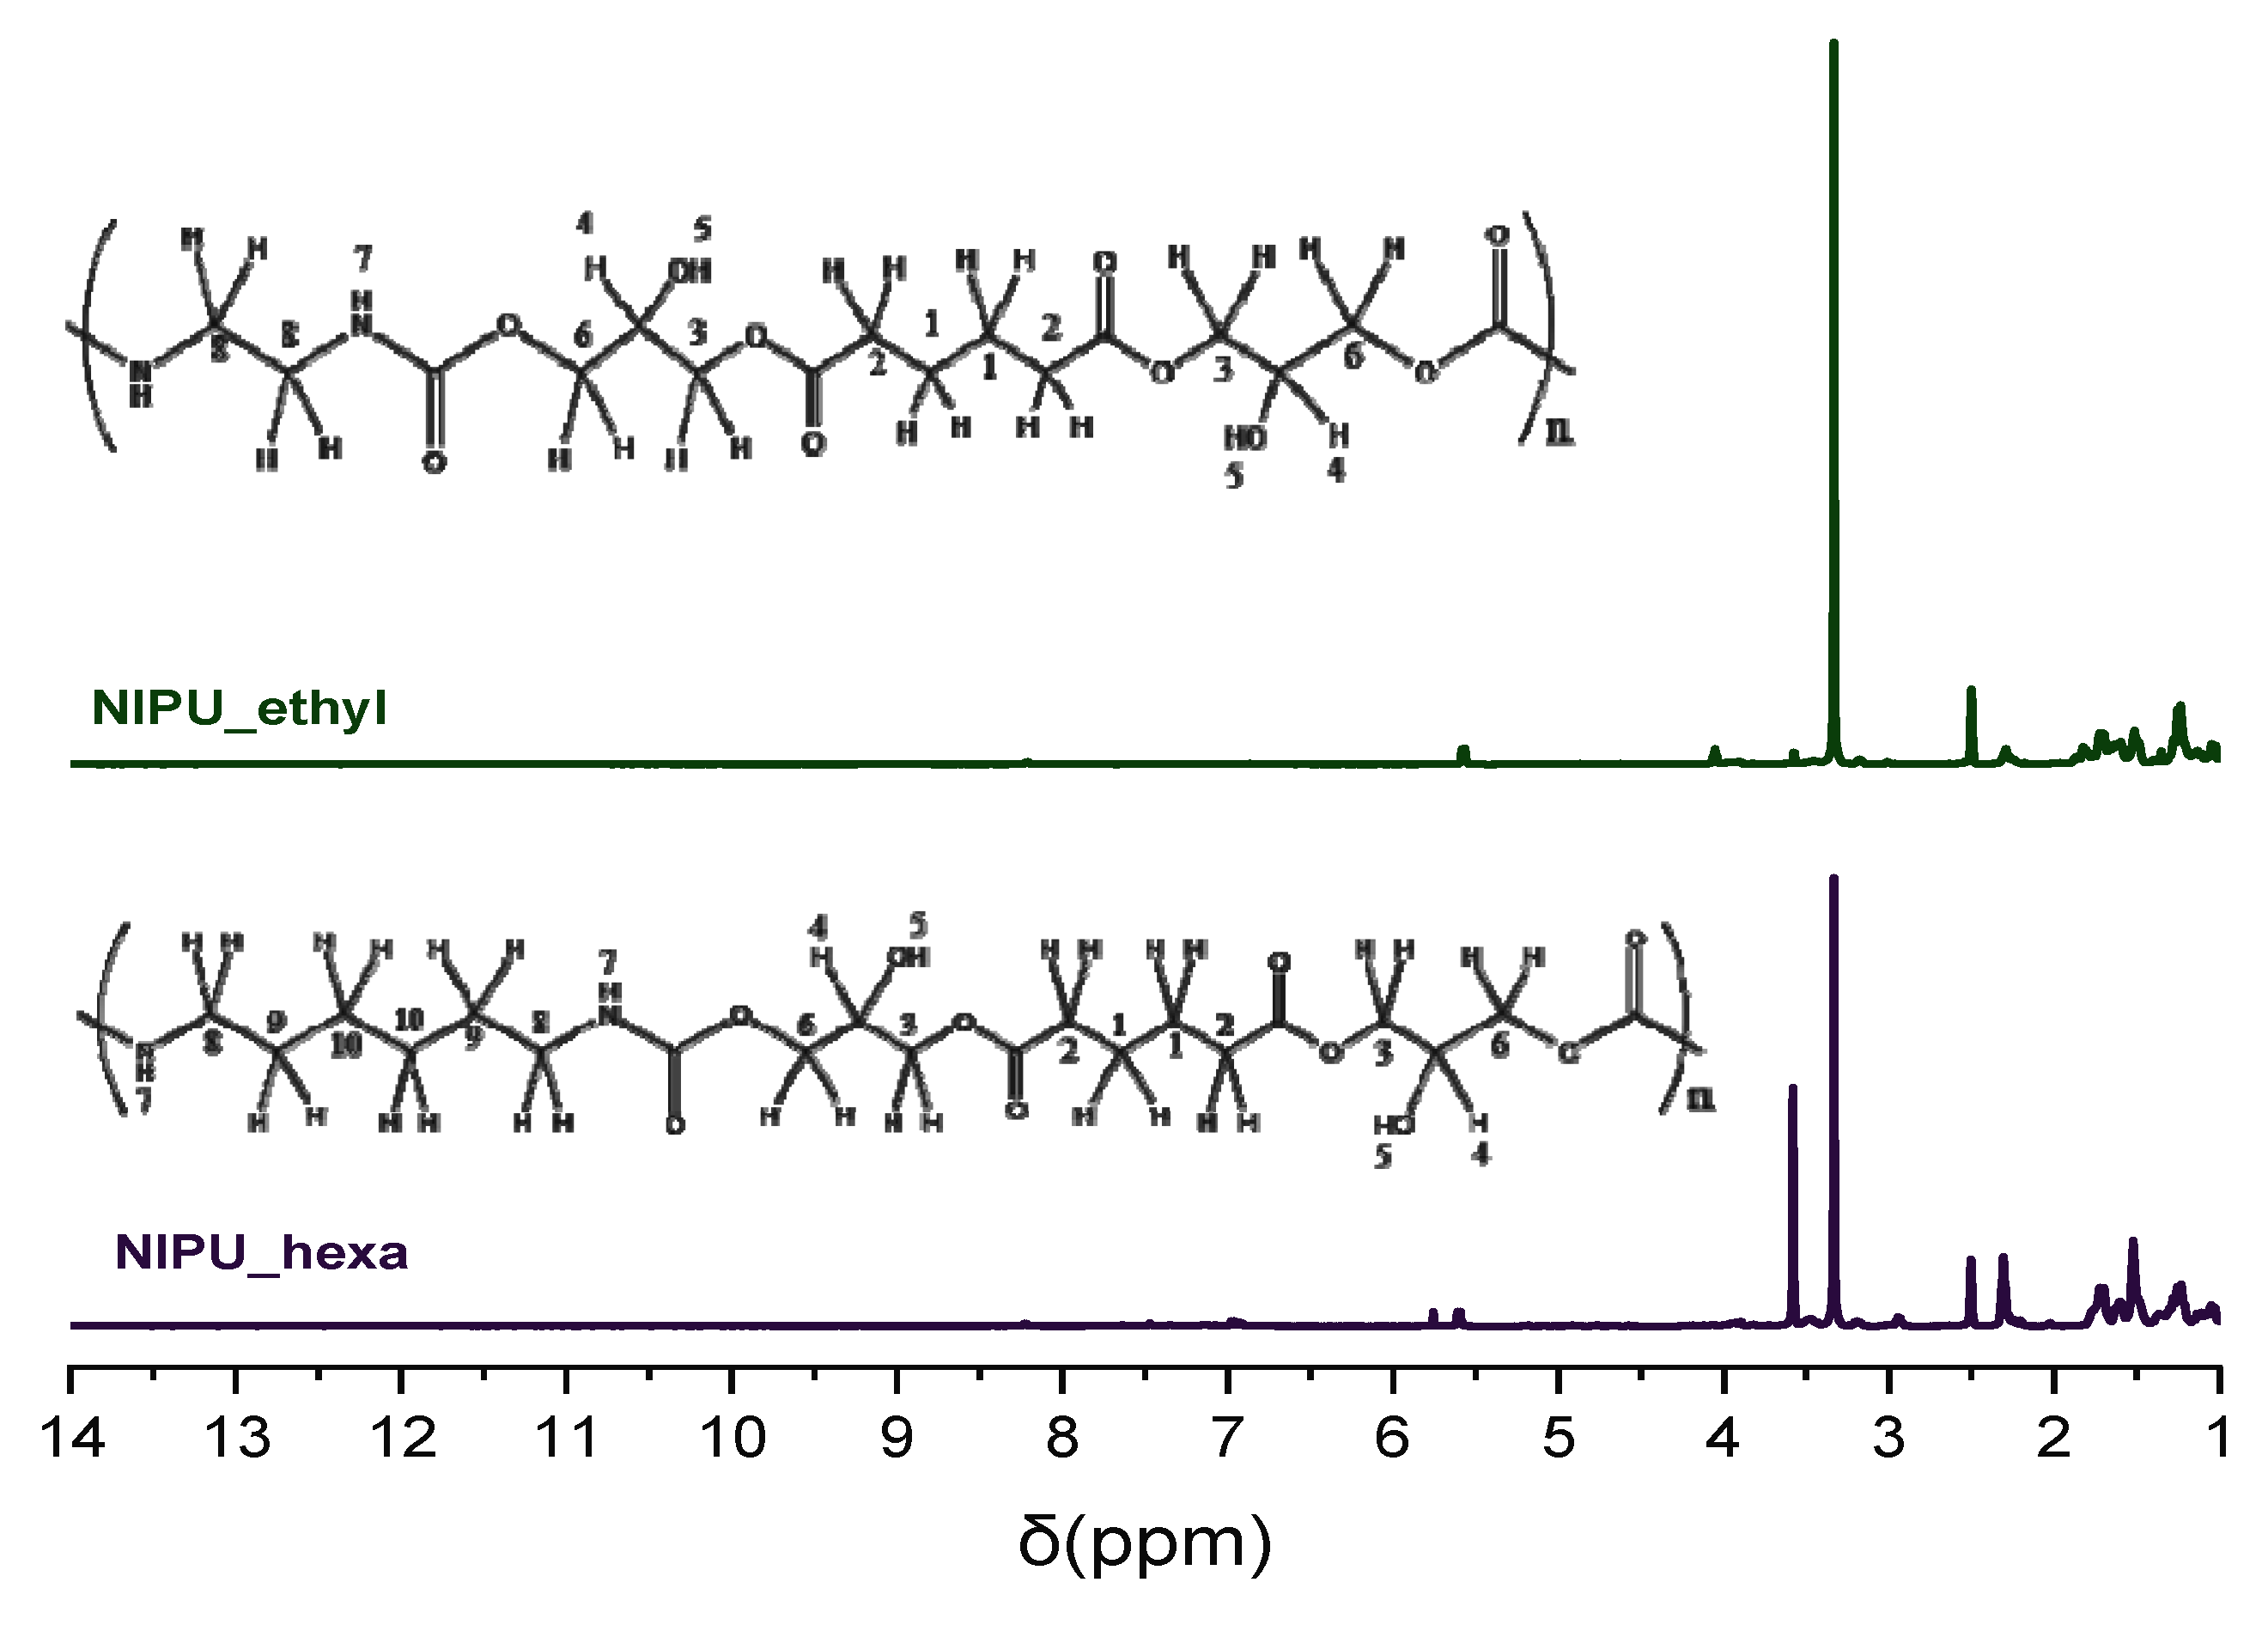
3.1. NMR
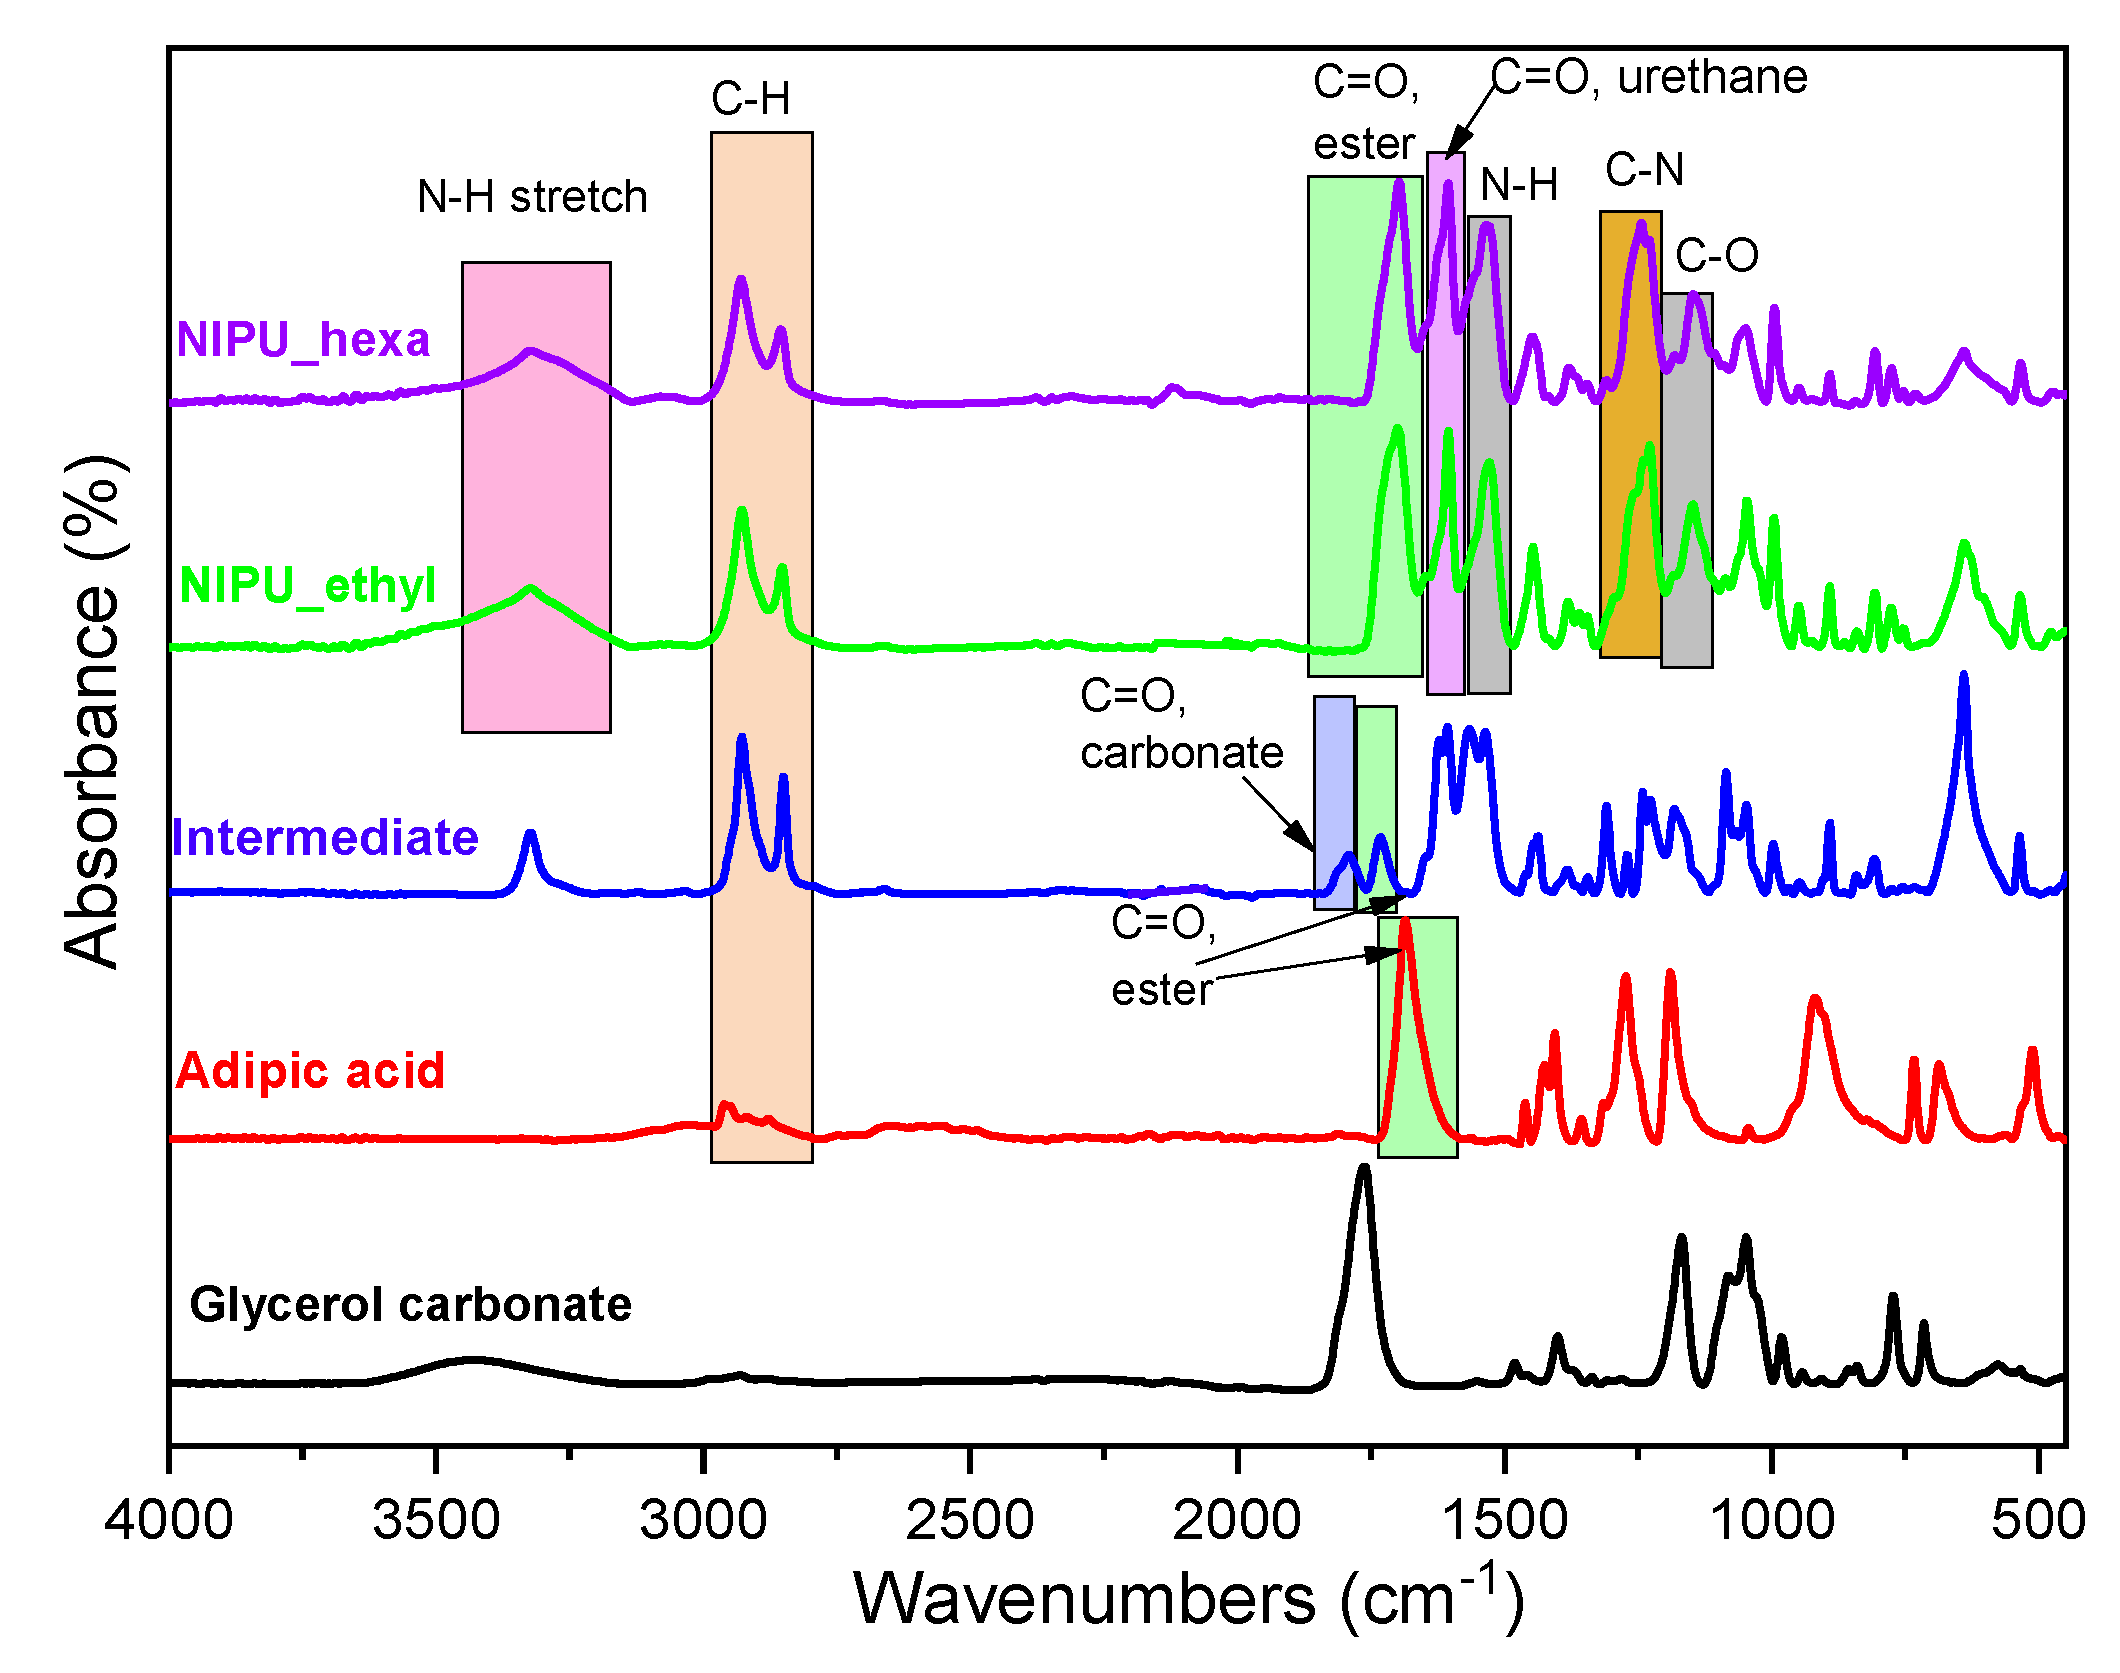
3.2. Fourier-Transform Infrared Spectroscopy (FTIR)
3.3. Gel Permeation Chromatography (GPC)
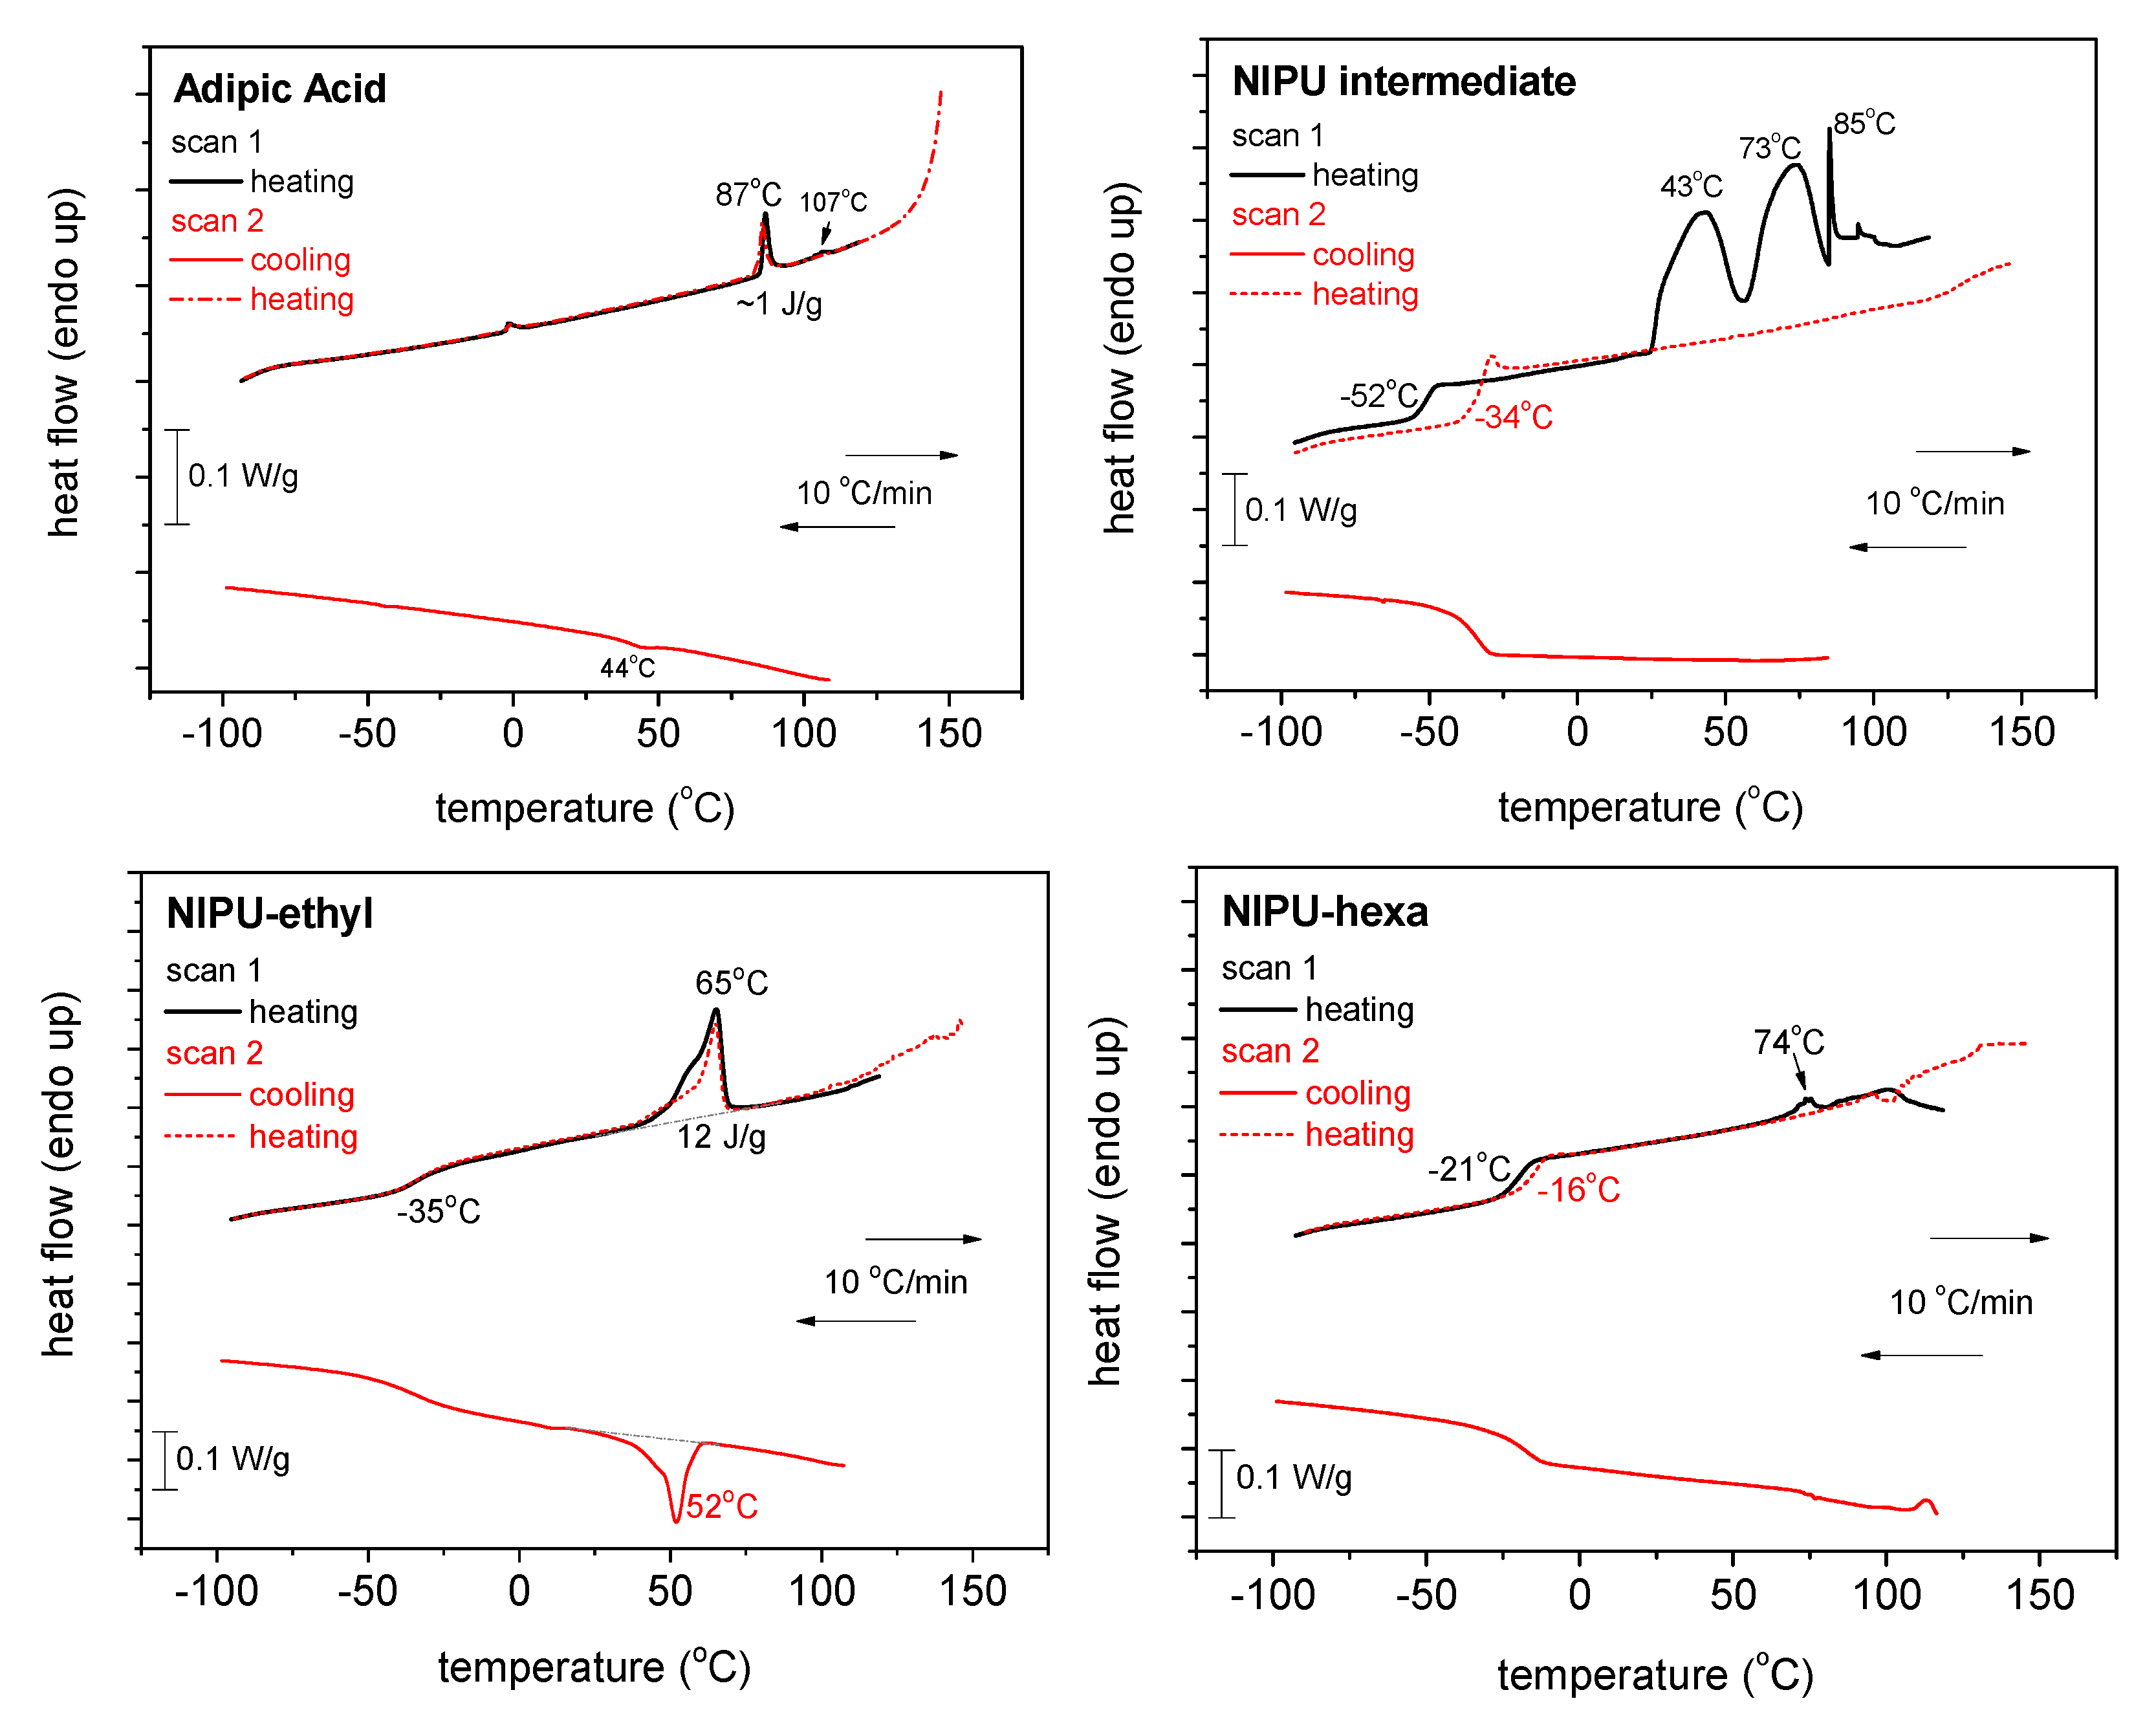
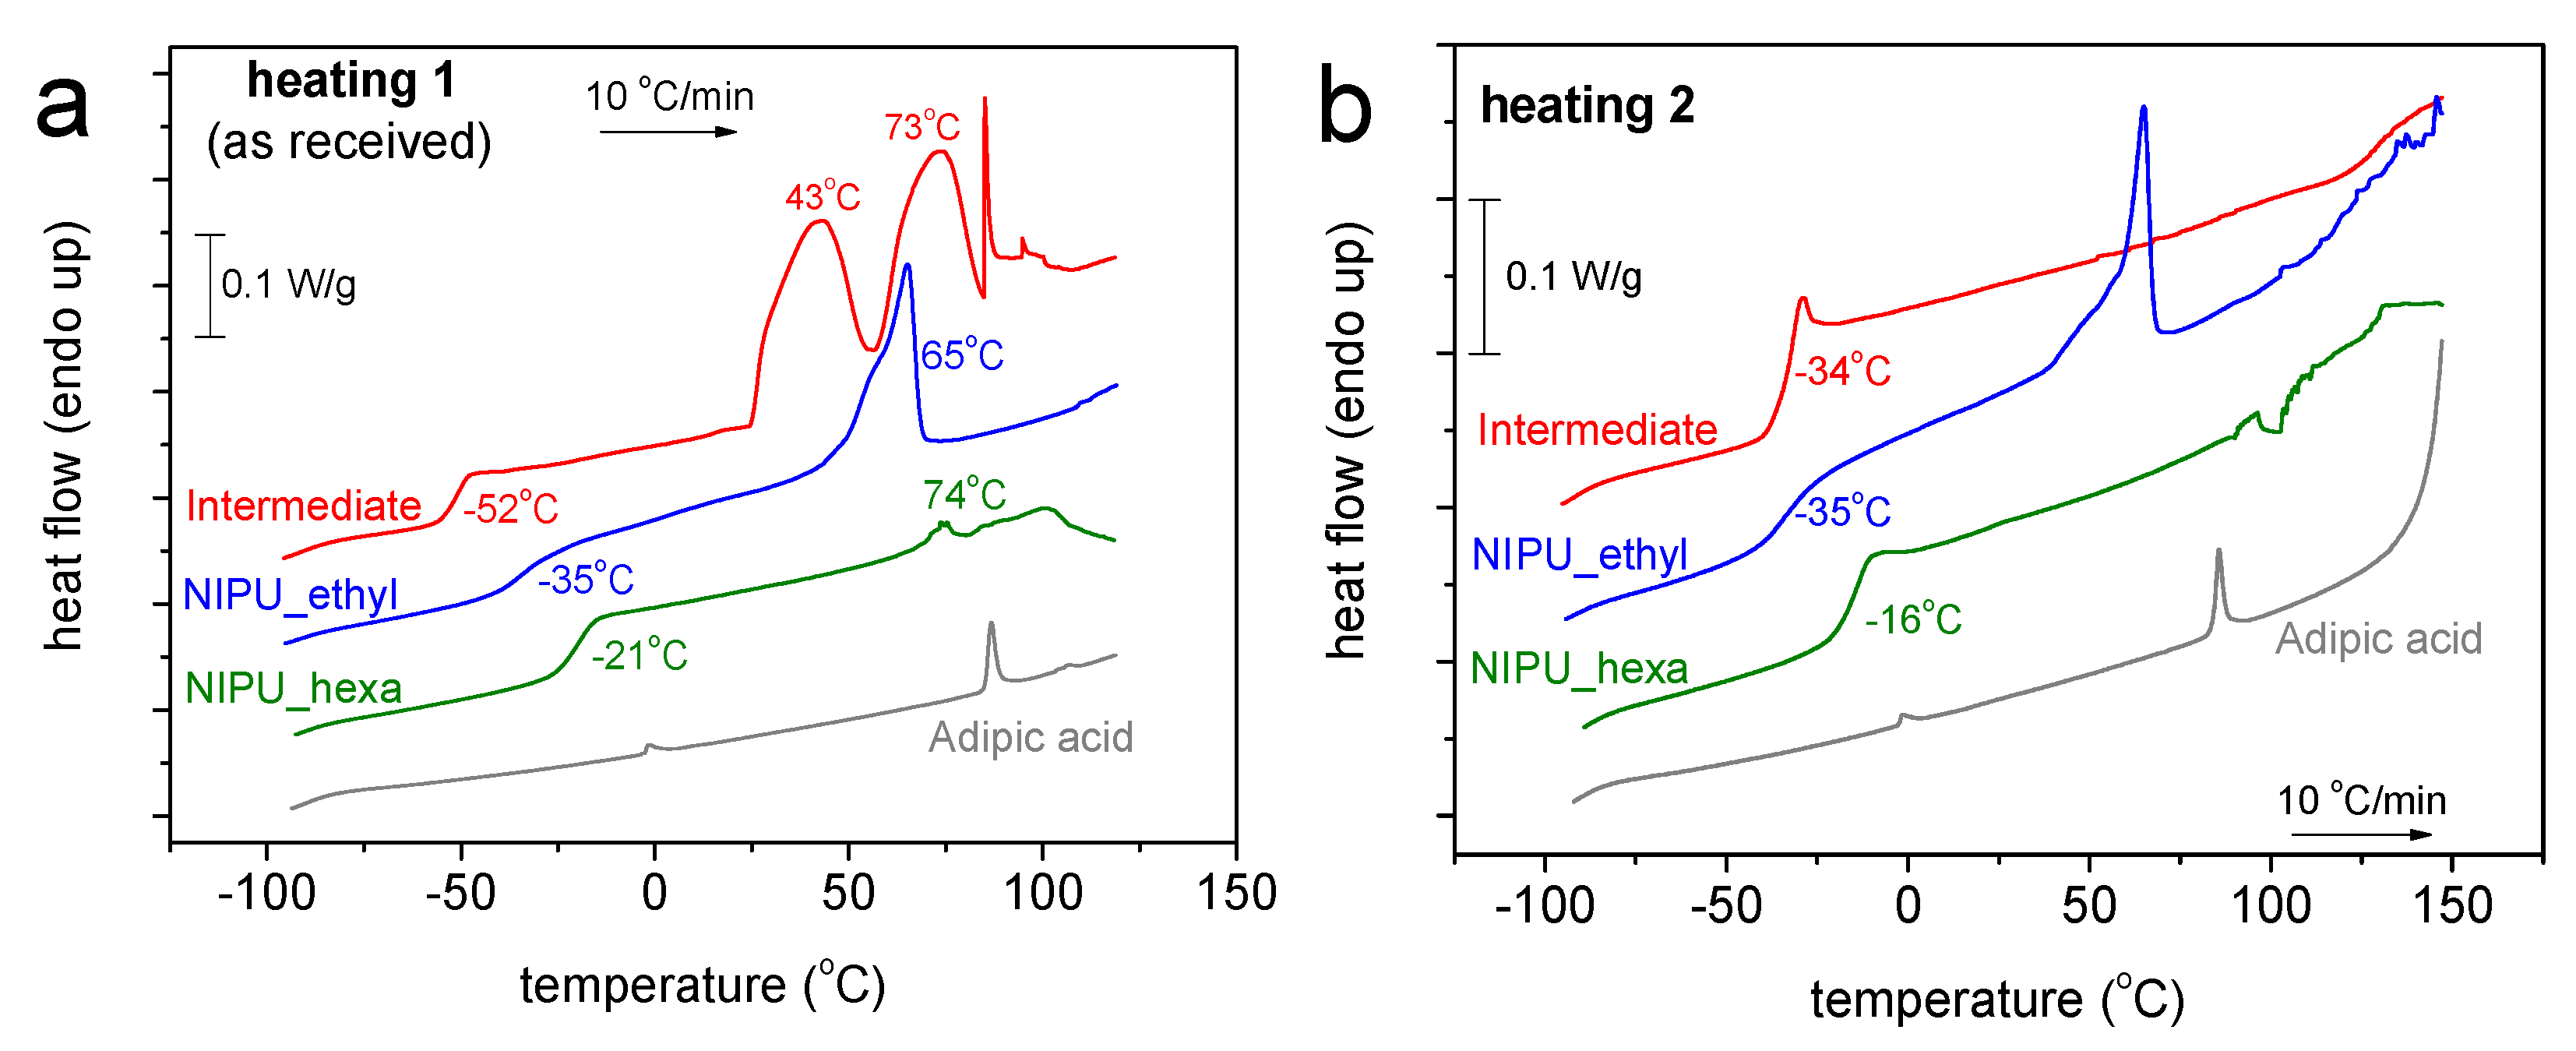
3.4. Differential Scanning Calorimetry (DSC)
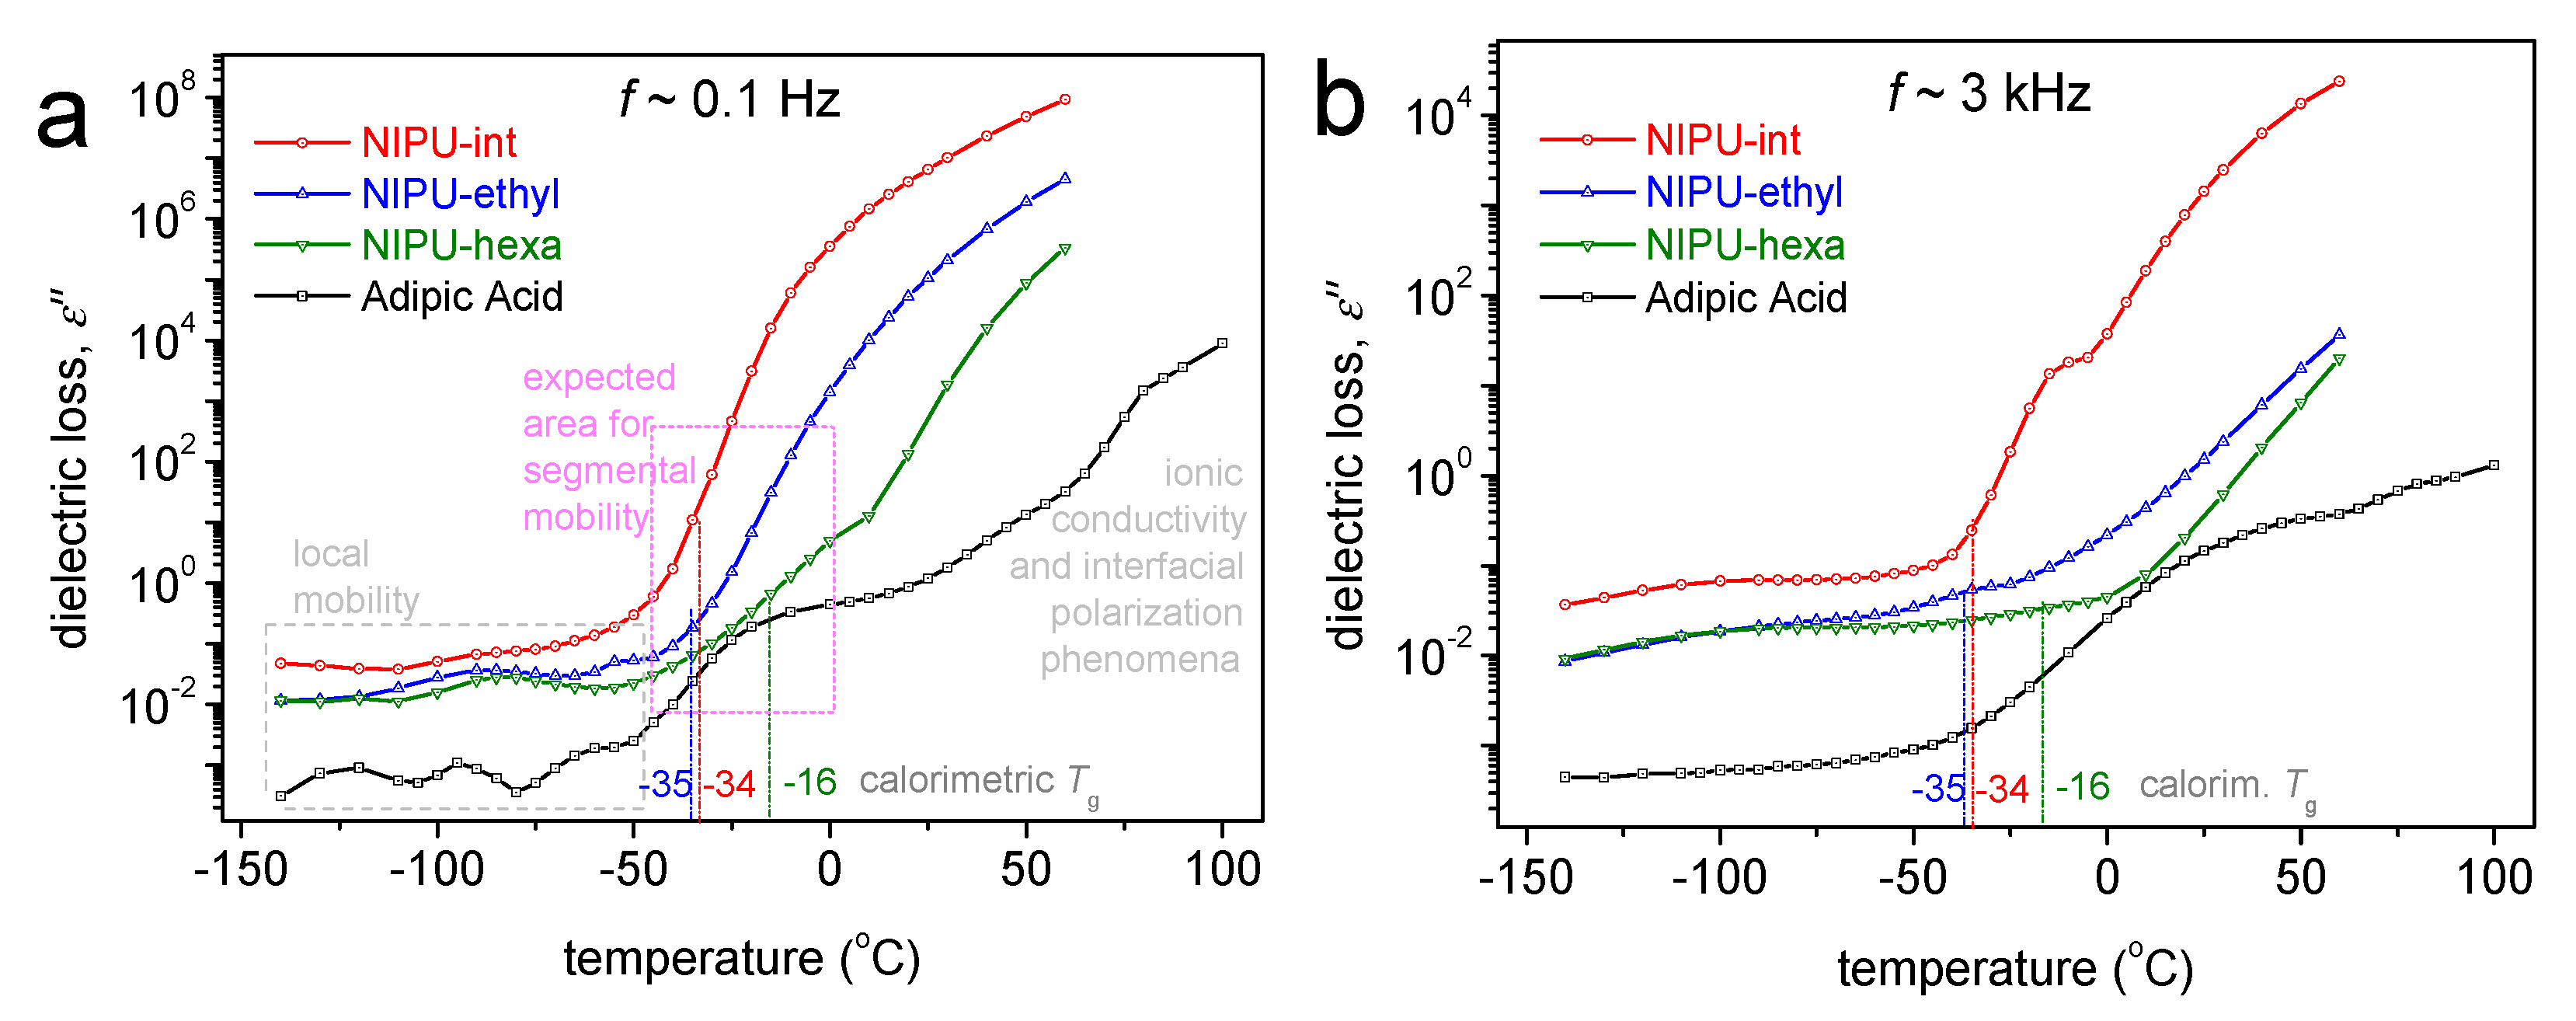
3.5. Broadband Dielectric Spectroscopy Results
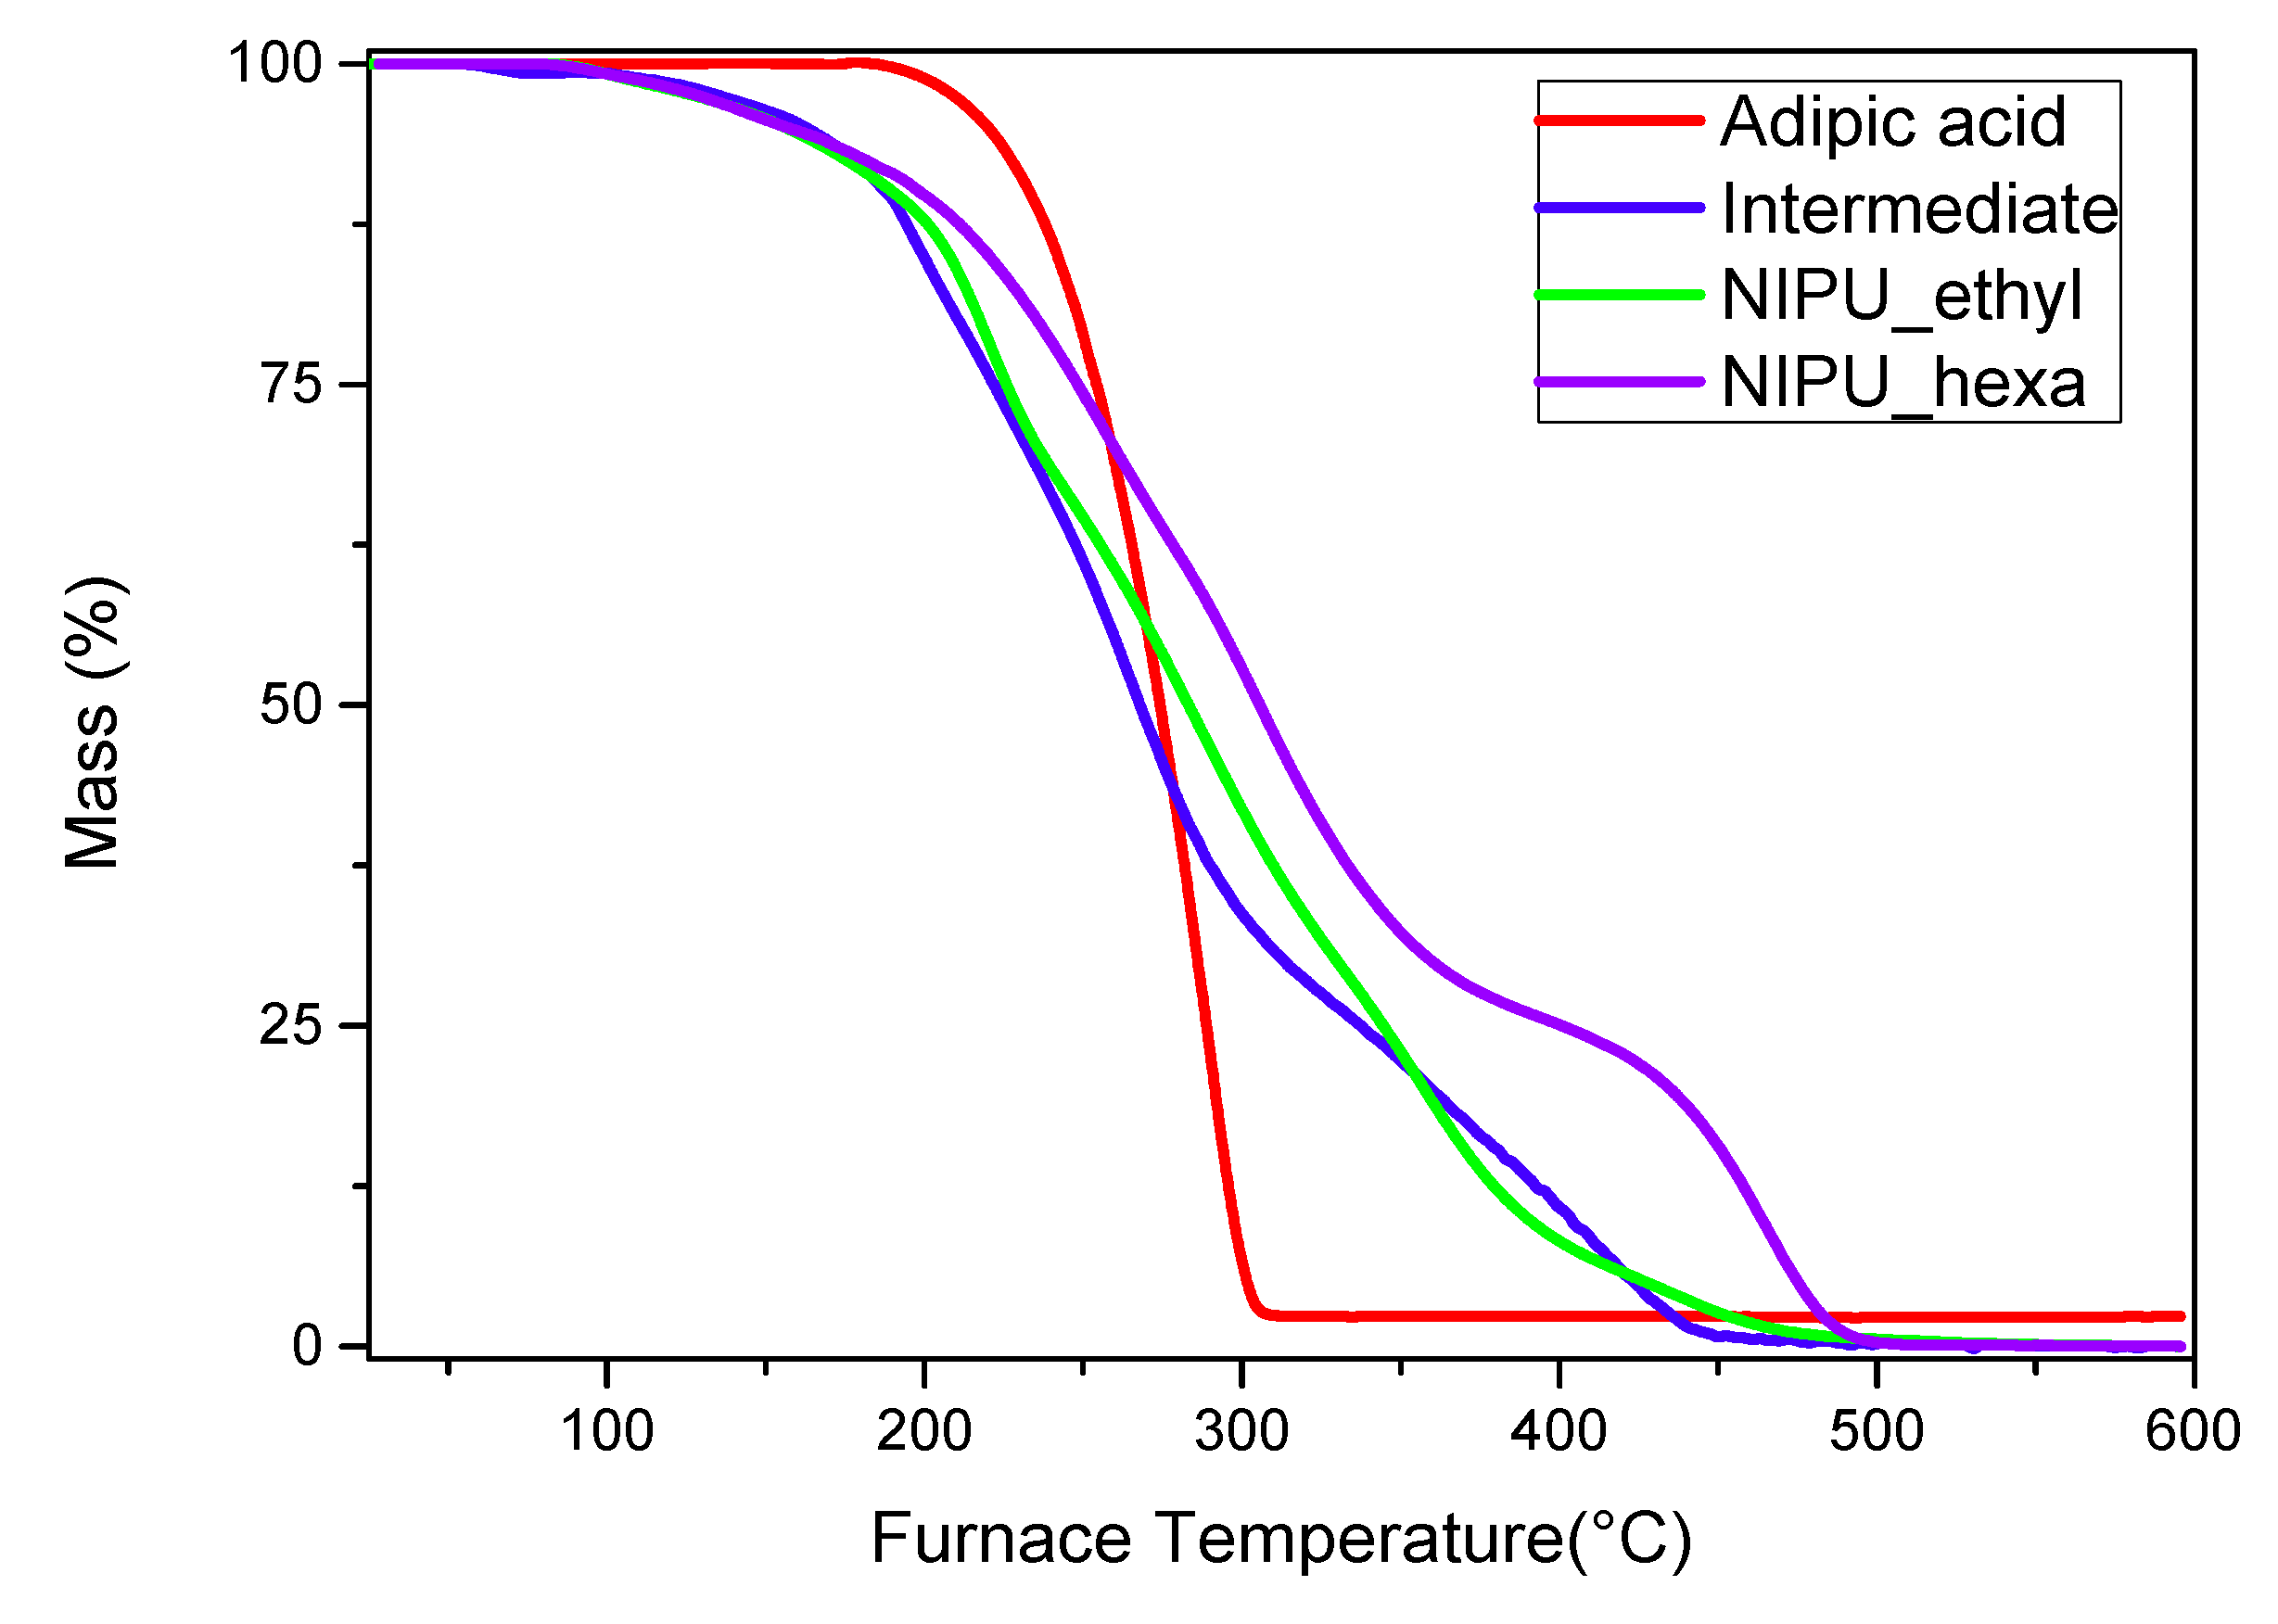
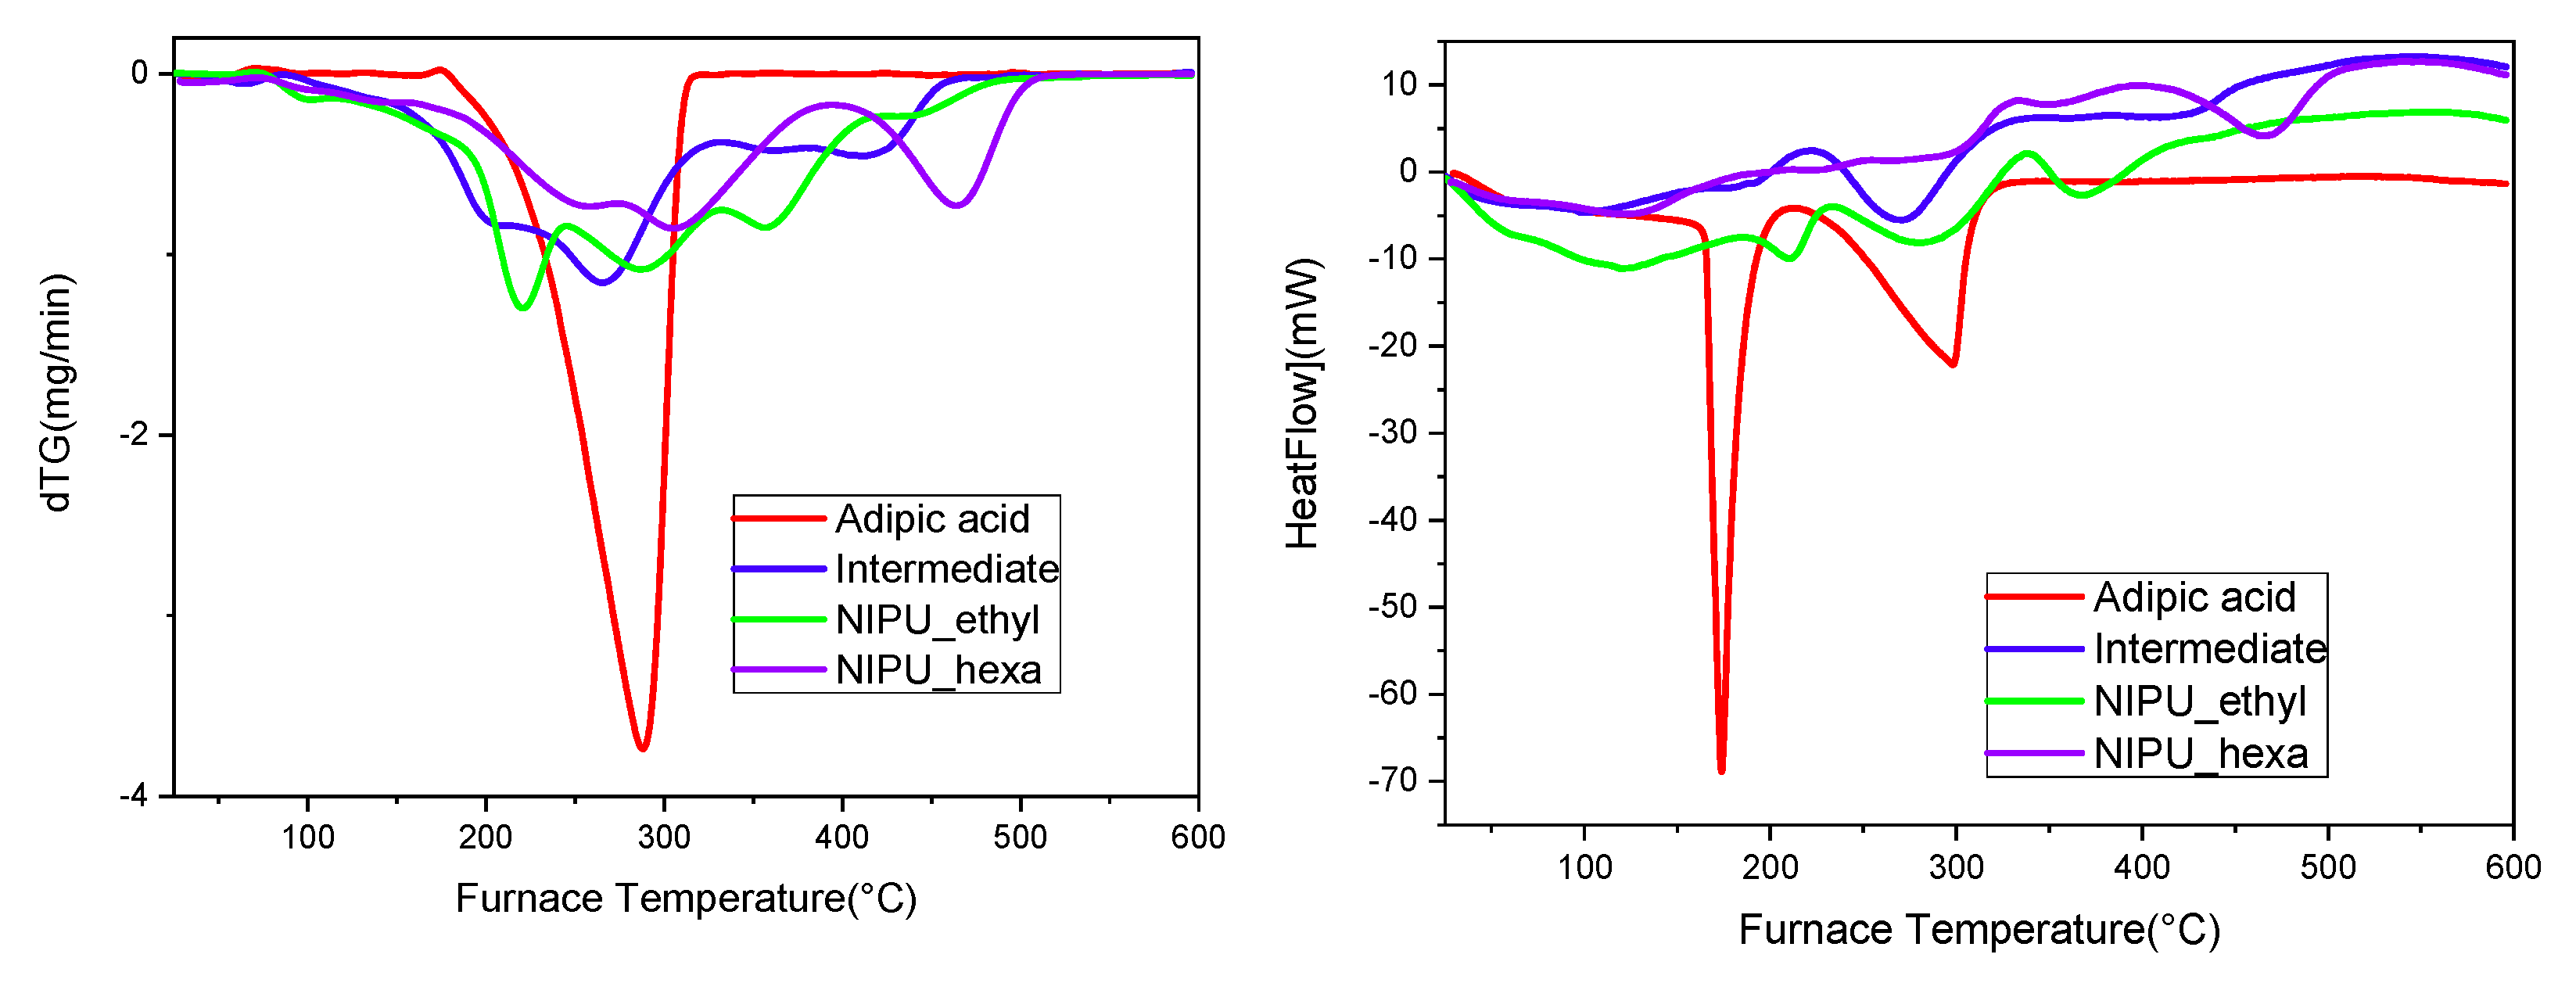
3.6. Thermogravimetric Analysis (TGA)
3.7. Hydrolysis–Enzymatic Hydrolysis
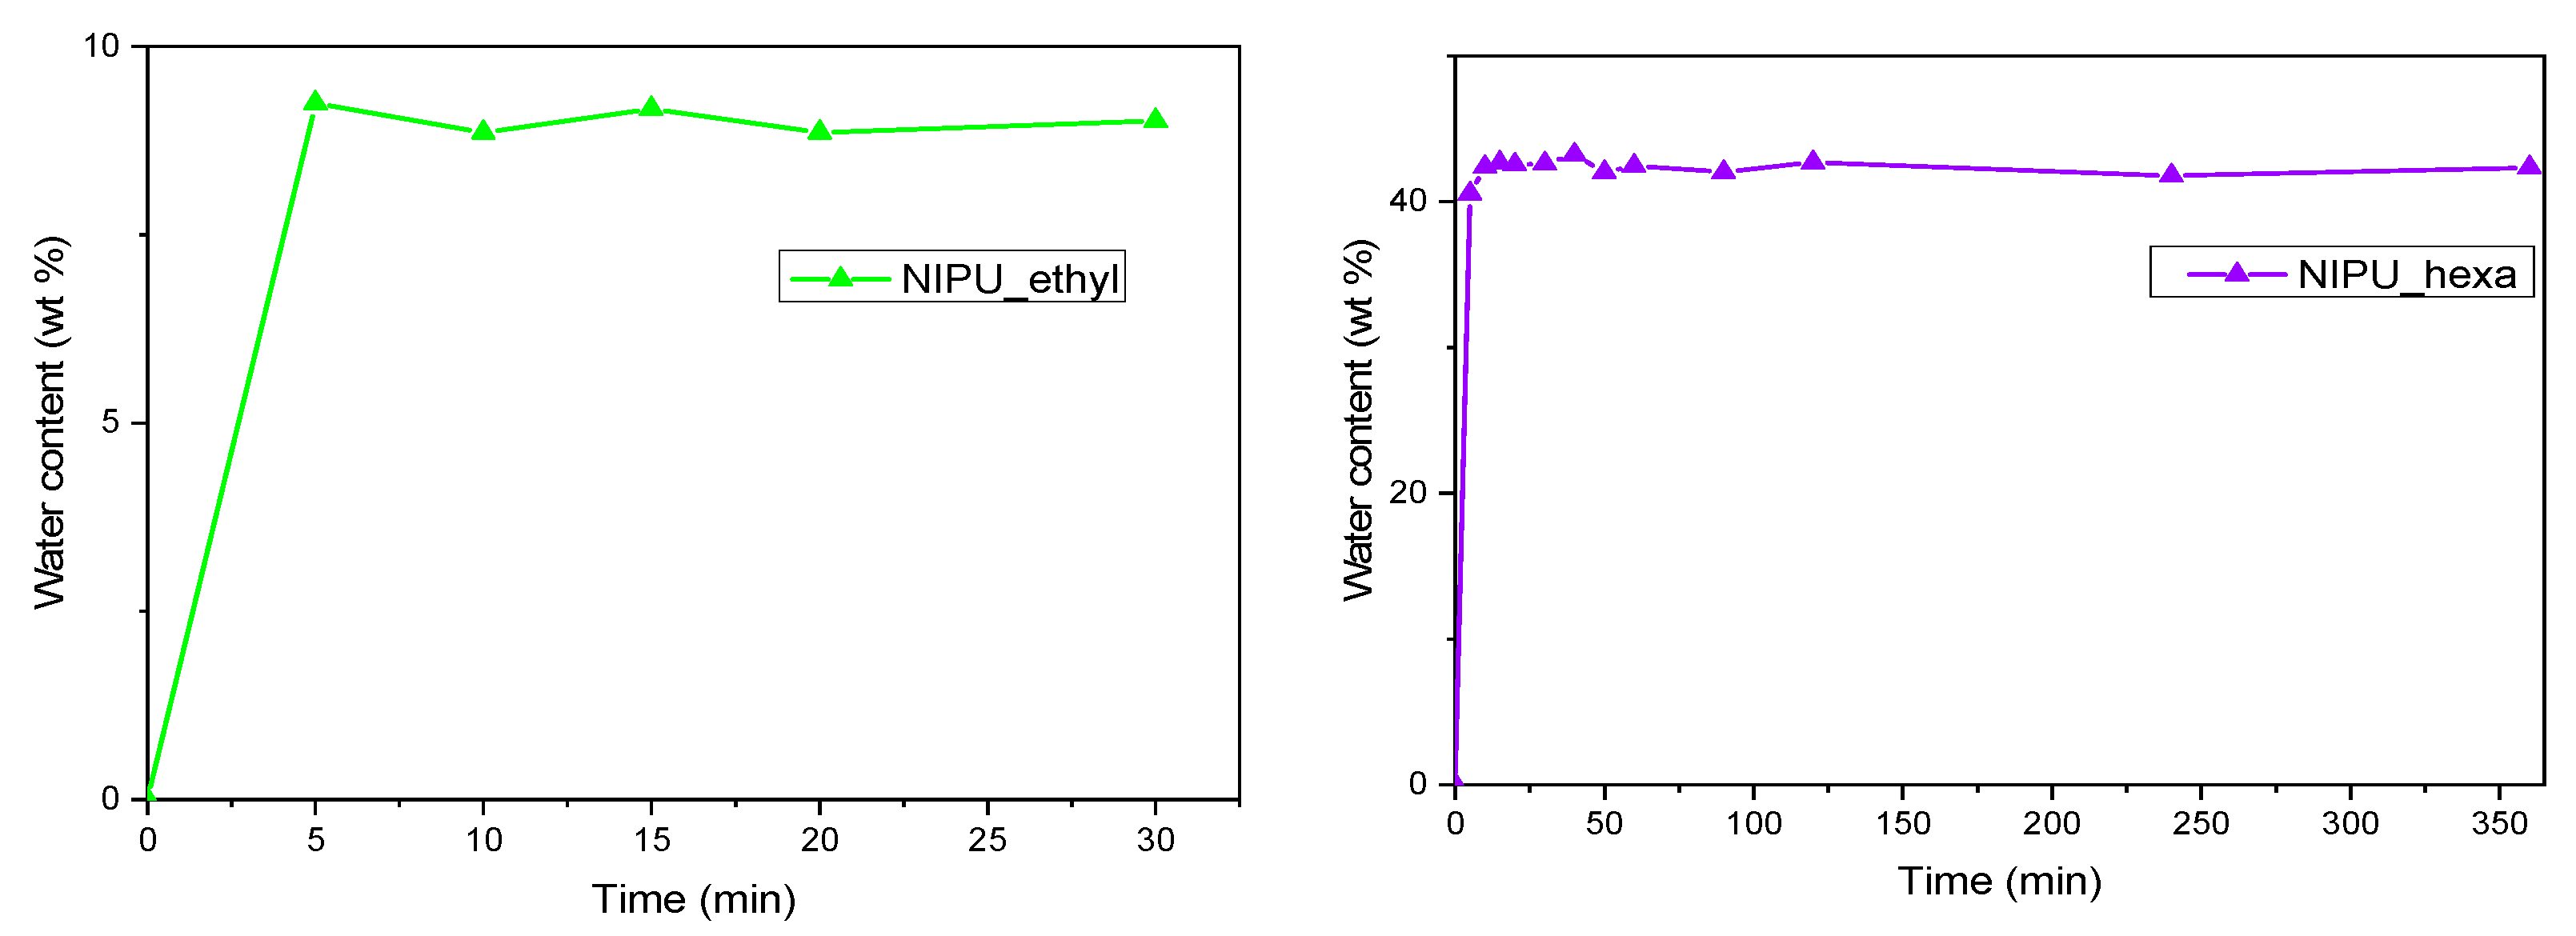
3.8. Swelling
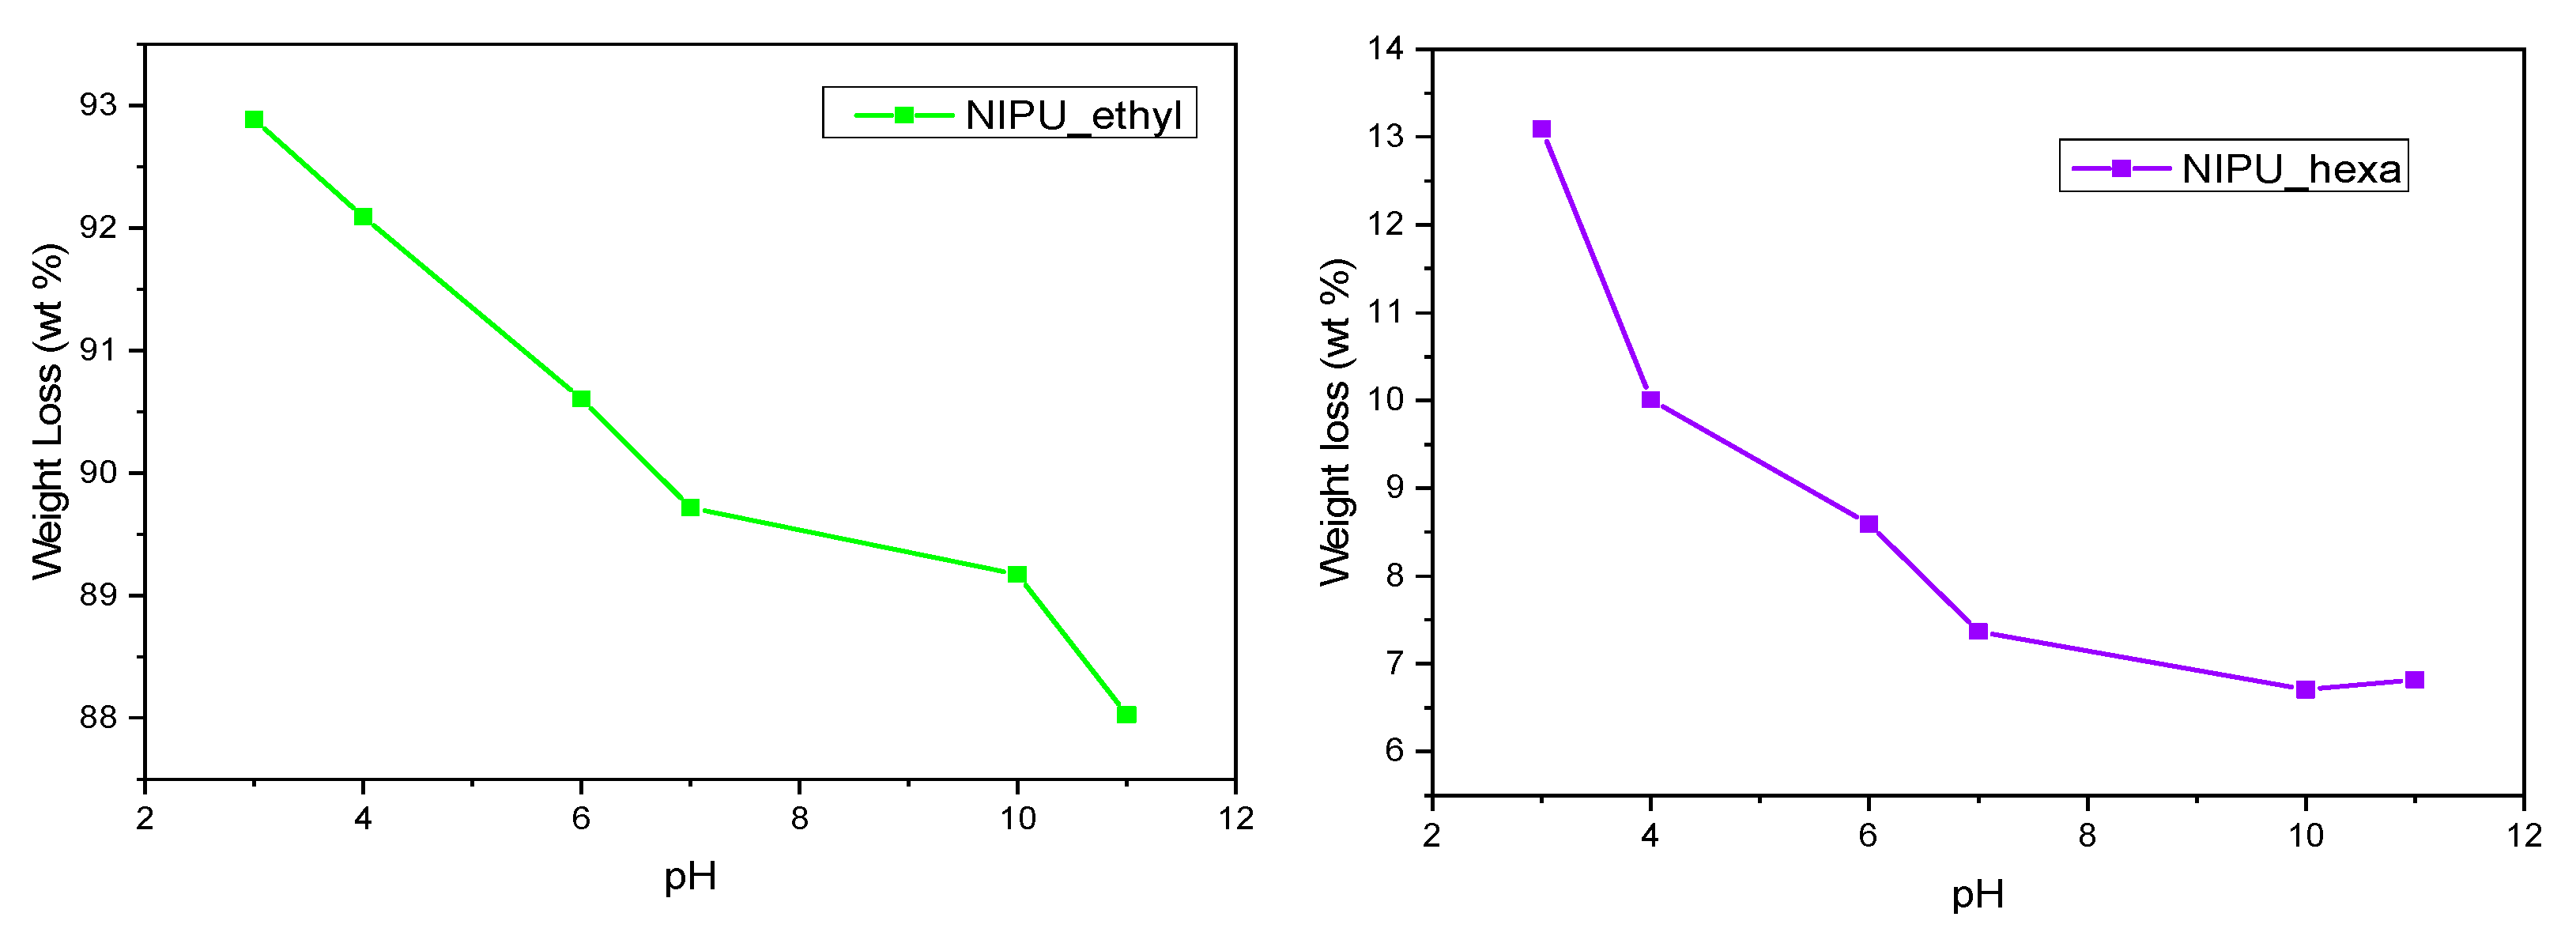
3.9. Solubility at Various pH Levels
4. Conclusions
Author Contributions
Funding
Data Availability Statement
Conflicts of Interest
References
- Nakajima, H.; Dijkstra, P.; Loos, K. The Recent Developments in Biobased Polymers toward General and Engineering Applications: Polymers That Are Upgraded from Biodegradable Polymers, Analogous to Petroleum-Derived Polymers, and Newly Developed. Polymers 2017, 9, 523. [Google Scholar] [CrossRef]
- Ma, Y.; Xiao, Y.; Zhao, Y.; Bei, Y.; Hu, L.; Zhou, Y.; Jia, P. Biomass Based Polyols and Biomass Based Polyurethane Materials as a Route towards Sustainability. React. Funct. Polym. 2022, 175, 105285. [Google Scholar] [CrossRef]
- Zhu, Y.; Romain, C.; Williams, C.K. Sustainable Polymers from Renewable Resources. Nature 2016, 540, 354–362. [Google Scholar] [CrossRef] [PubMed]
- Liu, J.; He, J.; Xue, R.; Xu, B.; Qian, X.; Xin, F.; Blank, L.M.; Zhou, J.; Wei, R.; Dong, W.; et al. Biodegradation and Up-Cycling of Polyurethanes: Progress, Challenges, and Prospects. Biotechnol. Adv. 2021, 48, 107730. [Google Scholar] [CrossRef] [PubMed]
- Suleman, M.S.; Khan, S.; Aleem, W.; Suleman, S.; Maqsood Khan, S.; Jamil, T.; Shafiq, M.; Gull, N. Synthesis and Characterization of Flexible and Rigid Polyurethane Foam. Artic. Asian J. Appl. Sci. 2014, 2, 701–710. [Google Scholar]
- Nipus, T.B.N.P.; Catal, J.; Guerra, I.; Francisco, J. Tailor-Made Bio-Based Non-Isocyanate Polyurethanes (NIPUs). Polymers 2023, 15, 1589. [Google Scholar] [CrossRef]
- Desai, Y.; Jariwala, S.; Gupta, R.K. Bio-Based Polyurethanes and Their Applications. ACS Symp. Ser. 2023, 1453, 1–14. [Google Scholar] [CrossRef]
- Aristri, M.A.; Lubis, M.A.R.; Yadav, S.M.; Antov, P.; Papadopoulos, A.N.; Pizzi, A.; Fatriasari, W.; Ismayati, M.; Iswanto, A.H. Recent Developments in Lignin- and Tannin-Based Non-Isocyanate Polyurethane Resins for Wood Adhesives—A Review. Appl. Sci. 2021, 11, 4242. [Google Scholar] [CrossRef]
- Rokicki, G.; Parzuchowski, P.G.; Mazurek, M. Non-Isocyanate Polyurethanes: Synthesis, Properties, and Applications. Polym. Adv. Technol. 2015, 26, 707–761. [Google Scholar] [CrossRef]
- Wendels, S.; Avérous, L. Biobased Polyurethanes for Biomedical Applications. Bioact. Mater. 2021, 6, 1083–1106. [Google Scholar] [CrossRef]
- Yu, C.; Tan, X.; Xu, Z.; Zhu, G.; Teng, W.; Zhao, Q.; Liang, Z.; Wu, Z.; Xiong, D. Smart Drug Carrier Based on Polyurethane Material for Enhanced and Controlled DOX Release Triggered by Redox Stimulus. React. Funct. Polym. 2020, 148, 104507. [Google Scholar] [CrossRef]
- Cornille, A.; Auvergne, R.; Figovsky, O.; Boutevin, B.; Caillol, S. A Perspective Approach to Sustainable Routes for Non-Isocyanate Polyurethanes. Eur. Polym. J. 2017, 87, 535–552. [Google Scholar] [CrossRef]
- Jaratrotkamjorn, R.; Nourry, A.; Pasetto, P.; Choppé, E.; Panwiriyarat, W.; Tanrattanakul, V.; Pilard, J.F. Synthesis and Characterization of Elastomeric, Biobased, Nonisocyanate Polyurethane from Natural Rubber. J. Appl. Polym. Sci. 2017, 134, 45427. [Google Scholar] [CrossRef]
- Gholami, H.; Yeganeh, H. Soybean Oil-Derived Non-Isocyanate Polyurethanes Containing Azetidinium Groups as Antibacterial Wound Dressing Membranes. Eur. Polym. J. 2021, 142, 110142. [Google Scholar] [CrossRef]
- Wang, Y.; Zheng, Z.; Pathak, J.L.; Feng, W.; Wu, W.; Yang, C.; Wu, L.; Zheng, H. Fabrication and Characterization of Photosensitive Non-Isocyanate Polyurethane Acrylate Resin for 3D Printing of Customized Biocompatible Orthopedic Surgical Guides. Int. J. Bioprinting 2023, 9, 80–93. [Google Scholar] [CrossRef]
- Pierrard, A.; Melo, S.F.; Thijssen, Q.; Van Vlierberghe, S.; Lancellotti, P.; Oury, C.; Detrembleur, C.; Jérôme, C. Design of 3D-Photoprintable, Bio-, and Hemocompatible Nonisocyanate Polyurethane Elastomers for Biomedical Implants. Biomacromolecules 2024, 25, 1810–1824. [Google Scholar] [CrossRef]
- Laurén, I.; Farzan, A.; Teotia, A.; Lindfors, N.C.; Seppälä, J. Direct Ink Writing of Biocompatible Chitosan/Non-Isocyanate Polyurethane/Cellulose Nanofiber Hydrogels for Wound-Healing Applications. Int. J. Biol. Macromol. 2024, 259, 129321. [Google Scholar] [CrossRef]
- Melo, S.F.; Nondonfaz, A.; Aqil, A.; Pierrard, A.; Hulin, A.; Delierneux, C.; Ditkowski, B.; Gustin, M.; Legrand, M.; Tullemans, B.M.E.; et al. Design, Manufacturing and Testing of a Green Non-Isocyanate Polyurethane Prosthetic Heart Valve. Biomater. Sci. 2024, 12, 2149–2164. [Google Scholar] [CrossRef]
- Aduba, D.C.; Zhang, K.; Kanitkar, A.; Sirrine, J.M.; Verbridge, S.S.; Long, T.E. Electrospinning of Plant Oil-Based, Non-Isocyanate Polyurethanes for Biomedical Applications. J. Appl. Polym. Sci. 2018, 135, 46464. [Google Scholar] [CrossRef]
- Pramanik, S.K.; Sreedharan, S.; Singh, H.; Khan, M.; Tiwari, K.; Shiras, A.; Smythe, C.; Thomas, J.A.; Das, A. Mitochondria Targeting Non-Isocyanate-Based Polyurethane Nanocapsules for Enzyme-Triggered Drug Release. Bioconjug. Chem. 2018, 29, 3532–3543. [Google Scholar] [CrossRef]
- Lang, M.; Li, H. Sustainable Routes for the Synthesis of Renewable Adipic Acid from Biomass Derivatives. ChemSusChem 2022, 15, e202101531. [Google Scholar] [CrossRef] [PubMed]
- Sonnati, M.O.; Amigoni, S.; Taffin De Givenchy, E.P.; Darmanin, T.; Choulet, O.; Guittard, F. Glycerol Carbonate as a Versatile Building Block for Tomorrow: Synthesis, Reactivity, Properties and Applications. Green Chem. 2013, 15, 283–306. [Google Scholar] [CrossRef]
- Ghasemlou, M.; Daver, F.; Ivanova, E.P.; Adhikari, B. Bio-Based Routes to Synthesize Cyclic Carbonates and Polyamines Precursors of Non-Isocyanate Polyurethanes: A Review. Eur. Polym. J. 2019, 118, 668–684. [Google Scholar] [CrossRef]
- Munawar, S.; Zahoor, A.F.; Hussain, S.M.; Ahmad, S.; Mansha, A.; Parveen, B.; Ali, K.G.; Irfan, A. Steglich Esterification: A Versatile Synthetic Approach toward the Synthesis of Natural Products, Their Analogues/Derivatives. Heliyon 2024, 10, e23416. [Google Scholar] [CrossRef] [PubMed]
- Bikiaris, N.D.; Klonos, P.A.; Kyritsis, A.; Barmpalexis, P. Structural and Thermodynamical Investigation in Triblock Copolymers of Polylactide and Poly(Ethylene Glycol), PLA-b-PEG-b-PLA, Envisaged for Medical Applications. Mater. Today Commun. 2024, 38, 107799. [Google Scholar] [CrossRef]
- Cornille, A.; Blain, M.; Auvergne, R.; Andrioletti, B.; Boutevin, B.; Caillol, S. A Study of Cyclic Carbonate Aminolysis at Room Temperature: Effect of Cyclic Carbonate Structures and Solvents on Polyhydroxyurethane Synthesis. Polym. Chem. 2017, 8, 592–604. [Google Scholar] [CrossRef]
- Choong, P.S.; Chong, N.X.; Wai Tam, E.K.; Seayad, A.M.; Seayad, J.; Jana, S. Biobased Nonisocyanate Polyurethanes as Recyclable and Intrinsic Self-Healing Coating with Triple Healing Sites. ACS Macro Lett. 2021, 10, 635–641. [Google Scholar] [CrossRef]
- Bizet, B.; Grau, E.; Asua, J.; Cramail, H. Hybrid Nonisocyanate Polyurethanes (H-NIPUs): A Pathway towards a Broad Range of Novel Materials. Macromol. Chem. Phys. 2022, 223, 2100437. [Google Scholar] [CrossRef]
- Datta Sarma, A.; Zubkevich, S.V.; Addiego, F.; Schmidt, D.F.; Shaplov, A.S.; Berthé, V. Synthesis of High-Tg Nonisocyanate Polyurethanes via Reactive Extrusion and Their Batch Foaming. Macromolecules 2024, 57, 3423–3437. [Google Scholar] [CrossRef]
- Schönhals, A.; Szymoniak, P. (Eds.) Dynamics of Composite Materials; Springer: Geneva, Switzerland, 2022. [Google Scholar] [CrossRef]
- Raftopoulos, K.N.; Pielichowski, K. Segmental Dynamics in Hybrid Polymer/POSS Nanomaterials. Prog. Polym. Sci. 2016, 52, 136–187. [Google Scholar] [CrossRef]
- Carré, C.; Bonnet, L.; Avérous, L. Original Biobased Nonisocyanate Polyurethanes: Solvent- and Catalyst-Free Synthesis, Thermal Properties and Rheological Behaviour. RSC Adv. 2014, 4, 54018–54025. [Google Scholar] [CrossRef]
- Malik, M.; Kaur, R. Synthesis of NIPU by the Carbonation of Canola Oil Using Highly Efficient 5,10,15-Tris(Pentafluorophenyl)Corrolato-Manganese(III) Complex as Novel Catalyst. Polym. Adv. Technol. 2018, 29, 1078–1085. [Google Scholar] [CrossRef]
- Martin, A.; Lecamp, L.; Labib, H.; Aloui, F.; Kébir, N.; Burel, F. Synthesis and Properties of Allyl Terminated Renewable Non-Isocyanate Polyurethanes (NIPUs) and Polyureas (NIPUreas) and Study of Their Photo-Crosslinking. Eur. Polym. J. 2016, 84, 828–836. [Google Scholar] [CrossRef]
- Duval, C.; Kébir, N.; Charvet, A.; Martin, A.; Burel, F. Synthesis and Properties of Renewable Nonisocyanate Polyurethanes (NIPUs) from Dimethylcarbonate. J. Polym. Sci. Part A Polym. Chem. 2015, 53, 1351–1359. [Google Scholar] [CrossRef]
- Chen, X.; Pizzi, A.; Fredon, E.; Gerardin, C.; Zhou, X.; Zhang, B.; Du, G. Low Curing Temperature Tannin-Based Non-Isocyanate Polyurethane (NIPU) Wood Adhesives: Preparation and Properties Evaluation. Int. J. Adhes. Adhes. 2022, 112, 103001. [Google Scholar] [CrossRef]
- Bukowczan, A.; Stachak, P.; Łukaszewska, I.; Majka, T.M.; Hebda, E.; Pielichowski, K. Pyrolysis and Thermal Degradation Studies of Non-Isocyanate Polyurethanes Modified by Polyhedral Oligomeric Silsesquioxanes. Thermochim. Acta 2023, 723, 179484. [Google Scholar] [CrossRef]
- Ozimek, J.; Pielichowski, K. Sustainability of Nonisocyanate Polyurethanes (NIPUs). Sustainability 2024, 16, 25–33. [Google Scholar] [CrossRef]
- Tryznowski, M.; Izdebska-Podsiadły, J.; Żołek-Tryznowska, Z. Wettability and Surface Free Energy of NIPU Coatings Based on Bis(2,3-Dihydroxypropyl)Ether Dicarbonate. Prog. Org. Coat. 2017, 109, 55–60. [Google Scholar] [CrossRef]
- Łukaszewska, I.; Bukowczan, A.; Raftopoulos, K.N.; Pielichowski, K. ‘Spider-like’ POSS in NIPU Webs: Enhanced Thermal Stability and Unique Swelling Behavior. J. Polym. Res. 2023, 30, 456. [Google Scholar] [CrossRef]
- Naheed, S.; Zuber, M.; Barikani, M.; Salman, M. Molecular Engineering and Morphology of Polyurethane Elastomers Containing Various Molecular Weight of Macrodiol. Mater. Sci. Eng. B 2021, 264, 114960. [Google Scholar] [CrossRef]
- Gennen, S.; Grignard, B.; Jérôme, C.; Detrembleur, C. CO2-Sourced Non-Isocyanate Poly(Urethane)s with PH-Sensitive Imine Linkages. Adv. Synth. Catal. 2019, 361, 355–365. [Google Scholar] [CrossRef]


| Name | Diamine | Molecular Weight (Mw) | PDI |
|---|---|---|---|
| NIPU_ethyl |  | 5380 | 1.00 |
| NIPU_hexa |  | 7290 | 1.00 |
Disclaimer/Publisher’s Note: The statements, opinions and data contained in all publications are solely those of the individual author(s) and contributor(s) and not of MDPI and/or the editor(s). MDPI and/or the editor(s) disclaim responsibility for any injury to people or property resulting from any ideas, methods, instructions or products referred to in the content. |
© 2025 by the authors. Licensee MDPI, Basel, Switzerland. This article is an open access article distributed under the terms and conditions of the Creative Commons Attribution (CC BY) license (https://creativecommons.org/licenses/by/4.0/).
Share and Cite
Ntrivala, M.A.G.; Balla, E.D.; Klonos, P.A.; Kyritsis, A.; Bikiaris, D.N. Synthesis and Characterization of Novel Non-Isocyanate Polyurethanes Derived from Adipic Acid: A Comprehensive Study. Polymers 2025, 17, 728. https://doi.org/10.3390/polym17060728
Ntrivala MAG, Balla ED, Klonos PA, Kyritsis A, Bikiaris DN. Synthesis and Characterization of Novel Non-Isocyanate Polyurethanes Derived from Adipic Acid: A Comprehensive Study. Polymers. 2025; 17(6):728. https://doi.org/10.3390/polym17060728
Chicago/Turabian StyleNtrivala, Maria Angeliki G., Evangelia D. Balla, Panagiotis A. Klonos, Apostolos Kyritsis, and Dimitrios N. Bikiaris. 2025. "Synthesis and Characterization of Novel Non-Isocyanate Polyurethanes Derived from Adipic Acid: A Comprehensive Study" Polymers 17, no. 6: 728. https://doi.org/10.3390/polym17060728
APA StyleNtrivala, M. A. G., Balla, E. D., Klonos, P. A., Kyritsis, A., & Bikiaris, D. N. (2025). Synthesis and Characterization of Novel Non-Isocyanate Polyurethanes Derived from Adipic Acid: A Comprehensive Study. Polymers, 17(6), 728. https://doi.org/10.3390/polym17060728