Article

Food-Grade Microwave-Assisted Depolymerization of Grape Seed Condensed Tannins: Optimizing the Reaction Using Gallic Acid as a Nucleophile

by
Carolina F. Morales
and
Fernando A. Osorio
*
Department of Food Science and Technology, Technological Faculty, University of Santiago, Chile (USACH), Av. El Belloto 3735, Estación Central, Santiago 9170022, Chile
*
Author to whom correspondence should be addressed.
Polymers 2025, 17(5), 682; https://doi.org/10.3390/polym17050682
Submission received: 2 February 2025 / Revised: 27 February 2025 / Accepted: 2 March 2025 / Published: 4 March 2025
(This article belongs to the Section Polymer Chemistry)

Abstract

:
Food waste has a significant social impact but can be revalued as a source of bioactive compounds, such as condensed tannins. This abundant biomass, corresponding to a polymeric antioxidant, must be depolymerized to become bioavailable. Previous studies have investigated polymer degradation into oligomers using high temperatures and expensive nucleophiles, often under conditions unsuitable for food applications. In the present investigation, it is proposed that the depolymerization of condensed tannins can occur under food-grade conditions using a Generally Recognized as Safe (GRAS) solvent by optimizing the reaction’s heating method with microwave assistance and using gallic acid as a nucleophile. Thermal studies indicate that the degradation of total polyphenols content follows first-order kinetics and occurs above 80 °C in microwave. Depolymerization follows second-order kinetics, yielding epicatechin as the primary product with zero-order formation kinetics. The optimized factors were 80% v/v ethanol, 10 mg/mL polymeric tannins, and 5.88 mg/mL gallic acid. Under these conditions, the reaction efficiency was 99.9%, the mean particle diameter was 5.7 nm, the total polyphenols content was 297.3 ± 15.9 EAG mg/g, and the inhibition of ABTS●+ and DPPH● radicals was 93.5 ± 0.9% and 88.2 ± 1.5%, respectively. These results are promising for future scaling processes.

Graphical Abstract

1. Introduction

Agri-food industries generate large quantities of processing waste, such as peels, seeds, leaves, and stems, among the most common waste generated in processing fruits and vegetables [1]. Landfilling, composting, and incineration are the popular options for most of this waste [2]. Around 50% of these losses come from fruits and vegetables [3]. However, this type of bioproduct has been undervalued since it is notably rich in polyphenolic compounds, the most important class of natural antioxidants [4] with biological activities promoting health and preventing diseases [5].
Therefore, valorizing waste and food losses is not just an issue of high social impact, but also a significant step towards sustainable waste management. It has become a promising technological and ecological solution, especially for developing products with high added value, such as nutraceuticals or food supplements that benefit human health [6].
According to official figures from the World Health Organization (WHO), cancer is the leading cause of death in the world. In 2020 alone, almost 10 million deaths were attributed to this disease, and around a third of these were attributed to a low intake of fruits and vegetables [7]. The above, added to the current lifestyle, which is characterized by stress and the intake of harmful substances, causes a significant increase in long-term semi-pathological conditions such as oxidative stress, one of the leading causes of chronic diseases related to cancer. This underscores the urgent need for research and innovation in the field of health-promoting ingredients [8].
Proanthocyanidins or condensed tannins (CT) are natural polymers with molecular weights of up to 30,000 Da whose structural unit is flavan-3-ol, mainly catechin (Ca) and epicatechin (Ep), linked by interflavanic bonds [9]. These metabolites are widely available in the plant kingdom; it is estimated that they are the fourth most abundant type of biomass material [10], and grape seeds contain one of the richest sources of CT [11], grapes (Vitis vinifera L.) being one of the most abundant fruit crops in the world, with an annual production of 75.8 million metric tons [3].
Numerous studies have demonstrated the broad spectrum of bioactivity of CT, mainly their antioxidant, anti-inflammatory, anti-neurodegenerative, antimicrobial, anticancer, and cardioprotective activity [12,13,14,15,16]. However, its biological activities are related to its main degree of polymerization (mDP). It has been reported that monomeric and oligomeric units of up to 5 flavan-3-ol units can pass into the bloodstream. In comparison, polymeric units (about five monomers units) are not absorbable through the gastrointestinal tract [17], because of their absorption represents around 1% in humans [13,18]. Therefore, it is an emerging challenge to develop effective methods to convert condensed tannins into bio accessible small molecules [19].
The depolymerization of CT is carried out through a unimolecular nucleophilic substitution reaction (SN1), where the first step and determining the reaction rate is the formation of the carbocation upon breaking the interflavanic bond, which is activated by increasing the temperature above 65 °C in the presence of H+. The second step consists of the reaction between the carbocation formed and the nucleophile (Nü), generally a thiol or phloroglucinol, which must be in excess [20,21,22].
Recently, the depolymerization of CT to oligomers has been studied to increase their bio accessibility, using procedures with high temperatures and the use of nucleophiles of high commercial value such as catechin (Ca), epicatechin (Ep), epicatechin gallate (EpG) [23,24,25], captopril [19], tiopronin [26], and sulfite/catechin mixtures [27]. In addition, these reactions have been carried out in conditions not suitable for food purposes since they use methanol as a solvent, leading to the formation of adducts that are not found in nature.
Due to its prevalence in the plant kingdom, gallic acid (GA) is a highly accessible and low-cost phenolic acid; therefore, it has been widely used as a standard to determine the total polyphenol content (TPC) of various analytes, taking advantage of the Folin–Ciocalteau assay [4]. In this context, GA has been widely recognized as an effective antioxidant, with the potential to be used in the food industry to reduce lipid oxidation [28] and manufacture bioactive antioxidant packaging [29,30], among others.
In this study, we propose a method for depolymerizing polymeric condensed tannins (P) that can be implemented in a food-grade setting using a Generally Recognized as Safe (GRAS) solvent. By optimizing the heating process of the reaction with eco-friendly technologies like microwave assistance (M) and the use of an accessible and low-cost Nü, we aim to produce natural monomers with high antioxidant capacity. These monomers could be a significant addition to the food industry’s arsenal of health-promoting ingredients, with the potential to prevent chronic diseases related to cancer.

2. Materials and Methods

2.1. Chemicals and Reagents

Grape seed CT was obtained from Laffort (Bordeaux, France). GA for synthesis was obtained from Merck (Darmstadt, Germany). Sodium hydroxide reagent grade ≥98% (NaOH) pellets (anhydrous), sodium acetate, acetic acid, Cysteamine hydrochloride (Cys), 2,2′-azino-bis-3-ethylbenzothiazoline-6-sulfonic acid diammonium salt (ABTS●+), 2,2-diphenyl-1-picrylhydrazyl (DPPH●), analytical standard of (+)-catechin and (−)-epicatechin, and primary reference standard of epicatechin gallate and catechin gallate (purity ≥ 99%) were obtained from Sigma-Aldrich (Sigma-Aldrich, Steinheim, Germany). Ethanol pa (purity ≥ 99.9%) from Merck KGaA (Darmstadt, Germany), hydrochloric acid from Merck (Darmstadt, Germany), Milli-Q water (Elga Purelab® system, Griefswald, UK), and deionized water were used as solvents.

2.2. Characterization Extract of Condensed Grape Seed Tannins and Their Reaction Products

2.2.1. Total Polyphenol Content (TPC)

TPC was determined by the Folin–Ciocalteu method using the procedure described by Wang et al. (2016) [16], in which the Folin–Ciocalteu reagent must be used and then measure the absorbance at 760 nm in a spectrophotometer. The result of this measurement is expressed as the content of total phenols equivalent to gallic acid per gram of dry-weight polyphenol (GAEmg/g) and its equivalent molar concentration of gallic acid (GAEmol/L).

2.2.2. Structural Monomers Analysis and Mean Degree of Polymerization (mDP)

In this study, we aimed to analyze the depolymerization of CT. To achieve this, we followed the standardized protocol of Bianchi et al. (2016) [21] with slight modifications. This protocol involves the use of thiolysis reactions using Cys and hydrochloric acid (HCl). Specifically, 0.5 mg/mL of P was dissolved in methanolic hydrochloric acid pH 0.5 containing 25 mg/mL of Cys and placed in a thermostatic bath (TB) under a hood for 1 h at 60 °C. The reaction was stopped immediately by placing the reaction vessel in a water/ice bath and adding NaOH 5N until pH 3 was reached. The products were liofilized and then stored at −20 °C for later analysis.
The determination of the monomers structural units and the mDP of the CT was carried out with precision and reliability using a UHPLC/UV (UHPLC; Thermo Scientific Dionex UltiMate 3000, Waltham, MA, USA) analysis. This method employs a wavelength of 280 nm to determine the molar concentration (mol/L) of each flavan-3-ol monomer released from the condensed tannins. The mDP of CT could be estimated using Equation (1) [21].
m D P = [ F e x t ] + [ F t e r ] [ F t e r ]
where [ F e x t ] : molar concentration (µmol/L) of the total flavan-3-ol extension units released (flavan-3-ol/thioethers) after thiolysis; [ F t e r ] : molar concentration (µmol/L) of the total terminal flavan-3-ol units released (native flavan-3-ol) after depolymerization.

2.2.3. Chromatographic Analysis by Ultra-High-Performance Liquid Chromatography (UHPLC)

Samples were analyzed by reverse-phase high-performance liquid chromatography (UHPLC; Thermo Scientific Dionex UltiMate 3000, Waltham, MA, USA). Samples were filtered through a 0.22 μm PTFE filter and separated on a C18 column (5 μm, 4.6 × 150 mm, Thermo Scientific, Waltham, MA, USA). The system contains a quaternary pump, an autosampler, a column thermostat, an ultraviolet (UV) detector, and a photodiode array detector (DAD).
For the quantification of the condensed tannins and reaction products, the chromatographic conditions were an injection volume of 10 μL, a flow rate of 1 mL/min, and a column temperature of 30 °C. The mobile phase consisted of phase A, trifluoroacetic acid/water (0.1:100 v:v), and phase B, water/acetonitrile (1:4 v/v) containing 0.08% trifluoroacetic acid. The detection of polyphenols obtained was carried out at 280 and 545 nm. The peaks were integrated into the chromatograms, and the external standard method was used for quantification of the concentrations of the reaction products.

2.2.4. Structural Free Radical Scavenging Activity

ABTS●+ (2,2′-azino-di-[3-ethylbenzothiazoline sulfonate]) radical scavenging capacity was performed using absorbance measurements [31], which is expressed as a percentage of inhibition of ABTS Equation (2).
% A B T S   i n h i b i t i o n = A c o n t r o l A m i x t u r e A c o n t r o l 100
The DPPH● assay was performed according to the procedure described by Toro-Uribe et al. (2019) [18], which is expressed as a percentage of DPPH inhibition (Equation (3)).
% D P P H   i n h i b i c i o n = A c o n t r o l A m i x t u r e A c o n t r o l 100
where A c o n t r o l : absorbance of the mixture of ethanol and ABTS●+ solution at 734 nm or DPPH● at 517 nm; A m i x t u r e : absorbance of the sample solution mixture.

2.2.5. Mean Particle Diameters (MPD) and Polydispersity Index (PDI)

The MPD and PDI were measured using a dynamic light scattering instrument (DLS) (Litesizer 500, Anton Paar, Ashland, VA, USA) [32]. Before analysis, the suspensions were diluted with an appropriate buffer (sodium acetate and acetic acid buffer; 0.1 M; pH 3.0 ± 0.1) to prevent multiple dispersion effects.

2.3. Studies of Grape Seed Condensed Tannins’ Thermal Resistance and Microwave Behavior (CT)

The heating effect on CT was studied by comparing a thermostatic bath (TB) and a Microwave Reaction Platform (M) (MULTIWAVE 5000 Platform with 20SVT Rotor capacity 20 PTFE vessel, Anton Paar, Ashland, VA, USA). For this analysis, a 32 × 21 multilevel factorial experimental design was used (Table 1). A total of 1 mg/mL of CT was dissolved in 50% ethanol pH 3 and heated for 60 min at 40, 60, and 80 °C in both instruments, i.e., TB and M, respectively, taking samples every 5 min. The effect of temperature on the suspension’s TPC was analyzed according to the previously described methodologies.

2.4. Chemical Depolymerization of Grape Seed Tannins by Depolymerization with Gallic Acid

2.4.1. Food-Grade Depolymerization of Grape Seeds Condensed Tannins (CT)

Depolymerization was carried out through unimolecular nucleophilic substitution (SN1) reactions [20,21] using gallic acid as a chain-disrupting nucleophile with food-grade modifications. According to the experimental design described below, different masses of condensed tannins were dissolved in aqueous ethanol with HCl pH 0.5 and dispersed by sonication for two minutes. Some reaction parameters were set according to the results previously obtained in this study and by other authors to analyze the effect of the solvent change; for this, the temperature was 60 °C, and the pH was 0.5 [21,24,33].
After the addition of different masses of gallic acid and a 60 min incubation in a Polytetrafluoroethylene (PTFE) vessel for microwave synthesis, the reaction was brought to a halt. This was achieved by immediately placing the reaction vessel in a water/ice bath and carefully adjusting the pH to 3 by adding 5 N NaOH. The final suspensions of depolymerized condensed grape seed tannins (P-Dep) were then lyophilized and stored at −20 °C for further analysis.

2.4.2. Optimization of the Chemical Depolymerization Reaction

The depolymerization optimization procedure was carried out by studying the effect of the solvent and its interaction with the reagents (solvation capacity) using aqueous ethanol in different volume/volume percentage %(v/v) (S), CT, polymers from now on (P) and GA with variable concentrations. A 51 × 22 multilevel factorial experimental design was proposed, as described in Table 2. Once the reaction is optimized, its kinetics will be studied by reproducing the optimal depolymerization methodology and taking samples at different times up to 60 min of the reaction.
The response variable Reaction Yield ( R Y ) is calculated according to Equation (4), considering the results obtained by UHPLC detailed in Section 2.2.3.
R Y = [ P A   ] [ P R ] [ P A ] 100
where R Y : percentage of reaction yield (%); [ P A ] : molar concentration of added polymers (mol/L); and [ P R ] : molar concentration of remaining polymers (mol/L).

2.5. Optimized Depolymerization Analysis

2.5.1. Kinetics Reaction Analysis

The kinetics of the reaction were analyzed by plotting the change from polymeric to monomeric flavan-3-ol. Therefore, the depolymerization kinetics were studied based on PA, PR, GA, and Ep as a molar concentration as a function of time were followed. Typical mathematical models for reaction kinetics were used. The fit of the models was verified using the coefficient of determination (R2) using CurveExpert Professional software (version 2.7.3., Hyams, D. G.), where P A : molar concentration of added polymers (mol/L); P : polymeric condensed tannins (mol/L) P R : number of polymers remaining after depolymerization (mol/L); and P D e p : amount of all species in suspension after depolymerization (mol/L).

2.5.2. Kinetics Color Measurement

Color analysis of condensed tannins and reaction products at different reaction times was performed using a HunterLab colorimeter (HunterLab, Reston, VA, USA), which uses a D65 illuminant to simulate daylight to achieve a homogeneous measurement; the samples were placed in a thin layer of 3 mm on a white background.
Color was expressed in terms of the parameters L*, a*, and b* according to the CIELab scale. The color difference (∆E*) between the P and P-Dep suspensions control was calculated using Equation (5).
Δ E * = ( Δ L * ) 2 + ( Δ a * ) 2 + ( Δ b * ) 2
where (∆E*): total color difference between the P suspension sample and the P-Dep suspension reaction product; (∆L*): luminosity difference between the P suspension sample and the P-Dep suspension reaction product; (∆a*): change in green–red color between the P suspension sample and the P-Dep suspension reaction product; and (∆b*): change in blue–yellow color between the P suspension sample and the P-Dep suspension reaction product.
The color intensity of the samples was calculated through the difference in the chroma (∆C*) values using Equation (6).
Δ C * = ( Δ a * ) 2 + ( Δ b * ) 2

2.6. Statistical Analysis

All statistical analyses were performed using STATGRAPHICS Centurion (XVI v.16.1.03 software, StatPoint Technologies, Inc., Warrenton, Ashland, VA, USA). The results were expressed as mean values ± standard error. Differences were tested with ANOVA. The confidence level was set at 95% (p < 0.05). The model’s fit was verified using the coefficient of determination (R2), and the standard deviation and residual analysis program were used.

3. Results

3.1. Characterization Extract of Grape Seed Condensed Tannins

3.1.1. Physicochemical Characterization

Characterization of P was carried out according to the methodologies previously described, which are summarized in Table 3.

3.1.2. Determination of Molecular Structures and Mean Degree of Polymerization

The analysis of molecular structures and average degree of polymerization was carried out following the methodology described in Section 2.2.2 and Section 2.2.3, in which the chromatograms of Figure 1 and described in Table 4 were obtained.
Chemical structures obtained by thiolysis are shown in Table 4.

3.1.3. Studies of the Effect of Temperature on the TPC in P Comparing 2 Heating Methods: Microwave (M) and Thermostatic Bath (TB)

The results of the experimental design proposed in Section 2.3 are shown in Table 5.
The corresponding statistical analysis are shown in Table 6.

3.1.4. Evaluation of the Fit of the Kinetic Model of TPC Decay Under Treatment Conditions

The TPC results were adjusted as a function of time for the different temperature levels and heating methods, as shown in Figure 2 and Table 7.
The adjustment of the results is shown in Table 7.

3.2. Chemical Depolymerization of P with GA

3.2.1. Feasibility of Depolymerization of P Whit GA and Reaction Optimization

Two response variables and three experimental factors were specified as described in Table 2.
The selected design has 20 runs, with 1 sample to be taken in each run. The default model is cubic with 10 coefficients, as shown in Table 8.
Table 9 shows the ANOVA analysis for Reaction Yield (RY) and Mean Particle Diameter (MPD); this analysis considers the effect of the variables separately, as well as their interactions.
The statistical models were adjusted to the response variables. Two models with p-values below 0.05 indicate that the fitted model is statistically significant at 5.0%. Also, the R-squared statistics show the percentage of variation in the response that the adjusted model has explained. The R-squared values varied from 67.59% to 83.21%.
The optimal characteristics of the experimental factors were determined and established for each factor: S = 80% (v/v); P = 3.4 × 10⁻² (mol/L) = 10 (mg/mL); and GA = 3.4 × 10⁻² (mol/L) = 5.88 (mg/mL), establishing an optimal proportion P/S = 0.1 (% m/v) and P/GA 1.0 (mol/mol). With these characteristics, the response variables generate a desirability index of 100%.

3.2.2. Optimized Depolymerization Kinetics Analysis

The concentrations of P (where added polymers PA and remaining polymers PR), GA (from the suspension of P), and the main depolymerization product of Ep were analyzed over time in the mix suspension of depolymerized P (P-Dep), along with their respective linearized models, as shown in Figure 3.
The equations corresponding to the linearization of the molecules studied in the reaction are presented below in Table 10.

3.2.3. Optimized Depolymerization Color Analysis

Changes in color parameters were analyzed over reaction time for P-Dep, as shown in Figure 4.
Linear regressions for the color parameters during depolymerization are shown in Table 11.

3.3. Antioxidant Capacity

The antioxidant capacity of P, GA, and P-Dep was evaluated using the tests described in Section 2.2.4, which are shown in Table 12.

4. Discussion

4.1. Discussion of Characterization Extract of Grape Seed Condensed Tannins

The physicochemical characterization of P indicates that the TPC, approximately 230 GAEmg/g, is a high value since according to the portal antioxidants from the Institute of Nutrition and Food Technology (INTA), Chardonnay, Black seedless, and Crimson grape samples have a TPC of 200, 94, and 53 GAEmg/g in dry weight, respectively [34]. These results are representative of a high antioxidant activity close to 90% inhibition of ABTS●+ and DPPH● radicals, which is due to a high content of equivalent antioxidants of Trolox 8.8 ± 0.3, 9.2 ± 0.7, 9.4 ± 0.6 (mmol/L) for P, P-Dep, and AG, respectively, in agreement with Xu and collaborators, who analyzed the pomace of different grape varieties, finding equivalent antioxidant activities of Trolox of para varieties Viognier 3.5 and Vidal Blanc 7.7 µmol/g [35].
The MPS polymeric dispersions is in a relatively dispersed range with an IPD of 3.5, indicating the presence of P from monomers to at least octamers, consistent with 16.6 µm particle size, an average mDP of 7. 5.
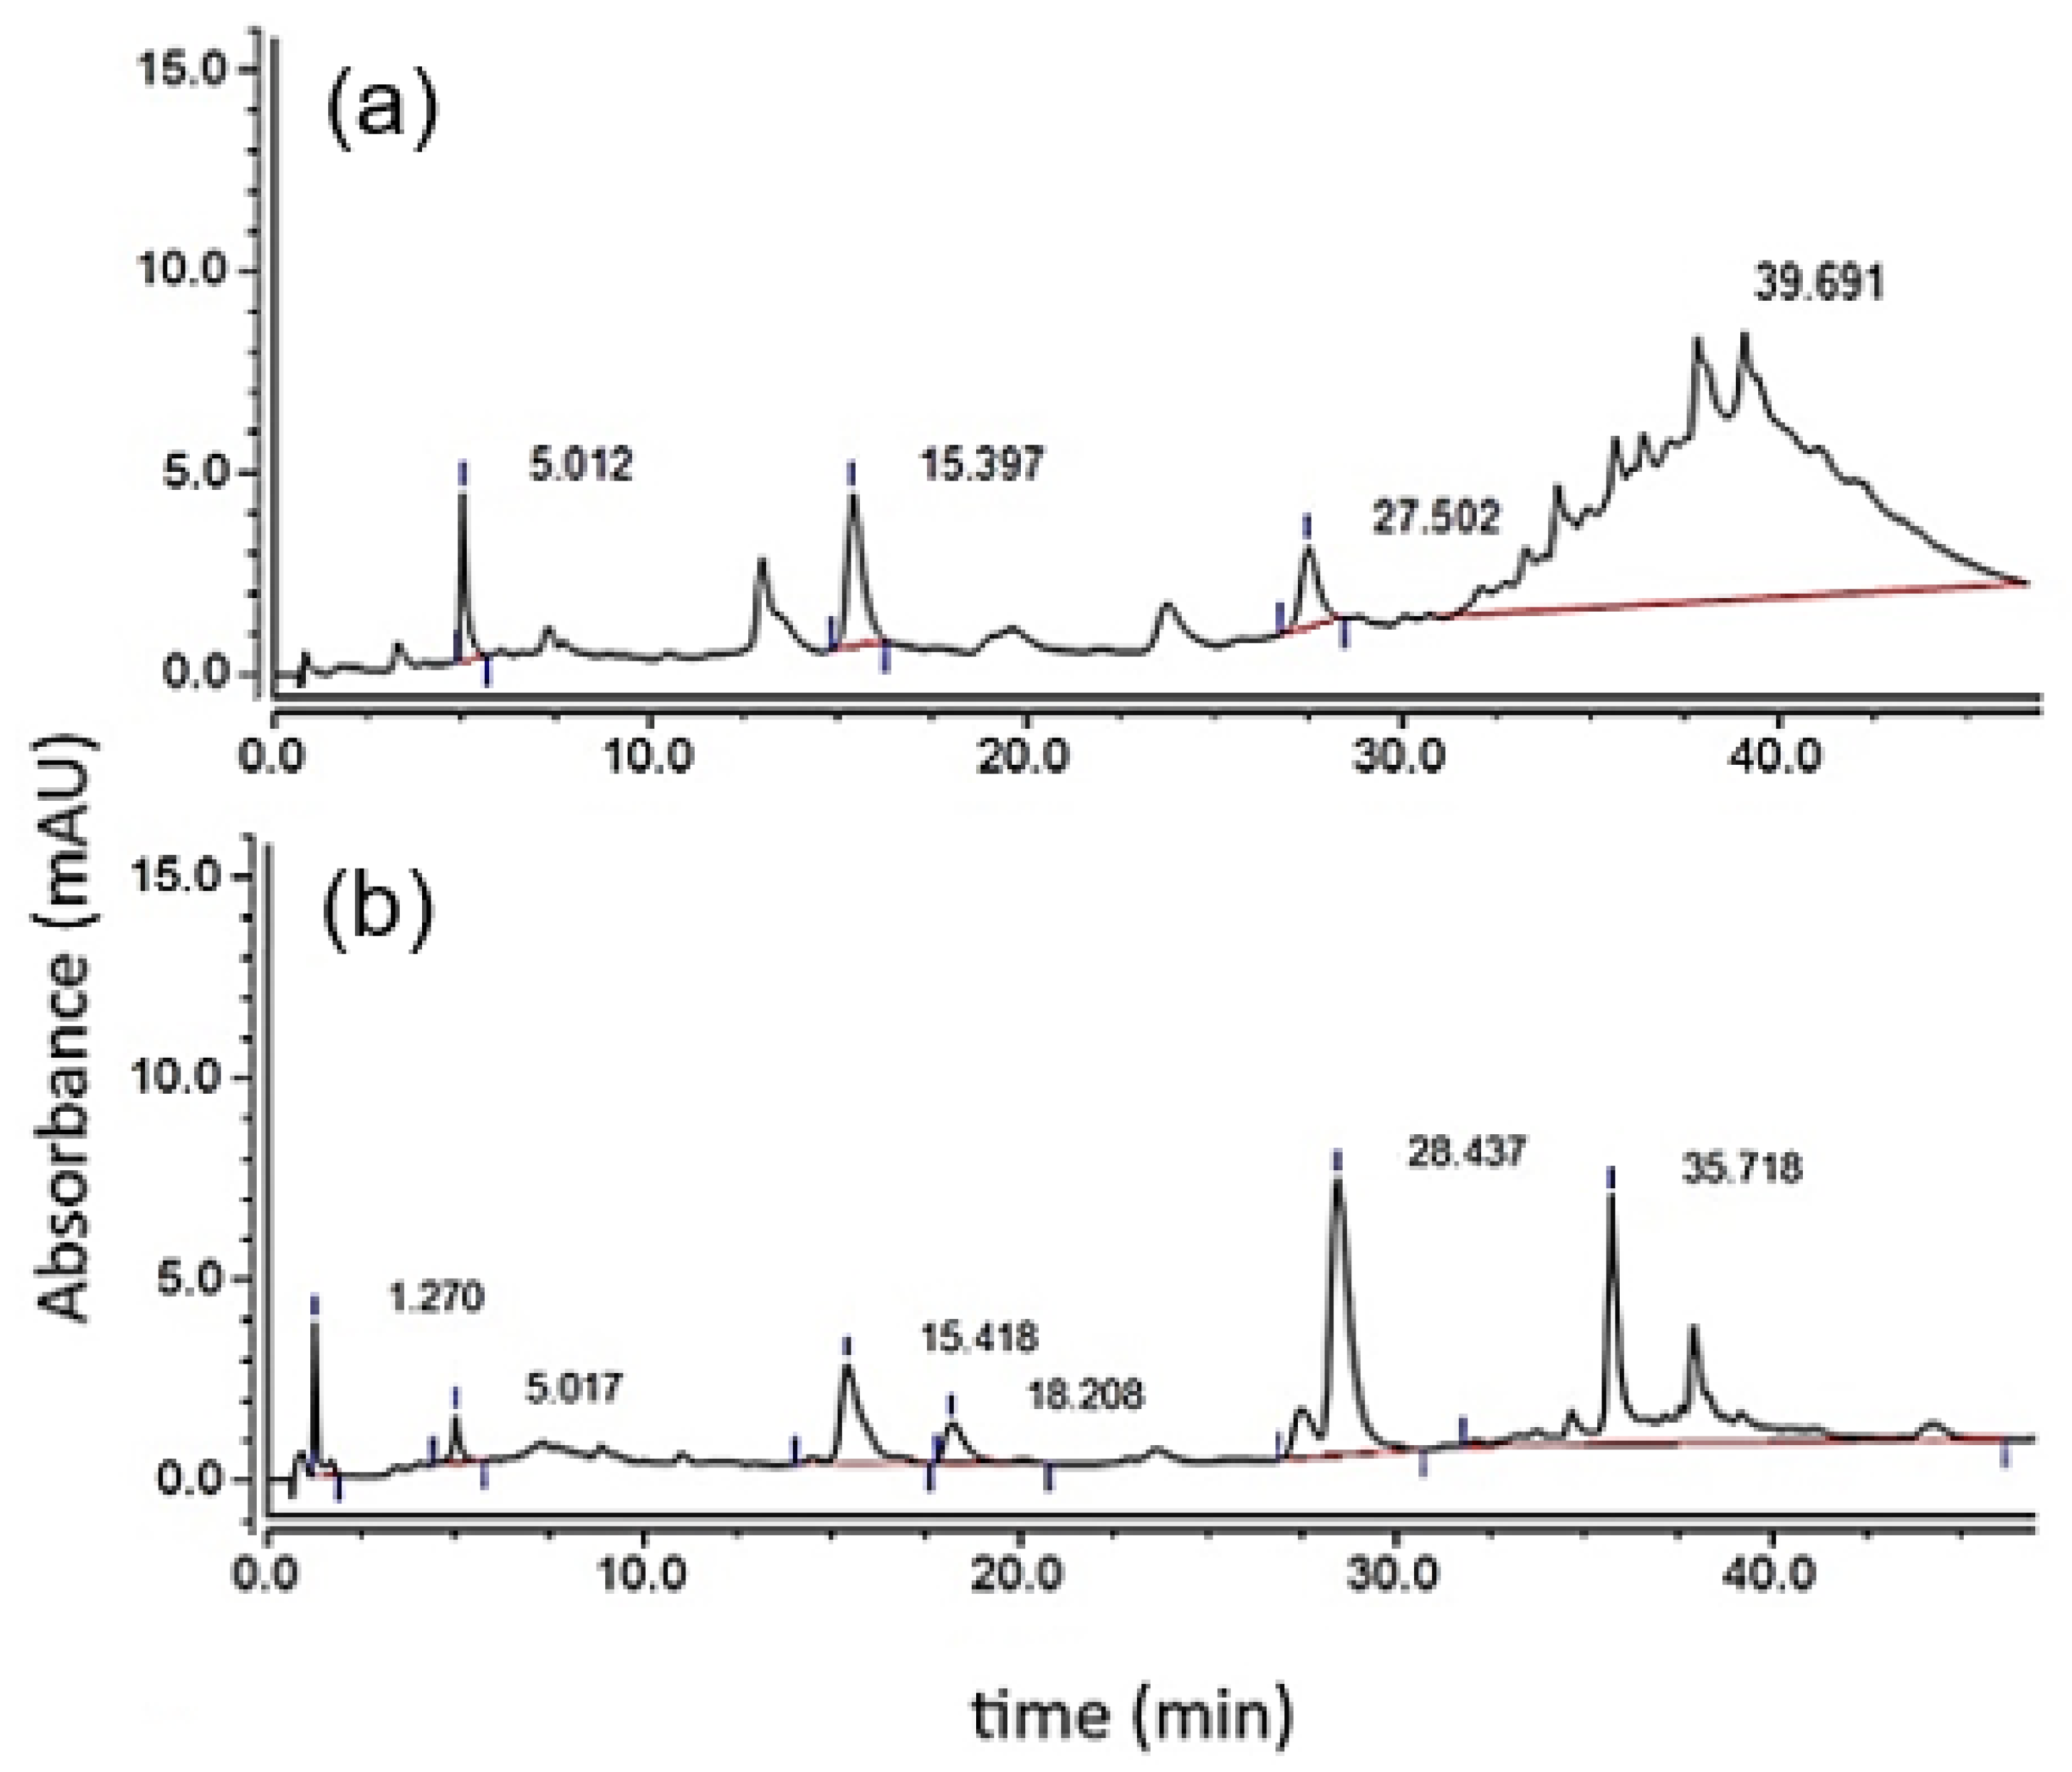
Calibration curves were carried out with an external standard of the main components present in condensed grape seed tannins (P) as reported in the literature to identify the species corresponding to each peak in the chromatograms corresponding to both P and P-Dep: GA (5.0 min), Ca (15.4 min), and Ep (27.5 min) [36]. Additionally, Cys (1.3 min) and thiolated adducts of catechin (18.2 min) and epicatechin (28.4 min) were identified [21] (Table 4). These results are consistent with what was reported by Bianchi and collaborators in their Bioprotocol to determine the m D P of condensed tannins in which it is specified that, although there are no external standards for thiolated compounds, these appear immediately after the monomer with which they formed the adduct [21]. The final peak is seen with a retention time between approximately 35 and 45 min (Figure 1a); these multiple peaks correspond to the condensed tannins fractions—that is, to flavan-3-ol polymers [37,38]. Furthermore, the 28.4 min area increase can be seen (Figure 1b), which corresponds to the thiolated adducts of extensional Ep, confirming that Ep is the main monomer of the P under study. This peak overlapped with terminal Ep, so they had to deconvulse [39].
Table 4 identifies the percentage of added P ( P A ) contained in the tannin samples, which corresponds to more than 90% of the total mass. The main degree of polymerization ( m D P ) of 8, which is indicative that this fraction of the sample is highly polymeric [13,40]. Furthermore, the depolymerization reaction yield with cysteamine under these conditions was 57.5%.

4.2. Studies of the Effect of Temperature on the TPC in P Comparing Two Heating Methods: Microwave (M) and Thermostatic Bath (TB)

In Table 5, it is possible to see that there is a decrease in the measured TPC values when the samples of P are subjected to heating both in a microwave synthesis platform and in a thermostatic bath. It is clear that TPC decay is present in all the TB tests and only in M at 80 °C. In contrast, there is no decay for TPC in M at 40 °C and M at 60 °C, providing a stable environment for our experiments.
Studies that have investigated the impact of temperature on polyphenol yield are mainly based on drying fruits and vegetables and extracting polyphenols from them. These studies have provided information on the thermal lability of plant polyphenols from different plant materials, which have indicated that external heat induces the loss of polyphenol content [41,42].
Thermal degradation is the most common mechanism explaining the drop in polyphenol yield during high-temperature extractions, as conventional extraction studies have shown that thermal degradation generally occurs at 80 °C [43]. However, it is important to consider that the duration of heating, storage conditions before heating, and exposure to oxygen play important roles in determining the effect of temperature on polyphenols [44].
It is also important to note that antioxidants can not only oxidize in the face of temperature increases; they can also degrade. In research carried out by Palma et al., the results of the extraction of polyphenols with boiling methanol (65 °C) showed that catechin experienced a 40% reduction in its concentration [45], while Loncaric and collaborators demonstrated that increasing the temperature to 100 °C causes shorter half-lives of catechin and epicatechin [46].
It should be noted that the studies are not carried out directly on a specific type of antioxidant as has been carried out in this study, and they involve all the components of the fruits and/or vegetables studied. In this sense, it has been shown that extracts with a higher carbohydrate content and lower tannin purity tend to have decreased thermal stability [47]. Therefore, the effect of heating under the proposed conditions is carried out directly on the antioxidants, without room for other types of reactions and, consequently, other degradation products.
To understand the behavior of polyphenols during exposure to high temperatures, it is necessary to understand all the factors that affect this parameter. Thermal degradation of different types of polyphenols occurs at different temperatures but depends on the pretreatment, type of solvent, pH, treatment time, environment, and source of the material. Regarding the antioxidant capacity, it is possible to observe that it follows the same thermal degradation pattern as phenolic compounds [48].
In this study, it is observed that there is a decline in the TPC; however, when comparing these values with what is described in the literature, it is possible to see that the TPC value continues to be within the averages for antioxidant extracts. The lowest TPC value recorded in this experiment was for TB 80 °C at 60 min and corresponds to 87.5 ± 2.1 (Table 5) (EAGmg/g), while Chardonnay, Black seeds, and Crimson grape samples have a CFT of 200, 94, and 53 EAGmg/g in dry weight, respectively [34].
Regarding the ANOVA analysis of the results, three effects are significant (Table 6) since they have a p-value < 0.05, indicating that they are significantly different from zero with a confidence level of 95.0%. Furthermore, the model fit describes that the experimental design factors predict 70% of the TPC.
The literature consistently shows that increasing temperature and time significantly affects TPC. However, this study also shows that the method by which these compounds are heated has a significant effect.
Microwaves are electromagnetic fields ranging from 300 MHz to 300 GHz with two perpendicular oscillating fields: electric and magnetic [49]. It is considered a non-thermal and “green” technology since it conforms to the criteria established by the Environmental Protection Agency (EPA) due to reduction in reaction times, energy consumption, use of solvents, and CO2 emissions in comparison with conventional heating methods [43].
Therefore, microwave equipment is a non-contact heat source that can provide more effective heating, accelerating energy transfer and reducing the thermal gradient [50]. Grigoras et al. (2012) [51] conducted a comparative study of conventional methods, maceration, and extraction using pressurized liquid, ultrasound, and microwaves. The microwave-assisted methodology provided the highest concentration of bioactive compounds in the apple extract. Boukroufa et al. (2015) [52] presented a study from laboratory to pilot scale for the extraction and separation of volatile and non-volatile compounds from boldo leaves using microwaves, concluding that this provided lower energy and time consumption because hydrodistillation required 30 min to initiate azeotropic distillation, while microwave-assisted extraction only required 5 min. This research indicates that microwaves quickly raise the volumetric temperature without overheating the surface, provide better process control, and achieve greater energy efficiency than conventional heating methods [53]. Some authors suggest that electric fields can alter the conformation of molecules, which are susceptible to structural changes that affect their functionality [54,55], as microwaves do not possess the energy necessary to break covalent bonds [35,56].
When comparing traditional and novel thermal processes, the discussion should focus on matching the temperature profiles since the results do not depend on any given mathematical model but on thermodynamic and molecular parameters [57]. Finally, it should be noted that microwave heating is an isothermal process where the temperature of the samples is uniform. In addition, the heating occurs due to the stretching and contraction of the bonds of the molecules with a high dielectric constant (water). In contrast, in conventional heating, the thermal gradient causes a higher temperature on the surface of the reactor and, therefore, the stretching of the bonds of all the molecules (in this case, the phenolic groups), giving them energy to activate oxidation reactions [58].
In 
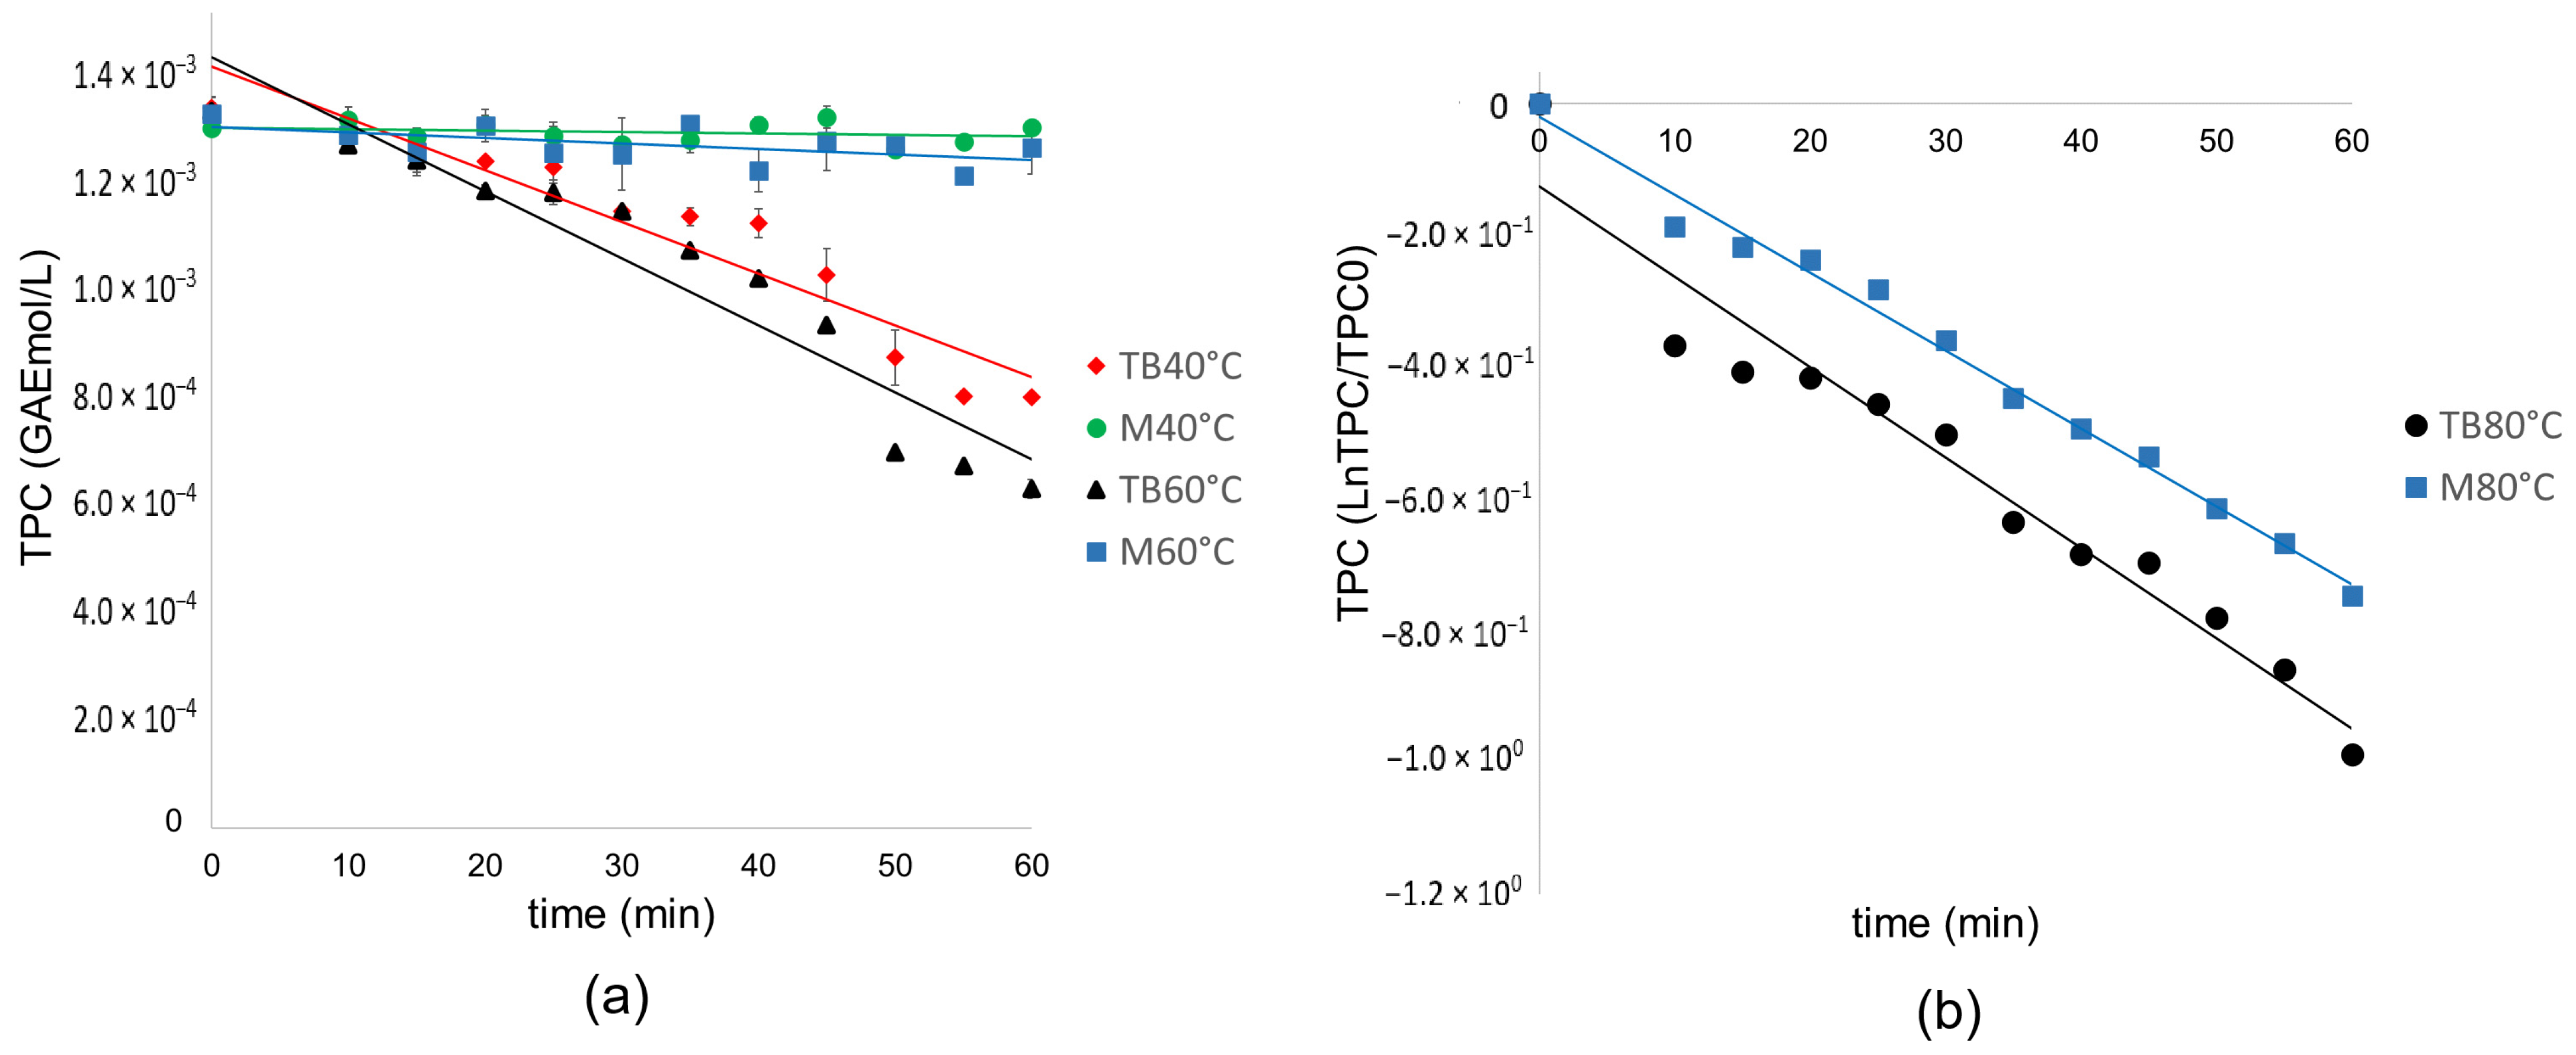
Figure 2a, for the M 40 °C and M 60 °C runs, there is no significant degradation of the TPC, which is why the data do not fit any reaction model and have a dispersion within the standard deviation.
The linear regression plots (Table 7) were fitted with a higher coefficient of determination to the equation TPC = k t + TPC0 in which TPC corresponds to the molar concentration of equivalent polyphenols of gallic acid, therefore following a zero-order reaction model for TB 40 °C and TB 60 °C; however, a change is seen in the degradation mechanism for TB 80 °C, adjusting to a first order linear regression, which indicates that at this temperature the concentration of one species is affecting the degradation mechanism oxidation. This same behavior is observed for M80 °C, which fits a first-order linear regression.
It has been shown that flavonoids’ antioxidant activity is due to aromatic OH groups (phenols). Polyphenols’ chemical properties, in terms of the availability of phenolic hydrogens as hydrogen donor radical scavengers, suggest that they will have antioxidant activity [59].
Although the degradation rate depends on temperature, the number of soluble solids, and pH, several authors report that these kinetics follow first-order kinetics [60,61,62]. Zapata and collaborators (2001) showed that the thermal degradation of phenolic compounds follows first-order kinetics in the range of typical food processes (70–90 °C). The antioxidant activity of the extracts is directly related, following the same pattern [48], and Loncaric and collaborators (2018) demonstrate that the thermal degradation of catechin and epicatechin follows first-order kinetics [46].
The reducing capacity of flavan-3-ol involves a complex oxidation process that varies depending on the pH; it is produced by a consecutive proton donation mechanism by which phenol is converted into a phenoxyl radical (semiquinone), which is reversible, followed by electron transfer by which this radical is converted into quinone, which is irreversible [63]. These structures are almost identical to the original flavan-3-ol and cannot be detected by conventional methods such as thiolysis [41].
It is inferred that in TB at 40 °C and 60 °C, the oxidation mechanism occurs by deprotonating the benzene catechol ring and following zero-order kinetics. Therefore, it is inferred that this oxidation occurs without depending on the concentration of the species.
For TB80 °C and M80 °C, the oxidation mechanism follows two steps: deprotonation and electron transfer. These results agree with previous research in which it is shown that thermal degradation in general for polyphenols occurs at 80 °C [43]. In comparison, the degradation of condensed tannins remains low at temperatures that do not exceed 50 °C [41]. Let us consider that water contains approximately 9 mg/L of oxygen in a saturated state. Ethanol can contain up to 40 mg/L (under standard pressure and temperature conditions) [64]; it is important to highlight that the reactors are closed in this study. The reaction occurs under reflux, which indicates that there may be a redissolution of oxygen. Low temperatures have been considered to inhibit the degradation of active ingredients. However, low temperatures significantly increase operation times [41]. Therefore, this study seeks to use the highest possible temperature with a non-significant loss of TPC in microwaves, which is 60 °C, demonstrating that this method is optimal for heating polyphenols in contrast to the thermostatic bath.

4.3. Feasibility of Depolymerization of P Whit GA, Reaction Optimization and Kinetics Analysis

Table 8 describes the experimental design and results obtained for optimizing the P depolymerization reaction. In general, the reaction is feasible for all experimental runs, with an RY over 70% and, under optimized conditions, around 100%.
In the case of RY, there are four significant effects: the percentage of ethanol (S); the P/S ratio; and, in turn, the interaction between them; and finally, the interaction between P/S and P/GA (Table 9).
The chemical methods investigated for the depolymerization of polymeric CT with the addition of (+)-catechin, (−)-epicatechin, and (−)-epigallocatechin gallate as a chain-disrupting nucleophile pose a significant limitation in their use due to their high costs. In addition, they include the use of catalysts or alcoholic solutions of mineral acids that raise problems in terms of their toxicity, flammability and environmental impact [23,65]. Due to this, in this work, it is proposed to use a highly accessible and low-cost nucleophile, such as GA, and a GRAS solvent such as ethanol.
However, chemical reactivity can change dramatically in different solvents, and it is not always clear which solvent properties will affect reaction rates [66]. In solution, all participants in a chemical reaction are solvated, both reactants and products, including intermediates and transition states. However, the system under study does not represent a solution but rather a polymeric dispersion, in which the dispersed particles have molecular sizes of the order of microns, while a molecule of water or ethanol represents less than 1 nm. However, as described in the literature, CT is soluble in water and ethanol; this is due to the large number of phenols, which can form hydrogen bonds with this type of polar protic solvents, which does not happen with their monomers, which have a very low solubility in water [67].
Then, the ethanol/water ratio is influential in three respects: in the solubility of the reactants, where, on the one hand, the GA dissolves in both solvents; in the solubility of the products, where the catechin and epicatechin monomers are better solubilized as the proportion of ethanol increases; and finally, in the dielectric constant (ε), which increases as the water content increases. The ε represents the ability of the solvent to dissociate a solute into ions through interatomic and intermolecular interactions [68]. This last variable becomes very important in this context in which microwaves assist the reaction. Some researchers have reported that the degradation of CT under microwaves occurs at a temperature above 60 °C, and the mDP of the products decreases gradually [27,69].
Water, methanol, and ethanol have ε of 79.99, 33.30, and 24.55 (in standard pressure and temperature conditions), respectively [70], and theoretically, 80% ethanol in 20% water has an ε of 35.64, similar to methanol—that is, the solvent generally used in the depolymerization of condensed tannins [21].
So, although, in a microwave-assisted reaction, the greater the ε of the solvent, the greater the reaction rate is expected to be; on the other hand, we have the opposite effect on the solvation of the products. This premise can be inferred based on the MPD results. For the MPD, it is observed that only the percentage of ethanol has a significant effect, this is because the solvent has an effect on the solubility of the products, which is reflected in their agglomeration; so, the more aggregated the products are, it means that their affinity with the solvent decreases; therefore, they will look for a way to reduce their energy again by condensing and reversing the reaction, impacting a decrease in the RY. Stepwise polymer growth occurs slowly in condensation reactions, but eventually, long chain polymers are formed [71].
In water, as the reaction proceeds, the particle size decreases, so their solvation should increase; however, the opposite effect occurs since, although CT is soluble in water, the monomers do not have aqueous solubilities at acidic pH (1.7) GA 86.76 mg/mL catechin and epicatechin 5.59 mg/mL [72]; this effect can be seen by increasing the percentage of ethanol from 0 to 50% v/v, in which the MDP decreases drastically. Although most reactions occur in aqueous media, much remains to be understood regarding their interactions, especially with other more complex particles, considering their sensitivity to factors such as temperature or the presence of an electric field [73]. This last factor becomes important in this reaction since this external “stress” factor is associated with ionic migration processes, the change in the orientation of the molecular dipole moments, the length of bonds in a molecule, and the distribution of charges in an atom. More information about how depolymerization occurs can be obtained by analyzing the optimized reaction over time.
The reaction’s efficiency is approximately 100%, likely due to the suitable nucleophile and the electromagnetic wave inducing a polarization reaction in the macromolecular structure. The polar bonds quickly absorbed the microwave energy, leading to a decrease in activation energy, an increase in reaction activity within the polar bonds, and an enhancement of the depolymerization effect [27,69].
These results are mainly because depolymerization occurs by the formation of a flavan-3-ol carbocation followed by the formation of an adduct with the GA nucleophile, which forms an ester between catechin/epicatechin, a GA homologous to catechin/epicatechin gallate. However, under the reaction conditions, this ester is hydrolyzed, giving rise to epicatechin monomer and the recovery of GA [74].
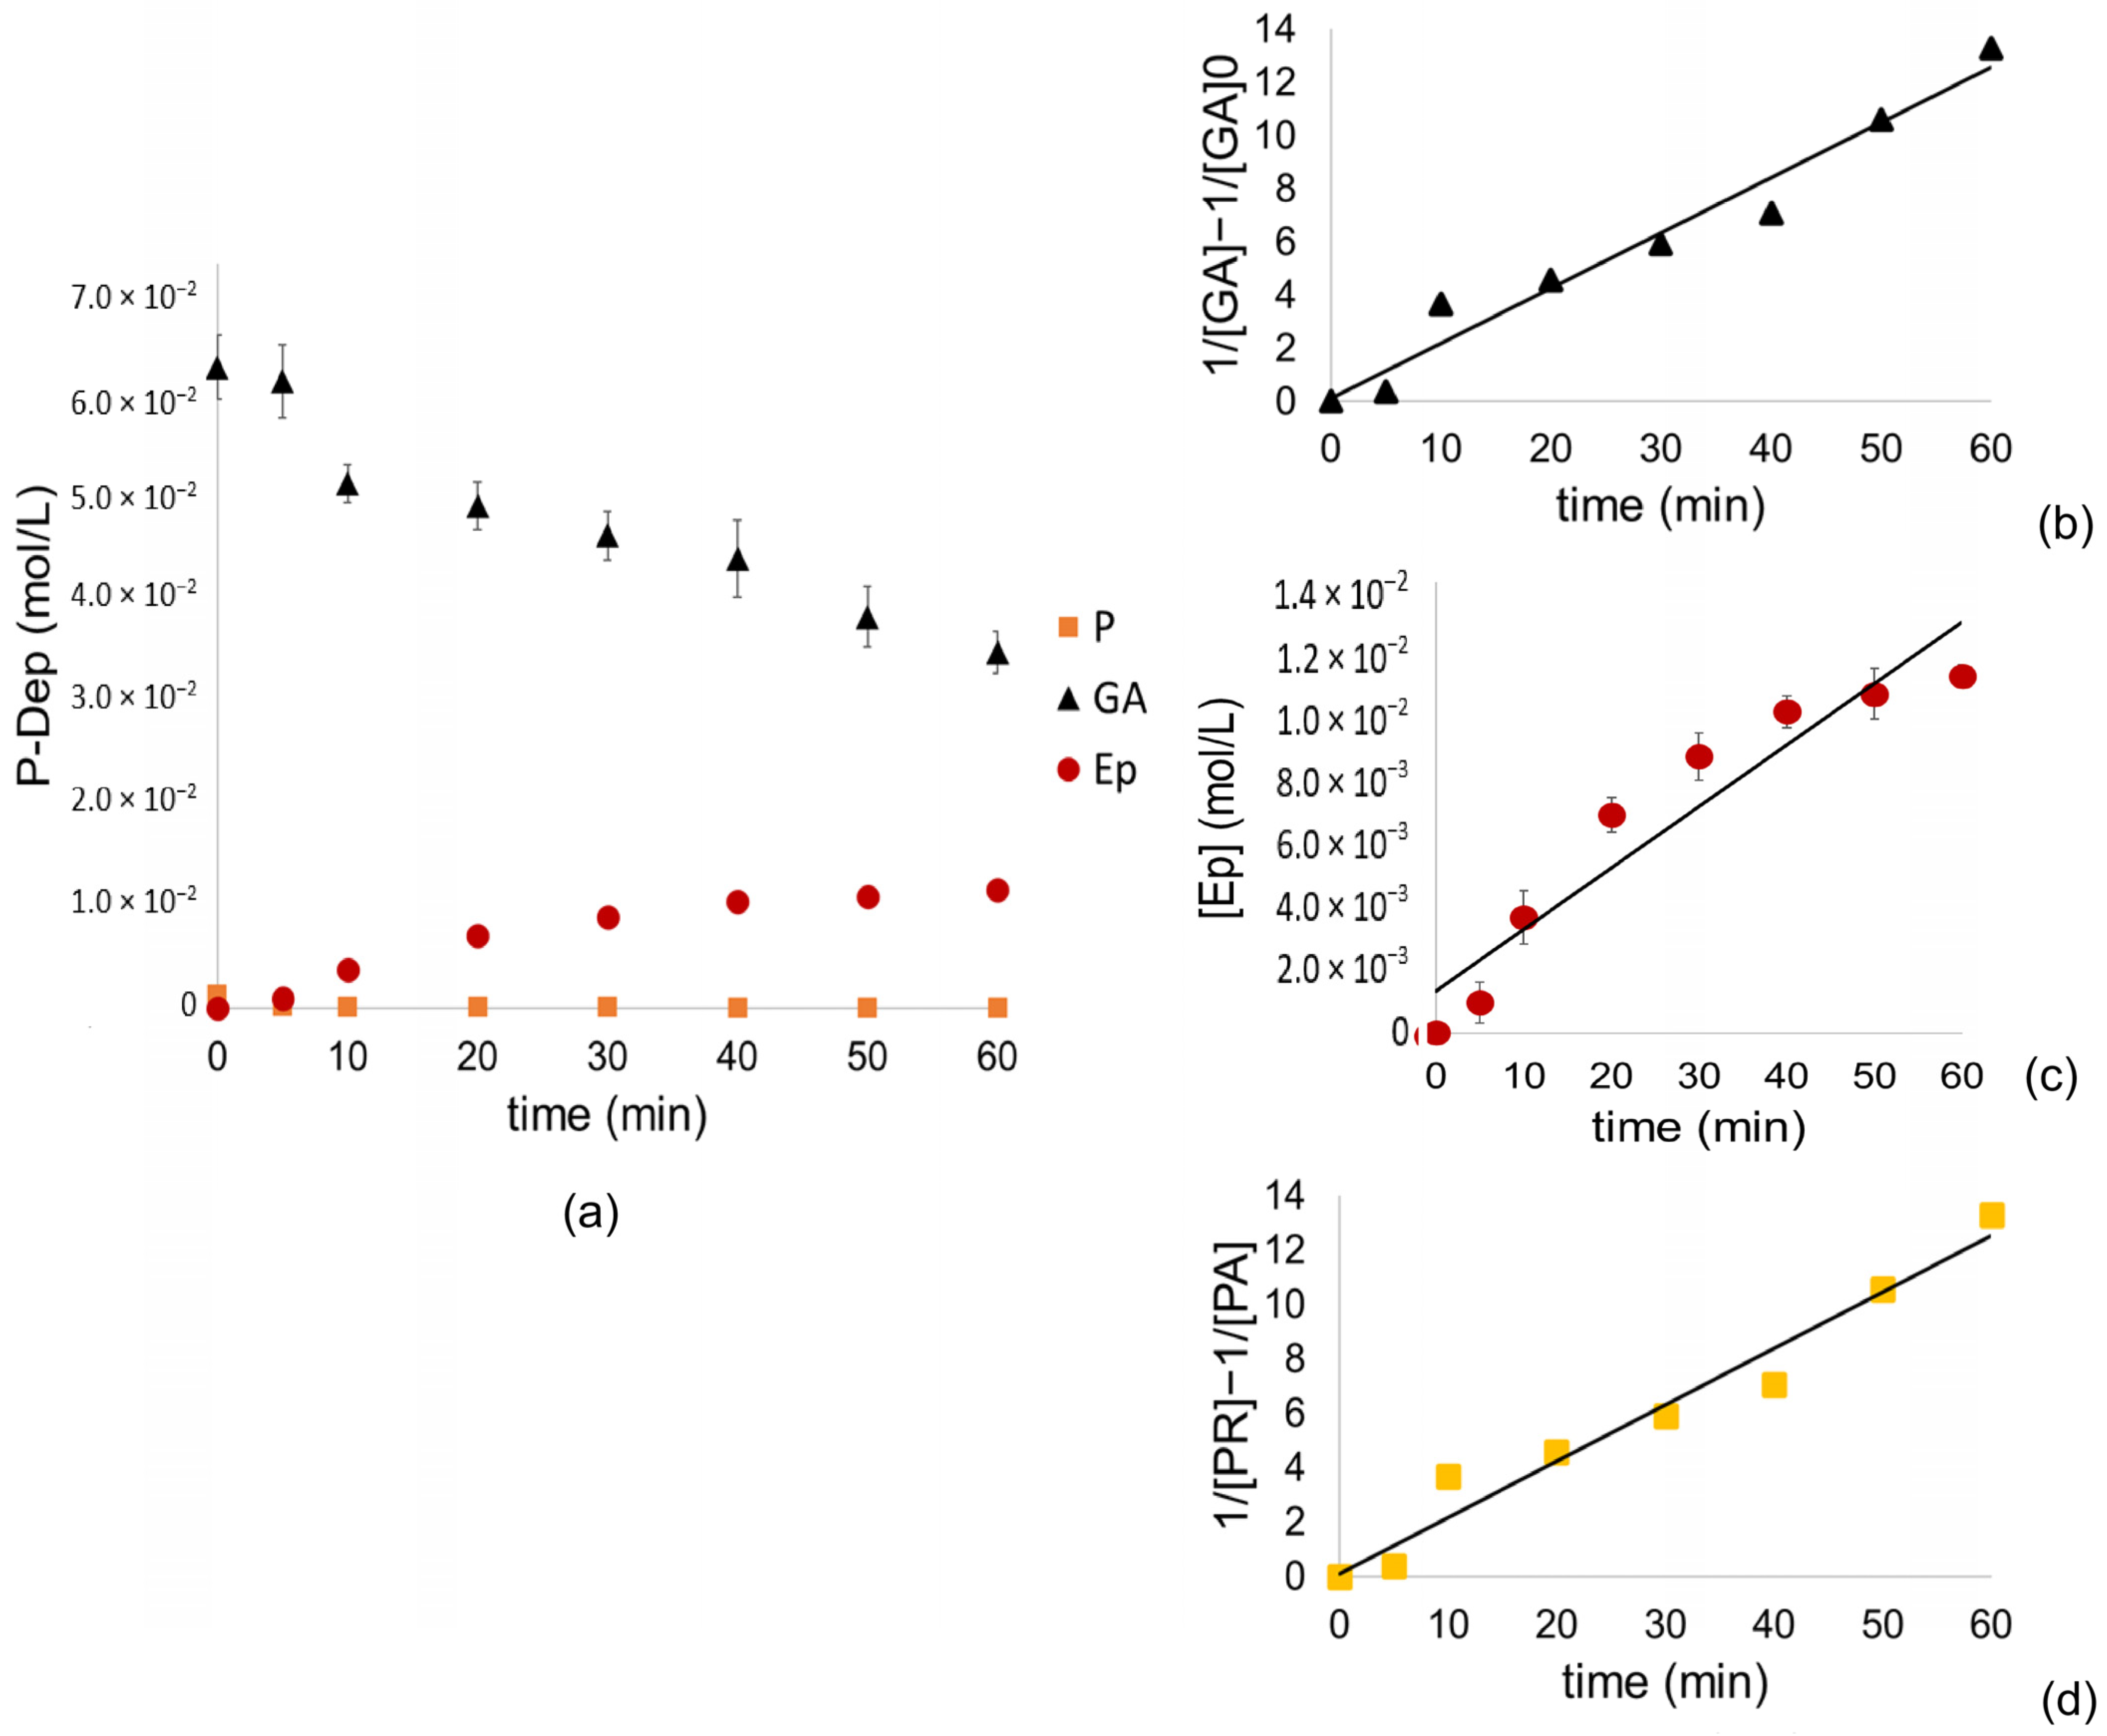
Therefore, the formation of epicatechin does not depend on the concentration of AG or P in this case, following a constant rate formation with zero-order kinetics (Figure 3c) since it relies on the formation of the carbocation, the nucleophilic attack and the hydrolysis of the ester consecutively, processes that are spontaneous in these reaction conditions. However, it is complex to understand all the processes that may be involved in the formation of the final products; it has been described in the literature that the main reaction products can follow several fragmentation routes, including quinone cleavage, retro-cleavage, Diels–Alder, heterocyclic ring fission, and gallate loss [24,40].
On the other hand, it is possible to observe an abrupt drop in the concentration of PR during the first 5 min of the reaction, which results in a linear adjustment of second-order kinetics. The same adjustment is observed for GA, which could be consumed by forming adducts with cyanidins formed by the oxidation of catechin and epicatechins [24,40,65].
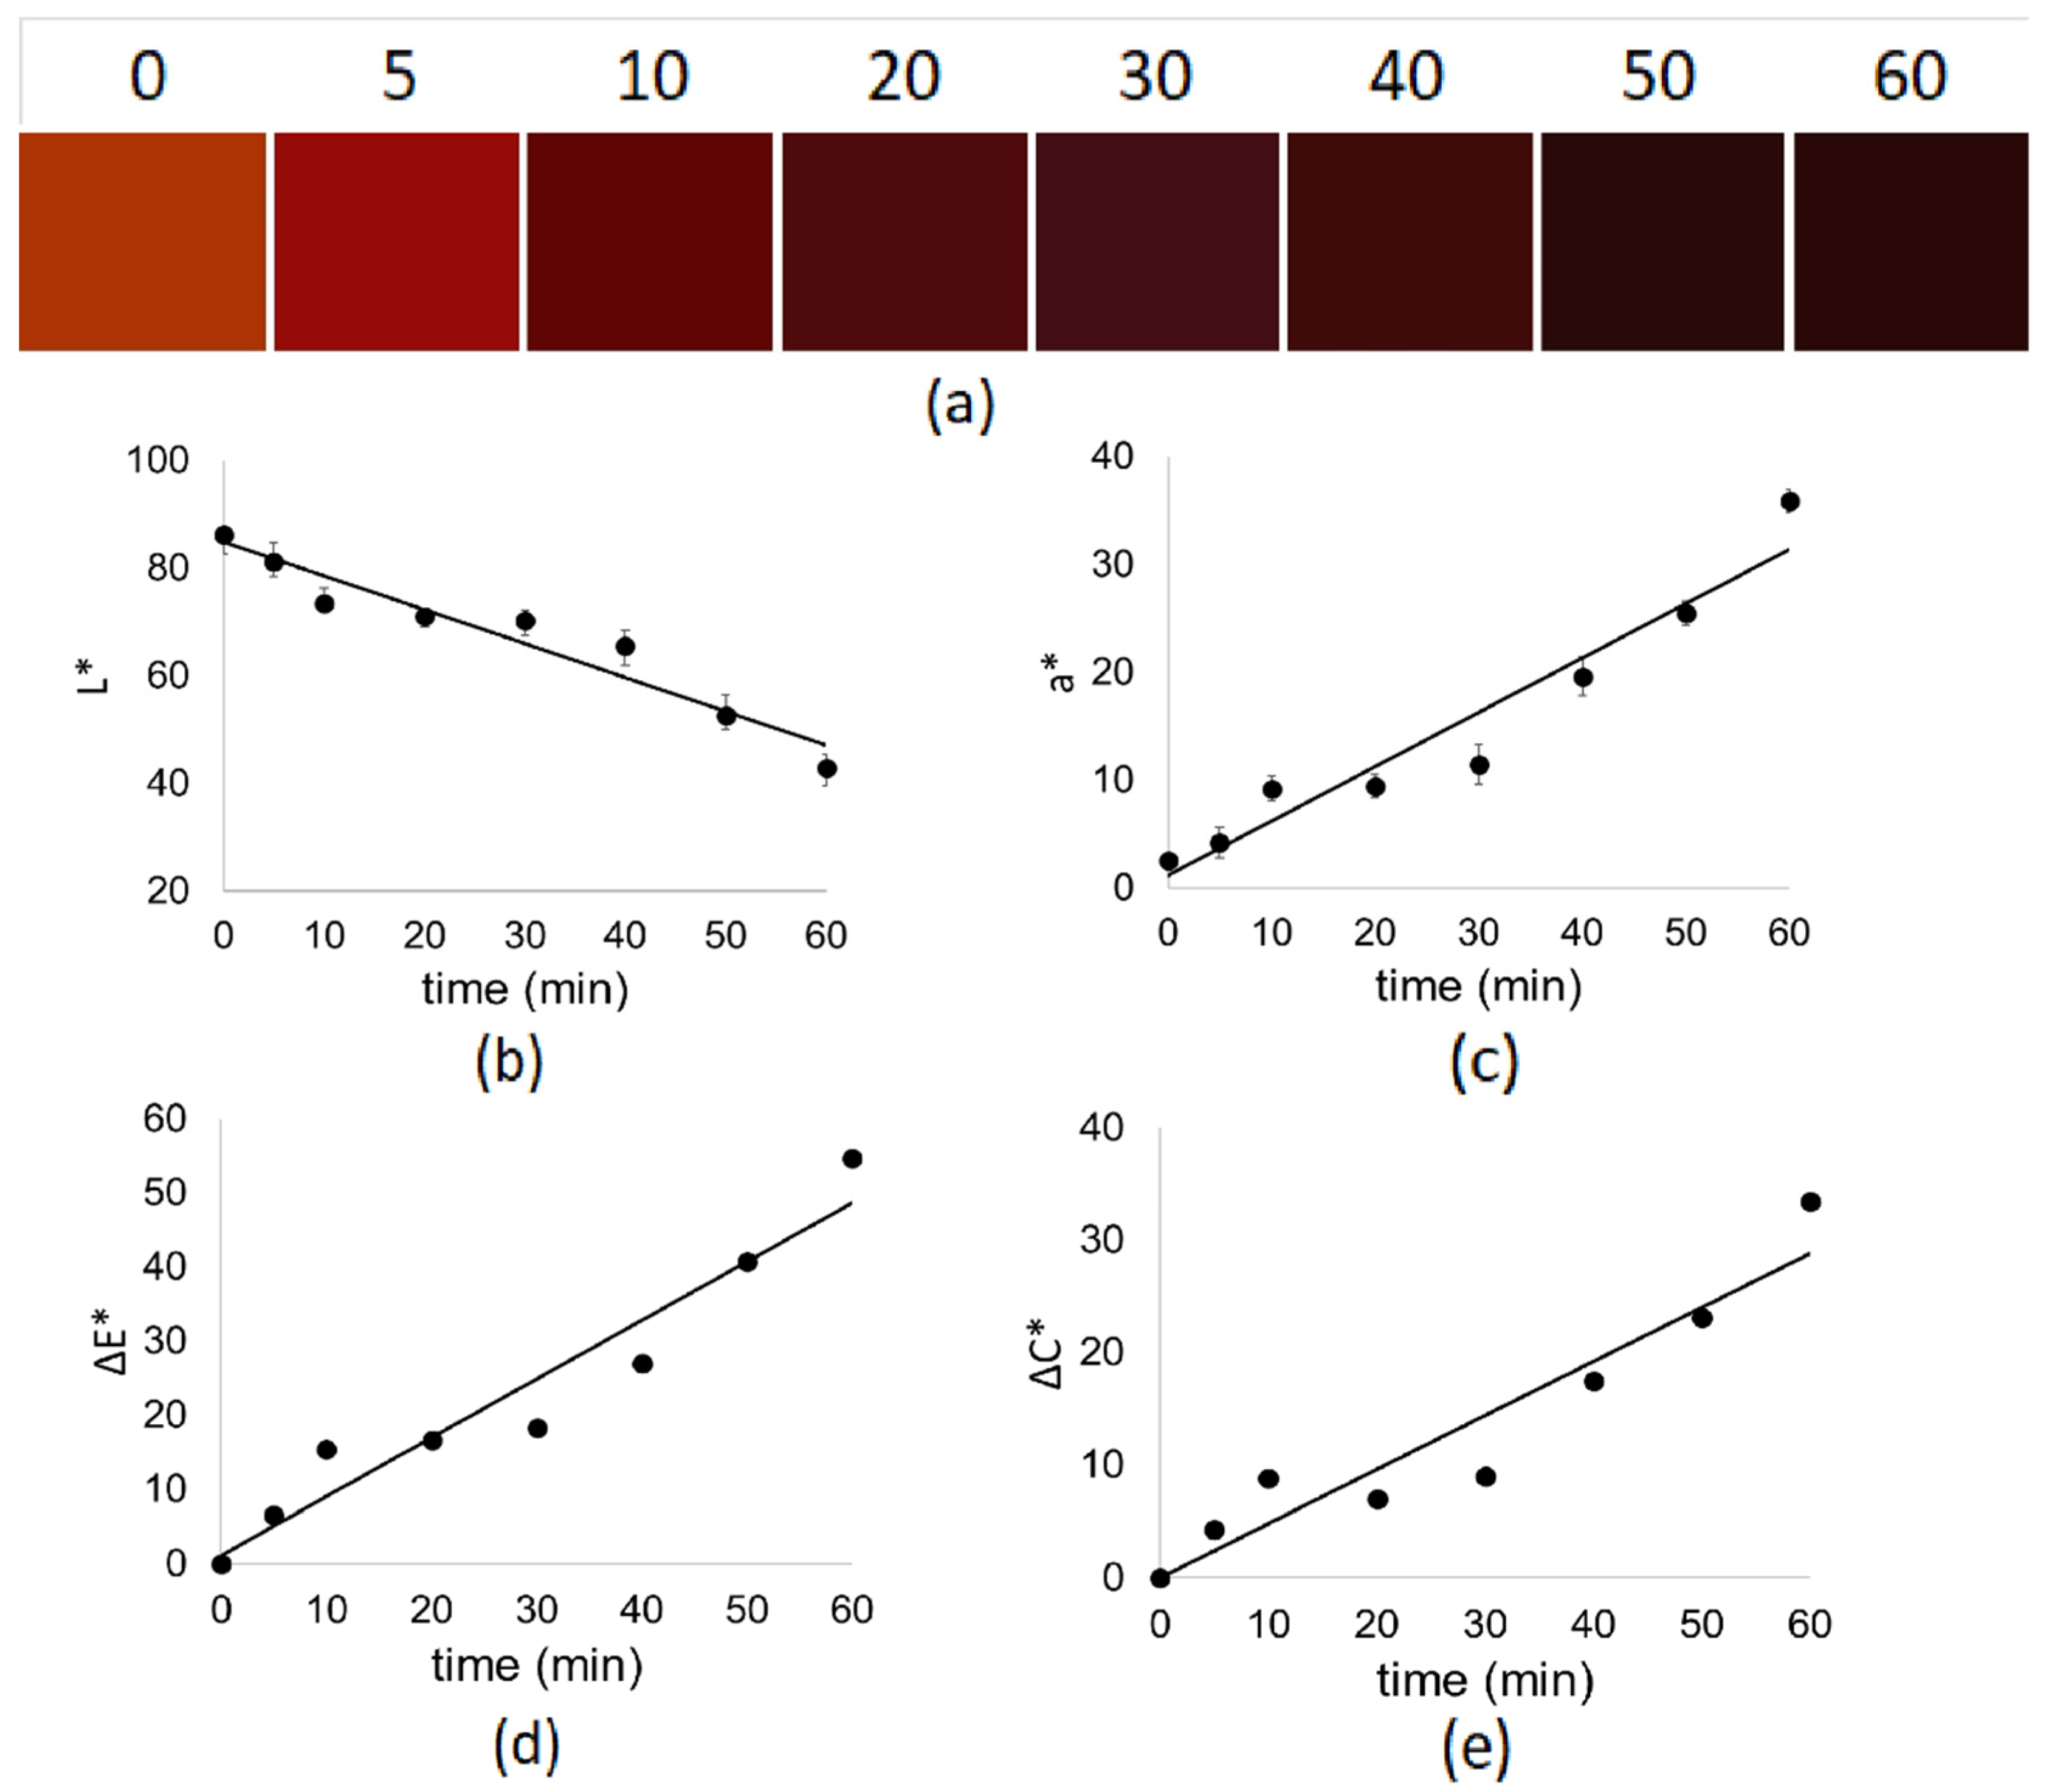
When analyzing the reaction products by UHPLC in the absorption range of 545 nm, seven chromatographic peaks at 36.8 can be seen: 39.6; 41.6; 43.6; 44.2; 45.0; and 49.1 min (Figure S1). These peaks do not appear in the suspension at 0 time and increase over time with zero-order kinetics (Table S1). This absorption range is typical for cyanidings, one of the main formation products of the cleavage of procyanidins in acid alcohol [40].
Ethanol recovery is crucial for enhancing the sustainability and cost-effectiveness of our process. This solvent can be efficiently recovered via vacuum evaporation using a rotary evaporator, a well-established technique for solvent recovery in polyphenol extraction [75,76]. The solvent can be further purified through nitrogen bubbling and ultrasonication, which ensures minimal solvent loss and prevents oxidation of bioactive compounds [77]. Studies indicate that over 90% of ethanol can be recovered under optimized vacuum conditions, significantly reducing solvent consumption [75,78].
Implementing solvent recovery systems reduces operational costs and minimizes environmental impact, aligning with sustainability goals in green chemistry applications [79,80].

4.4. Optimized Depolymerization Color Analysis

It is possible to observe a variation in the suspension’s color as a function of the reaction time, which changes from orange-brown, the color of P, to an intense dark red (Figure 4a); this is reflected in the change of the ∆E* and ∆C* parameters (Figure 4d and Figure 4e, respectively).
The results obtained from the color analysis support the hypothesis of cyanidin formation due to the appearance of its typical red color in acidic pH [81]. This is reflected in the increase in the a* parameter (Figure 4c). As the reaction time progresses, a decrease in the L* parameter is observed (Figure 4b) due to the increase in cyanidin concentration [82]. All parameters follow zero-order kinetics (Table 11), consistent with the kinetics of cyanidin formation (Table S1), so the color in this reaction can be considered a parameter of the reaction’s efficiency in terms of cyanidin formation as they have a constant formation rate independent of the concentration of other molecules [83].

4.5. Discussion of Antioxidant Capacity

It is possible to observe an increase in the TPC for P-Dep compared to P (Table 12), which is highly beneficial for this study. The P-Dep inhibited the DPPH● radical by 88.2%, higher than that reported by Li and collaborators (2023), where the maximum DPPH● elimination rate in their experimental design was 81.26% [27]. Furthermore, it is also possible to see that the inhibition percentage for ABTS●+ radicals is higher for P-Dep by 4.2%, exceeding 90% inhibition.
This phenomenon is due to the “break” of the interflavanic bonds, which makes it possible to expose antioxidant groups (hydroxyls) and promote the release of more electrons. Added to this effect, the decrease in molecular size promotes more significant binding to DPPH● sites, avoiding the steric impediments that CT has [27,84].
Previous studies on depolymerization have mainly focused on optimizing experimental conditions and separating and identifying the resulting compounds. As a result, these studies often overlook assessing the antioxidant capacity of the obtained products [20,21,23,24,25]. However, research by Wen et al. has shown an increase in antioxidant capacity following depolymerization. The free radical scavenging ability of the antioxidant was quantified using the IC50 index, which represents the concentration needed to eliminate 50% of DPPH● radicals. The IC50 values for proanthocyanidins decreased as the degree of polymerization increased, ranging from 50.6 to 54.3 mg/mL [22].

4.6. Economic Analysis and Future Perspectives

To evaluate the feasibility of the microwave-assisted depolymerization process of grape seed condensed tannins using gallic acid as a nucleophile, we assessed the market value of the products and the cost of consumables and reagents.
The primary product of the depolymerization process is epicatechin, a flavanol with significant antioxidant properties used in pharmaceuticals, nutraceuticals, and cosmetics. The market price of high-purity epicatechin ranges between USD 200 to USD500 per gram, depending on the supplier and purity grade [79,85].
The major consumables in our process include ethanol (solvent) and gallic acid (nucleophile). Industrial-grade ethanol costs approximately USD 1 to USD 3 per liter, while gallic acid is priced at around USD 50 to USD 100 per kilogram [80,86]. Based on our optimized reaction conditions (80% v/v ethanol, 10 mg/mL polymeric tannins, and 5.88 mg/mL gallic acid), the cost per liter of reaction mixture is relatively low compared to the commercial value of epicatechin.
Transitioning from laboratory-scale experiments to pilot-scale production requires designing microwave reactors capable of handling larger volumes while maintaining reaction uniformity [76,78,79]. Developing a continuous flow microwave-assisted extraction system could improve production rates and process efficiency. Continuous microwave processing has been successfully applied in polyphenol extraction and enhances reaction reproducibility [76,79,87]. After depolymerization, purification steps such as membrane filtration and chromatography will be employed to isolate high-purity epicatechin. Advanced spectroscopic and chromatographic techniques will confirm the structural integrity and antioxidant activity of the final product [79,80]. Given the food-grade nature of our approach, regulatory approval pathways must be explored. This will facilitate the incorporation of epicatechin into food, nutraceutical, and pharmaceutical formulations [79,85].

5. Conclusions

This study demonstrates that grape seed condensed tannins can be efficiently depolymerized under food-grade conditions using microwave-assisted heating, ethanol as a Generally Recognized as Safe (GRAS) solvent, and gallic acid as a nucleophile. Thermal analysis confirms that total polyphenol content (TPC) degradation follows first-order kinetics above 80 °C in microwaves, while depolymerization follows second-order kinetics, yielding epicatechin as the primary product with zero-order formation kinetics. Optimization of the reaction conditions—80% v/v ethanol, 10 mg/mL polymeric tannins, and 5.88 mg/mL gallic acid—resulted in a 99.9% reaction yield, with a mean particle diameter of 5.7 nm. The final product retained a high TPC (297.3 ± 15.9 mg EAG/g) and strong antioxidant activity, inhibiting ABTS●+ and DPPH● radicals by 93.5 ± 0.9% and 88.2 ± 1.5%, respectively. These findings provide a sustainable and scalable approach for valorizing food waste by converting condensed tannins into bioavailable antioxidant compounds, reinforcing the potential of microwave-assisted methodologies in food chemistry applications. The main reaction product of this study is the epicatechin, a high-value compound, while maintaining low process costs. Solvent recovery through vacuum evaporation achieves over 90% efficiency, further enhancing sustainability. Future developments focus on scaling up with continuous flow systems, improving purification methods, and ensuring regulatory compliance to support industrial applications in food, nutraceuticals, and pharmaceuticals.

Supplementary Materials

The following supporting information can be downloaded at https://www.mdpi.com/article/10.3390/polym17050682/s1, Figure S1: UHPLC-VIS chromatogram at 545 nm for TSD samples after 60 minutes of reaction. Table S1: Linear regressions for the concentration of cyanidin species absorbing at 545 nm, during depolymerization.

Author Contributions

Conceptualization, F.A.O.; methodology, C.F.M. and F.A.O.; software, C.F.M. and F.A.O.; formal analysis, C.F.M. and F.A.O.; investigation, C.F.M. and F.A.O.; resources, F.A.O.; writing—original draft preparation, C.F.M.; writing—review and editing, F.A.O. All authors have read and agreed to the published version of the manuscript.

Funding

This research was funded by: ANID FONDECYT N°1241250 and ANID Doctoral scholarship. F.A.O. acknowledges ANID FONDECYT N°1241250 for their financial support. CFM thanks the ANID national doctoral scholarship: BECA DE DOCTORADO NACIONAL—Año Académico 2019.

Institutional Review Board Statement

Not applicable.

Data Availability Statement

The original contributions presented in this study are included in the article/Supplementary Material. Further inquiries can be directed to the corresponding author.

Acknowledgments

C.F.M. and F.A.O. thank the Anamin Group for access to the Multiwave 5000 equipment.

Conflicts of Interest

The authors declare no conflicts of interest.

Abbreviations

CT: condensed tannins; P: polymeric condensed tannins; P-Dep: Depolymerized condensed tannins; PA: polymeric condensed tannins added to reactor; PR: polymeric condensed tannins remaining after depolymerization; P-Tiol: polymeric condensed tannins after thiolysis; Ep: epicatechin; Ca: catechin; GA: gallic acid; TPC: total polyphenols content; SN1: unimolecular nucleophilic substitution reaction; Nü: nucleophile; mDP: its main degree of polymerization; M: microwave reaction platform; TB: thermostatic bath; S: solvent reaction; MPD: Mean particle diameters; PDI: polydispersity index; RY: reaction yield.

References

  1. Mir-Cerdà, A.; Nunez, O.; Granados, M.; Sentellas, S.; Saurina, J. An overview of the extraction and characterization of bioactive phenolic compounds from agri-food waste within the framework of circular bioeconomy. TrAC 2023, 161, 116994. [Google Scholar] [CrossRef]
  2. Capanoglu, E.; Nemli, E.; Tomas-Barberan, F. Novel approaches in the valorization of agricultural wastes and their applications. J. Agric. Food Chem. 2022, 70, 6787–6804. [Google Scholar] [CrossRef] [PubMed]
  3. González, C.M.; Llorca, E.; Quiles, A.; Hernando, I.; Moraga, G. An in vitro digestion study of tannins and antioxidant activity affected by drying “Rojo Brillante” persimmon. LWT 2022, 155, 112961. [Google Scholar] [CrossRef]
  4. Molski, M. Enhancing bioactivity through the transfer of the 2-(Hydroxymethoxy) Vinyl Moiety: Application in the modification of Tyrosol and Hinokitiol. Molecules 2024, 29, 3414. [Google Scholar] [CrossRef]
  5. Saini, A.; Panesar, P.S.; Bera, M.B. Valorization of fruits and vegetables waste through green extraction of bioactive compounds and their nanoemulsions-based delivery system. Bioresour. Bioprocess. 2019, 6, 26. [Google Scholar] [CrossRef]
  6. Panzella, L.; Napolitano, A. Condensed tannins, a viable solution to meet the need for sustainable and effective multifunctionality in food packaging: Structure, sources, and properties. J. Agric. Food Chem. 2022, 70, 751–758. [Google Scholar] [CrossRef]
  7. Ferlay, J.; Colombet, M.; Soerjomataram, I.; Parkin, D.M.; Piñeros, M.; Znaor, A.; Bray, F. Cancer statistics for the year 2020: An overview. Int. J. Cancer 2021, 149, 778–789. [Google Scholar] [CrossRef]
  8. Manca, M.L.; Casula, E.; Marongiu, F.; Bacchetta, G.; Sarais, G.; Zaru, M.; Escribano-Ferrer, E.; Peris, J.E.; Usach, I.; Fais, S.; et al. From waste to health: Sustainable exploitation of grape pomace seed extract to manufacture antioxidant, regenerative and prebiotic nanovesicles within circular economy. Sci. Rep. 2020, 10, 14184. [Google Scholar] [CrossRef]
  9. Li, W.; Yao, R.; Xie, L.; Liu, J.; Weng, X.; Yue, X.; Li, F. Dietary supplementation of grape seed tannin extract stimulated testis development, changed fatty acid profiles and increased testis antioxidant capacity in pre-puberty hu lambs. Theriogenology 2021, 172, 160–168. [Google Scholar] [CrossRef]
  10. Kraus, T.E.; Dahlgren, R.A.; Zasoski, R.J. Tannins in nutrient dynamics of forest ecosystems—A review. Plant Soil 2003, 256, 41–66. [Google Scholar] [CrossRef]
  11. Ju, Y.-L.; Yang, L.; Yue, X.-F.; He, R.; Deng, S.-L.; Yang, X.; Liu, X.; Fang, Y.-L. The condensed tannin chemistry and astringency properties of fifteen Vitis davidii Foex grapes and wines. Food Chem. X 2021, 11, 100125. [Google Scholar] [CrossRef]
  12. Chen, L.; Zhao, H.; Zi, Y.; Zhang, Y. Fabrication, characterization, and in vitro digestion of bamboo leaf extract loaded liposomes. Food Struct. 2021, 30, 100238. [Google Scholar] [CrossRef]
  13. Jia, B.; Wei, Z.; Kong, X.; Xia, S.; Gan, L.; Han, S. Antioxidant Properties of Larch Tannins with Different Mean Polymerization Degrees: Controlled Degradation Based on Hydroxyl Radical Degradation. J. Agric. Food Chem. 2022, 70, 9367–9376. [Google Scholar] [CrossRef] [PubMed]
  14. Molino, S.; Casanova, N.A.; Rufián Henares, J.A.; Fernandez Miyakawa, M.E. Natural tannin wood extracts as a potential food ingredient in the food industry. J. Agric. Food Chem. 2019, 68, 2836–2848. [Google Scholar] [CrossRef] [PubMed]
  15. Pizzi, A. Tannins medical/pharmacological and related applications: A critical review. Sustain. Chem. Pharm. 2021, 22, 100481. [Google Scholar] [CrossRef]
  16. Díaz, H.S.; Ríos-Gallardo, A.; Ortolani, D.; Díaz-Jara, E.; Flores, M.J.; Vera, I.; Monasterio, A.; Ortiz, F.C.; Brossard, N.; Osorio, F.; et al. Lipid-Encapsuled Grape Tannins Prevent Oxidative-Stress-Induced Neuronal Cell Death, Intracellular ROS Accumulation and Inflammation. Antioxidants 2022, 11, 1928. [Google Scholar] [CrossRef]
  17. De Melo, L.F.M.; De Queiroz Aquino-Martins, V.G.; Da Silva, A.P.; Rocha, H.A.O.; Scortecci, K.C. Biological and pharmacological aspects of tannins and potential biotechnological applications. Food Chem. 2023, 414, 135645. [Google Scholar] [CrossRef]
  18. Toro-Uribe, S.; López-Giraldo, L.J.; Alvarez-Rivera, G.; Ibánez, E.; Herrero, M. Insight of Stability of Procyanidins in Free and Liposomal Form under an in Vitro Digestion Model: Study of Bioaccessibility, Kinetic Release Profile, Degradation, and Antioxidant Activity. J. Agric. Food Chem. 2019, 67, 1990–2003. [Google Scholar] [CrossRef]
  19. Cui, C.; Shi, A.; Bai, S.; Yan, P.; Li, Q.; Bi, K. Novel Antihypertensive Prodrug from Grape Seed Proanthocyanidin Extract via Acid-Mediated Depolymerization in the Presence of Captopril: Synthesis, Process Optimization, and Metabolism in Rats. J. Agric. Food Chem. 2018, 66, 3700–3707. [Google Scholar] [CrossRef]
  20. Kennedy, J.A.; Jones, G.P. Analysis of proanthocyanidin cleavage products following acid-catalysis in the presence of excess phloroglucinol. J. Agric. Food Chem. 2001, 49, 1740–1746. [Google Scholar] [CrossRef]
  21. Bianchi, S.; Kroslakova, I.; Mayer, I. Determination of molecular structures of condensed tannins from plant tissues using HPLC-UV combined with thiolysis and MALDI-TOF mass spectrometry. Bio-Protocl 2016, 6, e1975. [Google Scholar] [CrossRef]
  22. Wen, K.S.; Ruan, X.; Wang, J.; Yang, L.; Wei, F.; Zhao, Y.X.; Wang, Q. Optimizing nucleophilic depolymerization of proanthocyanidins in grape seeds to dimeric proanthocyanidin B1 or B2. J. Agric. Food Chem. 2019, 67, 5978–5988. [Google Scholar] [CrossRef]
  23. Qi, Y.; Zhang, H.; Awika, J.M.; Wang, L.; Qian, H.; Gu, L. Depolymerization of sorghum procyanidin polymers into oligomers using HCl and epicatechin: Reaction kinetics and optimization. J. Cereal Sci. 2016, 70, 170–176. [Google Scholar] [CrossRef]
  24. Liu, H.; Zou, T.; Gao, J.M.; Gu, L. Depolymerization of cranberry procyanidins using (+)-catechin, (−)-epicatechin, and (−)-epigallocatechin gallate as chain breakers. Food Chem. 2013, 141, 488–494. [Google Scholar] [CrossRef] [PubMed]
  25. Bai, R.; Cui, Y.; Luo, L.; Yuan, D.; Wei, Z.; Yu, W.; Sun, B. A semisynthetic approach for the simultaneous reaction of grape seed polymeric procyanidins with catechin and epicatechin to obtain oligomeric procyanidins in large scale. Food Chem. 2019, 278, 609–616. [Google Scholar] [CrossRef]
  26. Suo, H.; Tian, R.; Xu, W.; Li, L.; Cui, Y.; Zhang, S.; Sun, B. Novel Catechin–Tiopronin Conjugates Derived from Grape Seed Proanthocyanidin Degradation: Process Optimization, High-Speed Counter-Current Chromatography Preparation, as Well as Antibacterial Activity. J. Agric. Food Chem. 2019, 67, 11508–11517. [Google Scholar] [CrossRef]
  27. Li, M.; Li, P.; Xu, Y.; Zhang, B.; Li, J.; Zhong, W.; Zang, H.; Zheng, H.; Rong, H.; Ma, F. Degradation of polymeric polyproanthocyanidins from black chokeberry by microwave-assisted nucleophilic technique of sulfite/catechin: Reaction kinetics, antioxidation and structural analysis. Food Chem. 2023, 408, 135220. [Google Scholar] [CrossRef]
  28. Gao, J.; Hu, J.; Hu, D.; Yang, X. A role of gallic acid in oxidative damage diseases: A comprehensive review. Nat. Prod. Commun. 2019, 14, 1934578X19874174. [Google Scholar] [CrossRef]
  29. Tran, T.N. Active antioxidant additives in sustainable food packaging. Sustain. Food Packag. Technol. 2021, 349–367. [Google Scholar] [CrossRef]
  30. Fu, C.; Chen, W.; Quek, Y.L.; Ni, R.; Ghani, A.B.A.; Leong, W.W.Y.; Zeng, H.; Huang, D. Sustainability from agricultural waste: Chiral ligands from oligomeric proanthocyanidins via acid-mediated depolymerization. Tetrahedron Lett. 2010, 51, 6322–6324. [Google Scholar] [CrossRef]
  31. Ali, H.; Al-Khalifa, A.R.; Aouf, A.; Boukhebti, H.; Farouk, A. Effect of nanoencapsulation on volatile constituents, and antioxidant and anticancer activities of Algerian Origanum glandulosum Desf. essential oil. Sci. Rep. 2020, 10, 2812. [Google Scholar] [CrossRef] [PubMed]
  32. Silva-Weiss, A.; Quilaqueo, M.; Venegas, O.; Ahumada, M.; Silva, W.; Osorio, F.; Giménez, B. Design of dipalmitoyl lecithin liposomes loaded with quercetin and rutin and their release kinetics from carboxymethyl cellulose edible films. J. Food Eng. 2018, 224, 165–173. [Google Scholar] [CrossRef]
  33. Luo, L.; Cui, Y.; Cheng, J.; Fang, B.; Wei, Z.; Sun, B. An approach for degradation of grape seed and skin proanthocyanidin polymers into oligomers by sulphurous acid. Food Chem. 2018, 256, 203–211. [Google Scholar] [CrossRef]
  34. Portalantioxidantes.com. Available online: https://portalantioxidantes.com/base-de-datos-de-actividad-antioxidante-orac-y-de-contenido-de-polifenoles-totales-pft-en-frutas/ (accessed on 5 July 2024).
  35. Xu, B.; Wang, L.K.; Miao, W.J.; Wu, Q.F.; Liu, Y.X.; Sun, Y.; Gao, C. Thermal versus microwave inactivation kinetics of lipase and lipoxygenase from wheat germ. J. Food Process Eng. 2016, 39, 247–255. [Google Scholar] [CrossRef]
  36. Li, R.; Wang, Q.; Peng, H.; Zhao, G.; Zhang, D.; Li, Z. Exploring the effect of microwave treatment on phenolic flavonoids antioxidant capacity and phenolic in vitro bioaccessibility of sorghum. Int. J. Food Sci. Technol. 2022, 57, 2510–2522. [Google Scholar] [CrossRef]
  37. Romani, A.; Ieri, F.; Turchetti, B.; Mulinacci, N.; Vincieri, F.F.; Buzzini, P. Analysis of condensed and hydrolysable tannins from commercial plant extracts. J. Pharm. Biomed. Anal. 2006, 41, 415–420. [Google Scholar] [CrossRef]
  38. Laitila, J.E. Composition and evolution of oligomeric proanthocyanidin–malvidin glycoside adducts in commercial red wines. Food Chem. 2021, 340, 127905. [Google Scholar] [CrossRef]
  39. Álvarez Segura, T. Strategies to Find Optimal Resolution in Liquid Chromatography. Ph.D. Thesis, Universitat de València, València, España, 2019. [Google Scholar]
  40. Pan, H.; Wang, Y.; Xu, X.; Qian, Z.; Cheng, H.; Ye, X.; Chen, S. Simultaneous extraction and depolymerization of condensed tannins from Chinese bayberry leaves for improved bioavailability and antioxidant activity. J. Agric. Food Chem. 2021, 69, 11292–11302. [Google Scholar] [CrossRef]
  41. Jylhä, P.; Halmemies, E.; Hellström, J.; Hujala, M.; Kilpeläinen, P.; Brännström, H. The effect of thermal drying on the contents of condensed tannins and stilbenes in Norway spruce (Picea abies [L.] Karst.) sawmill bark. Ind. Crops Prod. 2021, 173, 114090. [Google Scholar] [CrossRef]
  42. Cardoso, L.d.M.; Pinheiro, S.S.; De Carvalho, C.W.P.; Queiroz, V.A.V.; de Menezes, C.B.; Moreira, A.V.B.; De Barros, F.A.R.; Awika, J.M.; Martino, H.S.D.; Pinheiro-Sant’Ana, H.M. Phenolic compounds profile in sorghum processed by extrusion cooking and dry heat in a conventional oven. J. Cereal Sci. 2015, 65, 220–226. [Google Scholar] [CrossRef]
  43. Galanakis, C.M. Recovery of high added-value components from food wastes: Conventional, emerging technologies and commercialized applications. Trends Food Sci. Technol. 2012, 26, 68–87. [Google Scholar] [CrossRef]
  44. Havlikova, L.; Mikova, K. Heat stability of anthocyanins. Z. Lebensm. Unters. Forsch. 1985, 181, 427–432. [Google Scholar] [CrossRef]
  45. Palma, M.; Piñeiro, Z.; Barroso, C.G. Stability of phenolic compounds during extraction with superheated solvents. J. Chromatogr. A 2001, 921, 169–174. [Google Scholar] [CrossRef]
  46. Lončarić, A.; Pablo Lamas, J.; Guerra, E.; Kopjar, M.; Lores, M. Thermal stability of catechin and epicatechin upon disaccharides addition. Int. J. Food Sci. Technol. 2018, 53, 1195–1202. [Google Scholar] [CrossRef]
  47. Gaugler, M.; Grigsby, W.J. Thermal degradation of condensed tannins from radiata pine bark. J. Wood Chem. Technol. 2009, 29, 305–321. [Google Scholar] [CrossRef]
  48. Zapata, J.E.; Sepúlveda, C.T.; Álvarez, A.C. Kinetics of the thermal degradation of phenolic compounds from achiote leaves (Bixa orellana L.) and its effect on the antioxidant activity. Food Sci. Technol. 2021, 42, e30920. [Google Scholar] [CrossRef]
  49. Soquetta, M.B.; Terra, L.D.M.; Bastos, C.P. Green technologies for the extraction of bioactive compounds in fruits and vegetables. CyTA-J. Food 2018, 16, 400–412. [Google Scholar] [CrossRef]
  50. Lin, B.; Li, H.; Chen, Z.; Zheng, C.; Hong, Y.; Wang, Z. Sensitivity analysis on the microwave heating of coal: A coupled electromagnetic and heat transfer model. Appl. Therm. Eng. 2017, 126, 949–962. [Google Scholar] [CrossRef]
  51. Grigoras, C.G.; Destandau, E.; Zubrzycki, S.; Elfakir, C. Sweet cherries anthocyanins: An environmental friendly extraction and purification method. Sep. Purif. Technol. 2012, 100, 51–58. [Google Scholar] [CrossRef]
  52. Boukroufa, M.; Boutekedjiret, C.; Petigny, L.; Rakotomanomana, N.; Chemat, F. Bio-refinery of orange peels waste: A new concept based on integrated green and solvent-free extraction processes using ultrasound and microwave techniques to obtain essential oil, polyphenols and pectin. Ultrason. Sonochem. 2015, 24, 72–79. [Google Scholar] [CrossRef]
  53. Cavalcante TA, B.B.; dos Santos Funcia, E.; Gut, J.A.W. Inactivation of polyphenol oxidase by microwave and conventional heating: Investigation of thermal and non-thermal effects of focused microwaves. Food Chem. 2021, 340, 127911. [Google Scholar] [CrossRef] [PubMed]
  54. George, D.F.; Bilek, M.M.; McKenzie, D.R. Non-thermal effects in the microwave-induced unfolding of proteins observed by chaperone binding. Bioelectromagnetics 2008, 29, 324–330. [Google Scholar] [CrossRef]
  55. Zhang, H.Q.; Barbosa-Cánovas, G.V.; Balasubramaniam, V.B.; Dunne, C.P.; Farkas, D.F.; Yuan, J.T. (Eds.) Nonthermal Processing Technologies for Food; John Wiley & Sons: Hoboken, NJ, USA, 2011. [Google Scholar] [CrossRef]
  56. Benlloch-Tinoco, M.; Igual, M.; Rodrigo, D.; Martínez-Navarrete, N. Comparison of microwaves and conventional thermal treatment on enzymes activity and antioxidant capacity of kiwifruit puree. Innov. Food Sci. Emerg. Technol. 2013, 19, 166–172. [Google Scholar] [CrossRef]
  57. Peleg, M.; Corradini, M.G.; Normand, M.D. On quantifying nonthermal effects on the lethality of pressure-assisted heat preservation processes. J. Food Sci. 2012, 77, R47–R56. [Google Scholar] [CrossRef]
  58. Mohorič, T.; Bren, U. How does microwave irradiation affect aqueous solutions of polar solutes? J. Mol. Liq. 2018, 266, 218–228. [Google Scholar] [CrossRef]
  59. Heijnen, C.G.; Haenen, G.R.; Vekemans, J.A.; Bast, A. Peroxynitrite scavenging of flavonoids: Structure activity relationship. Environ. Toxicol. Pharmacol. 2001, 10, 199–206. [Google Scholar] [CrossRef]
  60. Bolea, C.; Turturică, M.; Stănciuc, N.; Vizireanu, C. Thermal degradation kinetics of bioactive compounds from black rice flour (Oryza sativa L.) extracts. J. Cereal Sci. 2016, 71, 160–166. [Google Scholar] [CrossRef]
  61. Henríquez, C.; Córdova, A.; Almonacid, S.; Saavedra, J. Kinetic modeling of phenolic compound degradation during drum-drying of apple peel by-products. J. Food Eng. 2014, 143, 146–153. [Google Scholar] [CrossRef]
  62. De Marchi, L.; Salemi, L.; Bellumori, M.; Chignola, R.; Mainente, F.; Soto, D.V.S.; Fierri, I.; Ciulu, M.; Zoccatelli, G. Thermal degradation of red cabbage (Brassica oleracea L. var. Capitata f. rubra) anthocyanins in a water model extract under accelerated shelf-life testing. Food Chem. 2024, 440, 138272. [Google Scholar] [CrossRef]
  63. Janeiro, P.; Brett, A.M.O. Catechin electrochemical oxidation mechanisms. Anal. Chim. Acta 2004, 518, 109–115. [Google Scholar] [CrossRef]
  64. Cargill, R.W. Solubility of oxygen in some water+ alcohol systems. J. Chem. Soc. Faraday Trans. 1 1976, 72, 2296–2300. [Google Scholar] [CrossRef]
  65. Iannuzzo, F.; Piccolo, V.; Novellino, E.; Schiano, E.; Salviati, E.; Summa, V.; Campiglia, P.; Tenore, G.C.; Maisto, M. A food-grade method for enhancing the levels of low molecular weight proanthocyanidins with potentially high intestinal bioavailability. Int. J. Mol. Sci. 2022, 23, 13557. [Google Scholar] [CrossRef]
  66. Slakman, B.L.; West, R.H. Kinetic solvent effects in organic reactions. J. Phys. Org. Chem. 2019, 32, e3904. [Google Scholar] [CrossRef]
  67. Zanchi, D.; Vernhet, A.; Poncet-Legrand, C.; Cartalade, D.; Tribet, C.; Schweins, R.; Cabane, B. Colloidal dispersions of tannins in water− ethanol solutions. Langmuir 2007, 23, 9949–9959. [Google Scholar] [CrossRef] [PubMed]
  68. Jouyban, A.; Soltanpour, S.; Chan, H.K. A simple relationship between dielectric constant of mixed solvents with solvent composition and temperature. Int. J. Pharm. 2004, 269, 353–360. [Google Scholar] [CrossRef] [PubMed]
  69. Lin, Q.; Cao, Q.; Huo, Q. Study on degradation process of procyanidins Asian. J. Chem. 2014, 26, 6665–6668. [Google Scholar]
  70. Mohsen-Nia, M.; Amiri, H.; Jazi, B. Dielectric constants of water, methanol, ethanol, butanol and acetone: Measurement and computational study. J. Solut. Chem. 2010, 39, 701–708. [Google Scholar] [CrossRef]
  71. Billmeyer, F.W. Ciencia de los polímeros. Reverté. 2020. Available online: https://books.google.es/books?id=Fe0FEAAAQBAJ&lpg=PR5&ots=e4v_mVfepL&lr&hl=es&pg=PR5#v=onepage&q&f=false (accessed on 1 February 2025).
  72. Orozco, M.; Luque, F.J. Theoretical methods for the description of the solvent effect in biomolecular systems. Chem. Rev. 2000, 100, 4187–4226. [Google Scholar] [CrossRef]
  73. Štrajbl, M.; Florián, J.; Warshel, A. Ab initio/LD studies of chemical reactions in solution: Reference free-energy surfaces for acylation reactions occurring in serine and cysteine proteases. Int. J. Quantum Chem. 2000, 77, 44–53. [Google Scholar] [CrossRef]
  74. Hori, K.; Ikenaga, Y.; Arata, K.; Takahashi, T.; Kasai, K.; Noguchi, Y.; Sumimoto, M.; Yamamoto, H. Theoretical study on the reaction mechanism for the hydrolysis of esters and amides under acidic conditions. Tetrahedron 2007, 63, 1264–1269. [Google Scholar] [CrossRef]
  75. Ebrahimi, P.; Lante, A. Environmentally friendly techniques for the recovery of polyphenols from food by-products and their impact on polyphenol oxidase: A critical review. Appl. Sci. 2022, 12, 1923. [Google Scholar] [CrossRef]
  76. Lorrain, B.; Ky, I.; Pechamat, L.; Teissedre, P.-L. Evolution of analysis of polyphenols from grapes, wines, and extracts. Molecules 2013, 18, 1076–1100. [Google Scholar] [CrossRef]
  77. Freitas, L.C.; Barbosa, J.R.; da Costa, A.L.C.; Bezerra, F.W.F.; Pinto, R.H.H.; de Carvalho Junior, R.N. From waste to sustainable industry: How can agro-industrial wastes help in the development of new products? Resour. Conserv. Recycl. 2021, 169, 105466. [Google Scholar] [CrossRef]
  78. Galanakis, C.M. Recovery of polyphenols from distillery stillage by microwave-assisted extraction. Sci. Rep. 2013, 3, 2834. [Google Scholar] [CrossRef]
  79. Chen, J.; Thilakarathna, W.P.D.W.; Astatkie, T.; Rupasinghe, H.P.V. Optimization of catechin and proanthocyanidin recovery from grape seeds using microwave-assisted extraction. Biomolecules 2020, 10, 243. [Google Scholar] [CrossRef]
  80. Ghafoor, K.; Choi, Y.H.; Jeon, J.Y.; Jo, I.H. Optimization of ultrasound-assisted extraction of phenolic compounds, antioxidants and anthocyanins from grape (Vitis vinifera) seeds. J. Agric. Food Chem. 2009, 57, 4988–4994. [Google Scholar] [CrossRef]
  81. Chung, C.; Rojanasasithara, T.; Mutilangi, W.; McClements, D.J. Stabilization of natural colors and nutraceuticals: Inhibition of anthocyanin degradation in model beverages using polyphenols. Food Chem. 2016, 212, 596–603. [Google Scholar] [CrossRef] [PubMed]
  82. Antonio-Gómez, M.V.; Salinas-Moreno, Y.; Hernández-Rosas, F.; Herrera-Corredor, J.A.; Contreras-Oliva, A. Color and stability of anthocyanins of chagalapoli (Ardisia compressa K.) fruit added to an isotonic beverage as microcapsules and as free extract. Foods 2023, 12, 2009. [Google Scholar] [CrossRef]
  83. Perez, M.B.; Hamparsomian, M.J.D.P.; Gonzalez, R.E.; Denoya, G.I.; Dominguez, D.L.; Barboza, K.; Iorizzo, M.; Simon, P.W.; Vaudagna, S.R.; Cavagnaro, P.F. Physicochemical properties, degradation kinetics, and antioxidant capacity of aqueous anthocyanin-based extracts from purple carrots compared to synthetic and natural food colorants. Food Chem. 2022, 387, 132893. [Google Scholar] [CrossRef]
  84. Saini, N.; Sharma, A.; Thakur, V.K.; Makatsoris, C.; Dandia, A.; Bhagat, M.; Tonk, R.K.; Sharma, P.C. Microwave assisted green synthesis of thiazolidin-4-one derivatives: A perspective on potent antiviral and antimicrobial activities. Curr. Res. Green Sustain. Chem. 2020, 3, 100021. [Google Scholar] [CrossRef]
  85. Farías-Campomanes, A.M.; Rostagno, M.A.; Meireles, M.A. Production of polyphenol extracts from grape bagasse using supercritical fluids: Yield, extract composition, economic evaluation. J. Supercrit. Fluids 2013, 77, 70–78. [Google Scholar] [CrossRef]
  86. Sigma-Aldrich. (−)-Epicatechin (≥90% HPLC). Available online: https://www.sigmaaldrich.com/CL/es/product/sigma/e1753 (accessed on 26 February 2025).
  87. Kammerer, J.; Ternes, F.; Carle, R. Economic considerations in polyphenol recovery from grape pomace. Food Chem. 2021, 342, 128295. [Google Scholar] [CrossRef]
Figure 1. UHPLC/UV chromatograms at a wavelength of 280 nm of P (a) initial (P) and (b) after thiolysis depolymerization (P-Tiol).
Polymers 17 00682 g001
Figure 2. Linearized graphs for TPC on P as a function of time for (a) TB 40 °C, M40 °C, TB 60 °C, and M60 °C and (b) TB60 °C and M60 °C.
Polymers 17 00682 g002
Figure 3. Molar concentration graphs as a function of depolymerization time for (a) GA, Ep, and P; fitted graphs with linearized models for (b) GA, (c) Ep, and (d) remaining polymers (PR). All the molecules studied are in a mixed depolymerization products suspension (P-Dep).
Polymers 17 00682 g003
Figure 4. Color parameters change graphs as a function of depolymerization time for (a) visual color (photography of P-Dep the samples), (b) L*, (c) a*, (d) ∆E*, and (e) ∆C*.
Polymers 17 00682 g004
Table 1. Experimental design for studies of thermal resistance and microwave behavior of grape seed condensed tannins (CT).
Definition and UnitsLevels
FACTORSTemperature (°C)40; 60; 80
Time (min)10; 30; 60
Heating methodM; TB
RESPONSETPC (mgEGA/g)-
Table 2. Experimental design for optimization of the chemical depolymerization reaction.
Definition and UnitsLevels
FACTORSPercentage of ethanol (S) (% v/v)0; 20; 50; 80; 100
Polymers/Solvent ratio (P/S) (% m/v)0.1; 1
Polymers/Nucleophile ratio (P/GA) (mol/mol)0.5; 1
RESPONSEReaction Yield (RY) (%)-
MPD (nm)-
Table 3. Physicochemical characterization of initial grape seed condensed tannin (P).
ParameterValue
TPC (EAGmg/g)234.62 ± 0.17
MPD (µm)16.55 ± 1.47
PDI3.50 ± 1.59
Trolox equivalent (mmol/L)8.8 ± 0.3
ABTS inhibition (%)89.30 ± 2.27
DPPH inhibition (%)87.59 ± 1.12
Table 4. Molar concentration and percentage of the main component chemical structures of initial condensed grape seed tannins (P) and their resulting species in the cysteamine depolymerization procedure (P-Tiol), n = 3.
Chemical StructureRetention TimeConcentration (mol/L)Amount (%)
PP-TiolPP-Tiol
Gallic Acid5.01.16 × 10−5 ± 1.76 × 10−71.73 × 10−5 ± 5.07 × 10−61.03 ± 0.201.00 ± 0.33
Catechin15.44.94 × 10−5 ± 5.51 × 10−71.34 × 10−4 ± 4.03 × 10−64.41 ± 0.067.74 ± 0.02
Catechin-tiol18.204.76 × 10−5 ± 4.46 × 10−602.75 ± 0.45
Epicatechin27.52.98 × 10−5 ± 3.51 × 10−71.04 × 10−4 ± 1.33 × 10−62.66 ± 0.036.02 ± 0.28
Epicatechin-tiol28.409.89 × 10−4 ± 6.49 × 10−5057.19 ± 5.62
Polymers35 to 451.03 × 10⁻³ ± 9.59 × 10−64.38 × 10−4 ± 9.72 × 10−591.90 ± 0.25 125.31 ± 6.63 2
Terminal units--1.59 × 10⁻⁴--
Extension units--1.04 × 10⁻³--
R Y 57.50
m D P 7.53
1 Amount of polymers added to the reactor. 2 Amount of polymers remained after reaction.
Table 5. Multilevel 32 × 21 factorial experimental design for heating P on TPC over time at different temperatures through two heating methods. Ethanol solvent 50% pH 3, n = 3.
SampleHeating MethodTemperature (°C)Time (min)TPC (GAEmg/g)
2M4010228.8 ± 4.2
8M4030221.0 ± 2.3
13M4060226.4 ± 1.9
17M6010224.0 ± 2.0
15M6030217.8 ± 11.7
12M6060219.9 ± 8.4
18M8010194.4 ± 4.9
4M8030163.6 ± 14.8
7M8060111.0 ± 5.2
9TB4010223.4 ± 1.5
16TB4030199.4 ± 1.5
1TB4060139.4 ± 0.9
5TB6010220.8 ± 1.1
14TB6030199.4 ± 1.5
11TB6060109.7 ± 2.9
6TB8010162.6 ± 1.3
10TB8030142.0 ± 1.2
3TB806087.5 ± 2.1
Table 6. Analysis of variance for TPC—Type III sum of squares. This analysis considers the effect of the variables separately as well as their interactions.
Sources (Factors)F-Ratiop-Value
Temperature29.660.0000 *
Time26.820.0000 *
Heating method5.780.0209 *
Temperature–time interaction1.630.1864
Temperature–heating method interaction1.720.1923
Time–heating method interaction2.120.1335
R269.9%
Adjusted R264.5%
* p < 0.05.
Table 7. Mathematical adjustment of the results obtained from TPC as a function of time, temperature, and heating method (Table 6).
Samples SetAdjusted ModelEquationR2
TB 40 °COrder 0TPC = −9.81t 1 + 1.450.9072
TB 60 °COrder 0TPC = −1.27t + 1.460.9079
TB 80 °COrder 1Ln(TPC/TPC0 2) = −0.0137 t – 0.12590.9477
M 40 °C---
M 60 °C---
M 80 °COrder 1Ln(TPC/TPC0) = −0.0113 t – 0.13390.9897
1 Time. 2 TPC at time 0.
Table 8. Experimental design and results obtained for the optimization of the P depolymerization reaction.
SampleS (% v/v)P/S Ratio (% m/v)P (mol/L)P/GA Ratio (mol/mol)GA (mol/L)RY (%)MPD (nm)
151001.03.4 × 10−21.03.4 × 10−299.56.5
5801.03.4 × 10−21.03.4 × 10−299.95.7
19501.03.4 × 10−21.03.4 × 10−299.65.5
11201.03.4 × 10−21.03.4 × 10−287.42524.1
1601.03.4 × 10−21.03.4 × 10−269.68399.0
81001.03.4 × 10−20.51.7 × 10−288.9933.1
17801.03.4 × 10−20.51.7 × 10−289.6643.2
3501.03.4 × 10−20.51.7 × 10−290.875.9
9201.03.4 × 10−20.51.7 × 10−279.63608.0
101.03.4 × 10−20.51.7 × 10−271.96171.7
131000.13.4 × 10−31.01.7 × 10−287.61582.7
14800.13.4 × 10−31.03.4 × 10−387.81104.6
20500.13.4 × 10−31.03.4 × 10−389.7182.0
18200.13.4 × 10−31.03.4 × 10−398.9376.7
200.13.4 × 10−31.03.4 × 10−398.21755.2
41000.13.4 × 10−30.51.7 × 10−398.7708.8
7800.13.4 × 10−30.51.7 × 10−399.0550.7
12500.13.4 × 10−30.51.7 × 10−399.086.5
10200.13.4 × 10−30.51.7 × 10−398.71637.1
600.13.4 × 10−30.51.7 × 10−397.35951.6
Table 9. Analysis of variance for reaction yield and mean particle size—Type III sum of squares.
RYMPD
Sources (Factors)F-Ratiop-ValueF-Ratiop-Value
A: Ethanol (% v/v)8.390.0134 *16.350.0016 *
B: Polymers/Solvent ratio (% m/v)13.500.0032 *1.210.2938
C: Polymers/Gallic acid ratio (mol/mol)0.050.82870.330.5754
A–B Interaction23.420.0004 *3.940.0706
A–C interaction0.060.81730.310.5853
B–C interaction9.550.0094 *0.200.6621
A–B–C interactions4.490.05572.690.1270
R283%68%
Adjusted R273%49%
* p < 0.05.
Table 10. Equations resulting from the linear regressions for the concentration of the main species during depolymerization in the mixed depolymerization product suspension (P-Dep).
MoleculeAdjusted ModelEquationR2
GAOrder 2(1/C 1 − 1/C0 2) = 0.108t0.9638
EpOrder 0C = 2.0 × 10⁻⁴t0.9622
POrder 2(1/C − 1/C0) = 1.98 × 10⁻²t0.8915
1 Concentration of the molecule over time. 2 Concentration initial of the molecule.
Table 11. Equations resulting from the linear regressions for the color parameters during depolymerization.
ParameterAdjusted ModelEquationR2
L*Order 0L* = −6.29 × 10⁻¹t + 8.48 × 1010.9294
a*Order 0a* = 5.05 × 10⁻¹t + 1.140.9329
∆E*Order 0∆E* = 7.91 × 10⁻¹t + 1.130.9295
∆C*Order 0∆C* = 4.80 × 10⁻¹t − 3.17 × 10−20.9046
Table 12. Total phenolic content and antioxidant capacity of P, P-Dep, and AG suspensions according to ABTS●+ and DPPH● assay.
Sample% ABTS●+ Inhibition% DPPH● InhibitionTPC (mgEGA/g)Eq. Trolox (mmol/L)
P89.3 ± 2.387.6 ± 1.1234.6 ± 0.28.8 ± 0.3
P-Dep93.5 ± 0.988.2 ± 1.5297.3 ± 15.99.2 ± 0.7
AG94.9 ± 1.186.7 ± 1.3108.8 ± 7.19.4 ± 0.6
Disclaimer/Publisher’s Note: The statements, opinions and data contained in all publications are solely those of the individual author(s) and contributor(s) and not of MDPI and/or the editor(s). MDPI and/or the editor(s) disclaim responsibility for any injury to people or property resulting from any ideas, methods, instructions or products referred to in the content.

