4.1. The Relative Partial Permittivity and the Relative Partial Susceptibility
The dependence of the relative partial susceptibility RX on the relative partial permittivity RE at different values of the true permittivity ε
t is given in
Figure 2 for the considered dielectric materials. When ε
t increases, then RX → RE, and, at sufficiently high values of the true permittivity, RE ≈ RX, as seen in Equation (6). The dashed line marks the equality of RE and RX for a hypothetical dielectric with an infinitely high ε
t: RE = RX.
Figure 2.
Dependence of the relative partial susceptibility RX on the relative partial permittivity RE at different values of the true permittivity: (a) SikaBlockM80, (b) SikaBlockM150, and (c) SikaBlockM450 and monolithic materials (d) Lab-made PU, and (e) PU SikaBlockM945, as well as (f) epoxy Lab975 New and (g) a hypothetical dielectric (εt = ∞).
It can be seen that the lower the true permittivity, the higher the difference between the corresponding RE and RX values. For the epoxy Lab975 New of a comparatively high true permittivity εt = 8.95, when RE = 90%, then RX = 89%, and it can be concluded RE ≈ RX. In such case, it is often sufficient to consider just the relative partial susceptibility.
The true permittivity of PU foams and monolithic polyurethanes is quite small, εt ≤ 4.5, in the entire range of densities, 30 kg/m3 ≤ ρ ≤ 1350 kg/m3, and the difference between RE and RX is significant; e.g., for SikaBlockM80, when RE = 90%, then RX = 25%, and, for the lab-made PU, when RE = 50%, then RX = 29%. It can be concluded RE >> RX. Therefore, in different estimations, the relative partial permittivity has to be considered besides the relative partial susceptibility in the case of the rigid PU foams.
4.2. The Inter-Electrode Zone
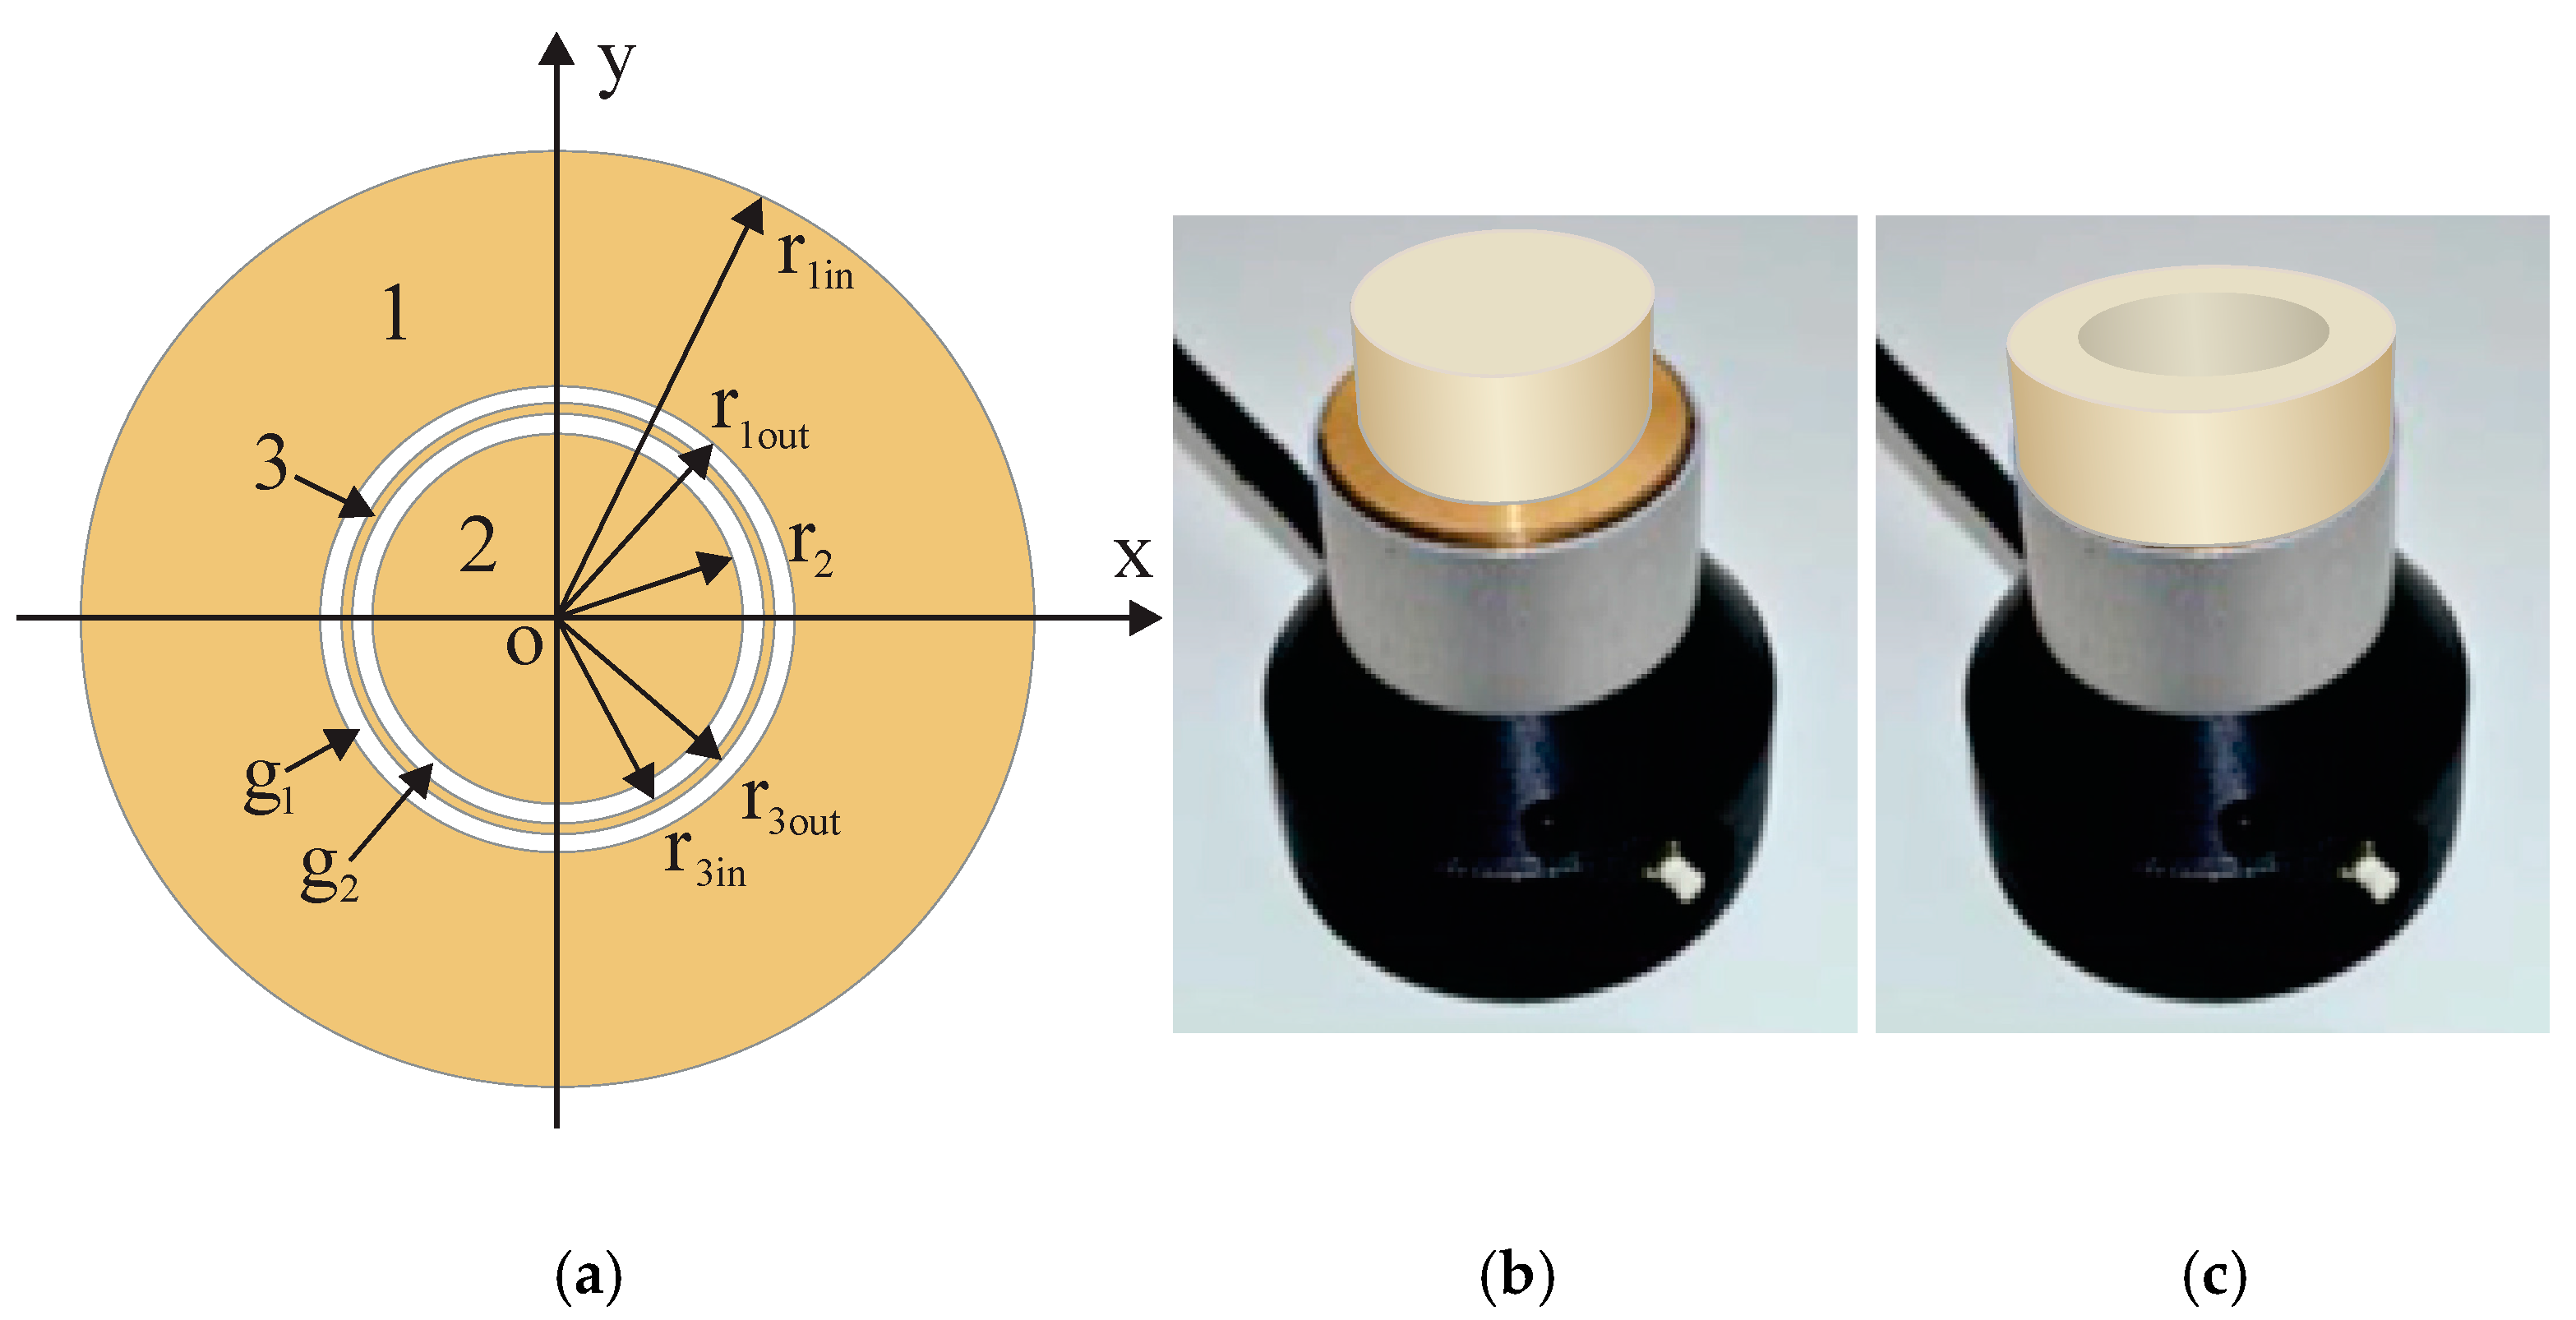
The hand-cutting technology of the subsamples yielded the uncertainty of the transversal dimensions Δr
c = ± 0.5 mm … ± 1.5 mm (depending on the density) due to deviations from a circular shape. The uncertainty of the concentric placement of a sample on the active area was estimated as Δ’r
c = ± 0.5 mm … ± 0.7 mm. A circular ring between electrodes 1 and 2, of width 2.0 mm, is referred to as the inter-electrode zone, where r
1in is the inner radius of electrode 1 and r
2 is the radius of electrode 2. The inter-electrode zone comprises the gaps g1 and g2, each of width 0.55 mm, and the guard electrode of width 1.00 mm, as seen in
Figure 1a, meaning that the dimensions of the gaps and the guard electrode are comparable to the uncertainties of the subsample’s transversal dimensions and placement. A measurement of the partial permittivity ε
pc for a subsample with a radius r
c provides an average of the accurate ε
pc(r
c) values measured at an r
c interval: r
c − (Δr
c + Δ
′r
c) ≤ r
c ≤ r
c + (Δr
c + Δ
′r
c). Therefore, the given experiment could not resolve the values of ε
pc, which correspond to cylindrical subsamples with radii corresponding to the inter-electrode zone r
2 < r
c < r
3in, r
3in ≤ r
c ≤ r
3out and r
3out < r
c < r
1in. The gaps and the guard electrode are too narrow for a more detailed characterization of the inter-electrode zone.
The partial permittivity ε
pc is a cumulative quantity, which increases at an increase in the radius of a cylindrical subsample. When the radius of a subsample takes values corresponding to the inter-electrode zone r
2 < r
c < r
1in, the partial permittivity has to match the following inequalities:
The experiments confirmed that the experimental data points εpc(rc) of the studied dielectric materials match the inequalities (15). Since a detailed character of the relationships “εpc–rc” and “εps–rsin” in the inter-electrode zone could not be determined in the given experiments due to the above-mentioned reasons, the functions, derived from Φ(rc) and Ψ(rc), were used to model “εpc–rc” and “εps–rsin” in the inter-electrode zone as well (similar considerations can be made for shells).
4.3. Experimental Data
Experimental data of the true (the dashed horizontals) and the partial permittivity of low- to medium-density PU foams with a similar true permittivity 1.00 < ε
t < 1.80 (group 1) are given in
Figure 3 with a dependence on the radii of the samples and subsamples (further–samples).
Figure 3.
(1) The partial permittivity of PU foams’ cylinders and shells εpc and εps: (a), (c), (e) and (b), (d), (f) in dependence of the samples’ radiuses rc (circles) and rsin (triangles). (a,b) SikaBlockM80; (c,d) SikaBlockM150 and (e,f) SikaBlockM450 and (2) The relative partial permittivity RE(rc) and RE(rsin) of PU foams in dependence of radiuses of cylinders and shells rc and rsin: (a,d) SikaBlockM80, (b,e) SikaBlockM150 as well as (c,f) SikaBlockM450.
The dashed verticals in
Figure 3,
Figure 4,
Figure 5,
Figure 6,
Figure 7,
Figure 8 and
Figure 9 mark the radius r
2 of electrode 2, the inner and outer radii r
3in and r
3out of electrode 3, and the inner radius r
1in of electrode 1. It can be seen that, at an increase in r
c from 0.0 mm to R
0 = 22.5 mm, the partial permittivity ε
pc increases from 0.0 to the value of true permittivity ε
t. The concave–convex curves “ε
pc-r
c” have an inflection point at r
2 ≤ r
c ≤ r
1in.
Figure 3(2) shows the relative partial permittivity RE with a dependence on the radius of the samples, cylinders, and shells, for PU foams with a similar true permittivity 1.00 < ε
t < 1.80. The data curves “RE(r
c)-r
c” follow a concave/convex pattern as well, with the inflection point in the limits r
2 ≤ r
c ≤ r
1in. When r
c → R
0 = 22.5 mm (a complete sample), then ε
m → ε
t. The higher the true permittivity ε
t, the smaller the value of RE at r
c = 0.0 mm. For low- to medium-density PU foams (ρ = 85–415 kg/m
3) with a similar true permittivity 1.00 < ε
t < 1.80, at r
c → 0.0 mm, the lower values of RE lie in the range 56–94%. The conclusions for the curves “RE(r
sin)-r
sin” for shells are similar, besides the fact that the data curves are convex/concave.
Experimental data of the partial permittivity of PU materials and epoxy Lab975 New with a significantly differing true permittivity 1.0 < ε
t < 9.0 (group 2) are given in
Figure 4(1) with a dependence on the radius of the cylindrical samples. The character of the curves is similar to those in
Figure 3.
Figure 4.
(1) The partial permittivity εpc in dependence of cylinder’s radius rc: PU foams (a) SikaBlockM80, (b) SikaBlockM450, monolithic materials (c) lab-made PU, (d) PU SikaBlockM945 and (e) epoxy Lab975 New and (2) The relative partial permittivity RE(rc) in dependence of cylinder’s radius rc: (a) PU foams SikaBlockM80, (b) PU foams SikaBlockM450, monolithic materials (c) lab-made PU, (d) PU SikaBlockM945 and (e) epoxy Lab975 New.
Figure 4(2) depicts the relative partial permittivity RE with a dependence on the radius r
c of the cylindrical samples for PU materials and the epoxy Lab975 New. The curves “RE(r
c)-r
c” follow a concave/convex pattern, with the inflection point in the limits r
2 ≤ r
c ≤ r
1in. For the considered dielectric materials (having 1.0 < ε
t < 9.0), the lower value of RE lies in the limits 10–87%. When r
c → R
0 = 22.5 mm (a complete sample), then RE → 100%.
4.4. Model Functions for the Dielectrics of the Groups 1 and 2
Model functions Φ1(r
c) and Ψ1(r
sin) of the partial permittivity for group 1 dielectrics are given in
Figure 5(1) with a dependence on the radii of the samples.
Figure 5(2) gives Φ1(r
c) for the group 2 dielectrics.
Figure 5.
(1) Model functions Φ1 and Ψ1 of the partial permittivity εpc and εps of PU foams’ cylinders and shells with a dependence on the samples’ radii rc and rsin. Cylinders: (a), (b), and (c); shells: (d), (e), and (f). PU foams: (a) and (d) SikaBlockM80, (b) and (e) SikaBlockM150, as well as (c) and (f) SikaBlockM450 and (2) Model functions Φ1 of the partial permittivity εpc in dependence of cylinder’s radius rc: (a) PU foams SikaBlockM80, (b) PU foams SikaBlockM450, monolithic materials (c) lab-made PU, (d) PU SikaBlockM945 and (e) epoxy Lab975 New.
Figure 6(1) shows the relative partial permittivity RE of the PU foams with a similar true permittivity with a dependence on (1) the radii r
c and r
sin of the cylinders and shells, as well as (2) the coverage coefficients k
c and k
s, when the RE data are fitted by model functions Φ2(r
c) and Ψ2(r
sin).
Figure 6.
Model functions Φ2 and Ψ2 of the relative partial permittivity RE with a dependence on (1) samples’ radii rc and rsin and (2) coverage coefficients kc and ks. Cylinders: (a), (b), and (c); shells: (d), (e), and (f). PU foams: (a) and (d) SikaBlockM80, and (b) and (e) SikaBlockM150, as well as (c) and (f) SikaBlockM450.
It can be seen that, for each material, the curves “Φ1-rc” and “Ψ1-rsin”, as well as the curves “Φ2-rc” and “Ψ2-rsin”, are symmetrical about a straight line, which is drawn parallel to the Orc (Orsin) axis, and which is passing through the intersection point of the curves.
Let us consider the corresponding subsamples, cylinders and shells, defined by the equality of the radii r
c = r
sin [
31]. For the corresponding subsamples, when the cylindrical subsample is placed into its corresponding shell, a complete sample is obtained. It can be concluded from
Figure 6(1) that, for any of the considered PU foams, the following is valid at r
c = r
sin:
For the coverage coefficients of the corresponding subsamples, k
s = 1.0−k
c, and we obtain the following:
Figure 7 shows the model functions Φ2(r
c) of the relative partial permittivity RE with a dependence on radius r
c of the cylinders and coverage coefficient k
c. When the functions “Φ2-r
c” are determined for the cylinders, the curves for the shells “Φ2-r
sin” can be calculated from Equation (17):
Figure 7.
Model functions Φ2 of the relative partial permittivity RE with a dependence on (1) cylinder’s radius rc and (2) coverage coefficient kc. (a) PU foams SikaBlockM80, and (b) PU foams SikaBlockM450, and monolithic materials (c) lab-made PU, (d) PU SikaBlockM945, and (e) epoxy Lab975 New.
Figure 7.
Model functions Φ2 of the relative partial permittivity RE with a dependence on (1) cylinder’s radius rc and (2) coverage coefficient kc. (a) PU foams SikaBlockM80, and (b) PU foams SikaBlockM450, and monolithic materials (c) lab-made PU, (d) PU SikaBlockM945, and (e) epoxy Lab975 New.
All conclusions, made for the experimental data curves of εt and RE, remain valid for the model functions Φ1, Ψ1 and Φ2, Ψ2.
4.5. The Rate of Change
The rate of change of the partial permittivity Δε
pc/Δk
c with a dependence on the radius of a cylinder r
c is depicted in
Figure 8 for PU materials and the epoxy (group 2).
Figure 8.
The rate of change of the partial permittivity Δεpc/Δkc5% with a dependence on cylinder’s radius rc: (a) PU foams SikaBlockM80 and (b) PU foams SikaBlockM450, and monolithic materials (c) lab-made PU, and (d) PU SikaBlockM945, as well as (e) epoxy Lab975 New.
Figure 8.
The rate of change of the partial permittivity Δεpc/Δkc5% with a dependence on cylinder’s radius rc: (a) PU foams SikaBlockM80 and (b) PU foams SikaBlockM450, and monolithic materials (c) lab-made PU, and (d) PU SikaBlockM945, as well as (e) epoxy Lab975 New.
Since the partial permittivity ε
pc is a dimensionless quantity, its rate of change Δε
pc/Δk
c5% is calculated over the radius r
c, in units, per constant increments of the coverage coefficient Δk
c = 5%. It means, when at a certain radius r
ci, the coverage coefficient increases for Δk
c = 5%, the corresponding increment in the radius is Δr
ci(r
ci) =
, where i = 1, 2, …, I + 1 and I = k
c/Δk
c = 1.0/Δk
c [
31], and the partial permittivity increases for Δε
pc units. The increments Δr
c (corresponding to the markers on the curves in
Figure 8 and
Figure 9) depend on r
c, in a way, which ensures constant increments in the coverage coefficient Δk
c = Δk
c5% = 5%. It can be concluded that the rate of change in units per 5% increment in the coverage coefficient Δk
c5% is the highest for dielectrics (the PU materials and the epoxy) with the highest true permittivity.
It can be seen that the rate of change for the PU materials is the highest at the inter-electrode zone: 0.03 units/5% ≤ max Δε
pc/Δk
c5% ≤ 0.81 units/5%. The scatter in the location of max Δε
pc/Δk
c5% can be explained by a comparatively high uncertainty of the samples’ transversal dimensions (
Section 4.2) and low values of the partial permittivity of the PU foams. In the centre of the active area, the rate of change is 2–4 times lower. As the radius r
c increases above approx. 14 mm, the Δε
pc/Δk
c decreases rapidly.
Figure 9 gives the rate of change in the relative partial permittivity ΔRE
c/Δk
c over the radius of the sensor’s circular concentric zone, which is covered with a dielectric cylinder of radius r
c.
Figure 9.
The rate of change of the relative partial permittivity ΔREc/Δkc5% with a dependence on cylinder’s radius rc: (a) PU foams SikaBlockM80 and (b) PU foams SikaBlockM450, and monolithic materials (c) lab-made PU, and (d) PU SikaBlockM945, as well as (e) epoxy Lab975 New.
Figure 9.
The rate of change of the relative partial permittivity ΔREc/Δkc5% with a dependence on cylinder’s radius rc: (a) PU foams SikaBlockM80 and (b) PU foams SikaBlockM450, and monolithic materials (c) lab-made PU, and (d) PU SikaBlockM945, as well as (e) epoxy Lab975 New.
While
Figure 3 and
Figure 4 depict the integral relationships “ε
pc(r
c)-r
c” and “RE
c(r
c)-r
c”,
Figure 8 and
Figure 9 show the differential character of the ε
pc and RE
c change at a partial coverage of the active area. The rate of change in units per 5% increment in the coverage coefficient Δk
c5% is the highest for PU materials with the highest true permittivity.
Conclusions about the rate of change in the relative partial permittivity ΔREc/Δkc5% are similar to those about Δεpc/Δkc5%. ΔREc/Δkc5% is the highest at the inter-electrode zone 2.6%/5% ≤ max ΔREc/Δkc5% ≤ 18.4%/5% and max ΔREc/Δkc = 19% for the epoxy Lab975 New. In the centre of the active area, the rate of change is 2.5–5 times lower. As the radius rc increases above approx. 14 mm, the ΔREc/Δkc decreases.
To obtain proper data for the rate of change in the centre of the active area, a sufficient amount of experimental data is needed for cylinders of a small radius rc and shells with a small inner radius rsin. The partial permittivity of these subsamples is highly sensitive to deviations in the transversal cross-sectional shape from circularity and a concentric location of the samples on the active area. High-precision turning and milling technologies should be tested to make accurate circular cylinders with a small diameter, and precise drilling to make accurate shells with a small inner radius.
The partial permittivity curves (
Figure 3 and
Figure 4) as well as the curves of the derived quantities (
Figure 8 and
Figure 9) depend both on the parameters of the dielectric material and the active area of the OSA sensor. It can be seen that the overall character of the rate of change in the partial permittivity with a dependence on the subsample’s radius (equal to the radius of the covered area) is comparable to that of the surface charge density distribution curves for a circular two-electrode OSA sensor, calculated from the Laplace equation [
14]. The effective empirical manifestation of the active area of the given OSA sensor is similar to that of a two-electrode one. At the same time, theoretical considerations suggest a more complex character (several maxima) of the functions “ε
pc-r
c” and “ε
pc-r
sin” at the inter-electrode zone [
5,
19,
20]. Knowledge of the functions “ε
pc-r
c” and “ε
pc-r
sin” might facilitate the determination of the transcapacitance of the OSA sensor with three electrodes on the active surface.
More research is necessary on alternative experimental methods for the estimation of the functions “εpc-rc” and “εpc-rsin” in the inter-electrode zone. Increasing the accuracy of the subsample’s circular shape is not a solution, since at least 3–5 data points are needed for each gap and the guard electrode to estimate the character of curves. That determines the increment in a subsample’s radius: (a) Δrc = 1.0 mm/5 = 0.2 mm in the region of the guard electrode and (b) Δrc = 0.5 mm/5 = 0.1 mm in the region of gaps. The reliability of such experimental data is questionable, because increments 0.1 mm and 0.2 mm are comparable to the dimensions of the characteristic elements of the PU foams’ structure and to the uncertainty of the concentric placement of a subsample on the active area Δ′rc = ± 0.5 mm … ± 0.7 mm. Sensitivity of the spectrometer can be insufficient as well.
An indirect approach can be tested: making several sensors, each having three electrodes and two gaps on the active surface, all of a width exceeding the uncertainties of subsamples’ transversal dimensions by at least several times. Based on the partial permittivity data at the guard electrode and gaps, becoming narrower from one sensor to the other, the character of the curves could be estimated for small dimensions. At the same time, there are many practical situations, when knowledge of the effective empiric manifestation of the narrow inter-electrode zone is sufficient.
4.6. Dependence of on PU Foams’ Properties
The highest rate of change max Δε
pc/Δk
c5% and max ΔRE
c/Δk
c5% characterizes the slopes of the curves “ε
pc-r
c” and “RE
c-r
c” at the inflection point, at a 5% increment in k
c, as seen in
Figure 3. The values of max Δε
pc/Δk
c5% with a dependence on the density and the true permittivity of the PU materials are shown in
Figure 10.
Figure 10.
The highest rate of change max Δεpc/Δkc5% with a dependence on (a) density ρ and (b) the true permittivity εt for the following: PU foams: SikaBlockM80 (green), SikaBlockM150 (red), and SikaBlockM450 (khaki), and monolithic polyurethanes: lab-made PU (orange) and PU SikaBlockM945 (brown). The dashed lines mark the trendlines.
max Δε
pc/Δk
c5% increases according to nonlinear trends, approximated with second-order polynomials:
where max Δε
pc/Δk
c5% is calculated in units per 5% and R
2 is the coefficient of correlation. The lowest value of max Δε
pc/Δk
c5% corresponds to PU foams SikaBlockM80: max Δε
pc/Δk
c5% ≈ 0.03 and the highest to monolithic PU: max Δε
pc/Δk
c5% ≈ 0.8.
The values of max ΔRE
c/Δk
c5% with a dependence on the density ρ and the true permittivity ε
t of the PU materials are shown in
Figure 11.
Figure 11.
The highest rate of change max ΔREc/Δkc5% with a dependence on (a) density ρ and (b) the true permittivity εt for the following: PU foams: SikaBlockM80 (green), SikaBlockM150 (red), and SikaBlockM450 (khaki), and monolithic polyurethanes: lab-made PU (orange) and PU SikaBlockM945 (brown). The dashed lines mark the trendlines.
With an increase of density and the true permittivity max ΔRE
c/Δk
c5% increases according to nonlinear trends:
where max ΔRE
c/Δk
c5% is calculated in % per 5%. For the lab-made monolithic polyurethane and the industrially produced PU SikaBlockM945, the max ΔRE
c/Δk
c5% reaches the highest value ≈ 14–18%, while, for the light-weight PU foams SikaBlockM80, it is only around 3%.


