
Plastic Devolatilisation Kinetics During Isothermal High-Temperature Pyrolysis: Focus on Solid Products (Part I)

 , , and
Abstract
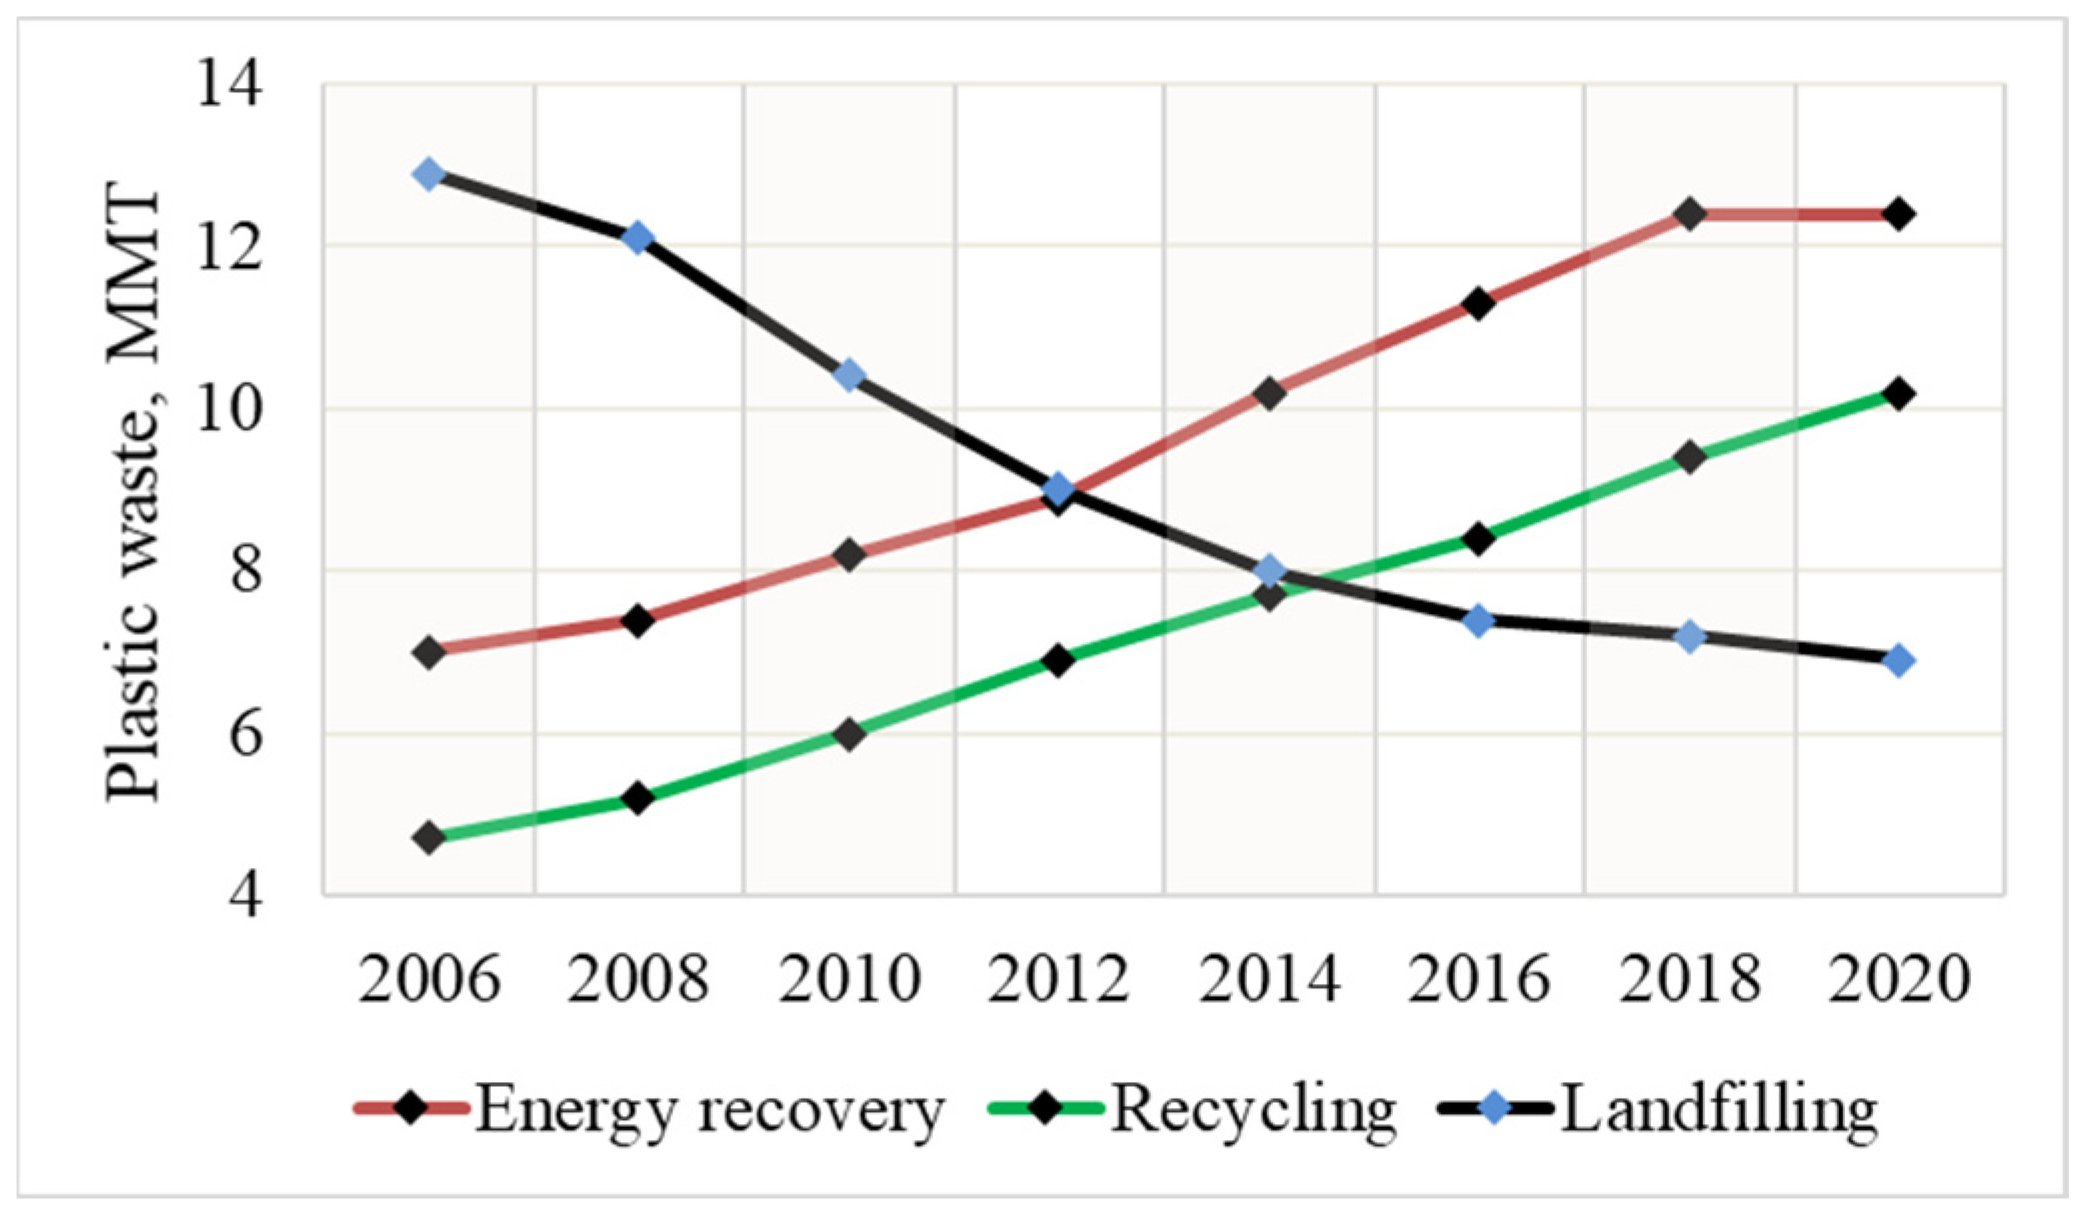
1. Introduction
2. Materials and Methods
2.1. Preparation of Plastic Samples
2.2. Thermal Analysis
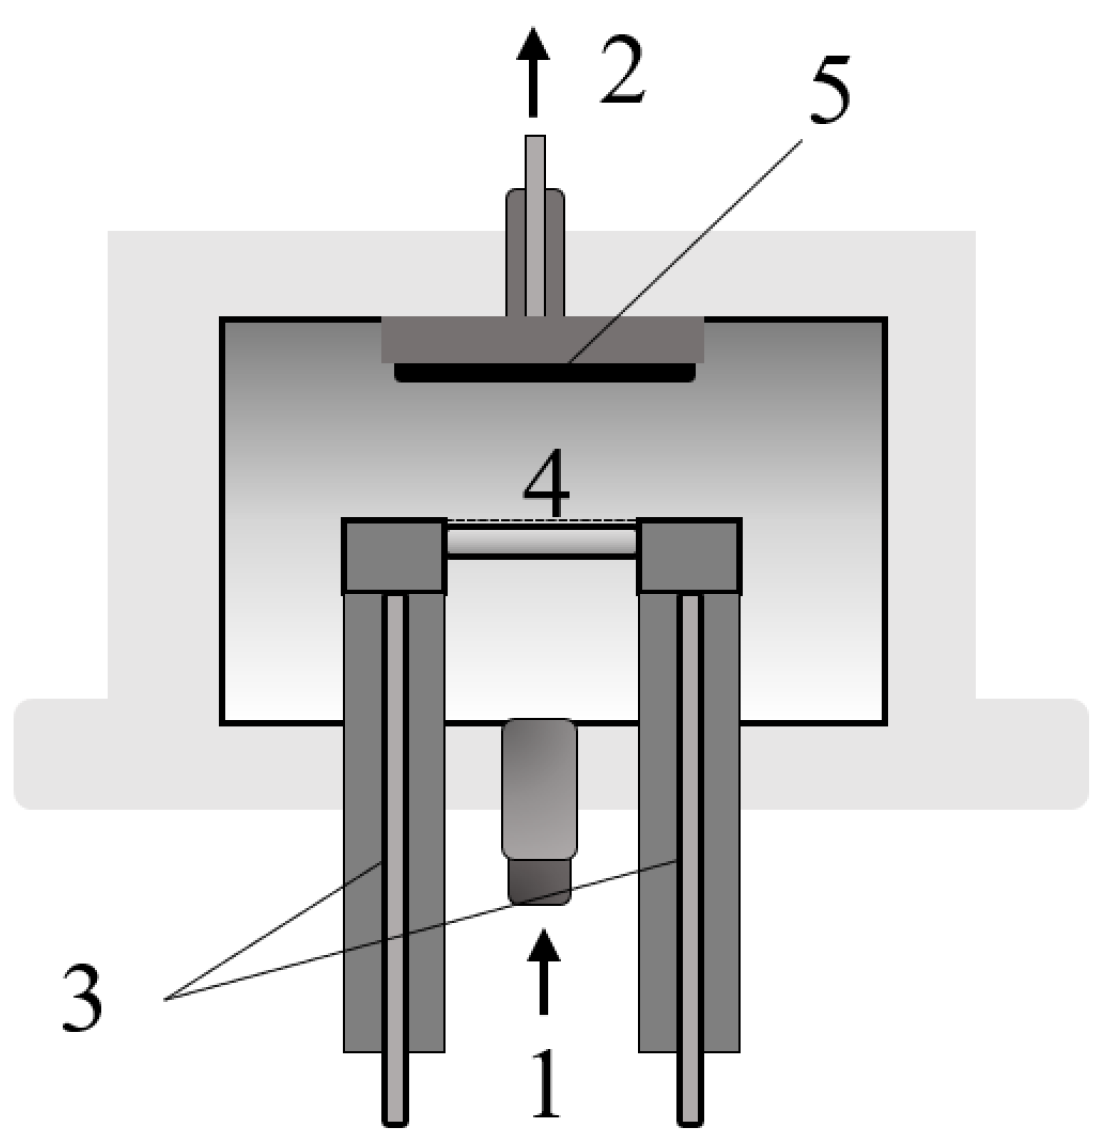
2.3. Flash Pyrolysis Experiments in Wire Mesh Reactor
2.4. Modelling of Devolatilisation Kinetics and Volatile Yield
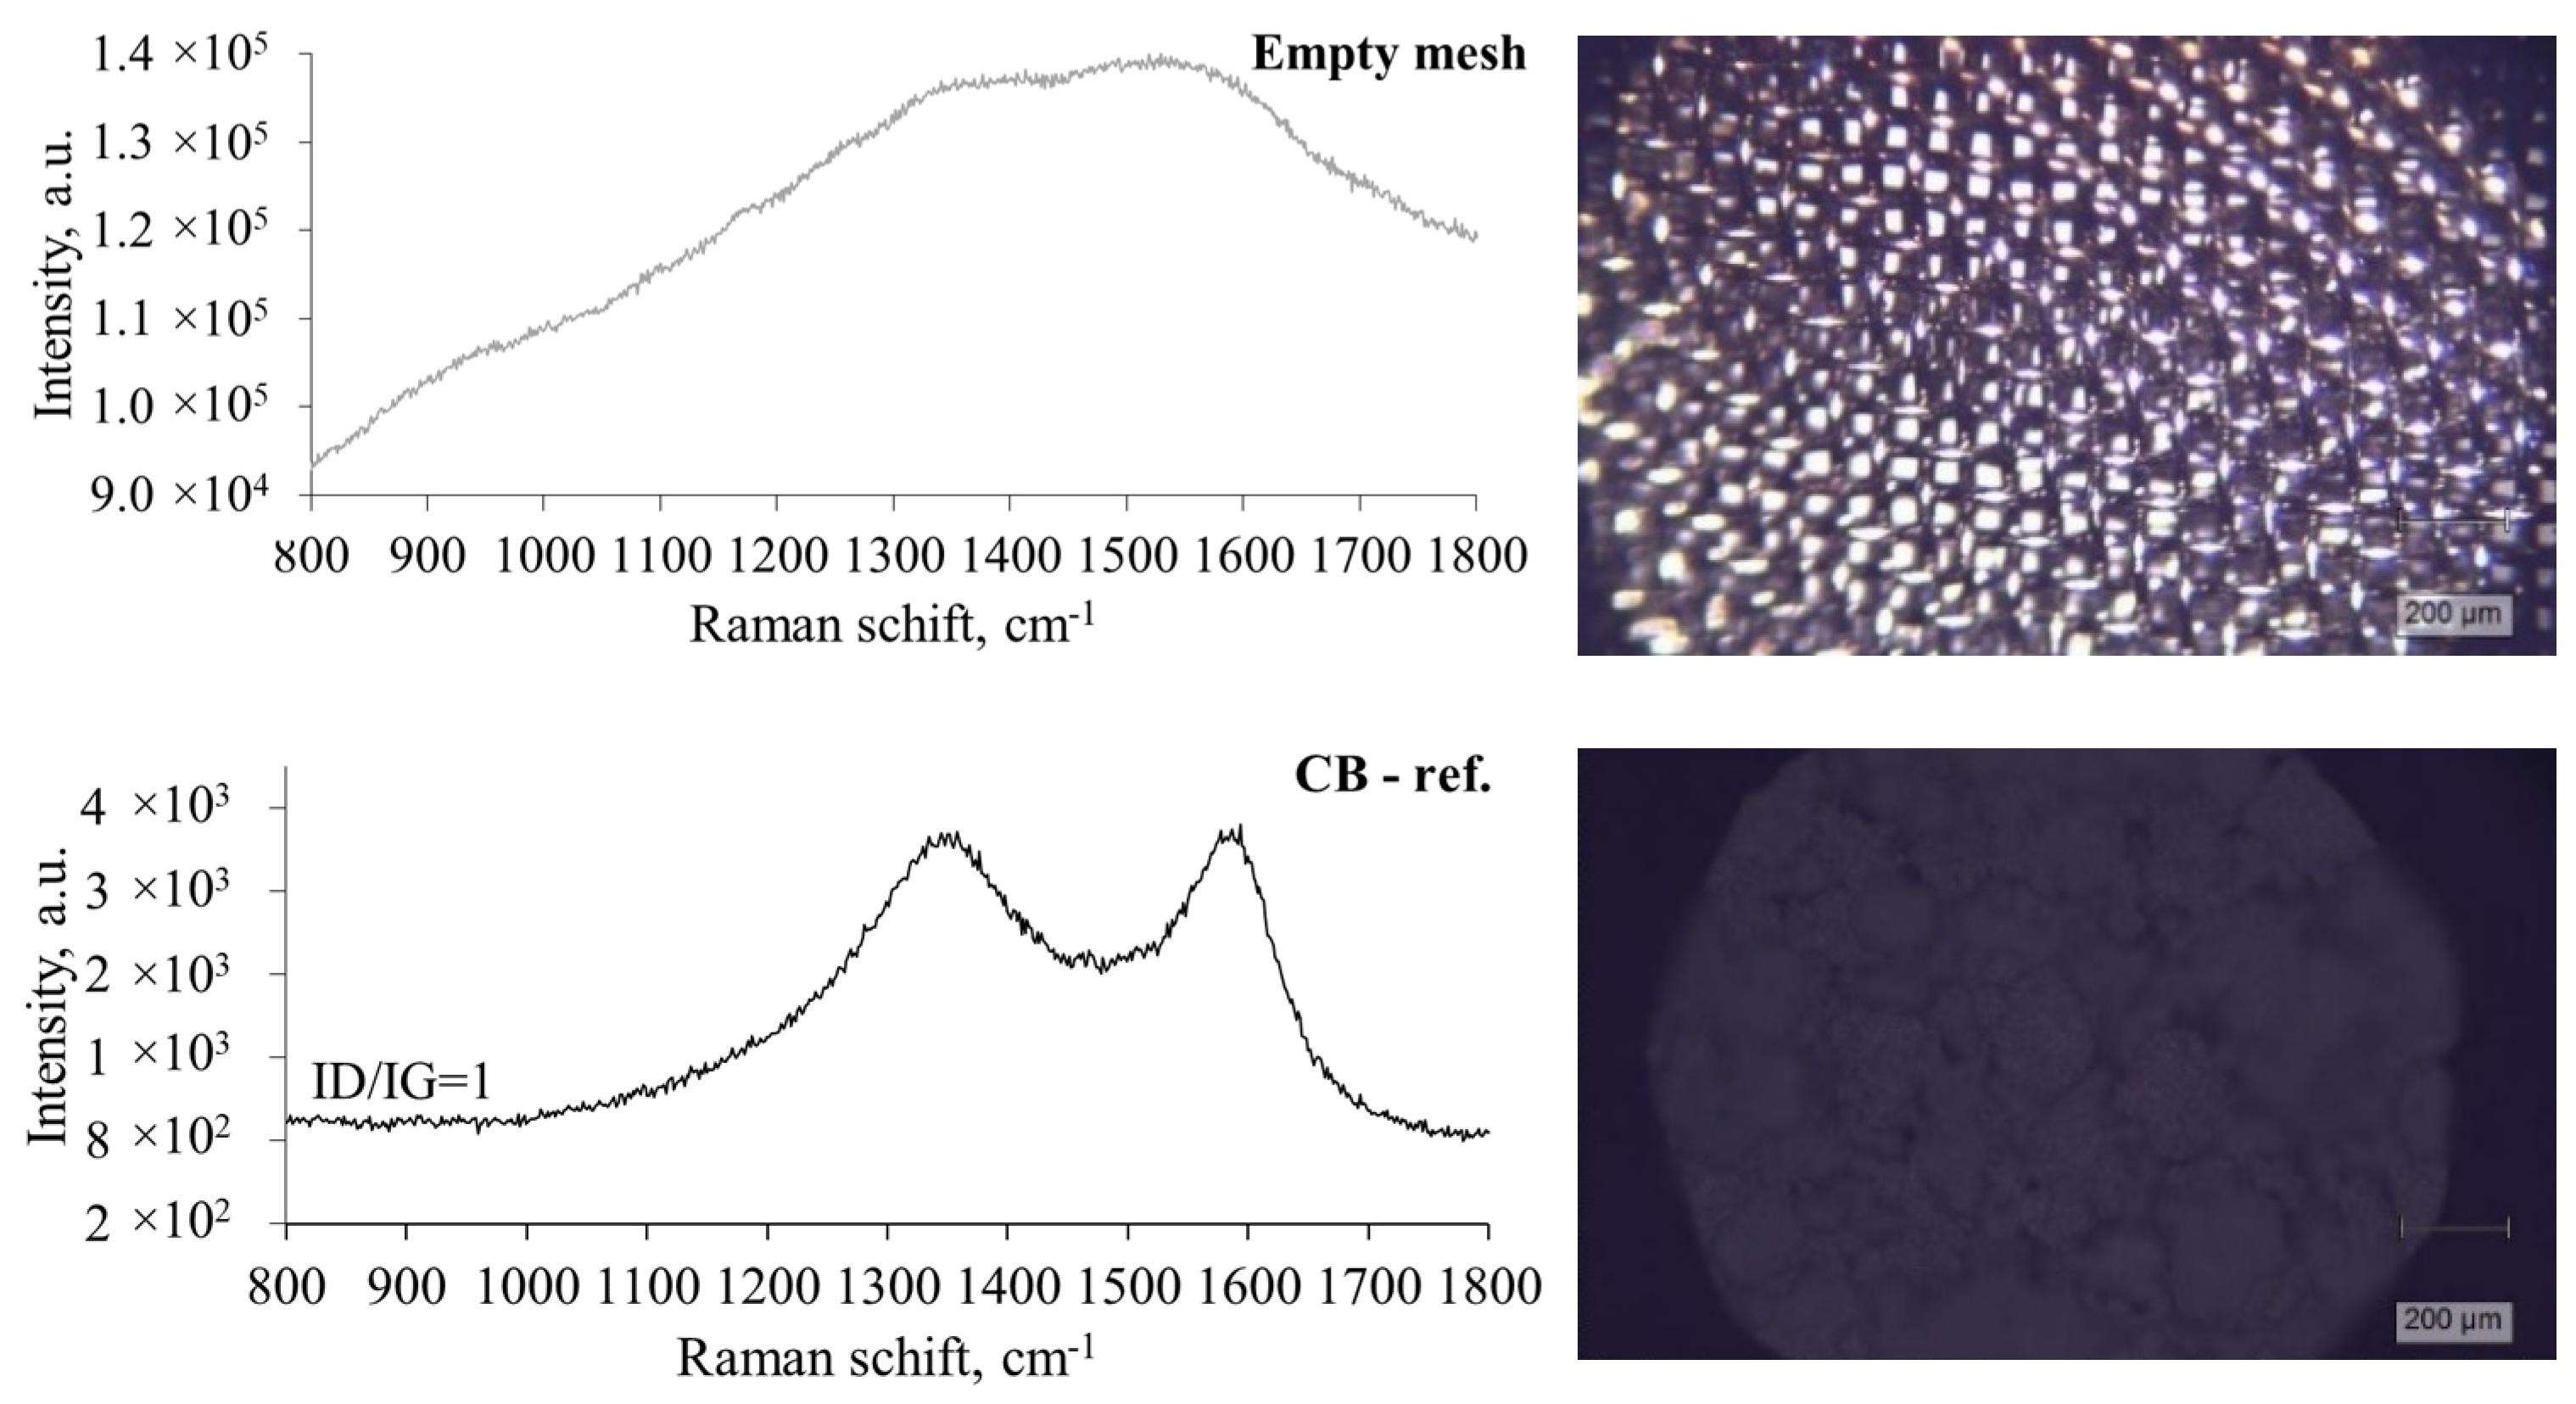
2.5. Raman Spectroscopy Measurements of Pyrolytic Carbon Deposits
3. Results and Discussion
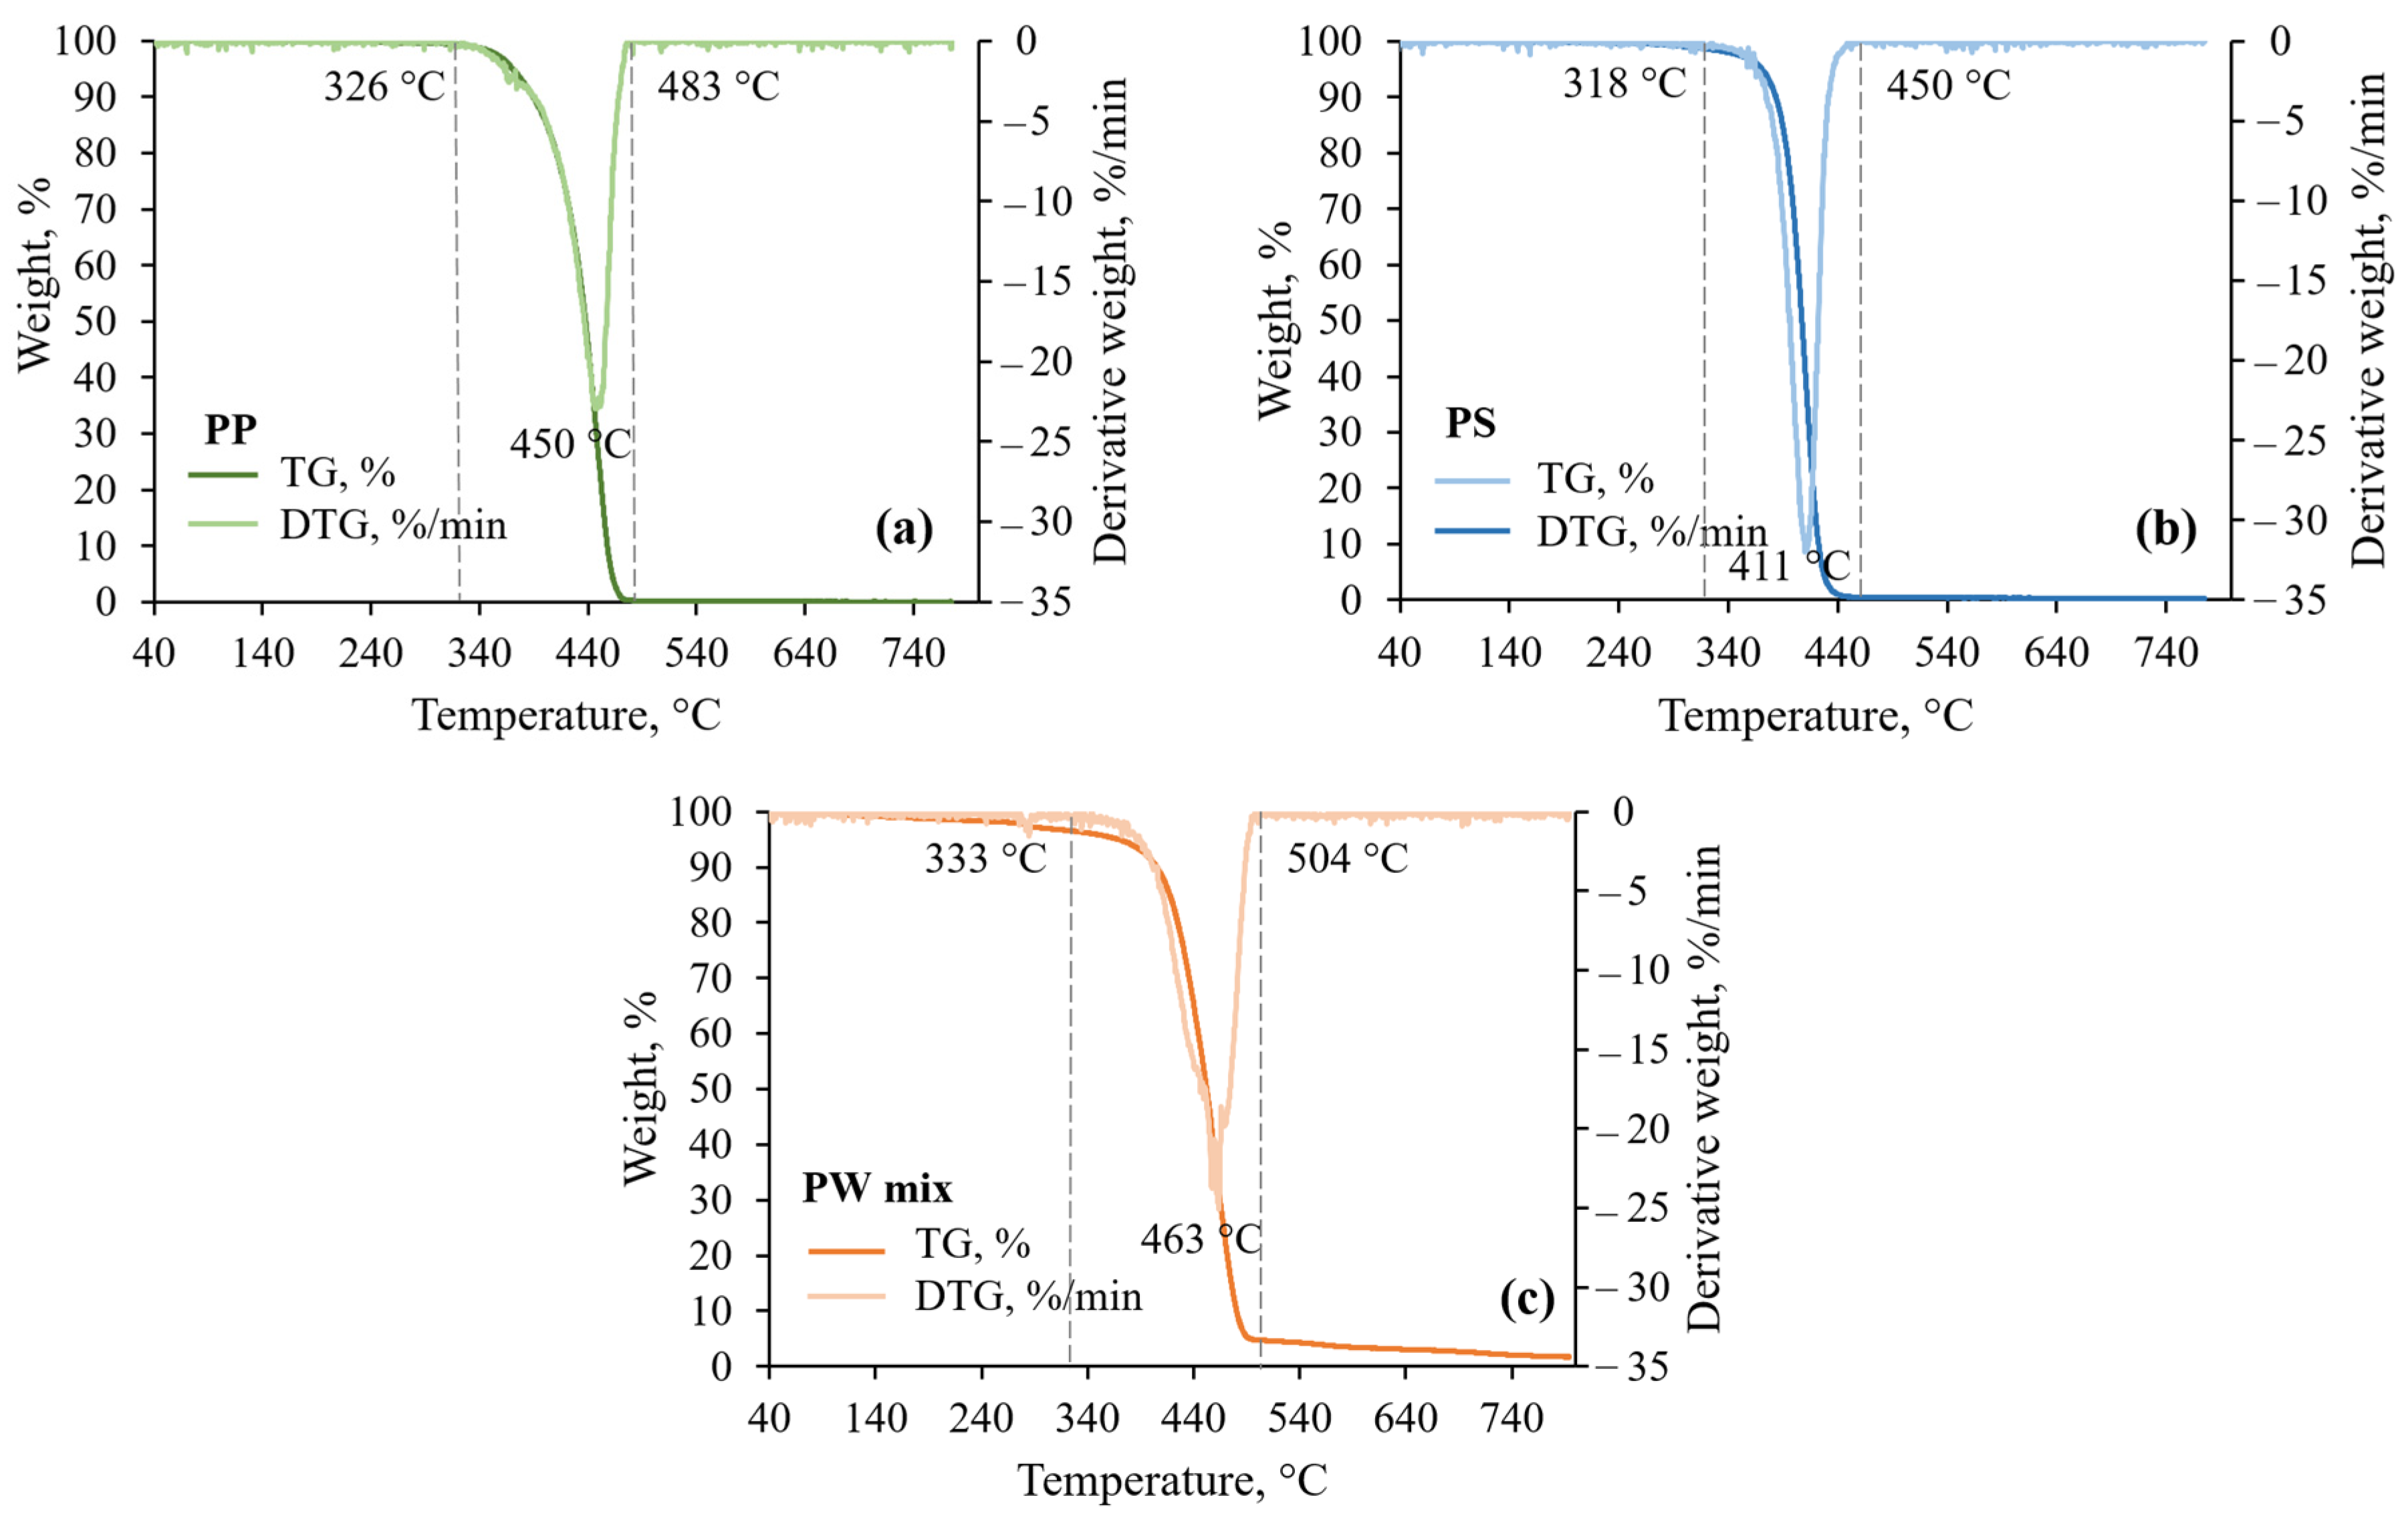
3.1. Feedstock Thermal Analysis
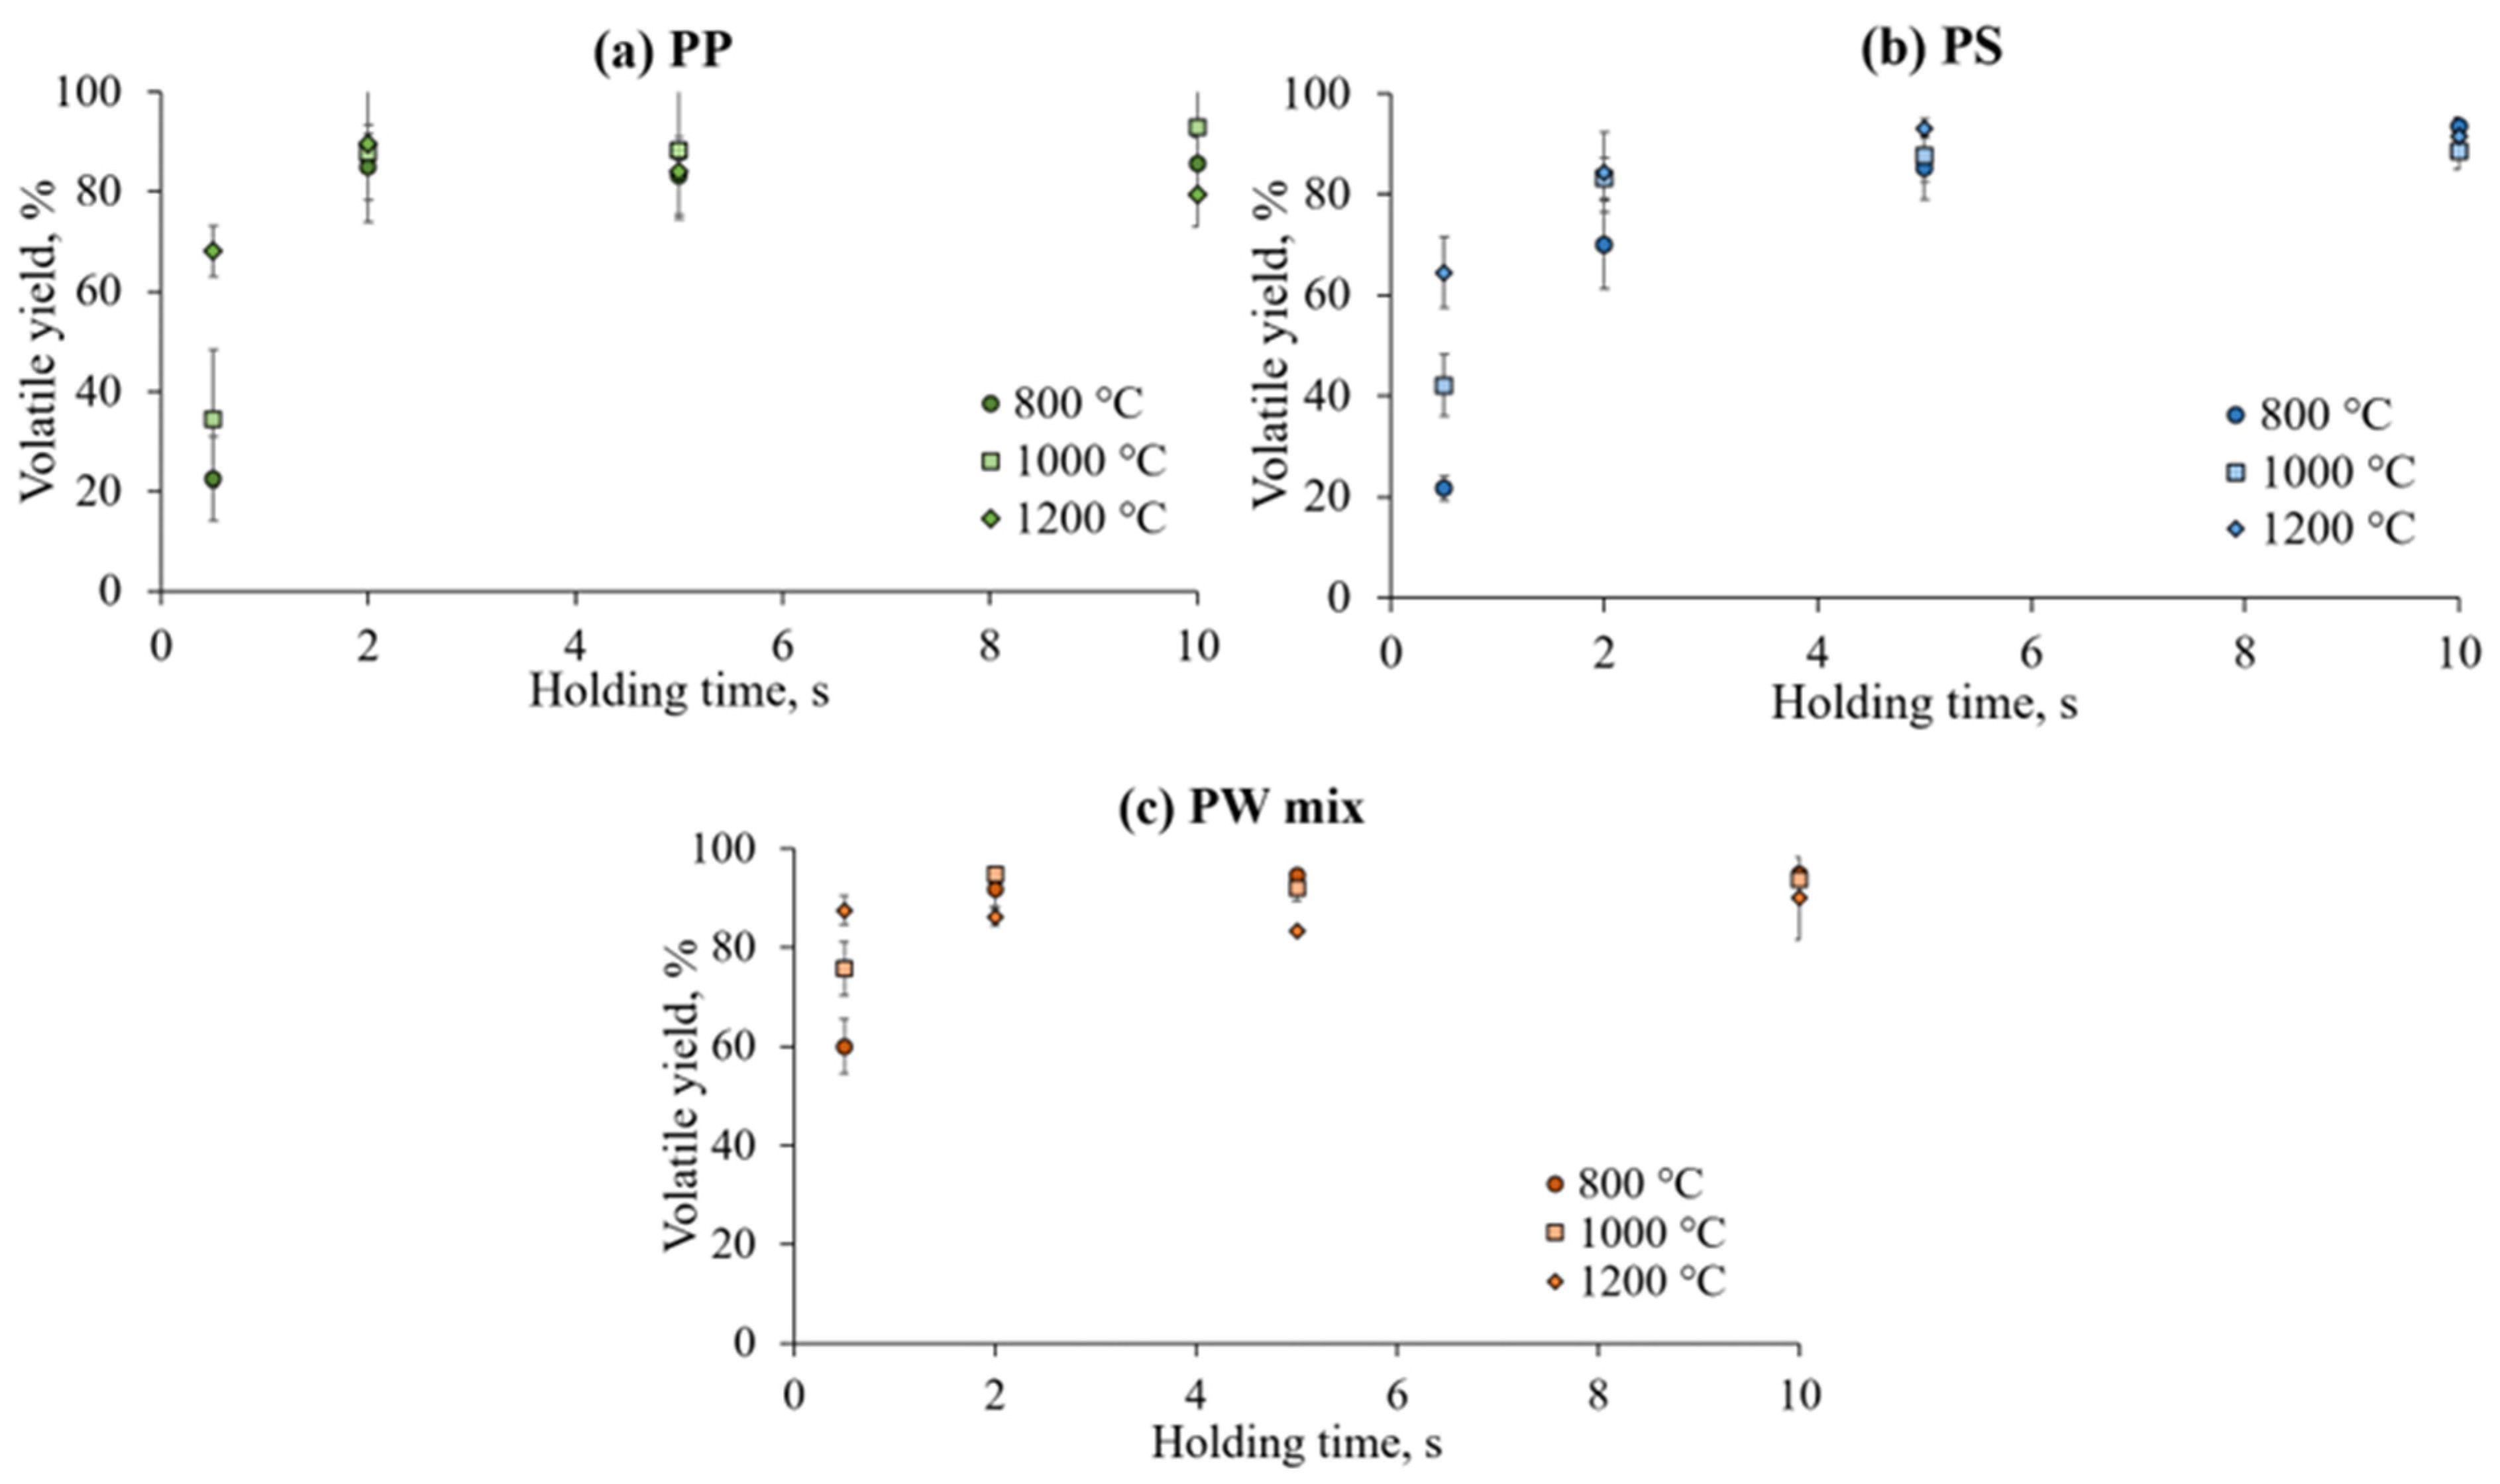
3.2. Influence of Temperature and Holding Time on Volatile Yield During Flash Pyrolysis
3.3. Kinetic Modelling of Devolatilisation
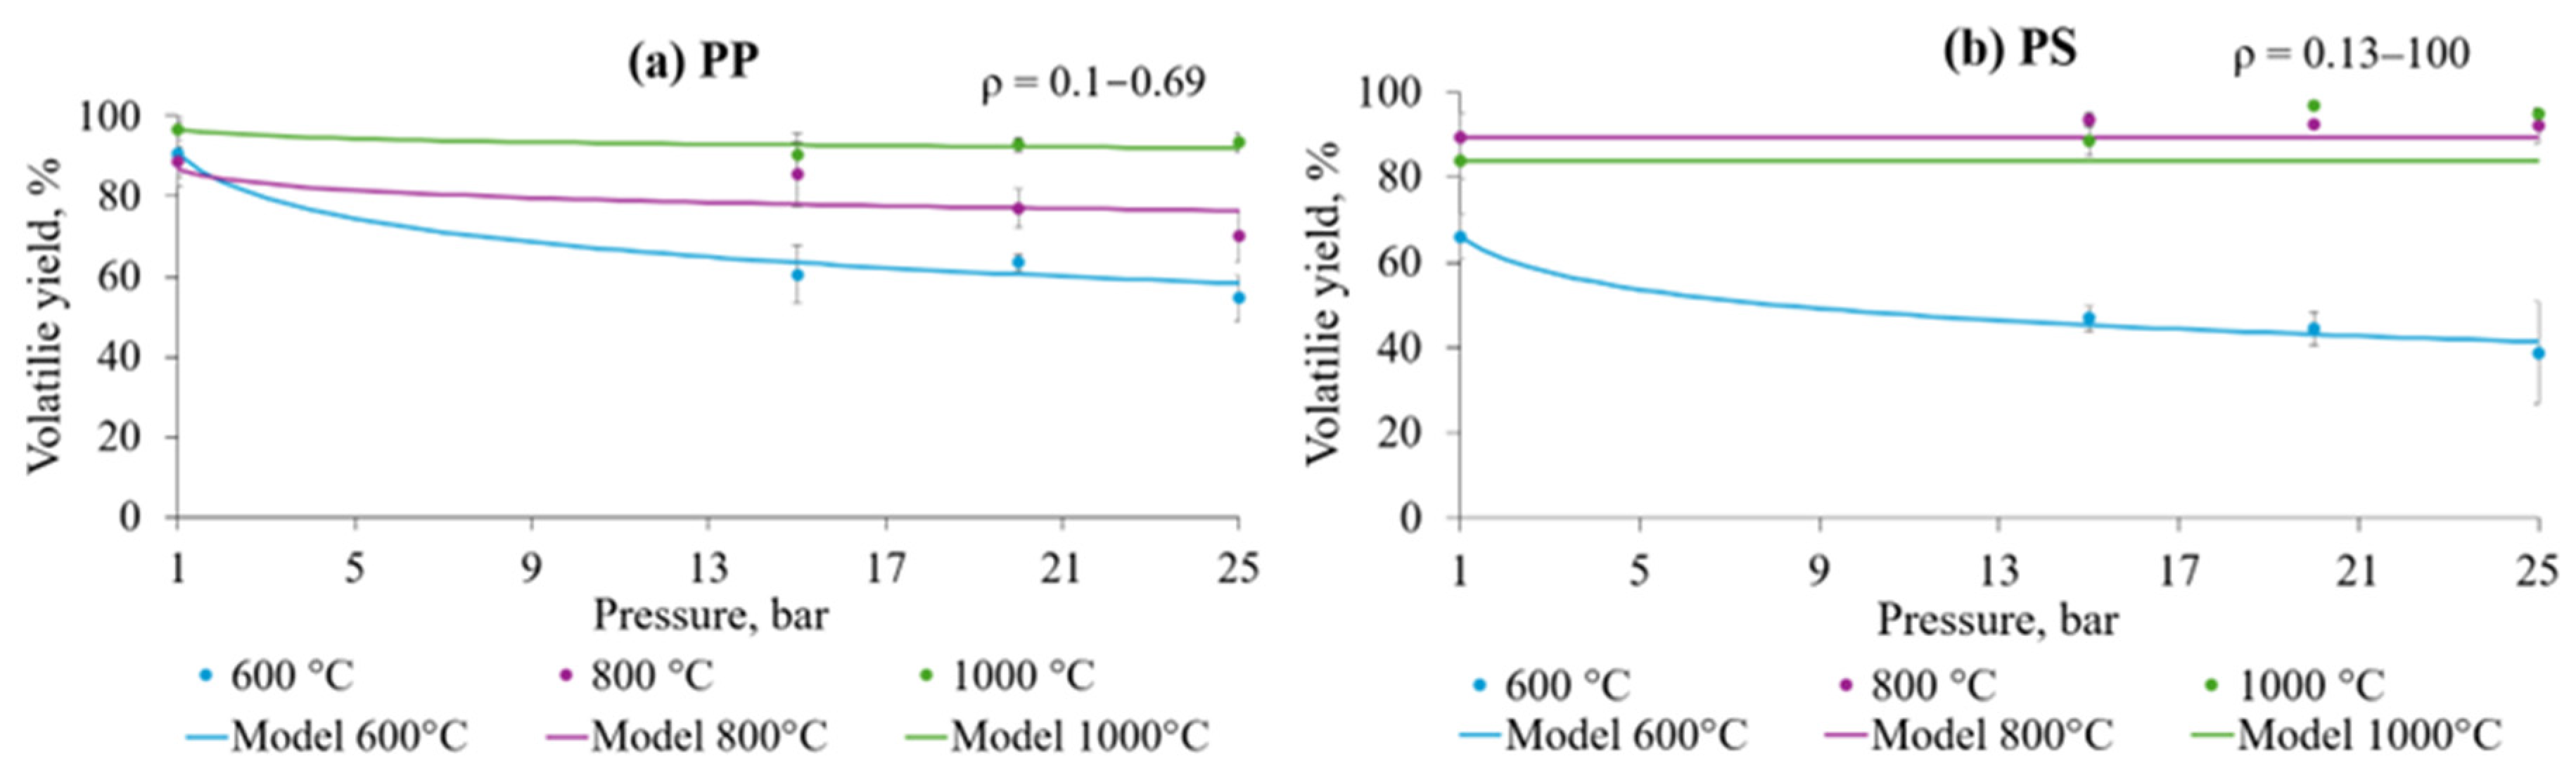
3.4. Influence of Pressure on Volatile Yield During Flash Pyrolysis
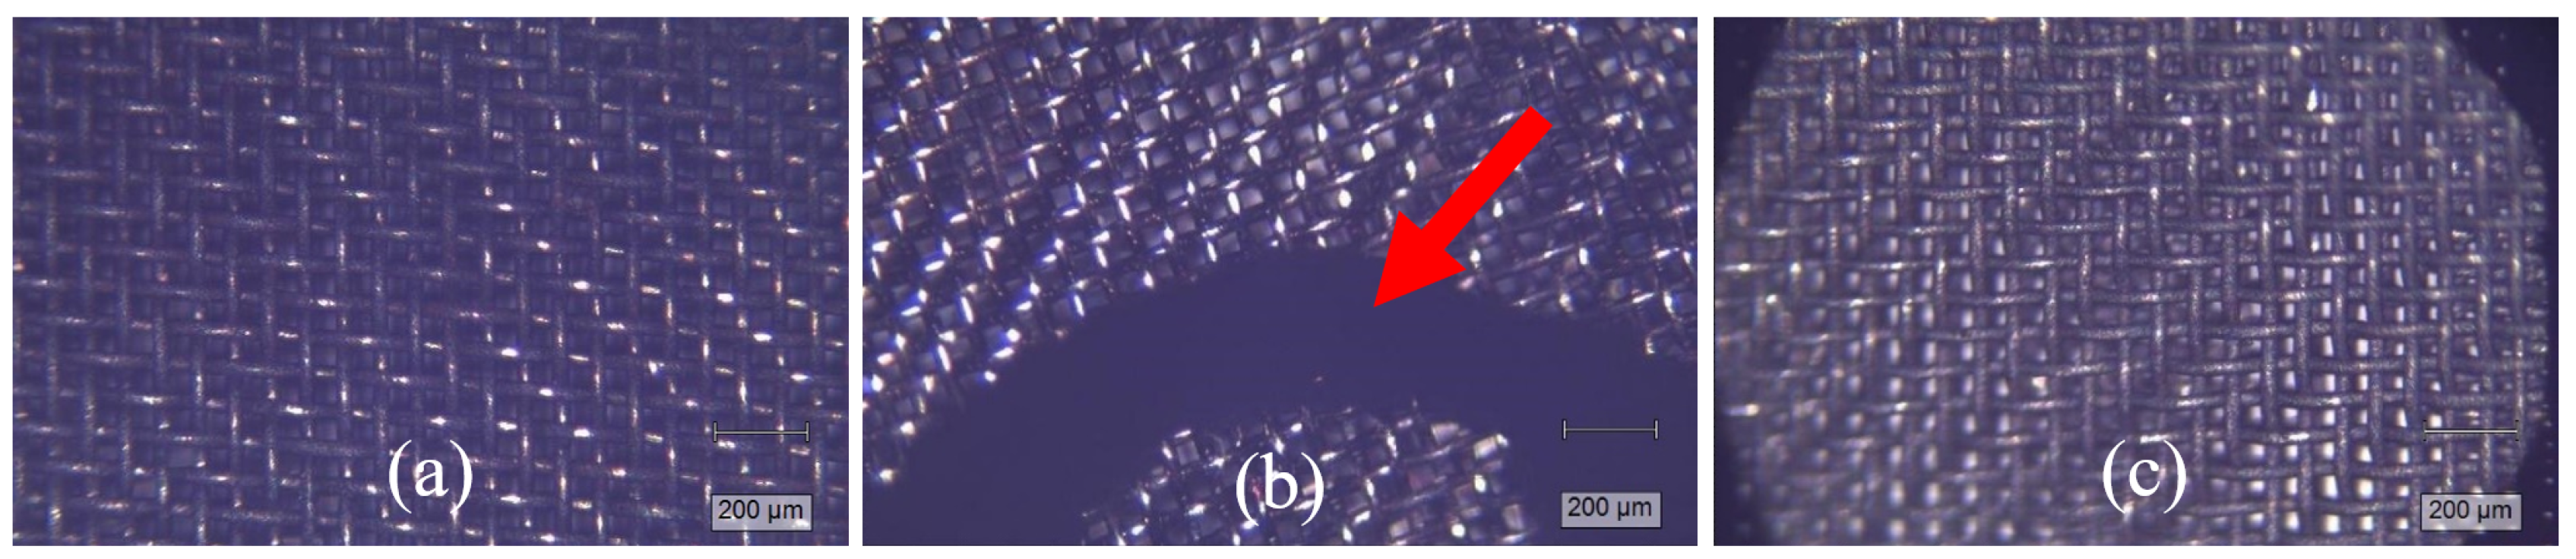
3.5. Characterization of Pyrolytic Carbon Deposits by Raman Spectroscopy
4. Discussion
- Cooled feeding (tubular) to feed plastics into the reaction temperature, avoiding melting (occurring at 100–200 °C) and clogging the feed inlet.
- Entrained flow reactor tube of estimated length and flows targeting CB production with controlled CB aggregate sizes. The length of the reactor tube and the flow rate of N2 gas for primary decomposition and subsequent secondary and tertiary reactions—determining factors affecting reaction time.
- Water quenching after pyrolysis to cool the reaction and collect the solid product.
- Drying and characterisation of produced CB—the structural characteristics (graphitisation, crystallite size, and other) are measured by XRD or Raman spectroscopy; morphology of particles (size and morphology of single particles and aggregates)—measured by SEM or TEM microscopy methods. Determination of the composition of the solid product via ultimate and proximate analysis must be included.
5. Conclusions
Author Contributions
Funding
Institutional Review Board Statement
Data Availability Statement
Acknowledgments
Conflicts of Interest
Abbreviations
| PW mix | municipal plastic packaging waste |
| PP | polypropylene |
| PS | polystyrene |
| CB | carbon black |
| HC | hydrocarbons |
| VOC | volatile organic compound |
| WMR | wire mesh reactor |
| k | reaction rate constant |
| Ea | activation energy |
| A | pre-exponential factor |
| TGA | thermogravimetric analysis |
| DTG | differential thermogravimetric analysis |
| SFOR | single first-order reaction model |
References
- Hahladakis, J.N.; Velis, C.A.; Weber, R.; Iacovidou, E.; Purnell, P. An Overview of Chemical Additives Present in Plastics: Migration, Release, Fate and Environmental Impact during Their Use, Disposal and Recycling. J. Hazard. Mater. 2018, 344, 179–199. [Google Scholar] [CrossRef] [PubMed]
- Ritchie, H.; Samborska, V.; Roser, M. Plastic Pollution. Available online: https://ourworldindata.org/plastic-pollution (accessed on 4 September 2024).
- Plastics Europe Plastics—The Facts 2022. Available online: https://plasticseurope.org/knowledge-hub/plastics-the-facts-2022/ (accessed on 4 September 2024).
- Bardales Cruz, M.; Saikawa, E.; Hengstermann, M.; Ramirez, A.; McCracken, J.P.; Thompson, L.M. Plastic Waste Generation and Emissions from the Domestic Open Burning of Plastic Waste in Guatemala. Environ. Sci. Atmos. 2023, 3, 156–167. [Google Scholar] [CrossRef] [PubMed]
- Thushari, G.G.N.; Senevirathna, J.D.M. Plastic Pollution in the Marine Environment. Heliyon 2020, 6, e04709. [Google Scholar] [CrossRef] [PubMed]
- Ragaert, K.; Delva, L.; Van Geem, K. Mechanical and Chemical Recycling of Solid Plastic Waste. Waste Manag. 2017, 69, 24–58. [Google Scholar] [CrossRef] [PubMed]
- Jin, H.; Gonzalez-Gutierrez, J.; Oblak, P.; Zupančič, B.; Emri, I. The Effect of Extensive Mechanical Recycling on the Properties of Low Density Polyethylene. Polym. Degrad. Stab. 2012, 97, 2262–2272. [Google Scholar] [CrossRef]
- Gil-Jasso, N.D.; Segura-González, M.A.; Soriano-Giles, G.; Neri-Hipolito, J.; López, N.; Mas-Hernández, E.; Barrera-Díaz, C.E.; Varela-Guerrero, V.; Ballesteros-Rivas, M.F. Dissolution and Recovery of Waste Expanded Polystyrene Using Alternative Essential Oils. Fuel 2019, 239, 611–616. [Google Scholar] [CrossRef]
- Prior, L.; Oliveira, M.S.A.; Zhiltsova, T. Assessment of the Impact of Superficial Contamination and Thermo-Oxidative Degradation on the Properties of Post-Consumer Recycled Polypropylene. Materials 2023, 16, 1198. [Google Scholar] [CrossRef] [PubMed]
- Kusenberg, M.; Eschenbacher, A.; Djokic, M.R.; Zayoud, A.; Ragaert, K.; De Meester, S.; Van Geem, K.M. Opportunities and Challenges for the Application of Post-Consumer Plastic Waste Pyrolysis Oils as Steam Cracker Feedstocks: To Decontaminate or Not to Decontaminate? Waste Manag. 2022, 138, 83–115. [Google Scholar] [CrossRef]
- Donnet, J.B.; Bansal, R.C.; Wang, M.-J. Carbon Black Science and Technology, 2nd ed.; Amazon: Seattle, WA, USA, 1997; ISBN 082478975X. [Google Scholar]
- Sahebdelfar, S.; Soltanieh, M. A Study on the Applicability of Non-Stoichiometric Thermodynamic Models for the Prediction of Carbon Black Yield and off-Gas Composition in Oil Furnace Process. Carbon Trends 2023, 13, 100308. [Google Scholar] [CrossRef]
- Rosner, F.; Bhagde, T.; Slaughter, D.S.; Zorba, V.; Stokes-Draut, J. Techno-Economic and Carbon Dioxide Emission Assessment of Carbon Black Production. J. Clean. Prod. 2024, 436, 140224. [Google Scholar] [CrossRef]
- Patlolla, S.R.; Katsu, K.; Sharafian, A.; Wei, K.; Herrera, O.E.; Mérida, W. A Review of Methane Pyrolysis Technologies for Hydrogen Production. Renew. Sustain. Energy Rev. 2023, 181, 113323. [Google Scholar] [CrossRef]
- Ahmed, S.; Aitani, A.; Rahman, F.; Al-Dawood, A.; Al-Muhaish, F. Decomposition of Hydrocarbons to Hydrogen and Carbon. Appl. Catal. A Gen. 2009, 359, 1–24. [Google Scholar] [CrossRef]
- da Costa Labanca, A.R. Carbon Black and Hydrogen Production Process Analysis. Int. J. Hydrogen Energy 2020, 45, 25698–25707. [Google Scholar] [CrossRef]
- Gautier, M.; Rohani, V.; Fulcheri, L. Direct Decarbonization of Methane by Thermal Plasma for the Production of Hydrogen and High Value-Added Carbon Black. Int. J. Hydrogen Energy 2017, 42, 28140–28156. [Google Scholar] [CrossRef]
- Bhatt, K.P.; Patel, S.; Upadhyay, D.S.; Patel, R.N. Production of Hydrogen-Rich Fuel Gas from Waste Plastics Using Continuous Plasma Pyrolysis Reactor. J. Environ. Manag. 2024, 356, 120446. [Google Scholar] [CrossRef] [PubMed]
- Diaz-Silvarrey, L.S.; Zhang, K.; Phan, A.N. Monomer Recovery through Advanced Pyrolysis of Waste High Density Polyethylene (HDPE). Green Chem. 2018, 20, 1813–1823. [Google Scholar] [CrossRef]
- Singh, R.K.; Ruj, B.; Sadhukhan, A.K.; Gupta, P. Impact of Fast and Slow Pyrolysis on the Degradation of Mixed Plastic Waste: Product Yield Analysis and Their Characterization. J. Energy Inst. 2019, 92, 1647–1657. [Google Scholar] [CrossRef]
- Win, M.M.; Asari, M.; Hayakawa, R.; Hosoda, H.; Yano, J.; Sakai, S.I. Gas and Tar Generation Behavior during Flash Pyrolysis of Wood Pellet and Plastic. J. Mater. Cycles Waste Manag. 2020, 22, 547–555. [Google Scholar] [CrossRef]
- Karaduman, A.; Şimşek, E.; Çiçek, B.; Bilgesü, A. Flash Pyrolysis of Polystyrene Wastes in a Free-Fall Reactor under Vacuum. J. Anal. Appl. Pyrolysis 2001, 60, 179–186. [Google Scholar] [CrossRef]
- Albright, L.F.; Marek, J.C. Coke Formation during Pyrolysis: Roles of Residence Time, Reactor Geometry, and Time of Operation. Ind. Eng. Chem. Res. 1988, 27, 743–751. [Google Scholar] [CrossRef]
- Kiminaitė, I.; González-Arias, J.; Striūgas, N.; Eimontas, J.; Seemann, M. Syngas Production from Protective Face Masks through Pyrolysis/Steam Gasification. Energies 2023, 16, 5417. [Google Scholar] [CrossRef]
- López, A.; de Marco, I.; Caballero, B.M.; Laresgoiti, M.F.; Adrados, A. Influence of Time and Temperature on Pyrolysis of Plastic Wastes in a Semi-Batch Reactor. Chem. Eng. J. 2011, 173, 62–71. [Google Scholar] [CrossRef]
- Ono, K.; Yanaka, M.; Tanaka, S.; Saito, Y.; Aoki, H.; Fukuda, O.; Aoki, T.; Yamaguchi, T. Influence of Furnace Temperature and Residence Time on Configurations of Carbon Black. Chem. Eng. J. 2012, 200–202, 541–548. [Google Scholar] [CrossRef]
- Williams, P.T.; Slaney, E. Analysis of Products from the Pyrolysis and Liquefaction of Single Plastics and Waste Plastic Mixtures. Resour. Conserv. Recycl. 2007, 51, 754–769. [Google Scholar] [CrossRef]
- Harmon, R.E.; SriBala, G.; Broadbelt, L.J.; Burnham, A.K. Insight into Polyethylene and Polypropylene Pyrolysis: Global and Mechanistic Models. Energy Fuels 2021, 35, 6765–6775. [Google Scholar] [CrossRef]
- Vyazovkin, S.; Wight, C.A. Model-Free and Model-Fitting Approaches to Kinetic Analysis of Isothermal and Nonisothermal Data. Thermochim. Acta 1999, 340–341, 53–68. [Google Scholar] [CrossRef]
- Yousef, S.; Eimontas, J.; Striūgas, N.; Zakarauskas, K.; Praspaliauskas, M.; Abdelnaby, M.A. Pyrolysis Kinetic Behavior and TG-FTIR-GC–MS Analysis of Metallised Food Packaging Plastics. Fuel 2020, 282, 118737. [Google Scholar] [CrossRef]
- Han, B.; Chen, Y.; Wu, Y.; Hua, D.; Chen, Z.; Feng, W.; Yang, M.; Xie, Q. Co-Pyrolysis Behaviors and Kinetics of Plastics-Biomass Blends through Thermogravimetric Analysis. J. Therm. Anal. Calorim. 2014, 115, 227–235. [Google Scholar] [CrossRef]
- Oyedun, A.O.; Tee, C.Z.; Hanson, S.; Hui, C.W. Thermogravimetric Analysis of the Pyrolysis Characteristics and Kinetics of Plastics and Biomass Blends. Fuel Process. Technol. 2014, 128, 471–481. [Google Scholar] [CrossRef]
- Miteva, K.; Slavcho, A.; Bogoeva-Gaceva, G. Kinetic Analysis of Pyrolysis of Waste Polyolefin Mixture. Arab. J. Sci. Eng. 2016, 41, 2601–2609. [Google Scholar] [CrossRef]
- Mortezaeikia, V.; Tavakoli, O.; Khodaparasti, M.S. A Review on Kinetic Study Approach for Pyrolysis of Plastic Wastes Using Thermogravimetric Analysis. J. Anal. Appl. Pyrolysis 2021, 160, 105340. [Google Scholar] [CrossRef]
- Jiang, G.; Fenwick, R.; Seville, J.; Mahood, H.B.; Thorpe, R.B.; Bhattacharya, S.; Monsalve, D.A.S.; Leeke, G.A. Lumped Kinetic Modelling of Polyolefin Pyrolysis: A Non-Isothermal Method to Estimate Rate Constants. J. Anal. Appl. Pyrolysis 2022, 164, 105530. [Google Scholar] [CrossRef]
- Cano-Pleite, E.; Rubio-Rubio, M.; Riedel, U.; Soria-Verdugo, A. Evaluation of the Number of First-Order Reactions Required to Accurately Model Biomass Pyrolysis. Chem. Eng. J. 2021, 408, 127291. [Google Scholar] [CrossRef]
- Yousef, S.; Eimontas, J.; Striūgas, N.; Abdelnaby, M.A. Pyrolysis Kinetic Behaviour and TG-FTIR-GC–MS Analysis of Coronavirus Face Masks. J. Anal. Appl. Pyrolysis 2021, 156, 105118. [Google Scholar] [CrossRef] [PubMed]
- Nisar, J.; Ali, G.; Shah, A.; Iqbal, M.; Khan, R.A.; Sirajuddin; Anwar, F.; Ullah, R.; Akhter, M.S. Fuel Production from Waste Polystyrene via Pyrolysis: Kinetics and Products Distribution. Waste Manag. 2019, 88, 236–247. [Google Scholar] [CrossRef] [PubMed]
- Aboulkas, A.; El Harfi, K.; El Bouadili, A.; Ben Chanâa, M.; Mokhlisse, A. Pyrolysis Kinetics of Polypropylene: Morocco Oil Shale and Their Mixture. In Proceedings of the Journal of Thermal Analysis and Calorimetry; Springer: Berlin/Heidelberg, Germany, 2007. [Google Scholar]
- Shan, T.; Bian, H.; Wang, K.; Li, Z.; Qiu, J.; Zhu, D.; Wang, C.; Tian, X. Study on Pyrolysis Characteristics and Kinetics of Mixed Waste Plastics under Different Atmospheres. Thermochim. Acta 2023, 722, 179467. [Google Scholar] [CrossRef]
- Yin, F.; Zhuang, Q.; Chang, T.; Zhang, C.; Sun, H.; Sun, Q.; Wang, C.; Li, L. Study on Pyrolysis Characteristics and Kinetics of Mixed Plastic Waste. J. Mater. Cycles Waste Manag. 2021, 23, 1984–1994. [Google Scholar] [CrossRef]
- Biagini, E.; Fantozzi, C.; Tognotti, L. CHARACTERIZATION OF DEVOLATILIZATION OF SECONDARY FUELS IN DIFFERENT CONDITIONS. Combust. Sci. Technol. 2004, 176, 685–703. [Google Scholar] [CrossRef]
- Bikane, K.; Yu, J.; Shankar, R.; Long, X.; Paterson, N.; Millan, M. Early-Stage Kinetics and Char Structural Evolution during CO2 Gasification of Morupule Coal in a Wire-Mesh Reactor. Chem. Eng. J. 2021, 421, 127803. [Google Scholar] [CrossRef]
- Niksiar, A.; Faramarzi, A.H.; Sohrabi, M. Kinetic Study of Polyethylene Terephthalate (PET) Pyrolysis in a Spouted Bed Reactor. J. Anal. Appl. Pyrolysis 2015, 113, 419–425. [Google Scholar] [CrossRef]
- Paik, P.; Kar, K.K. Kinetics of Thermal Degradation and Estimation of Lifetime for Polypropylene Particles: Effects of Particle Size. Polym. Degrad. Stab. 2008, 93, 24–35. [Google Scholar] [CrossRef]
- Di Blasi, C. Influences of Physical Properties on Biomass Devolatilization Characteristics. Fuel 1997, 76, 957–964. [Google Scholar] [CrossRef]
- Zhou, C.; Yang, W. Effect of Heat Transfer Model on the Prediction of Refuse-Derived Fuel Pyrolysis Process. Fuel 2015, 142, 46–57. [Google Scholar] [CrossRef]
- ASTM D3172; ASTM International Practice for Proximate Analysis of Coal and Coke. ASTM International: West Conshohocken, PA, USA, 2007.
- ASTM D3176; ASTM International Practice for Ultimate Analysis of Coal and Coke. ASTM International: West Conshohocken, PA, USA, 2015.
- Tremel, A. Reactions Kinetics of Solid Fuels During Entrained Flow Gasification. Ph.D. Thesis, Technical University of Munich, Munich, Germany, 2012. [Google Scholar]
- Dou, B.; Park, S.; Lim, S.; Yu, T.U.; Hwang, J. Pyrolysis Characteristics of Refuse Derived Fuel in a Pilot-Scale Unit. Energy Fuels 2007, 21, 3730–3734. [Google Scholar] [CrossRef]
- Tremel, A.; Spliethoff, H. Gasification Kinetics during Entrained Flow Gasification—Part I; Devolatilisation and Char Deactivation. Fuel 2013, 103, 663–671. [Google Scholar] [CrossRef]
- Jayarama Krishna, J.V.; Korobeinichev, O.P.; Vinu, R. Isothermal Fast Pyrolysis Kinetics of Synthetic Polymers Using Analytical Pyroprobe. J. Anal. Appl. Pyrolysis 2019, 139, 48–58. [Google Scholar] [CrossRef]
- ASTM E2550; Standard Test Method for Thermal Stability by Thermogravimetry. ASTM International: West Conshohocken, PA, USA, 2021.
- Kim, K.-W.; Lee, H.-M.; Kang, S.-H.; Kim, B.-J. Synthesis and Characterization of Activated Carbon Fibers Derived from Linear Low-Density Polyethylene Fibers Stabilized at a Low Temperature. Polymers 2021, 13, 3918. [Google Scholar] [CrossRef]
- Uhl, F.M.; Levchik, G.F.; Levchik, S.V.; Dick, C.; Liggat, J.J.; Snape, C.E.; Wilkie, C.A. The Thermal Stability of Cross-Linked Polymers: Methyl Methacrylate with Divinylbenzene and Styrene with Dimethacrylates. Polym. Degrad. Stab. 2001, 71, 317–325. [Google Scholar] [CrossRef]
- Aguado, R.; Olazar, M.; Gaisán, B.; Prieto, R.; Bilbao, J. Kinetic Study of Polyolefin Pyrolysis in a Conical Spouted Bed Reactor. Ind. Eng. Chem. Res. 2002, 41, 4559–4566. [Google Scholar] [CrossRef]
- Flaxman, R.; Hallett, W. Flow and Particle Heating in an Entrained Flow Reactor. Fuel 1987, 66, 607–611. [Google Scholar] [CrossRef]
- Anene, A.F.; Fredriksen, S.B.; Sætre, K.A.; Tokheim, L.A. Experimental Study of Thermal and Catalytic Pyrolysis of Plastic Waste Components. Sustain. 2018, 10, 3979. [Google Scholar] [CrossRef]
- Koga, N.; Vyazovkin, S.; Burnham, A.K.; Favergeon, L.; Muravyev, N.V.; Pérez-Maqueda, L.A.; Saggese, C.; Sánchez-Jiménez, P.E. ICTAC Kinetics Committee Recommendations for Analysis of Thermal Decomposition Kinetics. Thermochim. Acta 2023, 719, 179384. [Google Scholar] [CrossRef]
- Mianowski, A.; Radko, T.; Siudyga, T. Kinetic Compensation Effect of Isoconversional Methods. React. Kinet. Mech. Catal. 2021, 132, 37–58. [Google Scholar] [CrossRef]
- Tanaka, H.; Koga, N. KINETIC COMPENSATION EFFECT BETWEEN THE ISOTHERMAL AND NON-ISOTHERMAL DECOMPOSITION OF SOLIDS. J. Themal Anal. 1988, 34, 685–691. [Google Scholar] [CrossRef]
- Zeng, D.; Fletcher, T.H. Effects of Pressure on Coal Pyrolysis and Char Morphology. Energy Fuels 2005, 19, 1828–1838. [Google Scholar] [CrossRef]
- Supriyanto; Ylitervo, P.; Richards, T. Gaseous Products from Primary Reactions of Fast Plastic Pyrolysis. J. Anal. Appl. Pyrolysis 2021, 158, 105248. [Google Scholar] [CrossRef]
- Onwudili, J.A.; Insura, N.; Williams, P.T. Composition of Products from the Pyrolysis of Polyethylene and Polystyrene in a Closed Batch Reactor: Effects of Temperature and Residence Time. J. Anal. Appl. Pyrolysis 2009, 86, 293–303. [Google Scholar] [CrossRef]
- Maafa, I. Pyrolysis of Polystyrene Waste: A Review. Polymers 2021, 13, 225. [Google Scholar] [CrossRef] [PubMed]
- Cheng, L.; Gu, J.; Wang, Y.; Zhang, J.; Yuan, H.; Chen, Y. Polyethylene High-Pressure Pyrolysis: Better Product Distribution and Process Mechanism Analysis. Chem. Eng. J. 2020, 385, 123866. [Google Scholar] [CrossRef]
- Li, Z.; Deng, L.; Kinloch, I.A.; Young, R.J. Raman Spectroscopy of Carbon Materials and Their Composites: Graphene, Nanotubes and Fibres. Prog. Mater. Sci. 2023, 135, 101089. [Google Scholar] [CrossRef]
- Ferrari, A.C.; Robertson, J. Interpretation of Raman Spectra of Disordered and Amorphous Carbon. Phys. Rev. B 2000, 61, 632–645. [Google Scholar] [CrossRef]
- Skrzypek, E. First- and Second-Order Raman Spectra of Carbonaceous Material through Successive Contact and Regional Metamorphic Events (Ryoke Belt, SW Japan). Lithos 2021, 388–389, 106029. [Google Scholar] [CrossRef]
- Cao, J.; Xiao, G.; Xu, X.; Shen, D.; Jin, B. Study on Carbonization of Lignin by TG-FTIR and High-Temperature Carbonization Reactor. Fuel Process. Technol. 2013, 106, 41–47. [Google Scholar] [CrossRef]
- Youssry, M.; Kamand, F.Z.; Magzoub, M.I.; Nasser, M.S. Aqueous Dispersions of Carbon Black and Its Hybrid with Carbon Nanofibers. RSC Adv. 2018, 8, 32119–32131. [Google Scholar] [CrossRef] [PubMed]
- Saravanan, M.; Ganesan, M.; Ambalavanan, S. An in Situ Generated Carbon as Integrated Conductive Additive for Hierarchical Negative Plate of Lead-Acid Battery. J. Power Sources 2014, 251, 20–29. [Google Scholar] [CrossRef]
- Gascoin, N.; Abraham, G.; Gillard, P. Thermal and Hydraulic Effects of Coke Deposit in Hydrocarbon Pyrolysis Process. J. Thermophys. Heat Transf. 2012, 26, 57–65. [Google Scholar] [CrossRef]
- Park, K.-B.; Jeong, Y.-S.; Guzelciftci, B.; Kim, J.-S. Two-Stage Pyrolysis of Polystyrene: Pyrolysis Oil as a Source of Fuels or Benzene, Toluene, Ethylbenzene, and Xylenes. Appl. Energy 2020, 259, 114240. [Google Scholar] [CrossRef]
- Liu, Y.; Qian, J.; Wang, J. Pyrolysis of Polystyrene Waste in a Fluidized-Bed Reactor to Obtain Styrene Monomer and Gasoline Fraction. Fuel Process. Technol. 2000, 63, 45–55. [Google Scholar] [CrossRef]


| Parameter | PP | PS | PW Mix |
|---|---|---|---|
| Proximate analysis (wt.%) | |||
| Moisture, % | – | – | – |
| Volatile matter, % | 99.88 | 99.71 | 96.6 |
| Fixed carbon *, % | 0.12 | 0.29 | 2.2 |
| Ash, % | – | – | 1.2 |
| Ultimate analysis (wt.%) | |||
| C, % | 86.28 | 94.94 | 77.3 |
| H, % | 13.72 | 5.06 | 12.47 |
| N, % | – | – | 0.11 |
| S, % | – | – | 0.05 |
| O *, % | – | – | 8.86 |
| Cl, % | – | – | 1.37 |
| Parameter | PP | PS | PW |
|---|---|---|---|
| A (1/s) | 130 | 130 | 130 |
| Ea (J/mol) | 48 | 48 | 48 |
| pset, bar | 1 | 1 | 1 |
| ρ | 100 | 100 | 100 |
| α* | 1 | 1 | 0.97 |
| αpset | 1 | 1 | 0.97 |
| Ea, kJ/mol | A, s−1 | |
|---|---|---|
| PP | 34.3 | 29.52 |
| PS | 28.1 | 16.32 |
| PW mix | 28 | 42.26 |
Disclaimer/Publisher’s Note: The statements, opinions and data contained in all publications are solely those of the individual author(s) and contributor(s) and not of MDPI and/or the editor(s). MDPI and/or the editor(s) disclaim responsibility for any injury to people or property resulting from any ideas, methods, instructions or products referred to in the content. |
© 2025 by the authors. Licensee MDPI, Basel, Switzerland. This article is an open access article distributed under the terms and conditions of the Creative Commons Attribution (CC BY) license (https://creativecommons.org/licenses/by/4.0/).
Share and Cite
Kiminaitė, I.; Wilhelm, S.; Martetschläger, L.; Eckert, C.L.B.; Berenguer Casco, M.; Striūgas, N.; Fendt, S. Plastic Devolatilisation Kinetics During Isothermal High-Temperature Pyrolysis: Focus on Solid Products (Part I). Polymers 2025, 17, 525. https://doi.org/10.3390/polym17040525
Kiminaitė I, Wilhelm S, Martetschläger L, Eckert CLB, Berenguer Casco M, Striūgas N, Fendt S. Plastic Devolatilisation Kinetics During Isothermal High-Temperature Pyrolysis: Focus on Solid Products (Part I). Polymers. 2025; 17(4):525. https://doi.org/10.3390/polym17040525
Chicago/Turabian StyleKiminaitė, Ieva, Sebastian Wilhelm, Lukas Martetschläger, Clara Leonie Brigitte Eckert, Marcos Berenguer Casco, Nerijus Striūgas, and Sebastian Fendt. 2025. "Plastic Devolatilisation Kinetics During Isothermal High-Temperature Pyrolysis: Focus on Solid Products (Part I)" Polymers 17, no. 4: 525. https://doi.org/10.3390/polym17040525
APA StyleKiminaitė, I., Wilhelm, S., Martetschläger, L., Eckert, C. L. B., Berenguer Casco, M., Striūgas, N., & Fendt, S. (2025). Plastic Devolatilisation Kinetics During Isothermal High-Temperature Pyrolysis: Focus on Solid Products (Part I). Polymers, 17(4), 525. https://doi.org/10.3390/polym17040525