
Evaluation of Different Concentrations of Graphene on the Structural and Optical Properties of Carboxymethyl Cellulose Sodium

 , ,
, ,
Abstract
1. Introduction
2. Materials and Methods
2.1. Materials
2.2. CMC/GO Nanocomposites Syntheses
2.3. Characterization Techniques
2.4. Calculation Details
3. Results
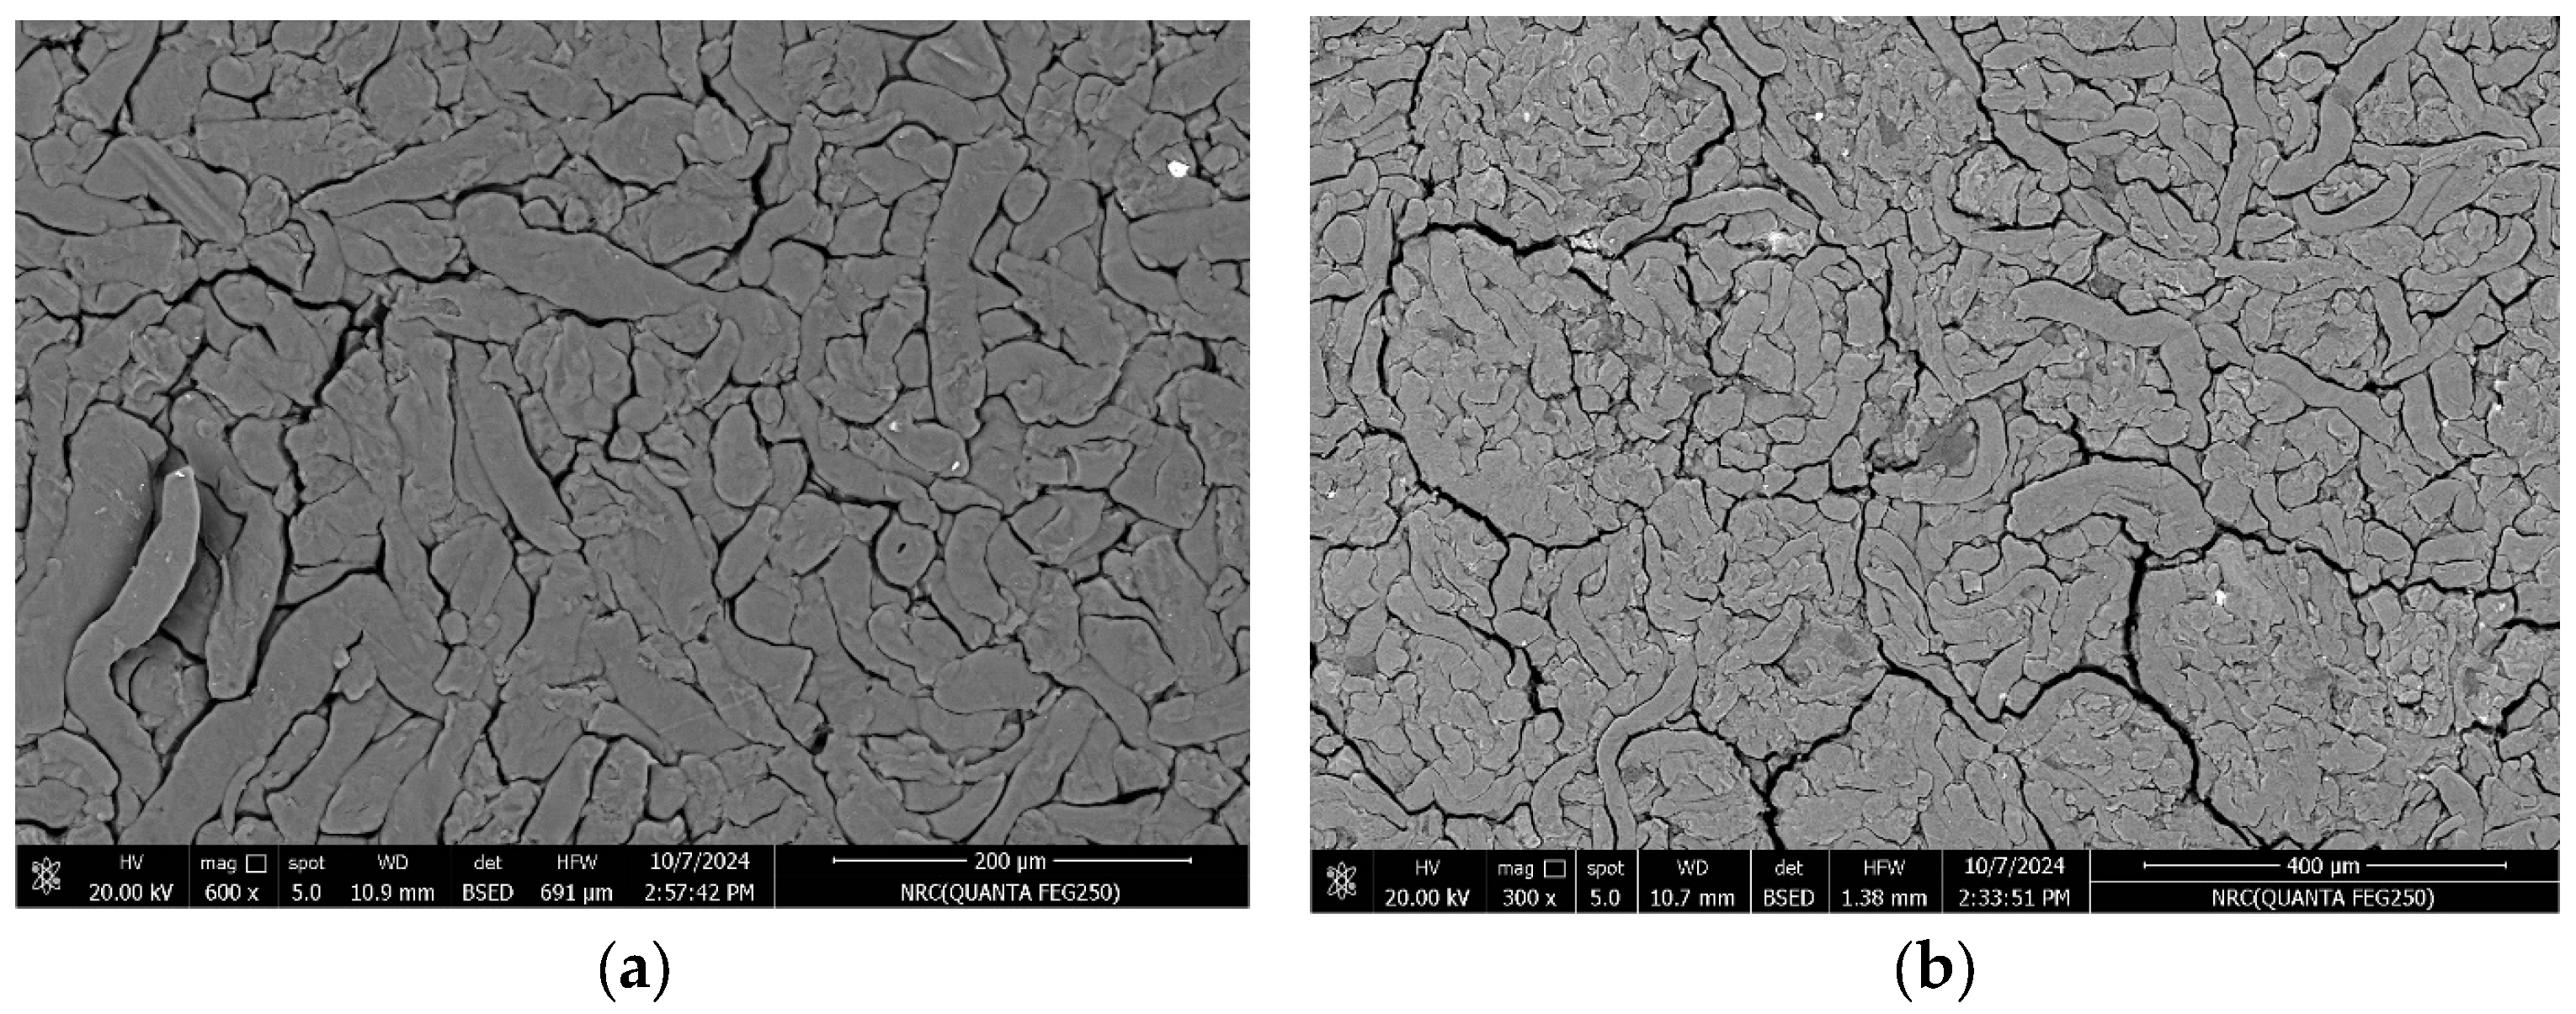
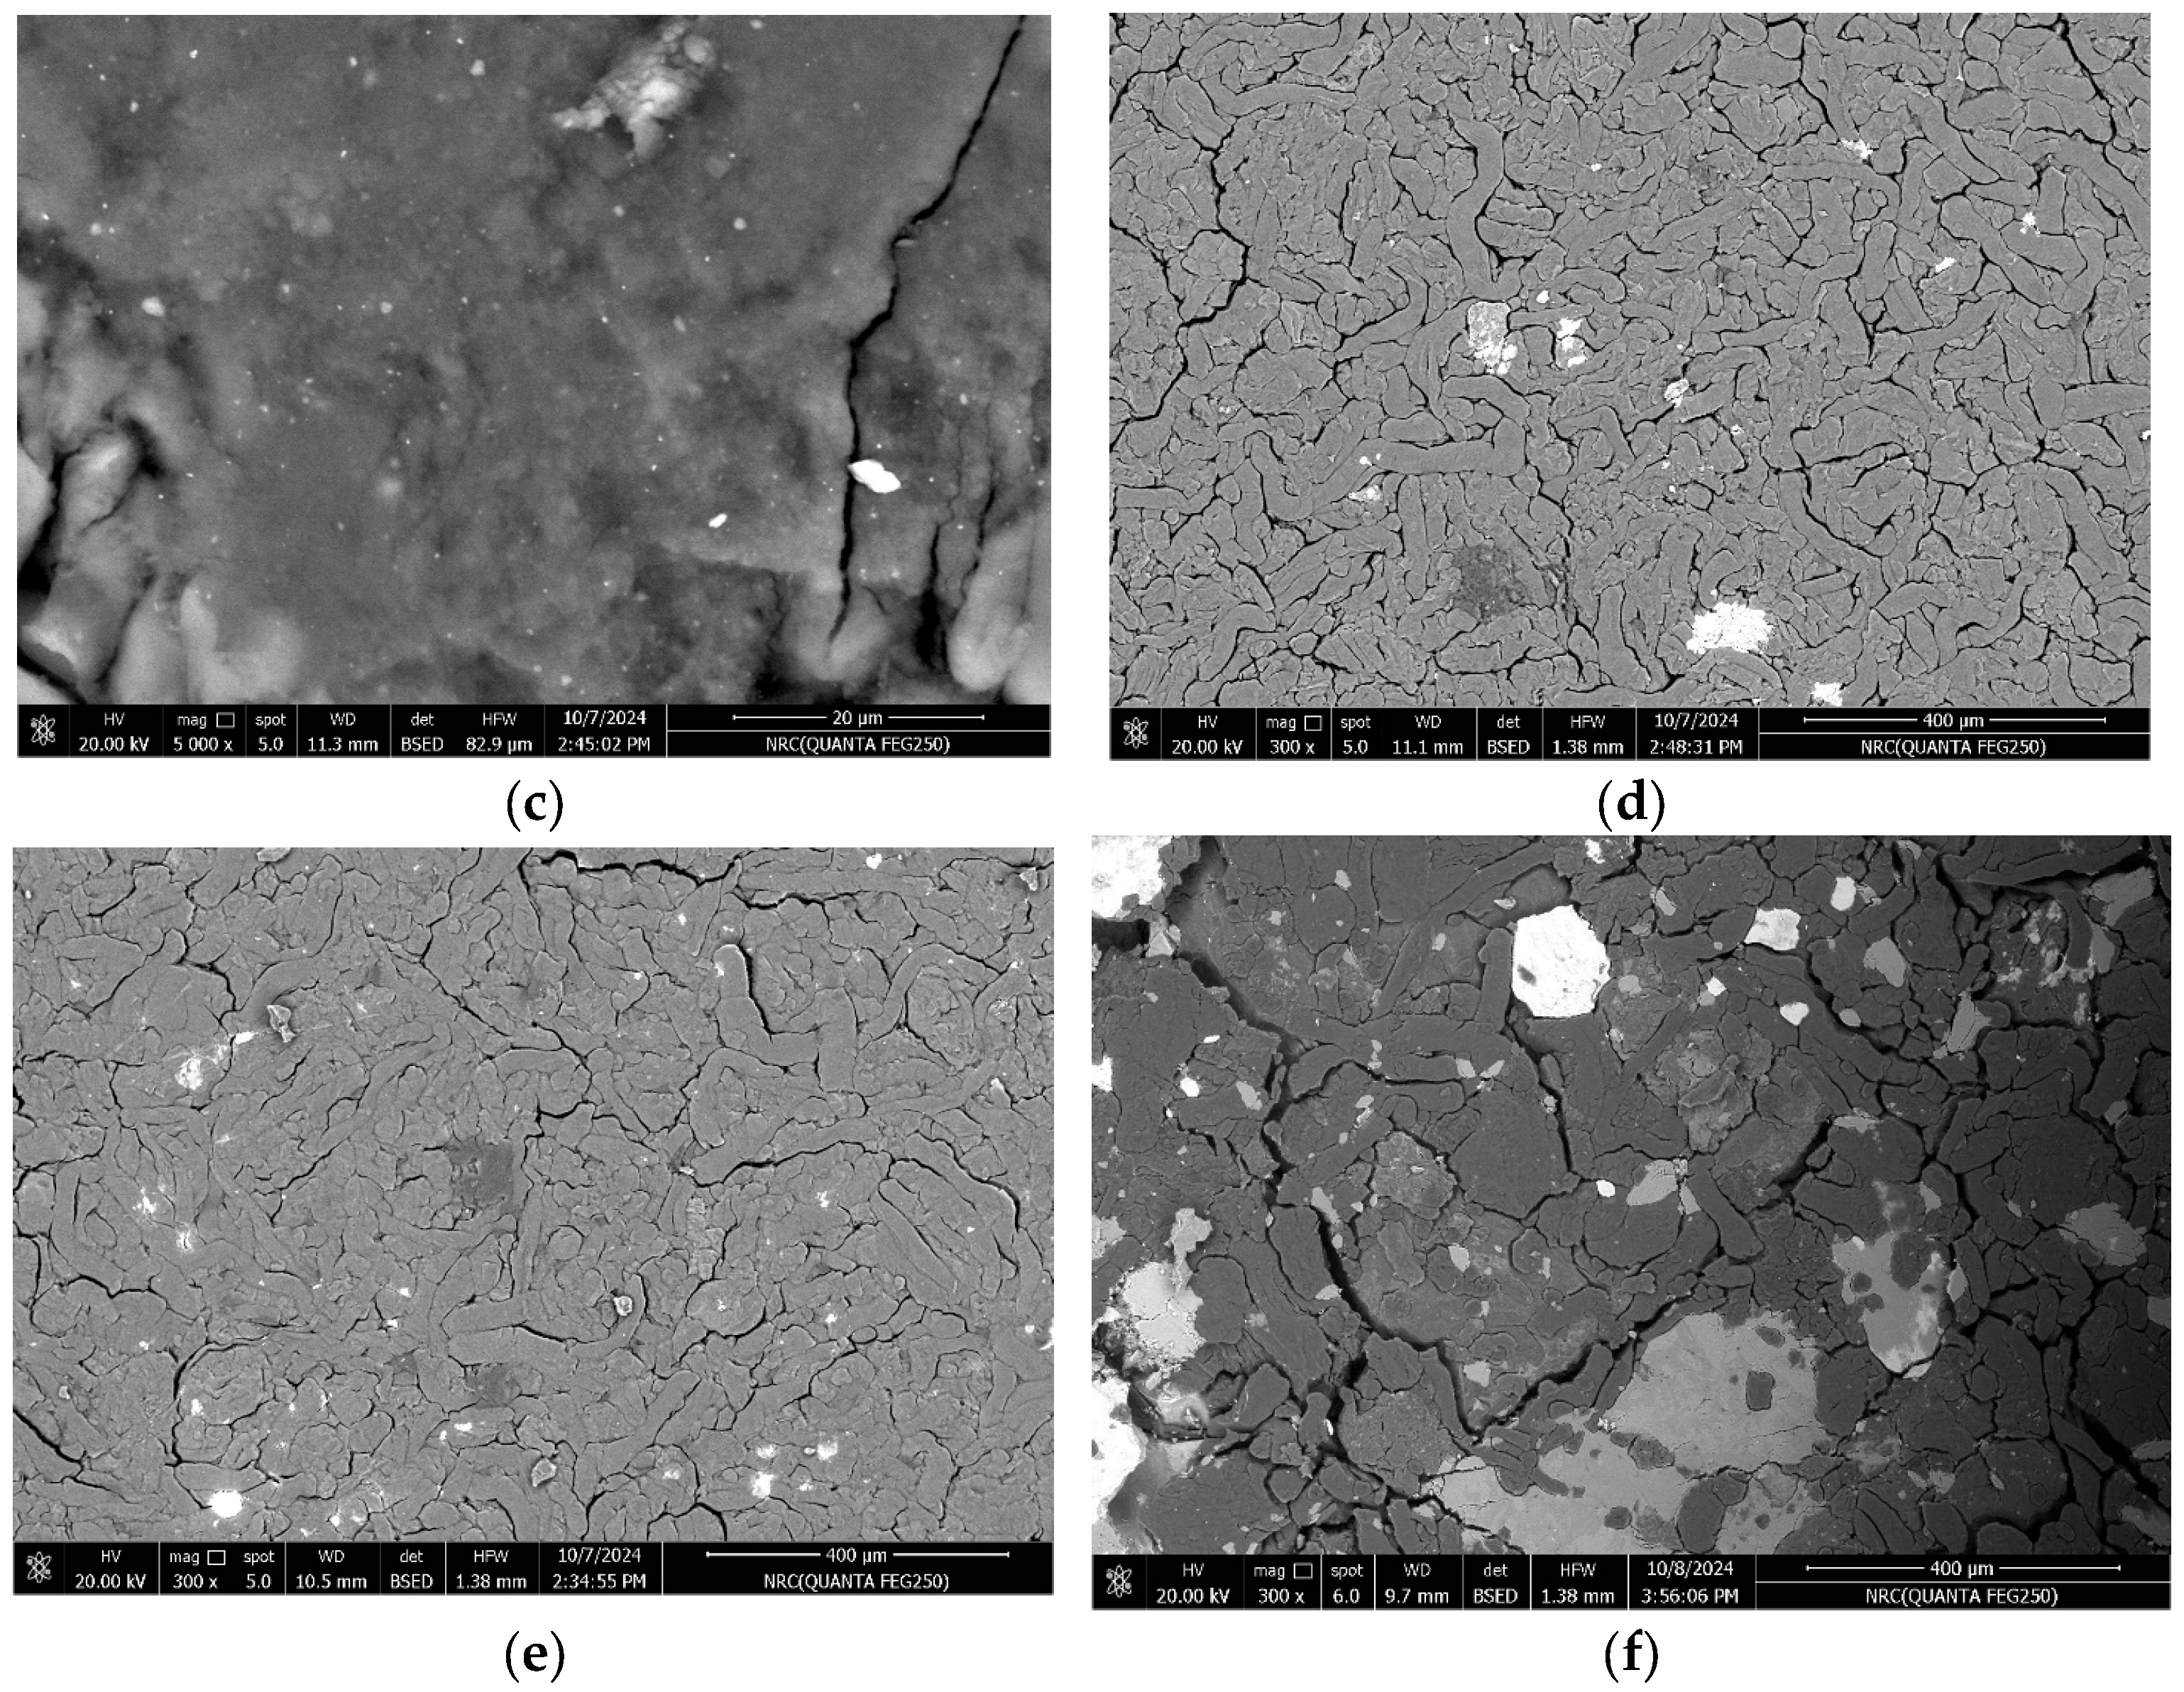
3.1. SEM Analysis
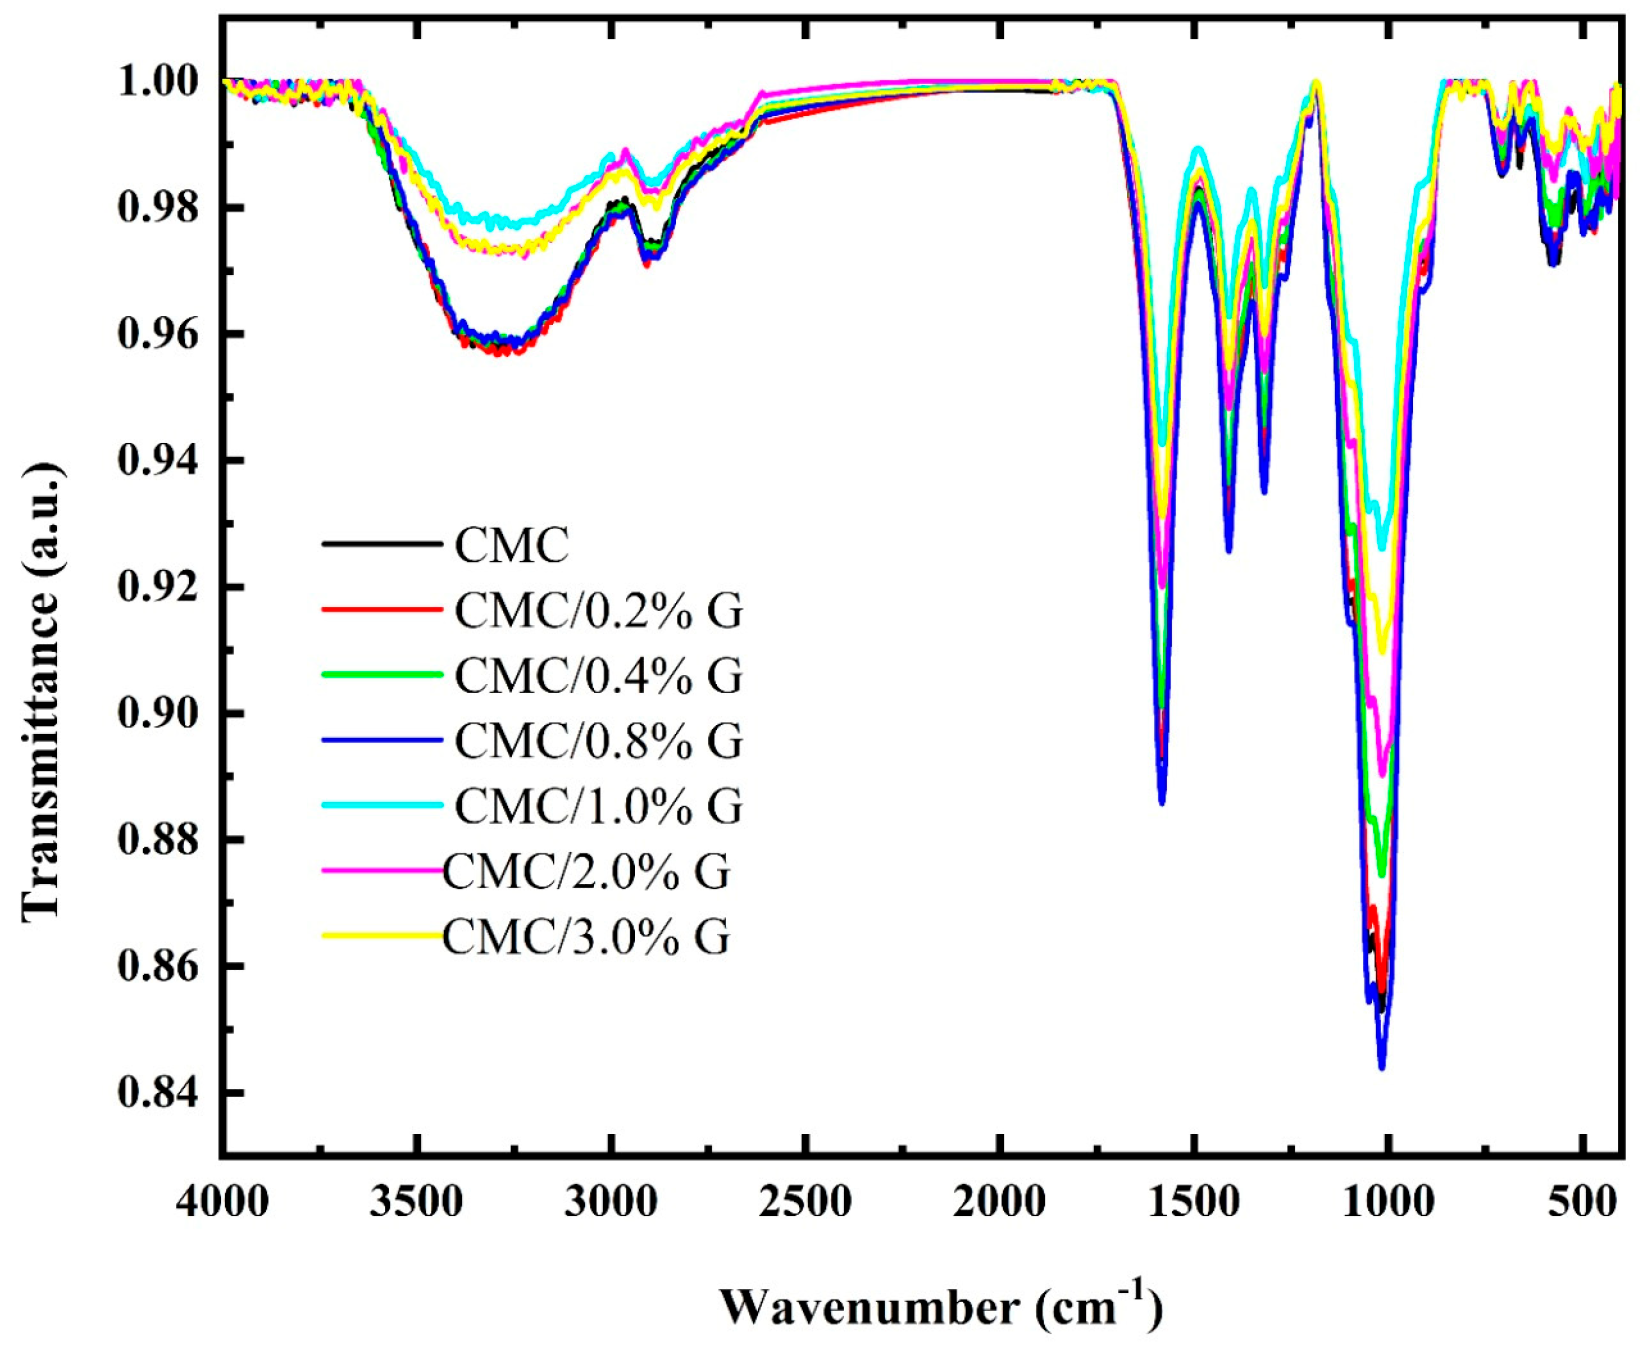
3.2. FT-IR Analysis
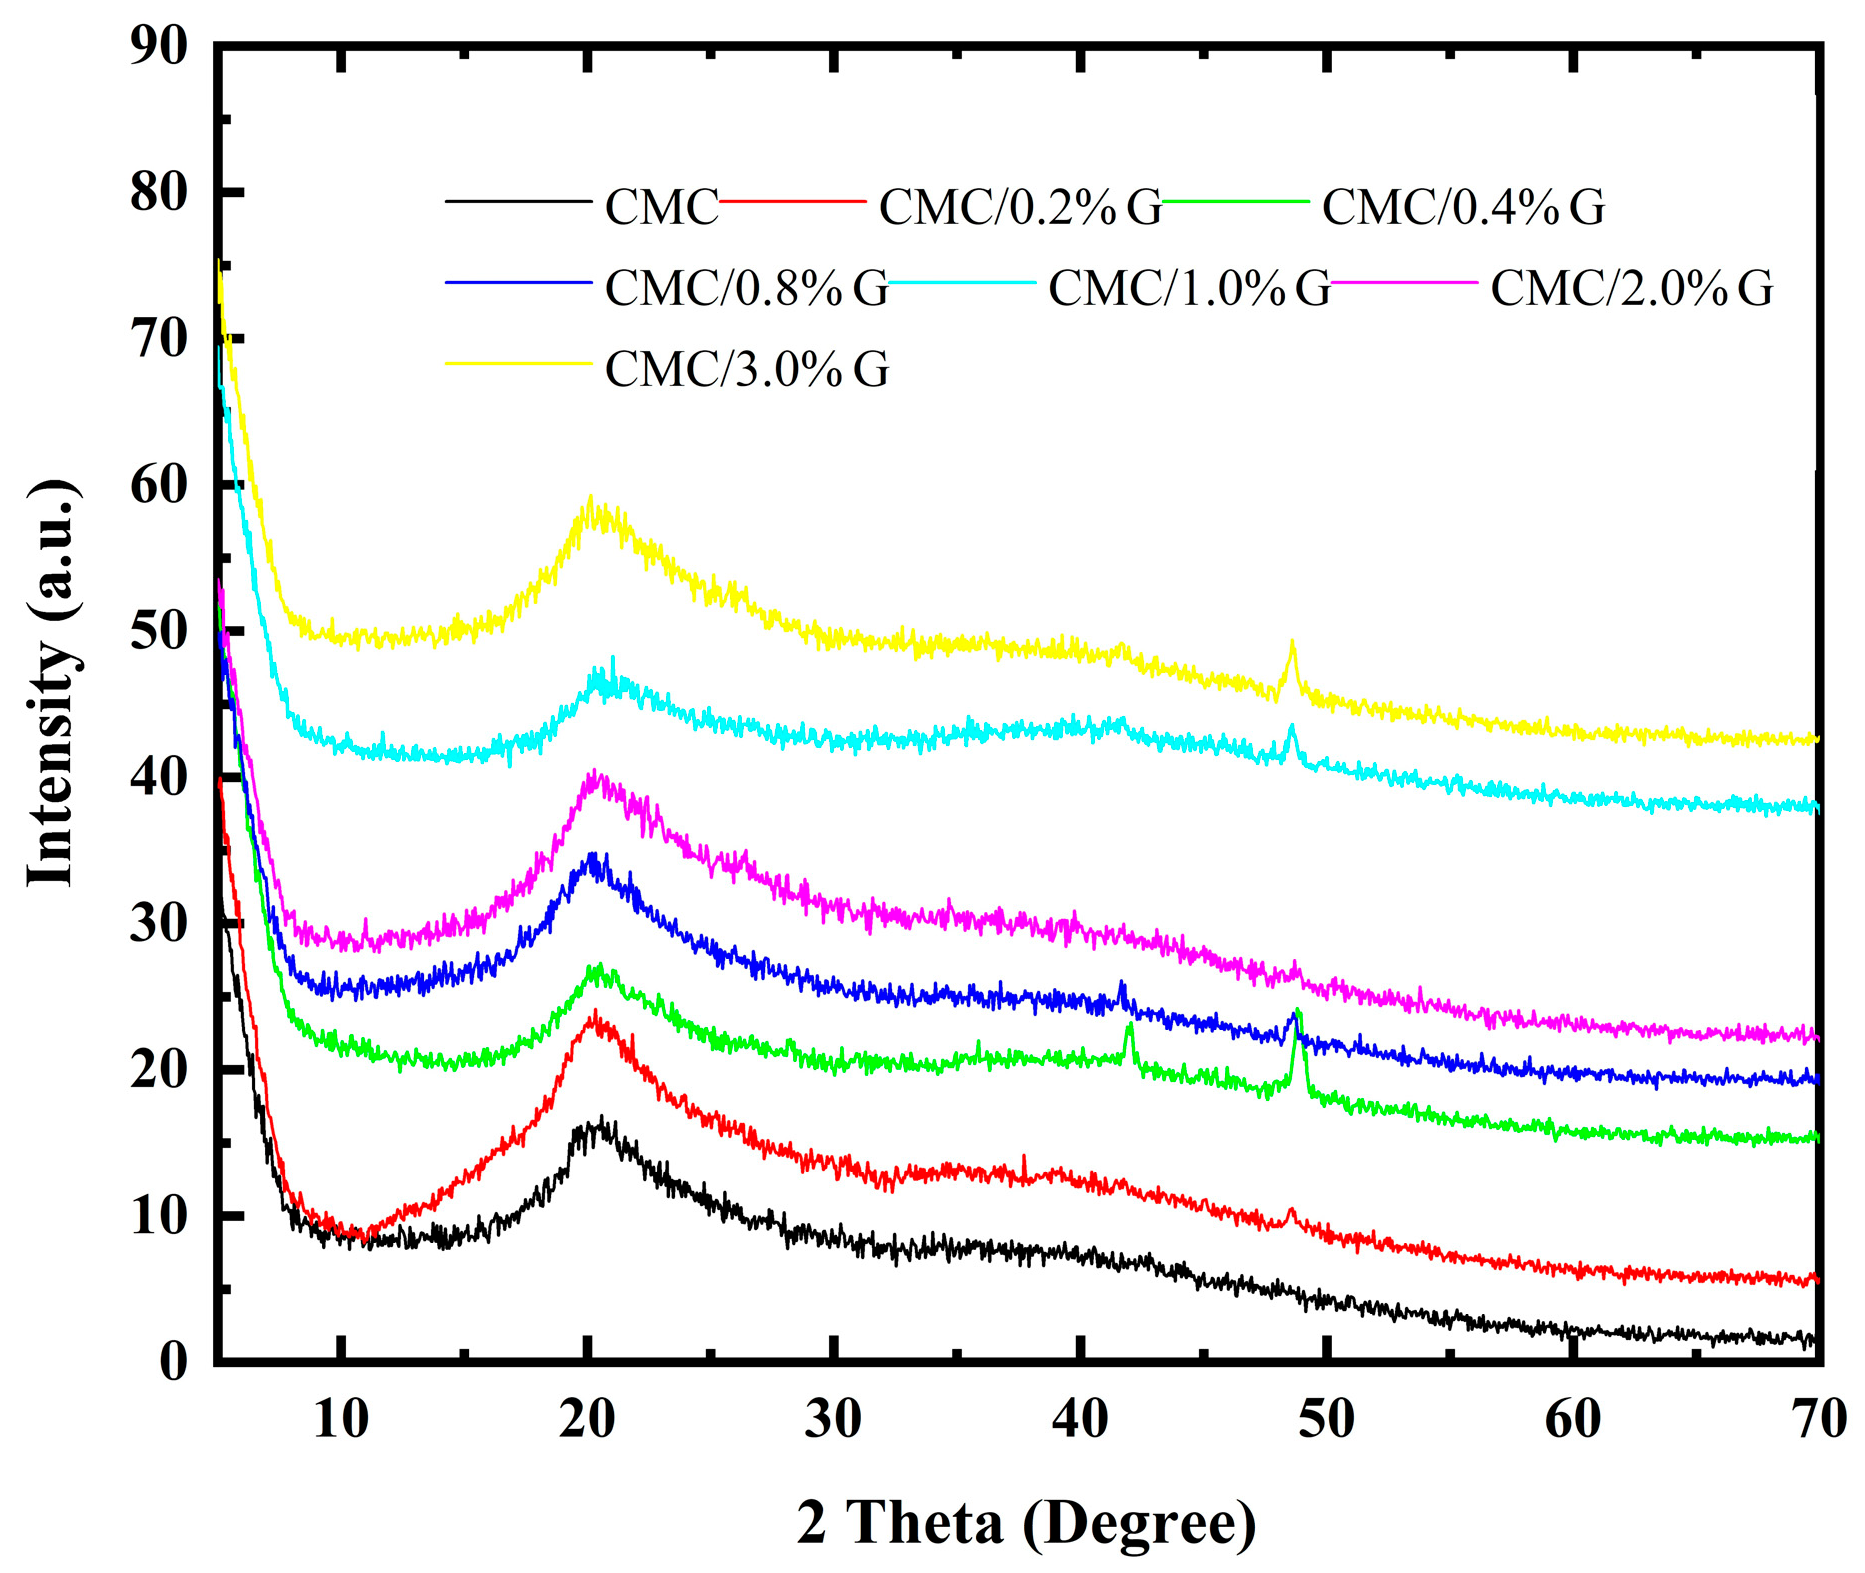
3.3. XRD Analysis
3.4. Optical Analysis
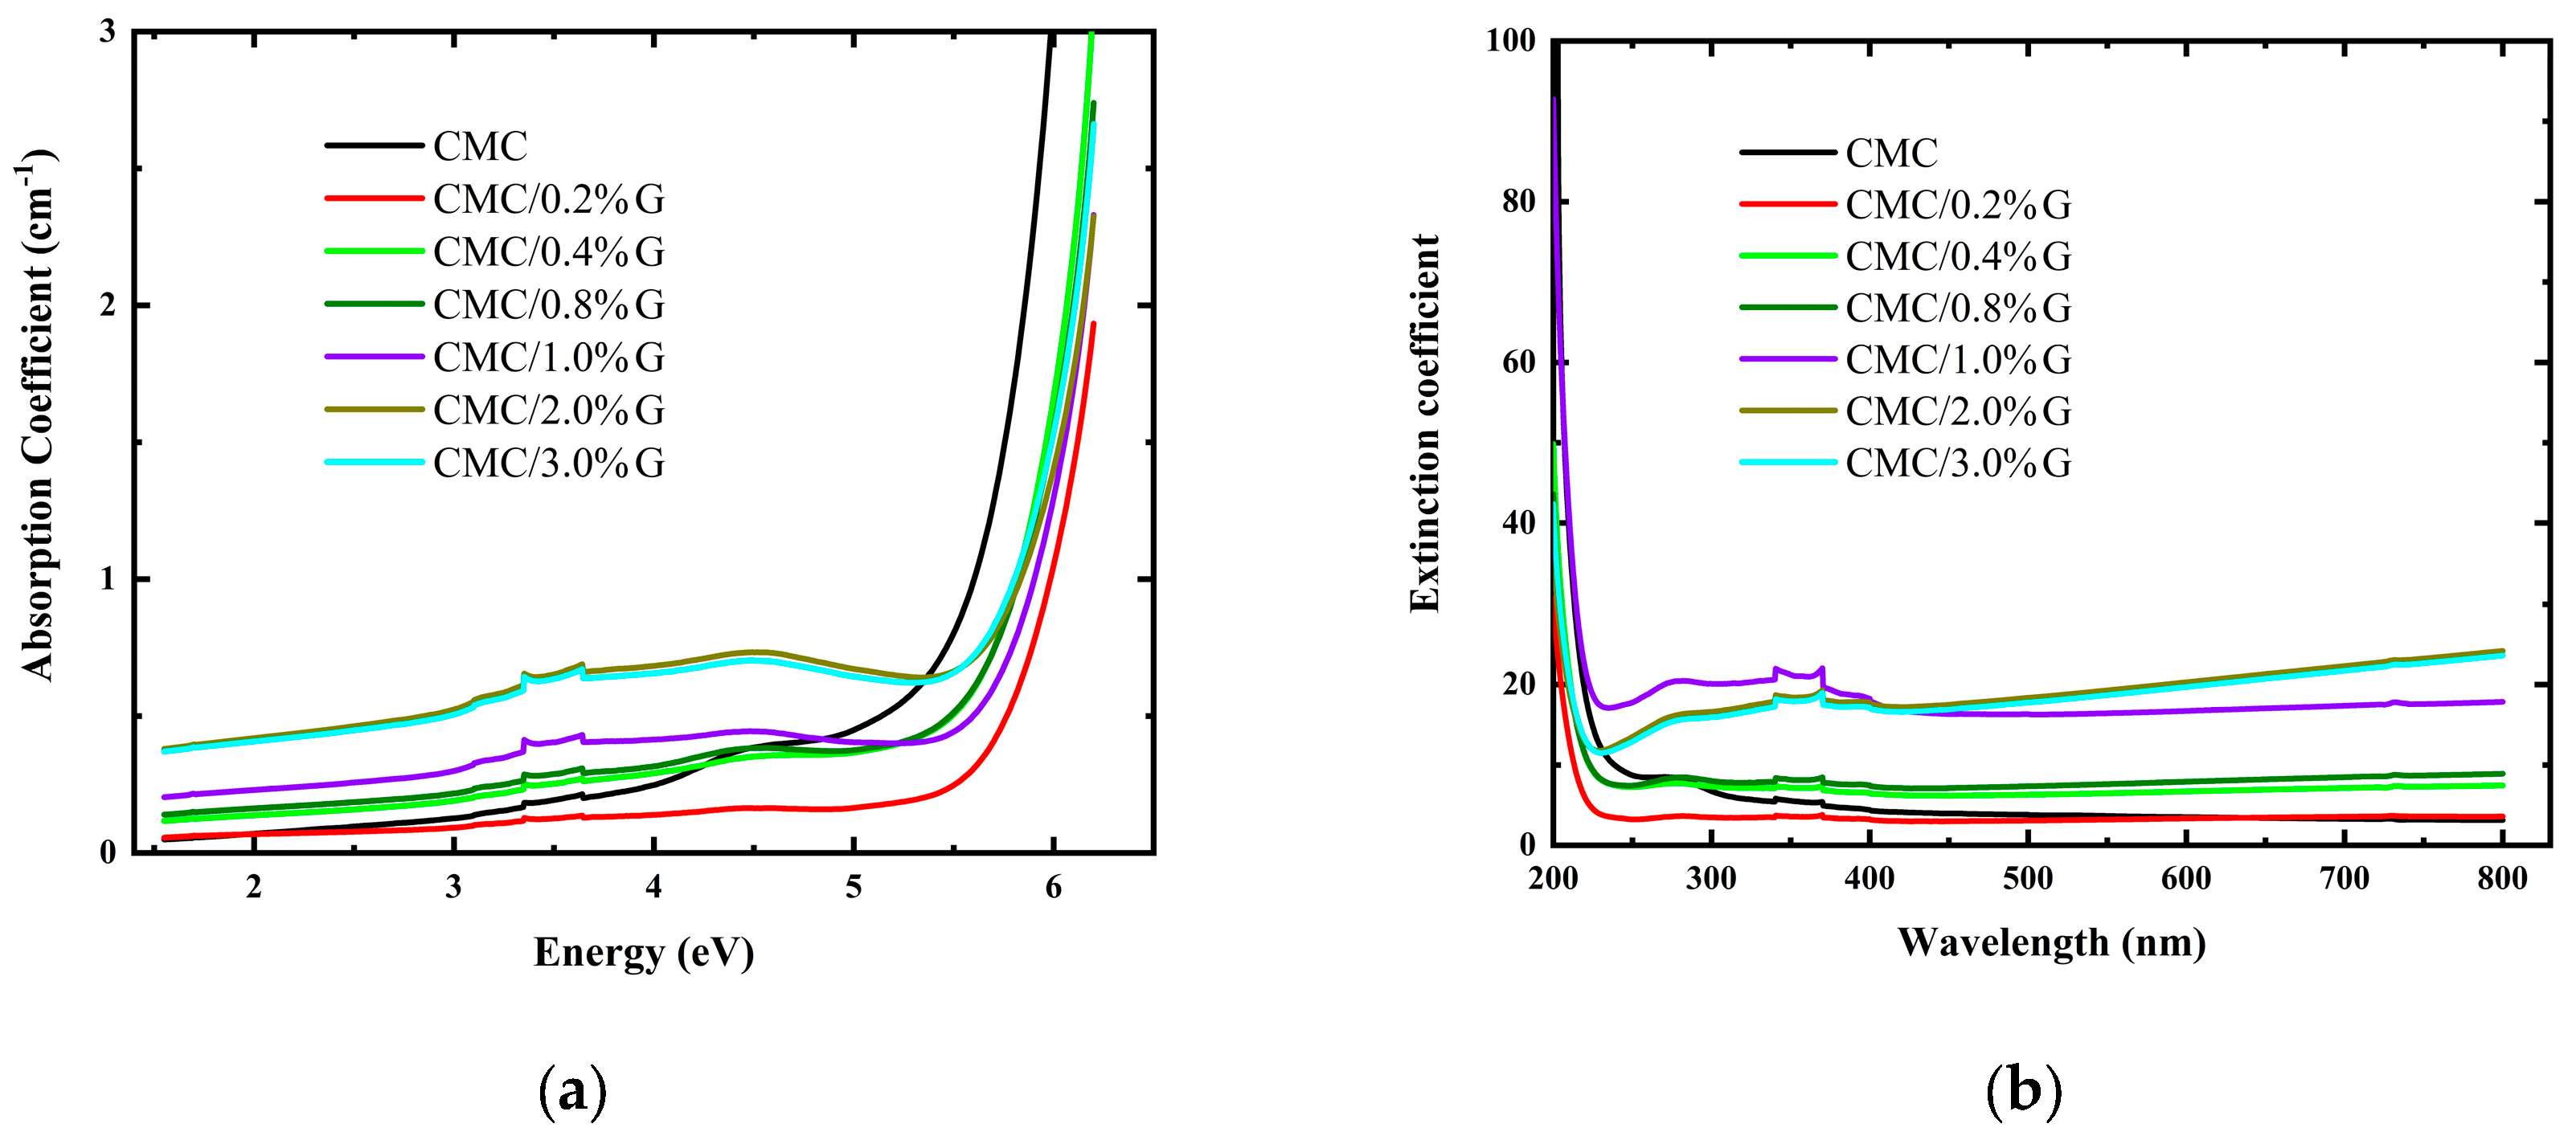
3.4.1. Optical Absorption
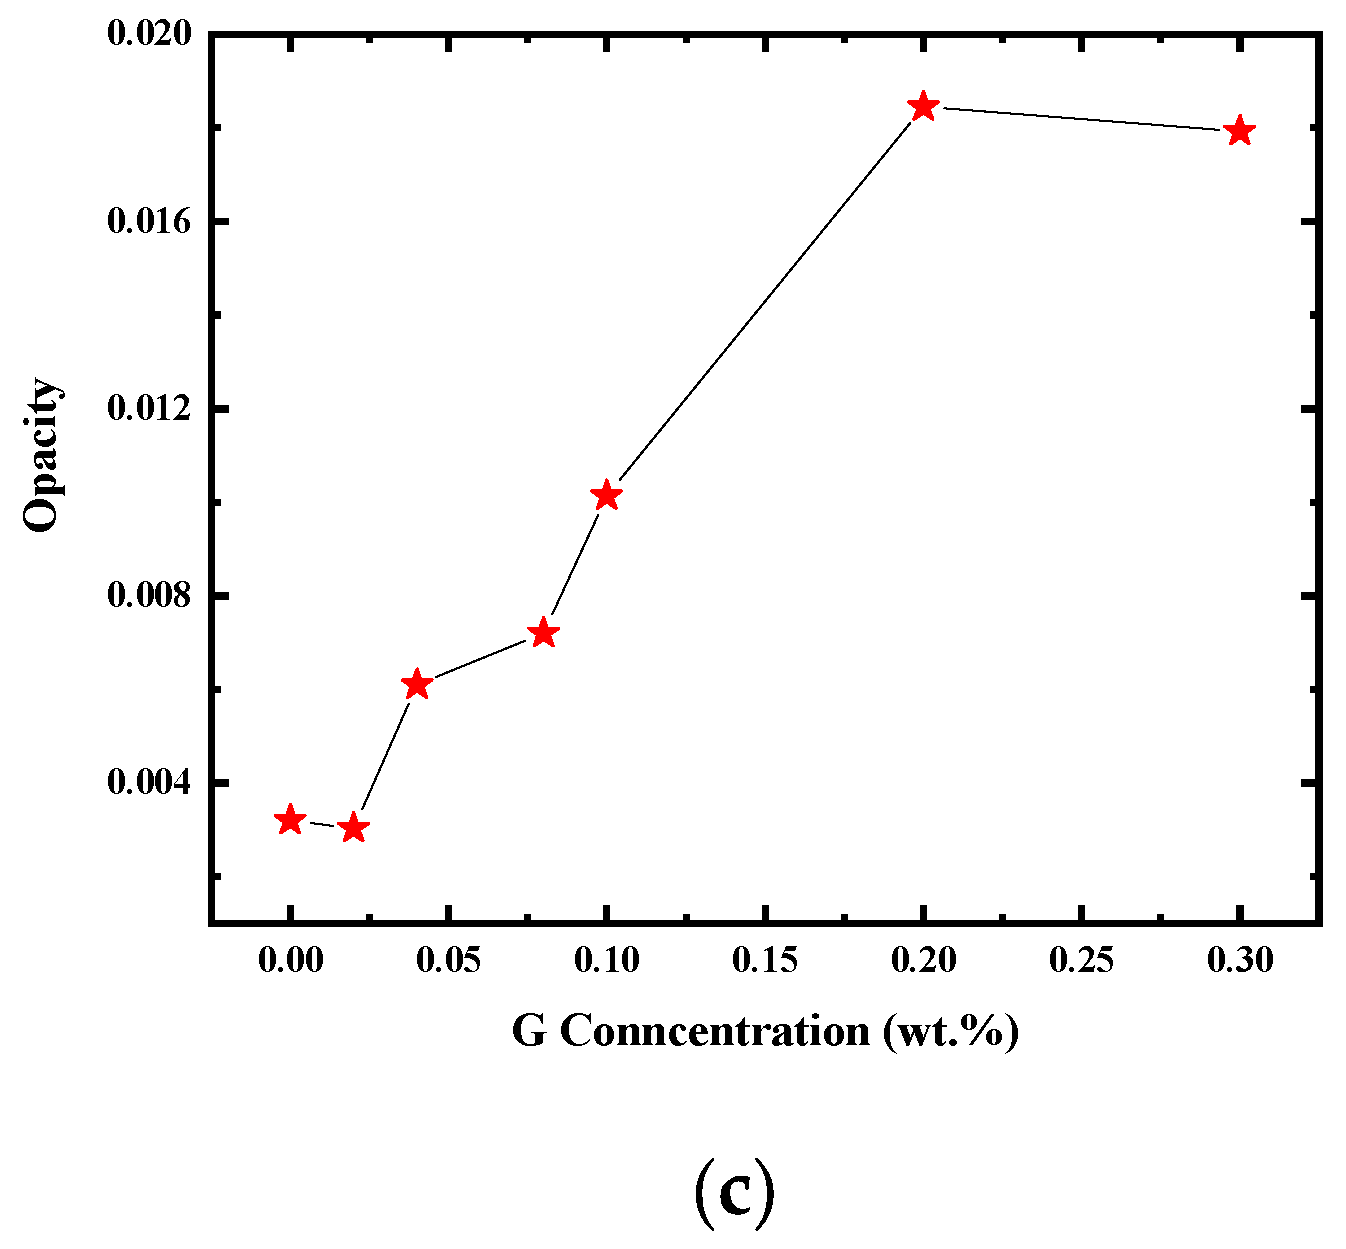
3.4.2. UV-Shielding Performance
3.4.3. UV–Vis Absorption Parameters
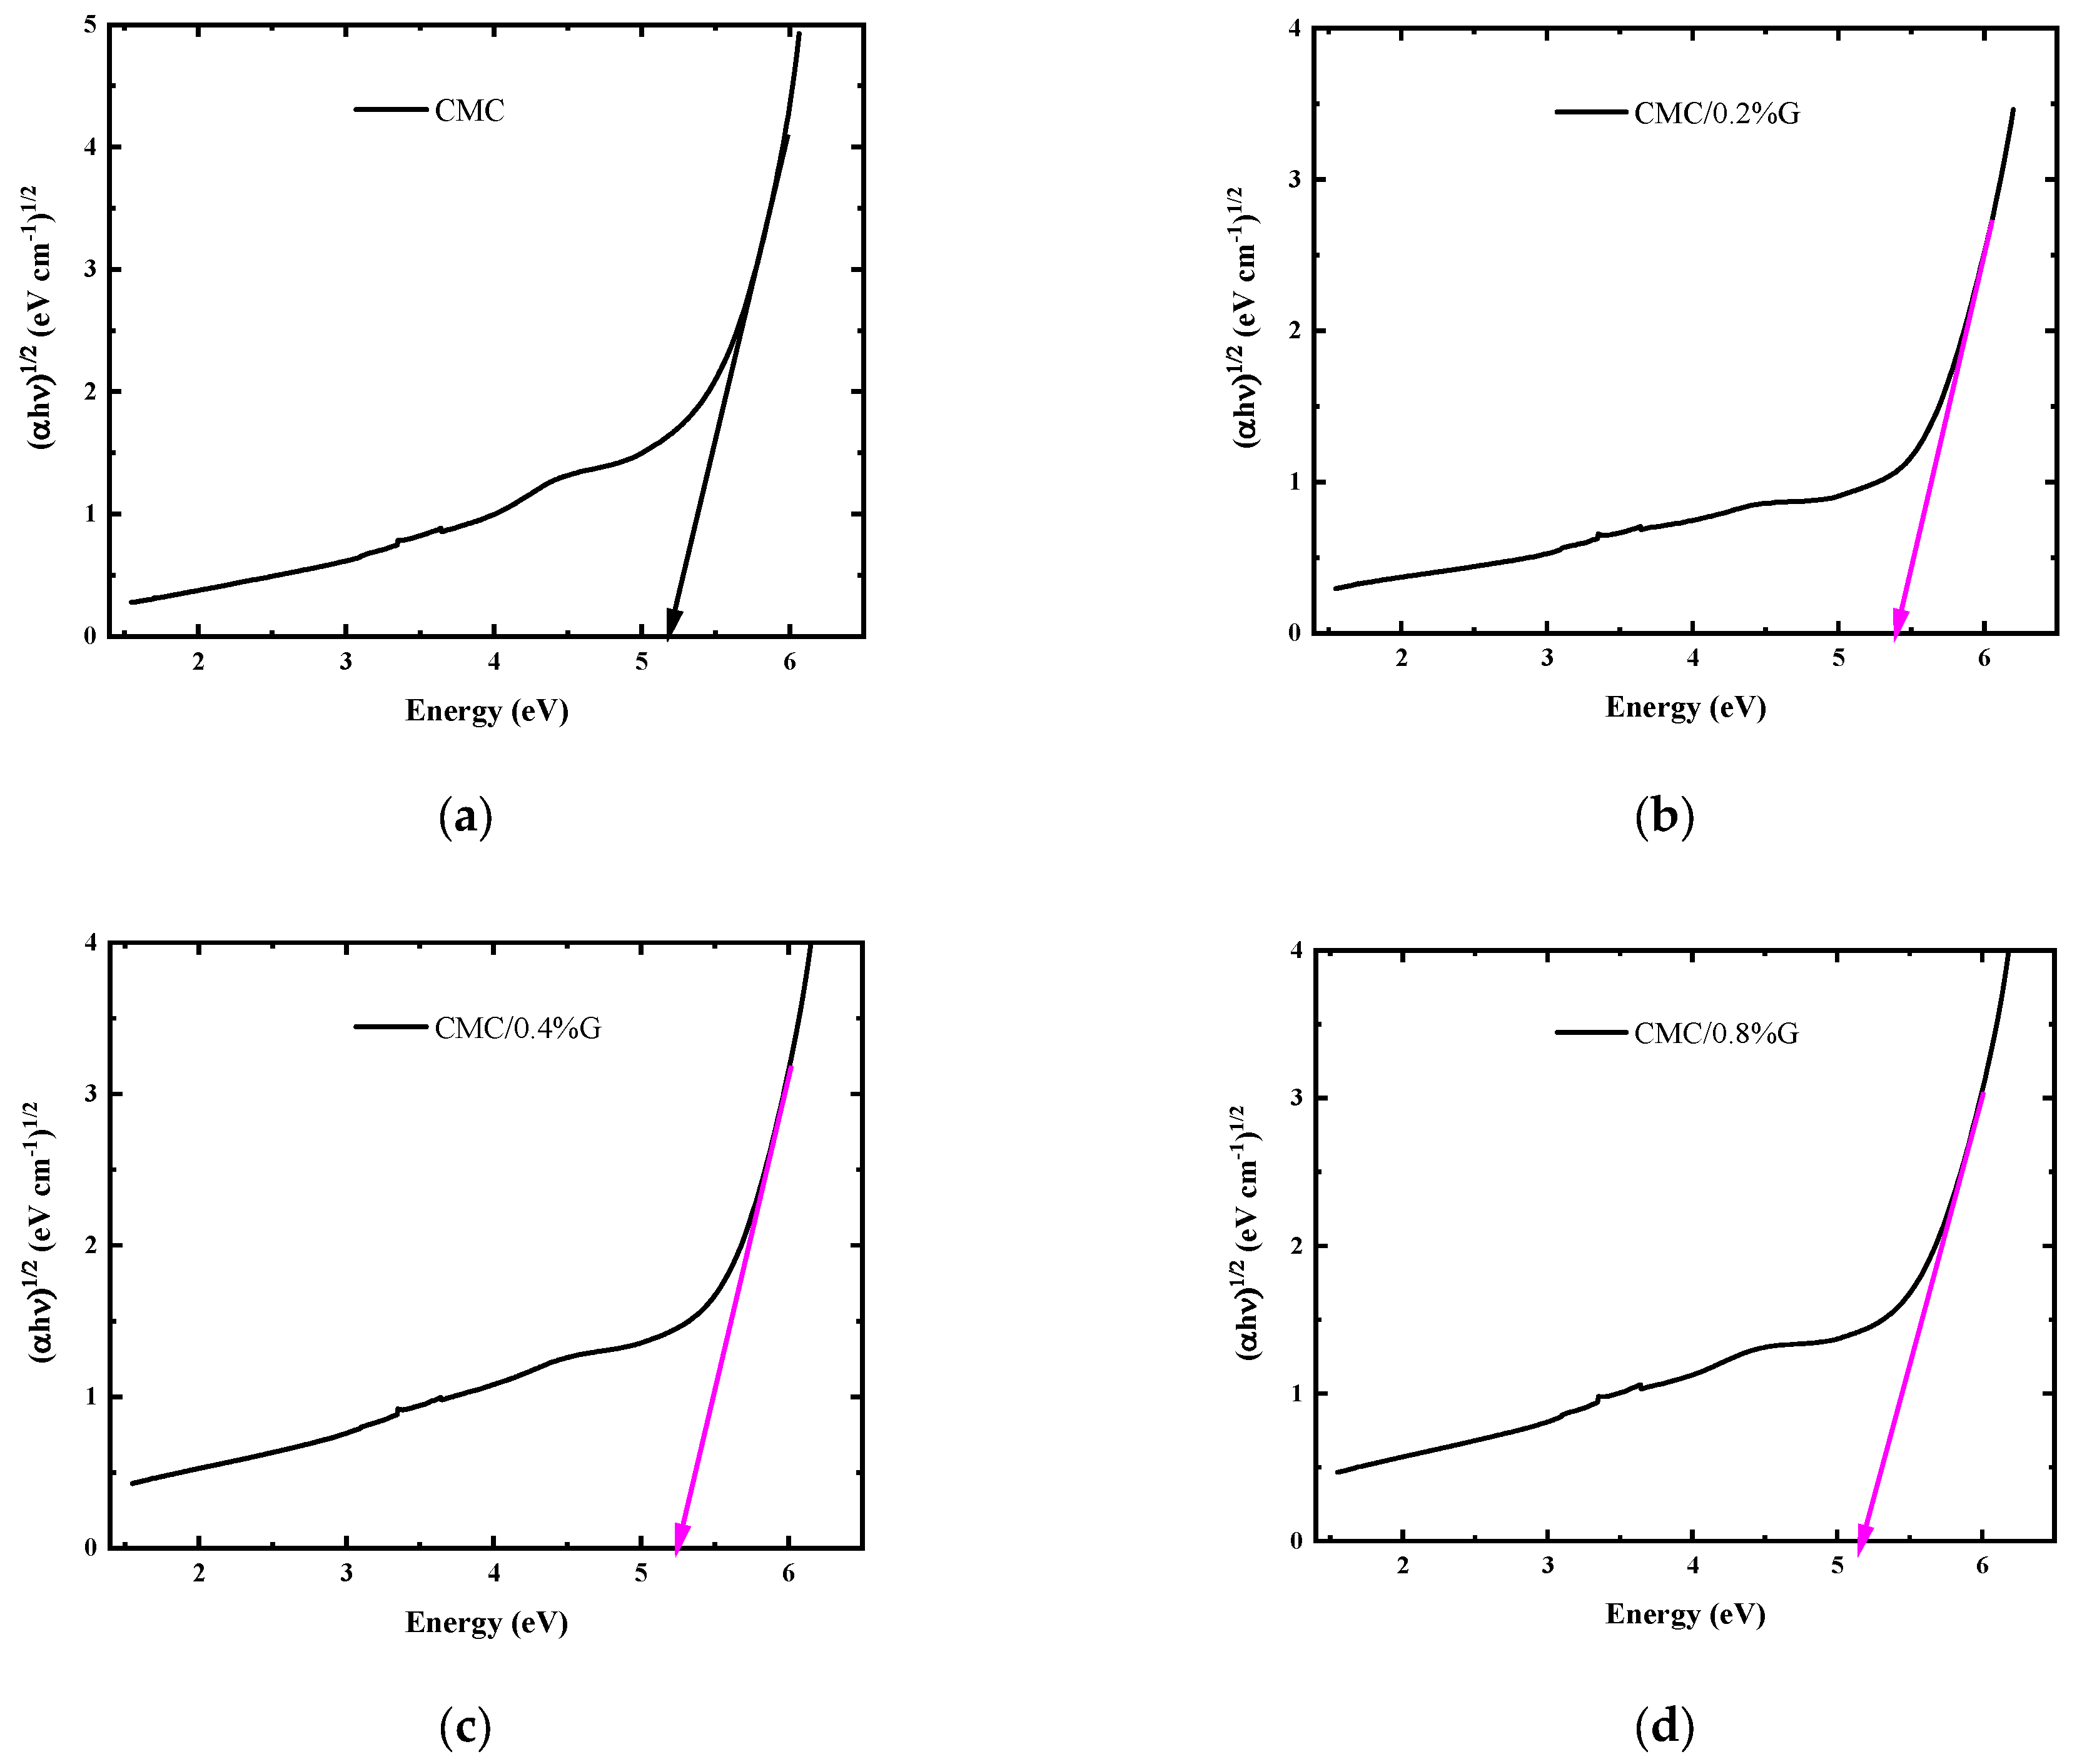
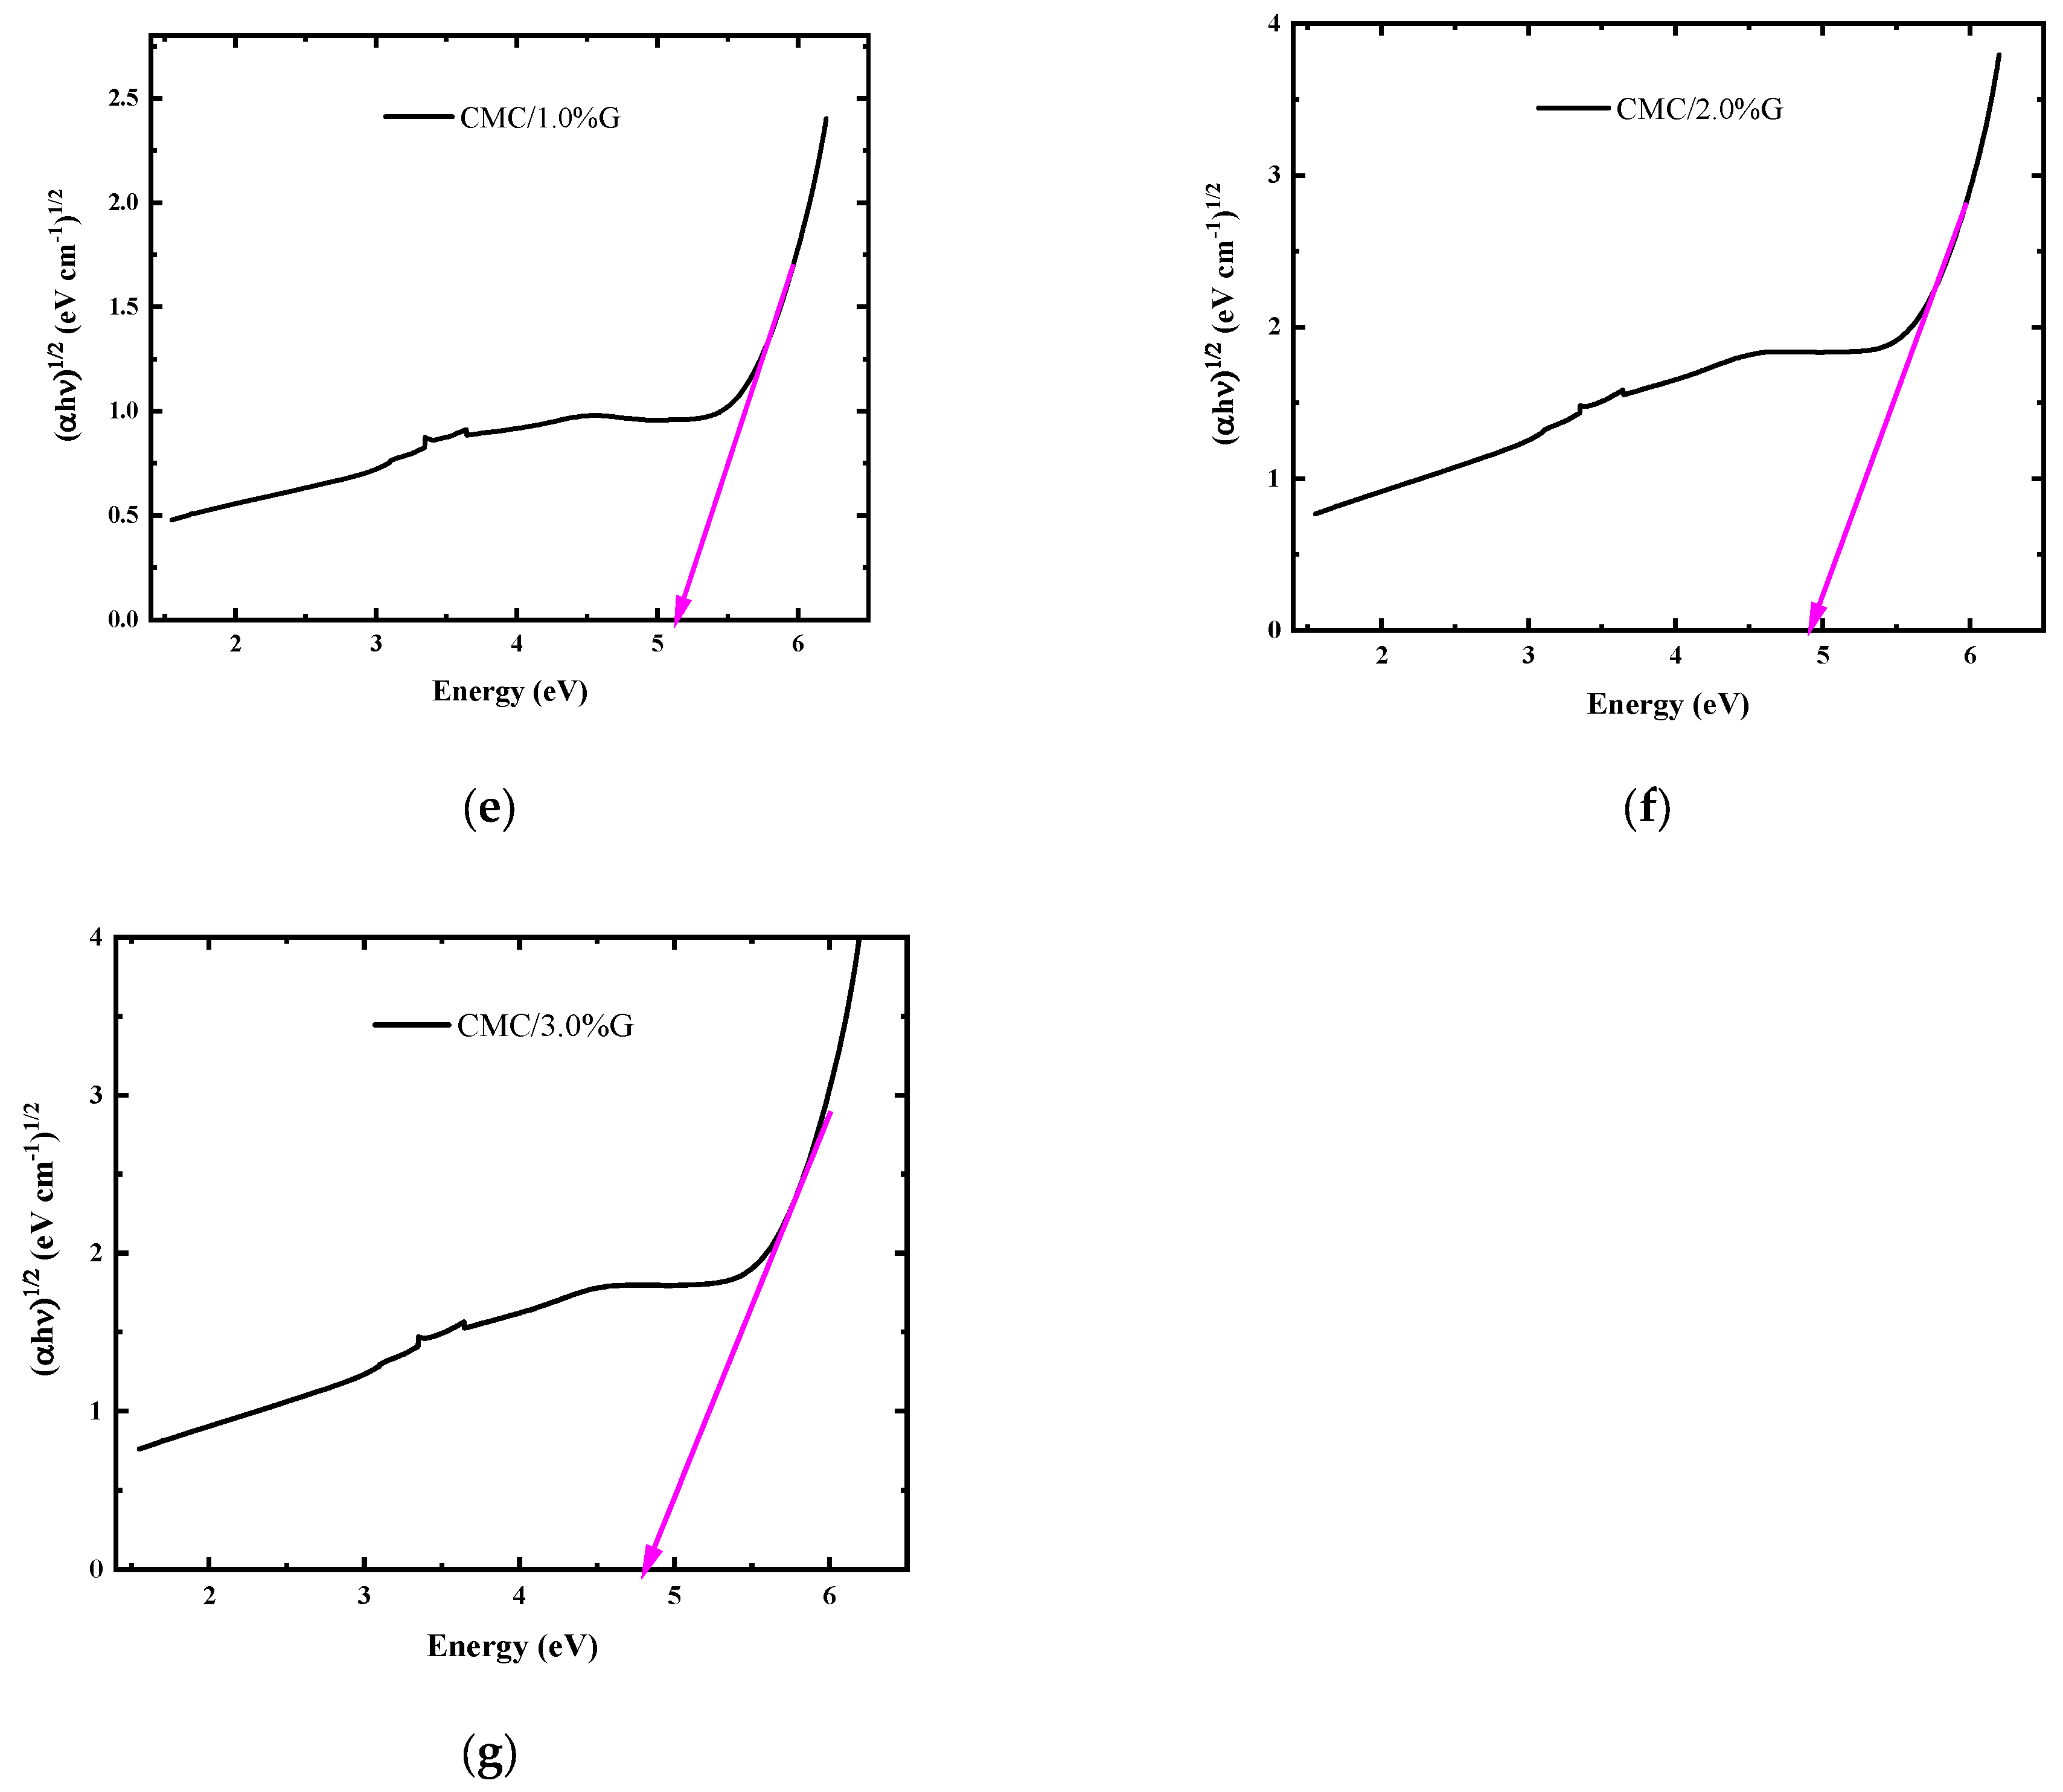
3.4.4. Optical Band Gap Energy Calculations
3.4.5. Determination of Urbach Energy
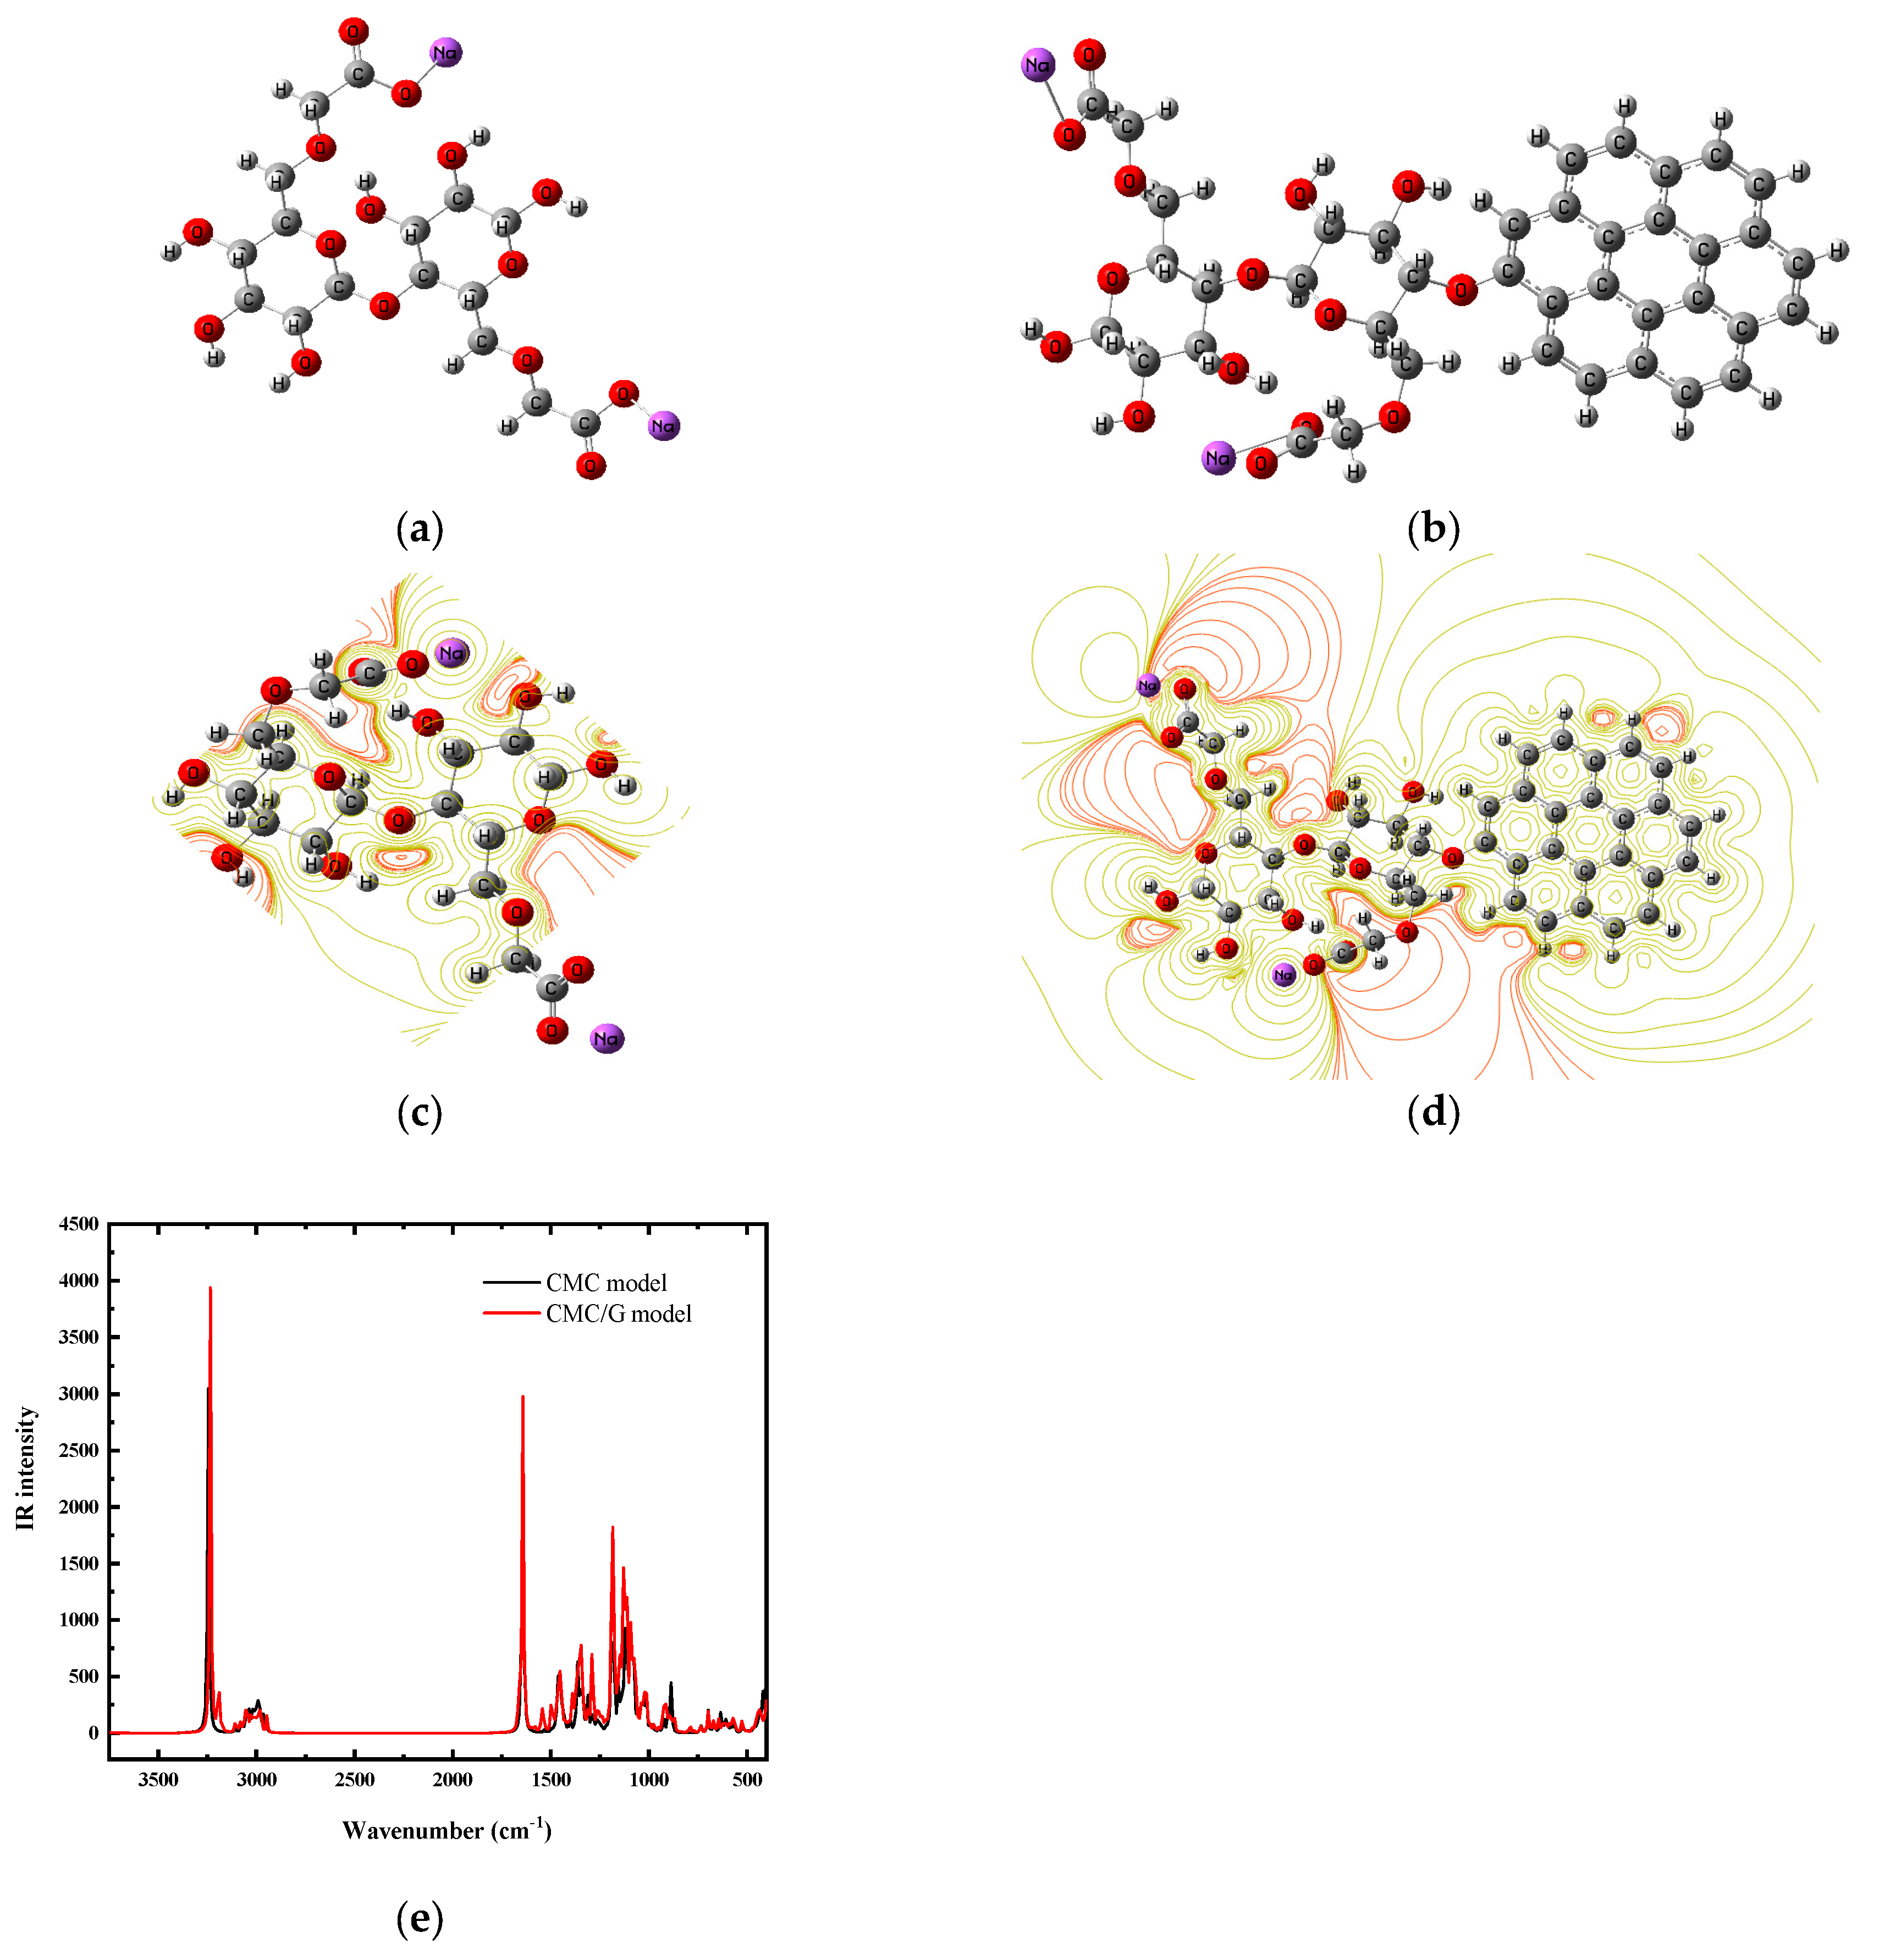
3.5. Interaction Mechanisms Between CMC and G
4. Conclusions
Author Contributions
Funding
Institutional Review Board Statement
Data Availability Statement
Conflicts of Interest
References
- Ivonkovic, A.; Zeljko, K.; Talic, S.; Lasic, M. Biodegradable packaging in the food industry. J. Food Saf. Food Qual. 2017, 68, 26–38. [Google Scholar] [CrossRef]
- Mostafa, Y.S.; Alrumman, S.A.; Alamri, S.A.; Otaif, K.A.; Mostafa, M.S.; Alfaify, A.M. Bioplastic (poly-3-hydroxybutyrate) production by the marine bacterium Pseudodonghicola xiamenensis through date syrup valorization and structural assessment of the biopolymer. Sci. Rep. 2020, 10, 8815. [Google Scholar] [CrossRef] [PubMed]
- Wang, R.; Feng, Y.; Li, D.; Li, K.; Yan, Y. Towards the sustainable production of biomass-derived materials with smart functionality: A tutorial review. Green Chem. 2024, 26, 9075–9103. [Google Scholar] [CrossRef]
- Zhang, W.; Ji, X.-X.; Ma, M.-G. Emerging MXene/cellulose composites: Design strategies and diverse applications. Chem. Eng. J. 2023, 458, 141402. [Google Scholar] [CrossRef]
- Pirsa, S.; Aghbolagh Sharifi, K. A review of the applications of bioproteins in the preparation of biodegradable films and polymers. J. Chem. Lett. 2020, 1, 47–58. [Google Scholar] [CrossRef]
- Wang, X.; Tarahomi, M.; Sheibani, R.; Xia, C.; Wang, W. Progresses in lignin, cellulose, starch, chitosan, chitin, alginate, and gum/carbon nanotube (nano) composites for environmental applications: A review. Int. J. Biol. Macromol. 2023, 241, 124472. [Google Scholar] [CrossRef] [PubMed]
- Lin, H.; Ma, M.; Chu, Q.; Xu, L.; Chen, S.; Shi, Y.; He, H.; Wang, X. Multifunctional nanofibrillated cellulose/ZnO@rGO composite films for thermal conductivity, electrical insulation, and antibacterial applications. Compos. Struct. 2023, 312, 116896. [Google Scholar] [CrossRef]
- da Rocha Santana, R.M.; Napoleão, D.C.; Rodriguez-Diaz, J.M.; de Mendonça, R.K.; Silva, M.G.; Garcia, R.R.P.; Vinhas, G.M.; Duarte, M.M.M.B. Original nanostructured bacterial cellulose/pyrite composite: Photocatalytic application in advanced oxidation processes. Chemosphere 2023, 319, 137953. [Google Scholar] [CrossRef]
- Ren, H.; Xu, Z.; Gao, M.; Xing, X.; Ling, Z.; Pan, L.; Tian, Y.; Zheng, Y.; Fan, W.; Yang, W. Preparation of microcrystalline cellulose from agricultural residues and their application as polylactic acid/microcrystalline cellulose composite films for the preservation of Lanzhou lily. Int. J. Biol. Macromol. 2023, 227, 827–838. [Google Scholar] [CrossRef] [PubMed]
- Cao, W.-T.; Chen, F.-F.; Zhu, Y.-J.; Zhang, Y.-G.; Jiang, Y.-Y.; Ma, M.-G.; Chen, F. Binary strengthening and toughening of MXene/cellulose nanofiber composite paper with nacre-inspired structure and superior electromagnetic interference shielding properties. ACS Nano 2018, 12, 4583–4593. [Google Scholar] [CrossRef]
- Son, Y.-R.; Park, S.-J. Green preparation and characterization of graphene oxide/carbon nanotubes-loaded carboxymethyl cellulose nanocomposites. Sci. Rep. 2018, 8, 17601. [Google Scholar] [CrossRef] [PubMed]
- El Achaby, M.; El Miri, N.; Snik, A.; Zahouily, M.; Abdelouahdi, K.; Fihri, A.; Barakat, A.; Solhy, A. Mechanically strong nanocomposite films based on highly filled carboxymethyl cellulose with graphene oxide. J. Appl. Polym. Sci. 2016, 133, 42356. [Google Scholar] [CrossRef]
- Shetty, S.K.; Ismayil; Shetty, G. Enhancement of electrical and optical properties of sodium bromide doped carboxymethyl cellulose biopolymer electrolyte films. J. Macromol. Sci. Part B 2020, 59, 235–247. [Google Scholar] [CrossRef]
- Mergen, Ö.B.; Arda, E.; Evingür, G.A. Electrical, optical and mechanical properties of chitosan biocomposites. J. Compos. Mater. 2020, 54, 1497–1510. [Google Scholar] [CrossRef]
- Nasrallah, D.A.; Ibrahim, M.A. Enhancement of physico-chemical, optical, dielectric and antimicrobial properties of polyvinyl alcohol/carboxymethyl cellulose blend films by addition of silver doped hydroxyapatite nanoparticles. J. Polym. Res. 2022, 29, 86. [Google Scholar] [CrossRef]
- Badry, R.; El-Nahass, M.M.; Nada, N.; Elhaes, H.; Ibrahim, M.A. Structural and UV-blocking properties of carboxymethyl cellulose sodium/CuO nanocomposite films. Sci. Rep. 2023, 13, 1123. [Google Scholar] [CrossRef]
- Badry, R.; El-Nahass, M.M.; Nada, N.; Elhaes, H.; Ibrahim, M.A. UV filters and high refractive index materials based on carboxymethyl cellulose sodium and CuO@ZnO core/shell nanoparticles. Sci. Rep. 2023, 13, 21159. [Google Scholar] [CrossRef]
- Badry, R.; Nada, N.; El-Nahass, M.M.; Elhaes, H.; Ibrahim, M.A. Enhanced sensing performance of carboxymethyl cellulose sodium to hydrogen sulphide gas and methylene blue dye by constructing CuO@ZnO core/shell heterostructure: A DFT/TD-DFT study. Opt. Quantum Electron. 2024, 56, 326. [Google Scholar] [CrossRef]
- Mergen, Ö.B.; Arda, E. Determination of electrical and optical behaviors of carboxymethyl cellulose/graphene nanocomposites. J. Mater. Sci. Mater. Electron. 2023, 34, 1719. [Google Scholar] [CrossRef]
- Badry, R.; Ibrahim, A.; Gamal, F.; Elhaes, H.; Yahia, I.S.; Zahran, H.Y.; Zahran, M.; Abdel-Wahab, M.S.; Zyoud, S.H.; Ibrahim, M.A. Design and implementation of low-cost gas sensor based on functionalized graphene quantum dot/Polyvinyl alcohol polymeric nanocomposites. Opt. Quantum Electron. 2023, 55, 247. [Google Scholar] [CrossRef]
- Niu, X.; Liu, Y.; Fang, G.; Huang, C.; Rojas, O.J.; Pan, H. Highly transparent, strong, and flexible films with modified cellulose nanofiber bearing UV shielding property. Biomacromolecules 2018, 19, 4565–4575. [Google Scholar] [CrossRef]
- Badry, R.; Hegazy, M.A.; Yahia, I.S.; Elhaes, H.; Zahran, H.Y.; Abdel-Salam, A.I.; Matar, H.A.; Ibrahim, M.A. Enhancing the optical properties of starch/ZnO nanocomposites using graphene oxide. Egypt. J. Chem. 2022, 65, 335–342. [Google Scholar] [CrossRef]
- Youssef, A.M.; El-Sayed, S.M.; El-Sayed, H.S.; Salama, H.H.; Dufresne, A. Enhancement of Egyptian soft white cheese shelf life using a novel chitosan/carboxymethyl cellulose/zinc oxide bionanocomposite film. Carbohydr. Polym. 2016, 151, 9–19. [Google Scholar] [CrossRef]
- Badry, R.; Nada, N.; El-Nahass, M.M.; Elhaes, H.; Ibrahim, M.A. The Detection of NH3, H2S and HBr gases by carboxymethyl cellulose sodium/ZnO nanocomposites: A theoretical study. Egypt. J. Chem. 2022, 65, 281–292. [Google Scholar] [CrossRef]
- Saeed, C.O.; Qader, A.A.; Aziz, S.B. Low cost novel PEO based nano-composite for semiconductor and He–Ne lasers beam attenuation: Structural and optical properties. Opt. Mater. 2022, 129, 112502. [Google Scholar] [CrossRef]
- Badry, R.; El-Khodary, S.; Elhaes, H.; Nada, N.; Ibrahim, M. On the molecular modeling analyses of sodium carboxymethyl cellulose treated with acetic acid. Lett. Appl. NanoBioScience 2019, 8, 553–557. [Google Scholar] [CrossRef]
- Yaradoddi, J.S.; Banapurmath, N.R.; Ganachari, S.V.; Soudagar, M.E.M.; Mubarak, N.M.; Hallad, S.; Hugar, S.; Fayaz, H. Biodegradable carboxymethyl cellulose based material for sustainable packaging application. Sci. Rep. 2020, 10, 21960. [Google Scholar] [CrossRef]
- Badry, R.; Ghanem, A.S.; Ahmed, H.; Fahmy, A.; Elhaes, H.G.A.A.; Refaat, A.; Ibrahim, M. Effect of Li, Na, K, Be, Mg and Ca on the electronic properties, geometrical parameters of carboxylic acids. Biointerface Res. Appl. Chem. 2018, 8, 3657–3660. [Google Scholar]
- Frisch, M.J.; Trucks, G.W.; Schlegel, J.; Scuseria, G.E.; Robb, M.A.; Cheeseman, J.R.; Schlegel, H.B.; Scalmani, G.; Barone, V.; Mennucci, B.; et al. Gaussian 09, Revision C.01; Gaussian, Inc.: Wallingford, CT, USA, 2010. [Google Scholar]
- Dennington, R.; Keith, T.; Millam, J. GaussView, Version 5; Semichem, Inc.: Shawnee Mission, KS, USA, 2009. [Google Scholar]
- Petersson, G.A.; Al-Laham, M.A. A complete basis set model chemistry. II. Open-shell systems and the total energies of the first-row atoms. J. Chem. Phys. 1991, 94, 6081–6090. [Google Scholar] [CrossRef]
- Becke, A.D. Density-functional thermochemistry. I. The effect of the exchange-only gradient correction. J. Chem. Phys. 1992, 96, 2155–2160. [Google Scholar] [CrossRef]
- Lee, C.; Yang, W.; Parr, R.G. Development of the Colle-Salvetti correlation-energy formula into a functional of the electron density. Phys. Rev. B 1988, 37, 785–789. [Google Scholar] [CrossRef] [PubMed]
- Hassan, A.U.; Sumrra, S.H.; Nazar, M.F.; Mughal, E.U.; Zafar, M.N.; Iqbal, M. New organosulfur metallic compounds as potent drugs: Synthesis, molecular modeling, spectral, antimicrobial, drug likeness and DFT analysis. Mol. Divers. 2022, 26, 51–72. [Google Scholar] [CrossRef]
- Sabarish, R.; Unnikrishnan, G. Polyvinyl alcohol/carboxymethyl cellulose/ZSM-5 zeolite biocomposite membranes for dye adsorption applications. Carbohydr. Polym. 2018, 199, 129–140. [Google Scholar] [CrossRef]
- Behrouz, S.J.; Khataee, A.; Safarpour, M.; Arefi-Oskoui, S.; Joo, S.W. Carboxymethyl cellulose/polyethersulfone thin-film composite membranes for low-pressure desalination. Sep. Purif. Technol. 2021, 269, 118720. [Google Scholar] [CrossRef]
- Chen, J.; Qin, T.; Cheng, Y.; Fang, C.; Zhang, X.; Chen, M. Surface charge regulation of imidazolium salts/starch/carboxymethyl cellulose ternary polymer blend films for controlling antimicrobial performance and hydrophobicity. Int. J. Biol. Macromol. 2023, 245, 125519. [Google Scholar] [CrossRef] [PubMed]
- Pavithra, A.; Rakkesh, R.A.; Durgalakshmi, D.; Balakumar, S. Room temperature detection of hydrogen gas using graphene based conductometric gas sensor. J. Nanosci. Nanotechnol. 2017, 17, 3449–3453. [Google Scholar] [CrossRef]
- Xu, J.-Z.; Liang, Y.-Y.; Zhong, G.-J.; Li, H.-L.; Chen, C.; Li, L.-B.; Li, Z.-M. Graphene Oxide Nanosheet Induced Intrachain Conformational Ordering in a Semicrystalline Polymer. J. Phys. Chem. Lett. 2012, 3, 530–535. [Google Scholar] [CrossRef] [PubMed]
- Aldosari, H. The Effect of Graphene Oxide Dispersion on Structure-Property Relationships in Graphene-Based Polymer Nanocomposites. J. Nano Res. 2020, 65, 97–121. [Google Scholar] [CrossRef]
- Sabry, N.M.; Badry, R.; Abdel-Gawad, F.K.; Elhaes, H.; Ibrahim, M.A. Electronic structure, global reactivity descriptors and nonlinear optical properties of glycine interacted with ZnO, MgO and CaO for bacterial detection. Sci. Rep. 2024, 14, 22801. [Google Scholar] [CrossRef]
- Al-Muntaser, A.A.; Pashameah, R.A.; Sharma, K.; Alzahrani, E.; Tarabiah, A.E. Reinforcement of structural, optical, electrical, and dielectric characteristics of CMC/PVA based on GNP/ZnO hybrid nanofiller: Nanocomposites materials for energy-storage applications. Int. J. Energy Res. 2022, 46, 23984–23995. [Google Scholar] [CrossRef]
- Mergen, Ö.B. Effect of MWCNT addition on the optical band gap of PVA/CS transient biocomposites. J. Compos. Mater. 2021, 55, 4347–4359. [Google Scholar] [CrossRef]
- Mengozzi, A.; Carullo, D.; Bot, F.; Farris, S.; Chiavaro, E. Functional properties of food packaging solutions alternative to conventional multilayer systems. J. Food Sci. Technol. 2024. [Google Scholar] [CrossRef]
- Li, X.; Li, J.; Shen, X.; Cao, M.; Wang, Y.; Zhang, W.; Xu, Y.; Ling, Z.; Chen, S.; Xu, F. Transparent cellulose/lignin composite films with adjustable haze and UV-blocking performance for light management. ACS Sustain. Chem. Eng. 2024, 12, 5427–5435. [Google Scholar] [CrossRef]
- Zhang, Y.; Wang, X.; Liu, Y.; Song, S.; Liu, D. Highly transparent bulk PMMA/ZnO nanocomposites with bright visible luminescence and efficient UV-shielding capability. J. Mater. Chem. 2012, 22, 11971–11977. [Google Scholar] [CrossRef]
- Wang, Y.; Su, J.; Li, T.; Ma, P.; Bai, H.; Xie, Y.; Chen, M.; Dong, W. A novel UV-shielding and transparent polymer film: When bioinspired dopamine–melanin hollow nanoparticles join polymers. ACS Appl. Mater. Interfaces 2017, 9, 36281–36289. [Google Scholar] [CrossRef] [PubMed]
- Makuła, P.; Pacia, M.; Macyk, W. How to correctly determine the band gap energy of modified semiconductor photocatalysts based on UV–Vis spectra. J. Phys. Chem. Lett. 2018, 9, 6814–6817. [Google Scholar] [CrossRef]
- Baishya, K.; Ray, J.S.; Dutta, P.; Das, P.P.; Das, S.K. Graphene-mediated band gap engineering of WO3 nanoparticle and a relook at Tauc equation for band gap evaluation. Appl. Phys. A 2018, 124, 704. [Google Scholar] [CrossRef]
- Pawlak, J.; Al-Ani, S.K.J. Inverse logarithmic derivative method for determining the energy gap and the type of electron transitions as an alternative to the Tauc method. Opt. Mater. 2019, 88, 667–673. [Google Scholar] [CrossRef]
- Rammah, Y.S.; Ali, A.A.; El-Mallawany, R.; Abdelghany, A.M. Optical properties of bismuth borotellurite glasses doped with NdCl3. J. Mol. Struct. 2019, 1175, 504–511. [Google Scholar] [CrossRef]
- Haryński, Ł.; Olejnik, A.; Grochowska, K.; Siuzdak, K. A facile method for Tauc exponent and corresponding electronic transitions determination in semiconductors directly from UV–Vis spectroscopy data. Opt. Mater. 2022, 127, 112205. [Google Scholar] [CrossRef]
- Souri, D.; Shomalian, K. Band gap determination by absorption spectrum fitting method (ASF) and structural properties of different compositions of (60−x) V2O5–40TeO2–xSb2O3 glasses. J. Non-Cryst. Solids 2009, 355, 1597–1601. [Google Scholar] [CrossRef]
- Aziz, S.B. Modifying poly (vinyl alcohol)(PVA) from insulator to small-bandgap polymer: A novel approach for organic solar cells and optoelectronic devices. J. Electron. Mater. 2016, 45, 736–745. [Google Scholar] [CrossRef]
- Urbach, F. The long-wavelength edge of photographic sensitivity and of the electronic absorption of solids. Phys. Rev. B 1953, 92, 1324. [Google Scholar] [CrossRef]
- Abutalib, M.M.; Rajeh, A. Boosting optical and electrical characteristics of polyvinyl alcohol/carboxymethyl cellulose nanocomposites by GNPs/MWCNTs fillers as an application in energy storage devices. Int. J. Energy Res. 2022, 46, 6216–6224. [Google Scholar] [CrossRef]
- Politzer, P.; Laurence, P.R.; Jayasuriya, K. Molecular electrostatic potentials: An effective tool for the elucidation of biochemical phenomena. Environ. Health Perspect. 1985, 61, 191–202. [Google Scholar] [CrossRef]


| Wavenumber/Sample | Band Assignment | ||||||
|---|---|---|---|---|---|---|---|
| CMC | CMC/0.2 wt.% G | CMC/0.4 wt.% G | CMC/0.8 wt.% G | CMC/1.0 wt.% G | CMC/2.0 wt.% G | CMC/3.0 wt.% G | |
| 3292 | 3294 | 3294 | 3232 | 3282 | 3223 | 3231 | OH stretching |
| 2906 | 2908 | 2908 | 2900 | 2915 | 2871 | 2883 | CH2 stretching |
| 2850 | 2851 | 2851 | 2855 | 2856 | 2856 | 2856 | CH2 asymmetric stretching |
| 1584 | 1583 | 1583 | 1582 | 1582 | 1582 | 1581 | Carboxylate group (COO–) asymmetric stretching |
| 1411 | 1410 | 1410 | 1410 | 1409 | 1410 | 1410 | CH2 scissoring |
| 1319 | 1320 | 1320 | 1320 | 1320 | 1319 | 1319 | OH bending |
| 1049 | 1050 | 1050 | 1050 | 1051 | 1048 | 1049 | C–O–C bending vibration |
| 1017 | 1017 | 1017 | 1017 | 1017 | 1015 | 1015 | C–O bond of the CH2OH group |
| Sample | Crystallite Size (nm) |
|---|---|
| CMC | 80.71 |
| CMC/0.2 wt.% G | 28.48 |
| CMC/0.4 wt.% G | 34.76 |
| CMC/0.8 wt.% G | 41.71 |
| CMC/1.0 wt.% G | 42.93 |
| CMC/2.0 wt.% G | 41.53 |
| CMC/3.0 wt.% G | 40.92 |
| Sample | Transmittance (%) | Reference | ||
|---|---|---|---|---|
| UV-C | UV-B | UV-A | ||
| CMC | 60 | 79 | 87 | Current study |
| CMC/0.2 wt.% G | 83 | 86 | 90 | // |
| CMC/0.4 wt.% G | 67 | 73 | 81 | // |
| CMC/0.8 wt.% G | 67 | 71 | 79 | // |
| CMC/1.0 wt.% G | 66 | 65 | 72 | // |
| CMC/2.0 wt.% G | 52 | 49 | 57 | // |
| CMC/3.0 wt.% G | 53 | 51 | 58 | // |
| CMC/8% CuO | 0 | 1 | 1 | [16] |
| CMC/4% CuO@ZnO core/shell | 0 | 0 | 0 | [17] |
| CMC/lignin | - | 2 | 11 | [45] |
| PMMA/0.05% ZnO quantum dots | 0 | 0 | 50 | [46] |
| PVA/5% dopamine– melanin | 0 | 0 | 30 | [47] |
| Sample | EU (eV) | |
|---|---|---|
| CMC | 5.27 | 0.34 |
| CMC/0.2 wt.% G | 5.30 | 0.45 |
| CMC/0.4 wt.% G | 5.24 | 0.55 |
| CMC/0.8 wt.% G | 5.16 | 0.57 |
| CMC/1.0 wt.% G | 5.13 | 0.68 |
| CMC/2.0 wt.% G | 4.90 | 0.81 |
| CMC/3.0 wt.% G | 4.81 | 0.94 |
| Sample | TDM (Debye) | ∆E (eV) |
|---|---|---|
| CMC | 12.15 | 4.22 |
| CMC/G | 8.05 | 3.68 |
| Wavenumber (cm−1) | Band Assignment | |
|---|---|---|
| CMC Model | CMC/G Model | |
| 3248 | 3239 | OH stretching |
| 2992 | 2985 | CH2 stretching |
| 2963 | 2945 | CH2 asymmetric stretching |
| 1641 | 1632 | Carboxylate group (COO–) asymmetric stretching |
| 1452 | 1455 | CH2 scissoring |
| 1344 | 1343 | OH bending |
| 1093 | 1096 | C–O–C bending vibration |
| 1013 | 1017 | C–O bond of the CH2OH group |
Disclaimer/Publisher’s Note: The statements, opinions and data contained in all publications are solely those of the individual author(s) and contributor(s) and not of MDPI and/or the editor(s). MDPI and/or the editor(s) disclaim responsibility for any injury to people or property resulting from any ideas, methods, instructions or products referred to in the content. |
© 2025 by the authors. Licensee MDPI, Basel, Switzerland. This article is an open access article distributed under the terms and conditions of the Creative Commons Attribution (CC BY) license (https://creativecommons.org/licenses/by/4.0/).
Share and Cite
Aldaleeli, N.Y.; Madani, M.; Al-Gahtany, S.A.; Elhaes, H.; Badry, R.; Ibrahim, M.A. Evaluation of Different Concentrations of Graphene on the Structural and Optical Properties of Carboxymethyl Cellulose Sodium. Polymers 2025, 17, 391. https://doi.org/10.3390/polym17030391
Aldaleeli NY, Madani M, Al-Gahtany SA, Elhaes H, Badry R, Ibrahim MA. Evaluation of Different Concentrations of Graphene on the Structural and Optical Properties of Carboxymethyl Cellulose Sodium. Polymers. 2025; 17(3):391. https://doi.org/10.3390/polym17030391
Chicago/Turabian StyleAldaleeli, Nadiah Y., Mohamed Madani, Samera Ali Al-Gahtany, Hanan Elhaes, Rania Badry, and Medhat A. Ibrahim. 2025. "Evaluation of Different Concentrations of Graphene on the Structural and Optical Properties of Carboxymethyl Cellulose Sodium" Polymers 17, no. 3: 391. https://doi.org/10.3390/polym17030391
APA StyleAldaleeli, N. Y., Madani, M., Al-Gahtany, S. A., Elhaes, H., Badry, R., & Ibrahim, M. A. (2025). Evaluation of Different Concentrations of Graphene on the Structural and Optical Properties of Carboxymethyl Cellulose Sodium. Polymers, 17(3), 391. https://doi.org/10.3390/polym17030391