1. Introduction
Polymers are a class of soft materials [
1,
2] widely used to fabricate miniaturized surface relief structures and nanoscale features through both top-down and bottom-up approaches [
3,
4,
5,
6,
7]. Their applications span various fields of materials science, including medicine, electronics, energy, and more. The emergence of additive manufacturing techniques for polymers has further diversified polymeric structures by enabling the construction of three-dimensional (3D) objects from digital models via layer-by-layer deposition, sintering, or curing. This advancement has significantly expanded the applicability of polymers to additional industrial sectors such as prototyping, tooling, and safety applications.
One of the most fascinating nature-inspired macroscopic configurations capable of efficiently absorbing mechanical energy is the honeycomb structure [
8,
9,
10]. This key capability is primarily attributed to the structure’s periodic cellular design, which provides a superior strength-to-weight ratio, controlled deformation, and effective load distribution under impact [
11]. The honeycomb structure features a repeating pattern of hexagonal cells, allowing for progressive and stable deformation during compression, making it an optimal choice for applications where energy dissipation is critical [
12]. Moreover, mechanical energy resulting from compression can be absorbed through various mechanisms (e.g., plastic or elastic deformation, buckling). The crushing behavior of honeycomb structure can be divided into three stages: elastic deformation, progressive collapse, and densification [
13]. This complex deformation mechanism ensures progressive absorption of high energy [
14]. Consequently, the mechanical properties of honeycomb structures are influenced by several factors, including the type of material used and the manufacturing method [
15,
16].
For example, while metallic structures achieve optimal mechanical energy absorption through complete plastic deformation, composite materials [
17] and polymer-based structures absorb energy by progressively compressing the mechanical energy absorption structure (MEAS) [
17,
18,
19]. Both absorption methods typically result in the complete destruction of the structure, allowing only limited reusability of the MEAS. Nevertheless, qualitative studies have been conducted on single-use mechanical energy absorption structures inspired by nature, including reproductions of wood structures and turtle shell re-entrant arc-shaped structures [
20]. Although turtle shells exhibit dynamic response curves with better crushing load uniformity than conventional re-entrant honeycombs, wood structures inspired by balsa [
21], bamboo [
22], or cork [
23] generally demonstrate superior energy absorption capabilities due to their fundamentally different internal architectures based on 2D honeycomb configurations. Specifically, the balsa wood structure typically consists of second-order, wood-inspired hierarchical honeycombs, where the solid side of a conventional honeycomb is replaced by a wall composed of smaller hexagons that absorb mechanical energy in the in-plane direction [
21]. In contrast, the bamboo configuration features bio-inspired hierarchical circular thin-walled honeycomb structures designed to efficiently absorb energy under out-of-plane crushing loads [
22]. In comparison, cork structures exhibit a chambered architecture that closely resembles the so-called 3D triply periodic minimal surface structures (TPMS) which are defined as highly porous geometries that repeat periodically in three dimensions while maintaining a minimal surface area for a given volume. Cork structures absorb impact isotropically, meaning they absorb approximately the same amount of energy regardless of the direction of the force (whether in-plane or out-of-plane).
Other structures designed to absorb mechanical energy have been reported in the literature, including those that imitate Miura origami-type folded shapes [
24], “kagome lattice” structures inspired by traditional Japanese woven patterns [
25], and flexible fish scale-like configurations [
26]. While each of these materials offers distinct advantages, they all share the drawback of limited or no reusability. Miura origami-type folded shapes are efficient mechanical energy absorbers due to their ability to collapse in a controlled manner, absorbing energy through plastic deformation. In contrast, “kagome lattice” structures exhibit superior energy dissipation properties because of their truss arrangement, which enables efficient load distribution, progressive buckling, and enhanced resistance to shear and impact forces. Their combination of axial stretching and bending mechanisms allows for gradual energy absorption, reducing stress concentrations and preventing sudden structural failure [
25]. Fish scale-like structures provide good impact resistance while maintaining flexibility, a characteristic attributed to their overlapping hierarchical arrangement [
26].
Furthermore, it is worth mentioning that all the aforementioned structures are considered effective mechanical energy absorbers based on several physical parameters, including specific energy absorption (SEA). Generally, a material becomes a better energy absorber as its SEA increases, as demonstrated, for example, by bio-inspired honeycomb structures made from bamboo or pomelo peel [
27]. Moreover, the SEA parameter becomes even more critical when designing and manufacturing high-capacity mechanical energy absorption systems (MEAS) that are extremely lightweight and used in applications such as safety helmets [
28], automotive passive safety, highway safety, packaging of valuables [
29,
30], and the aerospace industry [
31].
In this work, we propose a series of innovative and reusable honeycomb structures fabricated from three types of thermoplastic polyurethane (TPU) filaments using a fused deposition modeling (FDM) 3D printing. Although various polymeric materials have been used in previous studies dedicated to the fabrication of MEAS, including polylactic acid [
32,
33,
34], Nylon [
35,
36], and acrylonitrile butadiene styrene [
34,
37], TPU has been recognized for its elasticity and processability [
31,
38,
39]. However, the potential of TPU for creating highly reusable, high-efficiency honeycombs through systematic FDM optimization remains underexplored. TPU combines a favorable mix of flexibility, resilience and low cost, and its tunable hardness and good printability make it especially attractive for printed MEAS that must recover after impact [
12,
39]. Crucially, the mechanical response of filament-assembled TPU architectures is dominated by process-dependent interlayer adhesion and printing parameters; therefore, producing reusable TPU honeycombs requires deliberate parameter optimization rather than simple material substitution. In this study, we address this gap by comparing multiple TPU grades, mapping key FDM parameters to mechanical performance, and demonstrating reusability through repeated out-of-plane compression tests supported by before-and-after inspections. Compared with single-use, plastically deforming foams and more costly powder- or beam-based additive manufacturing methods (SLS/SLM, PolyJet, EBM) [
40,
41,
42,
43], optimized FDM of TPU offers a low-cost, rapid, and lightweight approach to scalable, reusable MEAs with reduced material waste and improved suitability for safety and automotive applications [
12,
29,
31,
38,
39,
40,
41,
42,
43,
44]. Thus, our specific objectives are to optimize FDM printing parameters for three TPU variants; characterize the out-of-plane compression behavior of four honeycomb geometries (hexagonal and circular, with and without twist); evaluate key performance metrics including energy absorption efficiency, specific energy absorption (SEA), and crushing load efficiency (CLE); and assess reusability potential across multiple compression cycles through repeated testing and before-and-after inspections. To achieve these goals, we combine systematic process–property mapping with mechanical testing and structural inspection to identify processing windows that maximize both energy absorption performance and recovery.
3. Results and Discussion
We begin our discussion by presenting, in
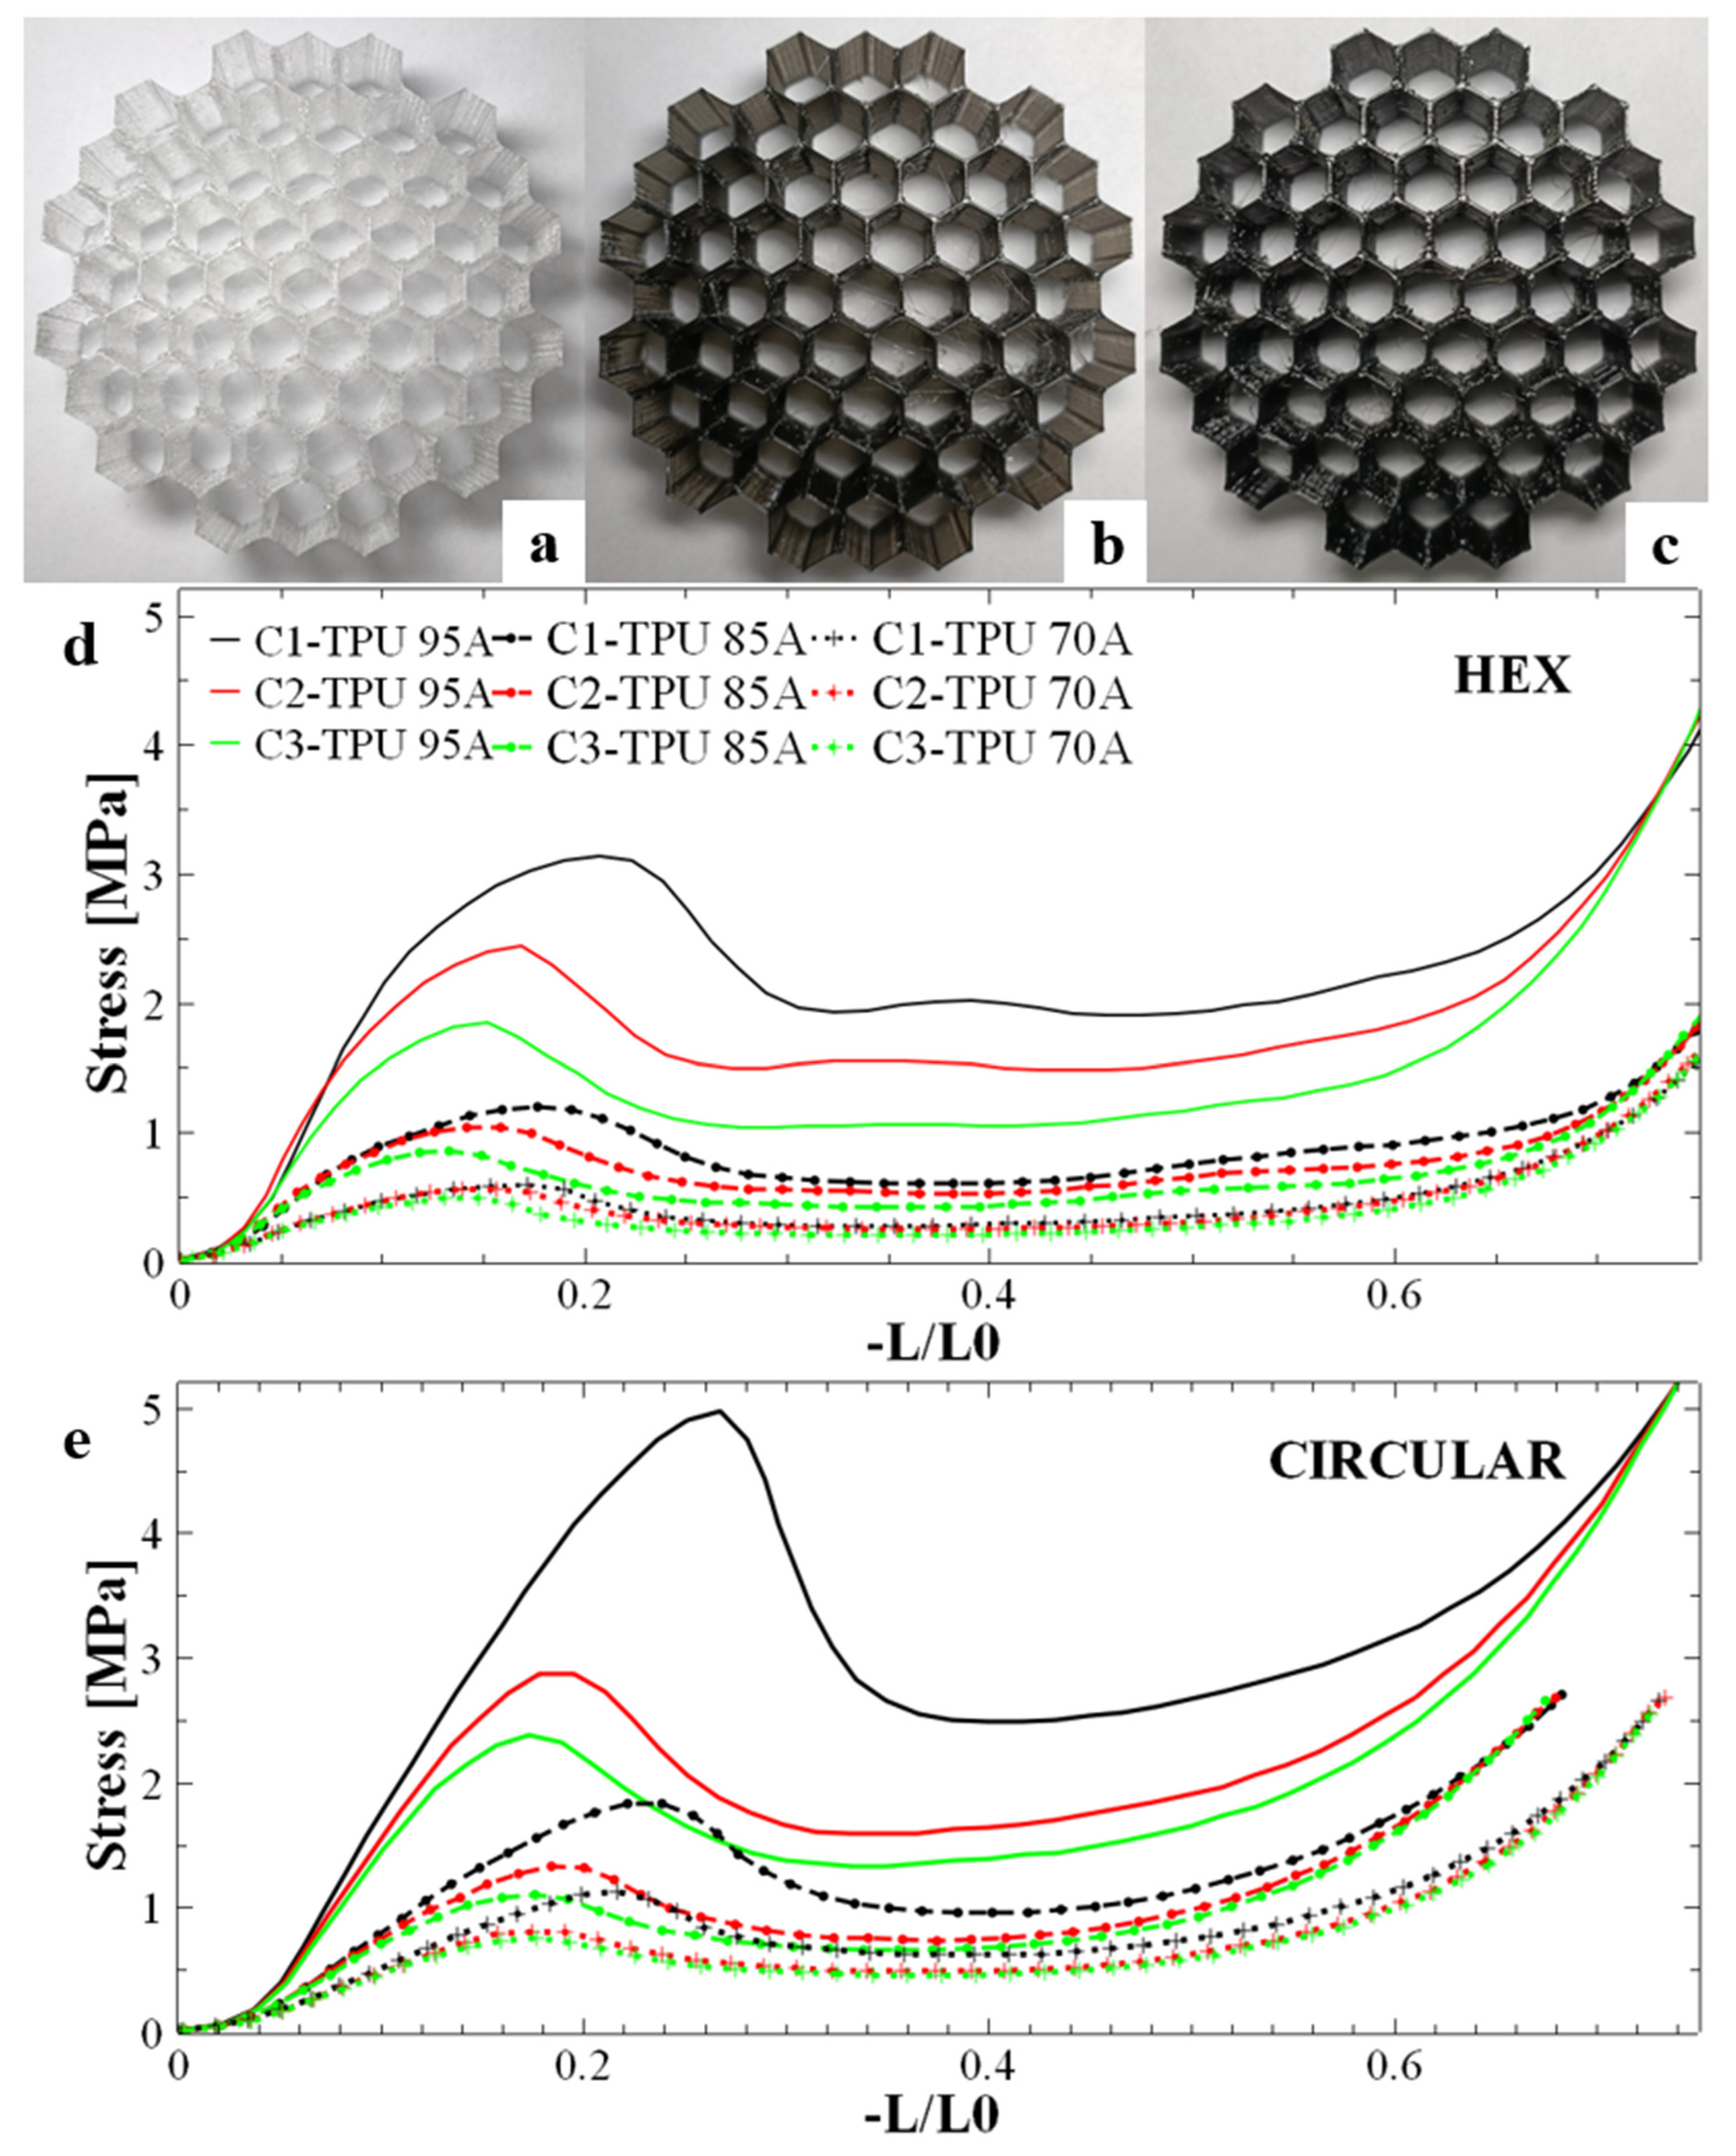
Figure 1a–c, the physical appearance of MEAS honeycomb-like hexagonal structures 3D-printed from TPU 70A, TPU 85A, and TPU 95A materials, respectively, using a printing temperature of 215 °C. These structures, each with atop surface area of 440.5 mm
2, were subjected to mechanical testing to evaluate their energy absorption capabilities and determine their degree of reusability. Specifically, all MEAS samples underwent compression tests by placing each specimen between two perfectly flat metal plates-one fixed and the other pushed by the device’s arm—ensuring that the pressing force was uniformly distributed over the contact surface. Three compression tests were conducted for each energy-absorbing honeycomb structure (photographs of representative samples at key positions are shown in
Figures S6–S13 in the Supporting Information). Compression results for all three 3D-printed honeycomb hexagonal structures (HEX) are presented in
Figure 1d, where stress is plotted as a function of strain rather than force versus compression distance. The results demonstrate a clear dependence of absorption capacity on the material type. Specifically, the maximum stress supported by the structure during the first compression correlates directly with the material’s hardness. TPU 95A exhibited the highest stress resistance, followed by TPU 85A, and then TPU 70A, which showed progressively lower stress resistance. This higher stress value also corresponds to a greater amount of energy absorbed by the structure. Furthermore, the samples exhibited a consistent decrease in stress between specific curves from one compression cycle to the next, indicating that the stress for a given sample is inversely proportional to the number of compressions. The difference between compression cycles also decreased progressively based on the material hardness, with TPU 95A exhibiting the largest differences between compressions and TPU 70A the smallest.
TPU hardness significantly influences the balance between peak stress, plateau stability, and elastic recovery. The harder TPU (95A) achieves higher peak stress and a more stable plateau while maintaining useful recoverability. The intermediate hardness (85A) represents a compromise between strength and ductility, whereas the softest grade (70A) exhibits the lowest peak stress but the greatest apparent elastic rebound. These trends reflect the competing effects of bulk polymer stiffness and interlayer adhesion in filament-assembled structures. To determine whether other honeycomb-like configurations could provide a better stress response than the hexagonal honeycomb structures, we 3D-printed honeycomb structures with a circular configuration (CIRCULAR), as shown in
Figure S8 in the Supporting Information. These circular samples, with a top plane surface area of 737 mm
2, exhibited behavior under compression similar to that of the hexagonal samples: the initial stress in the compression curves decreased with an increasing number of compressions (
Figure 1e). Nonetheless, the shape of each curve corresponding to the first compression for all three honeycomb circular structures and all three types of materials differed from those corresponding to the second and third compressions. For instance, the absorption curves exhibited a steeper initial slope compared to the structures with hexagonal holes, leading to a well-defined peak with higher values. Additionally, the difference between the maximum stress value and the stress value in the plateau region was more pronounced during the first compression for all these samples. For this reason, we considered that part of the internal circular structure might have been damaged after the first compression, causing the subsequent two compressions to withstand lower stress. This hypothesis was further confirmed when visualizing optical photographs of the compressed honeycomb circular structures (see
Figure S9 in the Supporting Information). The structure showed partial or complete ruptures of the walls in their thinnest areas. As shown in
Figure S1a, the wall thickness was not uniform in the circular configuration. In contrast, the circular-cell configuration contains thin regions that act as stress concentrators, initiating localized cracks and leading to a more abrupt, fracture-like failure mode. Thus, the hexagonal geometry with uniform wall thickness converts incoming energy into distributed folding and buckling of cell walls, whereas the circular cells concentrate strain and fail locally.
In conclusion, we observed that the base structure with hexagonal holes (and especially structures produced from TPU 95A) exhibited the best overall performance in terms of both energy absorption efficiency and reusability across multiple compressions. Moreover, as shown in
Figure S7 in the Supporting Information, the hexagonal MEAS sample maintained its original integrity (upon visual inspection), appearing undamaged after compression testing. Additionally, the curves presented in
Figure 1d demonstrated the best plateau linearity, a crucial property for energy absorption. Furthermore, the differences between the first and second compressions were significantly smaller compared to the curves of the circular structures presented in
Figure 1e. These characteristics pointed towards the hexagonal sample as being the most promising structure for further study.
It is important to note that the printing temperature used to produce the above-mentioned 3D honeycomb structures was not randomly chosen, but it was previously optimized by fabricating and testing standard samples of TPU 95A, TPU 85A and TPU 70A.
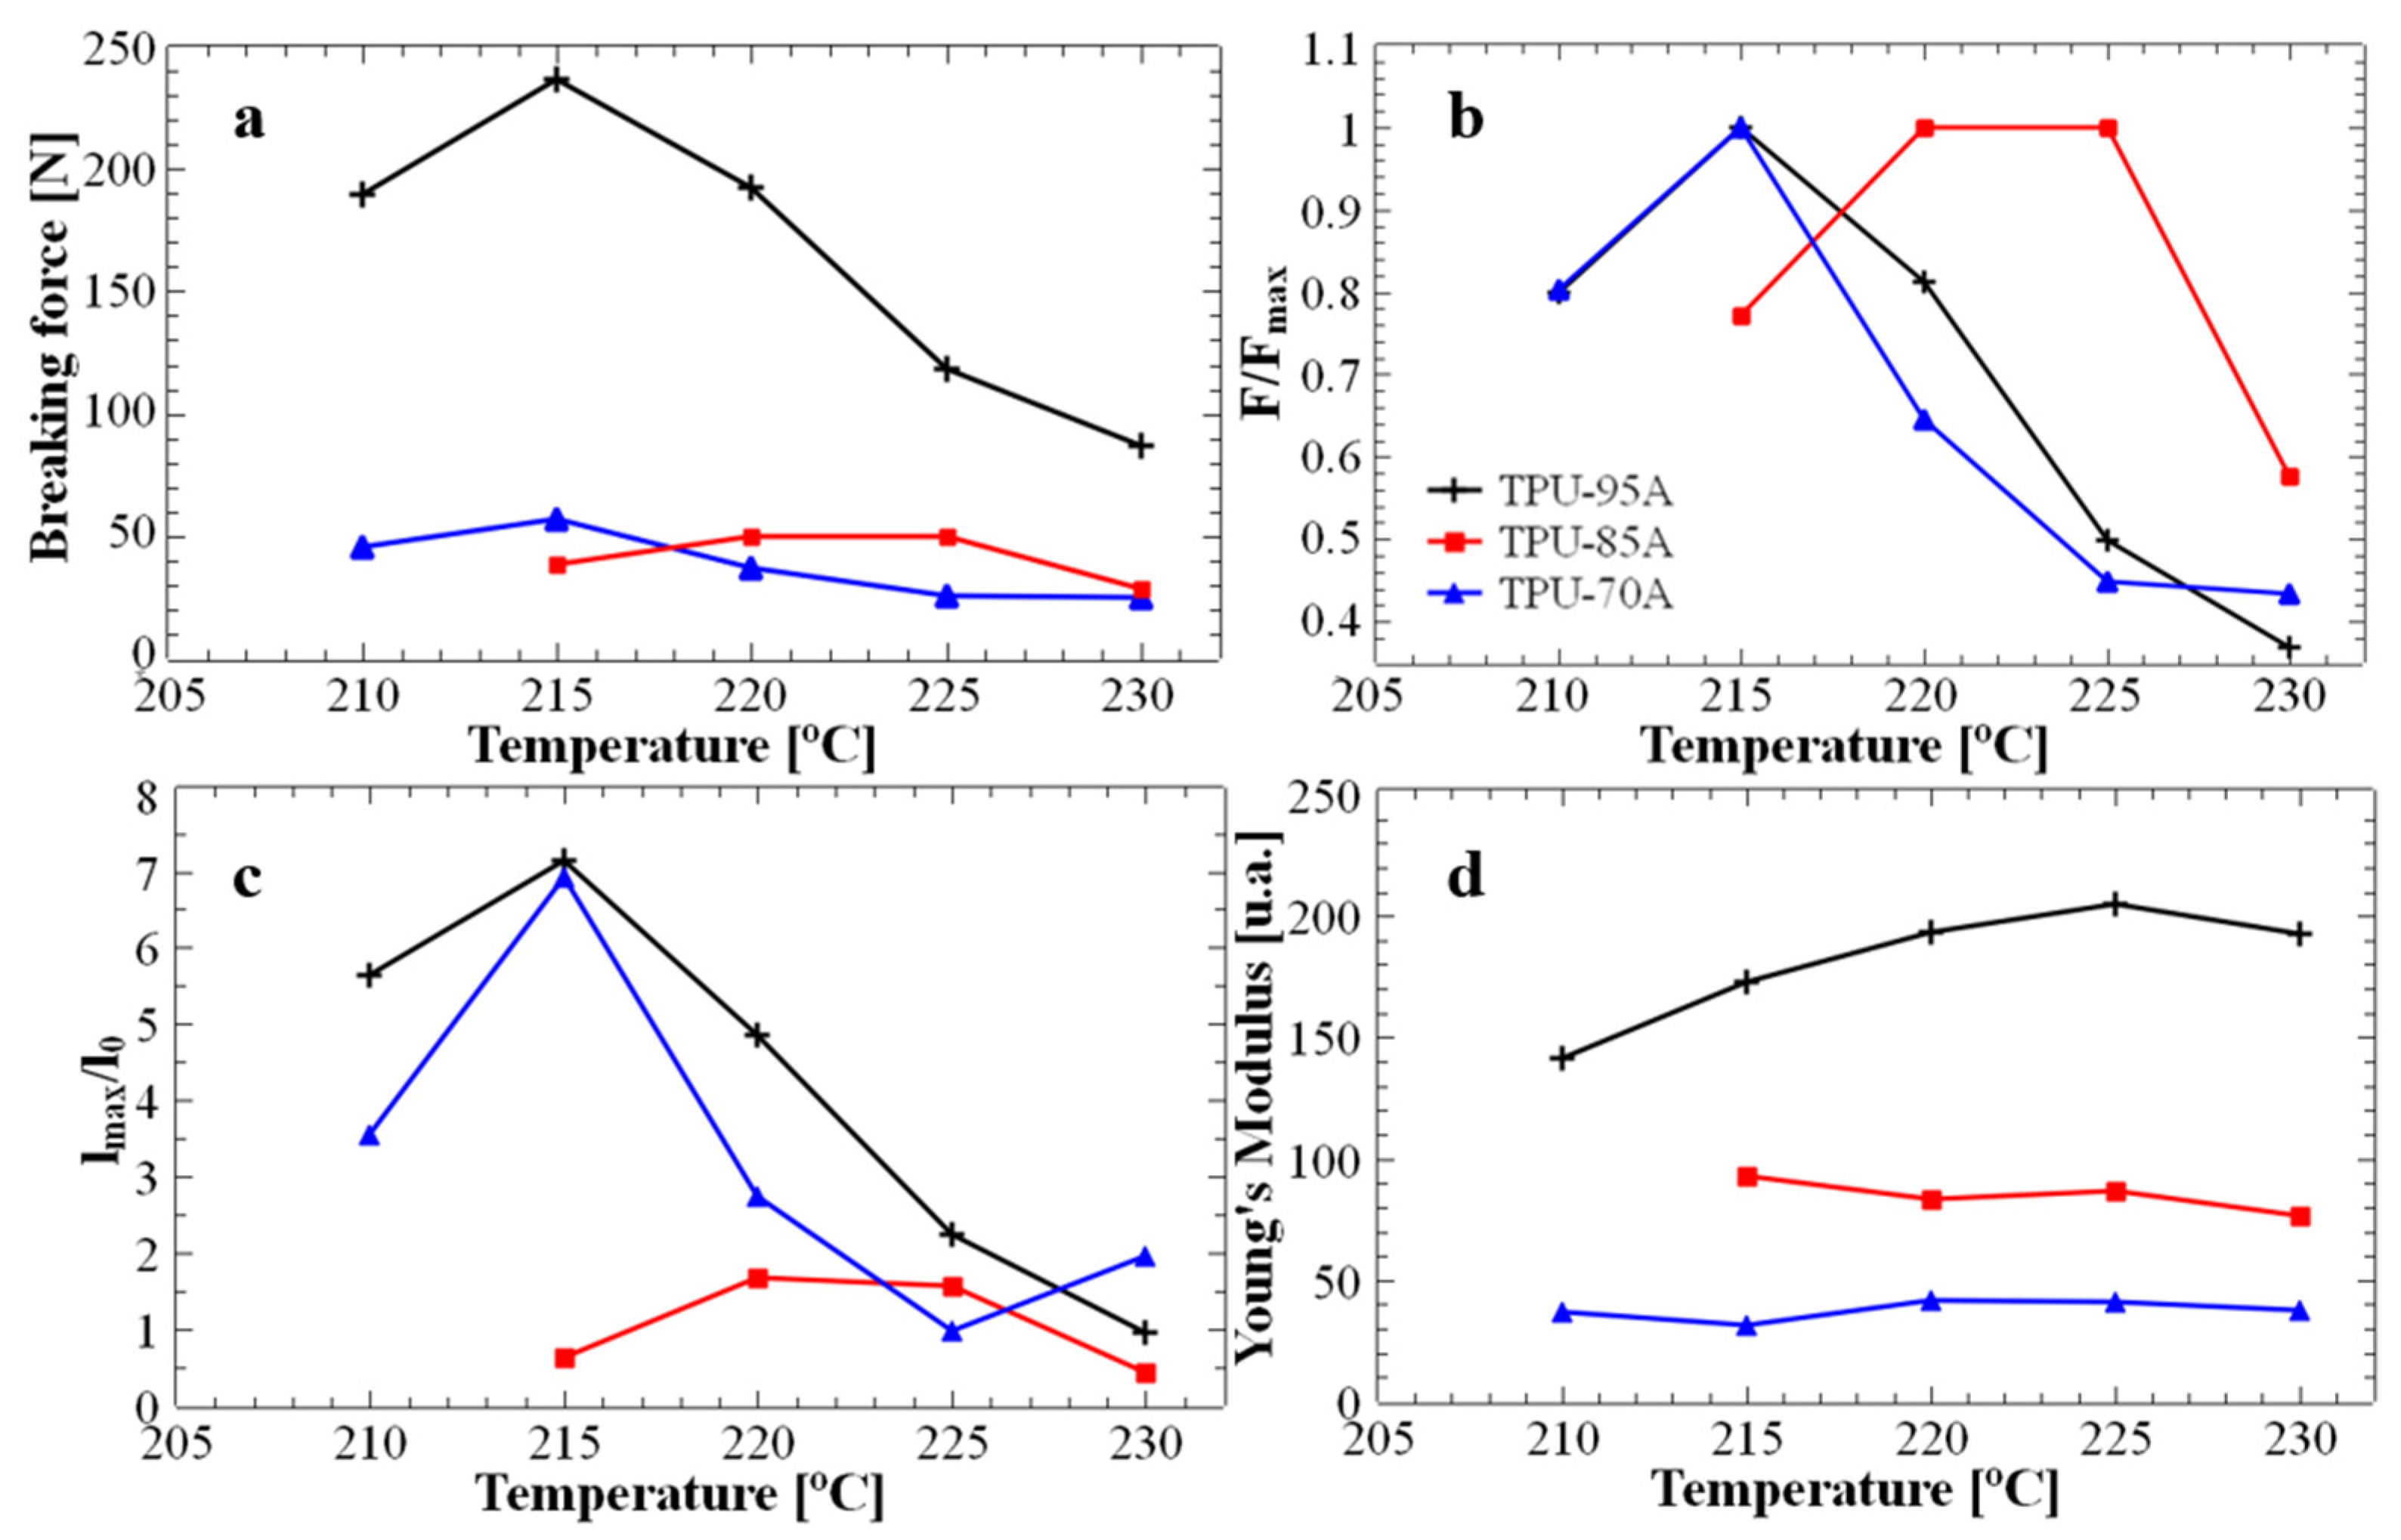
Figure 2 displays the main mechanical properties of all 3D-printed standard ASTM-D628-10 Type V samples, as inferred from typical mechanical tensile strength measurements. We aimed to study the properties of these standard samples in order to analyze how the printed layers adhere to each other at different printing temperatures. Our objective was to determine the optimal temperature for producing energy absorption honeycomb structures while ensuring their maximum structural resistance. First of all,
Figure 2a shows that the TPU 95A standard structure exhibited a much higher maximum breaking force (at least double at higher printing temperatures, and more than three-fold higher at lower printing temperatures) when compared to the other two TPU 85A and TPU 70A structures. Secondly, when further normalizing the maximum forces specific to each temperature, as shown in
Figure 2b, it was observed that the maximum breaking force for the TPU 70A and TPU 95A structures occurred at 215 °C. In contrast, for the TPU 85A structure, the maximum breaking force was observed at printing temperatures ranging between 220 °C and 225 °C. These results indicated that, in most cases, samples printed at 215 °C exhibited the best interlayer adhesion and higher overall print quality, as reflected by the superior force at which the samples failed. Furthermore, to study the final quality of the polymeric samples after exposure to different printing temperatures (considering that excessive temperatures could lead to material degradation), we determined the maximum elongation for all standard tensile specimens. This characteristic is important for reusable materials because it may indicate their ability to return to their original shape.
Figure 2c depicts the dependence of elongation on printing temperature and clearly highlights that TPU 70A and TPU 95A structures printed at 215 °C displayed a maximum elongation of approximately 700%, which is more than seven times higher than the maximum elongation of 75% observed for the TPU 85A structure at the same temperature. For TPU 85A material, the maximum elongation (150%) was achieved at printing temperatures around 220–225 °C. Finally,
Figure 2d emphasizes the variation in Young’s modulus corresponding to each ASTM-D628-10 Type V sample with printing temperature. While the Young’s modulus remained constant for TPU 70A and TPU 85A across all printing temperatures, it varied with temperature for TPU 95A. For example, an increase of about 15% in Young’s modulus was observed when increasing the printing temperature from 210 °C to 225 °C. A lower value of Young’s modulus may indicate increased elasticity. Note that we have chosen to determine Young’s modulus in arbitrary units because all utilized standard TPU samples were of the same size and for the purpose of solely finding the most appropriate printing temperature that could generate highly elastic standard samples, an exact value of the modulus was not necessary.
The data presented in
Figure 2 were extracted from the force-elongation curves shown in
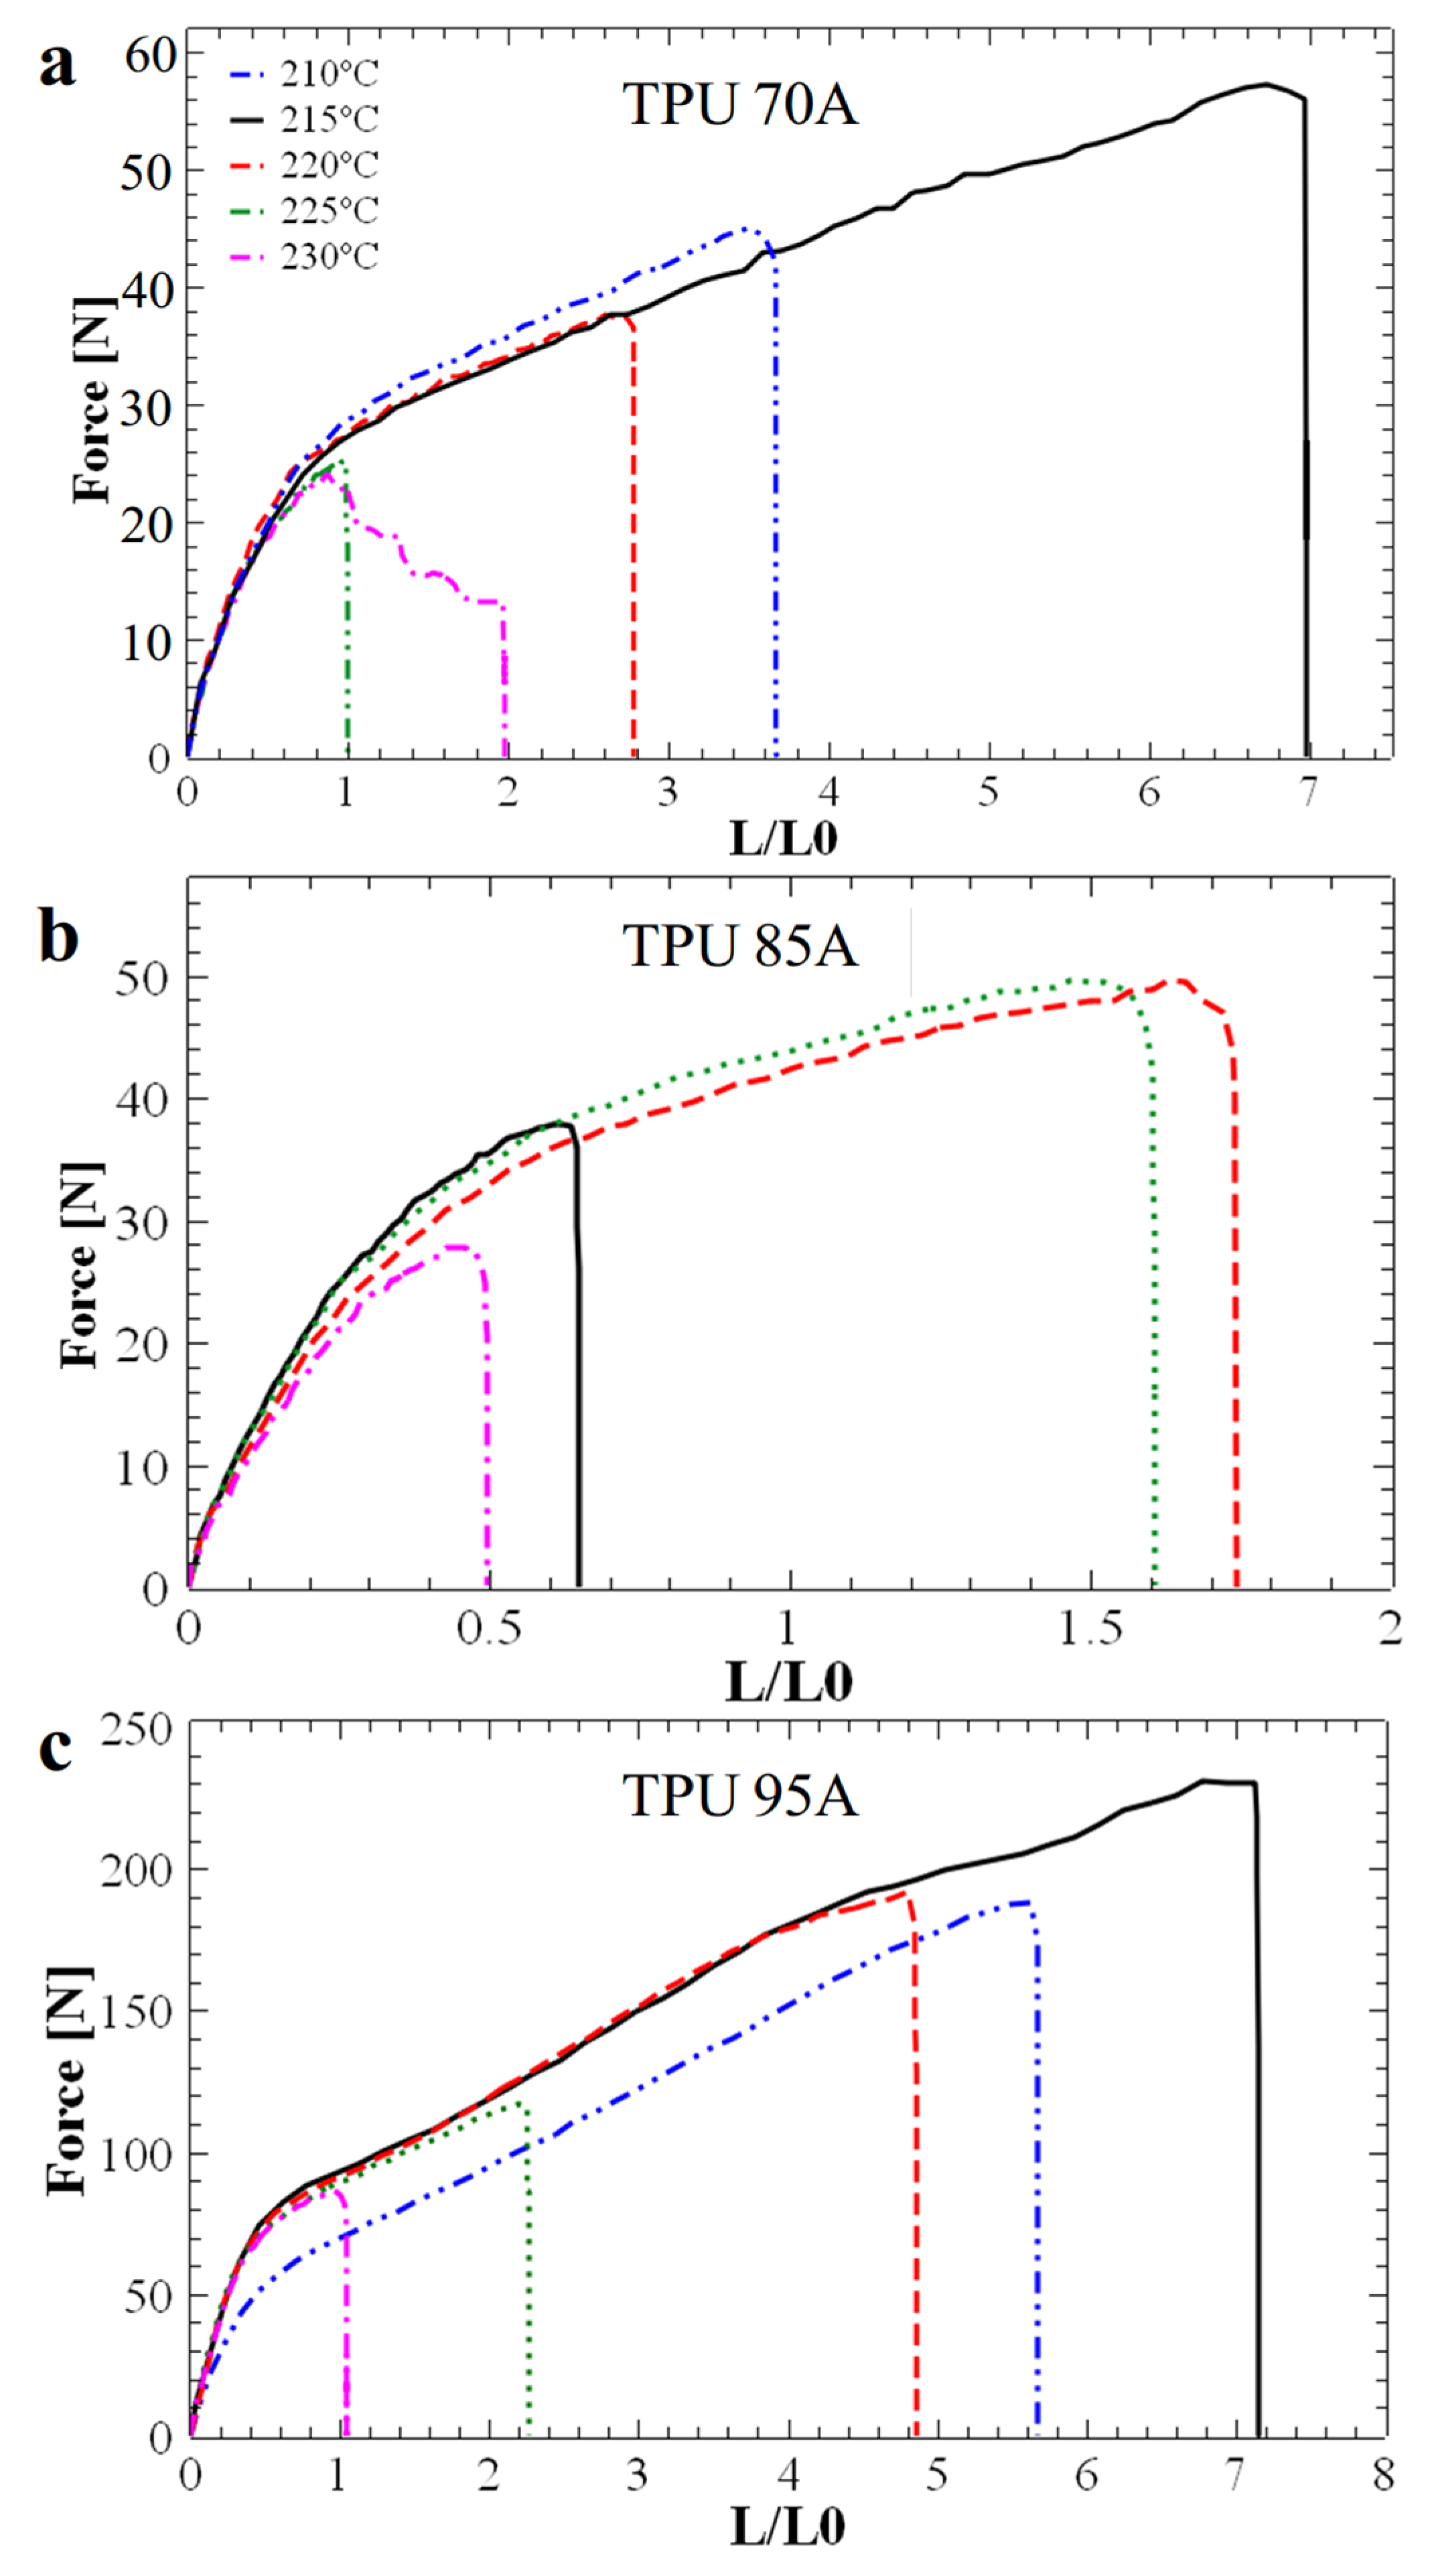
Figure 3. These curves display the critical force and elongation values up to the point of sample failure and help determine the optimum printing temperature. While the initial goal of this study was to optimize printing parameters for flexible materials such as TPU 95A, the subsequent objective was to observe the maximum force and elongation of samples printed at different temperatures to establish the optimal printing temperature for achieving the most efficient layer adhesion.
Figure 3 shows that the typical shape of the interlayer force-elongation curve indicates an optimal printing temperature of 215 °C for the TPU 70A and TPU 95A materials. These materials withstand a maximum breaking interlayer force of approximately 55 N (
Figure 3a) and 225 N (
Figure 3c), respectively. Instead, the TPU 85A standard sample displayed a maximum breaking interlayer force slightly below 50 N at a higher printing temperature of 220 °C (
Figure 3b). Under these conditions, and knowing that the hardness of TPU 85A lies between that of TPU 70A and TPU 95A, and to optimize the printing process, we chose to 3D-print all our honeycomb (hexagonal and circular) structures at 215 °C. For example, although the Young’s modulus of TPU 95A at 215 °C is lower, its corresponding elongation and breaking force are higher, which is more relevant for mechanical energy-absorbing applications.
To investigate how twisting the honeycomb absorbent structures with internal hexagonal and circular holes would impact their performance in terms of energy absorption upon compression, we rotated both hexagonal and circular structures by 30°.
Figure 4 illustrates the behavior of the twisted structures with internal hexagonal holes (
Figure 4a) and circular holes (
Figure 4b) during compression, using the same materials for production. A general characteristic of twisted structures is an offset between compressions, with the curve for the first compression showing a noticeably higher stress value than those for the two subsequent compressions. Since these latter compressions display similar values, we anticipate that further compressions will also exhibit comparable stress values. Therefore, we assume that the samples discussed here could withstand a series of additional compressions before failure. Moreover, although this characteristic of rotated structures may enhance their reusability potential, we observed that in the case of both basic (
Figure 1e) and twisted (
Figure 4b) structures with circular holes, the compression curve shows a reduced linear area compared to the hexagonal hole structures (
Figure 1d and
Figure 4a). This suggests lower efficiency in absorbing mechanical energy (the efficiency parameter, as you can see in Equation (8), is highly dependent on the length of the linear plateau; a longer linear area allows a larger amount of energy to be absorbed).
In the case of the twisted hexagonal structure (
Figure 4a) the height difference between the maximum peak and the partially linear area was smaller than that of the non-twisted hexagonal hole structure (
Figure 1d). This could indicate that twisting the structures improves their crushing load efficiency (CLE), as presented in Equation (7). This parameter depends on two main stress values: the maximum peak and the average stress. For example, if the maximum peak and plateau stress values are more similar, the CLE parameter will be closer to 1. Additionally, the shock absorption mechanism remains consistent because the gap between the peak and plateau is reduced. Therefore, we can conclude that the compression behavior of hexagonal cell structures is more balanced compared to structures with circular holes. In the case of twisted hexagonal cells, some crushing parameters may be superior. Nonetheless, from a quantitative point of view, the non-twisted structures (
Figure 1d,e) can withstand significantly higher peak stress compared to the twisted structures (
Figure 4a,b). This difference could translate into a greater amount of absorbed mechanical energy.
Besides its dependence on the length of the linear plateau, the efficiency parameter also depends on the difference in height between the maximum peak and the linear area. When this difference is small, the absorbed energy approaches the total energy that can theoretically be absorbed. For example, comparing
Figure 1 and
Figure 4 reveal that the basic structures with circular and hexagonal holes absorb a larger amount of energy compared to the twisted structures. Moreover, this amount of potentially absorbed energy seems also to be dependent on the type of TPU material used.
To generate a fair comparison of all samples in terms of the efficiency in absorbing mechanical energy during compression, the efficiency for each compression cycle was compiled separately, and the results are presented in
Figure 5. A thorough analysis of these results indicates that most samples exhibited relatively similar energy absorption efficiencies, ranging between 36% and 47%. The highest absorption efficiency was achieved by the basic hexagonal hole structure made from TPU 95A (see the blue bar in
Figure 5a), followed by the 30° twisted and non-twisted honeycomb with hexagonal internal patterns made from TPU 85A (see the red bar in
Figure 5a). However, when considering how well the structure maintains its absorption capacity over repeated compressions, the best-performing structure was the hexagonal hole structure rotated by 30° and made of TPU 85A (see the red bar in
Figure 5a), which showed a smaller variation in specific efficiencies across compression cycles. Nonetheless, the overall difference in the efficiency of energy absorption was rather small when comparing these three samples.
We further observed from the specific efficiency histograms presented in
Figure 5 that, overall, the twisted hexagonal structures exhibited similar or slightly better efficiency compared to non-twisted ones in some cases. Additionally, energy absorption efficiency depended on material hardness. For softer materials like TPU 70A, energy absorption was more efficient in twisted hexagonal structure. In contrast, for harder materials such as TPU 85A and TPU 95A, the hexagonal non-twisted structures demonstrated higher energy absorption efficiency. Moreover,
Figure 5 clearly shows that honeycomb structures with a hexagonal internal configuration (twisted or not) outperform those with a circular internal structure (twisted or not) in mechanical energy absorption. So, in terms of energy absorption efficiency, the non-twisted hexagonal hole structure demonstrated the highest capability as an energy absorber. And, because this structure made from TPU 95A exhibited an absorption efficiency exceeding 47%, we consider this sample the best outcome of our present study.
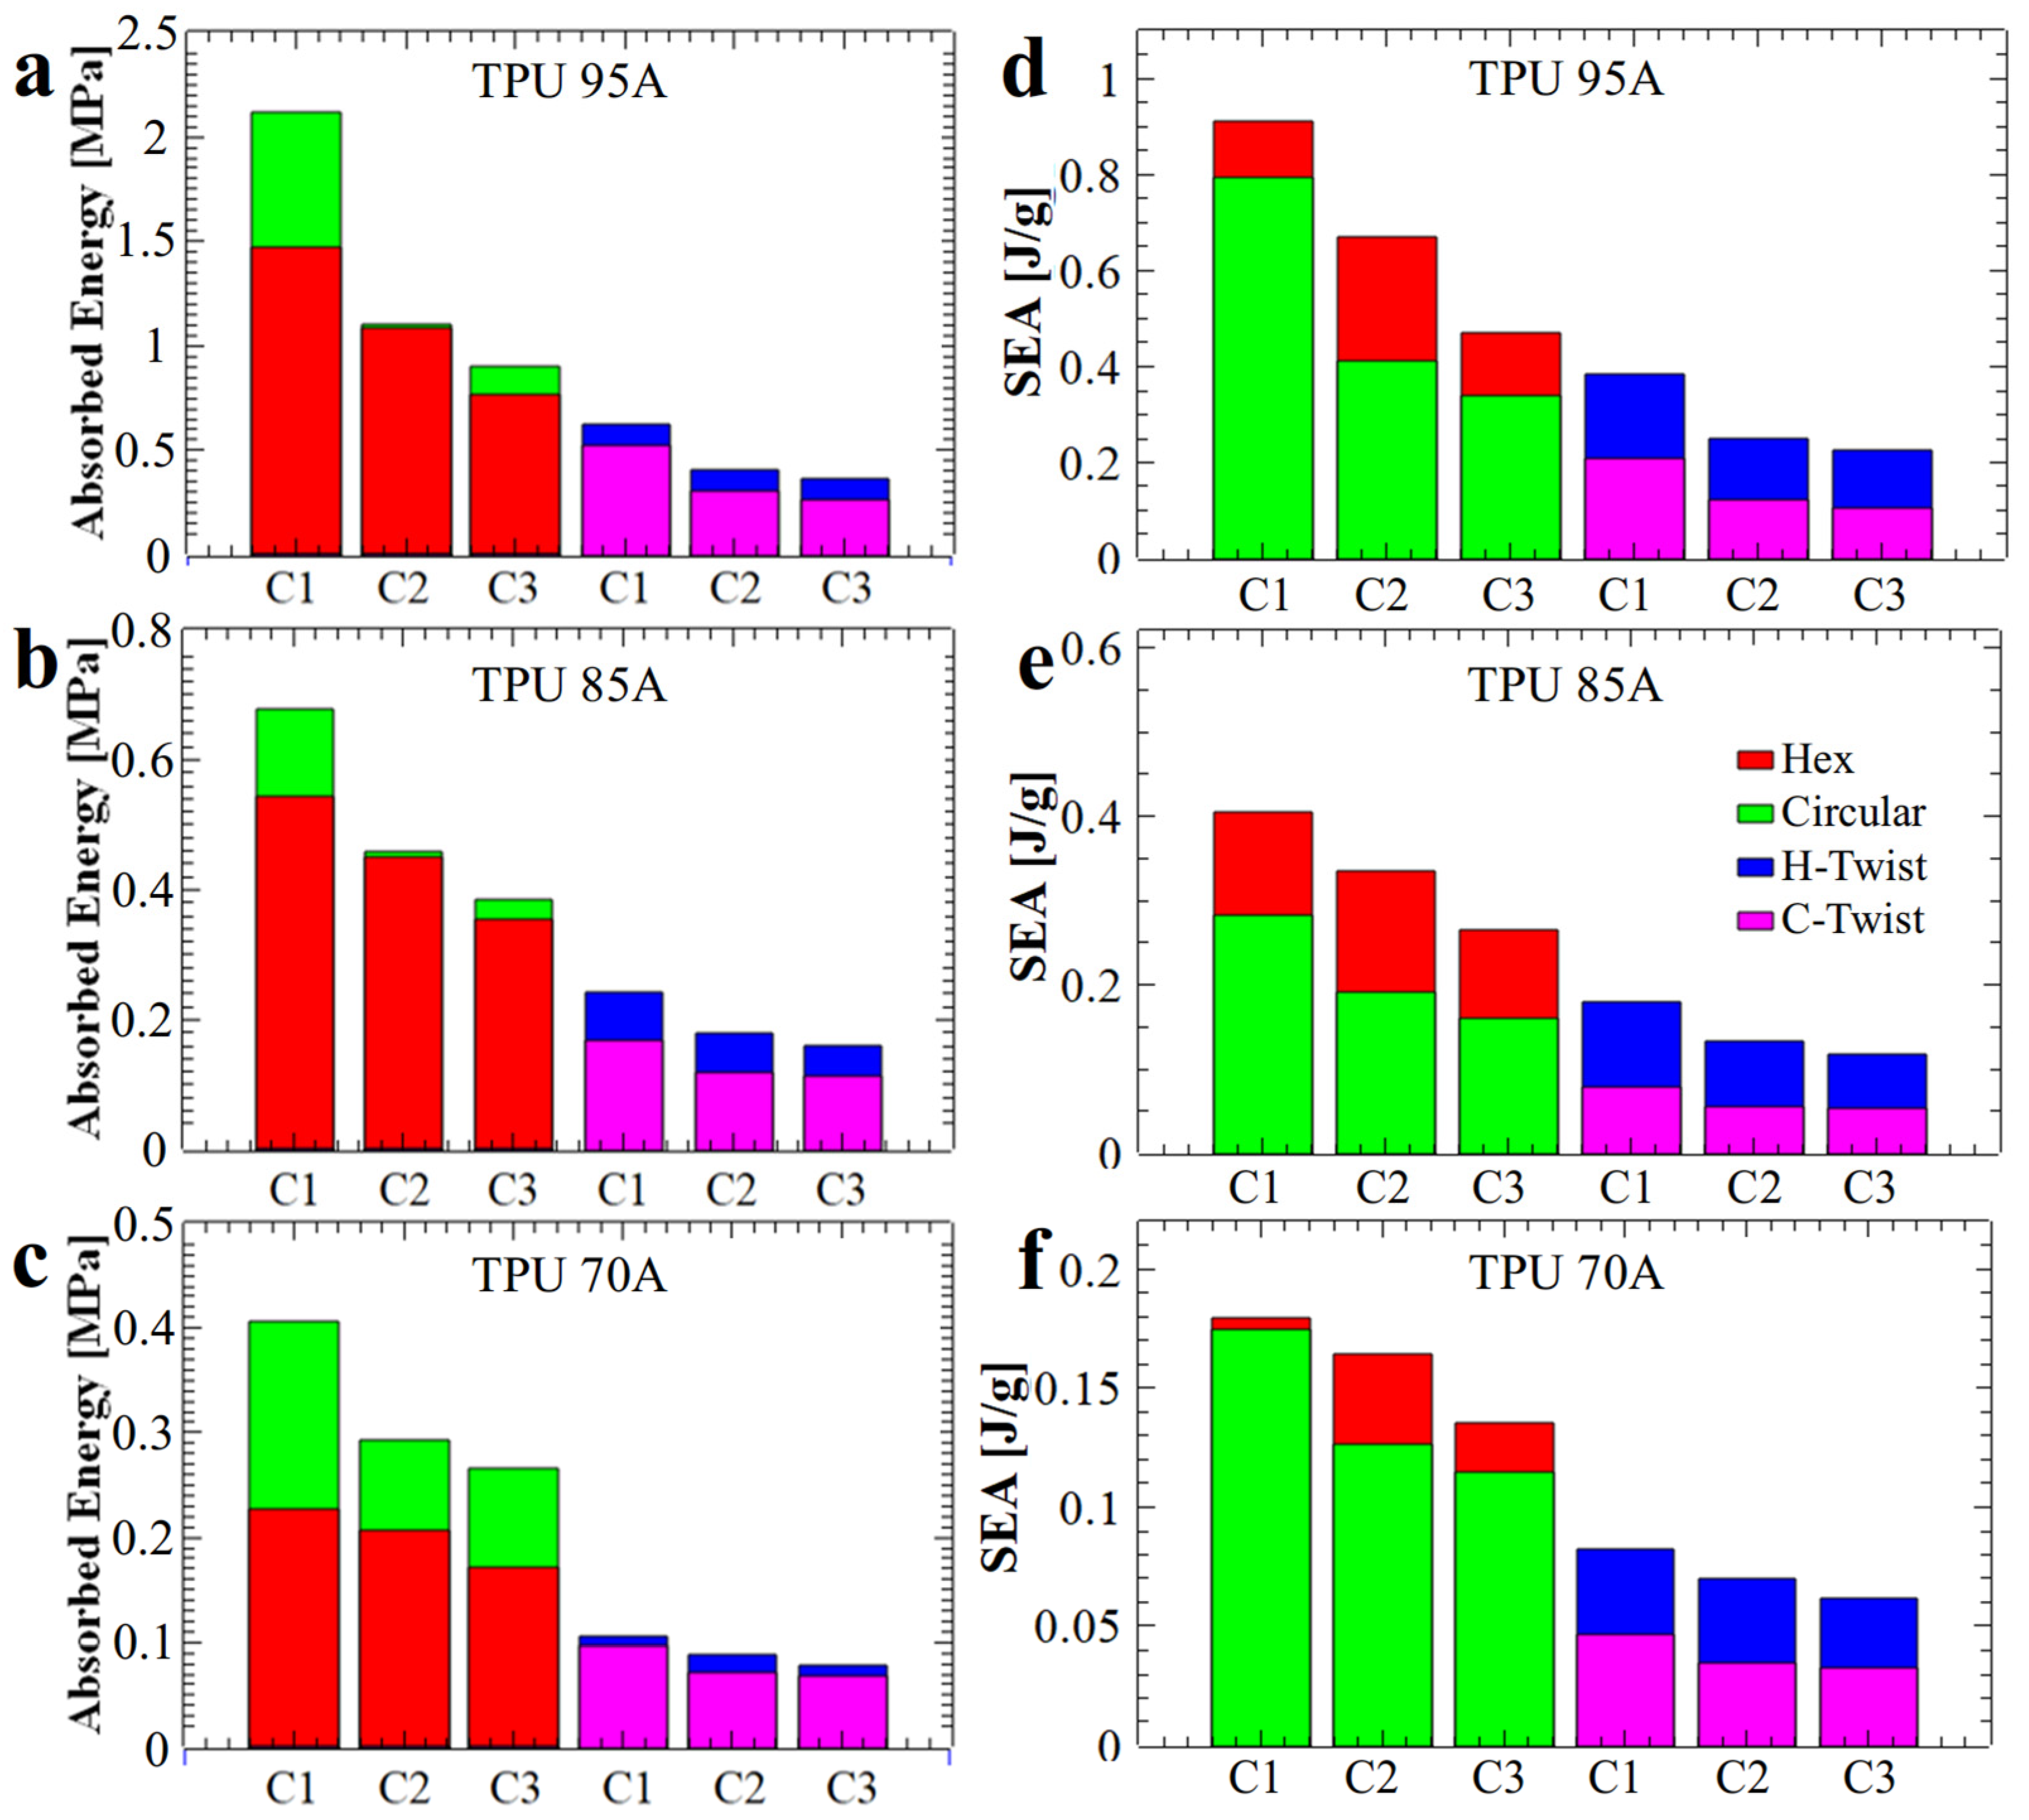
Furthermore, because each MEAS sample may vary in density, water absorption, and printing parameters, the samples were weighed. We used mass to calculate the specific energy absorption (SEA), as this parameter quantifies the energy stored per unit mass. In terms of energy absorption,
Figure 6a–c demonstrates that structures with circular holes have absorbed a greater amount of energy as compared to their hexagonal and twisted analogs. However, the SEA coefficient changed because samples with circular holes required more material to produce (
Figure 6d–f). Therefore, we can confidently state that structures with hexagonal holes absorbed a smaller amount of energy, but the latter was absorbed more efficiently, as in this case the mass of utilized material was smaller. For example, structures with circular holes used between 16 g and 20.5 g of material, while those with hexagonal holes required only 10 g to 14 g. To illustrate, with approximately the same amount of material, two circular-hole structures or three hexagonal-hole structures could be produced; notably, the total energy absorbed by three hexagonal-hole honeycomb structures exceeded that absorbed by two structures with circular holes. Moreover, the printing process for hexagonal hole structures was faster and of higher quality because the wall thickness was achieved in a single pass of the extruder, compared to circular hole structures where the extruder made a series of extra moves. In terms of price, a quick cost analysis has revealed that 20 g of TPU 95A sample cost under 1 euro, while approximately 1.5 euros must be paid for the same amount of TPU 85A, and around 1.6 euros for TPU 70A.
Additionally, the time to print samples with circular holes was twice that necessary to print structures with hexagonal holes, although this typically depends also on the type of utilized polymeric material. Furthermore, we observed that in the case of the structure with circular holes and made from the softer TPU 70A material, the amount of absorbed energy for the first compression was much lower (approximately 0.4 MPa, see
Figure 6c), compared to that of the hardest TPU 95A material (approximately 2.1 MPa, see
Figure 6a). We also noticed in
Figure 6a–c that the basic structures with circular holes (green bars) experienced a significant difference in energy absorption between the first and second compressions, compared to the structures with hexagonal holes (red bars). Specifically, the first compression of the circular hole structures showed much higher energy absorption than that of the hexagonal-hole structures, whereas the second compression resulted in similar energy absorption levels for both types of structures. This aspect was more pronounced in structures printed from harder materials: a difference of approximately 0.1 MPa between C1 and C2 was measured for TPU 70A (
Figure 6c), while a difference of approximately 1 MPa was determined in the case of TPU 95A (
Figure 6a).
After being compressed three times, the physical appearance of all structures remained similar to the original one. This can be visualized in
Figure S7 in the Supporting Information. Moreover, for structures with hexagonal holes, the walls visually retained their shape and linearity after compressions. In particular, structures with circular made from TPU 95A and subjected to three compressions experienced total or partial breaks in the walls at the thinner, intentionally designed areas. However, structures printed with a 30° twist angle showed no physical alterations after compressions.
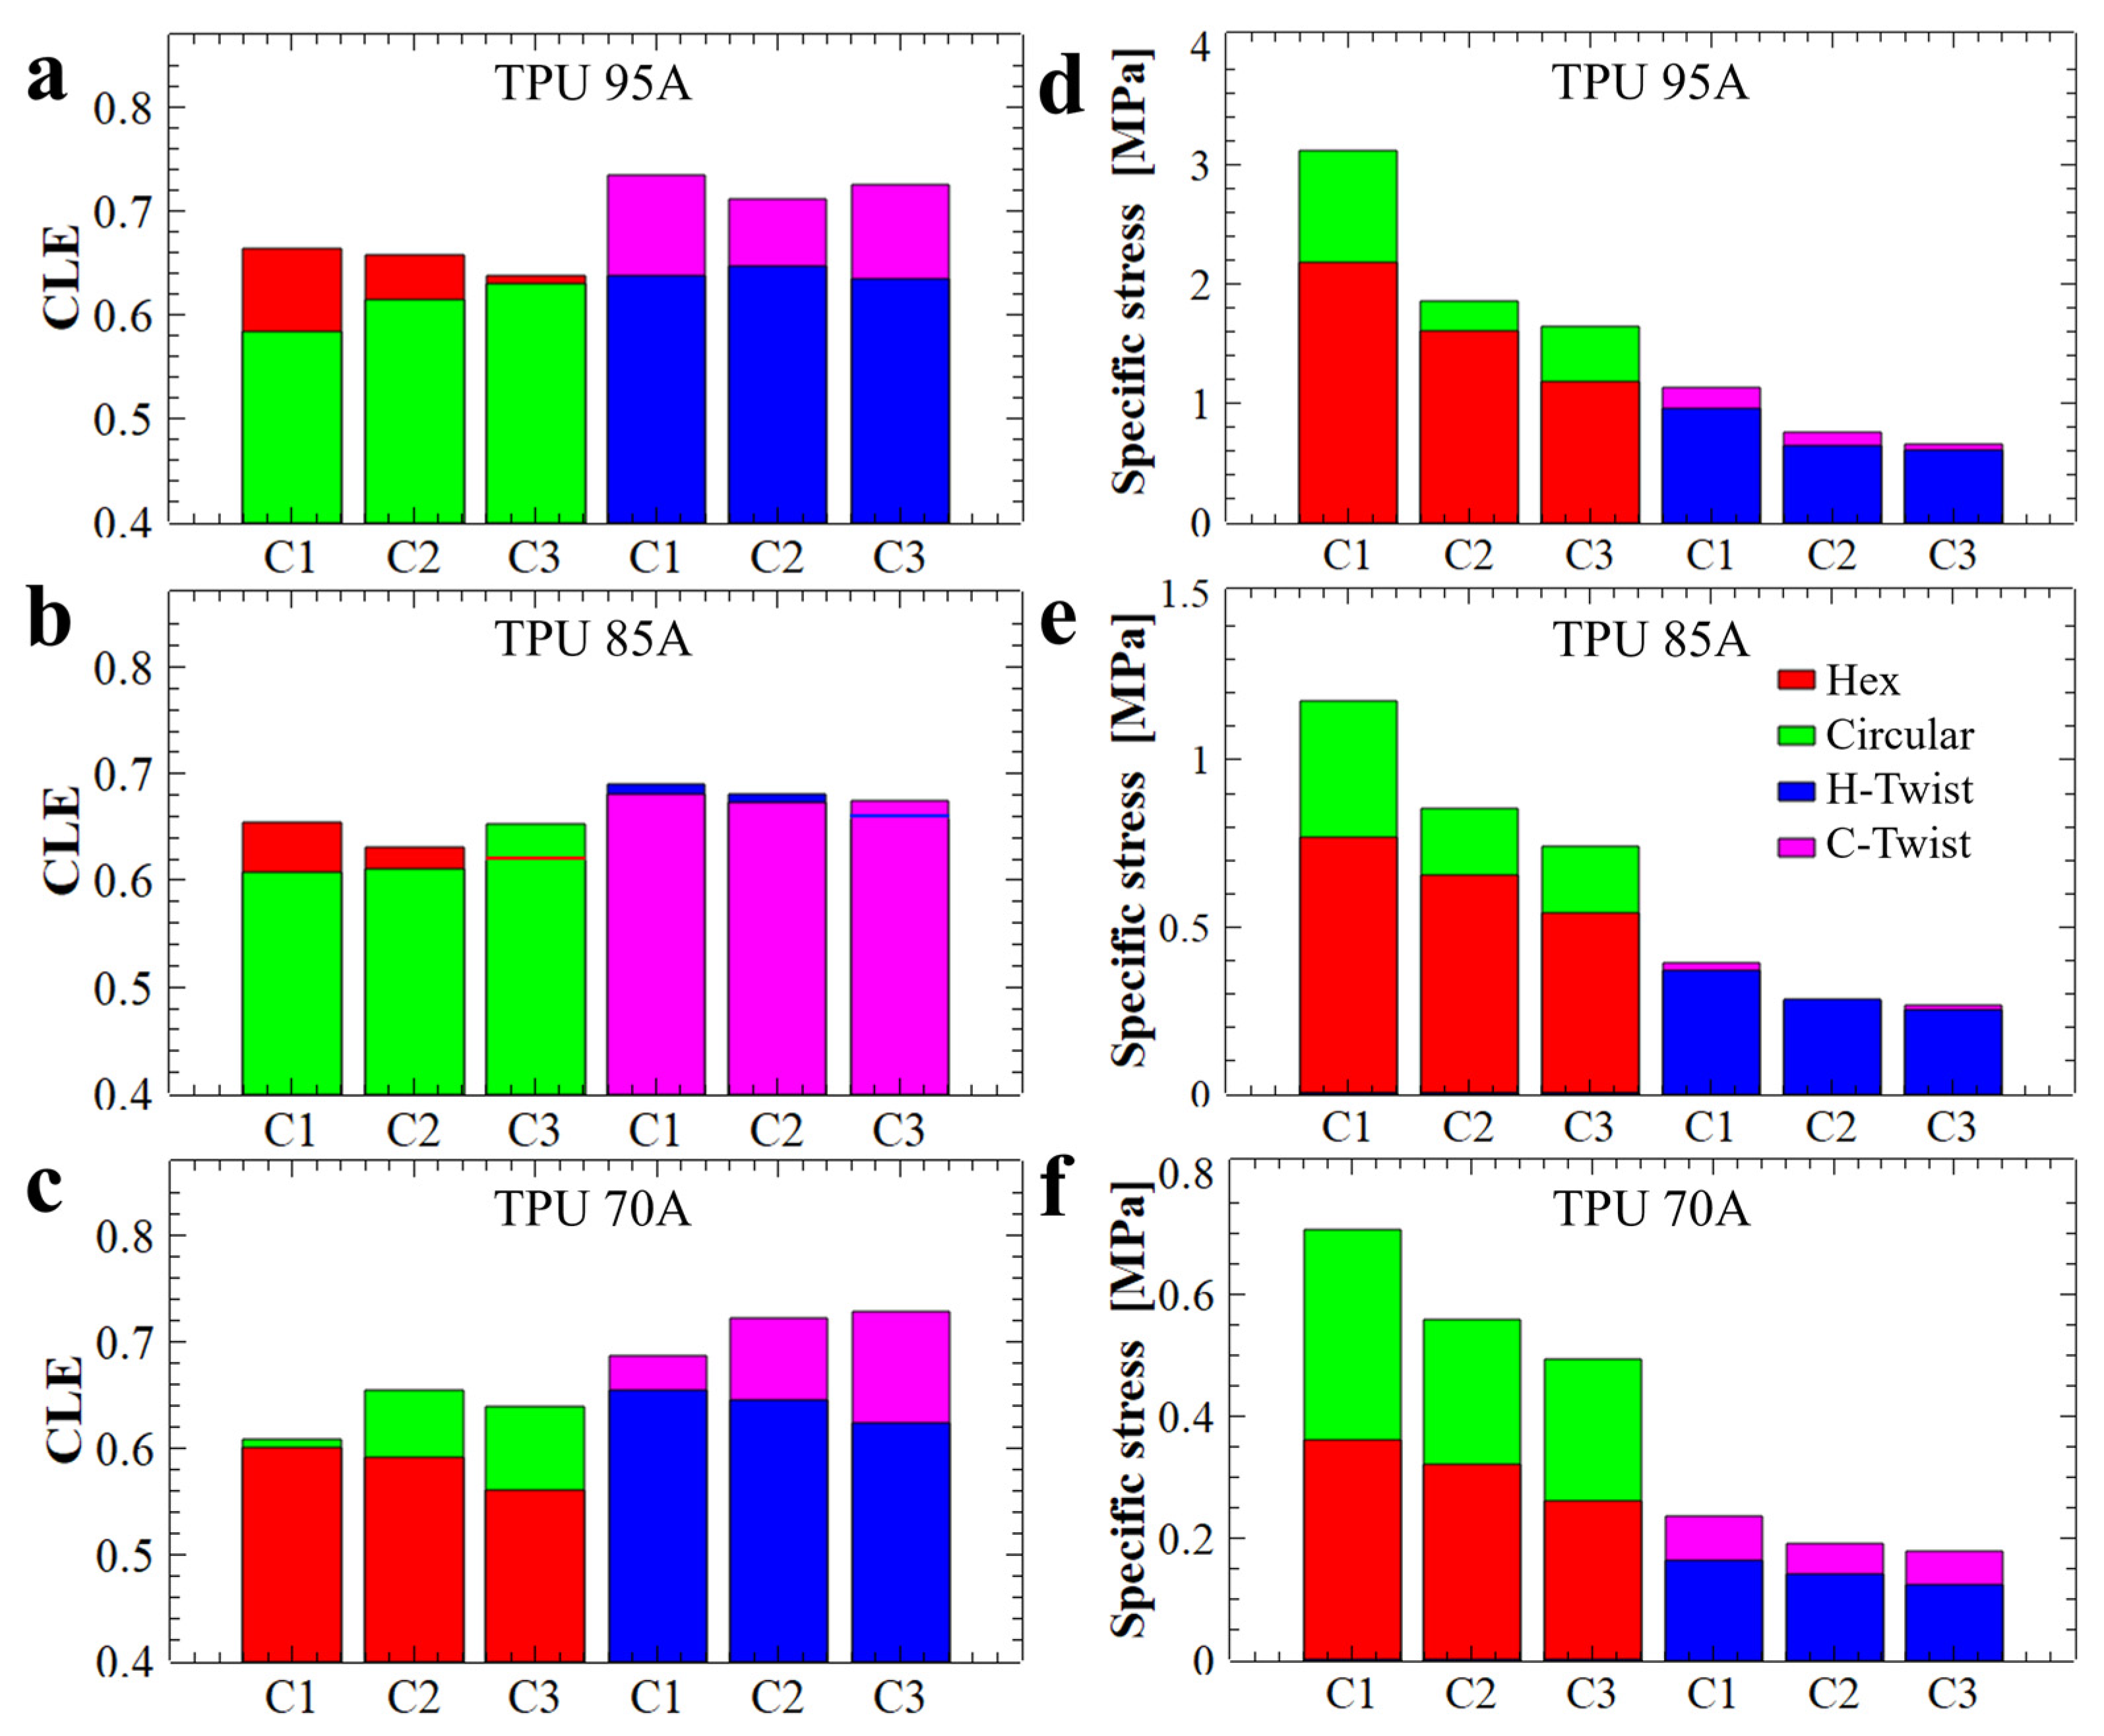
To quantitatively evaluate the mechanical energy absorption efficiency of the investigated structures, the dimensionless CLE parameter was computed and analyzed. A CLE value approaching unity is indicative of superior energy absorption characteristics. As shown in
Figure 7a–c, the twisted structures (H-twist and C-twist) exhibited, on average, higher CLE values, i.e., values closer to 1. In comparison the CLE values corresponding to the non-twisted counterparts were generally lower (except possibly for the hexagonal structures made from TPU 95A), i.e., further away from 1. Introducing a twist reduces the instantaneous peak stress and total absorbed energy but increases crushing load efficiency (CLE). This behavior is consistent with a transition from abrupt cell wall engagement to a more gradual, distributed deformation. Therefore, twisting promotes progressive loading of successive cell walls, improving CLE at the expense of initial load-bearing capacity.
In the case of structures with hexagonal holes, a decrease in the CLE parameter was observed with repeated compressions. This behavior is attributed to the fact that, although the compression curves maintained their general shape across successive cycles (
Figure 1d), the maximum force values progressively decreased. This trend can be explained by both the structural configuration and the fabrication method employed. Specifically, in structures with circular holes, the initial slope of the compression curve (
Figure 1e) was lower compared to that of the hexagonal-hole structures (
Figure 1d), indicating a different stress absorption mechanism. A steeper slope typically reflects a more rigid structure that maintains stiffness up to the peak load before yielding, whereas a gentler slope suggests a structure that absorbs stress more gradually before failure.
From a manufacturing perspective, structures with circular holes are more susceptible to defects due to the increased complexity involved in 3D printing flexible filaments into such geometries. These larger defects, combined with inherent variations in wall thickness, contribute to structural rearrangement during the initial compression cycle, as indicated by the differences observed between the first (C1) and second (C2) compression curves (
Figure 1e). The analysis of the CLE histograms presented in
Figure 7a–c revealed that the highest CLE values, ranging from 72% to 73.5%, were recorded for twisted structures with circular hole fabricated from TPU 95A (
Figure 7a) and TPU 70A (
Figure 7c), respectively. In contrast, the hexagonal holes structures produced from TPU 95A exhibited a CLE coefficient of 0.665 (i.e., 66.5%,
Figure 7a), while the H-twist structure fabricated from TPU 85A displayed a CLE value of 0.69 (i.e., 69%,
Figure 7b). Although the Hex structure demonstrated outstanding performance across the previously evaluated parameters, its CLE value did not reach a higher level. Nevertheless, the recorded value remained very close to the theoretical maximum, confirming the structure’s overall superior energy absorption behavior.
To characterize the linearity of a specific absorption plateau, we further calculated the specific stress of that plateau. The results are presented in
Figure 7d–f. It is important to emphasize that the energy absorption capability of a structure is strongly influenced by both the linearity and extent of the plateau region observed during compression. A longer and more stable plateau allows the structure to absorb greater amounts of mechanical energy efficiently, as the stress is distributed uniformly over an extended range of deformation. In particular, structures that maintain near-constant stress across the plateau phase exhibit improved mechanical performance, minimizing localized failures and optimizing energy dissipation. Therefore, designing honeycomb structures with geometries and material properties that promote a long, stable plateau is essential for developing efficient, reusable energy-absorbing systems. For example, the stress values of the basic samples (Hex and Circular) decreased considerably after each compression (see
Figure 7d), whereas in the case of structures twisted by 30°, the stress values decreased much less after each compression. Thus, we conclude that twisted structures with hexagonal holes are capable of preserving the linear plateau stress value at a level comparable to that observed during the initial compression.
Nonetheless, when considering parameters such as the energy absorption efficiency shown in
Figure 5, as well as the CLE parameter depicted in
Figure 7a, the structure with hexagonal holes made from TPU 95A demonstrated the best overall energy absorption properties. The energy absorbed by this structure was 1.5 MPa in terms of stress and 0.91 J/g in terms of specific absorbed energy. Thus, TPU 95A appears to be a more versatile material, capable of exhibiting a wide range of the maximum compression force values. Alongside the TPU 95A, another structure that efficiently absorbs mechanical energy is the twisted structure with hexagonal holes, produced from TPU 85A. This structure demonstrated an energy absorption efficiency of 46% (
Figure 5a), while its corresponding CLE parameter, as compiled from
Figure 7b, was 0.69 (i.e., 69%). However, this structure absorbed only 0.2 MPa of energy (as shown in
Figure 6b) and therefore appears to be suitable only for absorbing low-amplitude mechanical shocks. Similar properties were also observed for this type of structure when produced from TPU 95A.
In the case of twisted structures with circular holes, although they exhibited a favorable CLE parameter (see
Figure 7a–c), they absorbed only a small amount of specific energy relative to their weight (see
Figure 6d–f). Furthermore, the efficiency results for these structures (see
Figure 5) were lower than those of the basic structures. Therefore, we decide not to pursue twisted structures with circular holes further in our study.
In conclusion, the combined results obtained in this study clearly indicate that structures with hexagonal holes are the most effective configurations for developing energy-absorbing products. The findings also suggest that TPU 95A is the most versatile material for producing structures with hexagonal holes. Therefore, for subsequent studies, we produced a set of four basic, non-twisted structures with hexagonal holes using TPU 95A (with four samples per set to ensure experimental reproducibility).
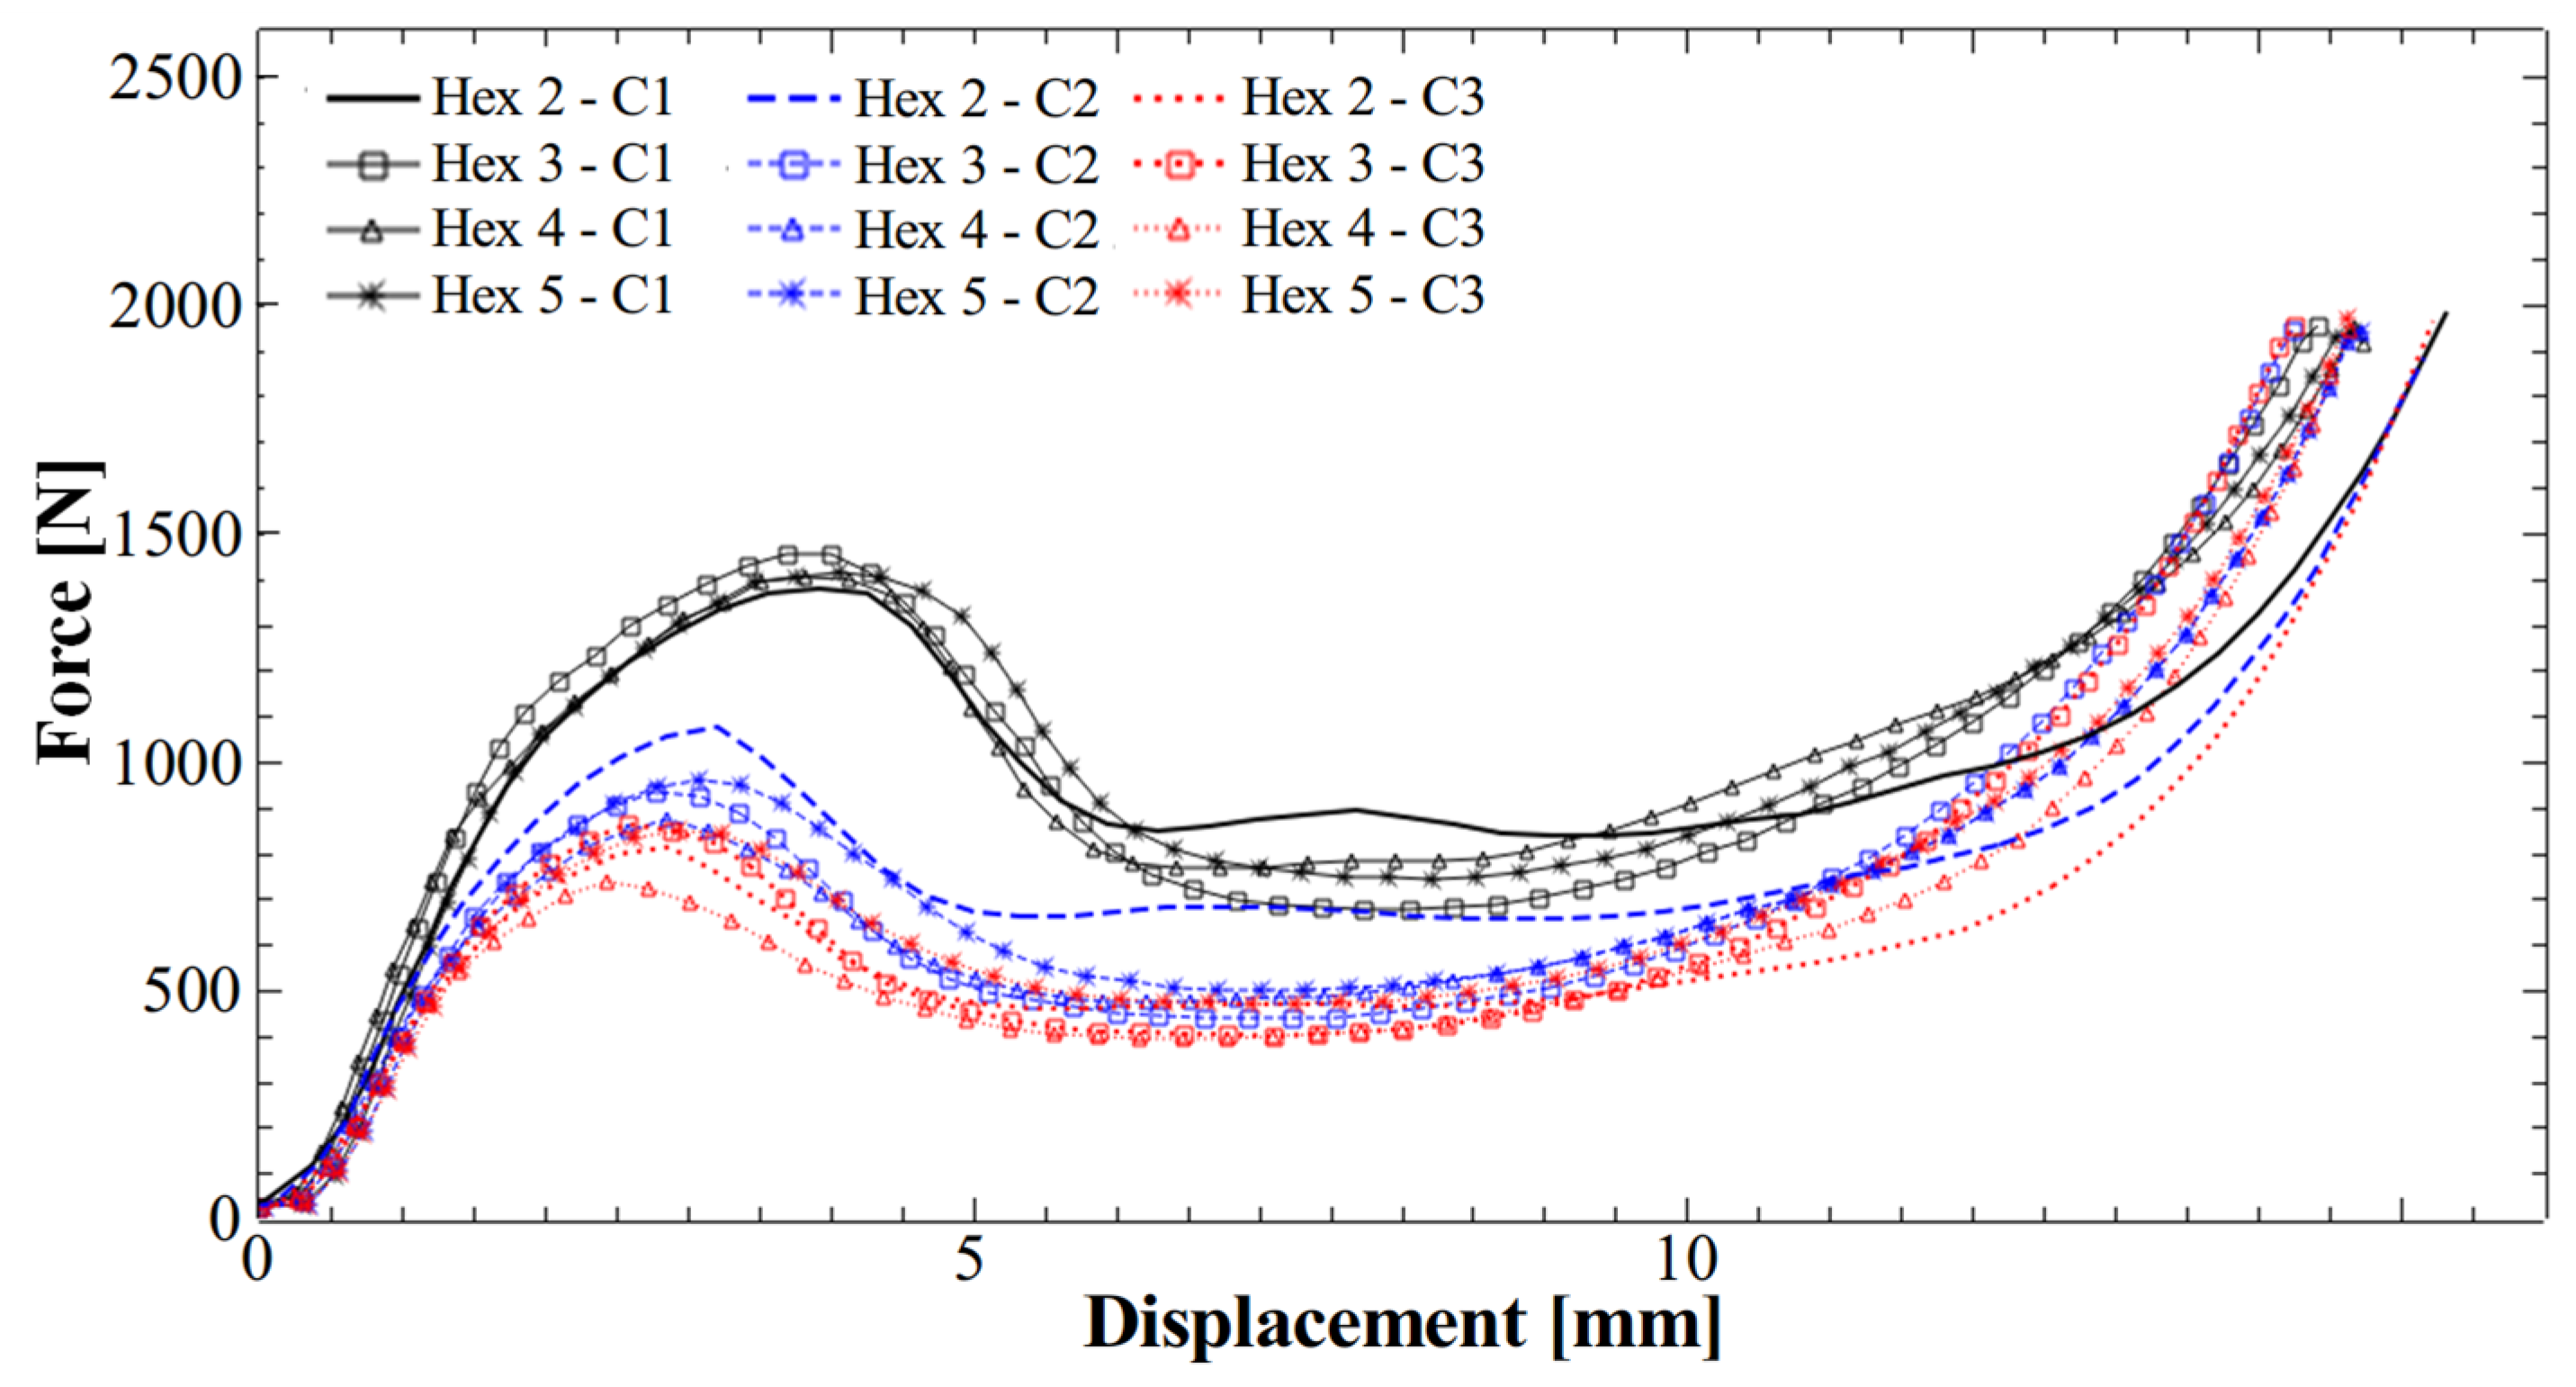
Figure 8 shows that the specific compression curves for structures with hexagonal holes remained consistent across all four samples, indicating good reproducibility. Additionally, all compression curve profiles were smooth, suggesting that the structures did not exhibit successive wall failures, even after three compression cycles. In contrast, compression curves reported in similar studies exhibited multiple peaks within the linear plateau region [
13], suggesting the compression was accompanied by gradual wall destruction.
To further evaluate the practical viability of the basic hexagonal structure, we extracted and analyzed the energy absorption efficiencies (η
abs) from the compression curves corresponding to each of the four newly fabricated samples after their first compression cycle. For a comprehensive comparison, we also included the η
abs value calculated from the initial hexagonal structure made from TPU 95A (denoted as Hex 1, based on the curves shown in
Figure 1d). These results were then compared with values reported in the literature for other energy-absorbing systems, as illustrated in
Figure 9.
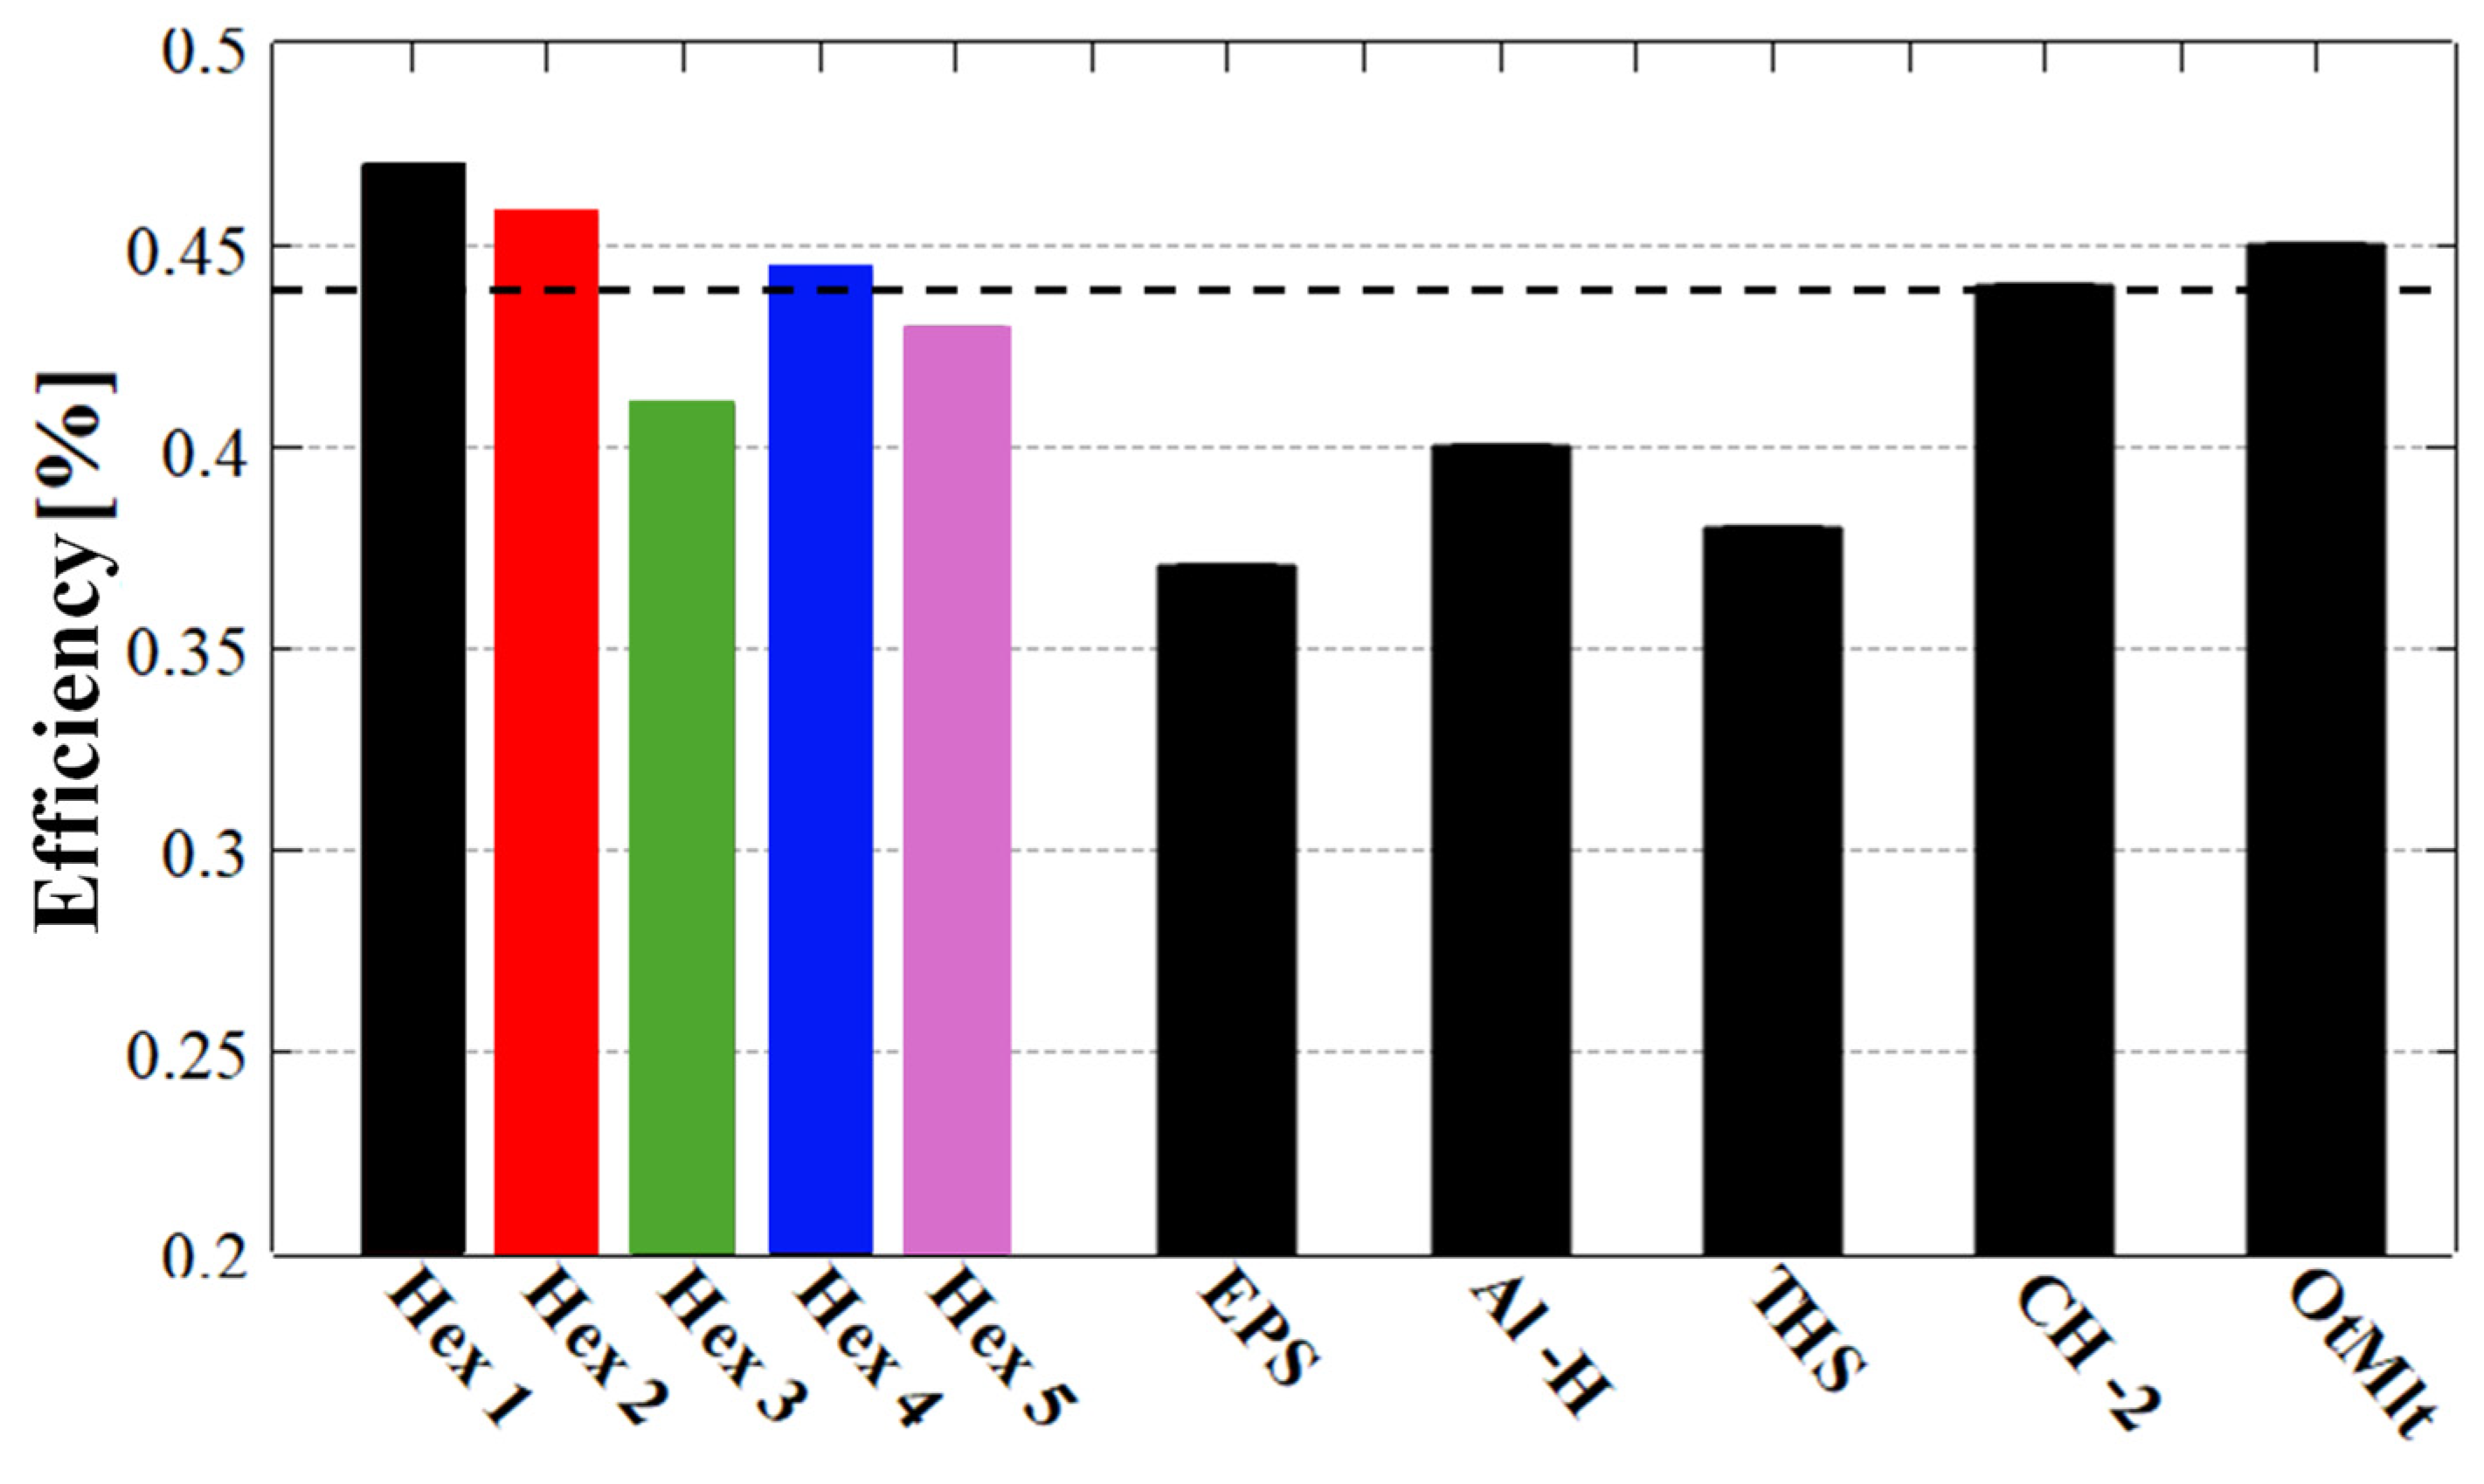
Obviously, one of our goals was to obtain ηabs values equal to or greater than those already reported for various energy absorption structures, including those manufactured using similar 3D printing methods or advanced, yet costly, techniques. Note that in the data used for comparison we also included structures that were reported as destroyable after the first compression.
Figure 9 reveals that the structures fabricated in this work are superior in terms of η
abs compared to available commercial absorption structures. For example, although the average η
abs values of our samples were similar to those reported for the CH-2 structure [
10], our structures neither failed after the first compression nor were produced using an expensive fabrication method, as was the case for the CH-2 structure.
Moreover, our results for 2D structures with hexagonal holes generally align with those obtained for octet truss macrolattice structures [
39]. The latter are 3D structures (such as TPMSor beam structures) that involve variations in shape along the sample’s growth direction and are more challenging to produce using FDM 3D printing methods. This difficulty arises because the printer’s precision depends on the nozzle size, with a typical standard nozzle diameter of 0.4 mm, which limits the resolution of finer details. Furthermore, considering the production method, the results obtained here are promising, as the approach used in this work is more cost-effective and offers considerable scalability potential compared to techniques employed in studies involving significantly more complex structures, which currently may have limited applicability for mass production.
Finally, when comparing our structures to other similar honeycomb structures reported in the literature [
28], we observed that average and maximum η
abs values of 0.44 and 0.47, respectively, are significantly higher than the reported value of 0.36. These differences can be attributed to the geometric dimensions of the basic cell and the testing setup. Specifically, we compressed our samples out-of-plane rather than in-plane, which allows for greater applicability by simply increasing the height and multiplying the basic cell or the thickness of the structure.
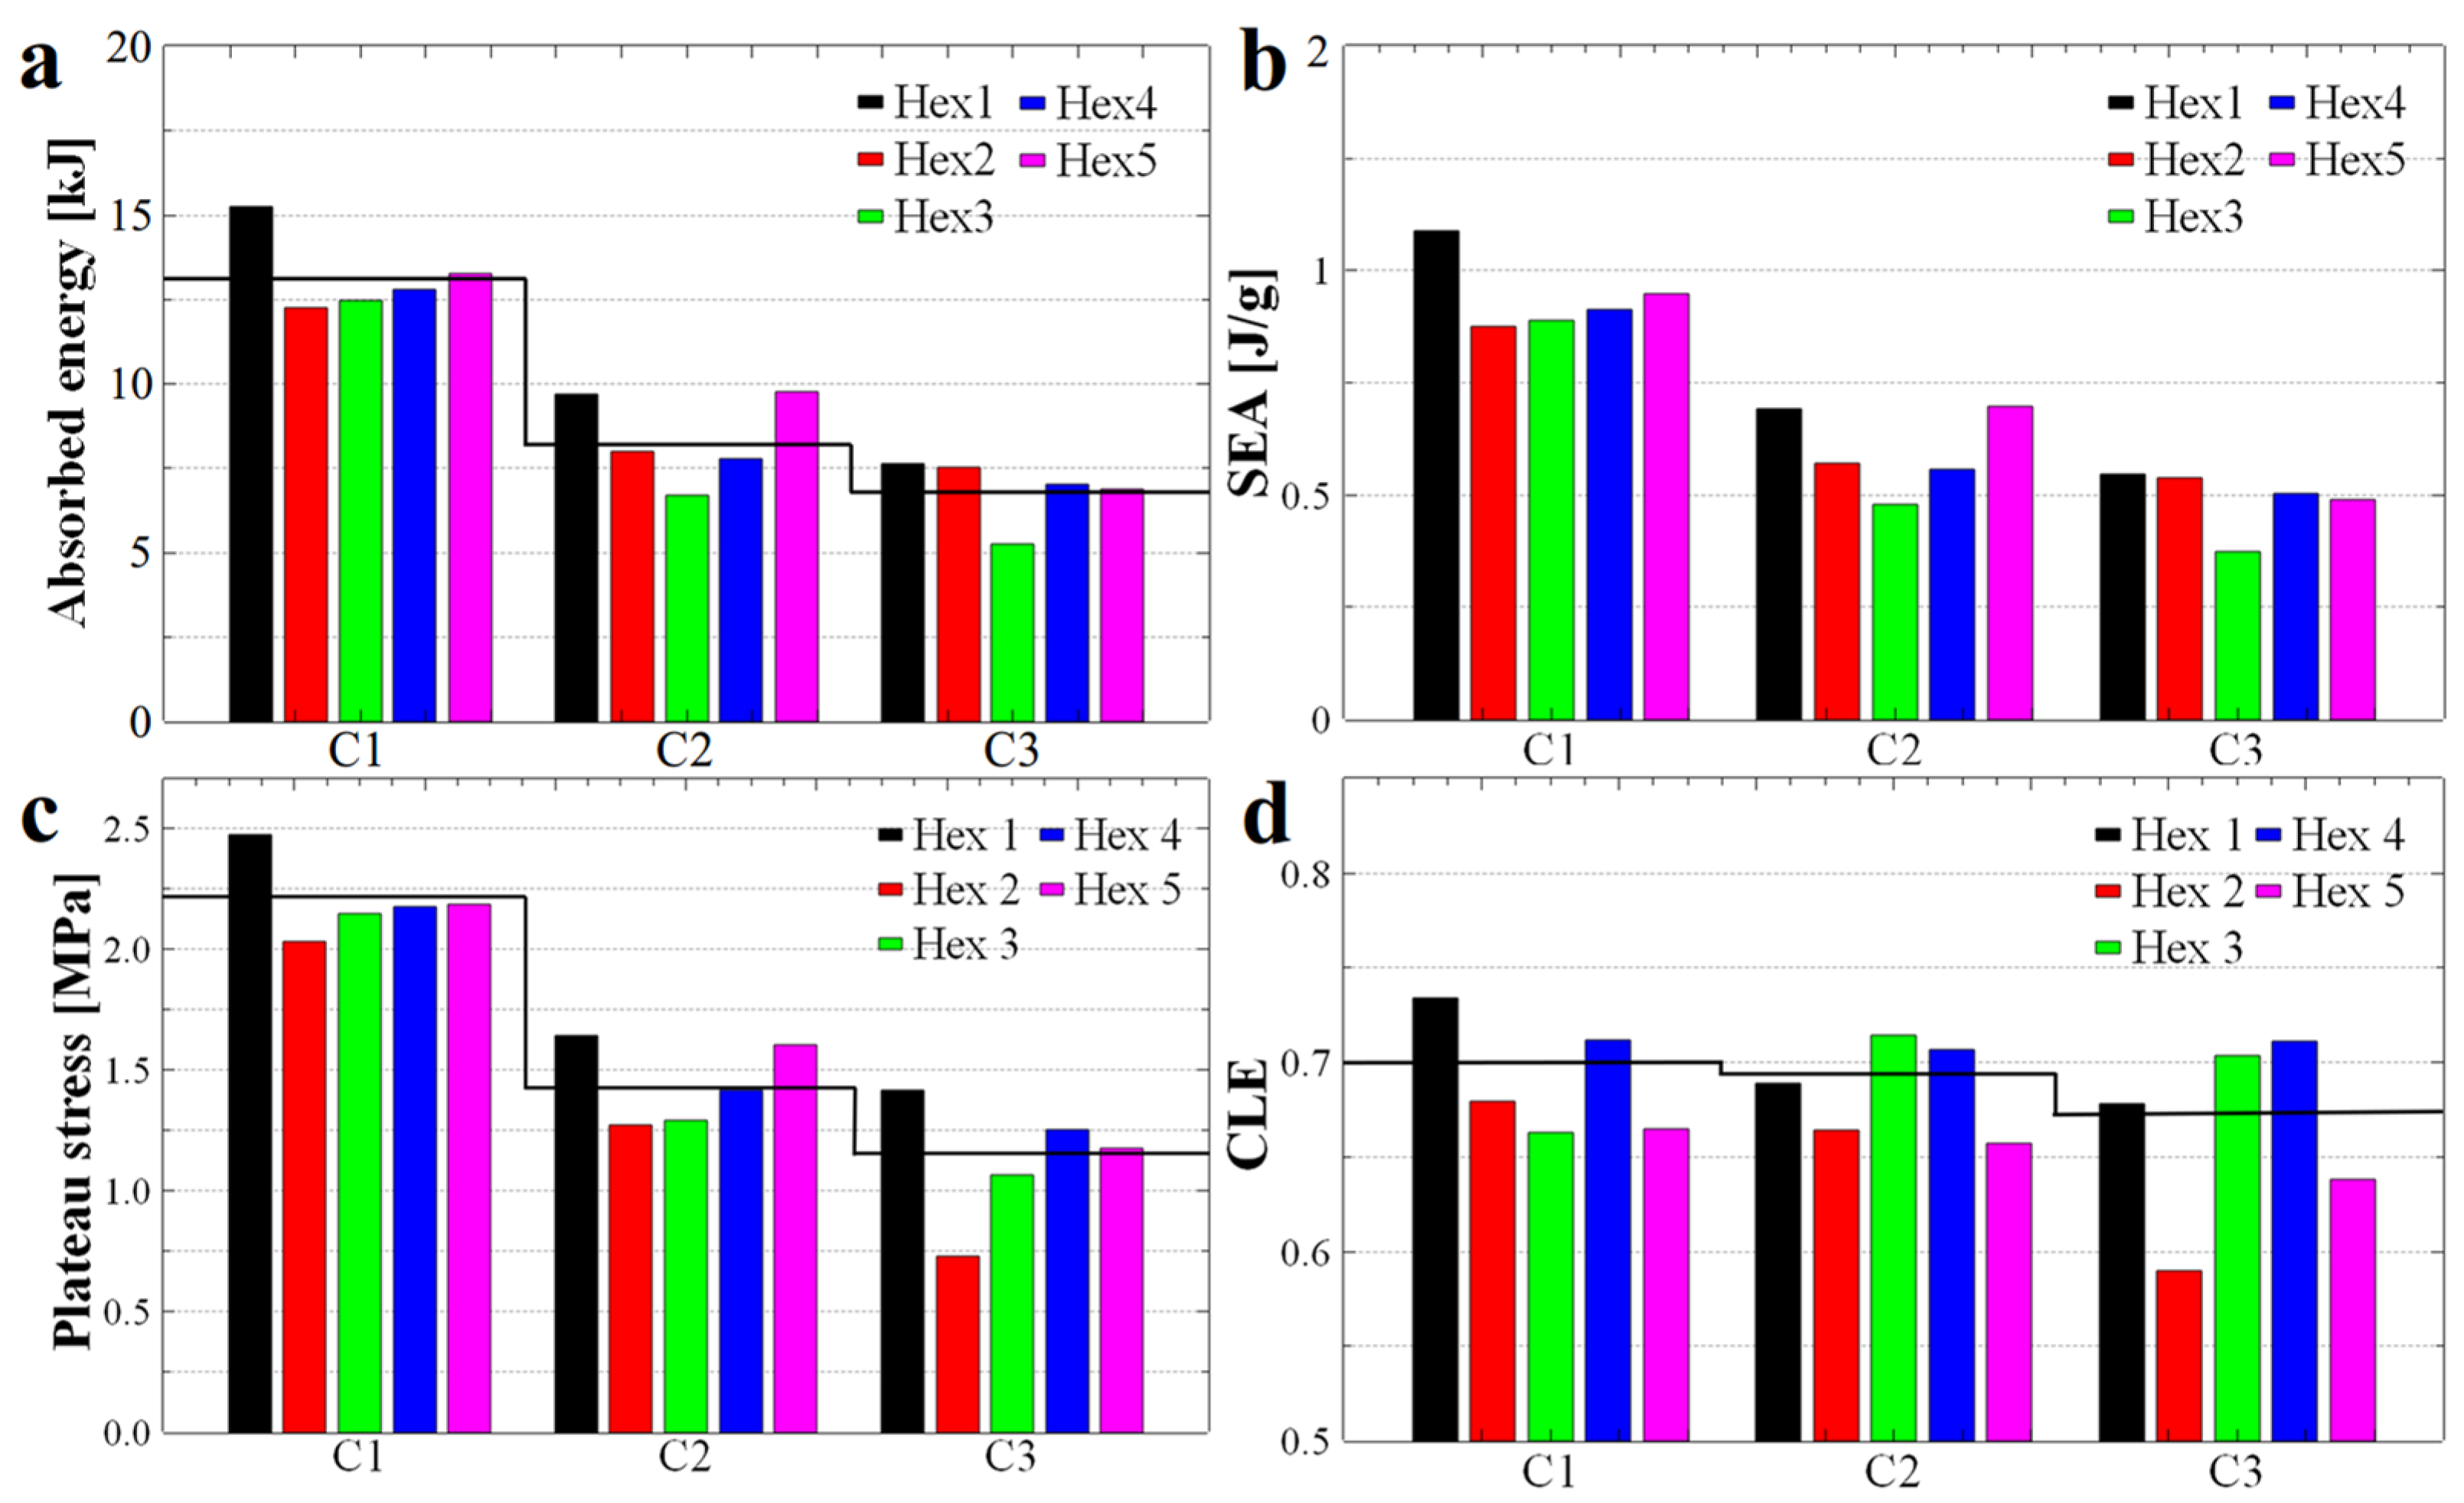
Figure 10a illustrates the histograms representing the energy absorbed by each sample after the first (C1), second (C2), and third (C3) compressions. The black line indicates the average absorbed energy. Following this line, it is immediately apparent that the greatest difference in absorbed energy (~4824 J) occurred between C1 and C2. The gap in absorbed energy between C2 and C3 was reduced to approximately ~1523 J, suggesting long-term cyclic stability and indicating the potential reusability of the structure.
Furthermore, when comparing SEA coefficient values (
Figure 10b), they are similar to those reported in the literature [
38], but superior to those of raw materials. Additionally, price of one gram of TPU 95A material is lower compared to the lighter materials used in other studies, making our structures more cost-effective and reusable. While the obtained SEA coefficient can be attributed to the material’s weight, we specifically selected this type of material for applications where the structures must withstand multiple mechanical shocks and avoid significant damage—that is, a flexible material capable of absorbing an increased amount of energy over time.
In the case of the linear plateau stress presented in
Figure 10c, we observed a steady decrease caused by the three compressions. As shown in
Figure 8, there are differences between the linear regions of the curves, which are also reflected in the values of the linear plateau stress. However, the overall shape of the curves remained similar across the different compressions, resulting in a trend of values comparable to that of energy absorption (compare
Figure 10a with
Figure 10c). In contrast, the average value of the CLE parameter (see the black line in
Figure 10d) exhibits only minor variation between compressions, with some structures even displaying a higher CLE coefficient upon the second or third compression.
The CLE coefficient represents the difference between the linear stress plateau and the maximum peak preceding the plateau. Samples composed of elastic materials typically exhibit a noticeable difference between the peak and the linear region. Additionally, an energy-absorbing structure that is damaged during compression generally dissipates energy by breaking its layers, which can reduce the difference between the peak and the linear region. In our case, such damage is minimal and imperceptible to the naked eye, as demonstrated in
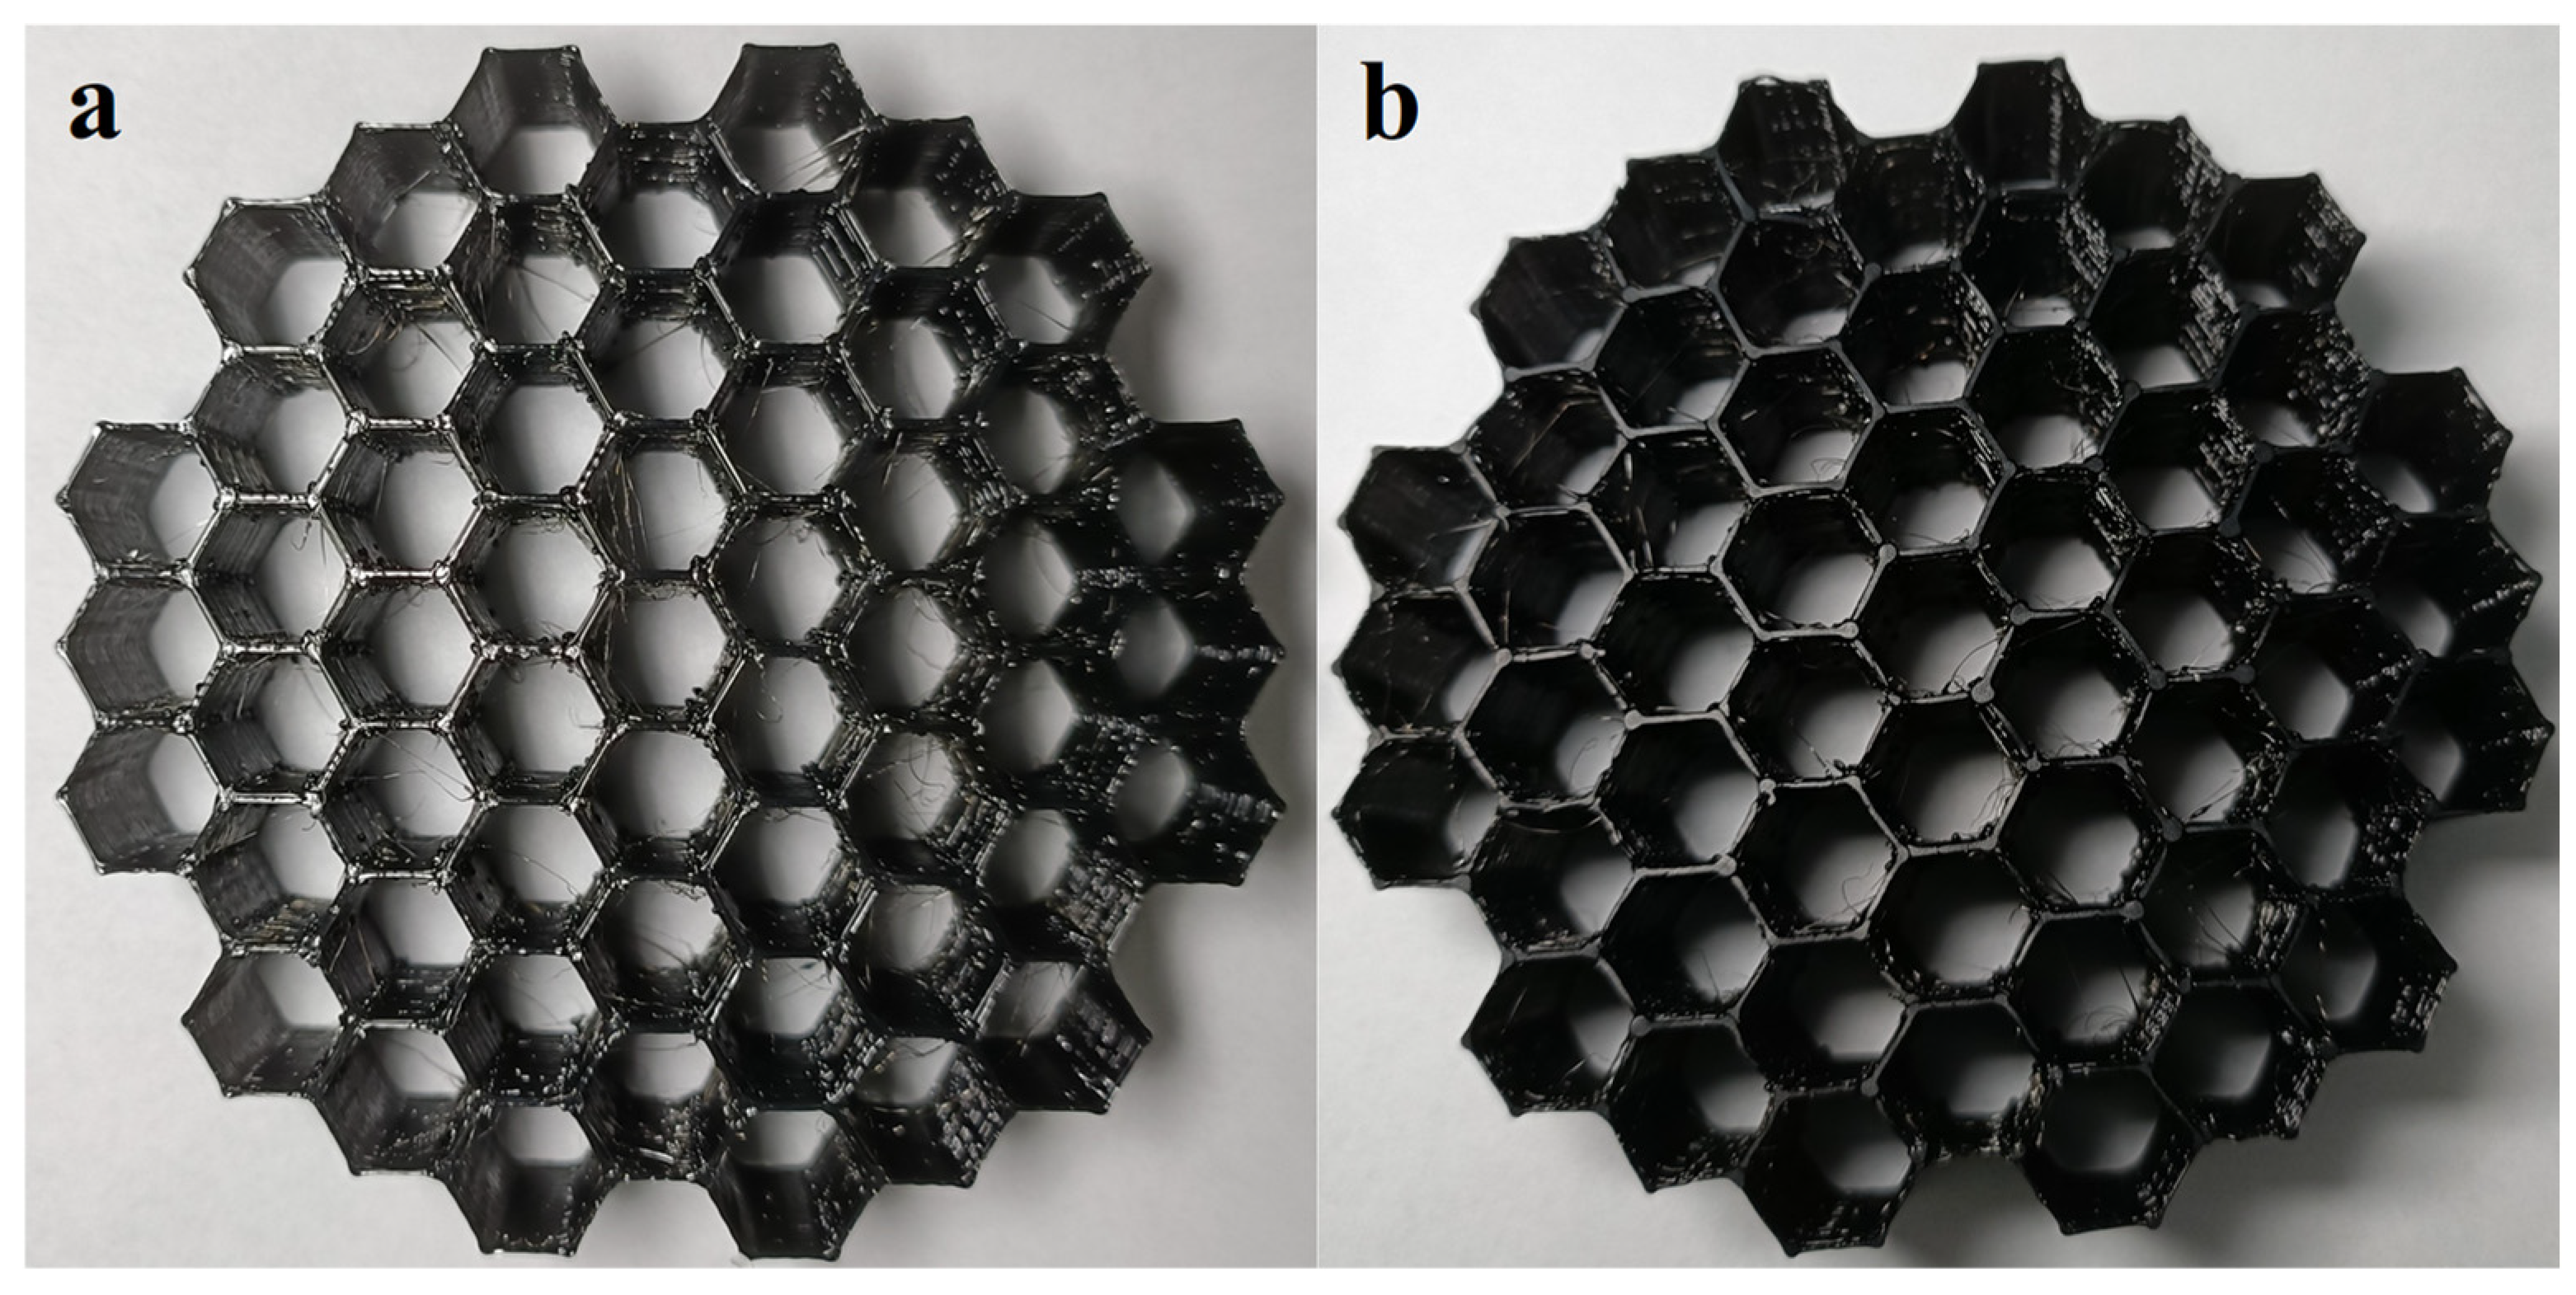
Figure 11, where one of our structures is shown before and after repeated compressions. The only observable change is a slight expansion in the linearity of the structure’s walls. Furthermore, after a thorough visual inspection of structures subjected to repeated compressions, we concluded that all compressed structures were able to return to their initial shape, without significant structural differences.
Future investigations will extend this work to high-rate dynamic impact testing to evaluate performance under realistic collision conditions. Longer-term fatigue studies, involving more than three compression cycles, are necessary to establish the lifetime and serviceability for practical applications. Exploring alternative topologies (e.g., TPMS) and hybrid material designs (such as multi-material printing and fiber reinforcement) could further optimize the balance between energy absorption and reusability. Finally, ongoing finite element simulations combined with experimental data will clarify stress distributions and guide process optimization to enhance cyclic durability.
