Abstract
For the first time, the kinetics of isothermal curing and thermal degradation of polyethylene glycol maleate (pEGM)–based systems and their composites with mineral fillers were investigated in the presence of a benzoyl peroxide/N,N-Dimethylaniline redox-initiating system. DSC analysis revealed that the curing process at 20 °C can be described by the modified Kamal autocatalytic model; the critical degree of conversion (αc) decreases with increasing content of the unsaturated polyester pEGM and in the presence of fillers. In particular, for unfilled systems, αc was 0.77 for pEGM45 and 0.60 for pEGM60. TGA results demonstrated that higher pEGM content and the incorporation of fillers lead to increased thermal stability and residual mass, along with a reduction in the maximum decomposition rate (dTGₘₐₓ). Calculations using the Kissinger–Akahira–Sunose and Friedman methods also confirmed an increase in the activation energy of thermal degradation (Ea): EKAS was 419 kJ/mol for pEGM45 and 470 kJ/mol for pEGM60, with the highest values observed for pEGM60 systems with fillers (496 kJ/mol for SiO2 and 514 kJ/mol for CaCO3). Rheological studies employing three-interval thixotropy tests revealed the onset of thixotropic behavior upon filler addition and an increase in structure recovery after deformation of up to 56%. These findings underscore the potential of pEGM-based systems for low-temperature curing and for the design of composite materials with improved thermal resistance.
1. Introduction
Modern requirements for polymer materials intended for structural and functional applications necessitate research into the synthesis and modification of high-performance thermosetting compositions with controllable rheological properties, strong adhesion, and resistance to aggressive environmental factors. Such materials are in high demand in construction, transportation engineering, as well as in the aerospace and shipbuilding industries [1,2,3,4]. Among thermosetting binders, particular attention is given to unsaturated polyester resins (UPRs), which, due to their relatively low viscosity, high reactivity, and ability to cure at moderate temperatures, form robust three-dimensional networks with excellent chemical and thermal resistance [5,6,7,8,9,10].
Most studies on UPRs have focused on systems cured with styrene or methyl methacrylate [11,12,13]. However, these monomers possess several significant drawbacks, including high volatility, toxicity, and substantial shrinkage during curing. Consequently, alternative approaches are being actively developed to reduce shrinkage deformations and improve the stability of polymer matrices. The introduction of low-shrinkage additives has proven effective in compensating for shrinkage [14]. The use of mineral fillers also makes it possible to control the viscosity, thixotropy, thermal conductivity, and thermal stability of polymer systems. Studies [15,16] have reported improvements in thixotropic properties through the incorporation of inorganic fillers. Other works [17,18] investigated the effect of mineral additives on UPRs and demonstrated the possibility of significantly modifying their rheological behavior. These findings highlight the importance and applied relevance of research aimed at developing advanced polymeric materials based on UPRs. However, despite the high potential of UPRs cured with styrene and methyl methacrylate [1,9,11,12], the number of studies involving other vinyl-containing monomers remains limited.
The use of unsaturated carboxylic acids in UPRs represents a promising research direction that requires further investigation. In particular, the copolymerization of unsaturated polyesters (UPs) with acrylic acid (AA) can significantly broaden the functionality of the resulting materials [7,10]. However, to date, no studies have addressed the influence of AA and mineral fillers on structural transformations, curing kinetics, or the rheological and thermal behavior of UPRs. The study of rheological properties is of great importance for evaluating processability, the ability of systems to recover their structure after mechanical deformation, and the optimization of processing conditions. To investigate the curing kinetics of thermosetting resins, Fourier-transform infrared spectroscopy (FTIR) [19,20,21], rheometry [22,23], and differential scanning calorimetry (DSC) [24,25,26,27] are commonly applied. Among these methods, DSC has become the most widely used tool for studying the entire curing process. During curing, the rate and degree of conversion as functions of time can be determined by approximating the exothermic effects recorded by DSC with different kinetic models [27]. The most widely applied models are the autocatalytic model proposed by Sourour and Kamal [24,27] and the modified autocatalytic model accounting for diffusion control, developed by Khanna et al. [28,29]. The literature provides some evidence on the thermal stability of UPR–AA copolymers [10,30]. However, no information is available regarding the thermal behavior of such systems with fillers in the presence of a redox-initiating system at room temperature. Data on curing kinetics and thermal stability are essential for determining processing parameters, optimizing heat-treatment conditions, and predicting the performance of the final materials under various temperature regimes.
Therefore, the aim of this study is to investigate the kinetic characteristics and thermal stability of thermosetting systems based on polyethylene glycol maleate and acrylic acid in the presence of inorganic fillers. Special attention is given to the effect of the nature and concentration of fillers (calcium carbonate and silicon dioxide) on the viscosity and thixotropic recovery of the studied systems.
2. Materials and Methods
2.1. Materials
Maleic anhydride (≥99%, Thermo Fisher Scientific, Waltham, MA, USA) and ethylene glycol (99.8%, Sigma-Aldrich, Burlington, VT, USA) were used as the starting monomers for the polycondensation reaction. Zinc chloride (≥98%, Sigma-Aldrich, Burlington, VT, USA) was employed as a catalyst in the polycondensation reaction. Acrylic acid (≥99%, Sigma-Aldrich, Burlington, VT, USA) was used as a vinyl-containing monomer for radical copolymerization with UP. Benzoyl peroxide Luperox® A75 (Sigma-Aldrich, Burlington, VT, USA) was used to initiate the radical copolymerization. N,N-Dimethylaniline (99.5%, Thermo Fisher Scientific, USA) was used as a promoter to activate the curing process in the presence of the initiator.
Calcium carbonate (≥99%, Reaktivsnab, Shymkent, Kazakhstan) and silicon dioxide (Aerosil® 300, Evonik Industries, Essen, Germany) were used as inorganic fillers.
2.2. Preparation of Polyethylene Glycol Maleate
Polyethylene glycol maleate (pEGM) was obtained by polycondensation of ethylene glycol with maleic anhydride at 423–443 K. The polycondensation was carried out according to a standard procedure in the presence of zinc chloride as a catalyst under a nitrogen atmosphere [9]. The synthesis reaction and the most probable structure of the resulting polyester are shown in Figure 1.
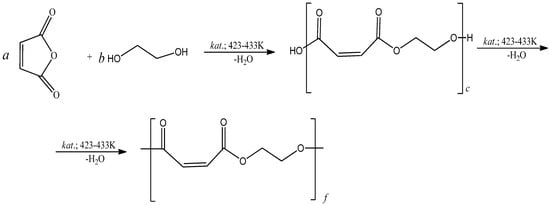
Figure 1.
Scheme of polyethylene glycol maleate formation. Where c = a + b (the formation of acidic ester); f = a + b (the formation of polyester).
2.3. Sample Preparation
An ultrasonic homogenizer (Scientz-IID, Ningbo Scientz Biotechnology Co., Ltd., Ningbo, China) was used for sample preparation: the required amounts of pEGM, acrylic acid (AA), the initiating system, and fillers were mixed at a frequency of 20–25 kHz for 30 min. The application of ultrasonic treatment ensured effective dispersion of the components and the formation of a homogeneous reaction mixture for subsequent studies and curing.
2.4. Curing of Polyethylene Glycol Maleate
Curing of the UP–AA reaction mixture was carried out by bulk radical copolymerization at various molar ratios of the comonomers, pEGM:AA: 45.3:54.7 wt.% (pEGM45) and 60.2:39.8 wt.% (pEGM60), at 20 °C in the presence of a redox initiating system consisting of benzoyl peroxide (BPO) and N,N-Dimethylaniline (DMA). The concentrations of the initiator (BPO) and the promoter (DMA) were 1% and 0.15%, respectively, relative to the total mass of the initial pEGM:AA mixture for all experiments. In addition, the filler concentrations were varied as follows: SiO2 at 5% and 10%, and CaCO3 at 15% and 30%.
2.5. Methods
2.5.1. NMR Analysis
Nuclear magnetic resonance (NMR) spectra were recorded on a Bruker Avance III 600 MHz spectrometer (VTT) in deuterated chloroform (CDCl3). All measurements were performed at room temperature.
2.5.2. Gel-Permeation Chromatography
The molecular weight of the synthesized pEGM was determined by gel permeation chromatography (GPC) using a Malvern chromatograph equipped with a Viscotek 270 dual detector (Malvern Instruments Inc., Bristol, UK), yielding an average molecular weight of approximately 1728 Da. Polystyrene was used as the calibration standard, and dioxane was employed as solvent [10].
2.5.3. Rheological Analysis
The rheological properties of the pEGM-based systems were investigated using an MCR 302e rheometer (Anton Paar, Graz, Austria). Before the measurements, the samples were carefully mixed and allowed to rest for 5 min to release residual stresses induced during preparation. Each experiment was repeated at least three times to ensure reproducibility, and the deviation between parallel measurements did not exceed 5%. During the experiments, viscosity–shear rate curves were obtained, and a three-interval thixotropy test was performed in rotational mode to monitor structural recovery [31]. The measurements were carried out using a CP-40 measuring system (plate diameter 40 mm, gap height 0.08 mm). Structural recovery tests generally comprise three consecutive stages designed to determine the material’s ability to restore its structure after shear-induced breakdown. In the first stage, a low shear stress not exceeding the yield point was applied to the sample. In the second stage, a shear stress above the yield point was applied to break down the internal structure of the material. In the final stage, the stress was reduced to its initial low value, and structural recovery was monitored over a set period of time. Thixotropic measurements were performed in a controlled shear rate mode [32].
- Interval I (0–30 s): low shear rate (γ˙ = 0.1 s−1), allowing determination of the initial viscosity in the quiescent state;
- Interval II (30–60 s): high shear rate (γ˙ = 1000 s−1), simulating an external load that disrupts the material structure;
- Interval III (60–110 s): return to a low shear rate (γ˙ = 0.1 s−1), aimed at determining the material’s ability to restore its viscosity and, consequently, its internal structure.
All rheological tests were carried out at 20 °C, prior to the onset of curing, in the presence of the BPO/DMA redox initiating system. Temperature control of the system was maintained in a convection oven equipped with Peltier elements. The rheometer operation and data acquisition were performed using RheoCompass™ software 1.35.1394 (Anton Paar).
2.5.4. Differential Scanning Calorimetry (DSC)
The thermal effects of the pEGM curing reaction were studied by DSC using a Labsys Evolution TG-DTA/DSC simultaneous thermal analysis system (Setaram Instrumentation, Caluire, France). A reaction mixture (95–100 mg) consisting of pEGM with AA, fillers, and the BPO/DMA redox initiating system was placed in open alumina crucibles and loaded into the calorimeter’s measuring cell. The tests were carried out under isothermal conditions at 20 °C in a nitrogen atmosphere. The curing reaction was considered complete when the exothermic curve returned to the baseline. The total area under the exothermic curve, calculated from the extrapolated baseline at the end of the reaction, was used to determine the isothermal heat of curing () [33].
The degree of curing () is expressed as:
where
is the residual reaction enthalpy obtained from dynamic scanning of the isothermally cured sample.
After completion of the isothermal experiment, the DSC cell was rapidly cooled to room temperature, and after stabilization, the residual heat of curing () was measured until no exothermic effect was observed. The value was recorded in dynamic mode at a heating rate of 10 °C/min over a temperature range from 20 °C to 200 °C.
The enthalpies were obtained by integrating the DSC exotherm and normalized to the mass of the reactive pEGM:AA mixture.
Each experiment was conducted three times. The kinetic parameters were calculated based on the resulting data and are presented as mean values with standard deviations, ensuring the reliability and reproducibility of the results.
The isothermal curing kinetics of the pEGM45 and pEGM60 systems at 20 °C were analyzed using the Kamal autocatalytic model according to Equation (3) [26,27]:
where
is the degree of curing,
and are the apparent rate constants corresponding to the Arrhenius law,
and are the kinetic reaction orders.
In the present study, the parameters , , and were determined by fitting the experimental data using a graphical method and nonlinear curve fitting. The constant can be calculated from the initial reaction rate at = 0.
Equation (3) can be rewritten as:
The value of n can be obtained from the slope of the plot of versus .
Equation (3) can also be expressed as:
Plotting the left-hand side of Equation (5) as a function of yields a straight line, from whose slope and intercept the values of m and can be determined, respectively.
2.5.5. IR-Spectroscopy
FTIR (Fourier Transform Infrared Spectroscopy) spectra of the samples were recorded on a Thermo Fisher Scientific Nicolet iS50 FTIR spectrometer (Waltham, MA, USA) (4 cm−1 resolution, Happ–Genzel apodization) in the ranges 400–4000 cm−1 (KBr beamsplitter) and 100–1800 cm−1 (Solid Substrate™,Thermo Fisher Scientific, Waltham, MA, USA). Measurements were carried out using the ATR technique with a diamond crystal, and standard ATR correction was applied to the recorded spectra [34].
2.5.6. Thermogravimetric Analysis (TGA)
The thermal properties of the systems under study were investigated using a Labsys Evolution TG-DTA/DSC simultaneous thermal analysis instrument (Setaram Instrumentation, Caluire, France) in dynamic mode over a temperature range of 20–600 °C. The samples were heated in Al2O3 crucibles at heating rates of 5, 10, and 20 °C/min in a nitrogen atmosphere with a flow rate of 30 mL/min. Calibration of the instrument for thermogravimetric measurements and heat flow was carried out using CaCO3 and indium (In) standards, respectively. Each measurement was performed in triplicate.
The kinetics of thermal decomposition are generally expressed by the following equation [35,36]:
The resulting equation provides the basis for differential kinetic methods. The right-hand side of Equation (6) cannot be solved analytically; therefore, various approximation methods are used in practice. The Friedman differential method was derived using an isoconversional approach to Equation (6), the results of which are presented in [37,38]:
The subscript i is introduced to denote different temperature programs. Ta,i is the temperature at which the conversion (α) is reached for temperature program i. As a result, Equation (7) assumes that Ta,i changes linearly over time at a heating rate βi.
There are several integral isoconversional methods that differ in the approximation of the temperature integral in Equation (7). The Murray and White approximation yields B = 2 and C = 1, which leads to another well-known equation, often referred to as the Kissinger–Akahira–Sunose equation [37,38,39,40]:
The activation energy for different degrees of conversion is calculated from the slope of the plot of versus 1/T.
3. Results and Discussion
3.1. Curing of pEGM: AA Systems
1H and 13C NMR spectroscopy was used to characterize the synthesized pEGM. Analysis of the 1H NMR spectrum (Figure 2) revealed signals corresponding to protons of various functional fragments within the polymer structure. Characteristic chemical shifts were identified, confirming the presence of vinyl, methylene, and carbonyl groups. In the interpretation and quantitative evaluation of the oligomer structure, the presence of several types of protons was taken into account.
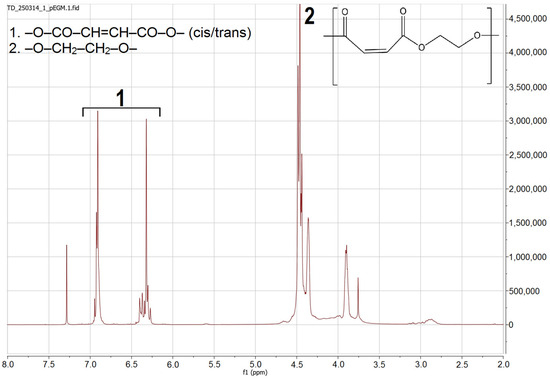
Figure 2.
1H NMR spectrum of pEGM.
In the region of δ 6.20–6.40 ppm, a signal corresponding to the vinylic protons of the maleate units –O–CO–CH=CH–CO–O– is observed, appearing as an almost singlet due to symmetry. The vinylic protons of the fumarate units (trans-isomer formed through thermal isomerization of maleate fragments) are detected at δ 6.70–7.00 ppm. The main broad signal at δ 4.30–4.70 ppm corresponds to the methylene protons –O–CH2–CH2–O– adjacent to the ester groups, which represent the polyester matrix.
The 13C NMR spectrum (Figure 3) displays three groups of resonance signals corresponding to different types of carbon atoms in the pEGM structure. Signals in the δ 164–169 ppm region are attributed to the carbonyl carbons of the ester groups(–O–CO–) in maleate/fumarate units, with two closely spaced resonances arising from cis/trans environments. The vinylic carbons (–CH=CH–) appear at δ 127–137 ppm, confirming the presence of unsaturated segments within the polymer structure. Signals in the δ 62–66 ppm range correspond to methylene carbons (–O–CH2–CH2–O–) of the ethylene glycol chain. The intense solvent peak of CDCl3 is observed at δ 77.0 ppm. The overall set of signals verifies the structure of the unsaturated polyester based on maleate/fumarate units and indicates the absence of residual anhydride.
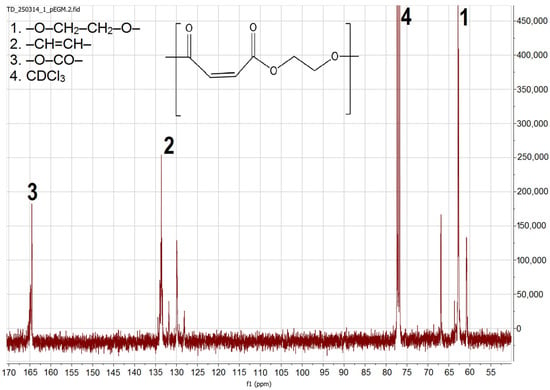
Figure 3.
13C NMR spectrum of pEGM.
Figure 4 presents the scheme of the radical copolymerization reaction of pEGM with AA. Curing of UPRs based on pEGM is carried out at 20 °C in the presence of the BPO/DMA redox initiating system.
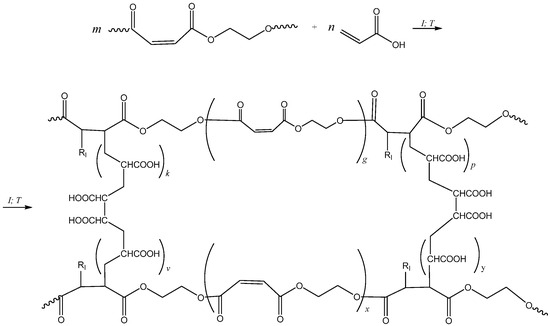
Figure 4.
Synthesis scheme of the pEGM–AA system. RI denotes the initiator radical.
3.2. Results of Rheological Analysis
The rheological properties of binder materials determine many performance characteristics of composite materials, such as paints and coatings, sealants, adhesives, and others [2]. In the quiescent state, these materials should have sufficiently high viscosity to prevent spontaneous spreading. However, under external mechanical action, their viscosity should decrease, ensuring ease of processing and application. Another important factor is the ability of the material to rapidly restore its initial viscosity after the load is removed. In this context, the rheological characteristics of the systems under study were investigated. In particular, the dependence of viscosity on shear rate and the thixotropic properties were examined. Viscosity recovery tests were carried out in a three-interval mode, comprising shear-induced structural breakdown, subsequent recovery, and final stabilization.
Figure 5 shows the plots of apparent viscosity versus shear rate for the pEGM45 and pEGM60 systems and their compositions with fillers.
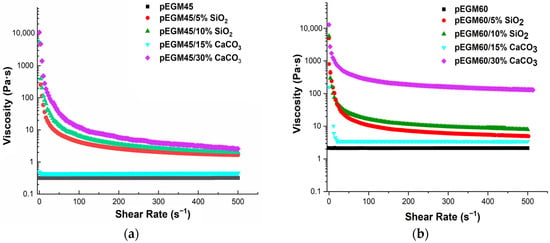
Figure 5.
Viscosity–shear rate dependence for the systems: (a) pEGM45; (b) pEGM60.
Silicon dioxide and calcium carbonate were used as fillers, with concentrations chosen according to their nature and activity. Silicon dioxide is a lightweight, finely dispersed filler with a high specific surface area. It exhibits a pronounced structuring effect even at 5% (the lower boundary of the percolation region) [41]. The upper boundary of the percolation range for silicon dioxide is approximately 10%, corresponding to the so-called “saturation concentration”. In contrast, macrodisperse and inert calcium carbonate exhibit a noticeable effect only at substantially higher concentrations. Thus, in [42] it was reported that the mechanical properties of the composite vary at CaCO3 concentrations ranging from 10 to 50%, with substantial modifications already observed at levels up to 40%. Similarly, in a study on CaCO3-filled composites [43] filler loadings of up to 35% were employed. These findings support the methodological rationale for selecting such ranges of filler contents.
The obtained rheograms show that the pEGM45 and pEGM60 systems without fillers exhibit Newtonian behavior, with a constant viscosity value over the investigated shear rate range, indicating the absence of structural changes in the flow. This is attributed to the relatively low molecular weight of the polyester synthesized by us [44]. The comparatively short polyester chains do not provide sufficient interchain entanglement [45], which limits the structuring of the system. This behavior is consistent with Newton’s law of viscosity [46] (τ = η · ẇ), where η is the dynamic viscosity.
The incorporation of silicon dioxide into the pEGM45 and pEGM60 systems results in the appearance of pseudoplastic behavior, in which viscosity decreases with increasing shear rate. This effect is more pronounced at an SiO2 concentration of 10% than at 5%. The pronounced decrease in viscosity with increasing shear rate confirms that SiO2 forms a three-dimensional network [47] that breaks down under shear. This behavior is described by the Ostwald–de Waele power-law model (, n < 1).
Calcium carbonate at concentrations of 15% and 30% has different effects on the rheological characteristics of the systems. It is noteworthy that pEGM45/15% CaCO3 retains Newtonian behavior with constant viscosity, indicating the absence of significant interparticle interactions in the system. The pEGM60/15% CaCO3 system exhibits behavior close to that of Newtonian liquids: at low shear rates, a slight decrease in viscosity is observed, followed by a constant viscosity over the entire shear rate range. This indicates a low degree of structural organization, which may be attributed both to the relatively low filler concentration and to the absence of specific interactions between calcium carbonate and the polymer matrix. This effect may be associated with the breakdown of filler aggregates formed in the system under static conditions. Under shear, these aggregates are disrupted, leading to a reduction in the degree of structuring and a decrease in viscosity [48]. At this filler content, the aggregates do not form a stable three-dimensional network capable of responding to shear deformation. As a result, the flow remains uniform and independent of the applied shear rate.
The pEGM45/30% CaCO3 and pEGM60/30% CaCO3 systems exhibit pseudoplastic behavior, with viscosity decreasing as the shear rate increases. A reduction in viscosity is observed across the entire shear rate range as deformation increases. This may be attributed to the formation of a partial structural network resulting from dense packing and physical contact between filler particles at high calcium carbonate content. The low AA content in pEGM60 reduces the likelihood of forming intermolecular interactions between the matrix and the filler, which also facilitates shear-induced breakdown. Taken together, these factors lead to reduced flow resistance and the manifestation of pseudoplastic liquid behavior.
Thus, the rheological properties of the modified compositions under study depend significantly on both the composition of the pEGM systems and the nature and concentration of the filler. Silicon dioxide has a high specific surface area and the ability to engage in interparticle interactions through the formation of hydrogen bonds. The introduction of this filler promotes the formation of a three-dimensional network structure that is sensitive to shear deformation. This results in pseudoplastic behavior, which becomes more pronounced with increasing SiO2 concentration.
Calcium carbonate does not significantly affect the rheological properties of pEGM systems. At a CaCO3 concentration of 15%, its interaction with the pEGM polymer matrix is minimal, resulting in the retention of Newtonian behavior in the solution. At a CaCO3 concentration of 30%, a weak structure is formed due to hydrogen bonding between CaCO3 particles and AA, leading to pseudoplastic behavior. However, as the AA content decreases, the number of possible interactions is reduced, which manifests as a weakly pronounced pseudoplastic effect in the pEGM60/30% CaCO3 system.
The obtained data show that variation in composition, primarily in the content of functional groups capable of interacting with the filler, makes it possible to control the rheological properties of the system, which is important for producing materials with the desired characteristics.
Figure 6 presents the results of the three-interval thixotropy test. The studies were carried out for systems that exhibited pseudoplastic behavior.
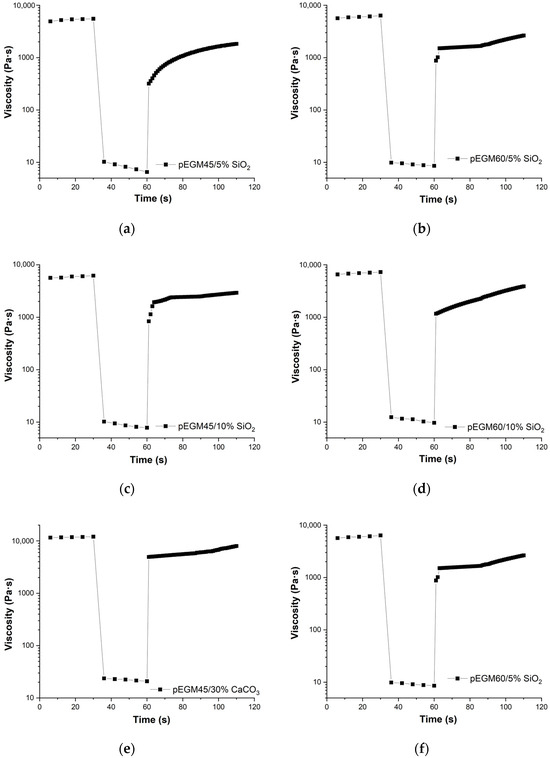
Figure 6.
Rheograms from the three-interval thixotropy test for pEGM-systems: (a) pEGM45/5% SiO2, (b) pEGM60/5% SiO2, (c) pEGM45/10% SiO2, (d) pEGM60/10% SiO2, (e) pEGM45/30% CaCO3, (f) pEGM60/5% CaCO3.
Three-interval thixotropic tests in rotational mode made it possible to quantitatively assess the dynamics of shear-induced breakdown and recovery in the pEGM polymer compositions. Figure 6 shows the viscosity–time curves for the pEGM45 and pEGM60 systems containing 5% and 10% SiO2, as well as 30% CaCO3. The viscosity changes over time display three distinct stages characteristic of thixotropic behavior: high initial viscosity, a sharp decrease at high shear rates, and partial recovery after returning to low deformation.
The results (Figure 6) showed that all studied formulations exhibited thixotropic properties, characterized by varying degrees of viscosity recovery after high-shear deformation.
The pEGM45/5% SiO2 and pEGM60/5% SiO2 systems exhibited structural recovery values of 25% and 28%, respectively. For the pEGM45 and pEGM60 systems with an SiO2 concentration of 10%, the recovery values were higher, at 35% and 40%, respectively. The presence of thixotropic properties is attributed to the formation of hydrogen bonds between SiO2 particles and the carboxyl groups of AA. In addition, SiO2 particles can form bonds with each other. Such interactions may lead to the formation of a temporary three-dimensional network structure that is disrupted under shear and re-forms in the quiescent state [49]. Thus, as the silicon dioxide content increases, the degree of structural recovery also increases.
The solutions containing calcium carbonate demonstrated the highest structural recovery values. The pEGM45/30% CaCO3 and pEGM60/30% CaCO3 samples had recovery values of 50% and 56%, respectively. This is explained by the fact that the high viscosity of the calcium carbonate-containing systems stabilizes the dispersed structure and reduces particle mobility, thereby promoting more effective structural recovery [34]. It should be noted that these results represent the degree of structural recovery 30 s after the start of the third interval; complete or more pronounced recovery may occur over a longer period.
3.3. Isothermal and Dynamic DSC Results
The kinetic parameters of the curing reaction for the pEGM45 and pEGM60 systems and their compositions with fillers were studied by DSC [50,51]. During the curing of thermosetting polymers, several processes may be observed, including the induction period, gelation, vitrification, thermal degradation, and others [50,52].
Figure 7 shows the isothermal curing thermograms of the pEGM samples at 20 °C. Analysis of the DSC results indicates that the composition of the formulation has a significant effect on the curing reaction kinetics. At the initial stage, after the introduction of the BPO/DMA redox initiating system into the reaction mixture, an induction period is observed during which polymerization is negligible. During this period, the properties of the composition change only slightly. This is followed by the active phase of copolymerization, the rate of which, as well as the duration of the induction period, is determined by the rate of free radical formation, the temperature of the medium, and the monomer ratio in the initial mixture.
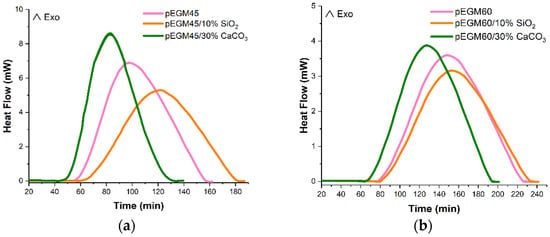
Figure 7.
Isothermal DSC thermograms of the curing process for (a) pEGM45; (b) pEGM60.
Table 1 presents the thermal characteristics of the curing process for pEGM-based systems with varying AA content and inorganic fillers. According to the DSC results, the pEGM45 systems are characterized by higher degrees of conversion compared to pEGM60. The pEGM45 systems exhibit higher reactivity, indicating a more complete curing reaction at 20 °C.

Table 1.
Reaction heats obtained from isothermal and dynamic DSC curves.
The thermal effects of the curing reaction depend on the pEGM:AA ratio and the type of filler. The pEGM45 systems are characterized by a higher total heat effect (∆Htot) than the pEGM60 formulations. In addition, the degree of curing (α) for pEGM45 is 0.84, which is significantly higher than that for pEGM60 (0.67).
As noted above, the introduction of fillers affects the thermal characteristics. The presence of silicon dioxide and calcium carbonate fillers reduces the total heat release (∆Htot). This reduction in ∆Htot may be attributed to a decrease in the concentration of reactive groups as a result of filler incorporation. The addition of silicon dioxide to the pEGM45 system reduces the total heat of reaction to 273.17 J/g, while the addition of calcium carbonate decreases it to 280.21 J/g. However, the degree of curing remains almost unchanged, at 0.83 and 0.82, respectively. A similar pattern is observed for the pEGM60 system: silicon dioxide lowers ∆Htot to 266.59 J/g, and calcium carbonate to 272.21 J/g, while the degree of curing remains at 0.66 and 0.65, respectively. These data indicate that the pEGM45-based systems are more thermoreactive compared to the pEGM60 systems. It should be noted that the nature of the fillers influences the curing time. As evidenced by the thermograms (Figure 7), silica slightly delays the curing process of pEGM compositions compared with the unfilled systems. This retardation is caused by adsorption of the initiator or accelerator on the filler surface, which reduces the concentration of active components in their free form and hinders the initiation of radical polymerization. In addition, radical inhibition occurs due to interactions between free radicals and the silicon dioxide surface.
Calcium carbonate slightly accelerates the curing process (Figure 7). One possible reason is the pH of the medium at the filler surface: calcium carbonate exhibits mildly basic surface properties [48], which promote faster decomposition of the initiator in the presence of the promoter. As a result, active species (radicals) that initiate polymerization are generated more rapidly, leading to a more active curing process.
The Kamal autocatalytic model was used to describe the isothermal curing process and evaluate the kinetic parameters of the pEGM systems. Table 2 presents the values of the parameters k1, k2, m and n, calculated using the above-described method for the pEGM45 and pEGM60 systems. As can be seen, these parameters depend on the composition of the reaction mixtures. To assess the validity of the model, the experimental data were compared with theoretical curves calculated using the Kamal autocatalytic model. The curves obtained with the autocatalytic model and the parameters from Table 2 were plotted for comparison with the experimental results (Figure 8). At the initial curing stages, when chemical control predominates, the autocatalytic model shows good agreement with the experimental data. However, at later stages of the process, deviations are observed, indicating a transition to a diffusion-controlled regime. As the curing reaction of the studied systems proceeds, gelation and vitrification occur due to an increase in viscosity, crosslink density, and the molecular weight of the UPR. The post-gel stage is associated with the possible onset of diffusion control in the curing kinetics of UPRs [53,54,55].

Table 2.
Kinetic parameters of the isothermal curing of pEGM-systems at 20 °C.
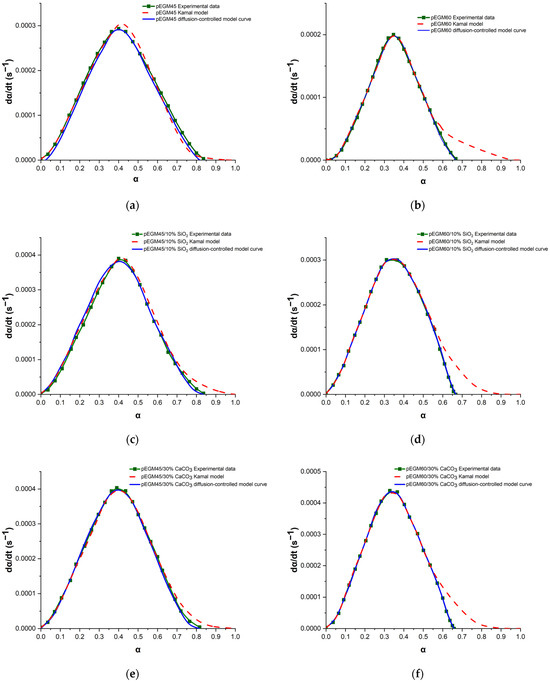
Figure 8.
Plots of dα/dt versus α for the pEGM-systems: (a) pEGM45, (b) pEGM60, (c) pEGM45/10% SiO2, (d) pEGM60/10% SiO2, (e) pEGM45/30% CaCO3, (f) pEGM60/30% CaCO3.
To account for the effect of diffusion control at the later stages of curing, a diffusion factor f(α) was introduced into the Kamal autocatalytic model [56,57]:
where f(α) is given by:
where
C is the modification constant,
αc is the critical degree of curing determined by the glass transition temperature (Tg) of the system. The value of f(α) can be obtained by dividing the experimental data by the values calculated using the Kamal model. The parameters C and are determined by fitting the data according to Equation (10).
Figure 8 shows the dependence of the conversion rate (dα/dt) on the degree of curing (α) for the pEGM45 (a) and pEGM60 (b) systems obtained at 20 °C. The experimental data (square markers) are compared with theoretical curves calculated using the Kamal autocatalytic model (dashed red line) and the modified model accounting for diffusion limitations (solid blue line) in accordance with Equation (9).
For the pEGM45 system (Figure 8a), the maximum degree of curing reaches αmax ≈ 0.84, with the Kamal model showing good agreement with the experimental data in the initial and intermediate conversion regions. However, at the final stage (αc ≈ 0.77), a slight deviation is observed: the autocatalytic model overestimates the conversion rate, whereas the modified model incorporating the diffusion factor f(α) more accurately reflects the observed slowdown. This indicates the onset of diffusion limitations at the later stage of curing.
For the pEGM60 system (Figure 8b), the degree of conversion is lower (αmax≈ 0.67), and the influence of diffusion is significantly more pronounced. The Kamal model substantially overestimates the conversion rate at αc ≈ 0.60, whereas the modified model accurately reproduces the shape of the experimental curve across the entire range. This indicates pronounced vitrification or an increase in viscosity, which limits the mobility of the reactants and leads to diffusion-controlled curing.
Thus, in both systems, diffusion-induced slowdown is observed at the later curing stages, requiring the inclusion of an appropriate correction factor in the model. The application of the modified model with f(α) makes it possible to adequately describe the curing kinetics under both moderate and pronounced diffusion limitations.
It should be noted that the kinetic behavior of the systems containing fillers (SiO2 and CaCO3) also conforms to the modified autocatalytic model that accounts for diffusion limitations (Figure 8c–f). The presence of fillers leads to a decrease in the critical degree of conversion (αc) due to several factors. First, the filler particles act as physical barriers, hindering the free diffusion of monomers and radicals within the reaction medium, which results in local restrictions on the mobility of polymer chains. Second, filler surfaces may adsorb initiators, monomers, and low-molecular-weight reaction products, thereby reducing the effective concentration of reactive groups in the resin volume. Third, the presence of a solid dispersed phase increases the effective viscosity of the system, accelerating the onset of diffusion-controlled behavior during the post-gel stage [58].
For systems containing silicon dioxide (Figure 8c,d), which possesses a high specific surface area and the ability to form hydrogen bonds with polar groups, the retardation of curing is more pronounced due to specific interactions between the filler particles and the functional groups of the polymer matrix [59]. In the case of calcium carbonate (Figure 8e,f), the determining factor is its high loading level (15–30%), which results in a pronounced increase in viscosity and a reduction in the free volume available for the reaction [60]. Thus, the presence of fillers shifts the critical degree of conversion to lower values and enhances the manifestation of diffusion control, which must be taken into account when describing the kinetics and modeling the curing behavior of composite materials.
To characterize the chemical structure of the synthesized polymer systems and their compositions, IR spectroscopy was performed in the mid-frequency range. Figure 9 presents the IR spectra of the pEGM45 sample without filler and the pEGM45/10% SiO2 and pEGM45/30% CaCO3 compositions. The analysis of the spectra reveals the presence of chemical groups characteristic of both the polymer matrix and the incorporated fillers.
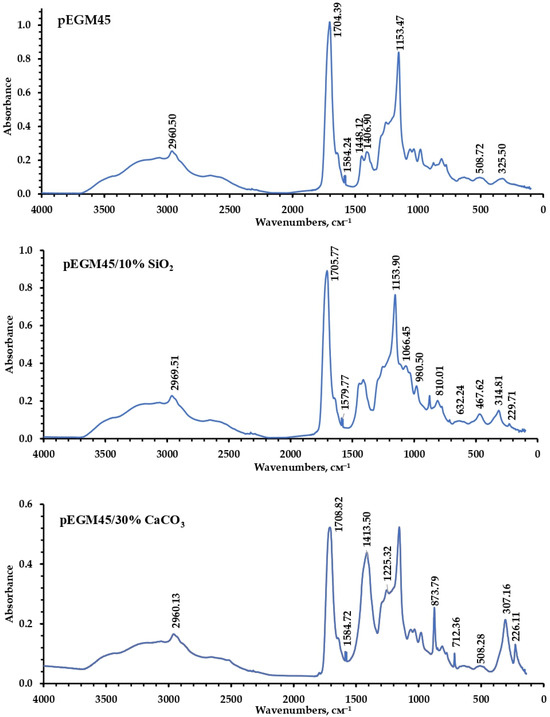
Figure 9.
IR spectra of pEGM45, pEGM45/10% SiO2, and pEGM45/30% CaCO3.
In the IR spectra of the cured samples, characteristic absorption bands reflecting their structural features are observed. The bands at 1586–1589 cm−1 correspond to a certain amount of unreacted unsaturated double bonds of pEGM. Narrow signals in the 2960–2961 cm−1 region are assigned to the asymmetric and symmetric stretching vibrations of methylene groups (–CH2–), indicating the presence of aliphatic units in the macromolecules. A broad, intense band in the range of 2500–3300 cm−1 is attributed to the stretching vibrations of O–H groups of AA carboxyl functionalities and partially overlaps with the stretching vibrations of the methylene groups. In addition, in the IR spectra of all studied samples, the absorption region at 1704–1708 cm−1, corresponding to the carbonyl fragment (C=O) of the AA carboxyl group (–COOH), appears broadened and partially overlaps with the carbonyl band of the polyester matrix, which typically absorbs in the higher-frequency region (1730–1750 cm−1). In the 1100–1155 cm−1 range, C–O–C stretching vibrations are observed, indicating the presence of polyester fragments that form the structural backbone of the copolymer [34]. The combined spectral data confirm the presence of aliphatic, polyester, and carboxyl fragments in the structure of the obtained samples. The presence of these bands is observed in all samples, indicating the preservation of the primary structural organization of the polymer matrix after the incorporation of fillers.
The IR spectrum of the pEGM45/10% SiO2 sample is characterized by bands at 1066, 988, 810, and 632 cm−1, corresponding to the vibrations of Si–O–Si bonds.
In the spectrum of the pEGM45/30% CaCO3 composition, characteristic bands are observed at 1413, 873, and 712 cm−1, corresponding to the stretching and bending vibrations of the carbonate ion (CO32−). Additional signals in the low-frequency region (500–600 cm−1) are attributed to Ca–O bond vibrations, typical of carbonate forms of calcium.
Analysis of the IR spectra made it possible to reliably identify the functional groups [61,62] characteristic of the polymer matrix. The characteristic peaks in the IR spectra also confirmed the presence of the inorganic components introduced into the system.
3.4. Results of TGA
To investigate the thermal properties of the synthesized pEGM-based systems, thermogravimetric analysis of the cured samples was carried out under linear heating conditions. The obtained data made it possible to assess the thermal stability of the studied systems and the nature of their degradation.
As shown in Figure 10, the highest residual mass is observed for samples containing inorganic fillers, which is attributed to their high inertness as well as the high decomposition temperatures of CaCO3 and SiO2. The residual masses of the unfilled pEGM45 and pEGM60 samples were 15.7% and 16.5%, respectively, which is significantly lower than those of the filled systems. Specifically, the residual masses of the systems filled with silicon dioxide were 21.2% and 23.2%, while the pEGM45 and pEGM60 systems filled with calcium carbonate exhibited the highest residual masses of 32.3% and 33.6%, respectively.
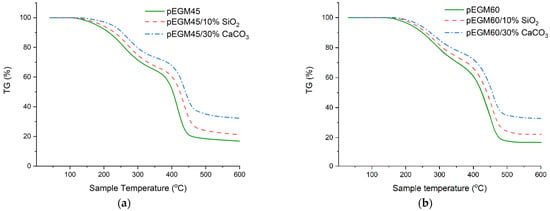
Figure 10.
TG curves of the systems at a heating rate of 20 °C/min in an inert atmosphere: (a) pEGM45; (b) pEGM60.
Figure 11 shows the dTG curves of the samples, providing a detailed representation of the decomposition stages.
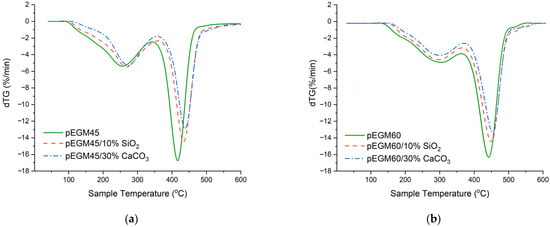
Figure 11.
dTG curves of the systems at a heating rate of 20 °C/min in an inert atmosphere: (a) pEGM45; (b) pEGM60.
As seen in Figure 11, the pEGM45 and pEGM60 polymer systems exhibit differences in thermal stability, which are reflected both in the temperature ranges of degradation and in the decomposition rates. For pEGM45, the first stage of thermal degradation begins at 90°C and ends at about 350°C, while the second stage occurs in the range of 350~475°C. The maximum decomposition rate is 16.7%/min at approximately 420 °C. In the case of pEGM60, degradation starts later: the first stage takes place in the range of 130~380 °C, and the second in the range of 380~515 °C (dTGmax = 16.4 %/min). Thus, the pEGM60 system exhibits higher thermal stability, as evidenced by the higher onset and completion temperatures of degradation at a comparable decomposition rate.
The addition of silicon dioxide has a stabilizing effect on both systems; however, the extent of this effect varies depending on the matrix composition. In the pEGM45/10% SiO2 system, the onset of degradation shifts to approximately 95 °C, while the second stage begins at around 365 °C with a mass loss of about 35%. The decomposition rate decreases to 14.5%/min. In the pEGM60/10% SiO2 system, degradation starts at 135 °C, and the second stage occurs in the range of 390~525 °C. The presence of silicon dioxide in the polymer matrix leads to a reduction in dTGmax and an increase in residual mass in both systems, indicating partial suppression of thermal degradation.
The introduction of calcium carbonate has the most pronounced effect on thermal stability, significantly reducing the decomposition rate and increasing the residual mass. In the pEGM45/30% CaCO3 system, the first stage begins at 105 °C and the second at 360 °C. In the pEGM60/30% CaCO3 system, the process starts at 140 °C and ends at 560 °C. The decomposition rates of the two stages are 4.2 %/min and 13.4 %/min at 300 °C and 450 °C, respectively. The substantial increase in residual mass, more than twice that of the unfilled systems, indicates a high proportion of non-decomposable components and the effective stabilizing action of the filler. Table 3 presents comparative thermogravimetric analysis data for the studied systems.

Table 3.
Thermogravimetric data for pEGM systems with fillers.
Based on the provided data, it can be noted that the thermal degradation of pEGM-based systems involves the following chemical processes: removal of moisture and low-molecular-weight volatile impurities, as well as the initial breakdown of weak bonds in the polymer structure during the first stage. In the second stage, bond cleavage occurs in the main macromolecular backbone—C–C, C–O, and other heteroatom bonds [63]. These processes are accompanied by the formation of volatile products, including olefin-type fragments, aldehydes, ketones, CO, and CO2. The degradation proceeds via a radical mechanism involving elements of depolymerization and rearrangements [64].
The presence of inorganic fillers has a noticeable effect on the thermal stability of the polymer matrix. Compared to the unfilled polymer matrix, the incorporation of amorphous silica contributes to a partial increase in thermal stability due to the adsorption of moisture and volatile degradation products on the particle surface. This process slows down their release into the gas phase and reduces the decomposition rate. In addition, the low thermal conductivity of silica limits heat transfer within the sample, leading to localized overheating, which is manifested as broadened transitions on the TG/dTG curves. As a result, SiO2-filled composites exhibit an increased residual mass and a slight shift in the degradation stages, although the onset and completion temperatures of the processes remain approximate. Silicon dioxide does not participate in chemical reactions; however, it acts as a thermal barrier, limiting macromolecular mobility and suppressing the propagation of thermodestructive radicals [65].
Calcium carbonate is also chemically inert within the studied temperature range and serves a stabilizing role, promoting the formation of a thermally stable residue [66]. As a result of its incorporation, a substantial increase in residual mass and a reduction in the thermal degradation rate are observed. Compared to the unfilled matrix, the addition of CaCO3 also enhances the thermal stability of the system. The high thermal conductivity of calcium carbonate promotes uniform heat distribution, which reduces the likelihood of local overheating and ensures a smoother profile of the thermogravimetric curves. As a result, CaCO3-filled composites exhibit a more uniform degradation process and an increased residual mass compared to the unfilled polymer.
For the quantitative evaluation of the thermal stability of the polymer systems, the activation energy (Ea) of degradation was calculated using the isoconversional principle. This approach involves the use of thermogravimetric curves obtained under different heating programs. For this purpose, the TG curves presented above were obtained at three different heating rates, and the Ea values were calculated based on them.
As an example, Figure 12 shows the three-point linearization plots for the most thermally stable system, pEGM45/30% CaCO3.
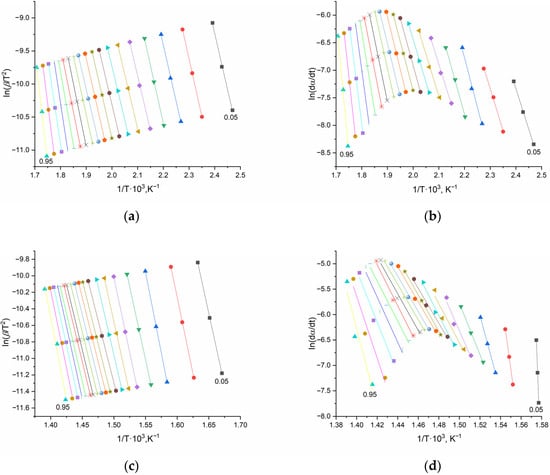
Figure 12.
Graphical dependencies of the Kissinger–Akahira–Sunose (a,c) and Friedman (b,d) equations for the pEGM45/30% CaCO3 system: (a,b) stage I, (c,d) stage II. Different colors and symbols correspond to various degrees of conversion (α = 0.05–0.95).
As can be seen from the presented plots, the lines constructed using the differential Friedman method exhibit greater scatter of the data points and less pronounced linearity compared to the results obtained by the integral method.
Figure 13 shows the Ea values for each individual degree of conversion (α) in the degradation range of 0.05–0.95.
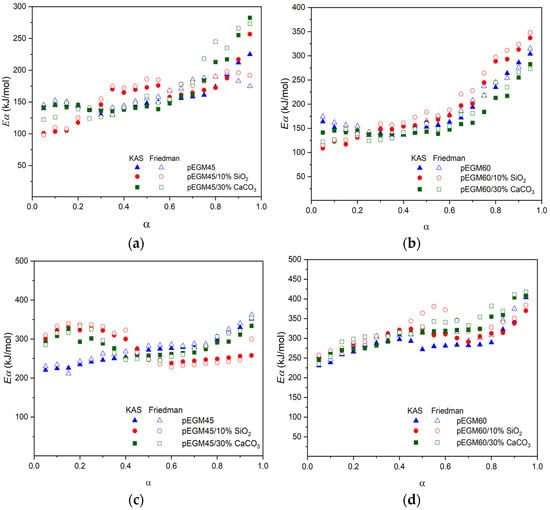
Figure 13.
Dependence of activation energy (Ea) on the degree of conversion (α) for the pEGM45 and pEGM60 systems: (a,b) stage I, (c,d) stage II.
The average activation energy values corresponding to both stages of thermal degradation, as well as the total values for each studied system, are presented in Table 4.

Table 4.
Activation energies of thermal degradation for pEGM systems with SiO2 and CaCO3 fillers.
A comparative analysis of the obtained Ea values for the thermal degradation of pEGM45 and pEGM60 systems containing 10% SiO2 and 30% CaCO3 showed that, at the initial stages, optimal Ea values are observed in accordance with the established patterns. At the second stage, Ea increases as expected. The total activation energy is highest for systems with the greatest UP content. It was also found that the fillers increase the Ea values of the pEGM systems. For example, the EKAS value is highest for pEGM60 with fillers, reaching 496 kJ/mol (SiO2) and 514 kJ/mol (CaCO3). It should be noted that the values obtained by the integral and differential methods (Table 4) show good correlation.
4. Conclusions
For the first time, a study was conducted on the rheological properties and the kinetics of the isothermal curing reaction of pEGM systems and their compositions in the presence of the BPO/DMA redox initiating system. It was established that the composition of the studied systems affects their rheological characteristics and the kinetics of low-temperature curing. It has been established that the introduction of mineral fillers alters the flow behavior of pEGM systems, resulting in a transition from Newtonian to pseudoplastic behavior. Three-interval thixotropy tests showed that structural recovery increases with increasing filler content. For the first time, the curing kinetics of pEGM-based systems were studied using DSC. The isothermal curing kinetics of the investigated systems are described by the modified Kamal autocatalytic model, taking into account the diffusion factor. As the UP content increases, the critical degree of curing (αc) corresponding to the transition from chemical to diffusion control decreases. It was determined that for the pEGM45 system αc is 0.77, while for pEGM60 αc is approximately 0.60. It was demonstrated that the application of the modified Kamal autocatalytic model provides an adequate description of the curing kinetics of the studied systems under both moderate and pronounced diffusion limitations. Thermogravimetric analysis revealed that an increase in pEGM content and the introduction of fillers enhance the thermal stability of pEGM45 and pEGM60 systems. The addition of SiO2 and CaCO3 decreases the maximum decomposition rate (dTGₘₐₓ) and nearly doubles the residual mass compared to the unfilled matrix. The activation energy (Ea) values for thermal degradation of the pEGM systems, calculated using the Kissinger–Akahira–Sunose and Friedman methods, showed that the introduction of fillers increases Ea. The EKAS value was found to be highest for pEGM60 with fillers, reaching 496 kJ/mol (SiO2) and 514 kJ/mol (CaCO3). The obtained data make it possible to optimize the composition of the systems for low-temperature curing and confirm their potential for use in composite, construction, and coating materials, as well as in adhesive and impregnating formulations.
Author Contributions
The manuscript was written with contributions of all authors. Conceptualization, G.B. and A.K.; data curation, G.B. and A.K.; investigation, D.M., A.O. and A.K.; methodology, G.B., A.B. and E.Z.; writing—original draft, G.B.; writing—review and editing, D.M., G.B. and Y.M.; validation, D.H.; visualization, A.O., M.N. and E.Z. All authors have read and agreed to the published version of the manuscript.
Funding
This research was funded by the Science Committee of the Ministry of Science and Higher Education of the Republic of Kazakhstan (Grant No. AP23488036).
Institutional Review Board Statement
Not applicable.
Data Availability Statement
The original contributions presented in this study are included in the article. Further inquiries can be directed to the corresponding author.
Conflicts of Interest
The authors declare no conflicts of interest.
Abbreviations
The following abbreviations are used in this manuscript:
| AA | acrylic acid |
| BPO | benzoyl peroxide |
| DSC | Differential scanning calorimetry |
| DMA | N,N-Dimethylaniline |
| FTIR | Fourier Transform Infrared Spectroscopy |
| IR | Infrared spectroscopy |
| NMR | Nuclear magnetic resonance |
| pEGM | Polyethylene glycol maleate |
| TGA | Thermogravimetric analysis |
References
- Penczek, P.; Czub, P.; Pielichowski, J. Unsaturated polyester resins: Chemistry and technology. In Crosslinking in Materials Science; Abe, A., Dus, K., Kobayashi, S., Eds.; Springer: Berlin/Heidelberg, Germany, 2005; pp. 1–95. [Google Scholar] [CrossRef]
- Lee, B.-Y.; Lee, D.-H.; Jang, K.-S. Impact Modifiers and Compatibilizers for Versatile Epoxy-Based Adhesive Films with Curing and Deoxidizing Capabilities. Polymers 2021, 13, 1129. [Google Scholar] [CrossRef]
- Gao, Y.; Romero, P.; Zhang, H.; Huang, M.; Lai, F. Unsaturated polyester resin concrete: A review. Constr. Build. Mater. 2019, 228, 116709. [Google Scholar] [CrossRef]
- Oliveira, M.; Pereira, A.; Garcia, F.; Demosthenes, L.; Nunes, L.; Braga, F.; da Luz, F.; Monteiro, S. Comparison of Interfacial Adhesion Between Polyester and Epoxy Matrix Composites Reinforced with Fique Natural Fiber. In Green Materials Engineering, 2019-01-01; Ikhmayies, S., Li, J., Vieira, C., Margem (Deceased), J., de Oliveira Braga, F., Eds.; The Minerals, Metals & Materials Series; Springer: Cham, Switzerland, 2019. [Google Scholar] [CrossRef]
- Berdnikova, P.; Zhizhina, E.G.; Pai, Z.P. Phenol-Formaldehyde Resins: Properties, Fields of Application, and Methods of Synthesis. Catal. Ind. 2021, 13, 113–124. [Google Scholar] [CrossRef]
- Liu, C.G.; Dai, Y.; Hu, Y.; Shang, Q.Q.; Feng, G.D.; Zhou, J.; Zhou, Y.H. Highly Functional Unsaturated Ester Macromonomer Derived from Soybean Oil: Synthesis and Copolymerization with Styrene. Acs Sustain. Chem. Eng. 2016, 4, 4208–4216. [Google Scholar] [CrossRef]
- Burkeev, M.; Zhunissova, M.; Tazhbayev, Y.; Fomin, V.; Sarsenbekova, A.; Burkeyeva, G.; Kazhmuratova, A.; Zhumagalieva, T.; Zhakupbekova, E.; Khamitova, T. Influence of RAFT Agent on the Mechanism of Copolymerization of Polypropylene Glycol Maleinate with Acrylic Acid. Polymers 2022, 14, 1884. [Google Scholar] [CrossRef]
- Burkeyev, M.; Kudaibergen, G.; Tazhbayev, Y.; Burkeyeva, G.; Omasheva, A.; Yesentayeva, N.; Bolatbay, A. The number average and mass average molar masses of polyethylene (propylene) glycol fumarates. Bull. Univ. Karaganda Ser. Chem. 2018, 90, 17–22. [Google Scholar] [CrossRef] [PubMed]
- Burkeyev, M.; Kovaleva, A.; Plocek, J.; Tazhbayev, E.; Burkeyeva, G.; Bolatbai, A.; Davrenbekov, S. Synthesis and Properties of Poly (Propylene Glycol Maleate Phthalate)-Styrene Copolymers as a Base of Composite Materials. Russ. J. Appl. Chem. 2018, 91, 1742–1749. [Google Scholar] [CrossRef]
- Burkeyeva, G.; Kovaleva, A.; Tazhbayev, Y.; Ibrayeva, Z.; Zhaparova, L. Investigation of Curing Process and Thermal Behavior of Copolymers Based on Polypropylene Glycol Fumarate and Acrylic Acid Using the Methods of DSC and TGA. Polymers 2023, 15, 3753. [Google Scholar] [CrossRef]
- Kirshanov, K.; Toms, R.; Melnikov, P.; Gervald, A. Unsaturated Polyester Resin Nanocomposites Based on Post-Consumer Polyethylene Terephthalate. Polymers 2022, 14, 1602. [Google Scholar] [CrossRef]
- Chabros, A.; Gawdzik, B. Methacrylate monomer as an alternative to styrene in typical polyester-styrene copolymers. J. Appl. Polym. Sci. 2019, 136, 47735. [Google Scholar] [CrossRef]
- Tank, R.; Gupta, D. Modification of styrene-divinyl benzene copolymers using monoacrylates as ter-monomer. J. Porous Mater. 2009, 16, 387–392. [Google Scholar] [CrossRef]
- Wang, K.; Wang, J.; Zhu, Y.; Xia, Y. The effect of low profile additives on unsaturated polyester resins during curing at low/medium temperature: Shrinkage behavior study. In Composite Materials III, Proceedings of the 3rd China Cross-strait Conference on Composite Materials, Wuhan, China, 7–12 May 2003; Zhang, L., Guo, J.K., Tuan, W.H., Eds.; Trans Tech Publications Ltd.: Baech, Switzerland, 2003; Volume 249, pp. 351–354. [Google Scholar] [CrossRef]
- Zhang, X.; Kong, L.; Yang, A.; Sayem, H. Thixotropic mechanism of clay: A microstructural investigation. Soils Found. 2017, 57, 23–35. [Google Scholar] [CrossRef]
- Oleksy, M.; Heneczkowski, M.; Galina, H. Thixotropic compositions: Unsaturated polyester resins/modified bentonites. Polimery 2007, 52, 345–350. [Google Scholar] [CrossRef]
- Kiehl, J.; Huser, J.; Bistac, S.; Delaite, C. Influence of fillers content on the viscosity of unsaturated polyester resin/calcium carbonate blends. J. Compos. Mater. 2012, 46, 1937–1942. [Google Scholar] [CrossRef]
- Spasojevic, P.; Seslija, S.; Markovic, M.; Pantic, O.; Antic, K.; Spasojevic, M. Optimization of Reactive Diluent for Bio-Based Unsaturated Polyester Resin: A Rheological and Thermomechanical Study. Polymers 2021, 13, 2667. [Google Scholar] [CrossRef] [PubMed]
- Bartolomeo, P.; Chailan, J.; Vernet, J. Curing of cyanate ester resin: A novel approach based on FTIR spectroscopy and comparison with other techniques. Eur. Polym. J. 2001, 37, 659–670. [Google Scholar] [CrossRef]
- Fraga, F.; Burgo, S.; Núñez, E. Curing kinetic of the epoxy system BADGE n=0/1,2 DCH by Fourier Transform Infrared Spectroscopy (FTIR). J. Appl. Polym. Sci. 2001, 82, 3366–3372. [Google Scholar] [CrossRef]
- Arasa, M.; Ramis, X.; Salla, J.; Mantecón, A.; Serra, A. Kinetic study by FTIR and DSC on the cationic curing of a DGEBA/γ-valerolactone mixture with ytterbium triflate as an initiator. Thermochim. Acta 2008, 479, 37–44. [Google Scholar] [CrossRef]
- Garschke, C.; Parlevliet, P.; Weimer, C.; Fox, B. Cure kinetics and viscosity modelling of a high-performance epoxy resin film. Polym. Test. 2013, 32, 150–157. [Google Scholar] [CrossRef]
- Domínguez, J.; Alonso, M.; Oliet, M.; Rojo, E.; Rodríguez, F. Kinetic study of a phenolic-novolac resin curing process by rheological and DSC analysis. Thermochim. Acta 2010, 498, 39–44. [Google Scholar] [CrossRef]
- Sourour, S.; Kamal, M. Differential Scanning Calorimetry of Epoxy Cure—Isothermal Cure Kinetics. Thermochim. Acta 1976, 14, 41–59. [Google Scholar] [CrossRef]
- Lascano, D.; Lerma-Canto, A.; Fombuena, V.; Balart, R.; Montanes, N.; Quiles-Carrillo, L. Kinetic Analysis of the Curing Process of Biobased Epoxy Resin from Epoxidized Linseed Oil by Dynamic Differential Scanning Calorimetry. Polymers 2021, 13, 1279. [Google Scholar] [CrossRef]
- Vyazovkin, S. Thermal analysis. Anal. Chem. 2006, 78, 3875–3886. [Google Scholar] [CrossRef]
- Kamal, M.R. Thermoset characterization for moldability analysis. Polym. Eng. Sci. 1974, 14, 231–239. [Google Scholar] [CrossRef]
- Khanna, U.; Chanda, M. Kinetics of Anhydride Curing of Isophthalic Diglycidyl Ester Using Differential Scanning Calorimetry. J. Appl. Polym. Sci. 1993, 49, 319–329. [Google Scholar] [CrossRef]
- Fraga, F.; Soto, V.; Rodríguez-Núñez, E.; Martínez-Ageitos, J.; Rodríguez, V. Cure kinetic of the epoxy network diglycidyl ether of bisphenol A (BADGE n = 0)/Amantidine. J. Therm. Anal. Calorim. 2007, 87, 97–100. [Google Scholar] [CrossRef]
- Burkeyev, M.; Tazhbayev, Y.; Bolatbay, A.; Minayeva, Y.; Davrenbekov, S.; Nassikhatuly, Y.; Kovaleva, A.; Kutzhanova, K.; Kazhmuratova, A. Study of Thermal Decomposition of the Copolymer Based on Polyethylene Glycol Fumarate with Acrylic Acid. J. Chem. 2022, 2022, 3514358. [Google Scholar] [CrossRef]
- Mezger, T.G. Applied Rheology: With Joe Flow on Rheology Road, 1st ed.; Anton Paar GmbH: Graz, Austria, 2015; pp. 145–175. Available online: https://www.anton-paar.com/corp-en/applied-rheology/?srsltid=AfmBOoprlHDGCq9apBptEh_0jgmBgbi7MFLa0McyzT3hyFOyGigqxpHr (accessed on 21 August 2023).
- Wang, Y.; Yu, M.-J. Effect of volume loading and surface treatment on the thixotropic behavior of polypropylene filled with calcium carbonate. Polym. Compos. 2004, 21, 1–12. [Google Scholar] [CrossRef]
- Liu, F.; Yu, W.; Wang, Y.; Shang, R.; Zheng, Q. Curing kinetics and thixotropic properties of epoxy resin composites with different kinds of fillers. J. Mater. Res. Technol.-JMRT 2022, 18, 2125–2139. [Google Scholar] [CrossRef]
- Pucić, I.; Jurkin, T. FTIR Assessment of Poly(ethylene oxide) Irradiated in Solid State, Melt and Aqueous Solution. Radiat. Phys. Chem. 2012, 81, 1426–1429. [Google Scholar] [CrossRef]
- Balart, R.; Garcia-Sanoguera, D.; Quiles-Carrillo, L.; Montanes, N.; Torres-Giner, S. Kinetic Analysis of the Thermal Degradation of Recycled Acrylonitrile-Butadiene-Styrene by non-Isothermal Thermogravimetry. Polymers 2019, 11, 281. [Google Scholar] [CrossRef]
- Lei, J.; Wang, Y.; Wang, Q.; Deng, S.; Fu, Y. Evaluation of Kinetic and Thermodynamic Parameters of Pyrolysis and Combustion Processes for Bamboo Using Thermogravimetric Analysis. Processes 2024, 12, 2458. [Google Scholar] [CrossRef]
- Paredes, R.; Castells, B.; Tascón, A. Thermogravimetric Assessment of Biomass: Unravelling Kinetic, Chemical Composition and Combustion Profiles. Fire 2024, 7, 396. [Google Scholar] [CrossRef]
- Dubdub, I.; Al-Yaari, M. Thermal Behavior of Mixed Plastics at Different Heating Rates: I. Pyrolysis Kinetics. Polymers 2021, 13, 3413. [Google Scholar] [CrossRef]
- Najafi, H.; Golrokh Sani, A.; Sobati, M.A. Thermogravimetric and thermo-kinetic analysis of sugarcane bagasse pith: A comparative evaluation with other sugarcane residues. Sci. Rep. 2024, 14, 2076. [Google Scholar] [CrossRef]
- Gola, A.; Knysak, T.; Mucha, I.; Musiał, W.S. Thermogravimetric Analysis, and Kinetic Study of Poly-N-Isopropylacrylamide with Varied Initiator Content. Polymers 2023, 15, 2427. [Google Scholar] [CrossRef]
- Sarikhani, N.; Arabshahi, Z.; Saberi, A.; Moshfegh, A. Unified modeling and experimental realization of electrical and thermal percolation in polymer composites. Appl. Phys. Rev. 2022, 9, 041403. [Google Scholar] [CrossRef]
- Peng, Y.; Musah, M.; Via, B.; Wang, X. Calcium Carbonate Particles Filled Homopolymer Polypropylene at Different Loading Levels: Mechanical Properties Characterization and Materials Failure Analysis. J. Compos. Sci. 2021, 5, 302. [Google Scholar] [CrossRef]
- Kherici, S.; Benouali, D.; Nouredine, C. The Effects of Calcium Carbonate Filler on HDPE Pipe. Adv. Sci. Technol.-Res. J. 2022, 16, 213–218. [Google Scholar] [CrossRef]
- Takenouchi, S.; Takasu, A.; Inai, Y.; Hirabayashi, T. Effects of geometrical difference of unsaturated aliphatic polyesters on their biodegradability III. Cross effects of molecular weight and geometric structure of poly(ethylene maleate/fumarate) and its model compounds. Polym. J. 2002, 34, 882–890. [Google Scholar] [CrossRef]
- Yang, H.; Du, J. Crystallinity, Rheology, and Mechanical Properties of Low-/High-Molecular-Weight PLA Blended Systems. Molecules 2024, 29, 169. [Google Scholar] [CrossRef]
- Huang, B.; Hu, X.; Fu, C.; Liu, C.; Wang, Y.; An, X. Rheological Model and Transition Velocity Equation of a Polymer Solution in a Partial Pressure Tool. Polymers 2019, 11, 855. [Google Scholar] [CrossRef]
- Sánchez, J.H.; Rubio-Hernández, F.J.; Páez-Flor, N.M. Time-Dependent Viscous Flow Behavior of a Hydrophobic Fumed Silica Suspension. Processes 2021, 9, 807. [Google Scholar] [CrossRef]
- Selim, K.A.; Farghaly, M.G.; Abdallah, S.S.; Abdel-khalek, M.A. Effect of polyacrylic acid molar mass as a surface modifier on rheological properties of calcium carbonate suspensions. Physicochem. Probl. Miner. Process. 2021, 57, 18–26. [Google Scholar] [CrossRef]
- Varfolomeeva, L.A.; Skvortsov, I.Y.; Kuzin, M.S.; Kulichikhin, V.G. Silica-Filled Polyacrylonitrile Solutions: Rheology, Morphology, Coagulation, and Fiber Spinning. Polymers 2022, 14, 4548. [Google Scholar] [CrossRef]
- Barakat, A.; Al Ghazal, M.; Fono Tamo, R.S.; Phadatare, A.; Unser, J.; Hagan, J.; Vaidya, U. Development of a Cure Model for Unsaturated Polyester Resin Systems Based on Processing Conditions. Polymers 2024, 16, 2391. [Google Scholar] [CrossRef]
- Ren, K.; Tsai, Y. Thermal Hazard Characteristics of Unsaturated Polyester Resin Mixed with Hardeners. Polymers 2021, 13, 522. [Google Scholar] [CrossRef]
- Chencheni, A.; Belkhiri, S.; Tarchoun, A.F.; Abdelaziz, A.; Bessa, W.; Boucheffa, Y.; Trache, D. Unravelling the Thermal Behavior and Kinetics of Unsaturated Polyester Resin Supplemented with Organo-Nanoclay. RSC Adv. 2024, 14, 517–528. [Google Scholar] [CrossRef]
- Jankovic, B. The kinetic analysis of isothermal curing reaction of an unsaturated polyester resin: Estimation of the density distribution function of the apparent activation energy. Chem. Eng. J. 2010, 162, 331–340. [Google Scholar] [CrossRef]
- Teil, H.; Page, S.; Michaud, V.; Månson, J. TTT-cure diagram of an anhydride-cured epoxy system including gelation, vitrification, curing kinetics model, and monitoring of the glass transition temperature. J. Appl. Polym. Sci. 2004, 93, 1774–1787. [Google Scholar] [CrossRef]
- Wise, C.; Cook, W.; Goodwin, A. Chemico-diffusion kinetics of model epoxy-amine resins. Polymer 1997, 38, 3251–3261. [Google Scholar] [CrossRef]
- Flammersheim, H.; Opfermann, J. Formal kinetic evaluation of reactions with partial diffusion control. Thermochim. Acta 1999, 337, 141–148. [Google Scholar] [CrossRef]
- Granado, L.; Kempa, S.; Gregoriades, L.; Brüning, F.; Genix, A.; Fréty, N.; Anglaret, E. Kinetic regimes in the curing process of epoxy-phenol composites. Thermochim. Acta 2018, 667, 185–192. [Google Scholar] [CrossRef]
- Zhao, Y.; Drummer, D. Influence of Filler Content and Filler Size on the Curing Kinetics of an Epoxy Resin. Polymers 2019, 11, 1797. [Google Scholar] [CrossRef]
- Chiu, Y.C.; Chen, C.Y.; Lee, L.T.; Chang, F.C. Effect of Silica Fillers on Epoxy–Imidazole Curing Reaction. J. Appl. Polym. Sci. 2025, 142, 56895. [Google Scholar] [CrossRef]
- Vazquez, I. Influence of the Filler CaCO3 on the Cure Kinetic of the Epoxy Network Diglycidyl Ether of Bisphenol A (BADGE n = 0) with Isophorone Diamine. J. Appl. Polym. Sci. 2009, 114, 3678–3686. [Google Scholar] [CrossRef]
- Achilias, D.S.; Karabela, M.M.; Varkopoulou, E.A.; Sideridou, I.D. Cure Kinetics Study of Two Epoxy Systems with Fourier Tranform Infrared Spectroscopy (FTIR) and Differential Scanning Calorimetry (DSC). J. Macromol. Sci. Part A 2012, 49, 630–638. [Google Scholar] [CrossRef]
- Cañavate, J.; Colom, X.; Pagès, P.; Carrasco, F. Study of the Curing Process of an Epoxy Resin by Ftir Spectroscopy. Polym. Technol. Eng. 2000, 39, 937–943. [Google Scholar] [CrossRef]
- Oh, S.; Kim, M.; Lee, D. Recent Advances in Oxidative Degradation of Plastics. Chem. Soc. Rev. 2024, 53, 1785–1812. [Google Scholar] [CrossRef]
- Zhumanazarova, G.M.; Sarsenbekova, A.Z.; Abulyaissova, L.K.; Figurinene, I.V.; Zhaslan, R.K.; Makhmutova, A.S.; Sotchenko, R.K.; Aikynbayeva, G.M.; Hranicek, J. Study of Mathematical Models Describing the Thermal Decomposition of Polymers Using Numerical Methods. Polymers 2025, 17, 1197. [Google Scholar] [CrossRef]
- Tomaszewska, J.; Sterzyński, T.; Walczak, D. Thermal Stability of Nanosilica-Modified Poly(vinyl chloride). Polymers 2021, 13, 2057. [Google Scholar] [CrossRef] [PubMed]
- Pashmforoush, F.; Ajori, S.; Azimi, H.R. Interfacial Characteristics and Thermo-Mechanical Properties of Calcium Carbonate/Polystyrene Nanocomposite. Mater. Chem. Phys. 2020, 247, 122871. [Google Scholar] [CrossRef]
Disclaimer/Publisher’s Note: The statements, opinions and data contained in all publications are solely those of the individual author(s) and contributor(s) and not of MDPI and/or the editor(s). MDPI and/or the editor(s) disclaim responsibility for any injury to people or property resulting from any ideas, methods, instructions or products referred to in the content. |
© 2025 by the authors. Licensee MDPI, Basel, Switzerland. This article is an open access article distributed under the terms and conditions of the Creative Commons Attribution (CC BY) license (https://creativecommons.org/licenses/by/4.0/).