

Ion Conduction Dynamics, Characterization, and Application of Ionic Liquid Tributyl Methyl Phosphonium Iodide (TMPI)-Doped Polyethylene Oxide Polymer Electrolyte

 , ,
, ,  , ,
, ,
Abstract
1. Introduction
2. The Experimental Procedure
2.1. Polymer Electrolyte Preparation
2.2. Dye-Sensitized Solar Cell Fabrication
2.3. Electric Double-Layer Capacitor Fabrication
3. Characterization and Results
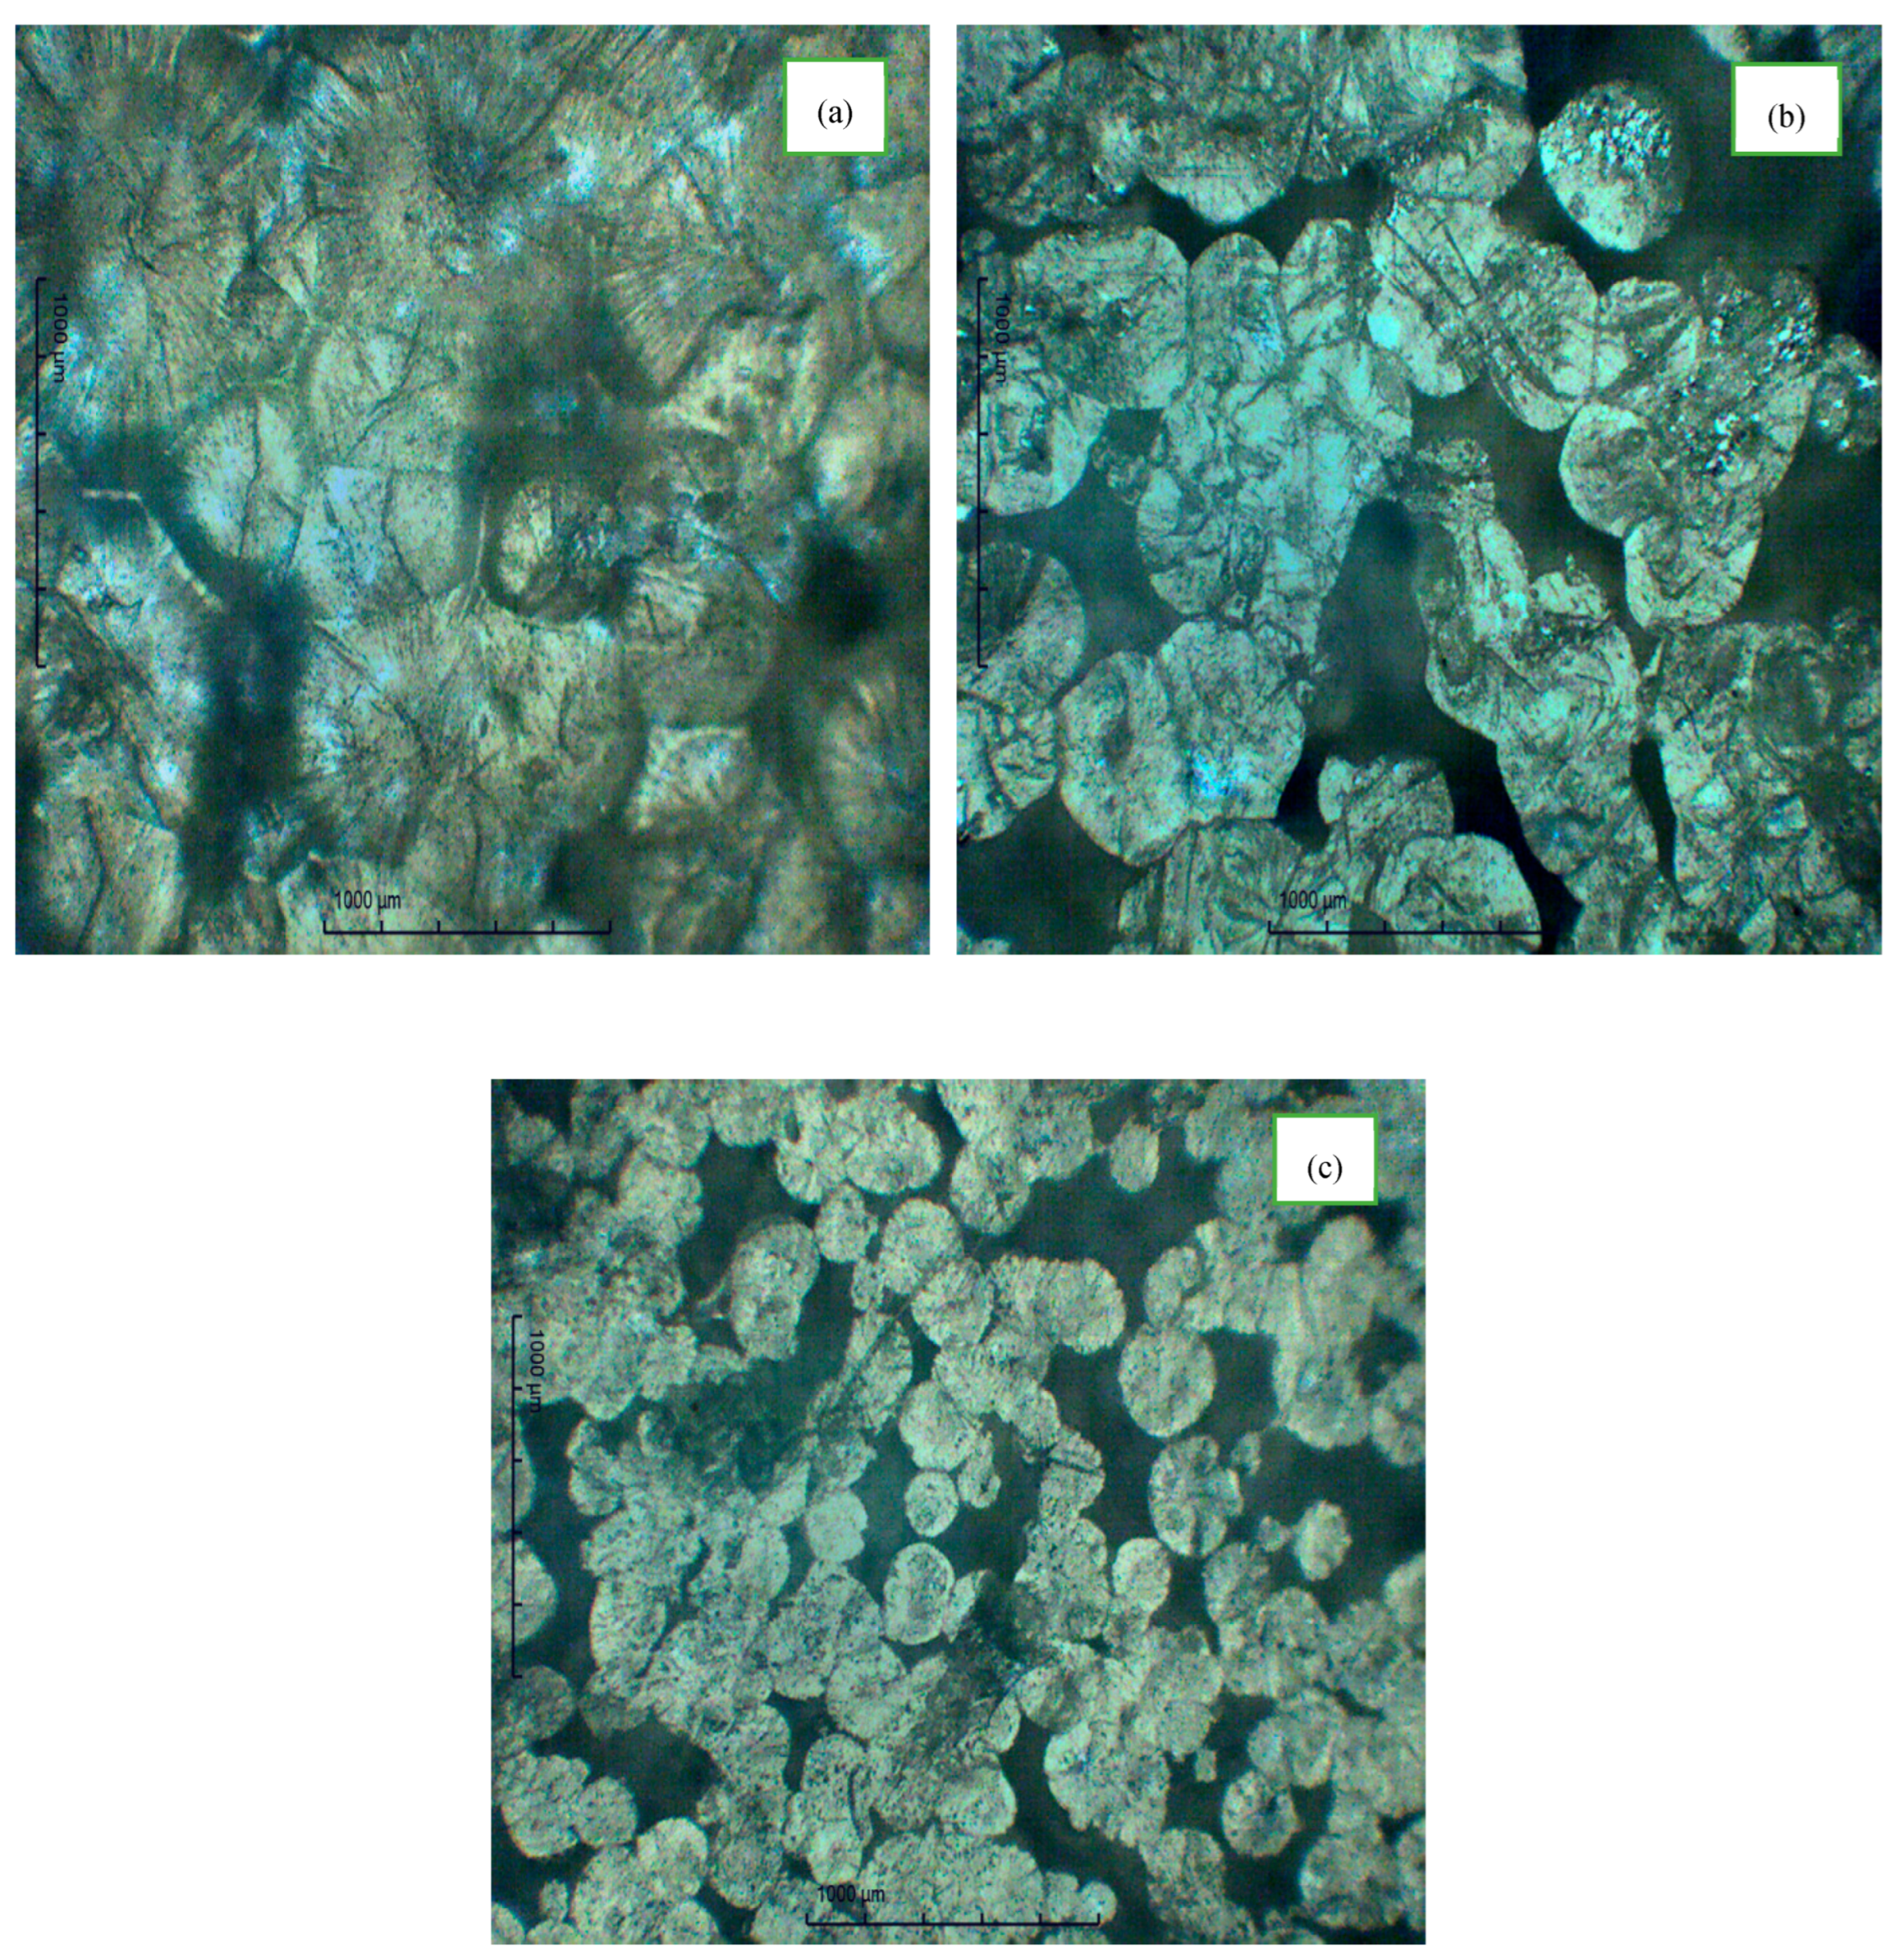
3.1. The Polarized Optical Microscope
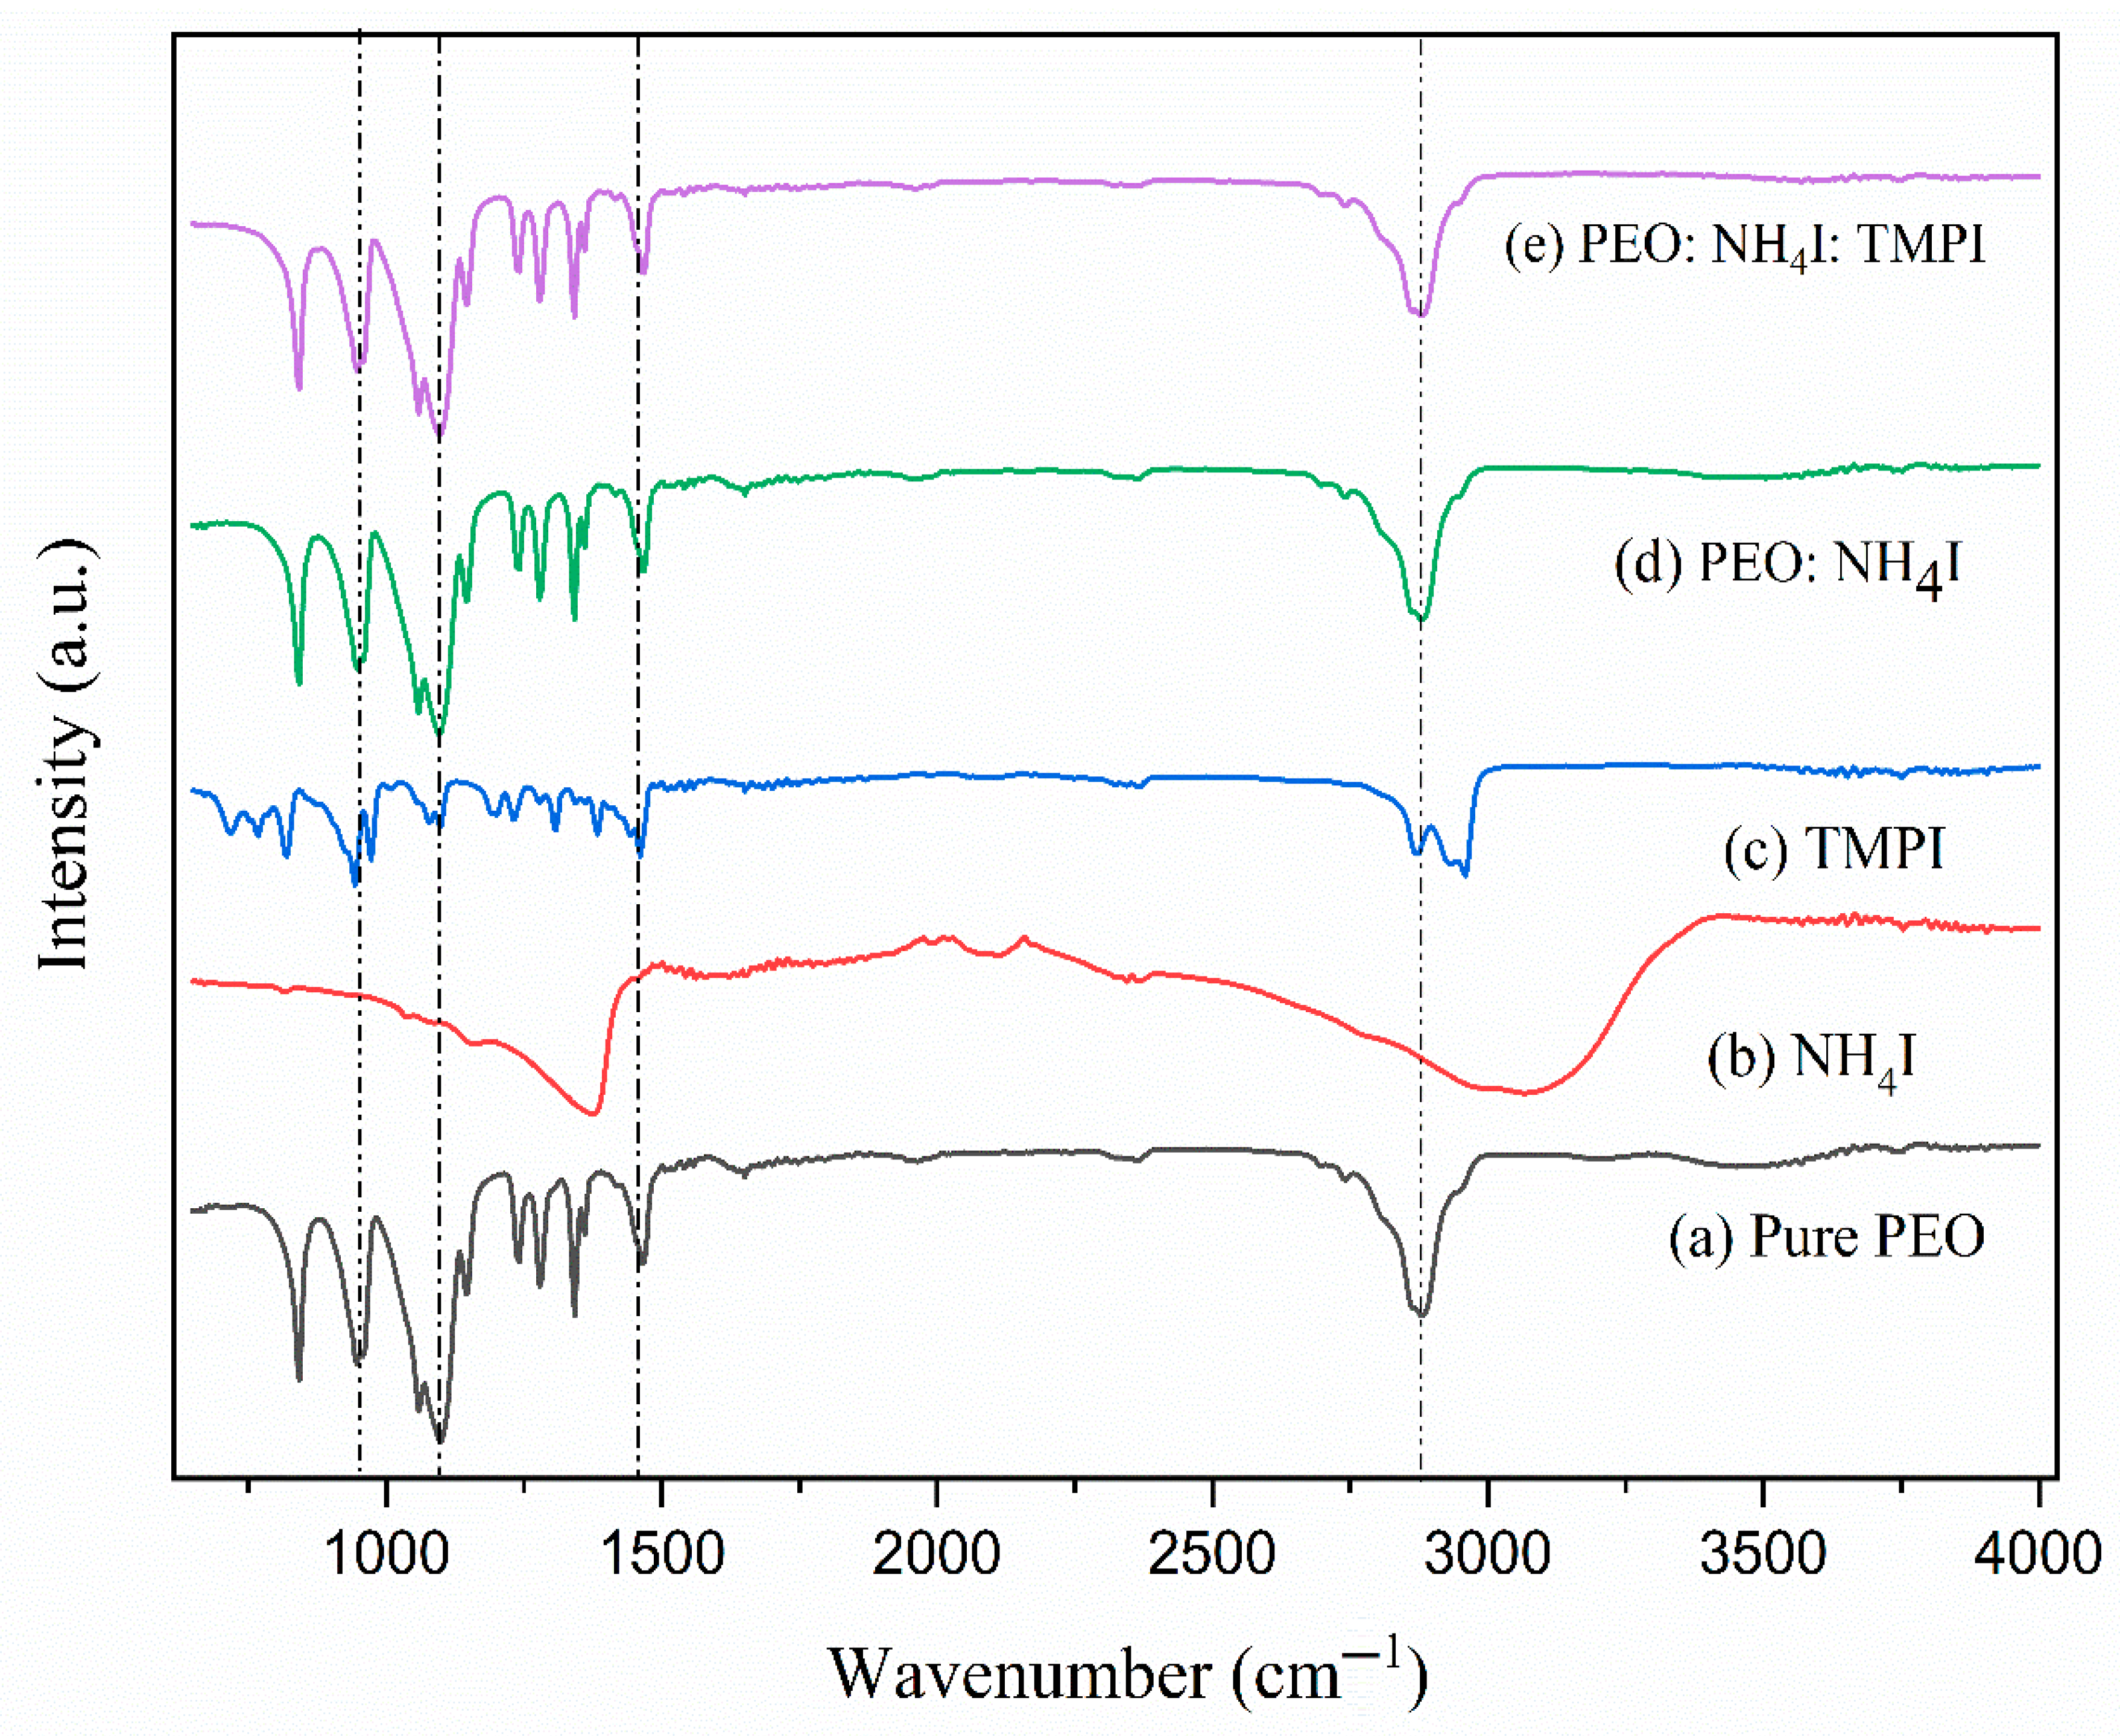
3.2. Fourier Transform Infrared Spectroscopy

| Material | Band Assignment | Class | Ref. | |
|---|---|---|---|---|
| 842 | rocking | [20] | ||
| 956 | Crystalline phase | - | [21] | |
| 1092.93 | stretching | Ether | [22] | |
| 1342.03 | wagging | [23] | ||
| 1465.12 | bending | [23] | ||
| 2878.07 | stretching | [23] | ||
| 1372 | bending | [24] | ||
| 3066 | stretching | Symmetric/asymmetric N-H bond | [24] | |
| 435 | interaction | Phosphonium–iodide interaction | [25] | |
| 812 | Phosphonium ring | Phosphonium | [26] | |
| 939 | stretching | Phosphonium– iodide | [27] | |
| 1096 | interaction | Phosphonium– iodide | [28] | |
| 1386 | symmetric stretching | Phosphonium ether group | [28] | |
| 1466 | bending | [29] | ||
| 2870 | stretching | [29] | ||
| 2957 | stretching | [29] | ||
| 634 | vibration | [30] | ||
| 1135 | stretching | Ether | [31] | |
| 1280 | wagging | [12] | ||
| 2857 | stretching | [31] | ||
| 3329 | stretching | Symmetric/asymmetric N-H bond | [31] | |
| 740 | rocking | Phosphonium group | [32] | |
| 1031 | stretching | Phosphonium group | [33] | |
| 1130 | stretching | Ether | [20] | |
| 1280 | wagging | [34] | ||
| 2870 | symmetric stretching | [30] | ||
| 2879 | stretching | [23] | ||
| 3340 | stretching | [12] |
3.3. Scanning Calorimetry
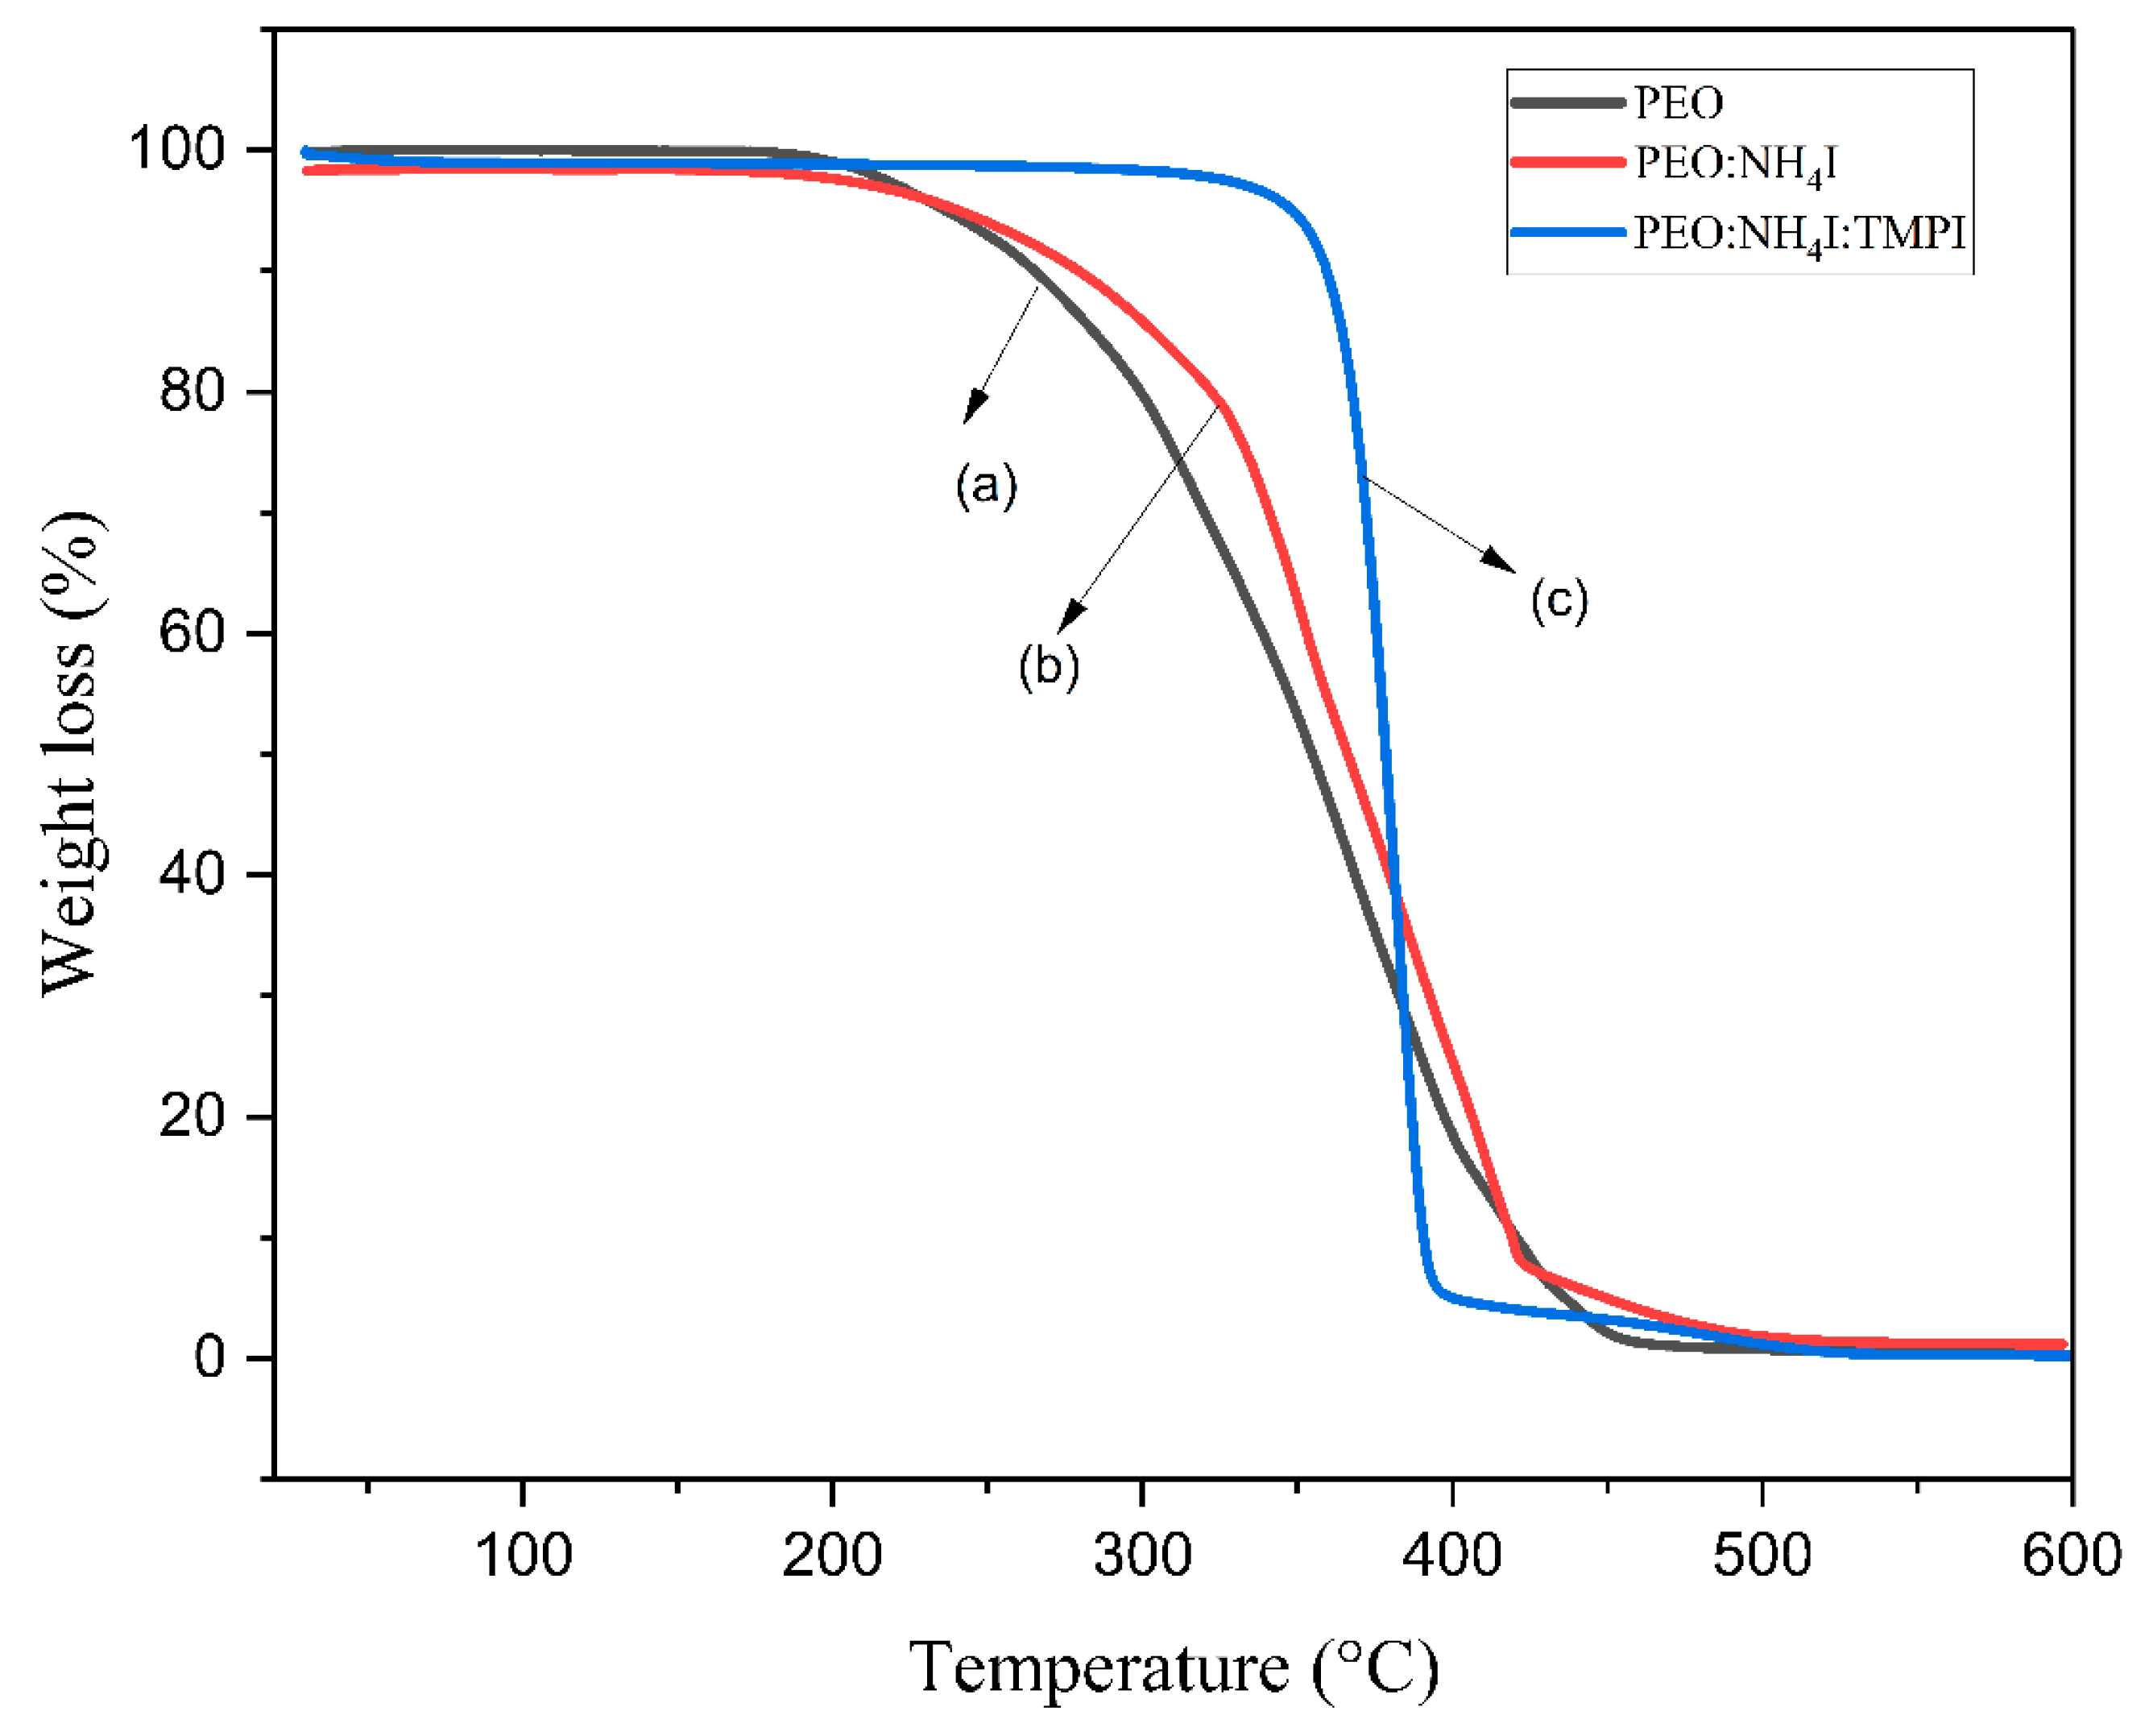
3.4. The Thermogravimetric Analysis
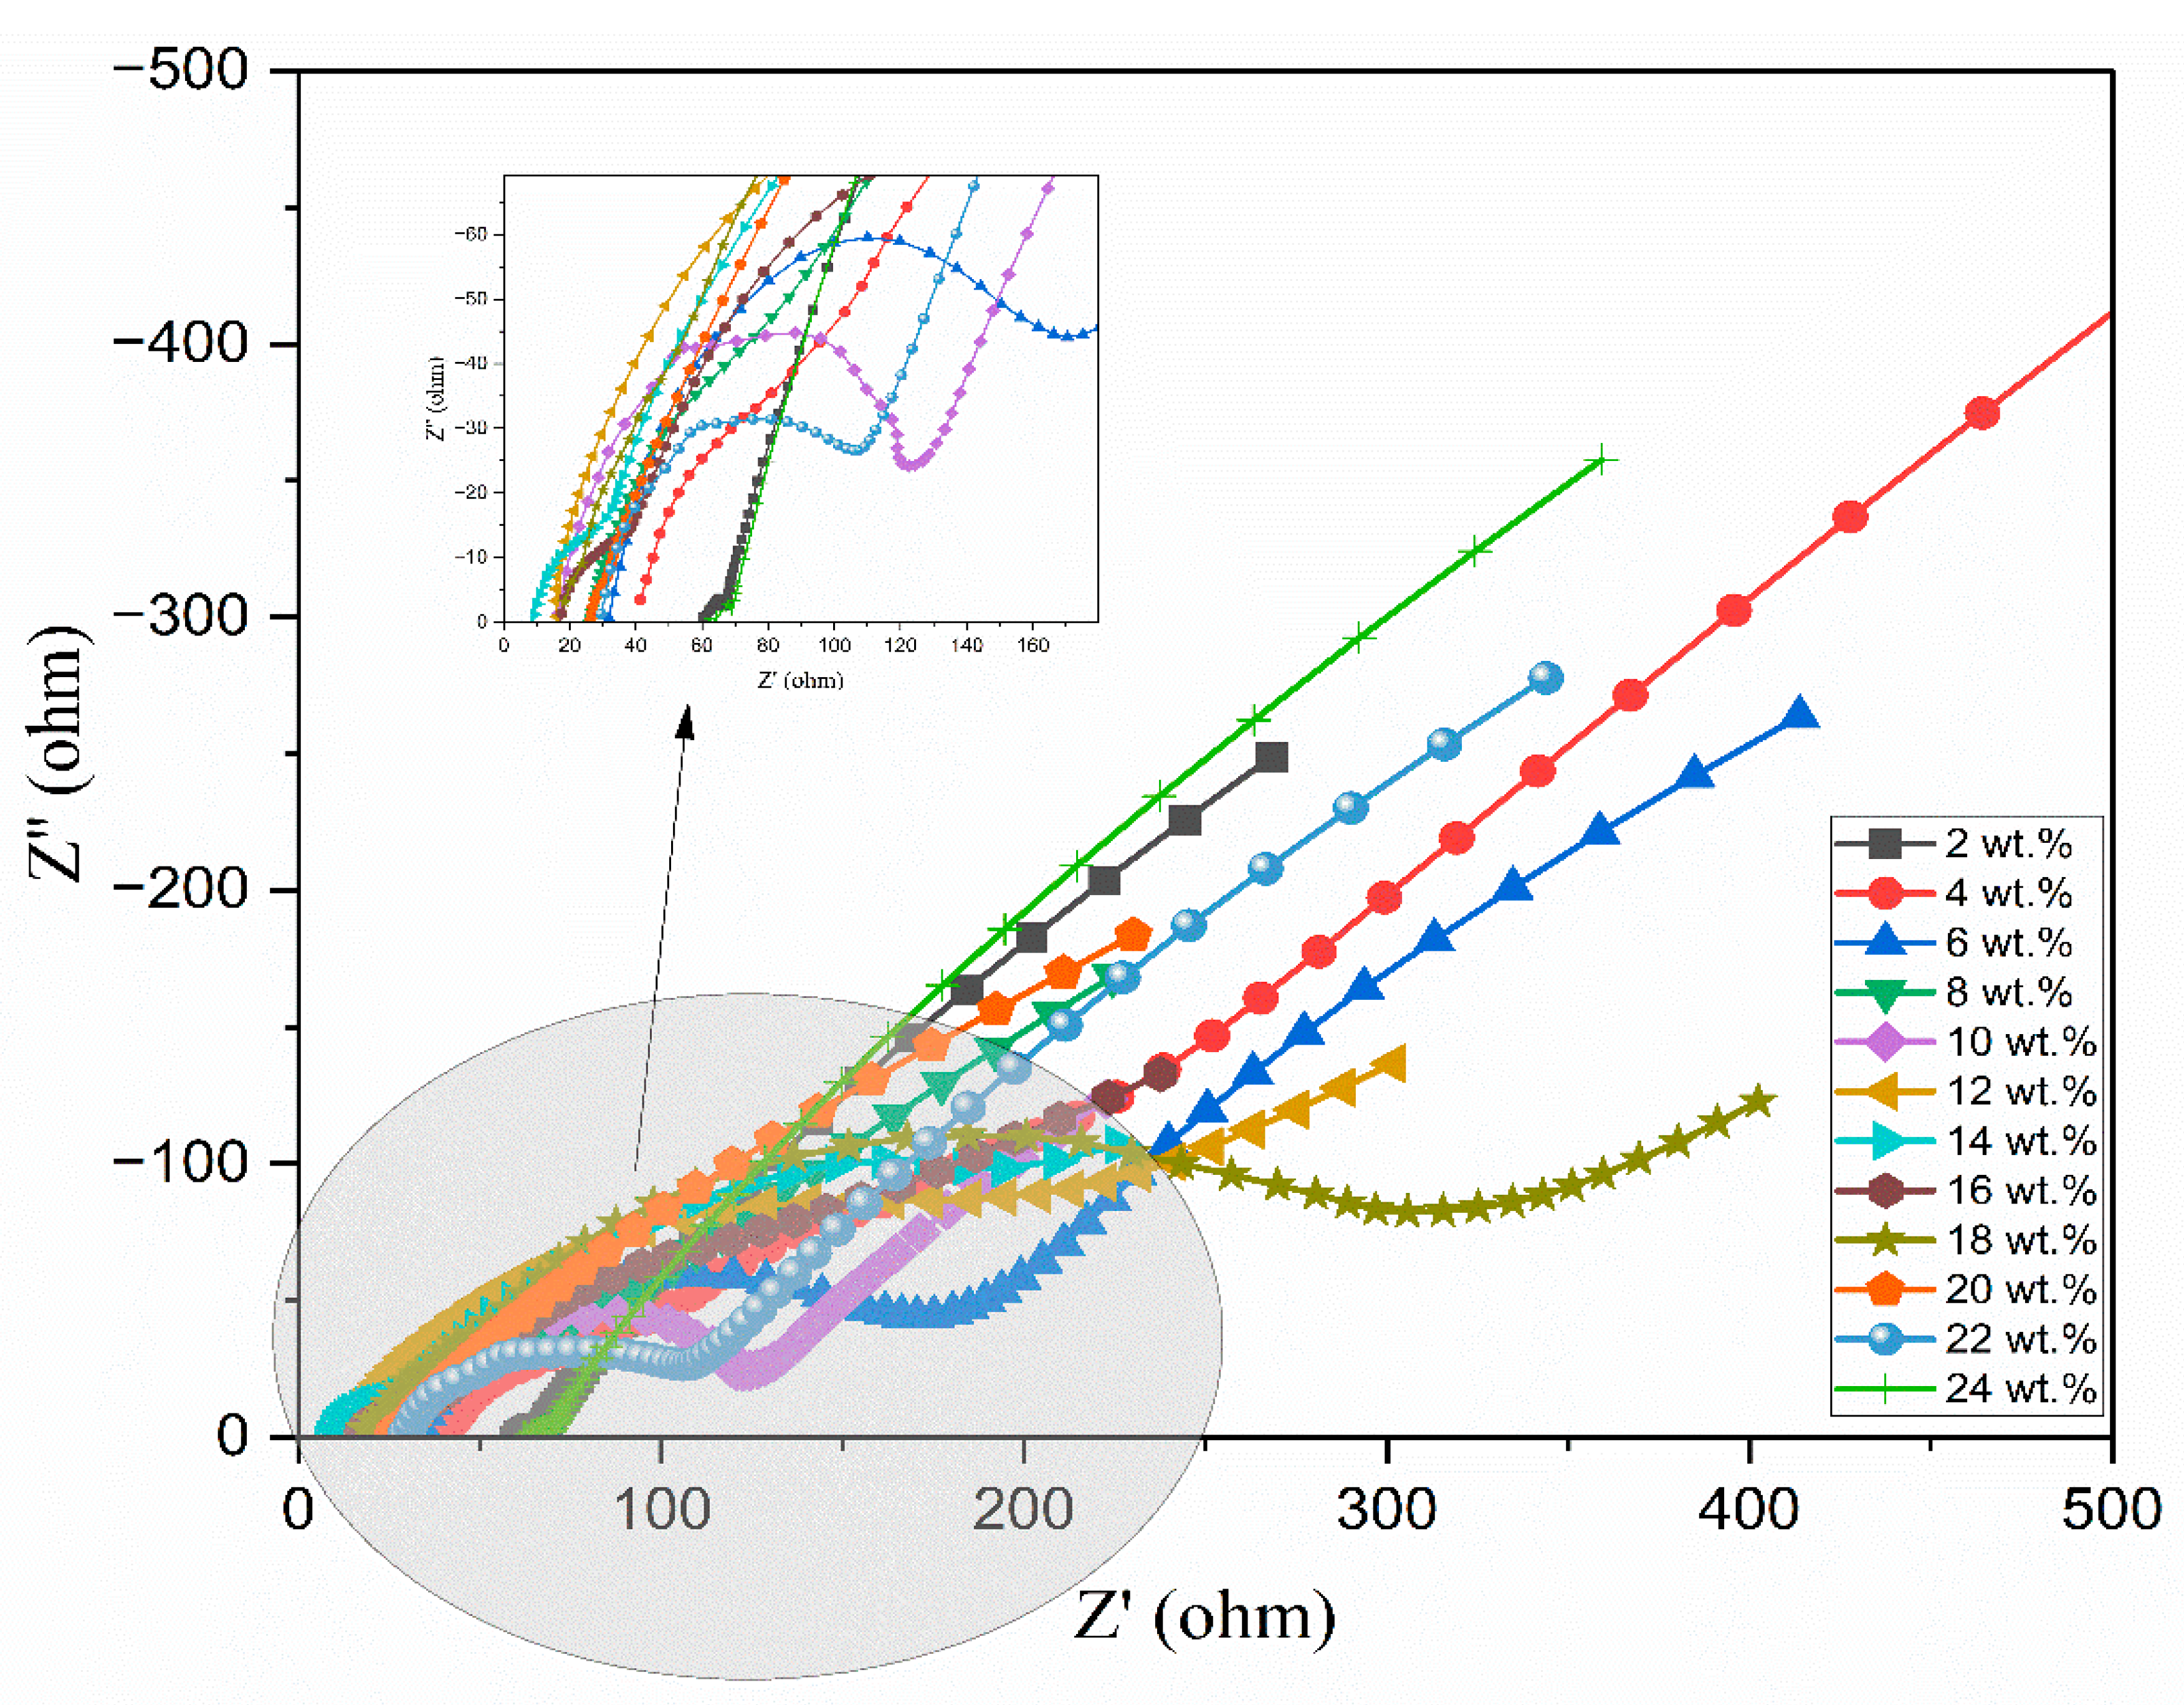
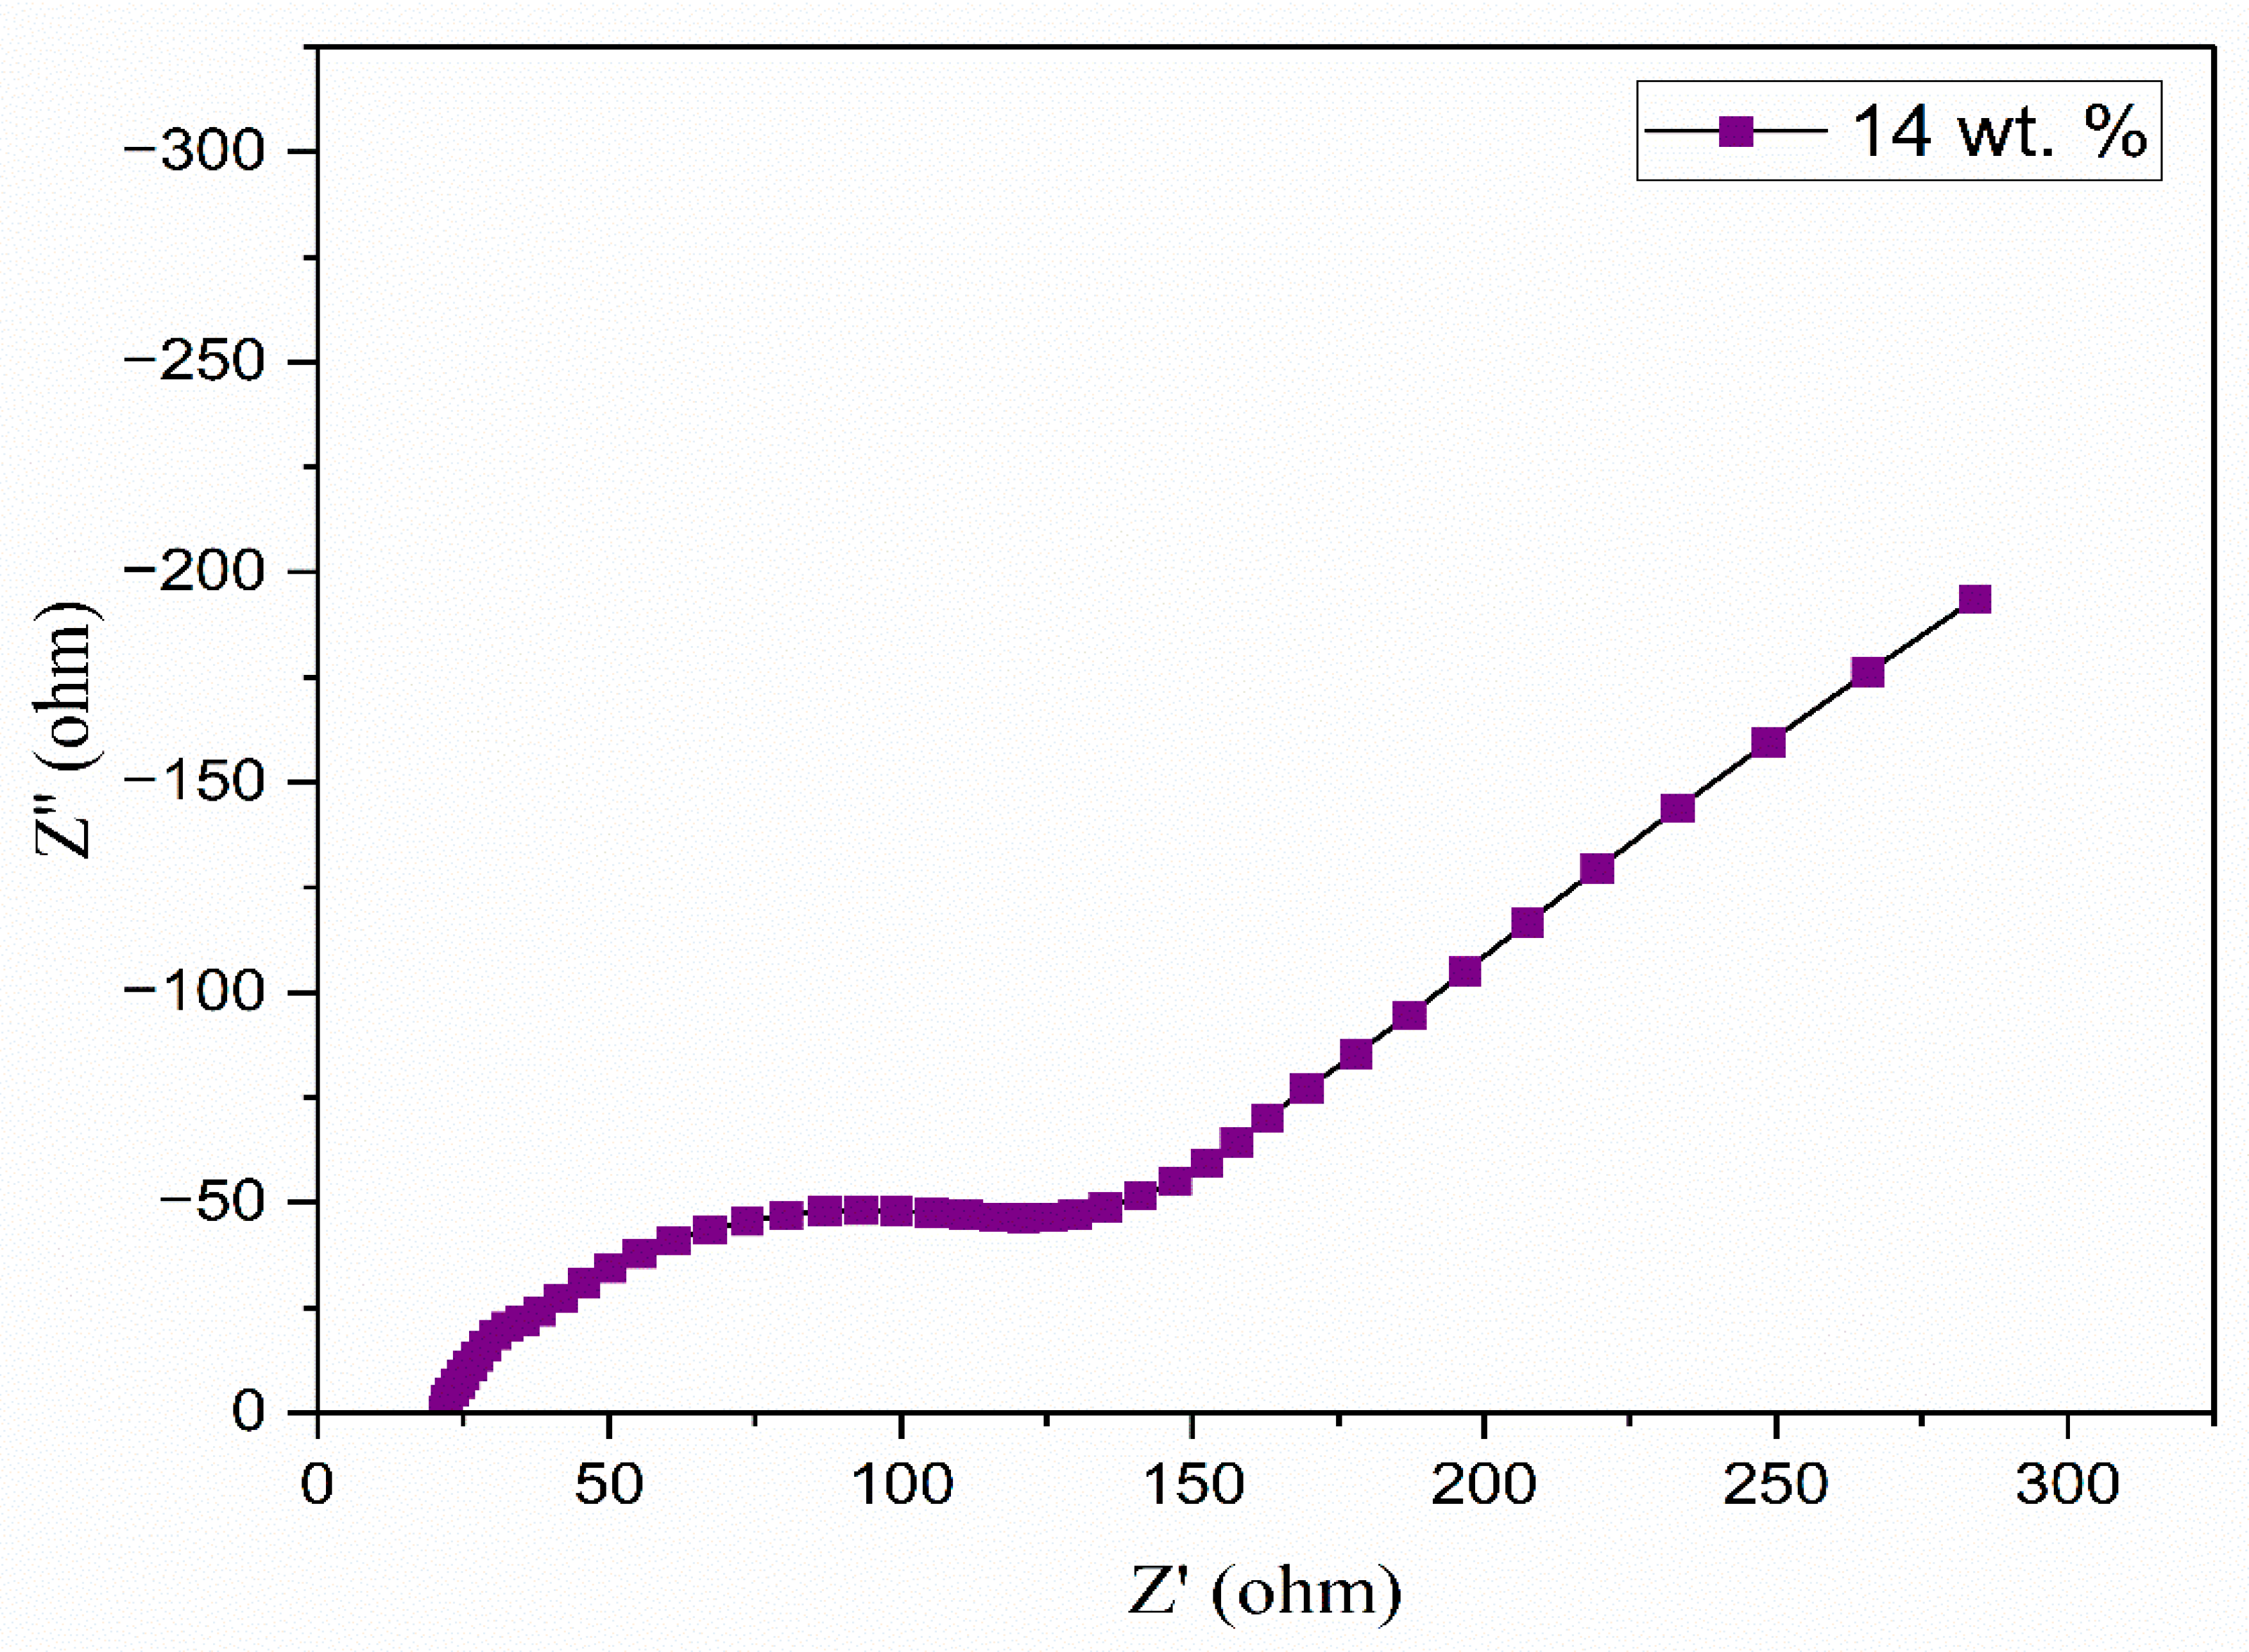
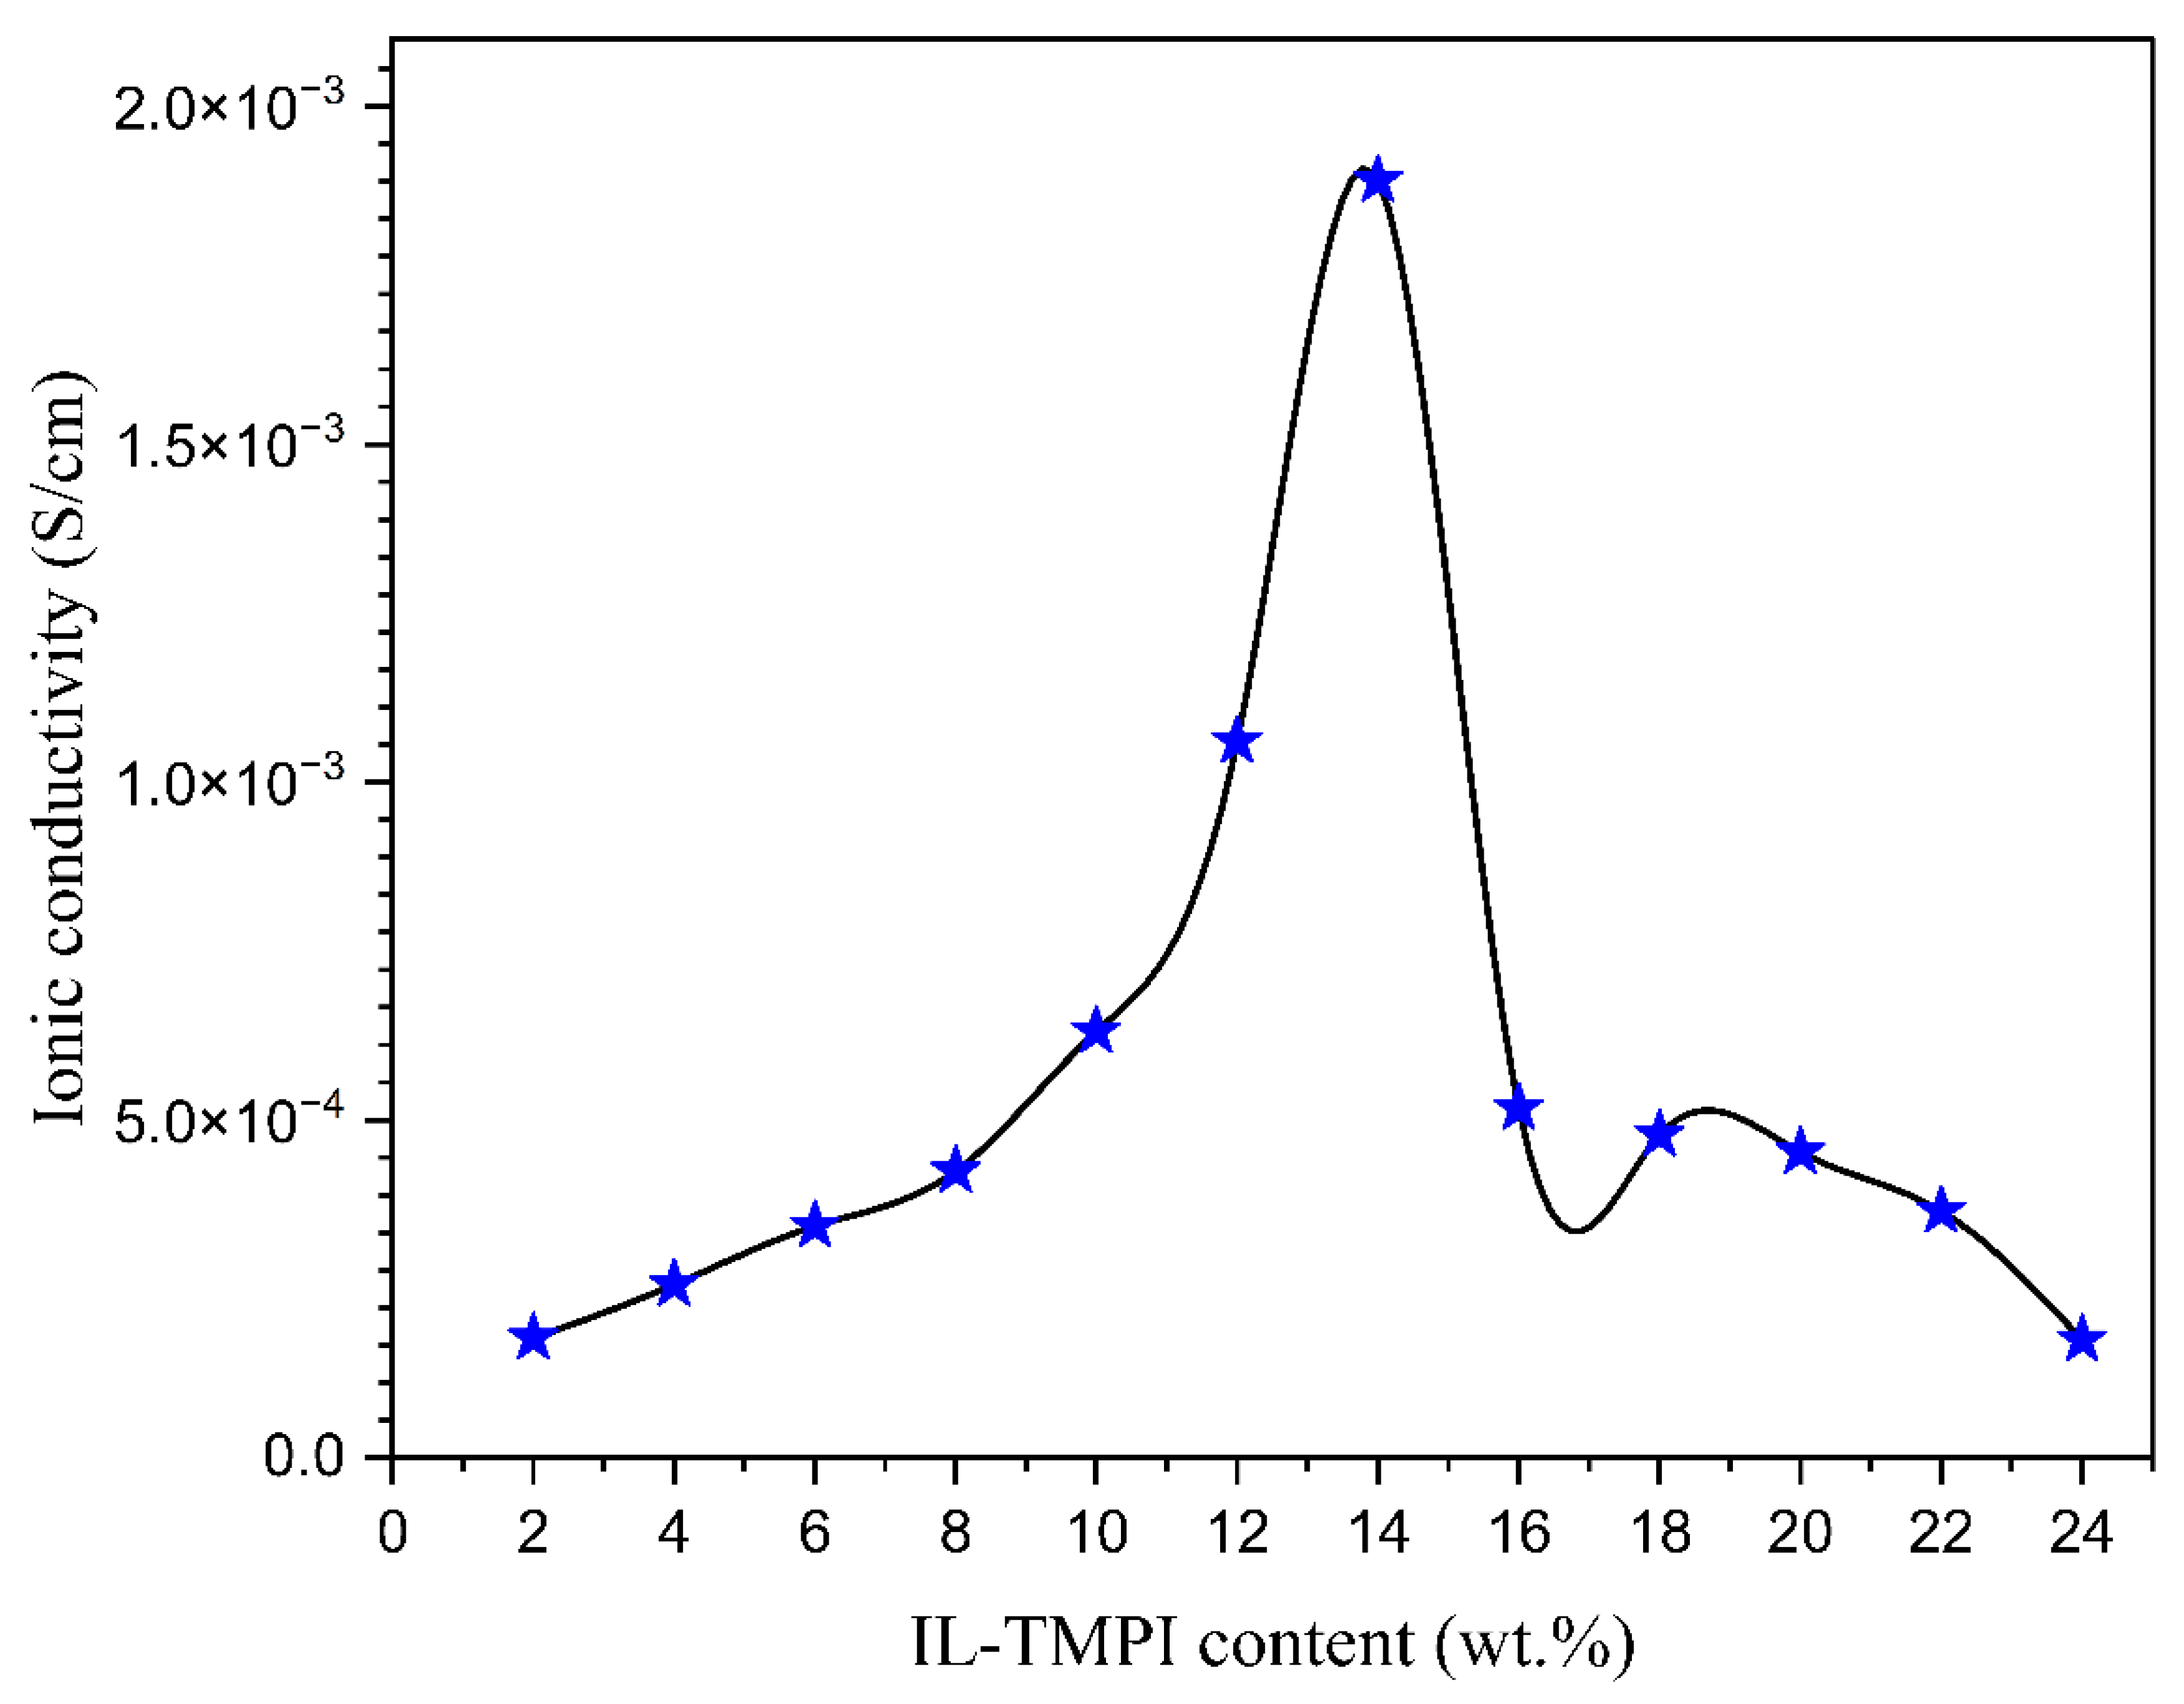
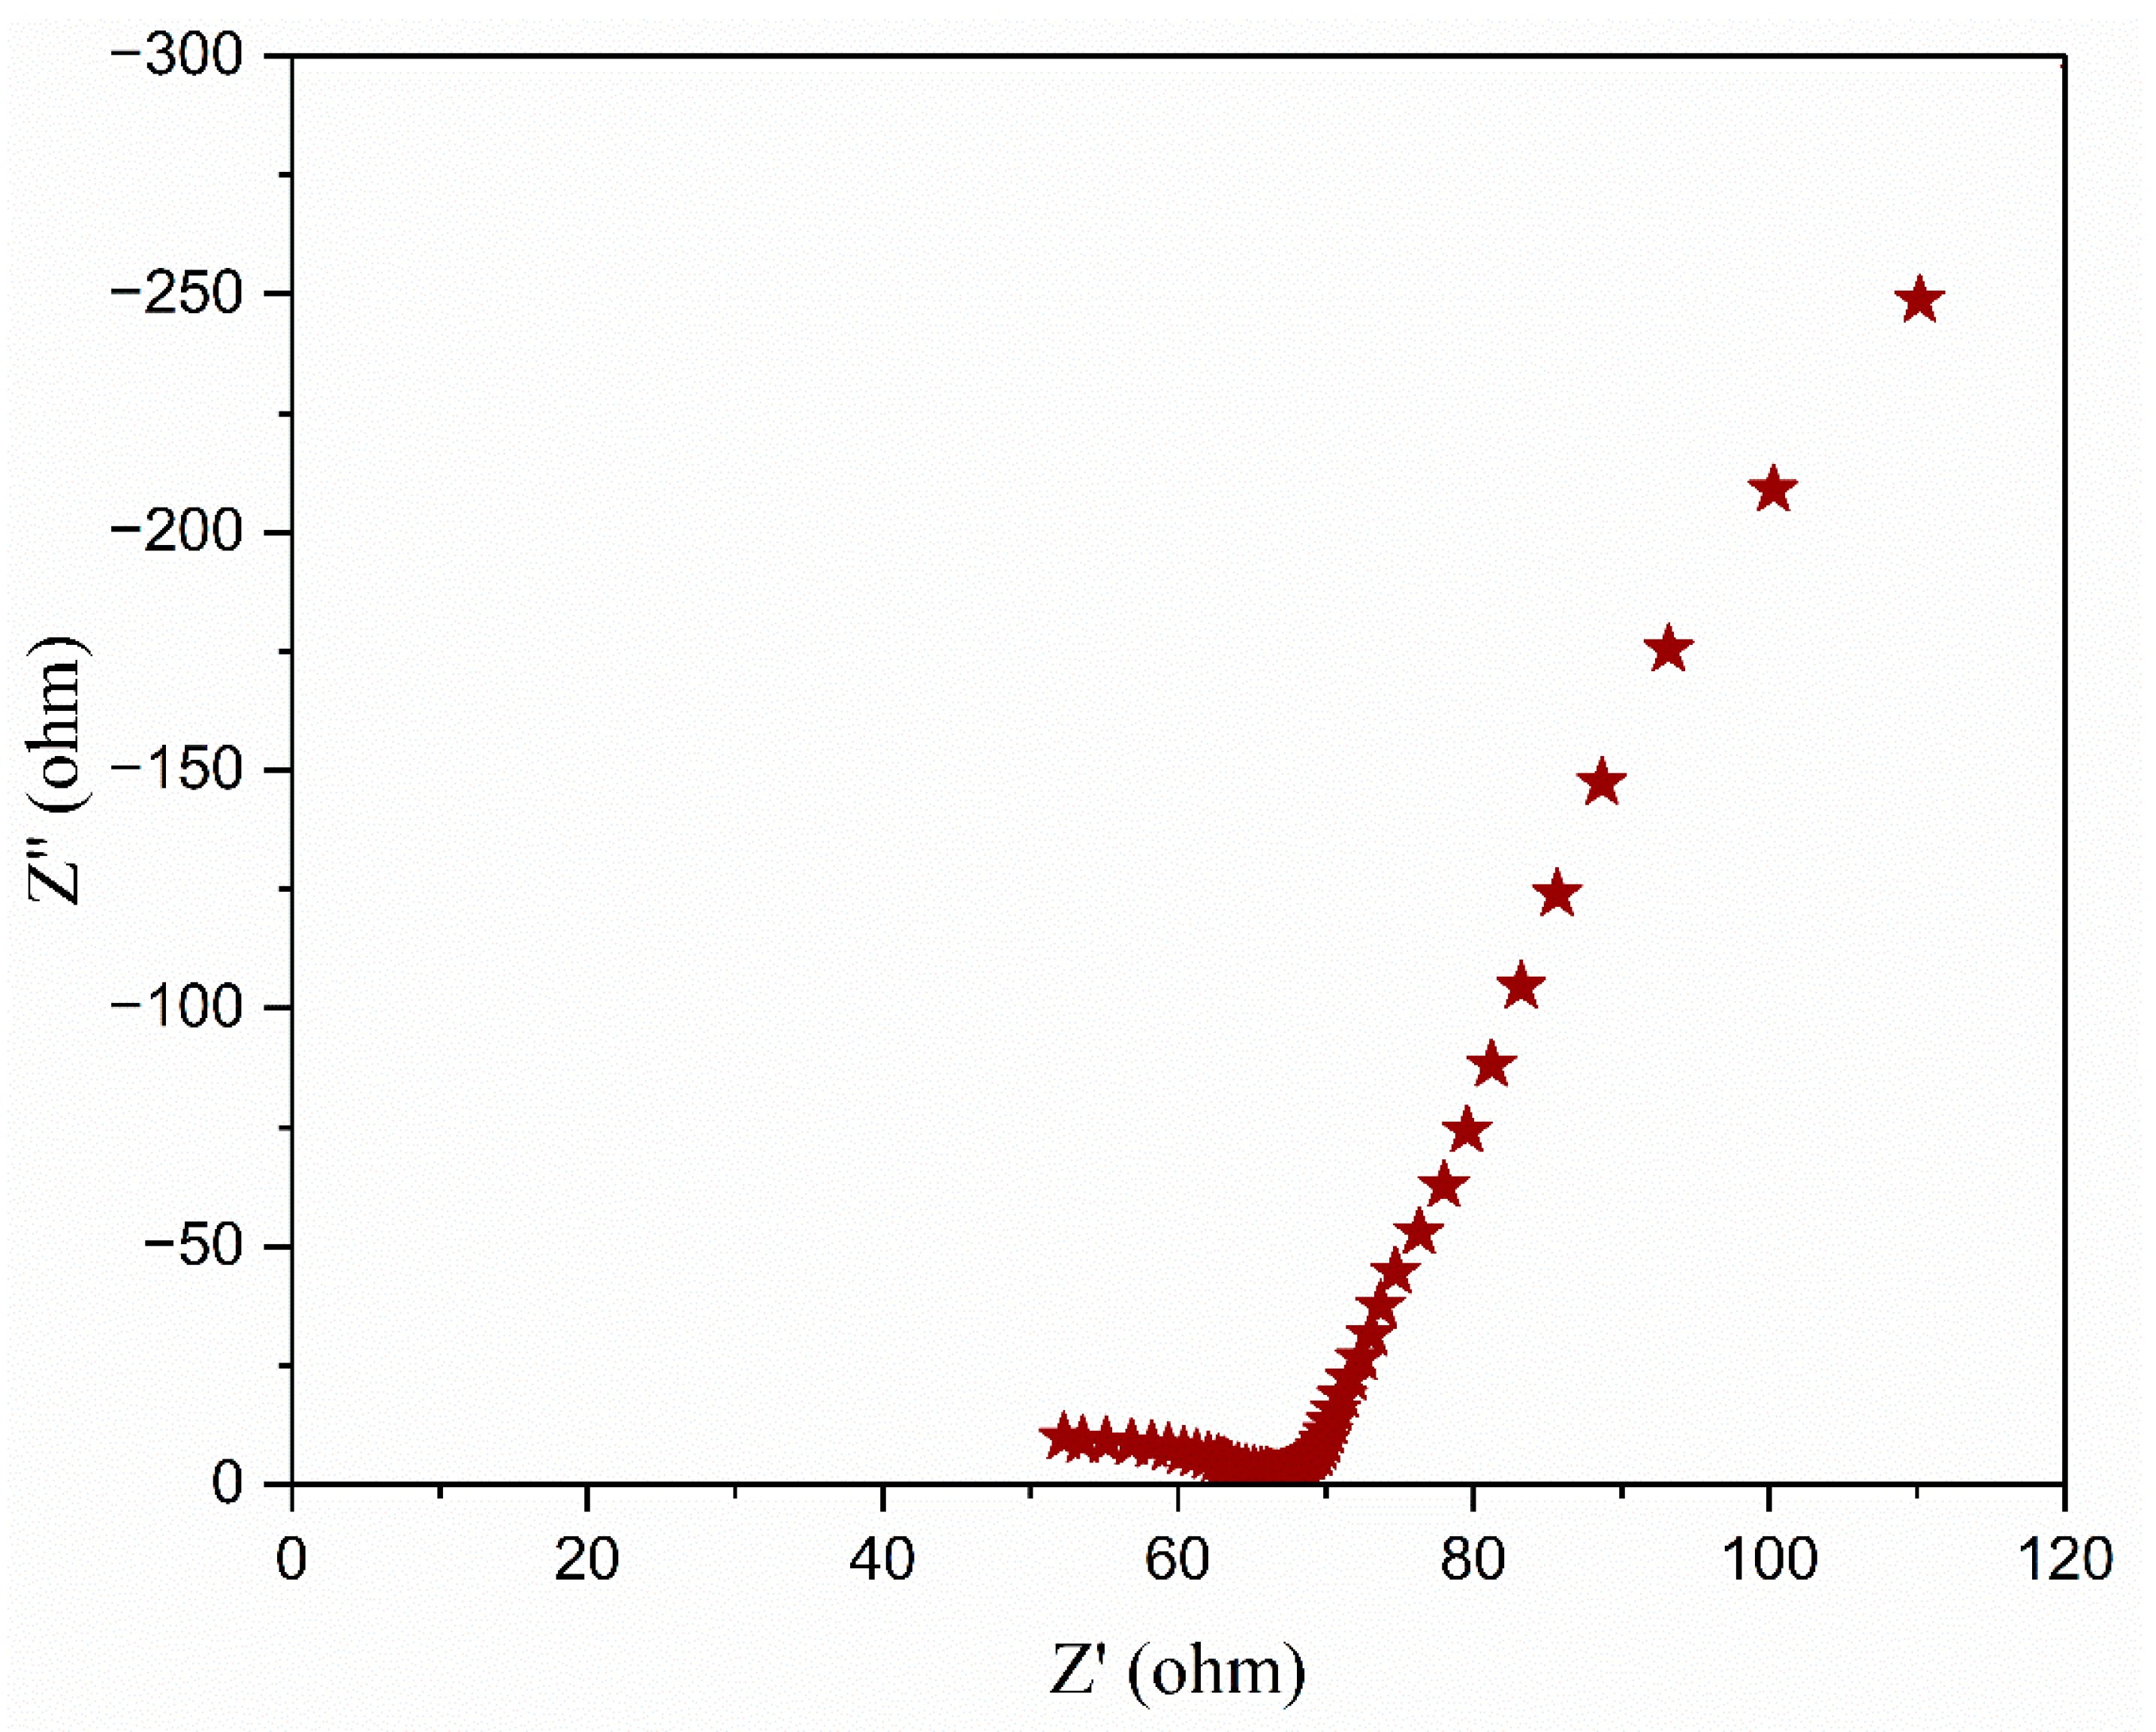
3.5. Complex Impedance Spectroscopy
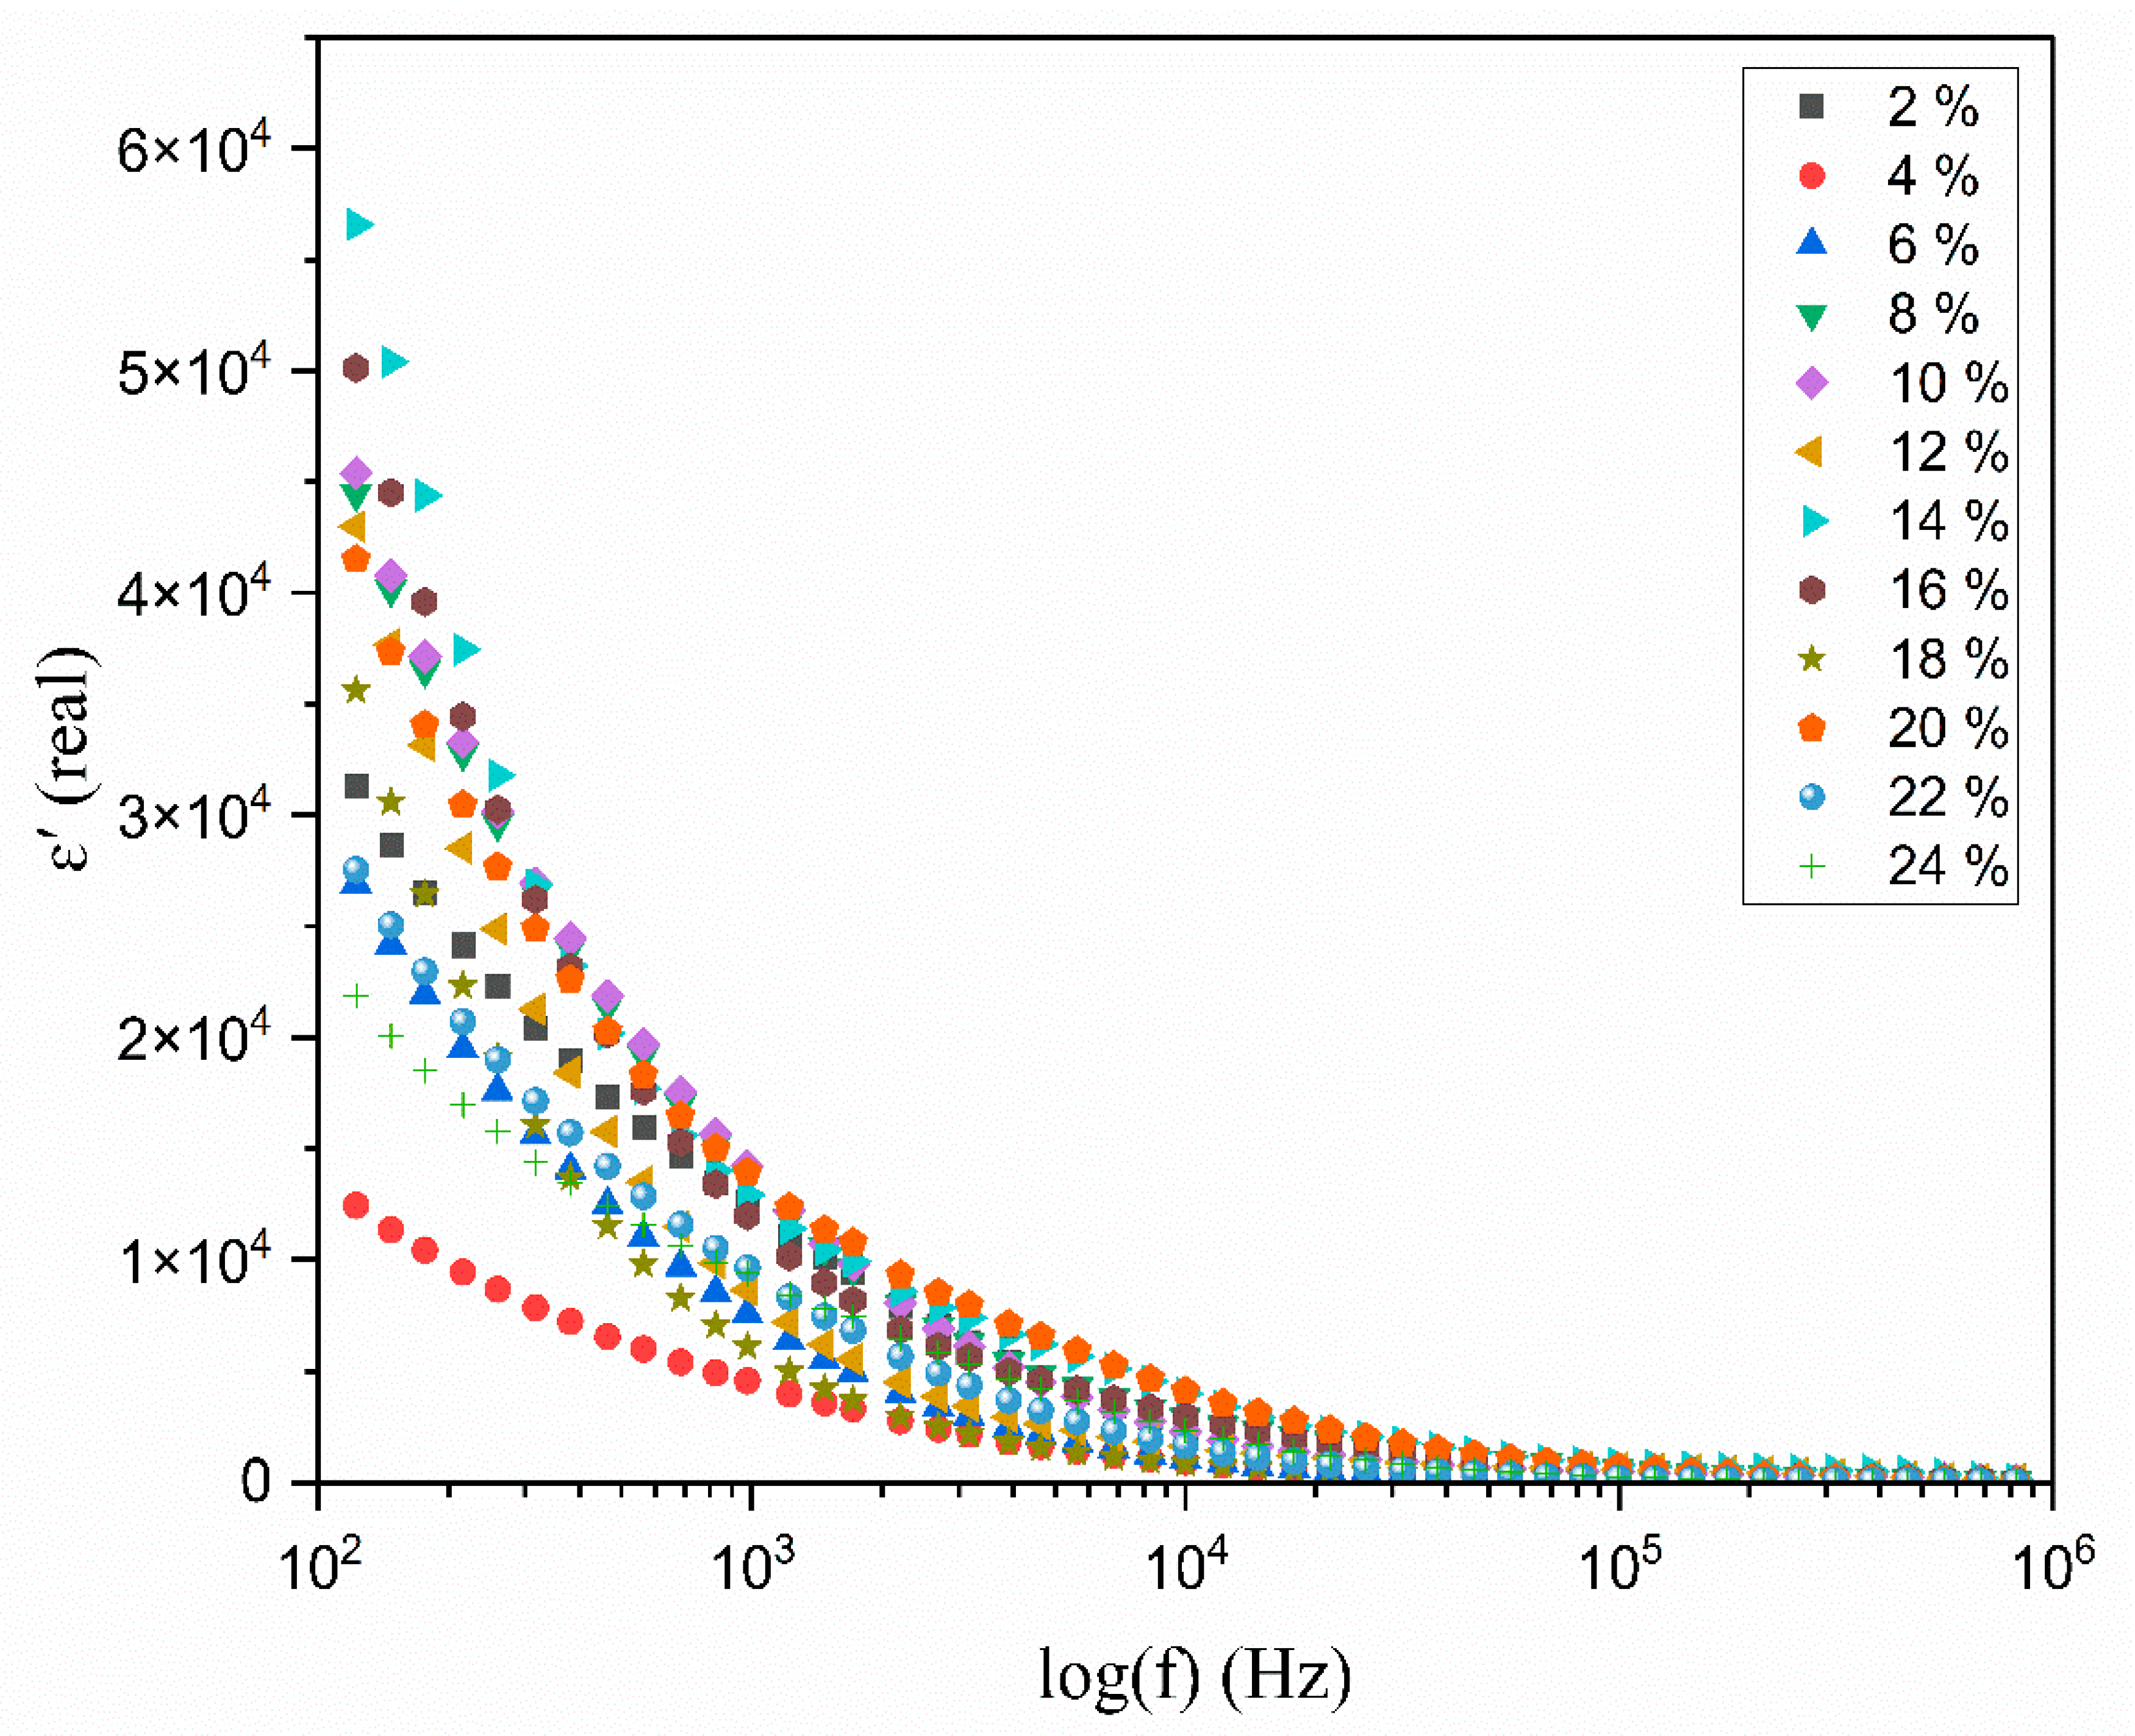
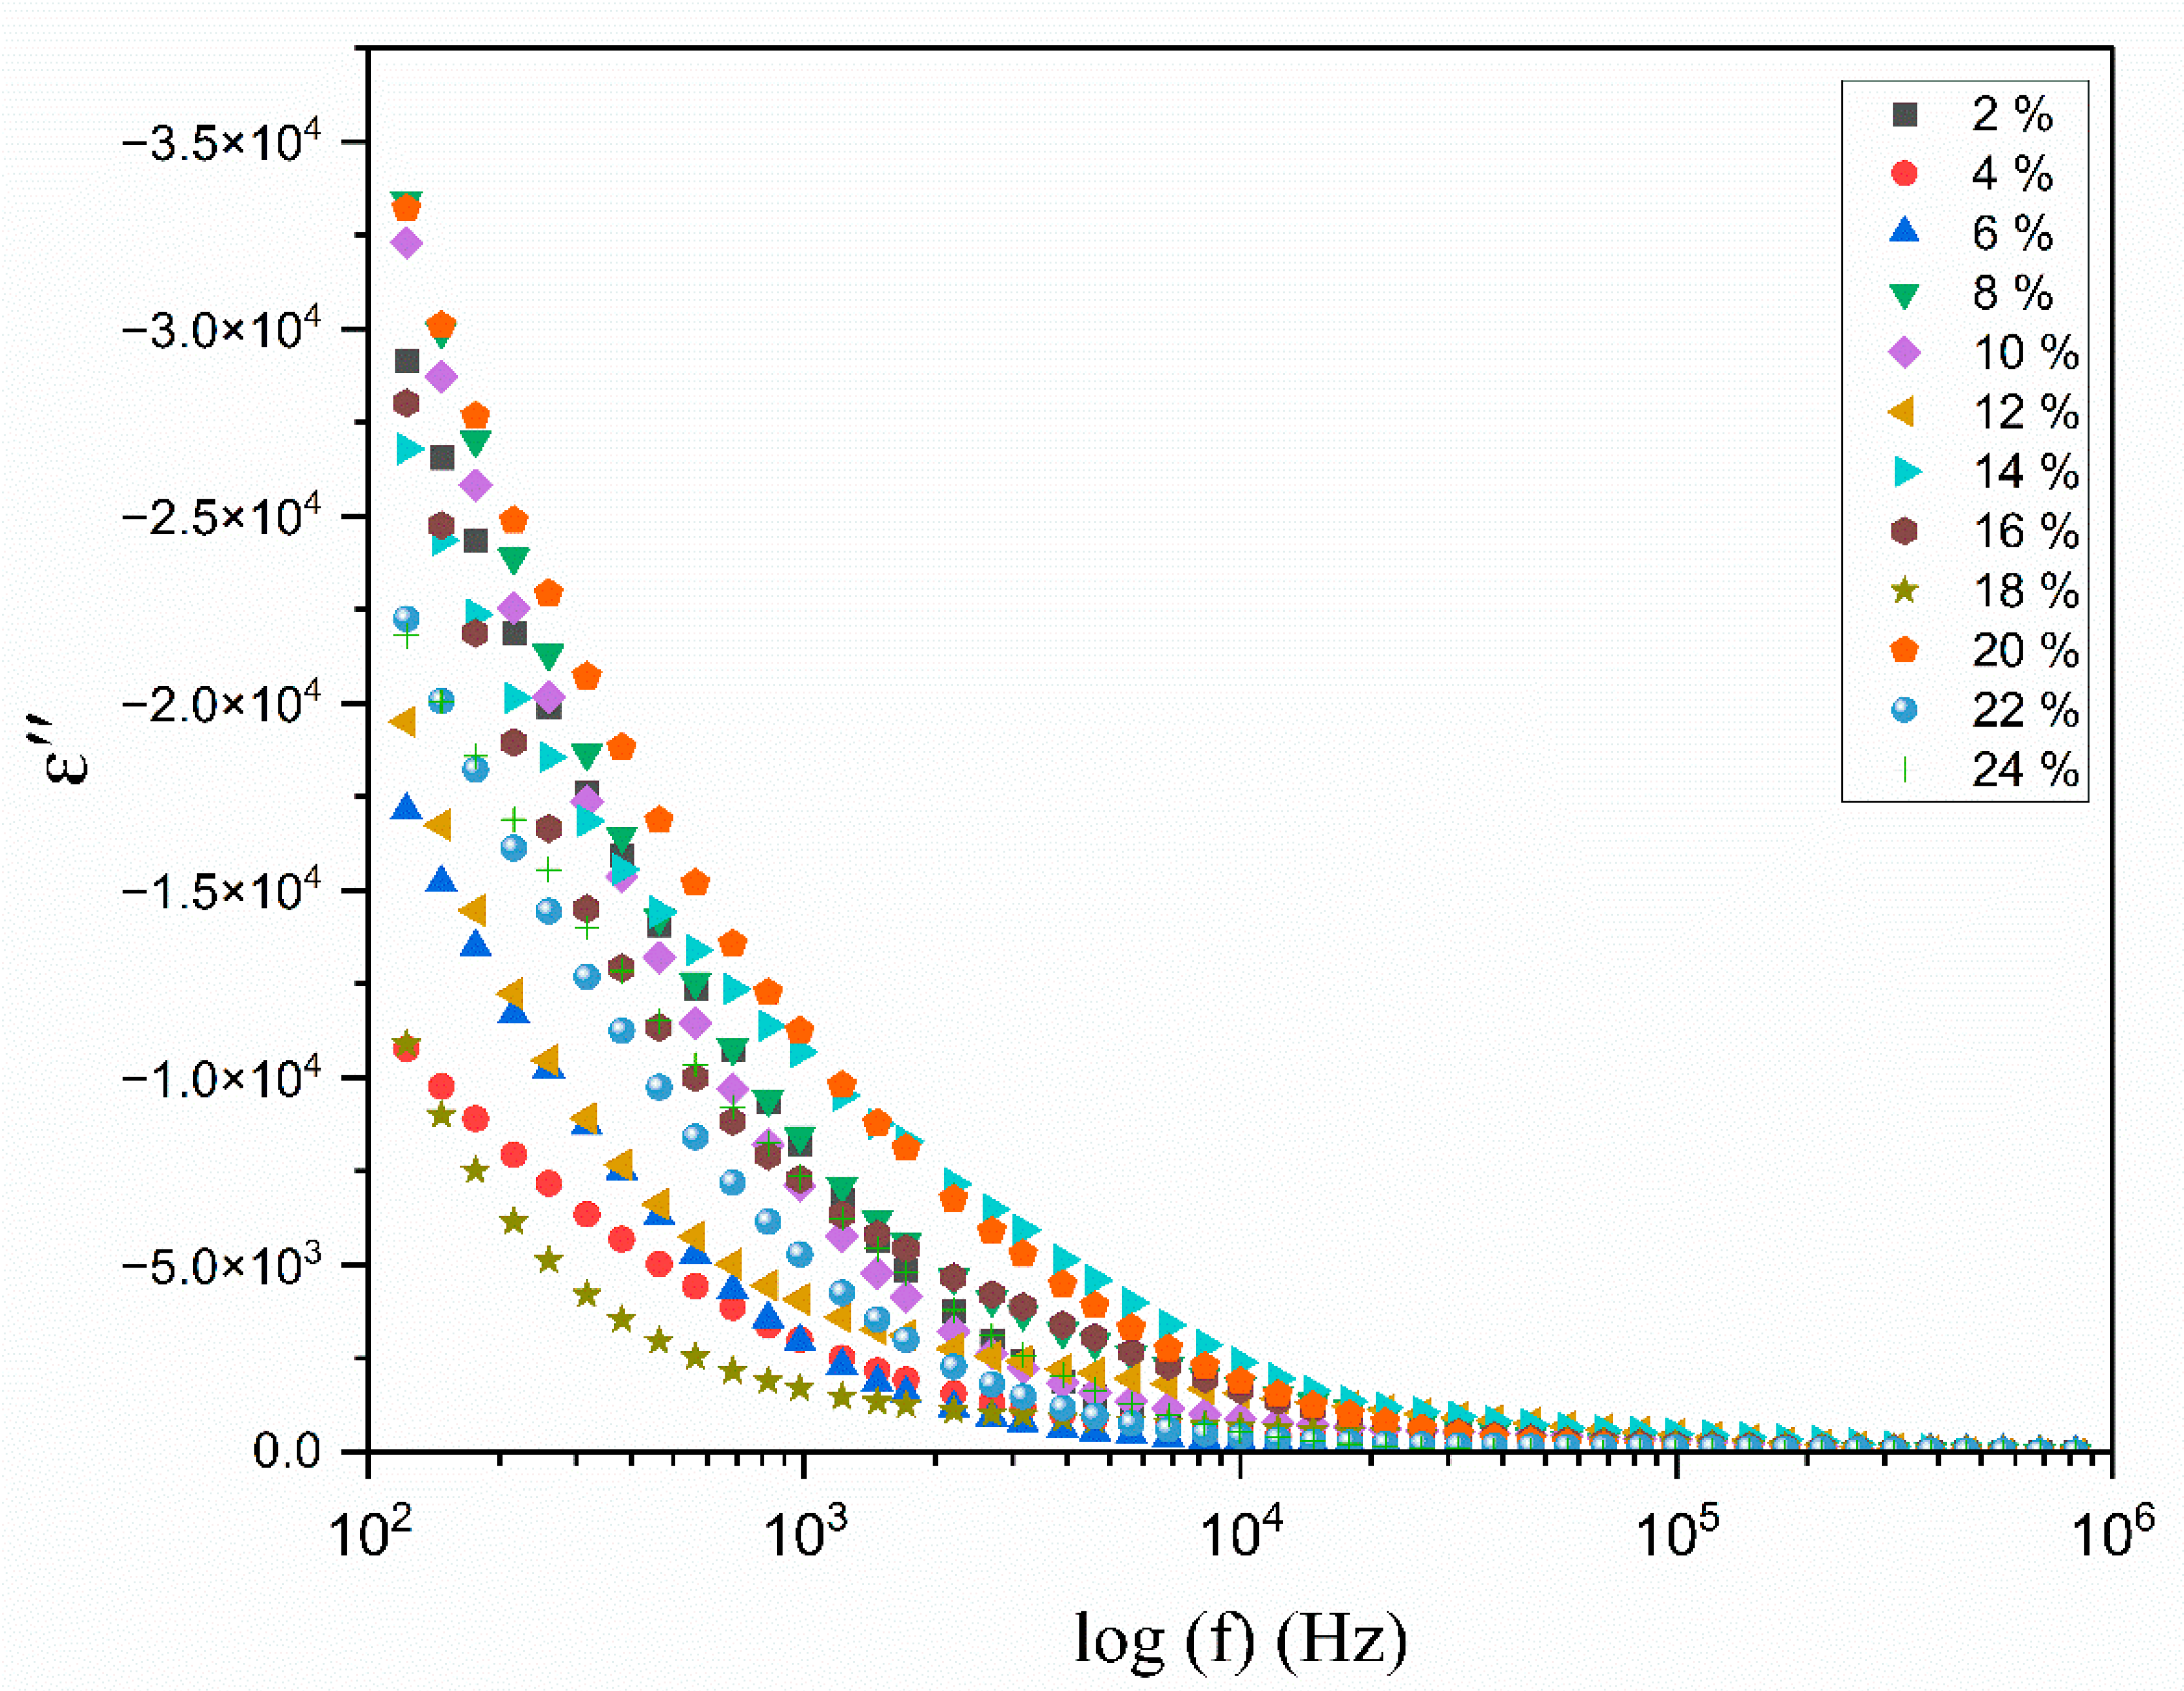
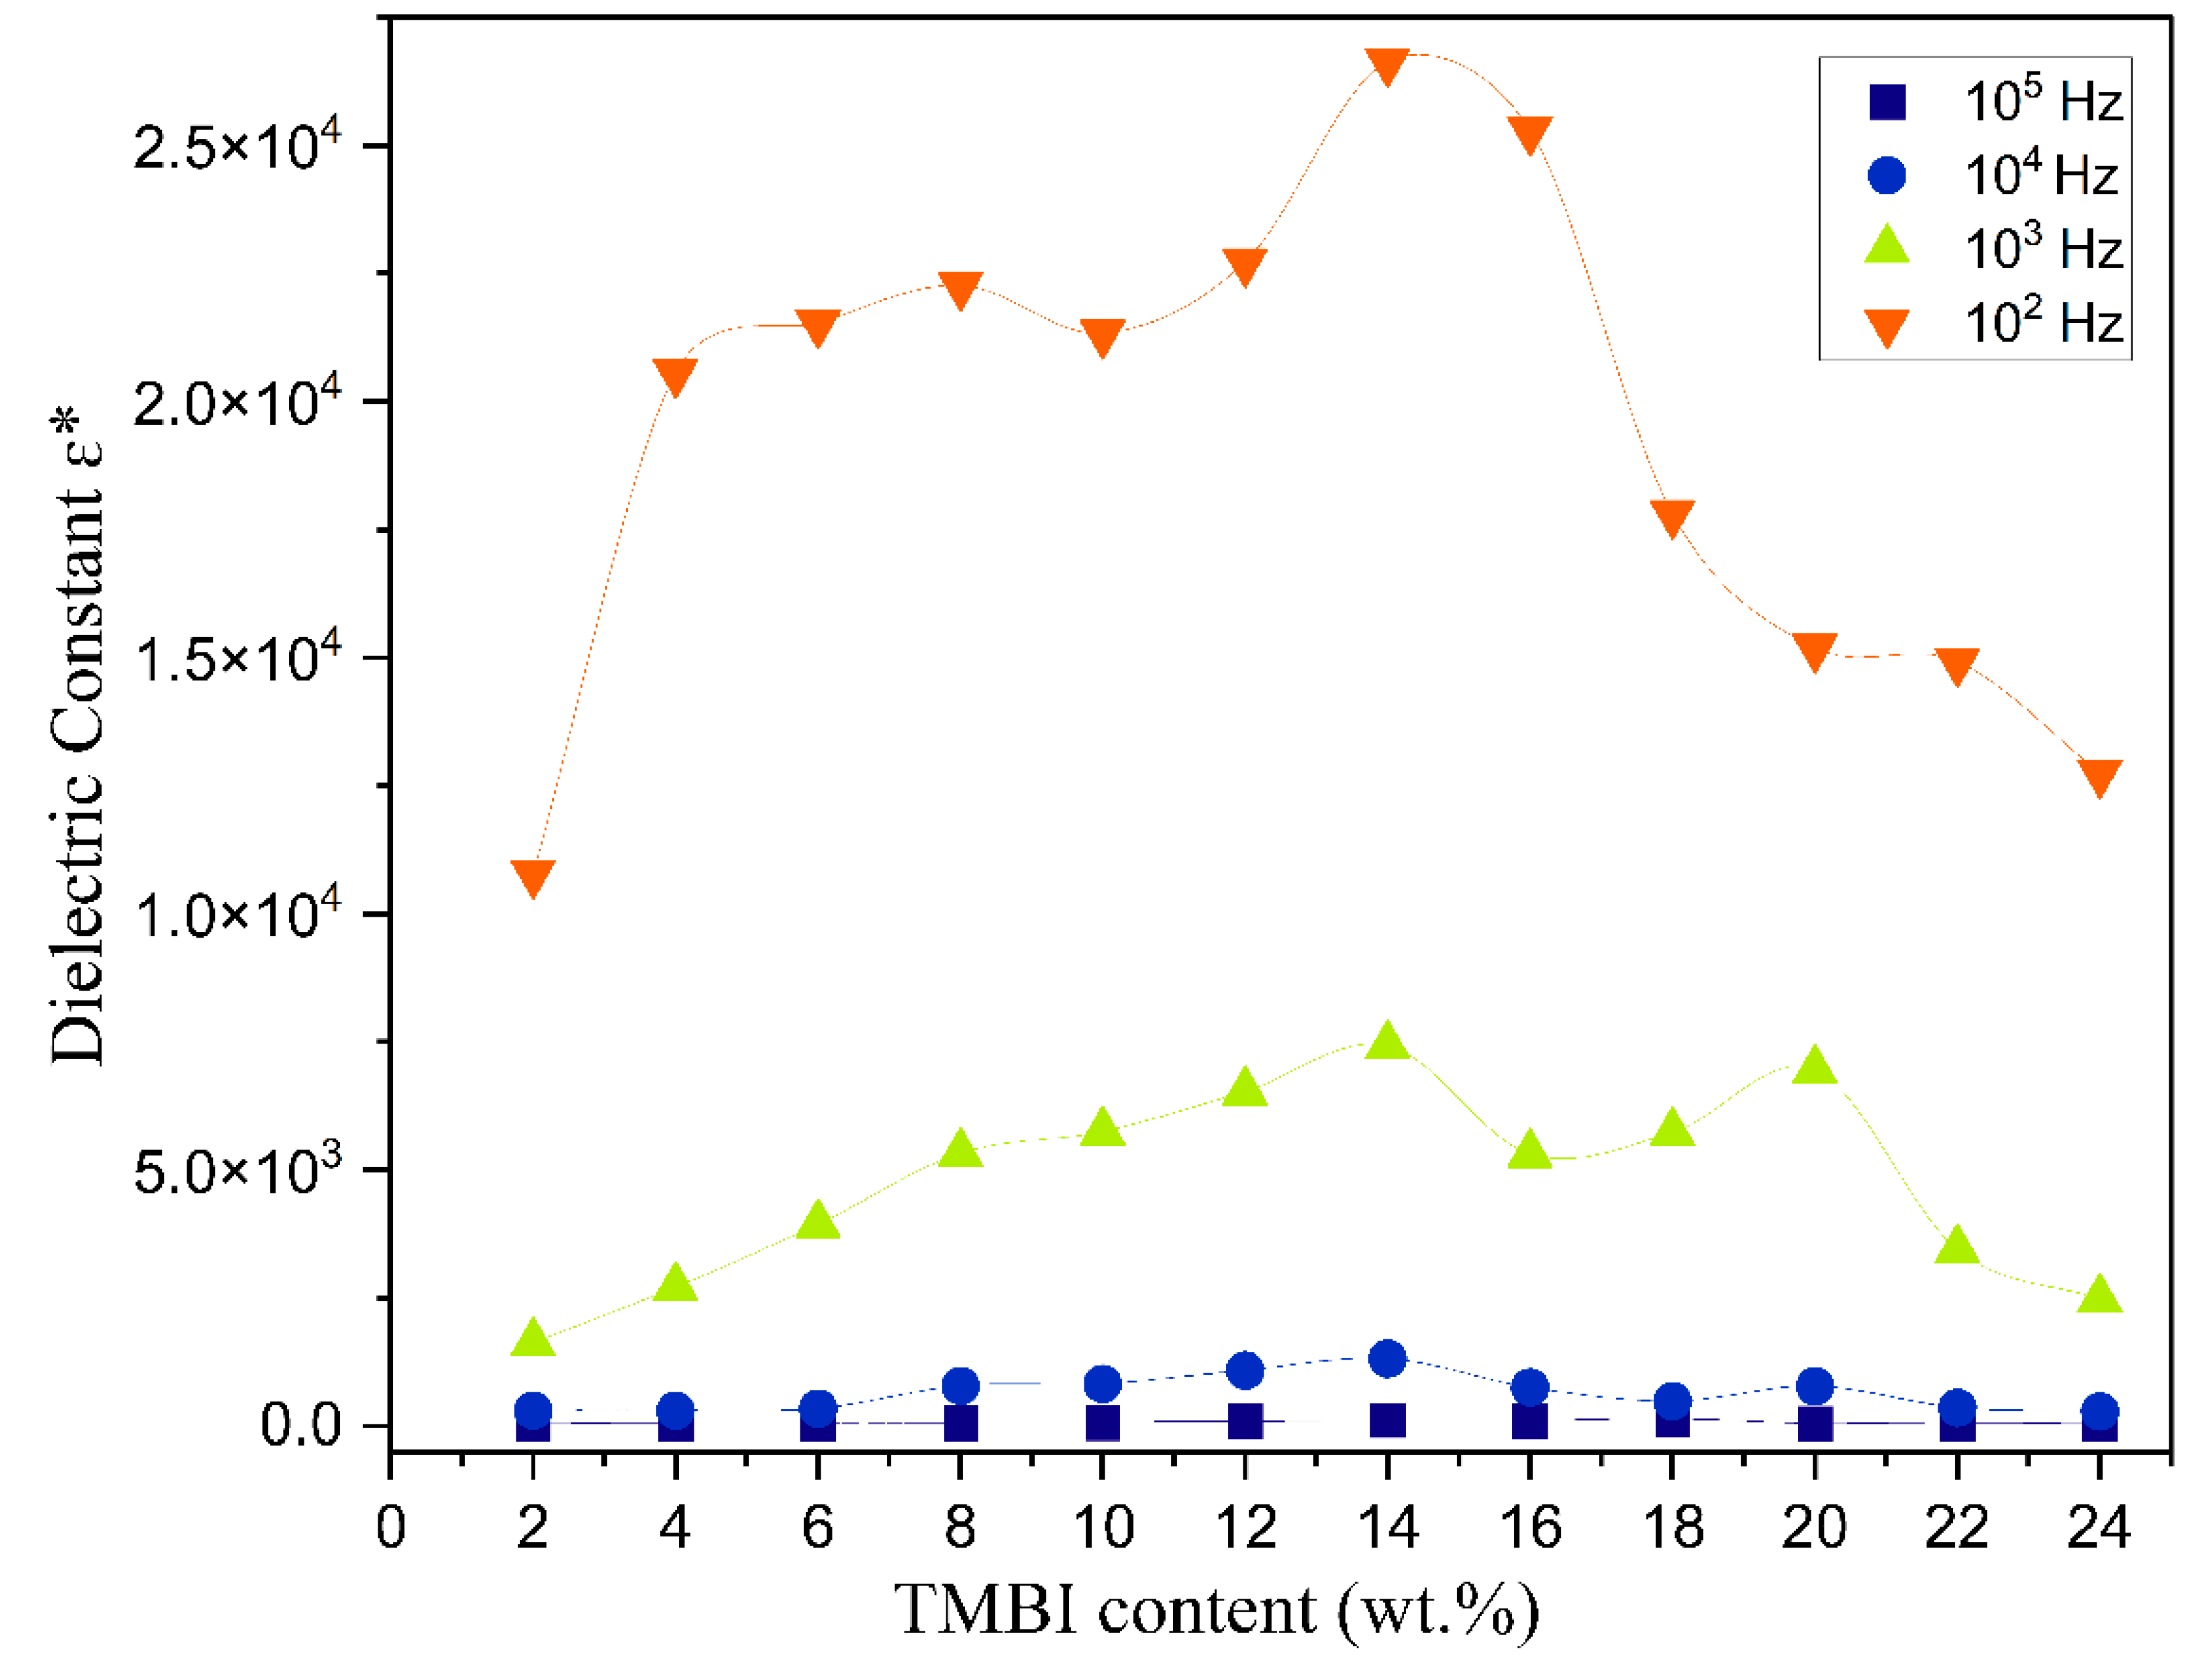
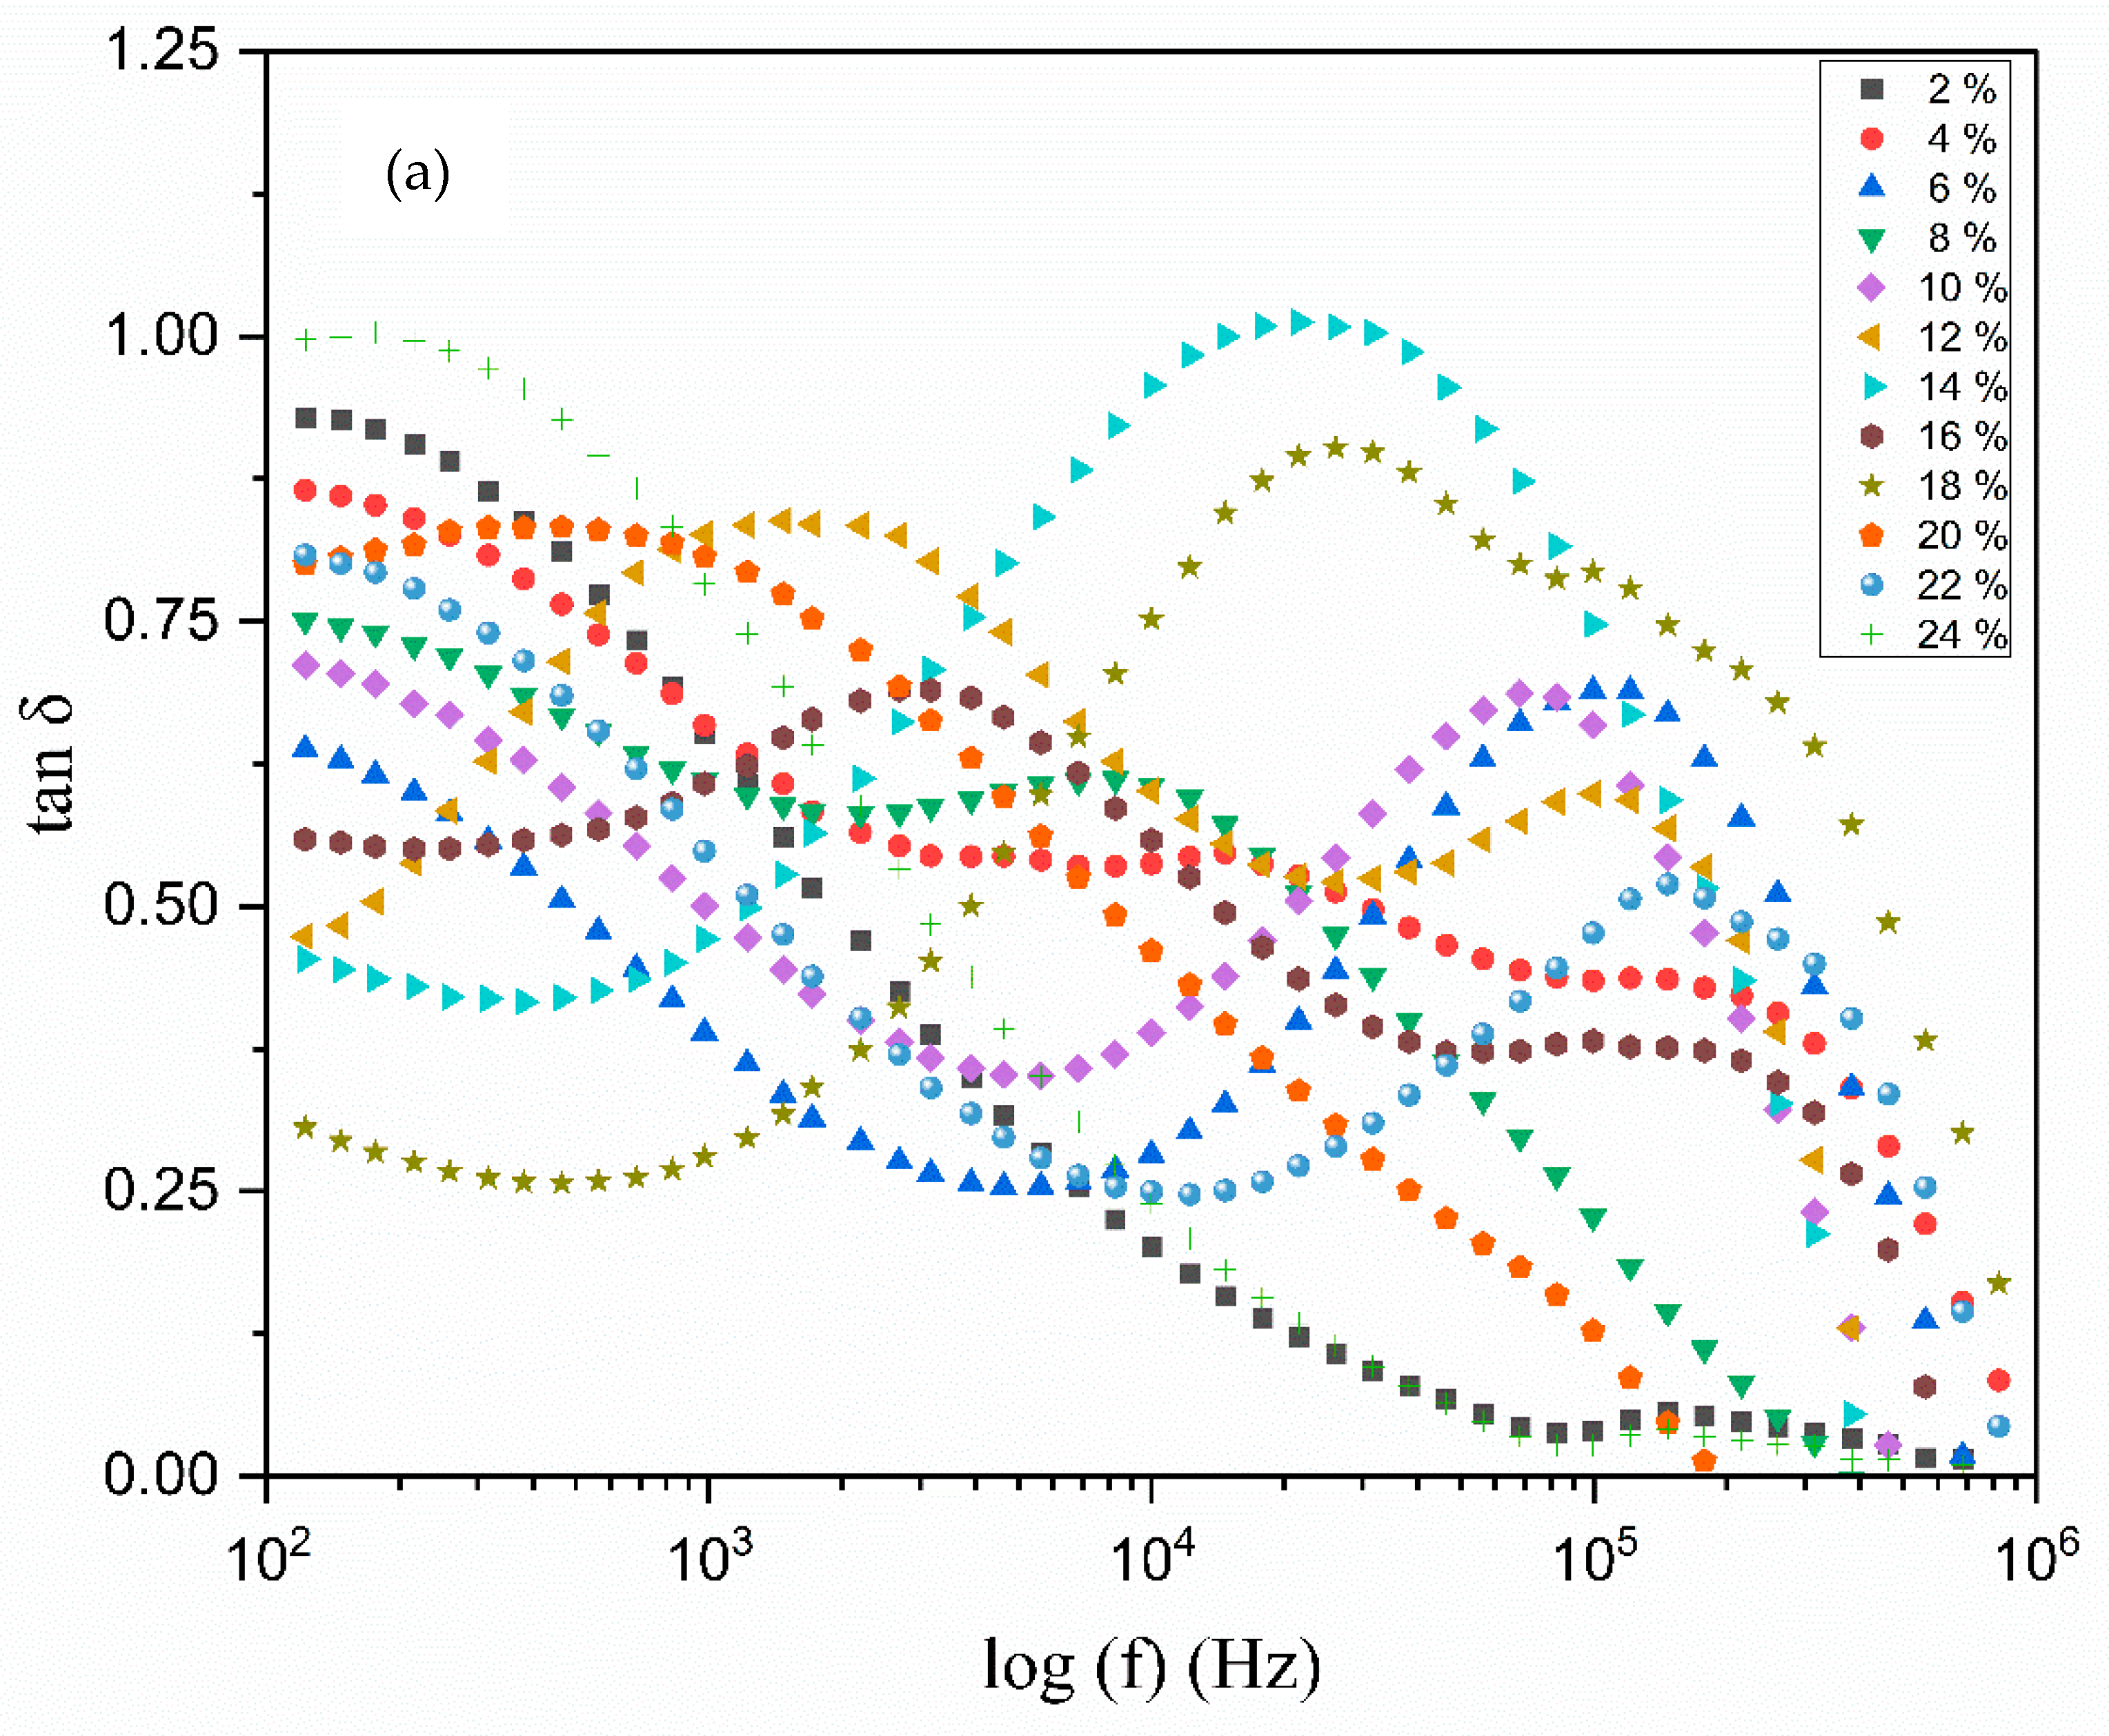
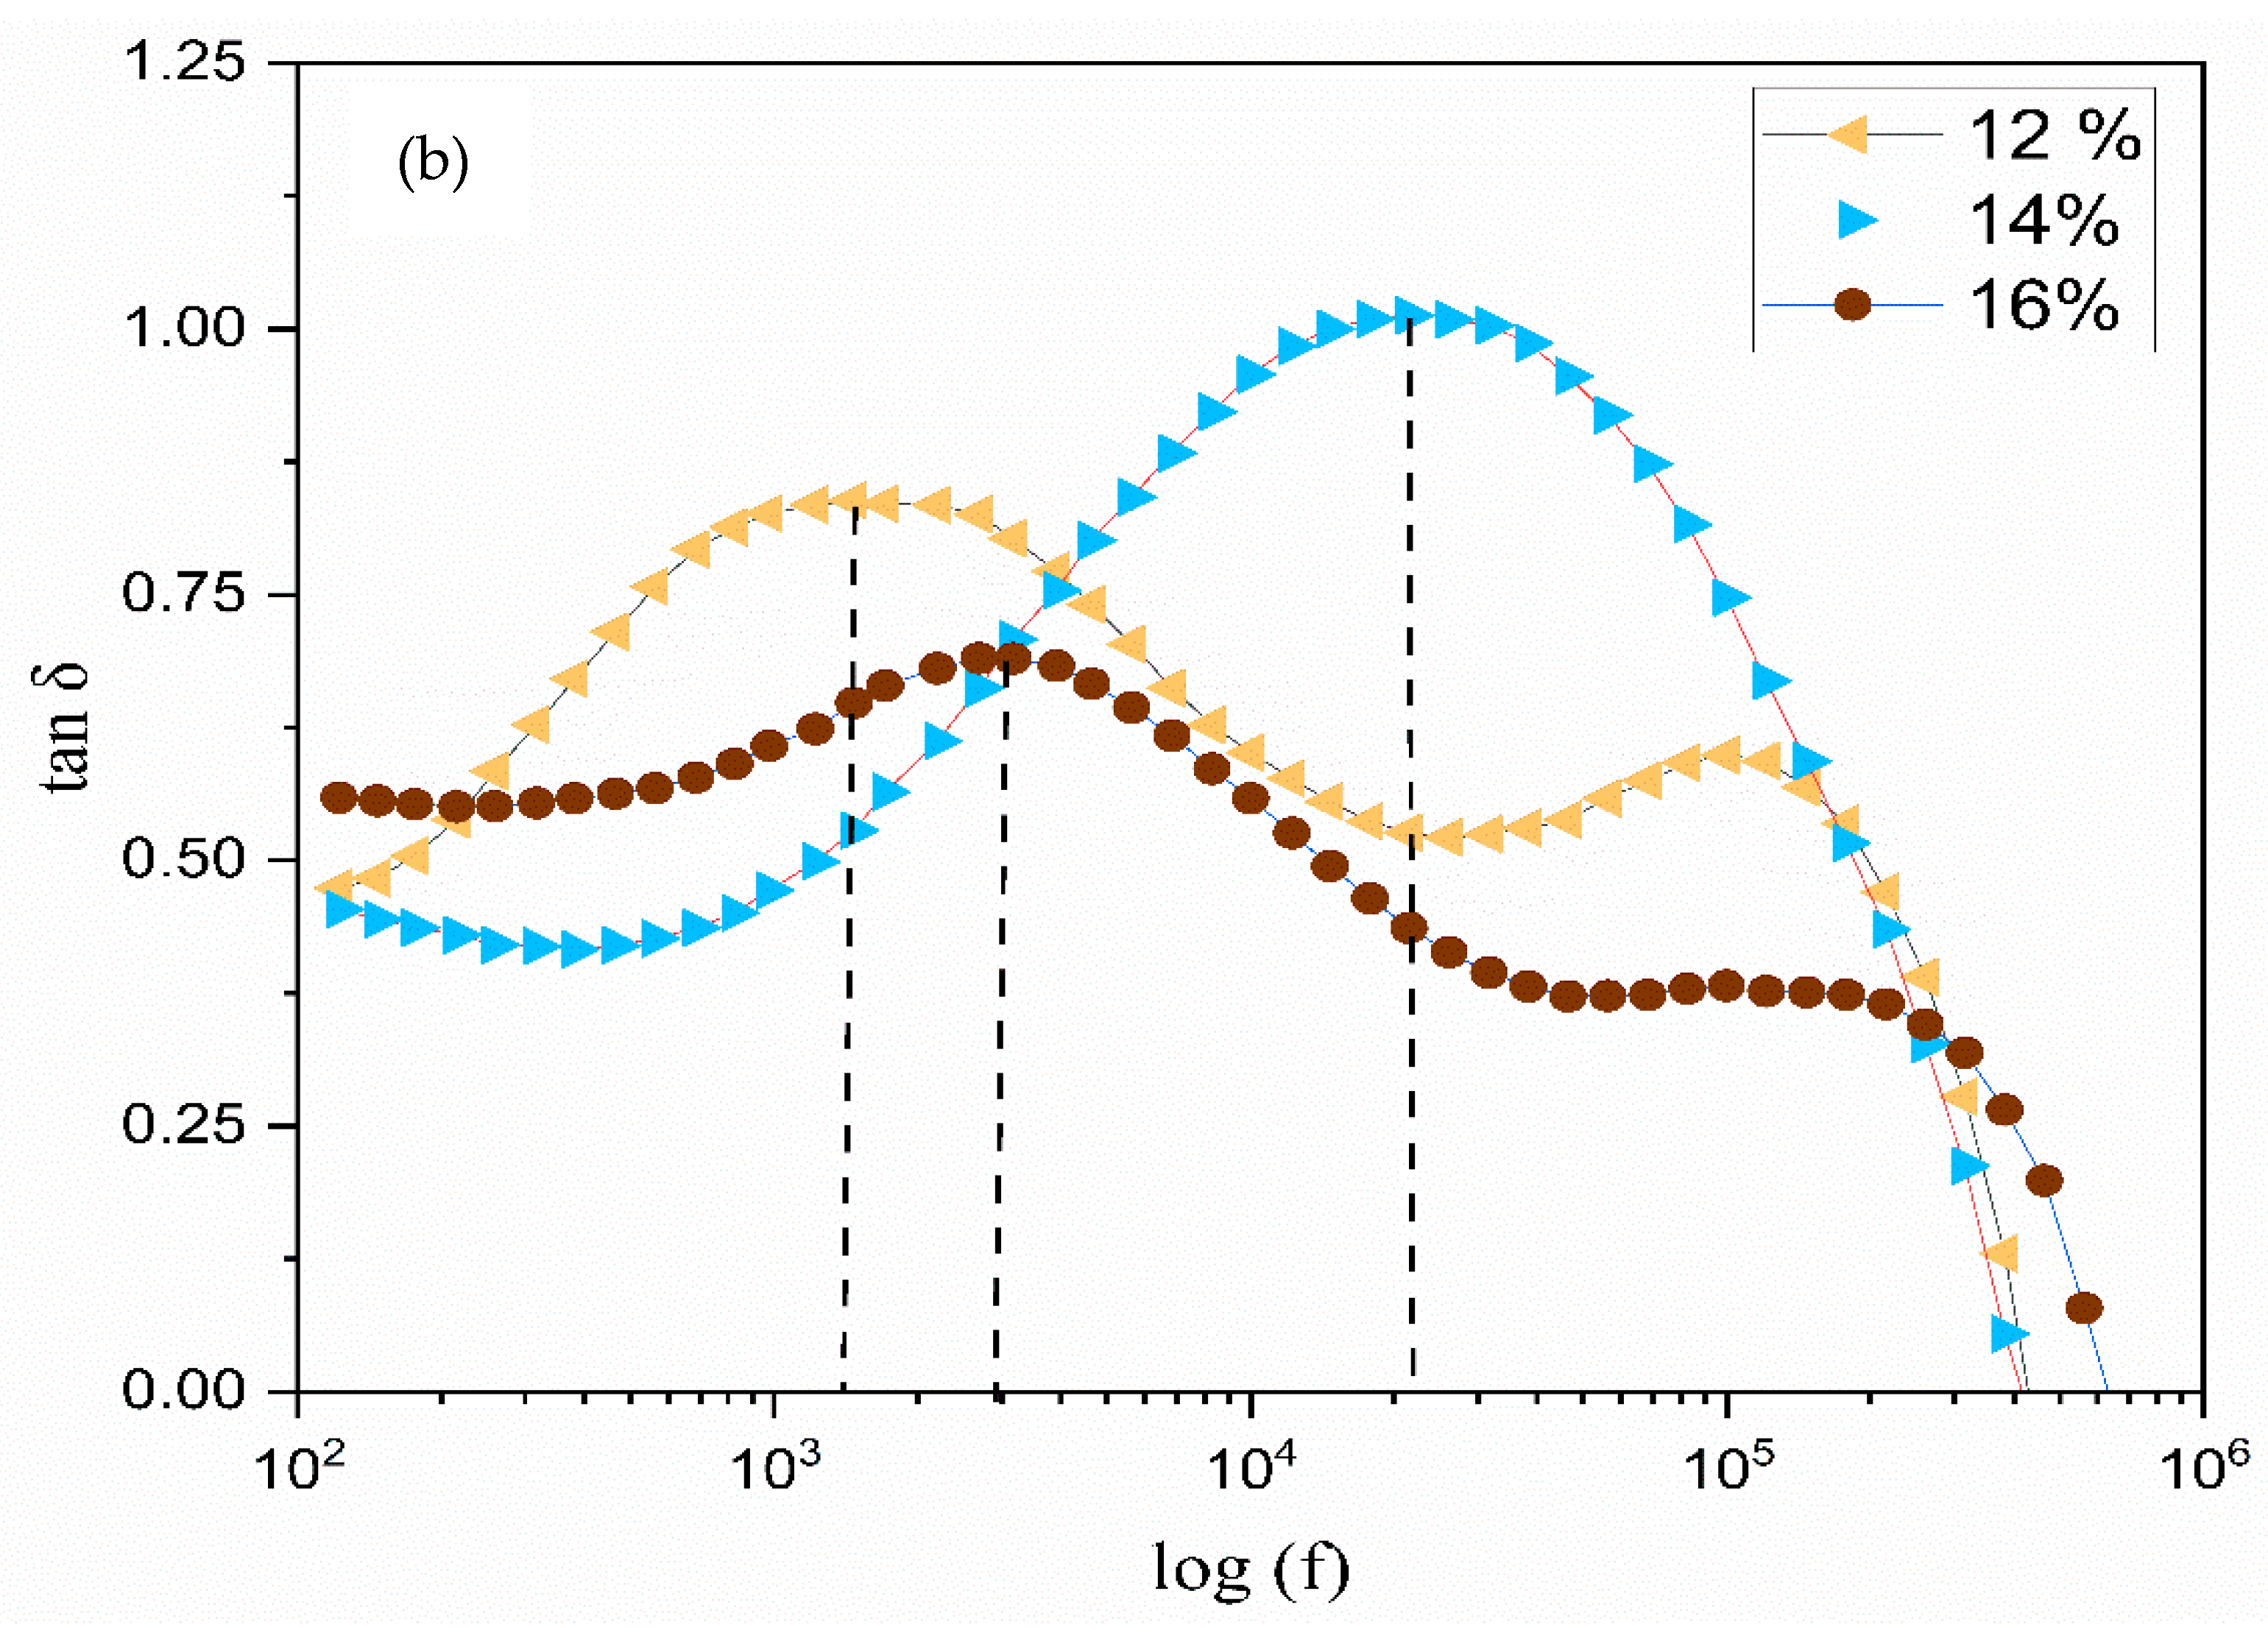
3.6. The Dielectric Analysis
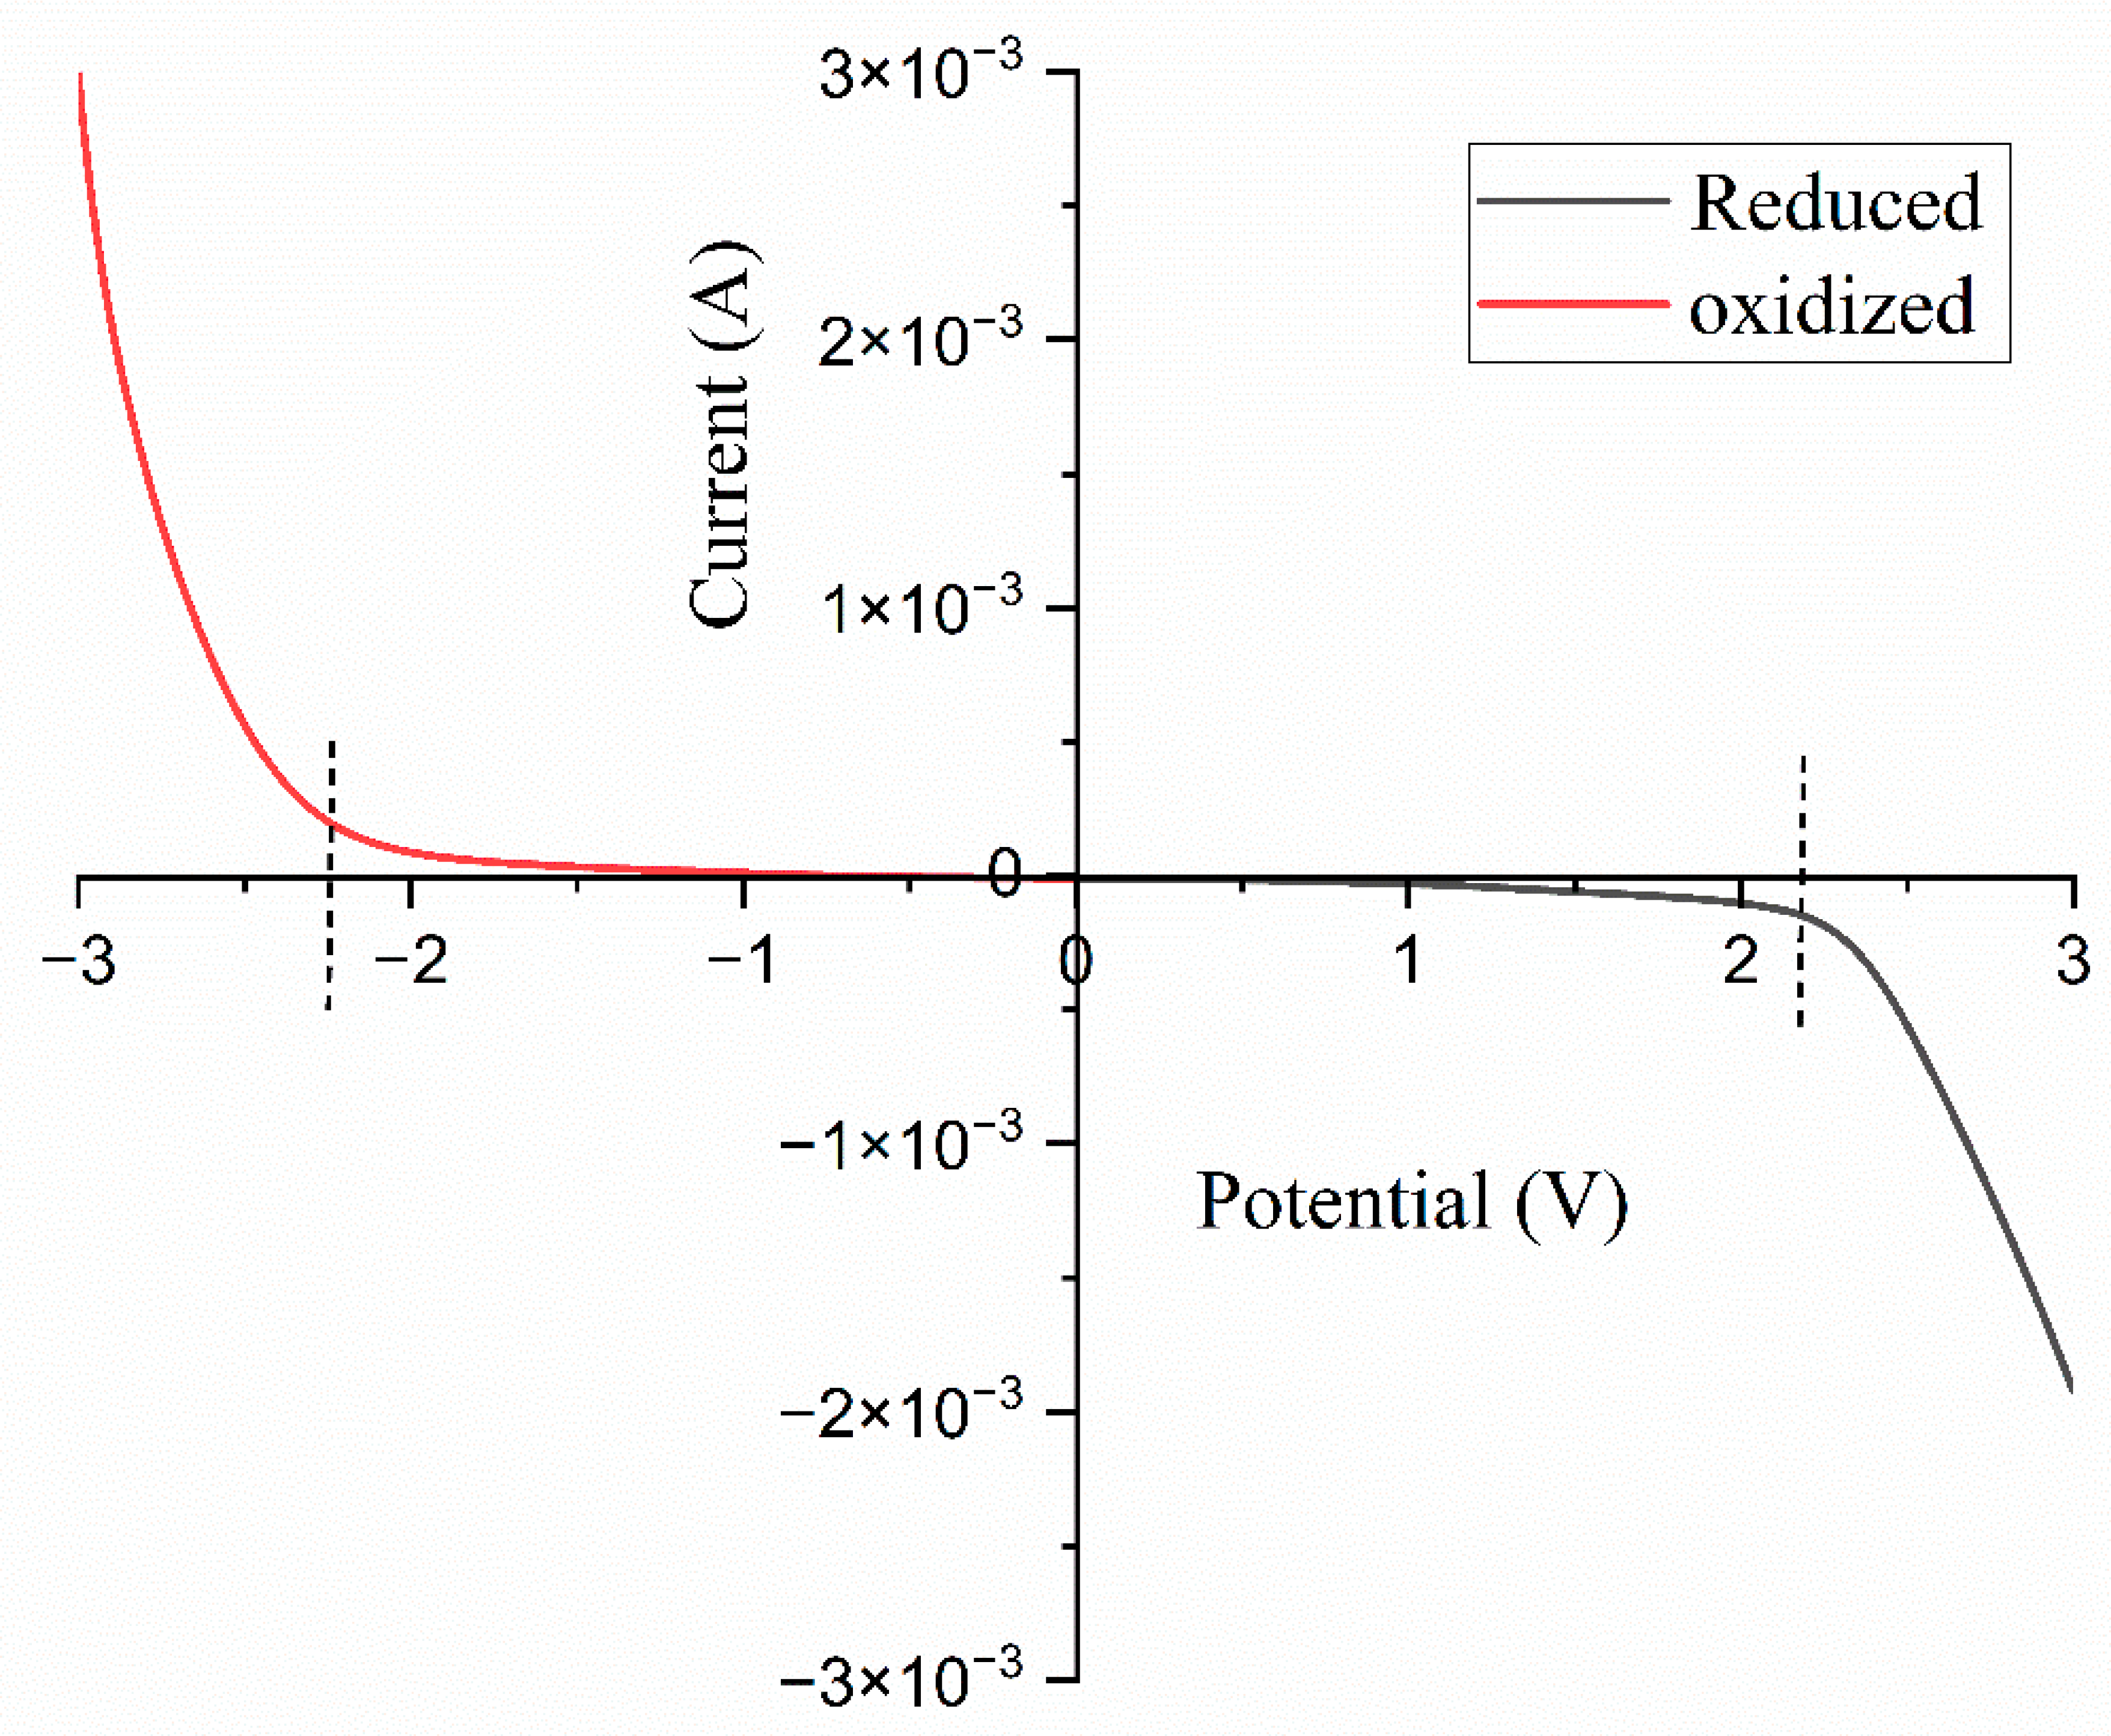
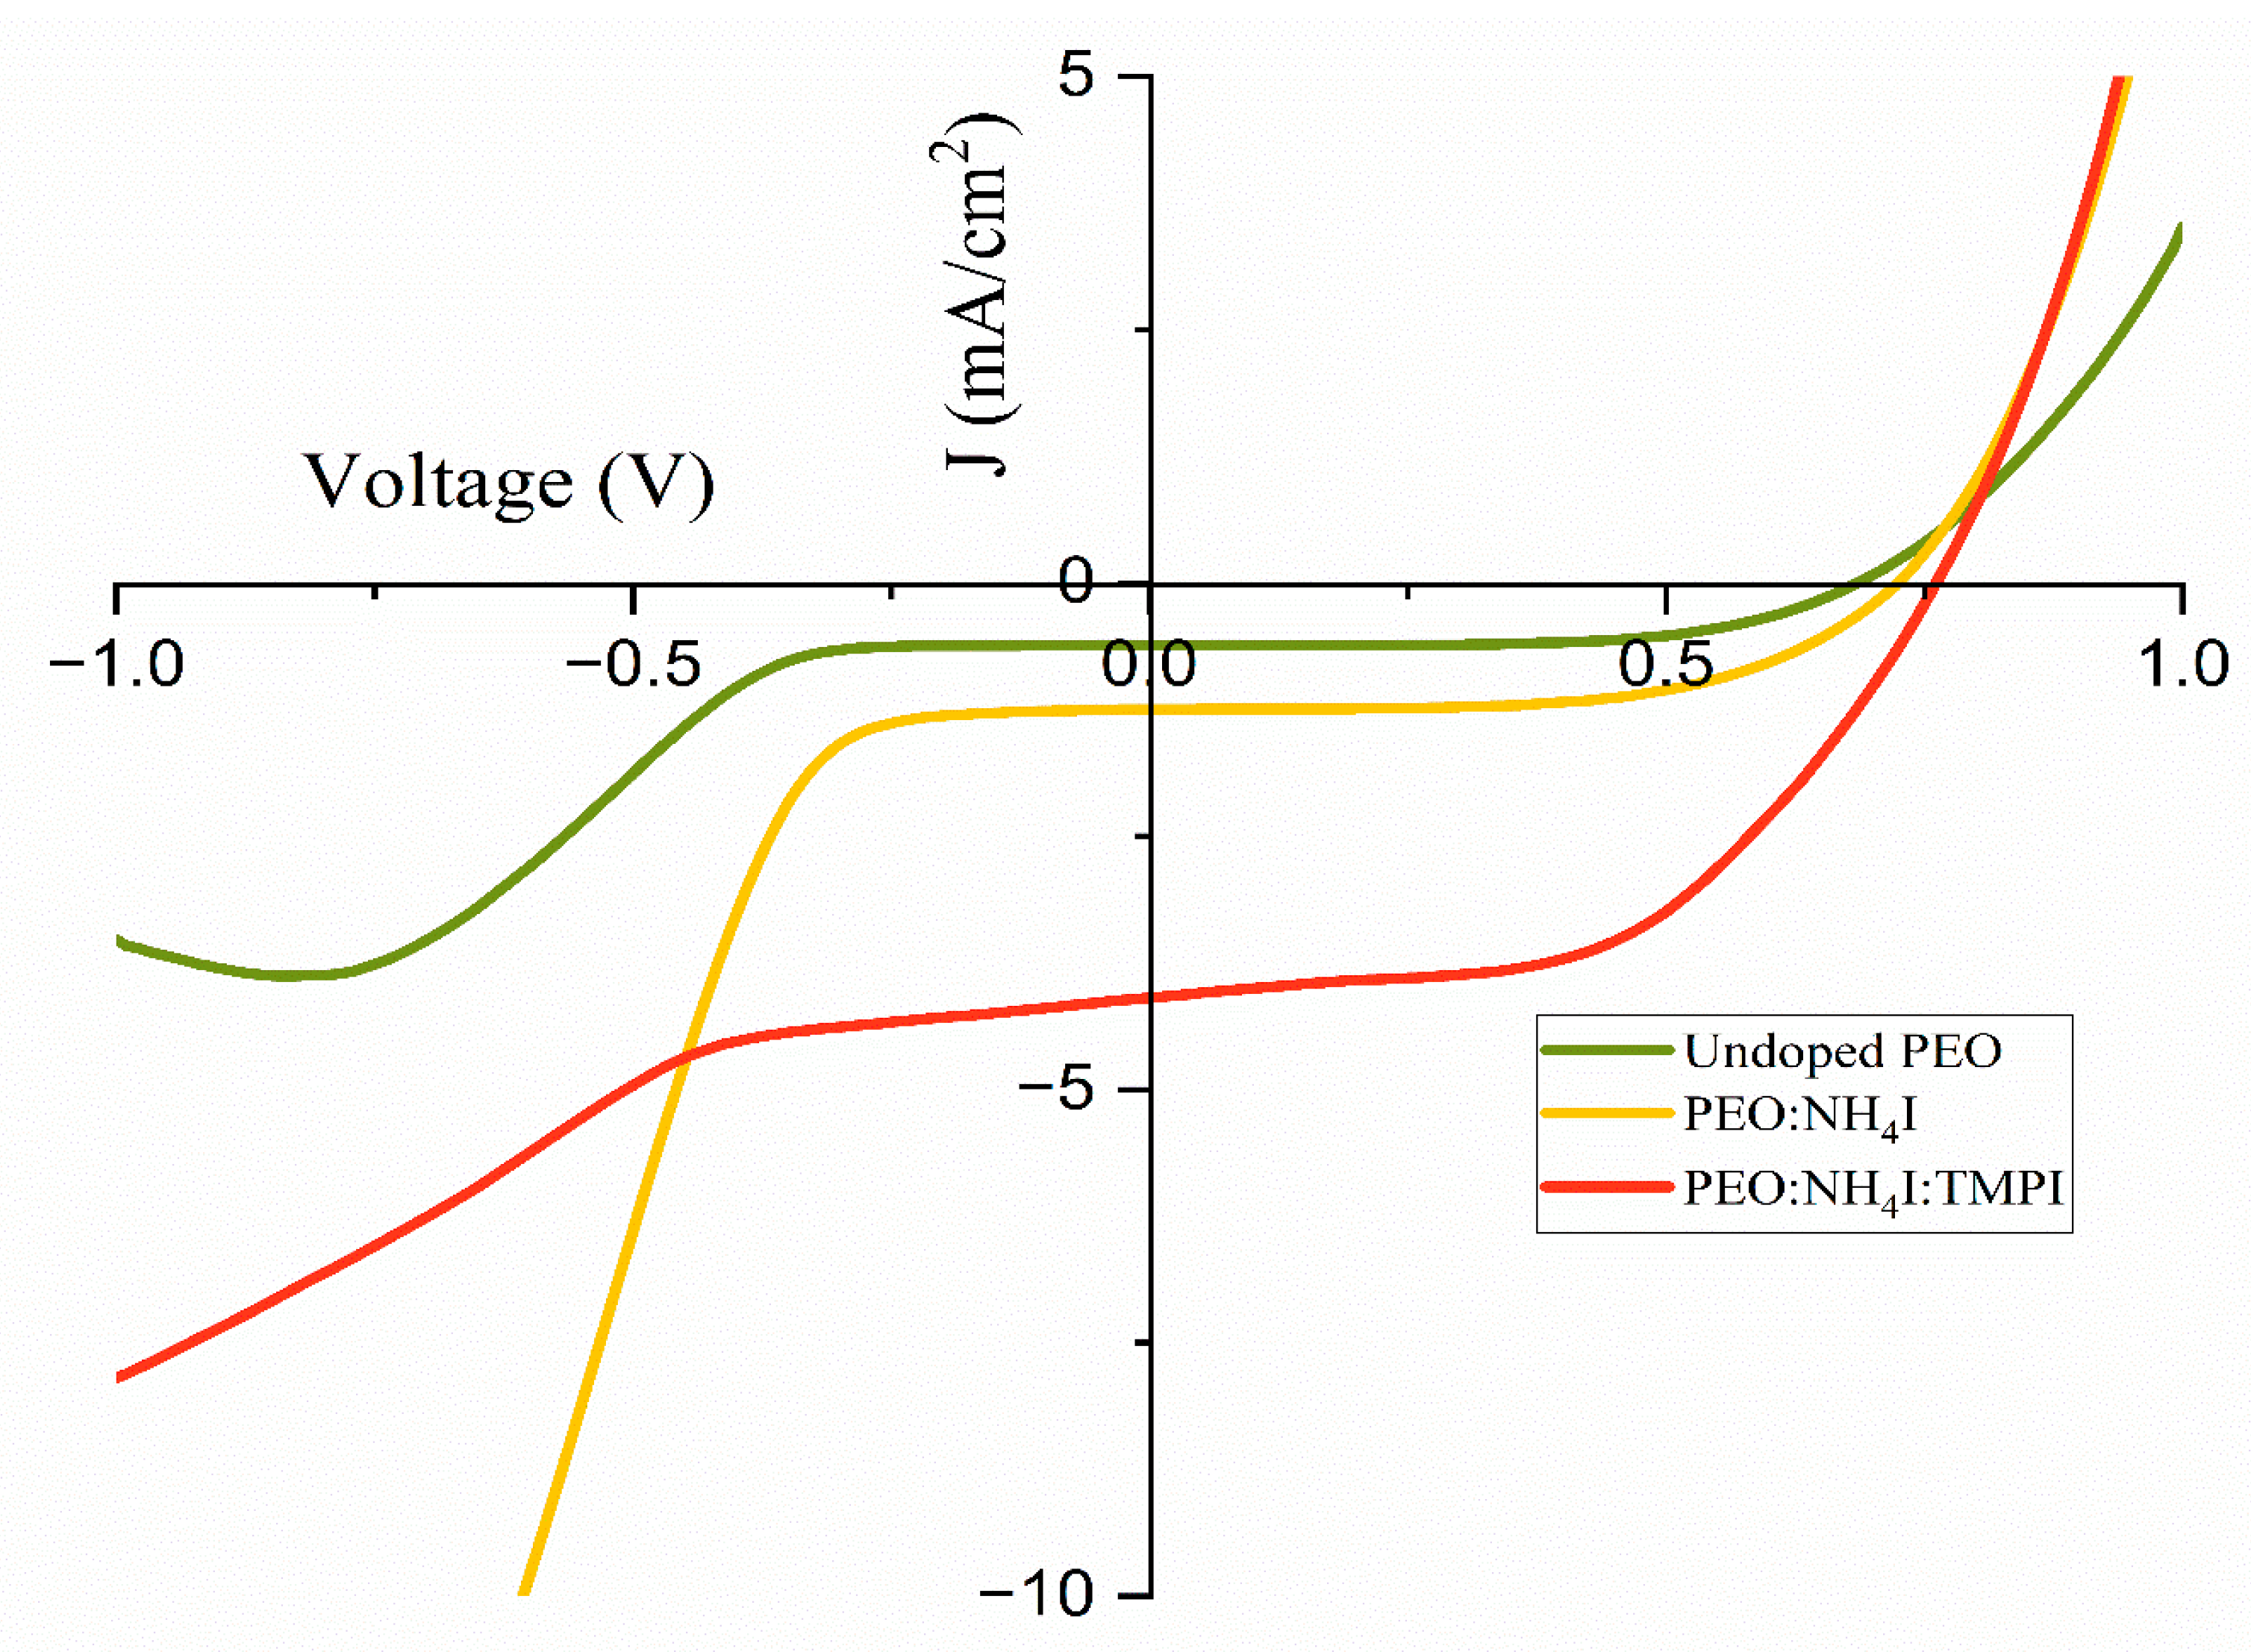
3.7. Linear Sweep Voltammetry
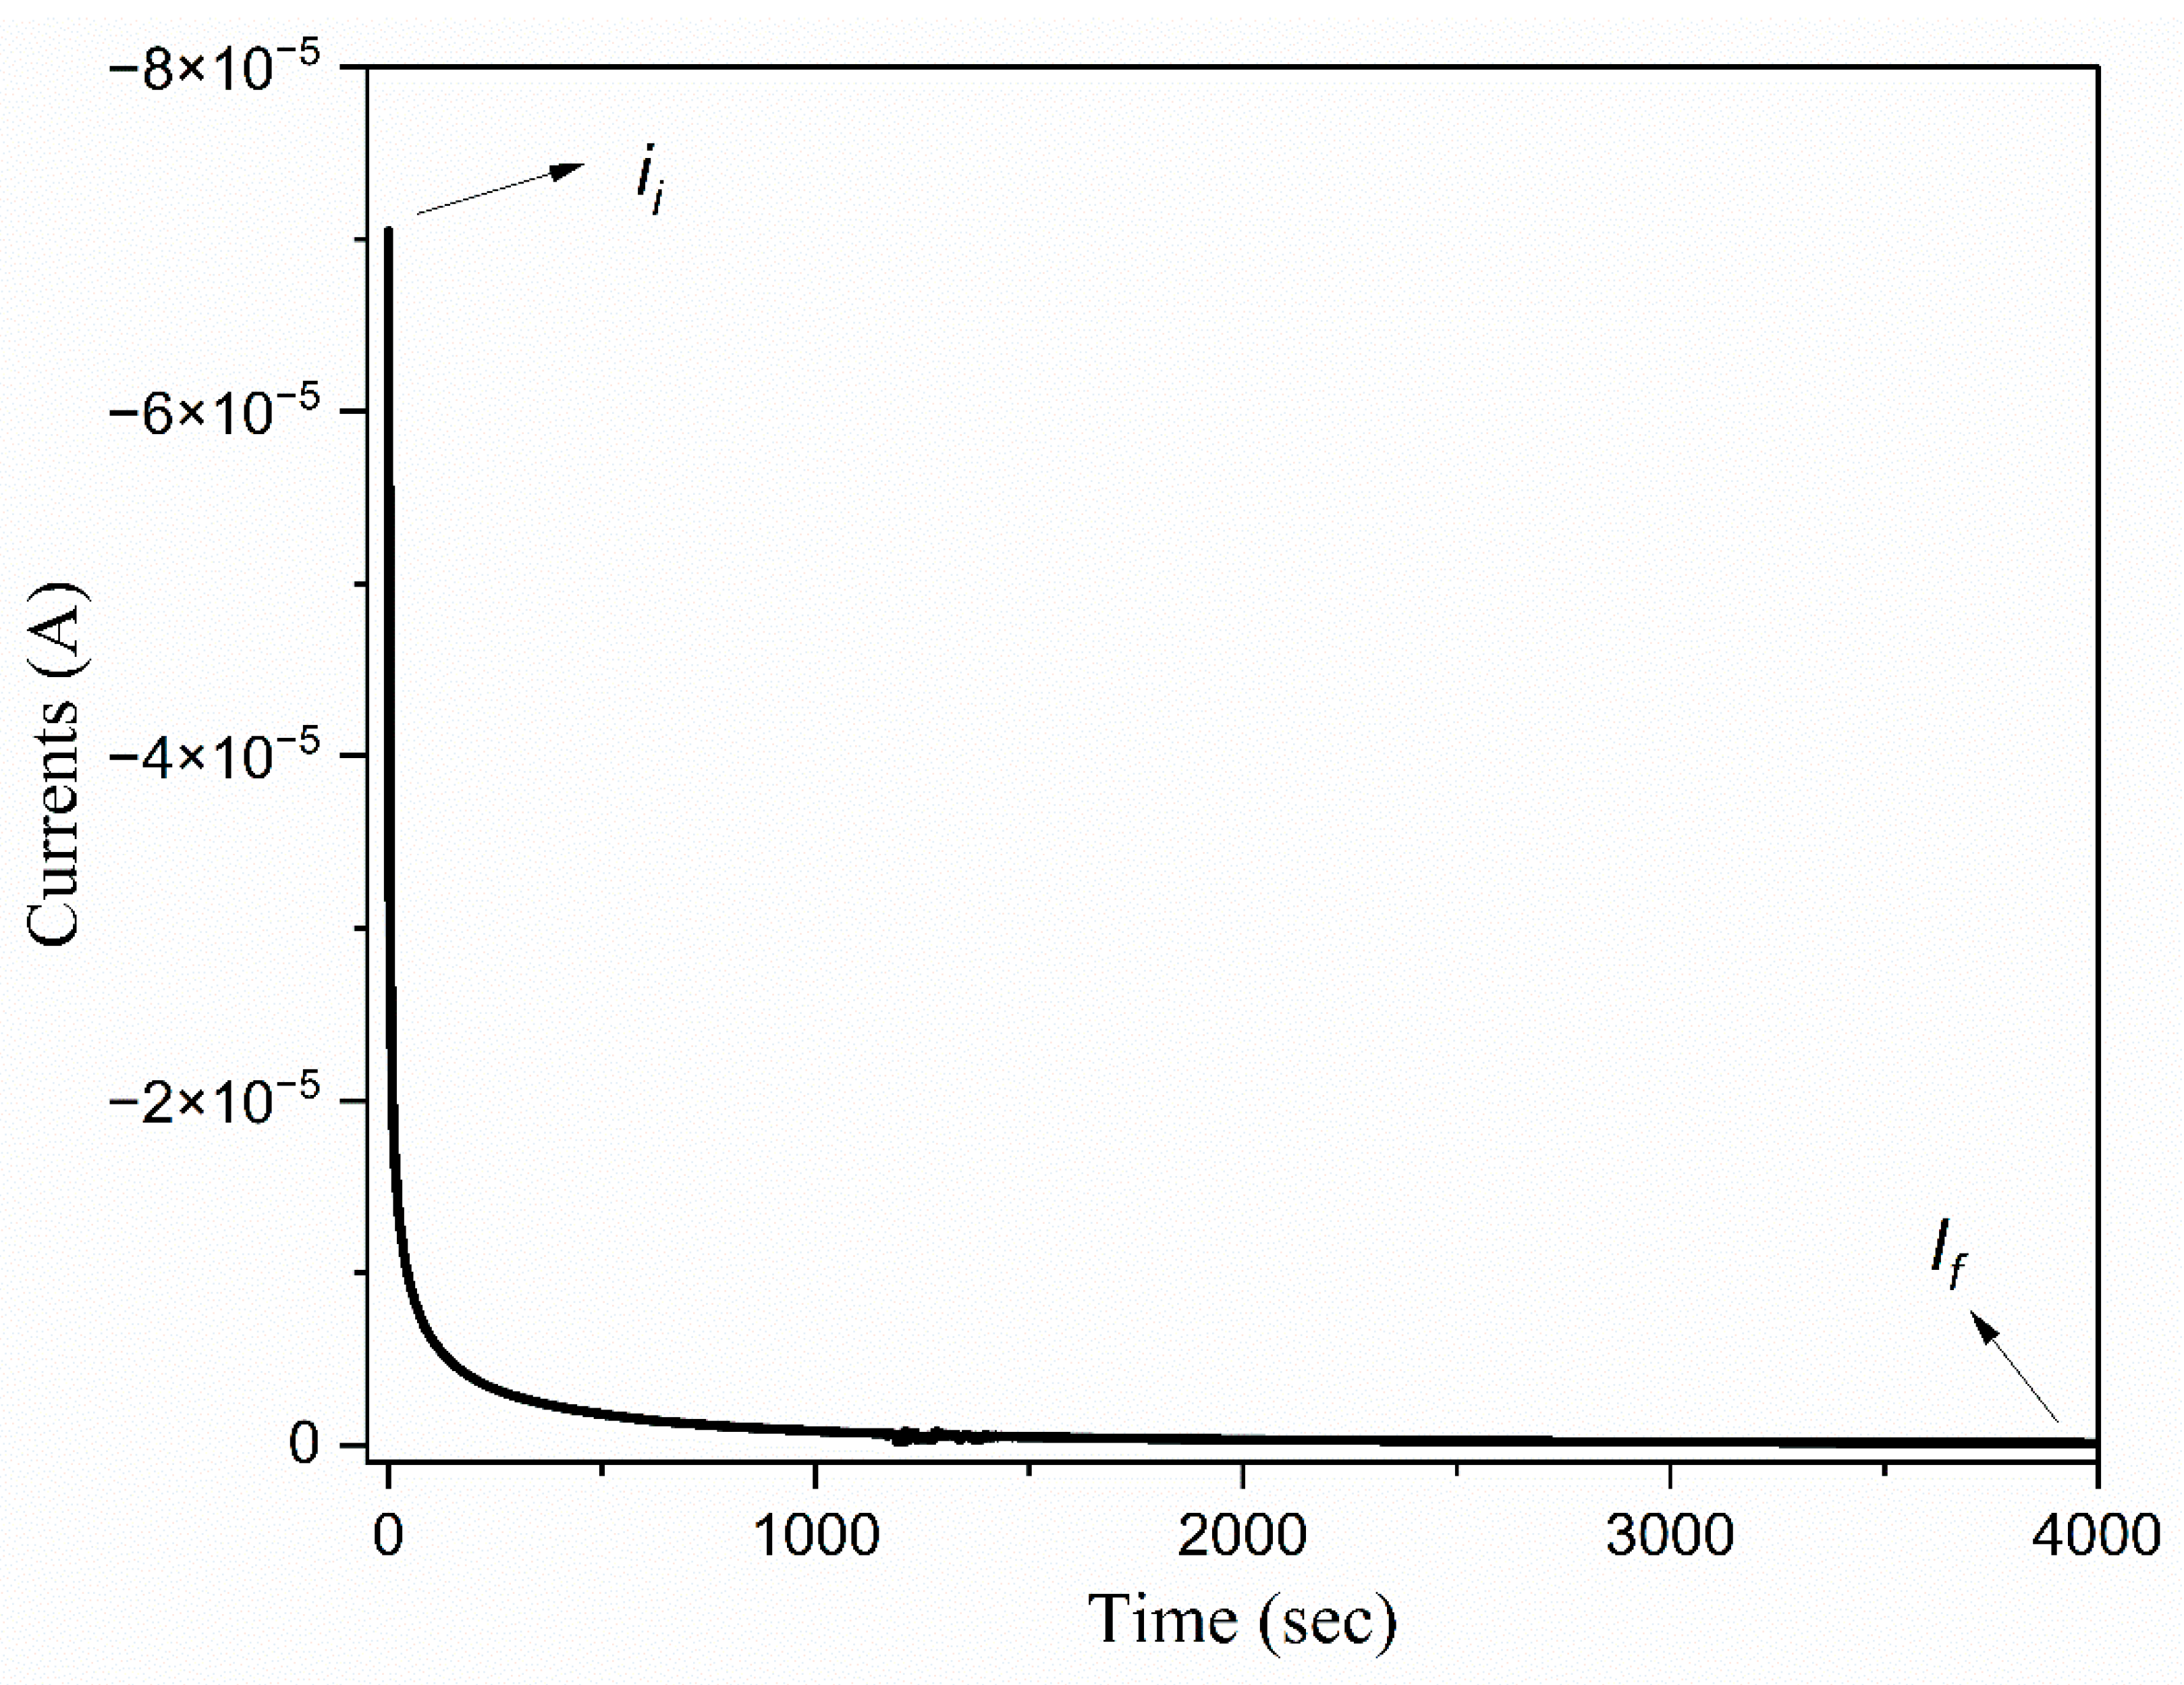
3.8. The Ionic Transference Number
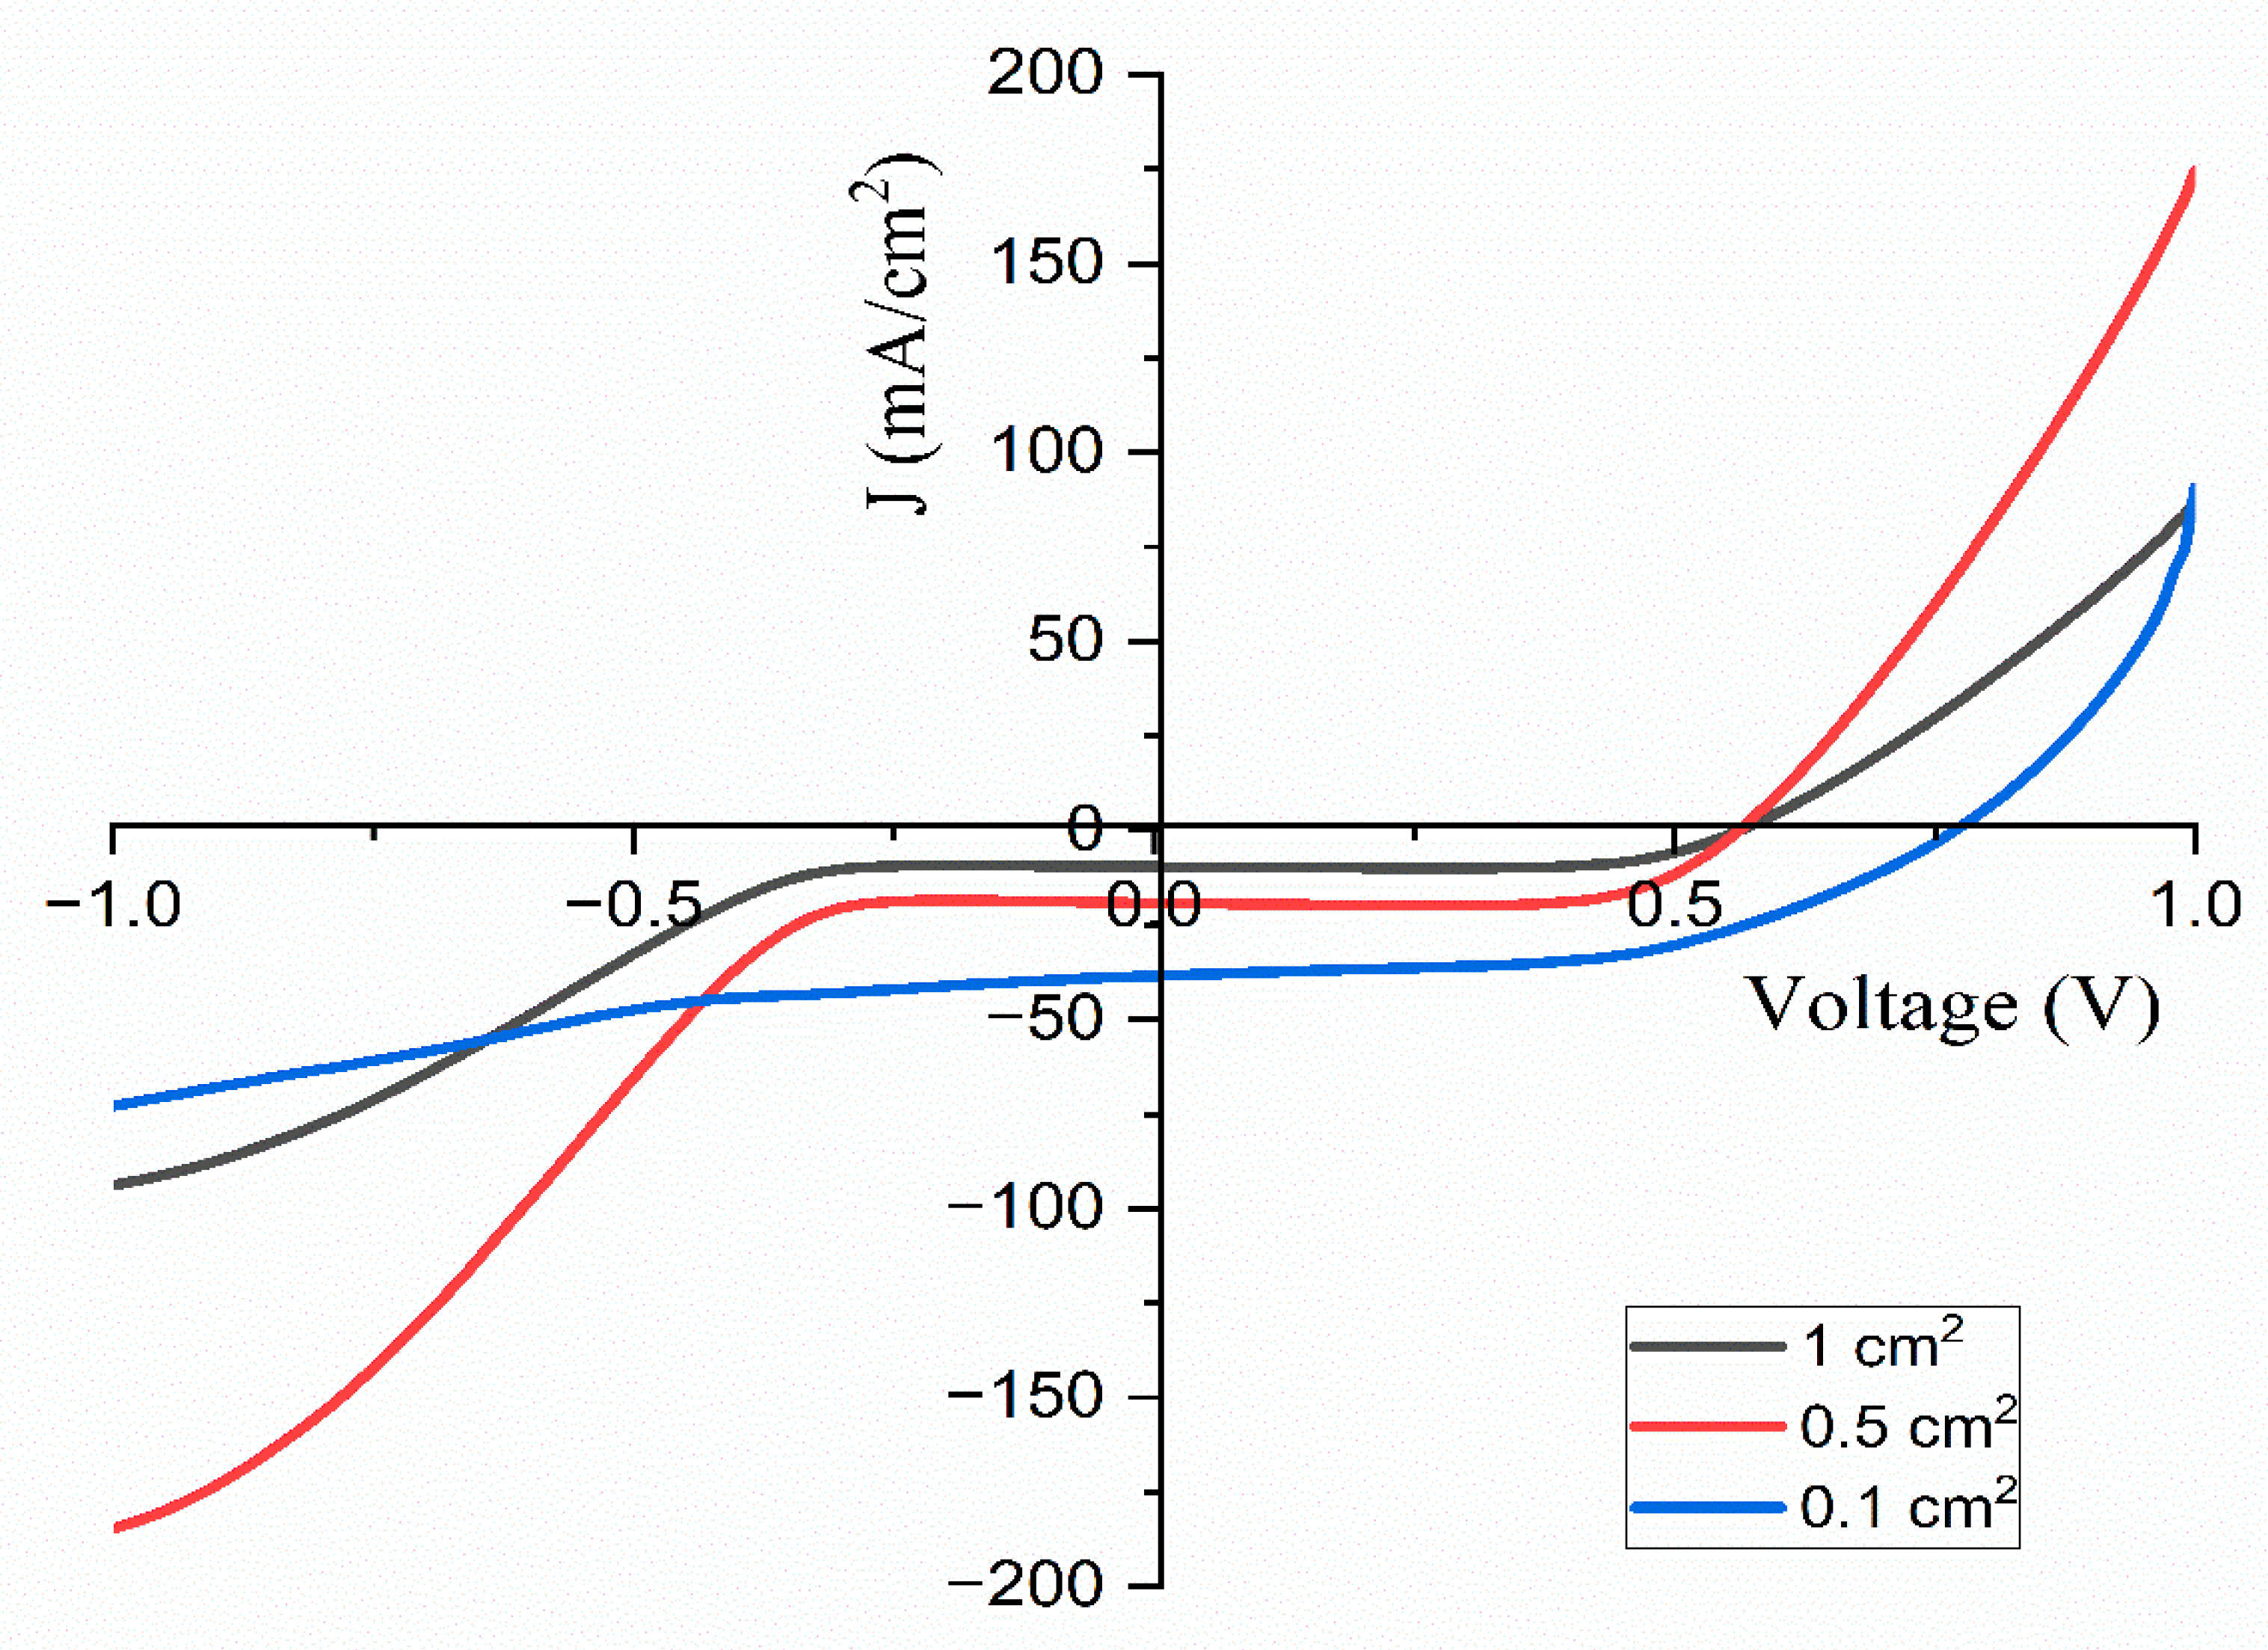
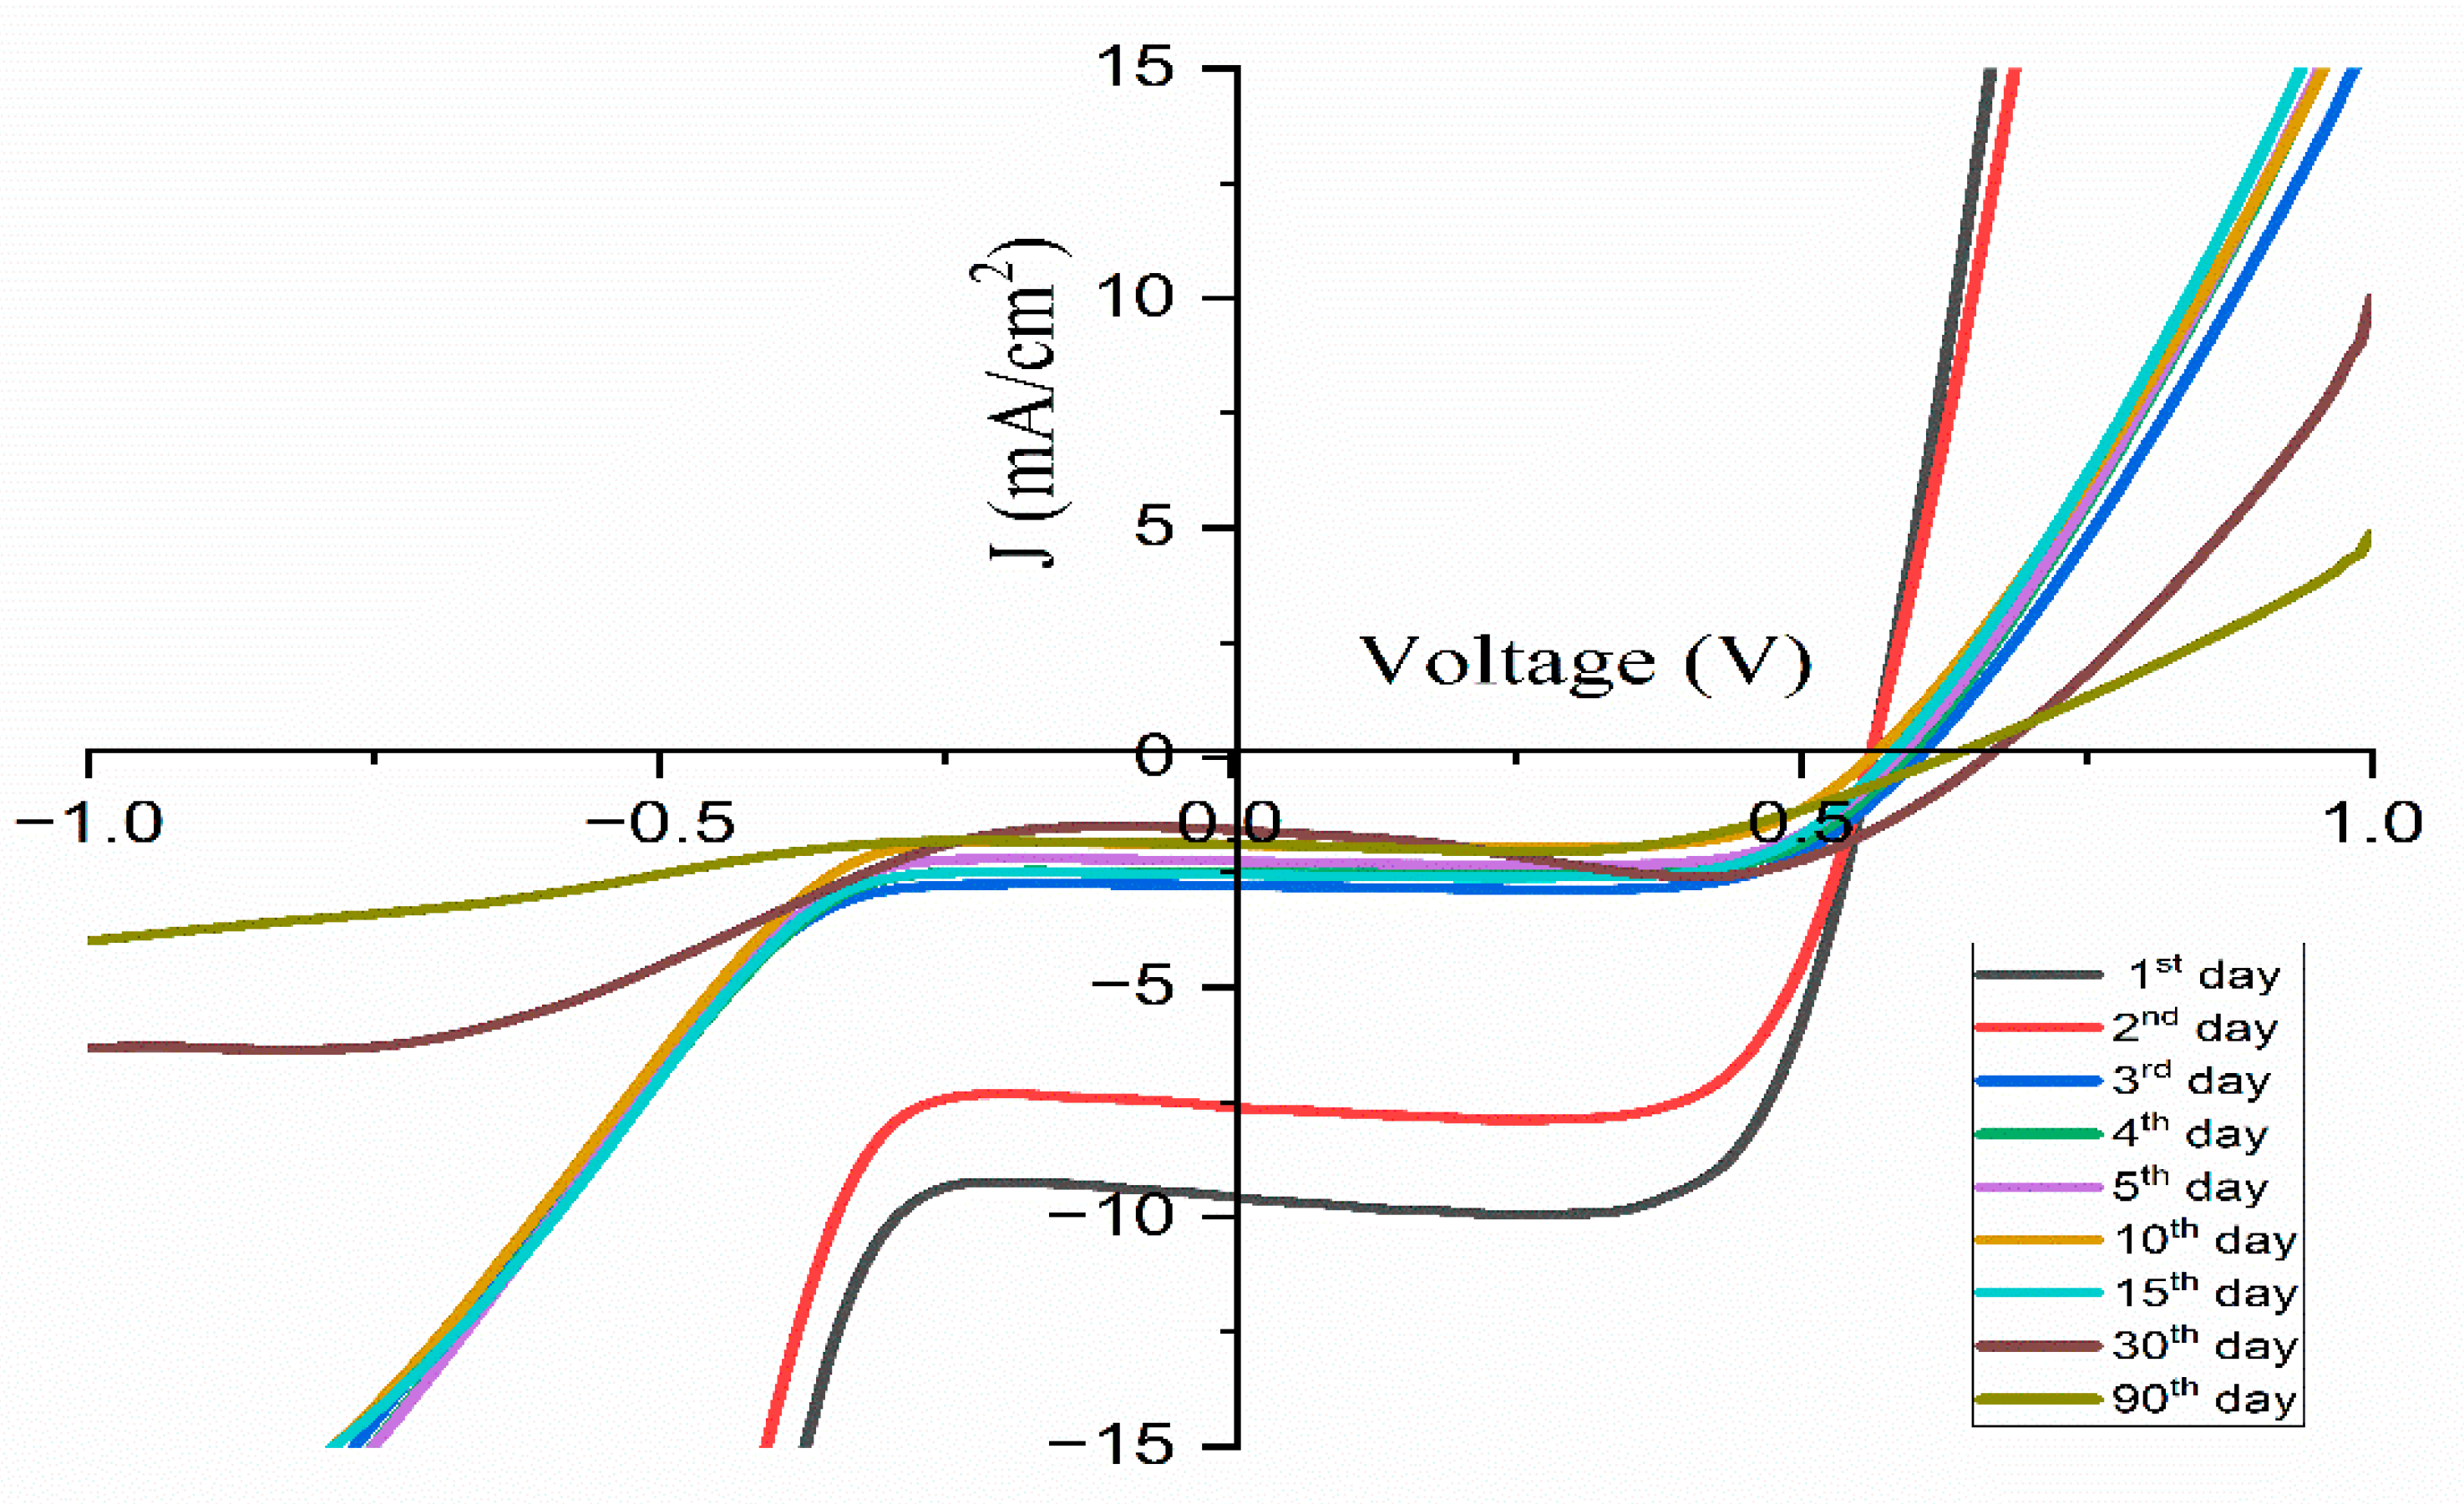
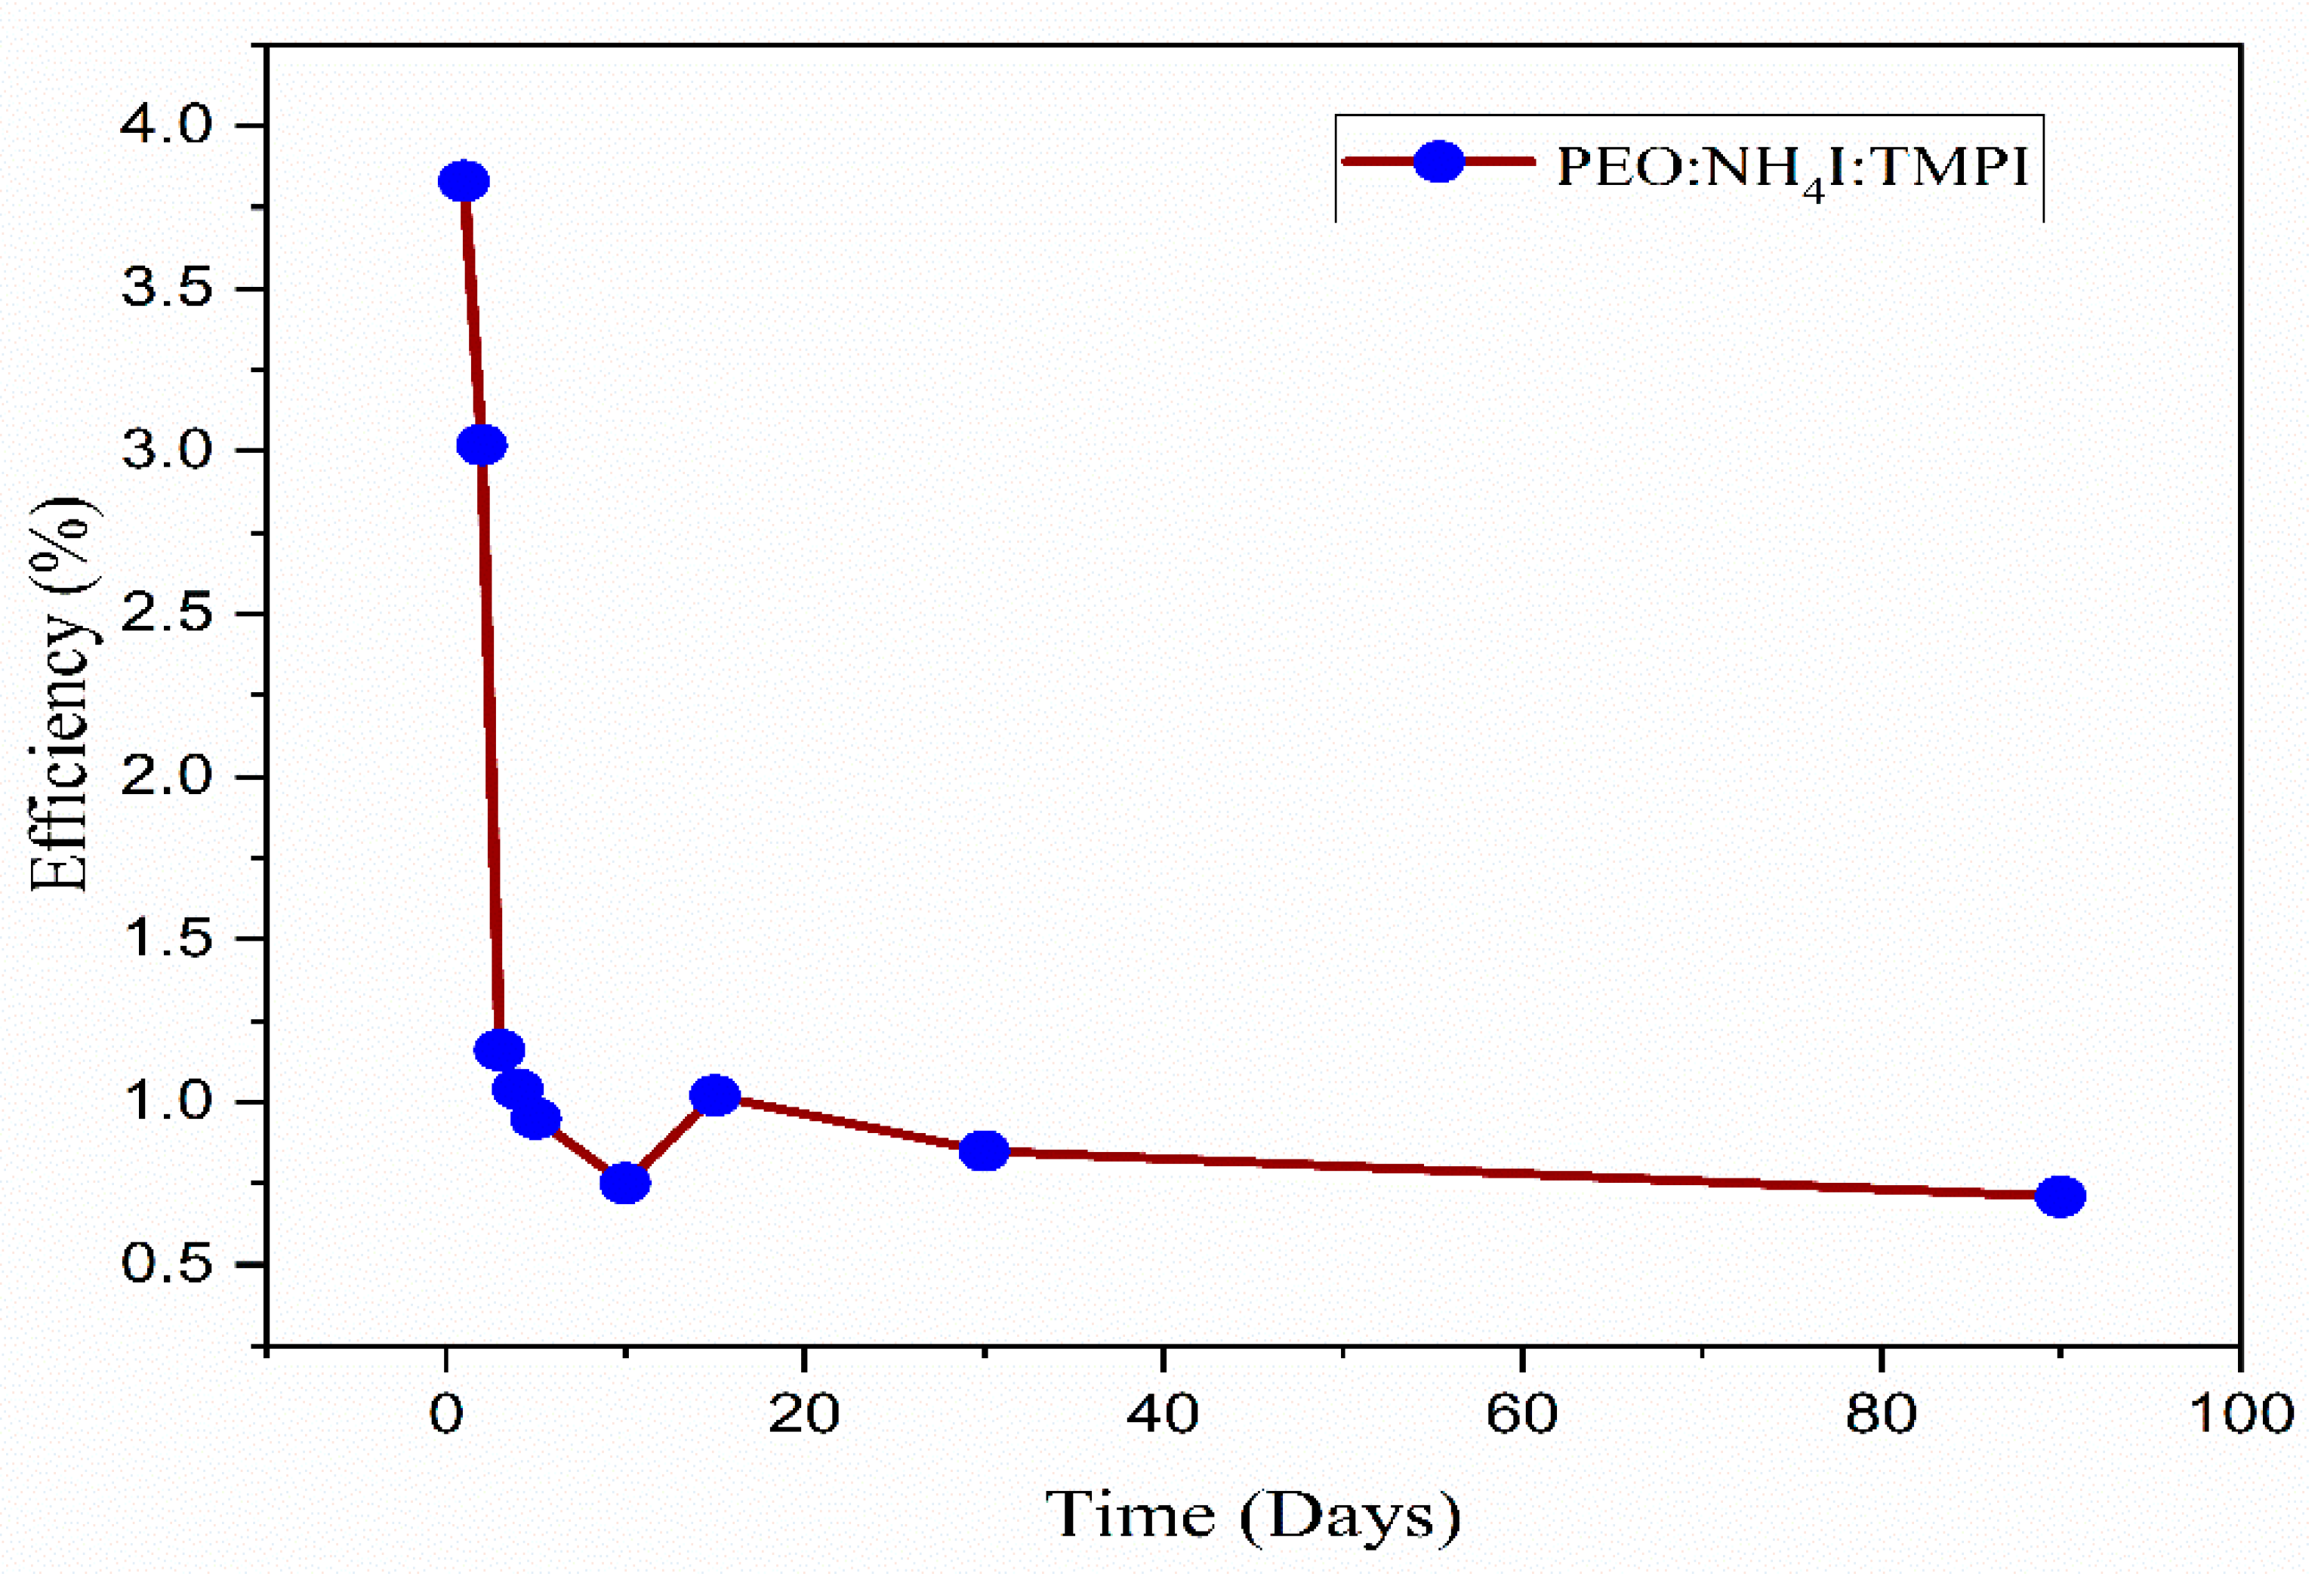
4. The Performance of Dye-Sensitized Solar Cells
5. The Electric Double-Layer Capacitor’s Performance
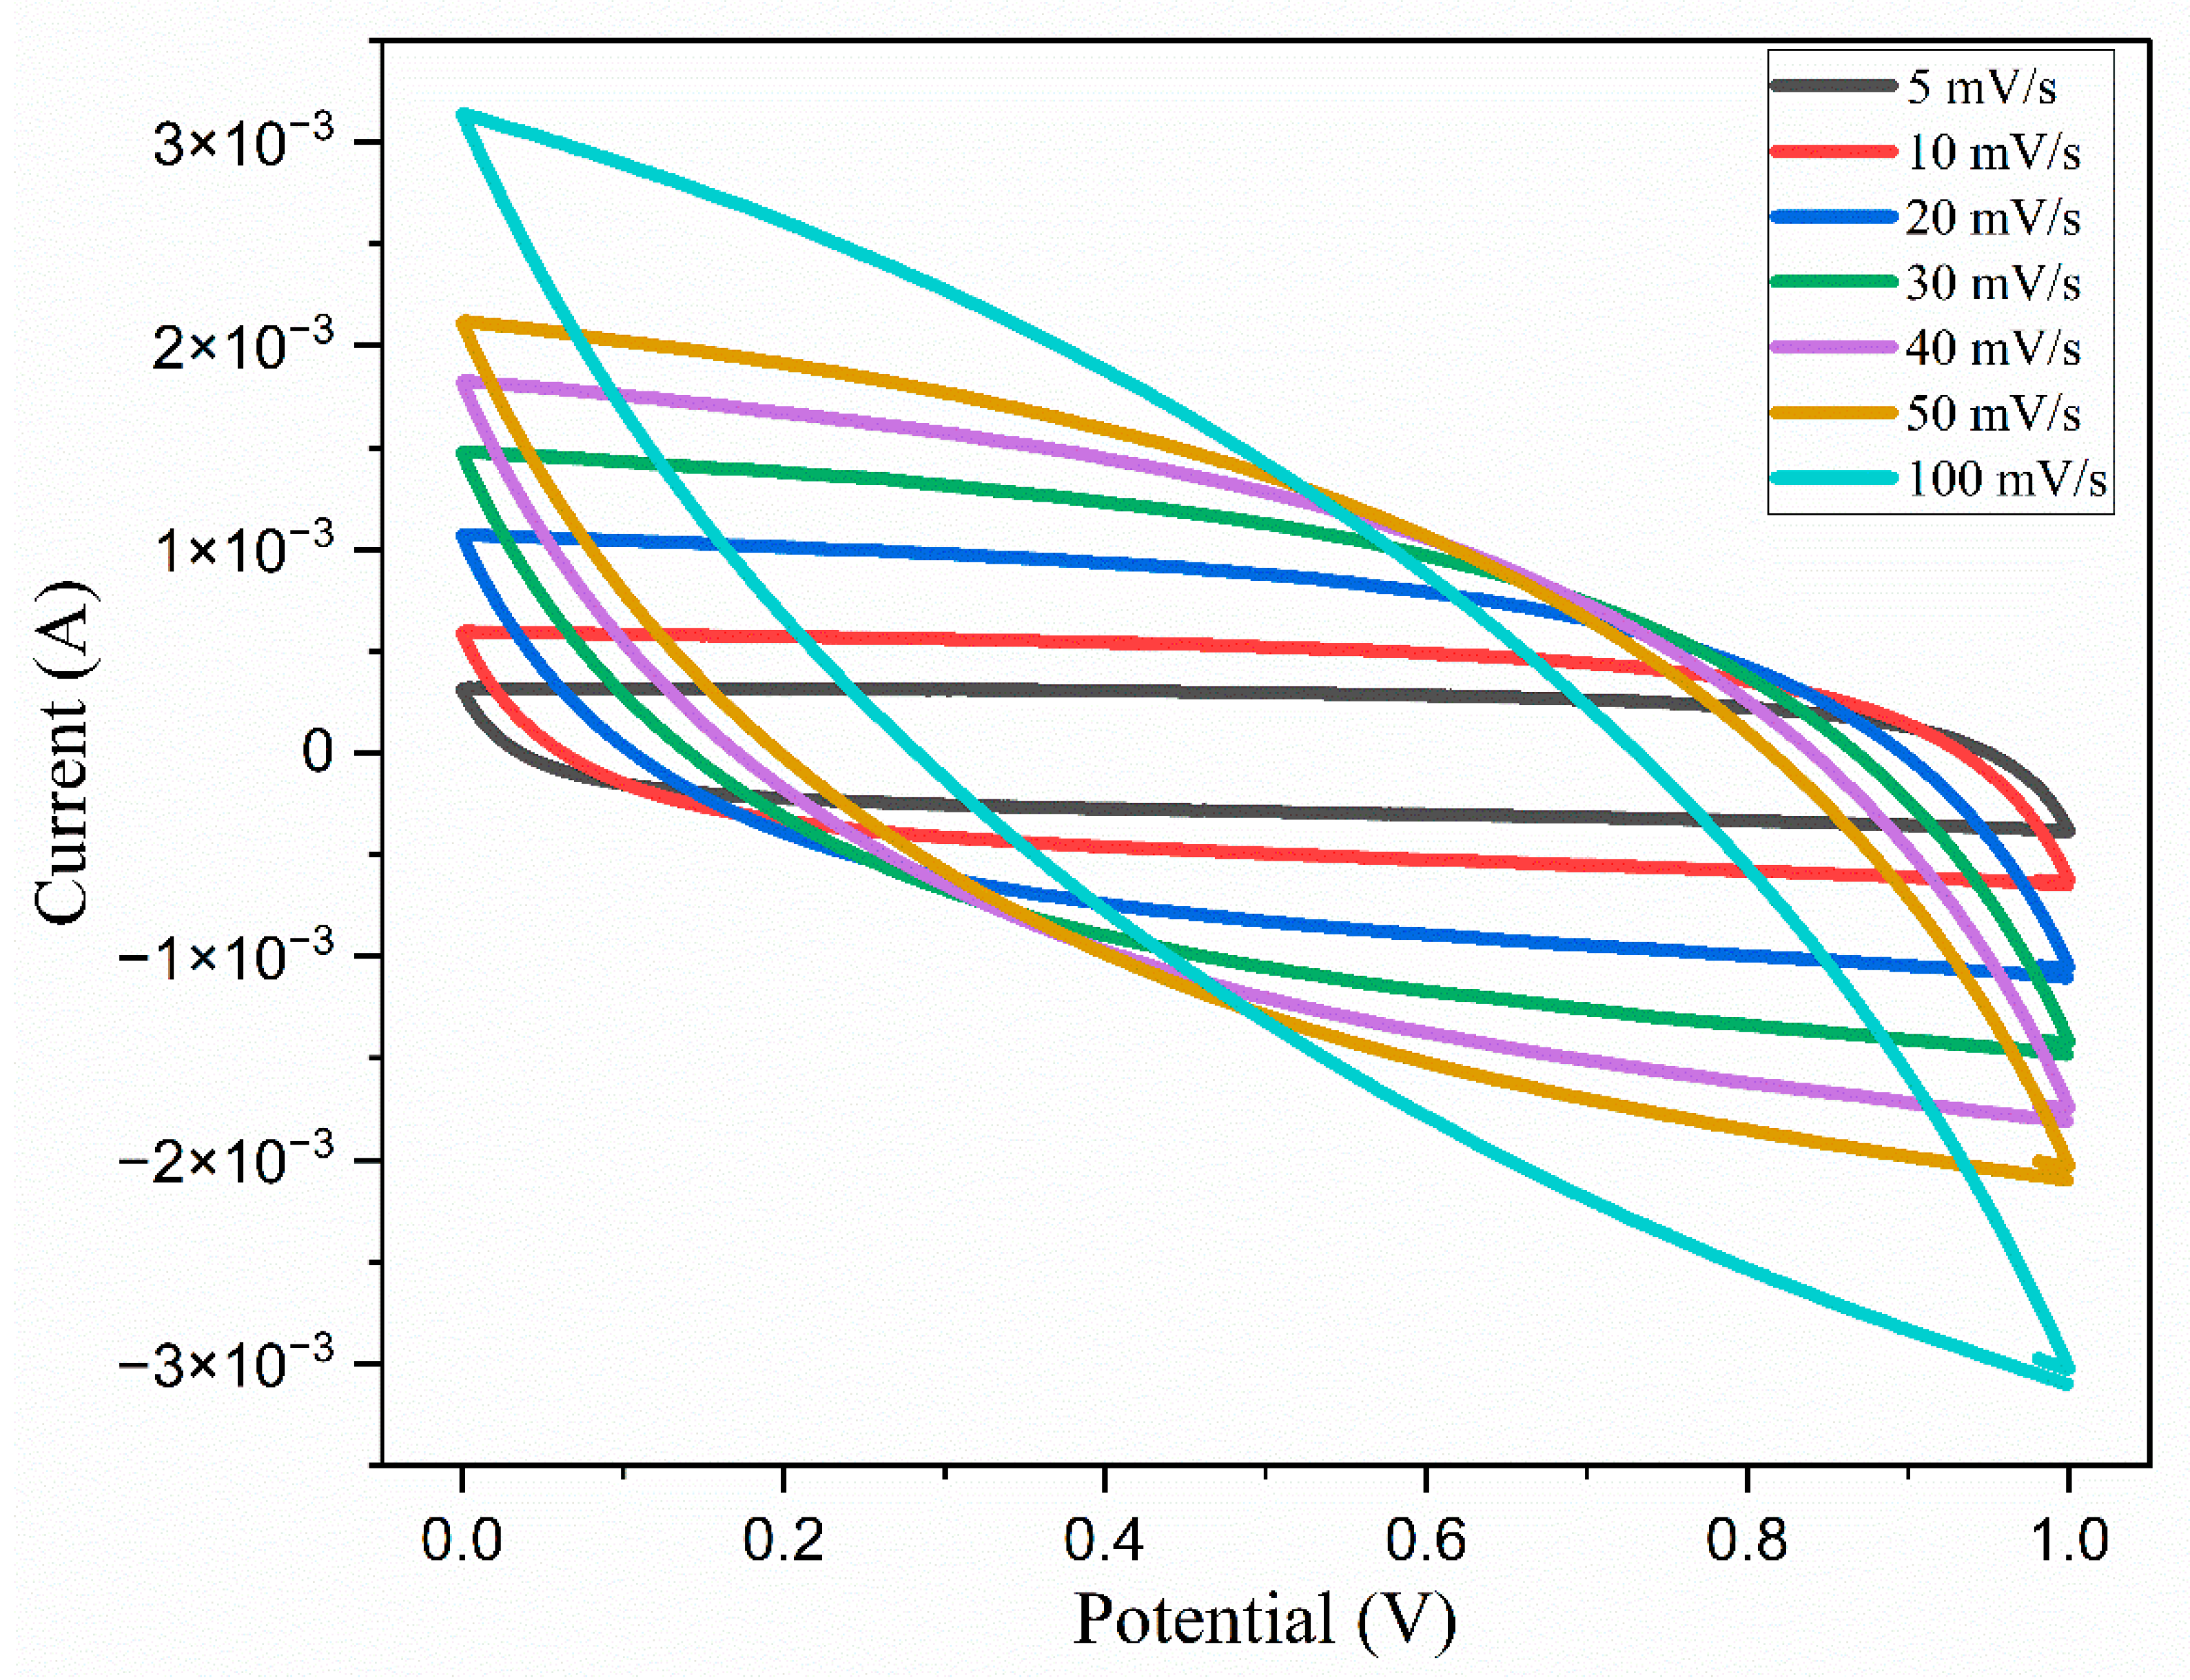
5.1. Cyclic Voltammetry
5.2. Low-Frequency Impedance Capacitance
6. Conclusions
Author Contributions
Funding
Institutional Review Board Statement
Data Availability Statement
Acknowledgments
Conflicts of Interest
References
- Su’ait, M.S.; Rahman, M.Y.A.; Ahmad, A. Review on polymer electrolyte in dye-sensitized solar cells (DSSCs). Sol. Energy 2015, 115, 452–470. [Google Scholar] [CrossRef]
- Plechkova, N.V.; Seddon, K.R. Applications of ionic liquids in the chemical industry. Chem. Soc. Rev. 2008, 37, 123–150. [Google Scholar] [CrossRef] [PubMed]
- Ghasemy, S.; Fattahi, A. Design and characterization of novel ionic liquids (ILs) containing natural compounds such as tryptophan, fructose, and adenine; the ILs stabilized via H-bonds and anomeric effect. J. Mol. Liq. 2025, 429, 127601. [Google Scholar] [CrossRef]
- Rawat, S.; Singh, P.K.; Pandey, S.P.; Singh, R.C. Review on Comparative Study of Solid Polymer Electrolyte Polyethylene Oxide (PEO) Doped with Ionic Liquid. Macromol. Symp. 2024, 413, 2300050. [Google Scholar] [CrossRef]
- Bharmoria, P.; Tietze, A.A.; Mondal, D.; Kang, T.S.; Kumar, A.; Freire, M.G. Do Ionic Liquids Exhibit the Required Characteristics to Dissolve, Extract, Stabilize, and Purify Proteins? Past-Present-Future Assessment. Chem. Rev. 2024, 124, 3037–3084. [Google Scholar] [CrossRef] [PubMed]
- Ebrahimi, M.; Kobzar, Y.; Kujawski, W.; Fatyeyeva, K. New hydroxylammonium-based protic ionic liquids: Influence of cation and anion structure on thermal, viscosity and conductive properties. J. Mol. Liq. 2024, 401, 124574. [Google Scholar] [CrossRef]
- Kahrizi, M.; Kar, M.; O’Dell, L.A.; Al-Masri, D.; Forsyth, M.; Howlett, P.C. Exploring the Physicochemical Properties and Electrochemical Behavior of Phosphonium-Based Ionic Liquids as Additives in Carbonate Electrolytes for Lithium-Ion Batteries. J. Phys. Chem. C 2025, 129, 2111–2121. [Google Scholar] [CrossRef]
- Abbas, Z.; Jung, S.M. A Comprehensive Comparison Analysis between Ammonium-Based and Phosphonium-Based Bifunctional Ionic Liquids for Metal Extraction and Separation Processes. ACS Omega 2024, 9, 44304–44311. [Google Scholar] [CrossRef] [PubMed]
- Li, Y.; Guo, Y.; Wang, L.; Fan, Q.; Xu, Y.; Wu, Z.; Zhang, K.; Feng, X. Thermal stability and flammability of several quaternary phosphonium ionic liquids. J. Therm. Anal. Calorim. 2025, 150, 1–12. [Google Scholar] [CrossRef]
- Gabryelczyk, A.; Swiderska-Mocek, A. Tailoring the Properties of Gel Polymer Electrolytes for Sodium-Ion Batteries Using Ionic Liquids: A Review. Chem. A Eur. J. 2024, 30, e202304207. [Google Scholar] [CrossRef] [PubMed]
- Kim, H.; Kim, J.; Lee, J.; Lee, M.; Kim, M.K.; Ahn, S.; Kim, J.; Jin, J.; Kang, S.J. High-performance solid-state Li-ion batteries enabled by homogeneous, large-area ferroelectric PVDF-TrFE solid polymer electrolytes via horizontal centrifugal casting method. Energy Storage Mater. 2024, 67, 103260. [Google Scholar] [CrossRef]
- Rawat, S.; Singh, P.K.; Jain, A.; Song, S.; Yahya, M.Z.A.; Savilov, S.V.; Diantoro, M.; Michalska, M.; Polu, A.R.; Singh, R.C. Ionic liquid (1-butyl-1-methylpyrrolidinium trifluoromethanesulfonate) doped polyethylene polymer electrolyte for energy devices. J. Mater. Sci. Mater. Electron. 2024, 35, 1643. [Google Scholar] [CrossRef]
- Scurti, F.; Reynolds, L. An undergraduate laboratory experiment on nucleation and growth via polarizing optical microscopy of semicrystalline polymers. Am. J. Phys. 2025, 93, 406–414. [Google Scholar] [CrossRef]
- Li, L.; Jiang, Y.; Guo, C.; Han, K.; Cui, X.; He, C.; Chen, Y.; Yang, Y. Mechanochemical production of graphene/amorphous carbon/Mn3O4 nanocomposites for asymmetric supercapacitor. Appl. Surf. Sci. 2024, 653, 159388. [Google Scholar] [CrossRef]
- St-Onge, V.; Cui, M.; Rochon, S.; Daigle, J.-C.; Claverie, J.P. Reducing crystallinity in solid polymer electrolytes for lithium-metal batteries via statistical copolymerization. Commun. Mater. 2021, 2, 83. [Google Scholar] [CrossRef]
- Phase Transformations in Materials, 1st ed.; Kostorz, G., Ed.; Wiley: Hoboken, NJ, USA, 2001; ISBN 978-3-527-30256-7. [Google Scholar]
- Bullmann, M.; Etcheverry, L.; Suárez, A.C.; Sampaio, E.J.P.; Pitthan, E.; Andrade, A.M.H.D.; De Fraga Malfatti, C. Tailored PEO synthesis and in-situ ATR-FTIR study of PtSnO2/Nb coral-like structures for application in ethanol electrooxidation. J. Alloys Compd. 2024, 1002, 175178. [Google Scholar] [CrossRef]
- Singh, S.; Singh, C.; Shukla, P.K.; Singh, L.; Bin Yahya, M.Z.A.; Agrawal, S. Effect of ammonium iodide on the structure and ionic conductivity of carboxymethyl cellulose-based gel polymer electrolytes for electrochemical devices. High Perform. Polym. 2025, 37, 103–121. [Google Scholar] [CrossRef]
- Del Olmo, R.; Harwood, J.; De Morais Zanata, D.; Santino, F.; Olmedo-Martínez, J.L.; Howlett, P.; Villaluenga, I. Enabling room temperature solid-state lithium batteries by blends of copolymers and ionic liquid electrolytes. J. Power Sources 2024, 621, 235233. [Google Scholar] [CrossRef]
- Slaný, M.; Jankovič, L.; Madejová, J. Near-IR study of the impact of alkyl-ammonium and -phosphonium cations on the hydration of montmorillonite. J. Mol. Struct. 2022, 1256, 132568. [Google Scholar] [CrossRef]
- Sachan, S.; Kruk, D.; Kumar, A.; Yadav, S.; Kumar, P.; Singh, M.K.; Chaurasia, S.K. Evaluation of Structural, Thermal, and Electrochemical Properties of PEO /Ionic Liquid Based Quasi-Solid-State Electrolytes for Electrical Double Layer Capacitor Devices. Energy Storage 2024, 6, e70085. [Google Scholar] [CrossRef]
- Koh, M.; Kitt, J.P.; Pendergast, A.D.; Harris, J.M.; Minteer, S.D.; Korzeniewski, C. Confocal Raman Microscopy for Measuring In Situ Temperature-Dependent Structural Changes in Poly(Ethylene Oxide) Thin Films. Appl. Spectrosc. 2025, 00037028241310904. [Google Scholar] [CrossRef] [PubMed]
- Wang, N.; Wei, Y.; Yu, S.; Zhang, W.; Huang, X.; Fan, B.; Yuan, H.; Tan, Y. A flexible PEO-based polymer electrolyte with cross-linked network for high-voltage all solid-state lithium-ion battery. J. Mater. Sci. Technol. 2024, 183, 206–214. [Google Scholar] [CrossRef]
- Nizam, M.A.H.; Mazuki, N.F.; Ghazali, N.M.; Samsudin, A.S. Enhanced ionic conduction properties of alginate-PVA biopolymer blend electrolytes doped with NH4I. Ionics 2025, 5627–5643. [Google Scholar] [CrossRef]
- Ramasamy, A.K.; Rajamanickam, G.; Anil Kumar, C.; Lung-Chien, C. Constructing a hydrophobic coating on MAPbI3 perovskite using organic molecule based phosphonium iodide for stable and efficient perovskite solar cells. J. Mater. Sci. Mater. Electron. 2025, 36, 198. [Google Scholar] [CrossRef]
- Ghaedi, H.; Ayoub, M.; Sufian, S.; Lal, B.; Uemura, Y. Thermal stability and FT-IR analysis of Phosphonium-based deep eutectic solvents with different hydrogen bond donors. J. Mol. Liq. 2017, 242, 395–403. [Google Scholar] [CrossRef]
- González-Juárez, E.; Valadez-Villalobos, K.; Garcia-Gutierrez, D.F.; Garcia-Gutierrez, D.I.; Roa, A.E.; Sanchez, E. Study on photovoltaic stability and performance by incorporating tetrabutyl phosphonium iodide into the active layer of a perovskite type photovoltaic cell. RSC Adv. 2020, 10, 31575–31585. [Google Scholar] [CrossRef] [PubMed]
- Ramírez, R.E.; Sánchez, E.M. Molten phosphonium iodides as electrolytes in dye-sensitized nanocrystalline solar cells. Sol. Energy Mater. Sol. Cells 2006, 90, 2384–2390. [Google Scholar] [CrossRef]
- MacPhail, R.A.; Strauss, H.L.; Snyder, R.G.; Elliger, C.A. Carbon-hydrogen stretching modes and the structure of n-alkyl chains. 2. Long, all-trans chains. J. Phys. Chem. 1984, 88, 334–341. [Google Scholar] [CrossRef]
- Fayt, A.; Bürger, H.; Litz, M.; Pawelke, G.; Demaison, J. High resolution FTIR spectrum of cyanogen iodide between 200 and 5000cm−1. Global rovibrational analysis of IR and MW data for I12C14N. J. Quant. Spectrosc. Radiat. Transf. 2012, 113, 1170–1194. [Google Scholar] [CrossRef]
- Rawat, S.; Singh, P.K.; Yahya, M.Z.A.; Yusuf, S.N.F.; Diantoro, M.; Latif, F.A.; Singh, R.C. Polyethylene Oxide Incorporated Ammonium Iodide Doped With Ionic Liquid Trihexyl (Tetradecy) Phosphonium Dicyanamide-Based Polymer Electrolyte for Dual Energy Storage Devices. Energy Storage 2025, 7, e70107. [Google Scholar] [CrossRef]
- Keskar, S.S.; Edye, L.A.; Fellows, C.M.; Doherty, W.O.S. ATR-FTIR Measurement of Biomass Components in Phosphonium Ionic Liquids. J. Wood Chem. Technol. 2012, 32, 175–186. [Google Scholar] [CrossRef]
- Unsalan, O.; Arı, H.; Altunayar-Unsalan, C.; Bolelli, K.; Boyukata, M.; Yalcin, I. FTIR, Raman and DFT studies on 2-[4-(4-ethylbenzamido)phenyl]benzothiazole and 2-[4-(4-nitrobenzamido)phenyl]benzothiazole supported by differential scanning calorimetry. J. Mol. Struct. 2020, 1218, 128454. [Google Scholar] [CrossRef]
- Chandra, S.; Rai, S.B.; Singh, P.K.; Kumar, K.; Chandra, A. On the correlation between the thermal and electrical transport in ionic conductors. J. Phys. Appl. Phys. 2006, 39, 3680–3683. [Google Scholar] [CrossRef]
- Abdulwahid, R.T.; Aziz, S.B.; Kadir, M.F.Z. Insights into ion transport in biodegradable solid polymer blend electrolyte based on FTIR analysis and circuit design. J. Phys. Chem. Solids 2022, 167, 110774. [Google Scholar] [CrossRef]
- Song, P.; Wang, H. High-Performance Polymeric Materials through Hydrogen-Bond Cross-Linking. Adv. Mater. 2020, 32, 1901244. [Google Scholar] [CrossRef] [PubMed]
- Hunger, J.; Roy, S.; Grechko, M.; Bonn, M. Dynamics of Dicyanamide in Ionic Liquids is Dominated by Local Interactions. J. Phys. Chem. B 2019, 123, 1831–1839. [Google Scholar] [CrossRef] [PubMed]
- Okui, N. Relationship between crystallization temperature and melting temperature in crystalline materials. J. Mater. Sci. 1990, 25, 1623–1631. [Google Scholar] [CrossRef]
- Pielichowska, K.; Pielichowski, K. Crystallization behaviour of PEO with carbon-based nanonucleants for thermal energy storage. Thermochim. Acta 2010, 510, 173–184. [Google Scholar] [CrossRef]
- Abdorreza, M.N.; Cheng, L.H.; Karim, A.A. Effects of plasticizers on thermal properties and heat sealability of sago starch films. Food Hydrocoll. 2011, 25, 56–60. [Google Scholar] [CrossRef]
- Fambri, L.; Migliaresi, C. Crystallization and Thermal Properties. In Poly(Lactic Acid); Auras, R.A., Lim, L., Selke, S.E.M., Tsuji, H., Eds.; Wiley: Hoboken, NJ, USA, 2022; pp. 135–151. ISBN 978-1-119-76744-2. [Google Scholar]
- Polu, A.R.; Kareem, A.A.; Rasheed, H.K. Thermal, electrical and electrochemical properties of ionic liquid-doped poly(ethylene oxide)–LiTDI polymer electrolytes for Li-ion batteries. J. Solid State Electrochem. 2023, 27, 409–416. [Google Scholar] [CrossRef]
- Wang, H.; Xiong, M.; Chen, H.; Liu, S. Multi-step ahead wind speed prediction based on a two-step decomposition technique and prediction model parameter optimization. Energy Rep. 2022, 8, 6086–6100. [Google Scholar] [CrossRef]
- Sohn, J.I.; Cha, S.N.; Song, B.G.; Lee, S.; Kim, S.M.; Ku, J.; Kim, H.J.; Park, Y.J.; Choi, B.L.; Wang, Z.L.; et al. Engineering of efficiency limiting free carriers and an interfacial energy barrier for an enhancing piezoelectric generation. Energy Env. Sci. 2013, 6, 97–104. [Google Scholar] [CrossRef]
- Wang, H.; Yang, L. Dielectric constant, dielectric loss, conductivity, capacitance and model analysis of electronic electroactive polymers. Polym. Test. 2023, 120, 107965. [Google Scholar] [CrossRef]
- Huang, Y.-F.; Gu, T.; Rui, G.; Shi, P.; Fu, W.; Chen, L.; Liu, X.; Zeng, J.; Kang, B.; Yan, Z.; et al. A relaxor ferroelectric polymer with an ultrahigh dielectric constant largely promotes the dissociation of lithium salts to achieve high ionic conductivity. Energy Environ. Sci. 2021, 14, 6021–6029. [Google Scholar] [CrossRef]
- Ardhra, S.; Prakash, P.; Siva Dev, R.; Venkatnathan, A. Effect of Concentration and Temperature on the Structure and Ion Transport in Diglyme-Based Sodium-Ion Electrolyte. J. Phys. Chem. B 2022, 126, 2119–2129. [Google Scholar] [CrossRef] [PubMed]
- Shi, L.; Zhang, C.; Du, Y.; Zhu, H.; Zhang, Q.; Zhu, S. Improving Dielectric Constant of Polymers through Liquid Electrolyte Inclusion. Adv. Funct. Mater. 2021, 31, 2007863. [Google Scholar] [CrossRef]
- Nofal, M.M.; Aziz, S.B.; Brza, M.A.; Abdullah, S.N.; Dannoun, E.M.A.; Hadi, J.M.; Murad, A.R.; Al-Saeedi, S.I.; Kadir, M.F.Z. Studies of Circuit Design, Structural, Relaxation and Potential Stability of Polymer Blend Electrolyte Membranes Based on PVA:MC Impregnated with NH4I Salt. Membranes 2022, 12, 284. [Google Scholar] [CrossRef] [PubMed]
- Ju, T.; Chen, X.; Langhe, D.; Ponting, M.; Baer, E.; Zhu, L. Enhancing breakdown strength and lifetime of multilayer dielectric films by using high temperature polycarbonate skin layers. Energy Storage Mater. 2022, 45, 494–503. [Google Scholar] [CrossRef]
- Hernández, G.; Johansson, I.L.; Mathew, A.; Sångeland, C.; Brandell, D.; Mindemark, J. Going Beyond Sweep Voltammetry: Alternative Approaches in Search of the Elusive Electrochemical Stability of Polymer Electrolytes. J. Electrochem. Soc. 2021, 168, 100523. [Google Scholar] [CrossRef]
- Zhao, Y.; Wang, L.; Zhou, Y.; Liang, Z.; Tavajohi, N.; Li, B.; Li, T. Solid Polymer Electrolytes with High Conductivity and Transference Number of Li Ions for Li-Based Rechargeable Batteries. Adv. Sci. 2021, 8, 2003675. [Google Scholar] [CrossRef] [PubMed]
- Zakariya’u, I.; Rawat, S.; Kathuria, S.; Ngulezhu, T.; Song, S.; Yahya, M.Z.A.; Savilov, S.V.; Polu, A.R.; Singh, R.C.; Singh, P.K. Efficient, stable dye-sensitized solar cell using ionic liquid–solid polymer electrolyte. J. Mater. Sci. Mater. Electron. 2024, 35, 1563. [Google Scholar] [CrossRef]
- Fedorov, M.V.; Kornyshev, A.A. Ionic Liquids at Electrified Interfaces. Chem. Rev. 2014, 114, 2978–3036. [Google Scholar] [CrossRef] [PubMed]
- Yue, X.; Fan, J.; Xiang, Q. Internal Electric Field on Steering Charge Migration: Modulations, Determinations and Energy-Related Applications. Adv. Funct. Mater. 2022, 32, 2110258. [Google Scholar] [CrossRef]
- Kumari, J.M.K.W.; Senadeera, G.K.R.; Weerasinghe, A.M.J.S.; Thotawatthage, C.A.; Dissanayake, M.A.K.L. Effect of polyaniline (PANI) on efficiency enhancement of dye-sensitized solar cells fabricated with poly(ethylene oxide)-based gel polymer electrolytes. J. Solid State Electrochem. 2021, 25, 695–705. [Google Scholar] [CrossRef]
- Cho, I.; Selvaraj, A.R.; Bak, J.; Kim, H.; Prabakar, K. Anomalous increase in specific capacitance in MXene during galvanostatic cycling studies. J. Energy Storage 2022, 53, 105207. [Google Scholar] [CrossRef]
- Wu, J. Understanding the Electric Double-Layer Structure, Capacitance, and Charging Dynamics. Chem. Rev. 2022, 122, 10821–10859. [Google Scholar] [CrossRef] [PubMed]
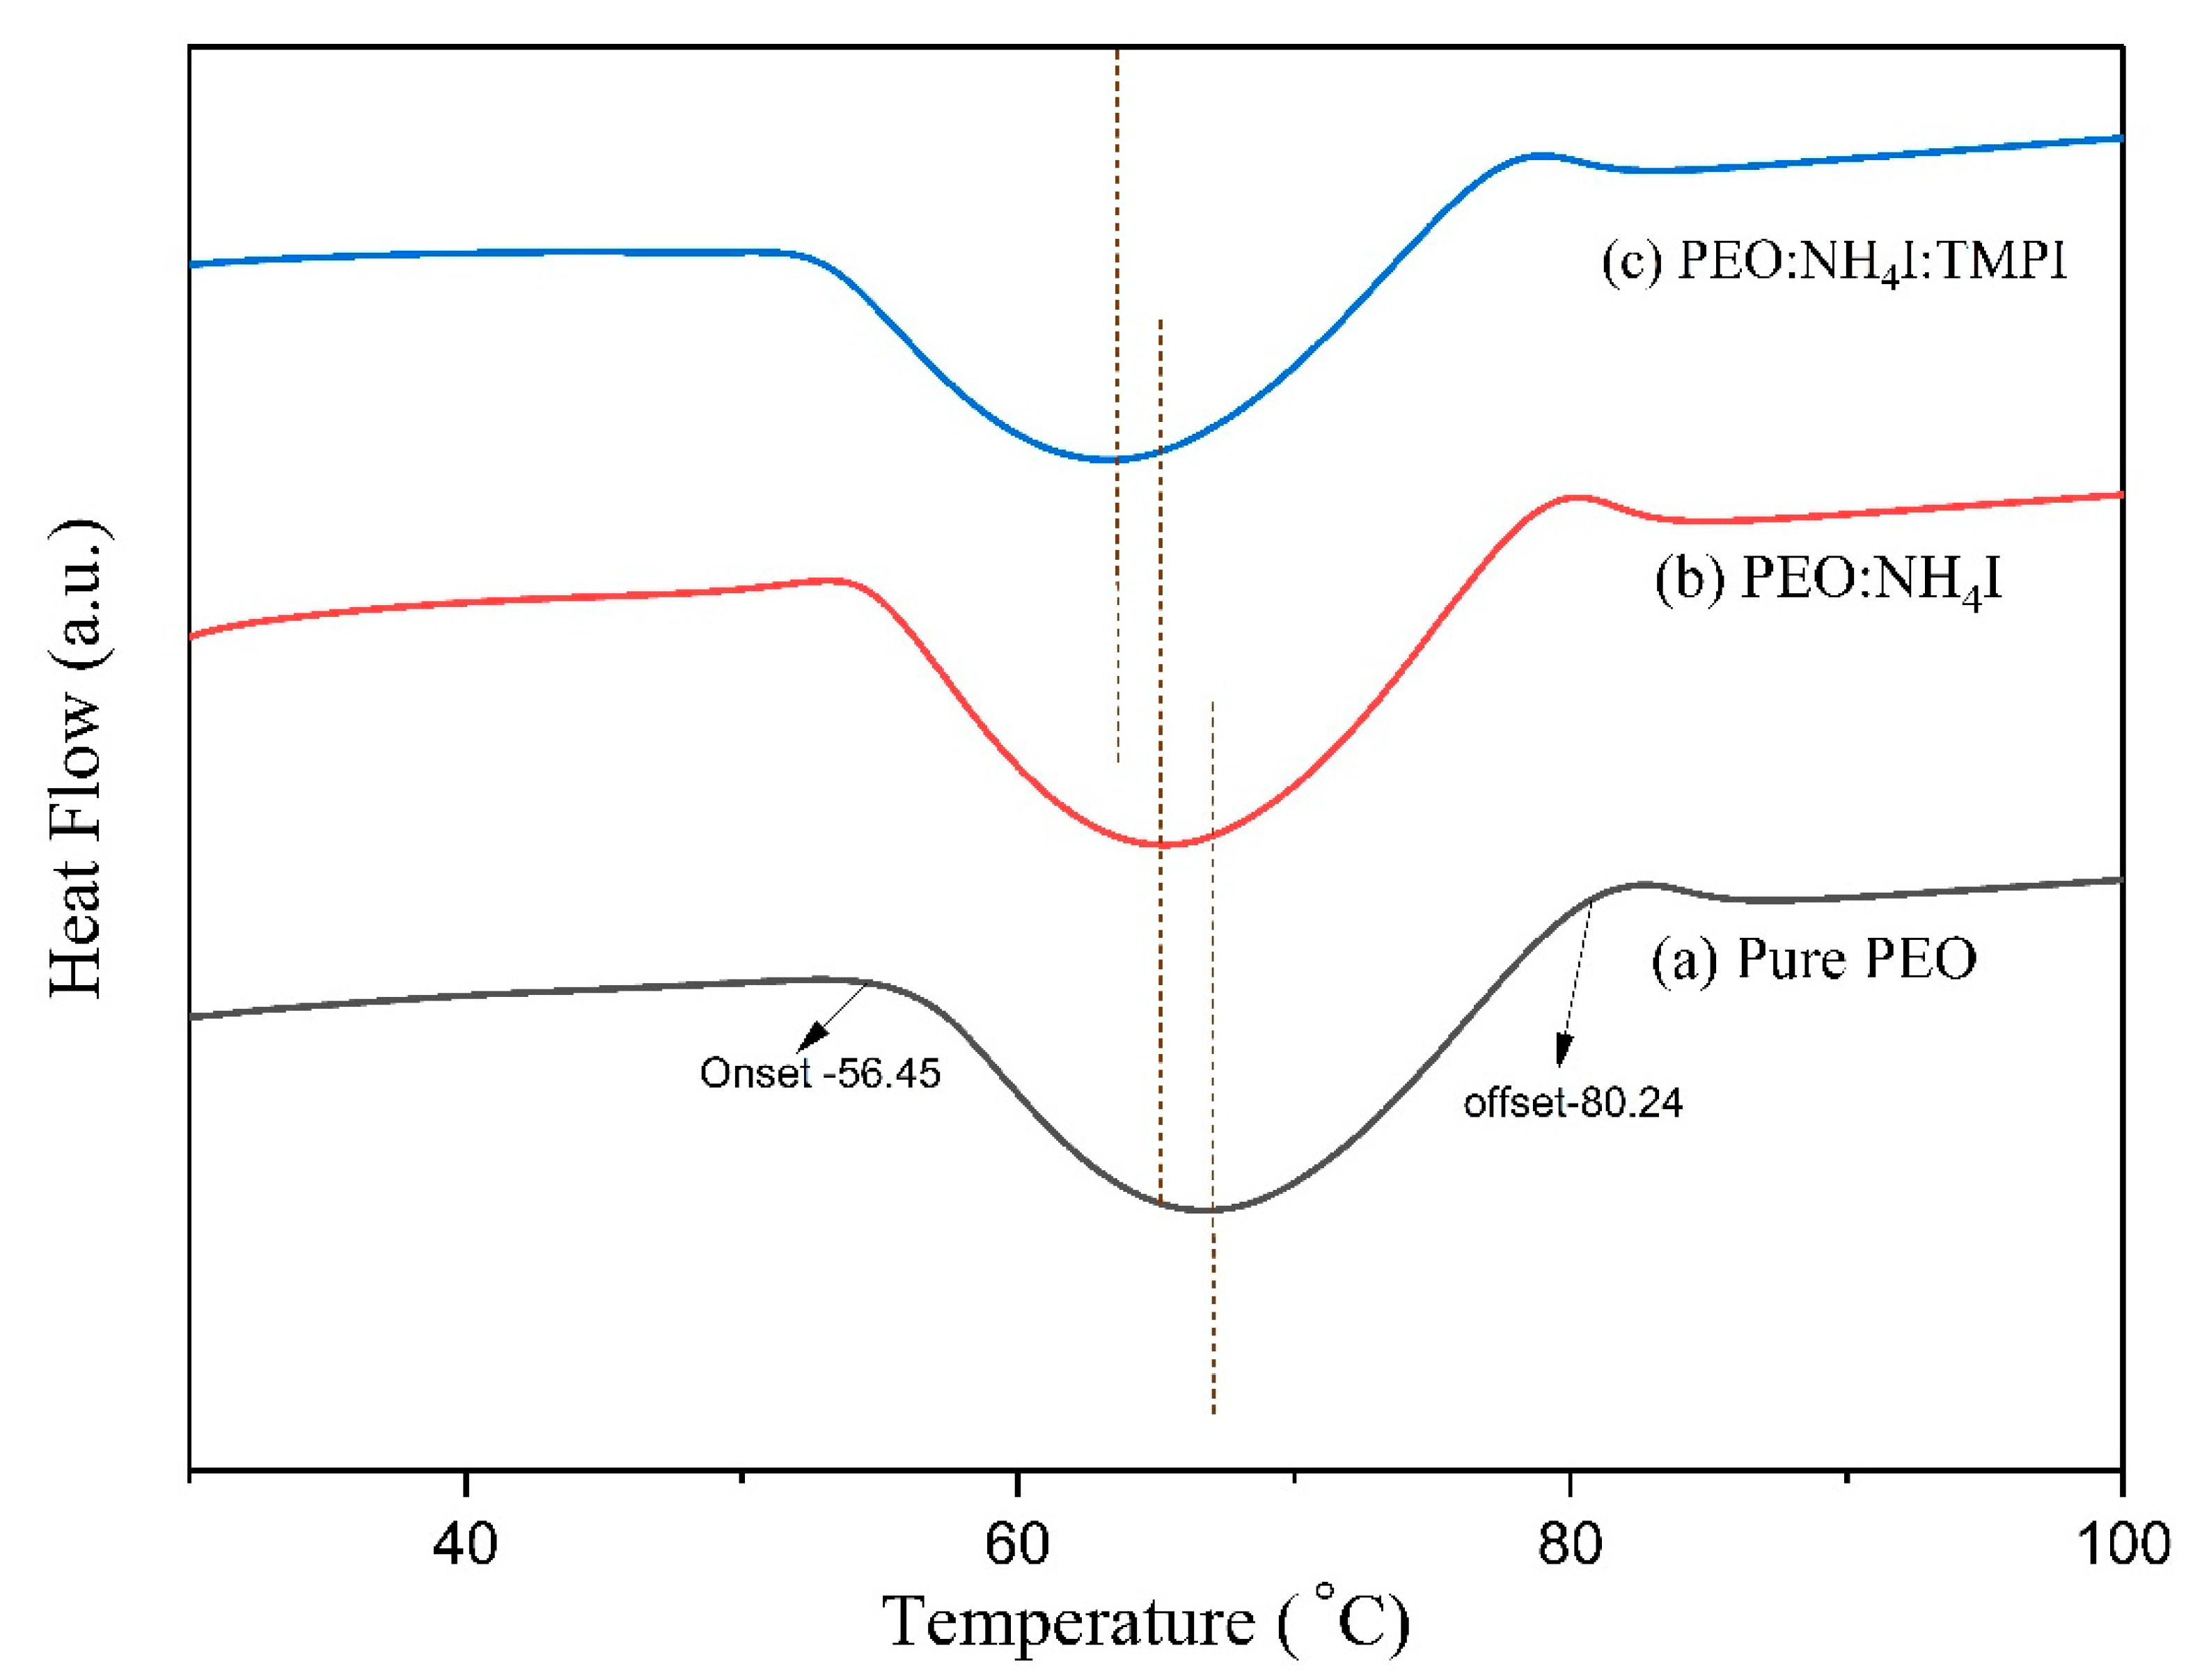

| Composition of Polymer Electrolyte | Tonset (°C) | Toffset (°C) | m | (%) | |
|---|---|---|---|---|---|
| Pure PEO | 56.35 | 80.23 | 23.77 | 155.45 | 72.74 |
| PEO:NH4I | 55.04 | 78.24 | 23.10 | 120.46 | 56.37 |
| PEO:NH4I:TMPI | 53.48 | 76.72 | 23.14 | 71.96 | 33.67 |
| Composition of PEO, NH4I, TMPI (wt.%) | Ionic Conductivity (S/cm) | ||
|---|---|---|---|
| PEO | NH4I, | TMPI | |
| 100 | 0 | 0 | 2.96 × 10⁻⁸ |
| 100 | 8 | 0 | 2.05 × 10⁻⁶ |
| 100 | 8 | 2 | 1.77 × 10⁻⁴ |
| 100 | 8 | 4 | 2.56 × 10⁻⁴ |
| 100 | 8 | 6 | 3.43 × 10⁻⁴ |
| 100 | 8 | 8 | 4.24 × 10⁻⁴ |
| 100 | 8 | 10 | 6.31 × 10⁻⁴ |
| 100 | 8 | 12 | 1.06 × 10⁻³ |
| 100 | 8 | 14 | 1.89 × 10⁻³ |
| 100 | 8 | 16 | 5.17 × 10⁻⁴ |
| 100 | 8 | 18 | 4.78 × 10⁻⁴ |
| 100 | 8 | 20 | 4.52 × 10⁻⁴ |
| 100 | 8 | 22 | 3.65 × 10⁻⁴ |
| 100 | 8 | 24 | 1.74 × 10⁻⁴ |
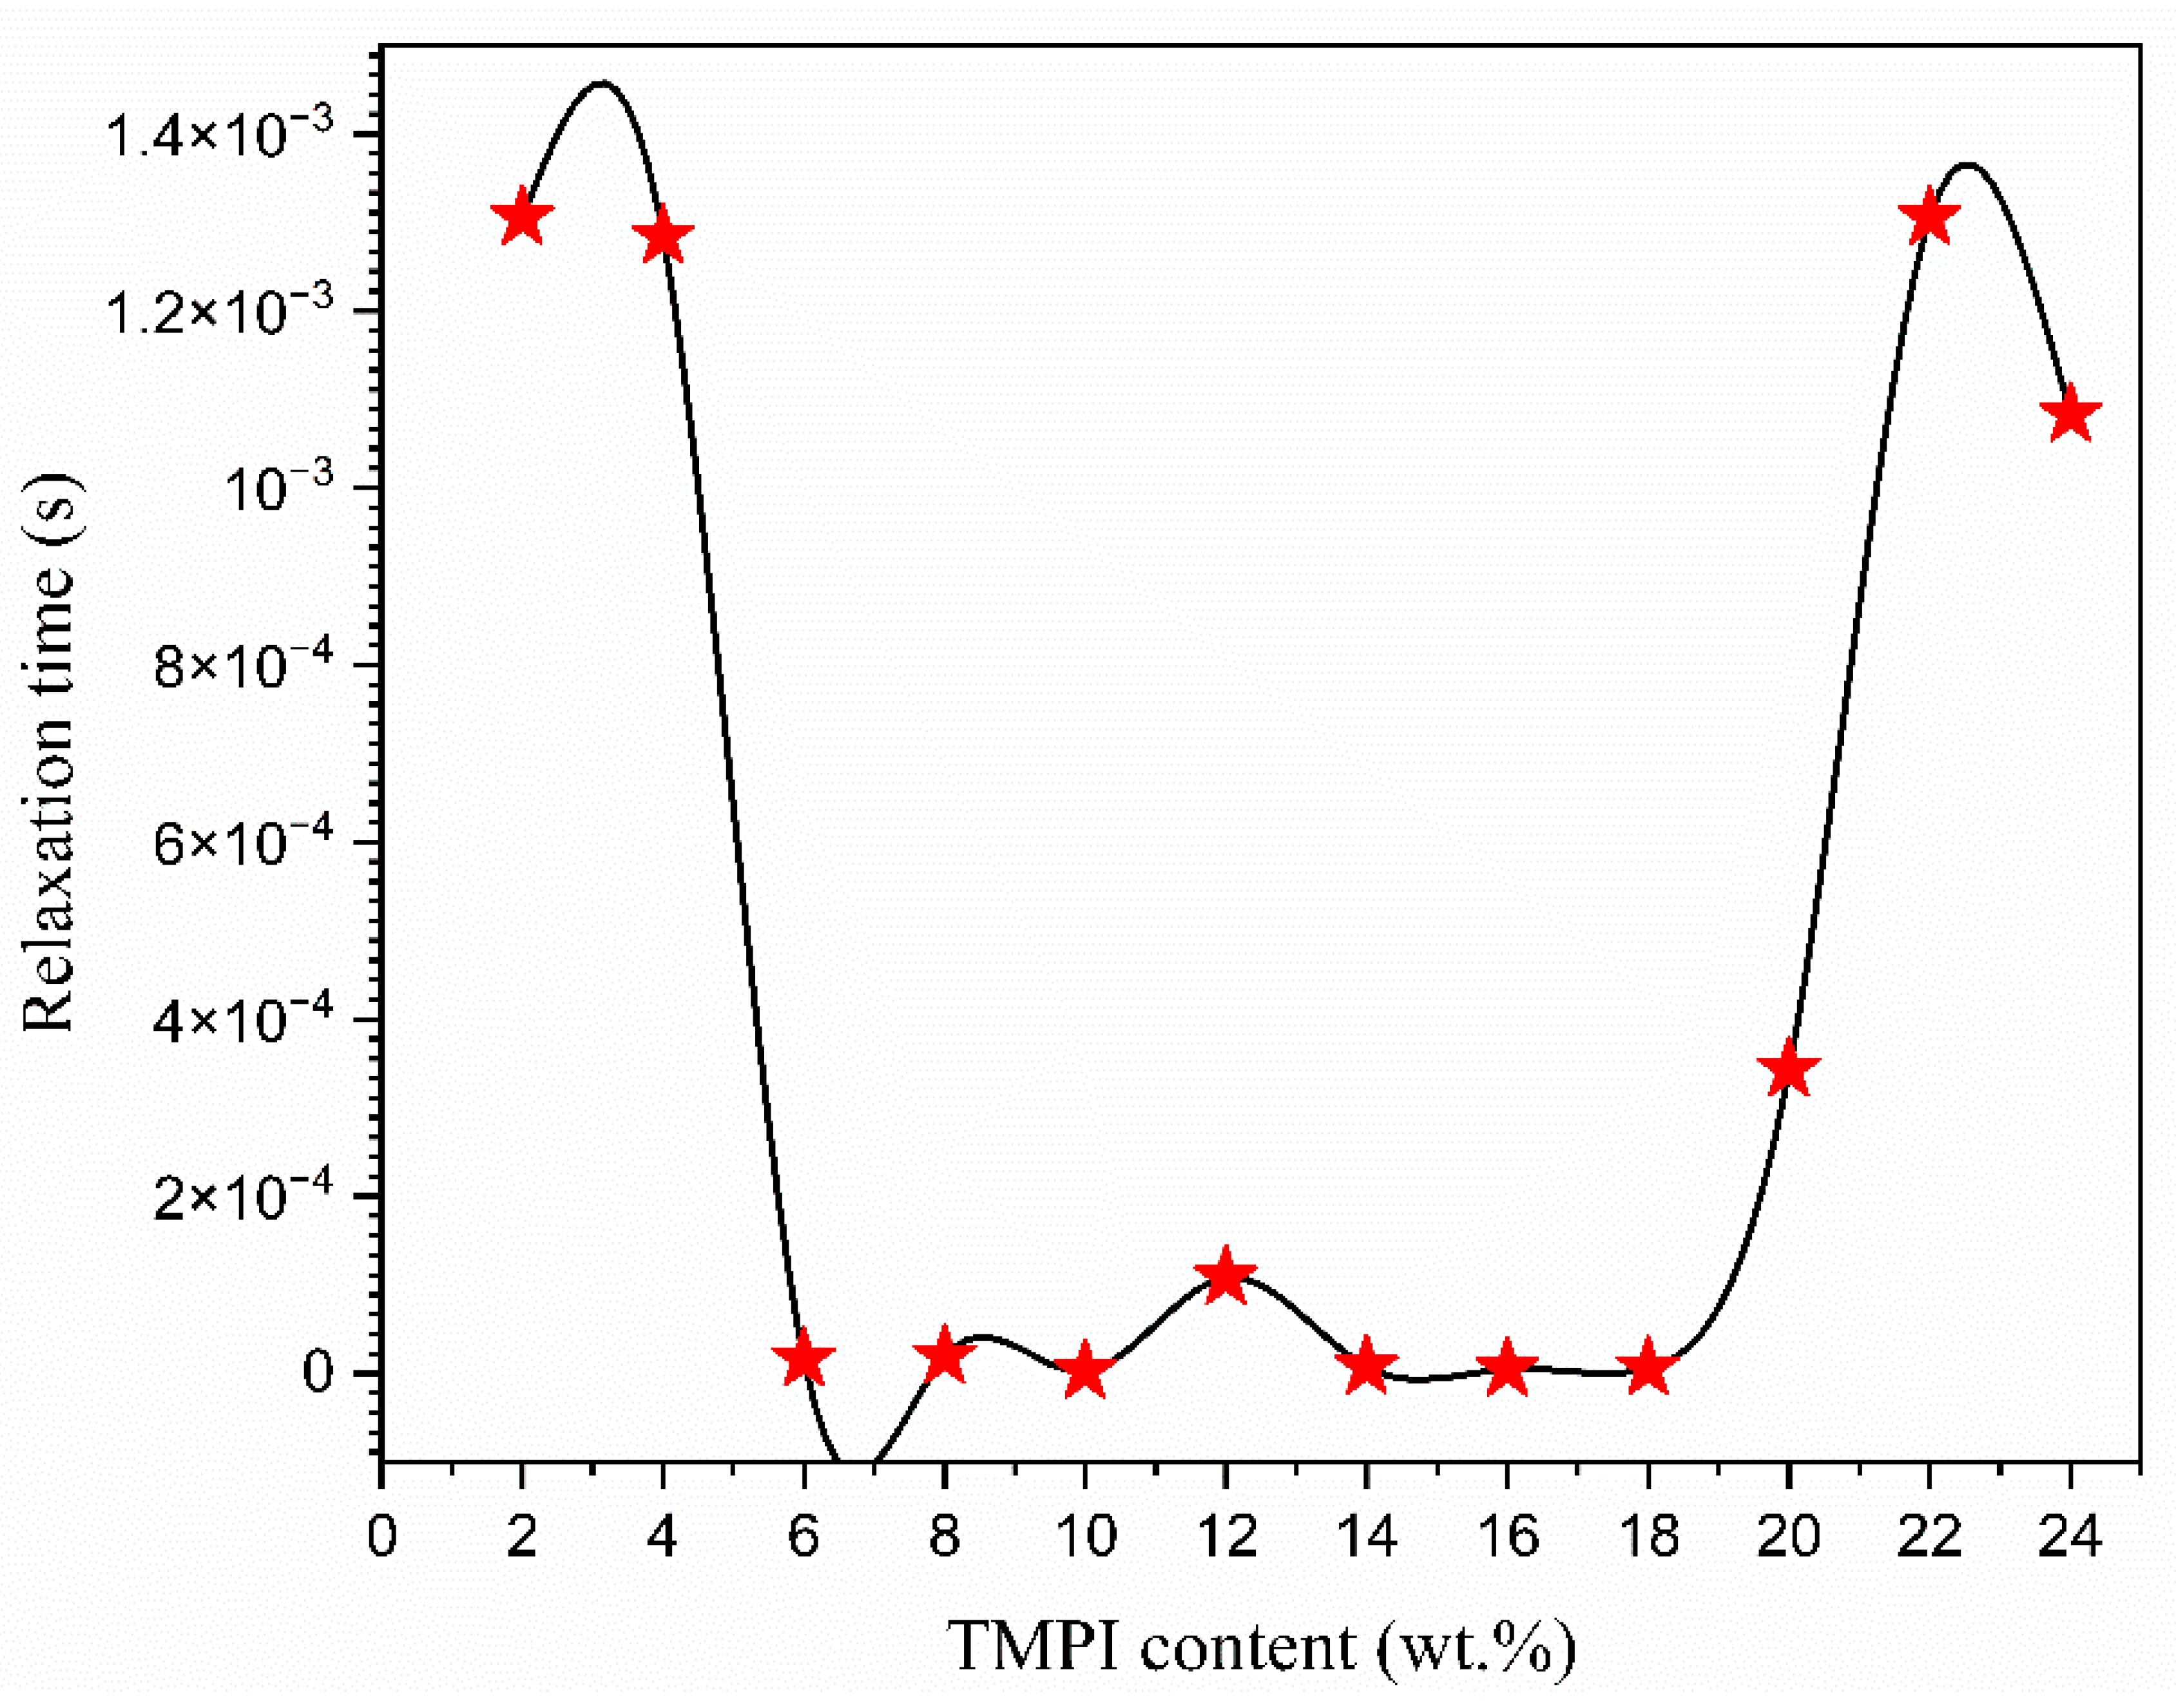
| TMPI Content (wt.%) | Relaxation Frequency (Hz) | Peak Angular Frequency (rad/s) | Relaxation Time (s) |
|---|---|---|---|
| 2 | 122 | 766.16 | 1.31 × 10⁻³ |
| 4 | 124 | 778.72 | 1.28 × 10⁻³ |
| 6 | 9960 | 62,548.8 | 1.59 × 10⁻⁵ |
| 8 | 8300 | 52,124 | 1.91 × 10⁻⁵ |
| 10 | 68,100 | 427,668 | 2.33 × 10⁻⁶ |
| 12 | 14,700 | 19,231.6 | 1.08 × 10⁻⁴ |
| 14 | 21,500 | 135,020 | 7.40 × 10⁻⁶ |
| 16 | 31,700 | 199,076 | 5.02 × 10⁻⁶ |
| 18 | 26,100 | 163,908 | 6.10 × 10⁻⁶ |
| 20 | 464 | 2913.92 | 3.34 × 10⁻⁴ |
| 22 | 122 | 766.16 | 1.13× 10⁻³ |
| 24 | 147 | 923.16 | 1.80 × 10⁻³ |
| 1 | 1.91 | 0.56 | 9.56 | 71.42 | 3.83 |
| 0.5 | 1.91 | 0.56 | 19.16 | 71.03 | 7.64 |
| 0.1 | 1.90 | 0.56 | 38.44 | 51.22 | 15.14 |
| Polymer Electrolyte | |||||
|---|---|---|---|---|---|
| Undoped PEO | 0.61 | 0.68 | 0.61 | 61.89 | 0.26 |
| PEO:NH4I | 0.31 | 0.72 | 1.24 | 58.51 | 0.52 |
| PEO:NH4I:TMPI | 1.91 | 0.56 | 9.56 | 71.42 | 3.83 |
| 1.91 | 0.56 | 9.56 | 71.42 | 3.83 | 1 |
| 1.90 | 0.56 | 7.61 | 70.91 | 3.02 | 2 |
| 2.78 | 0.60 | 2.78 | 69.14 | 1.16 | 3 |
| 2.49 | 0.59 | 2.49 | 70.42 | 1.04 | 4 |
| 2.25 | 0.58 | 2.25 | 72.18 | 0.95 | 5 |
| 1.89 | 0.56 | 1.89 | 71.19 | 0.75 | 10 |
| 2.54 | 0.57 | 2.54 | 70.07 | 1.02 | 15 |
| 1.57 | 0.66 | 1.57 | 81.82 | 0.85 | 30 |
| 1.88 | 0.62 | 1.88 | 60.15 | 0.71 | 90 |
| Scan Rate | Specific Capacitance (F/g) |
|---|---|
| 5 | 205.6 |
| 10 | 171.5 |
| 20 | 134 |
| 30 | 109.7 |
| 40 | 91.37 |
| 50 | 76.89 |
| 100 | 13.90 |
Disclaimer/Publisher’s Note: The statements, opinions and data contained in all publications are solely those of the individual author(s) and contributor(s) and not of MDPI and/or the editor(s). MDPI and/or the editor(s) disclaim responsibility for any injury to people or property resulting from any ideas, methods, instructions or products referred to in the content. |
© 2025 by the authors. Licensee MDPI, Basel, Switzerland. This article is an open access article distributed under the terms and conditions of the Creative Commons Attribution (CC BY) license (https://creativecommons.org/licenses/by/4.0/).
Share and Cite
Rawat, S.; Michalska, M.; Singh, P.K.; Strzałkowski, K.; Pal, N.; Diantoro, M.; Singh, D.; Singh, R.C. Ion Conduction Dynamics, Characterization, and Application of Ionic Liquid Tributyl Methyl Phosphonium Iodide (TMPI)-Doped Polyethylene Oxide Polymer Electrolyte. Polymers 2025, 17, 1986. https://doi.org/10.3390/polym17141986
Rawat S, Michalska M, Singh PK, Strzałkowski K, Pal N, Diantoro M, Singh D, Singh RC. Ion Conduction Dynamics, Characterization, and Application of Ionic Liquid Tributyl Methyl Phosphonium Iodide (TMPI)-Doped Polyethylene Oxide Polymer Electrolyte. Polymers. 2025; 17(14):1986. https://doi.org/10.3390/polym17141986
Chicago/Turabian StyleRawat, Suneyana, Monika Michalska, Pramod K. Singh, Karol Strzałkowski, Nisha Pal, Markus Diantoro, Diksha Singh, and Ram Chandra Singh. 2025. "Ion Conduction Dynamics, Characterization, and Application of Ionic Liquid Tributyl Methyl Phosphonium Iodide (TMPI)-Doped Polyethylene Oxide Polymer Electrolyte" Polymers 17, no. 14: 1986. https://doi.org/10.3390/polym17141986
APA StyleRawat, S., Michalska, M., Singh, P. K., Strzałkowski, K., Pal, N., Diantoro, M., Singh, D., & Singh, R. C. (2025). Ion Conduction Dynamics, Characterization, and Application of Ionic Liquid Tributyl Methyl Phosphonium Iodide (TMPI)-Doped Polyethylene Oxide Polymer Electrolyte. Polymers, 17(14), 1986. https://doi.org/10.3390/polym17141986