3.1. Unexposed Specimens
Results of baseline characteristics are shown in
Table 2. It should be noted that the averages and standard deviations are in line with those reported previously for similar systems by Wang et al. [
46] with an average tensile strength and modulus of 3133.4 MPa and 191.6 GPa, with standard deviations of 87.3 MPa and 2.62 GPa, respectively. Nguyen et al. [
47] also reported average tensile strengths and moduli of 2389.4 MPa and 156.99 GPa, with standard deviations of 298.98 MPa and 9.82 GPa, respectively. Sika, in their datasheets for the CarboDur S System report mean and design tensile strengths of 3100 MPa and 2800 MPa, respectively, which indicates a standard deviation of 100 MPa, and a mean and design tensile modulus of 165 GPa and 160 GPa, indicating a standard deviation of 1.67 GPa [
48].
As can be seen, system A has the highest tensile strength and modulus while system C has the lowest. While it may, at first glance, appear that the difference can be attributed completely to fiber volume fraction a simple constituent analysis using the rule-of-mixtures indicates that there are further reasons including differences in fiber–matrix interface bonding and fiber linearity, which can also be noted in SBS results. This can be directly attributed to the manufacturing method itself since the tension in pultrusion causes fibers to remain aligned whereas the use of a two-step process of preforming followed by processing in pulforming results in non-linearities that result in a drop in both strength and modulus. A comparison shows that system C has levels of tensile strength, modulus, and SBS strength 12.3%, 25.8% and 8.11% less than system A with the significantly lower modulus being an indicator of non-linearity effects. In contrast, the values of system B, which has a volume fraction of 61% compared to the 69% level of system A, are more in line with the effects of volume fraction. Further, the decrease in SBS strength of system A as compared to system B is in line with the effect of high fiber volume fraction on interfacial response as detailed by Karbhari and Xian [
49].
Tests on specimens maintained at 23 °C through the 5-year (60-month) period of investigation showed very little change in all characteristics indicating that, as expected, the specimens were completely cured at the outset and did not undergo posture, or deterioration, over time. For purposes of design the average values as tested are rarely used. Rather, the design value is chosen to be conservative and represents the minimum performance level a material can be expected to maintain, providing a lower bound for its performance. Within the aerospace sector, design values for composites are determined using either the A-basis (defined as the lower 1st percentile of a population distribution with 95% confidence) or the B-basis (defined as the lower 10th percentile of the population with a 95% confidence [
50]. In the case of externally bonded FRP strips for the rehabilitation of concrete ACI-440 [
17,
30] defines the guaranteed performance level as
where m is the sample mean of the tested property,
n (=3) is the multiplier corresponding to the required statistical confidence level, and s is the sample standard deviation. The value of 3 used for the multiplier in Equation (1) corresponds to a statistical confidence level of approximately 99.87% under the assumption of a normal distribution. This value is slightly more conservative than the B-basis which uses a multiplier of 1.66 in comparison. Both the Canadian Highway Bridge Design Code [
51] and the fiB model code [
52] define the characteristic value as the 5th percentile of the population with a 95% confidence level, such that
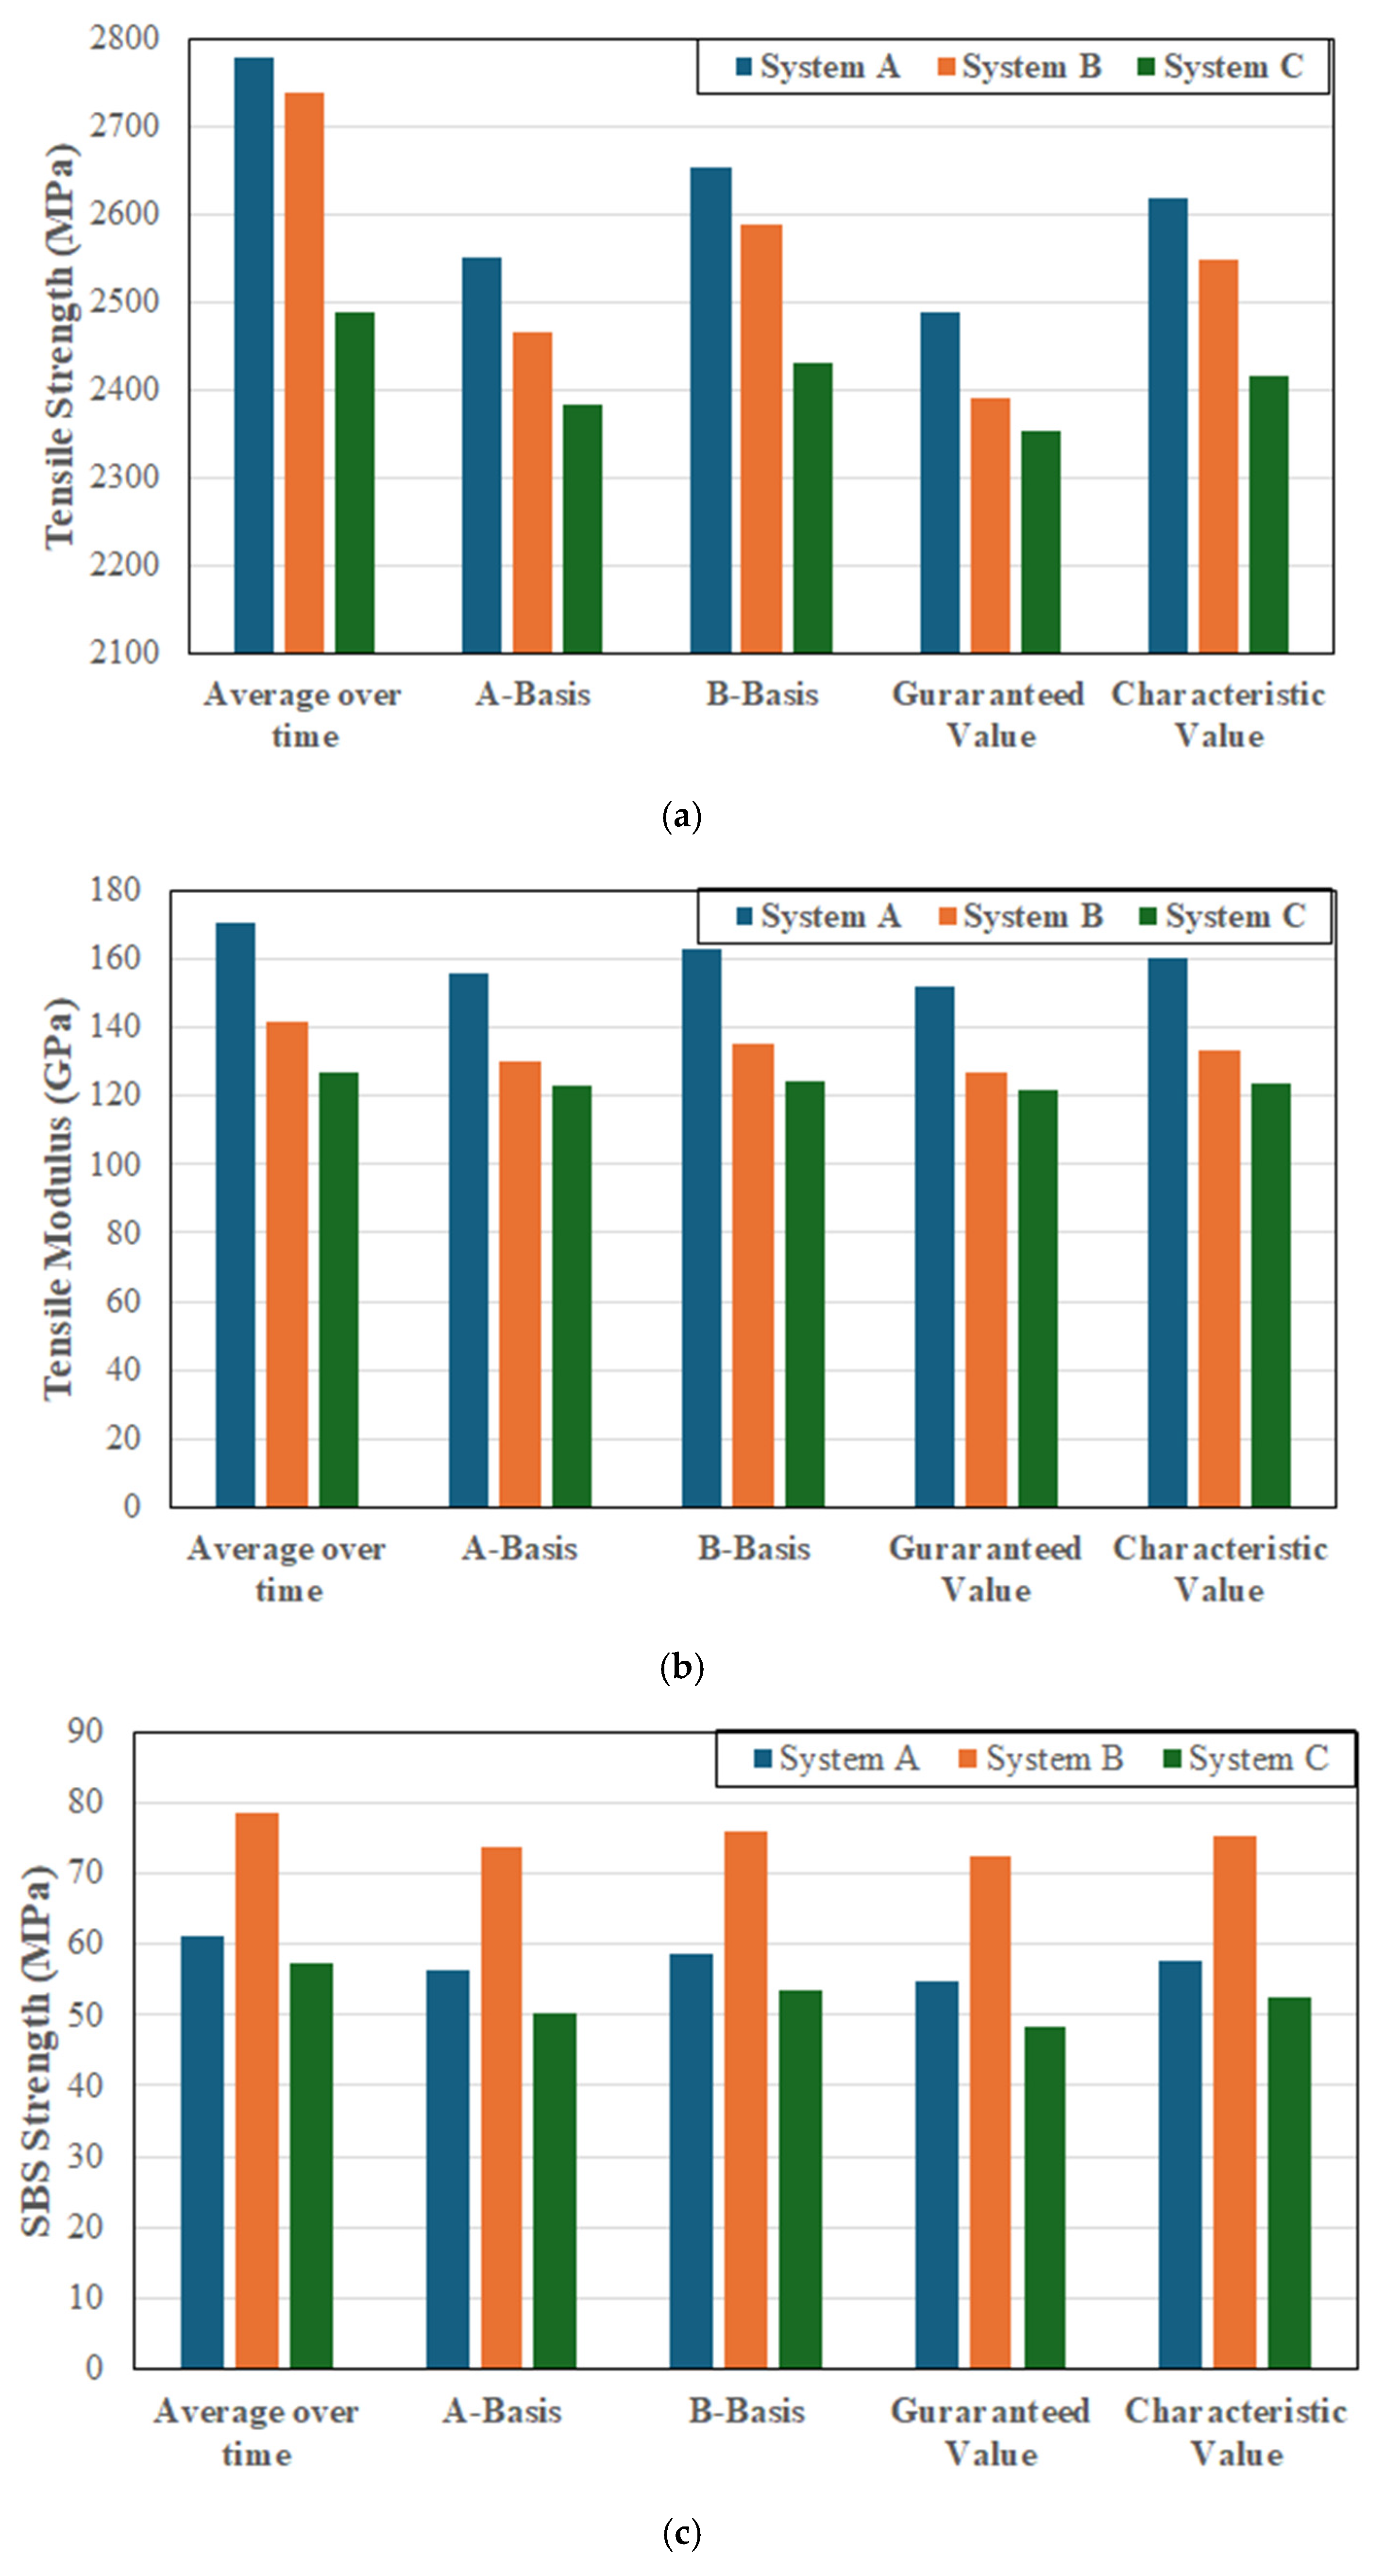
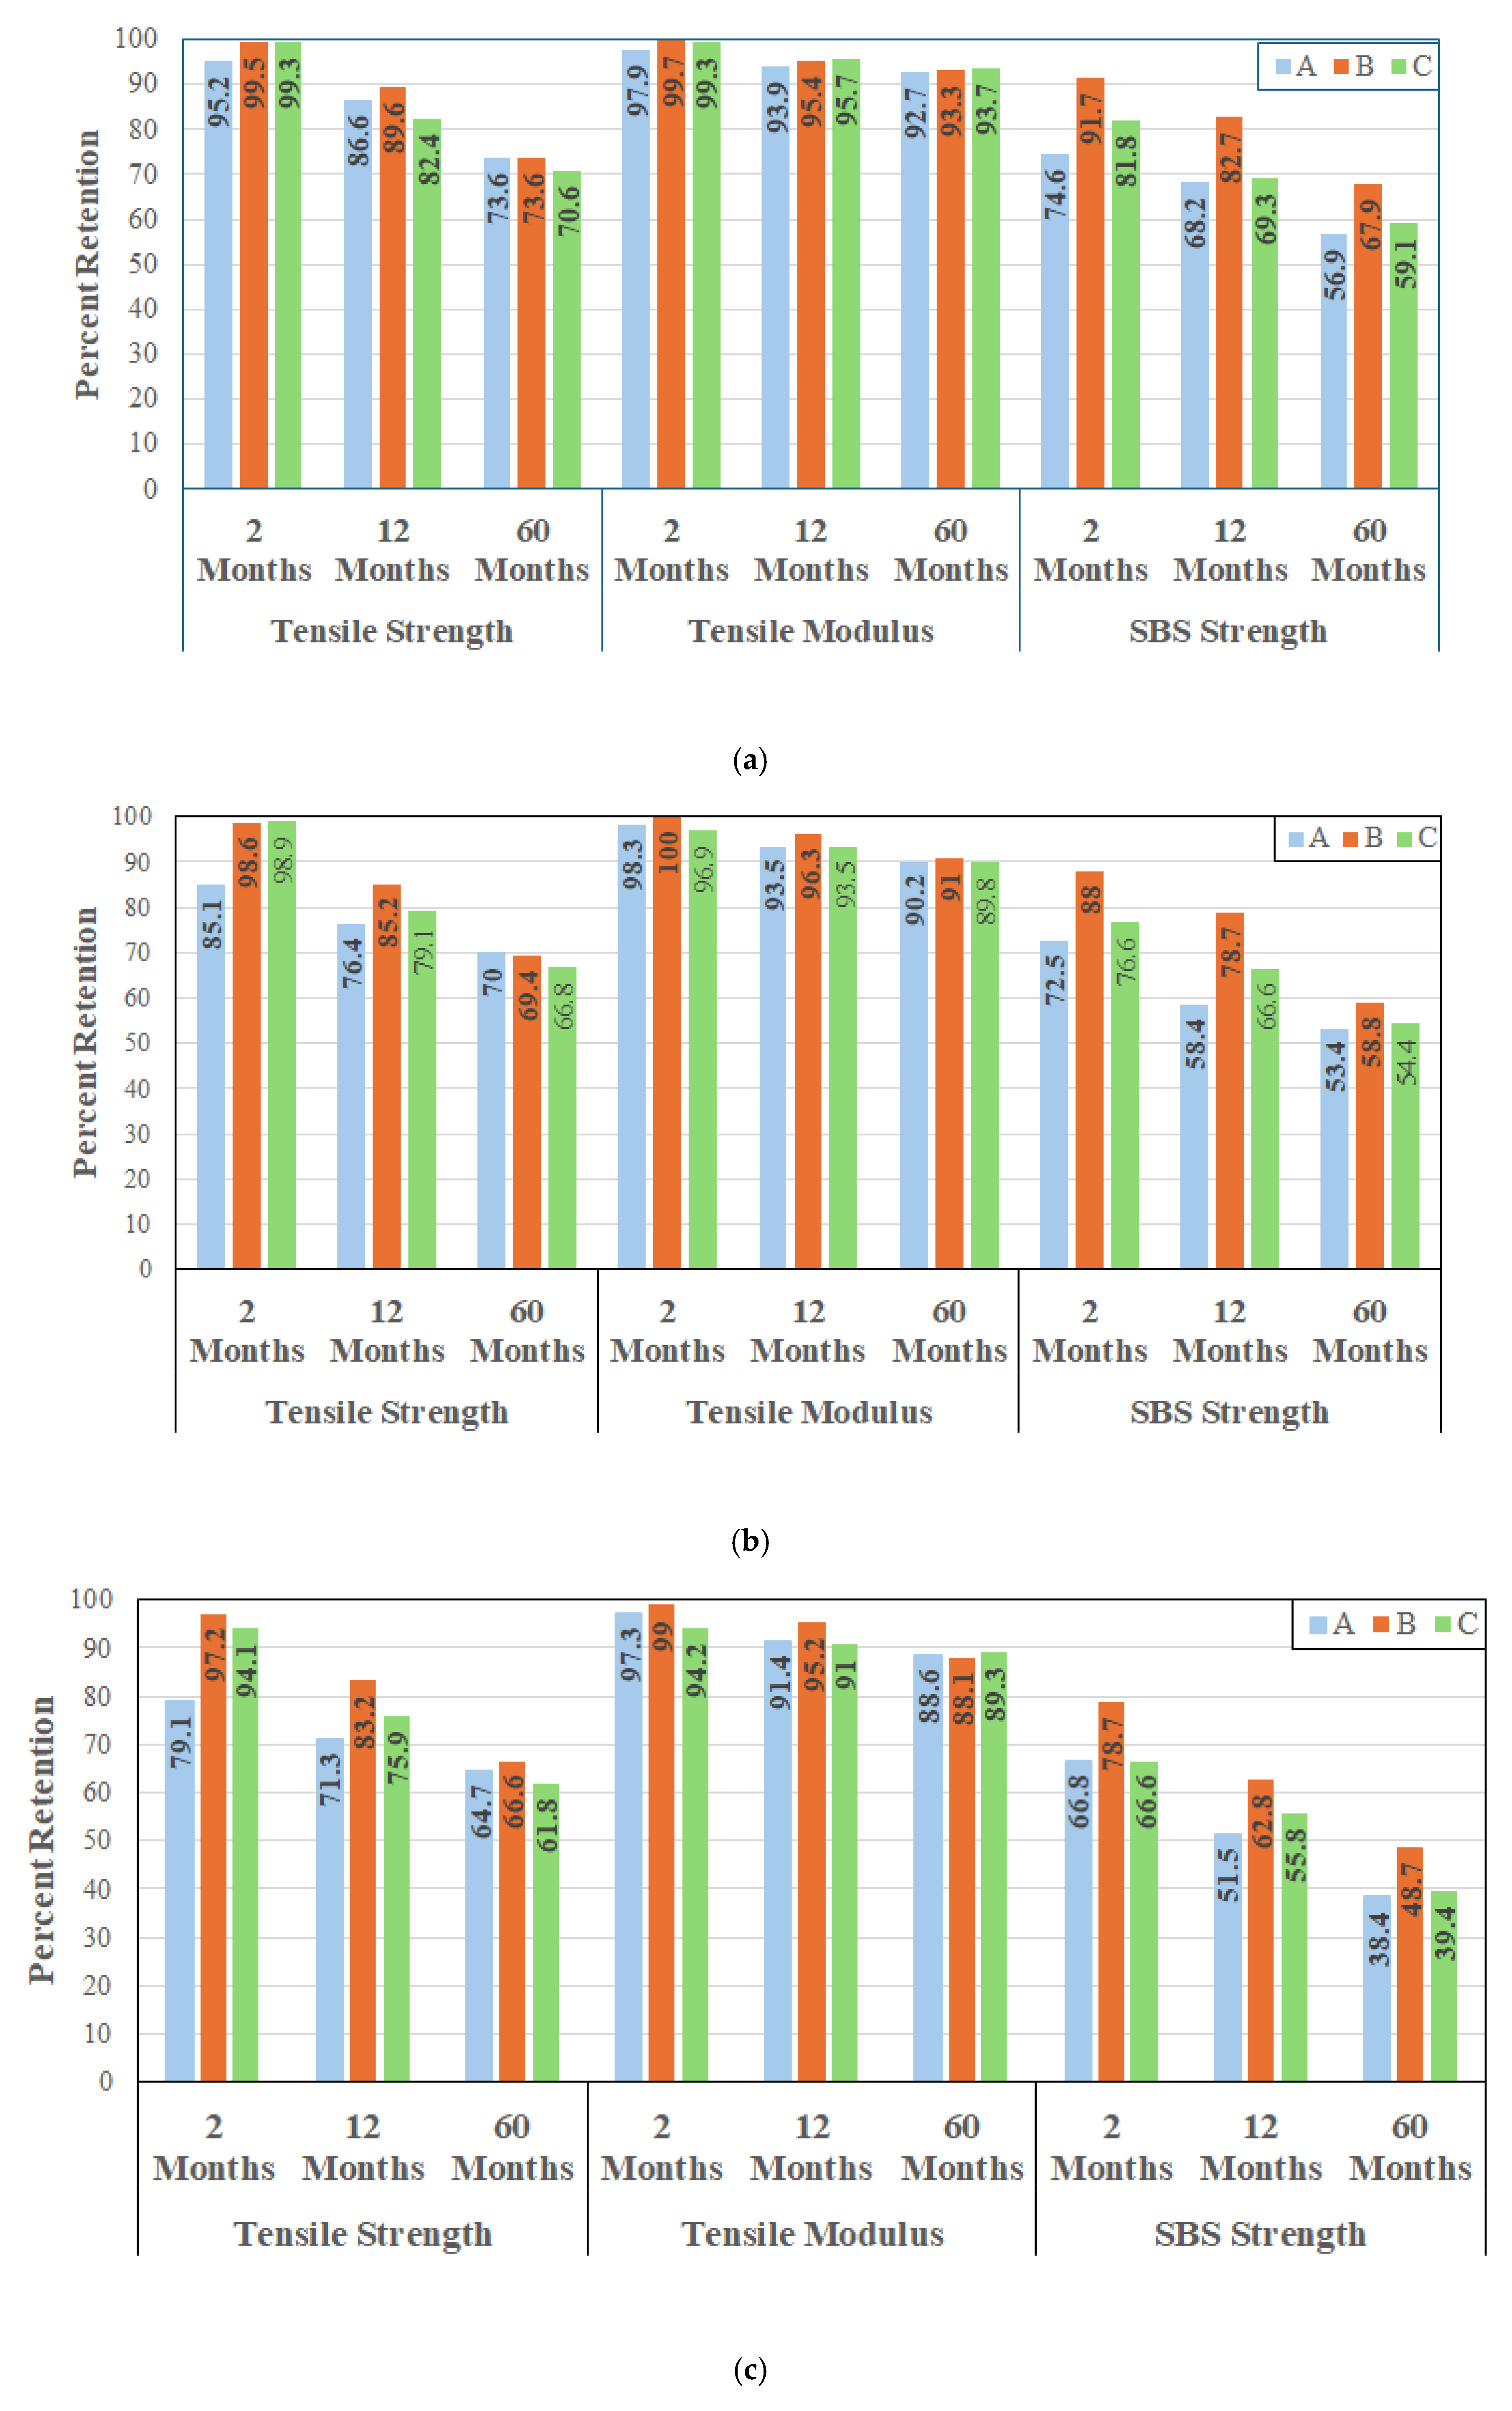
n = 1.645. Overall results for the three systems as related to population mean, A-basis, B-basis, guaranteed performance level, and the characteristic value for the tensile strength and modulus and the SBS strength are given in
Figure 1a–c. The A- and B-basis values are used extensively in the aerospace and defense sectors with composites and are hence provided here as a basis of comparison since they are predominantly used with extremely well characterized and highly regulated materials systems which have to be extensively qualified, including at the constituent (fiber and matrix) and process levels [
50].
As expected the guaranteed values are the lowest of all the sets determined for each of the three FRP systems, with the guaranteed values for system A being 89.5%, 89.1% and 89.5% of the mean for tensile strength, tensile modulus and SBS strength, respectively, while those for system B are 87.4%, 89.7% and 92.4%, respectively, and the corresponding values for system C are 94.6%, 96.1%, and 84.4%, respectively, suggesting that on a preliminary basis systems A and B are similar, but both are different from system C.
Given that the design values are often based on the assumption of normality of the distribution of populations, and the Weibull distribution has been widely used in describing failure of composites [
53,
54], it is of interest to assess the fit of these data to these two distributions. The probability density function (PDF) for the normal distribution is expressed as
where m is the mean, and s is the standard deviation. The 2-parameter Weibull distribution is expressed as
where a and b are the shape and scale parameters, respectively. Values of these parameters are given in
Table 2 for the normal distribution and
Table 3 for the Weibull distribution.
In the normal distribution the standard deviation, s, is a direct measure of scatter with a larger standard deviation being indicative of greater scatter around the mean. In comparison the shape parameter, a, governs the form and concentration of the distribution with a high value of a representing a narrower peak and hence less scatter, and a lower value of a being indicative of a flatter or more spread-out distribution representative of greater scatter. The scale parameter, b, describes the relative dispersion and sets the location with a higher value increasing the absolute value but not necessarily the relative scatter. As can be seen from a comparison of values in
Table 2 and
Table 3 the scale parameter in
Table 3 is analogous to the average and in all cases is higher than the mean for the normal distribution in
Table 2. The shape parameter, however, does not correlate directly with the standard deviation. For example, scatter in tensile modulus as indicated by the standard deviation is the highest for set B and the lowest for set C, whereas set C has the highest value of a and hence the least scatter. It is of interest to note that for tensile strength scatter as denoted by the shape parameter, a, follows the trend of C < A < B, whereas the order for tensile modulus is C < B < A and that for SBS strength is B < A < C.
In addition to the Kolmogorov–Smirnov test which was used to assess both normal and Weibull fits, the Shapiro–Wilk test was used to assess normality. Results are summarized in
Table 4.
It should be noted that the Shapiro–Wilk test uses a value of 0.05 to assess normality, i.e., if
p > 0.05 the null hypothesis is not rejected and the dataset is consistent with a normal distribution. In this case population sets with
p = 0.011 and
p = 0.003, representative of FRP systems A and B for tensile strength, indicate significant deviation from normality. This is confirmed by the Kolmogorov–Smirnov test where the
p value for the normal distribution is significantly lower than that for the Weibull distribution indicating that the latter provides the better fit. Overall, it is clear that neither distribution can be used across all three systems emphasizing the lack of qualification through rigorous specifications as would be necessitated in the aerospace/defense sectors. In the case of FRP system C for SBS strength, while the Shapiro–Wilk test indicates normality, the Kolmogorov–Smirnov test statistic is lower for the Weibull distribution and the
p-value is higher for the Weibull distribution suggesting that while both distributions could be used the Weibull provides the better fit. Knowledge of the fits and parameters are useful for further analysis using reliability-based approaches [
55,
56]. A comparison of distribution fits across the three systems indicates that systems A and B show similarities in the preferred distributions whereas system C is again different, following the conclusion reached earlier on comparison of basis and guaranteed values.
While FRP products are currently available without a preset standard or specification for the product, resulting in a variation in both geometrical (such as thickness in the case of the three prefabricated FRP strips considered in the current investigation) and performance characteristics, it would be advantageous for the systems to meet specific thresholds that could then be used generically for design in a manner similar to that for structural steel. An assessment by pooling data for all three systems and use of the Shapiro–Wilk test indicates significant non-normality for all three characteristics (tensile strength, tensile modulus, and SBS strength) with the Kolmogorov–Smirnov tests indicating a slight preference for the Weibull distribution on tensile strength but poor fits for both normal and Weibull distributions for tensile modulus and SBS strength with indications of multimodal behavior. This is not unexpected given the differences among the three systems as noted earlier. It is, however, of interest to note that pooling of only Sets A and B results in a similar conclusion with the tensile strength fitting the Weibull distribution extremely well (p = 0.919 compared to 0.0079 for all three sets together) but neither showing a good fit for the tensile modulus and SBS strength. Thus, significant work remains for the development of a performance-based standard for these products for use in general applications as has been achieved for structural steel in civil infrastructure applications and prepreg based autoclave cured composites in aerospace and defense applications.
3.2. Effect of Hydrothermal Exposure
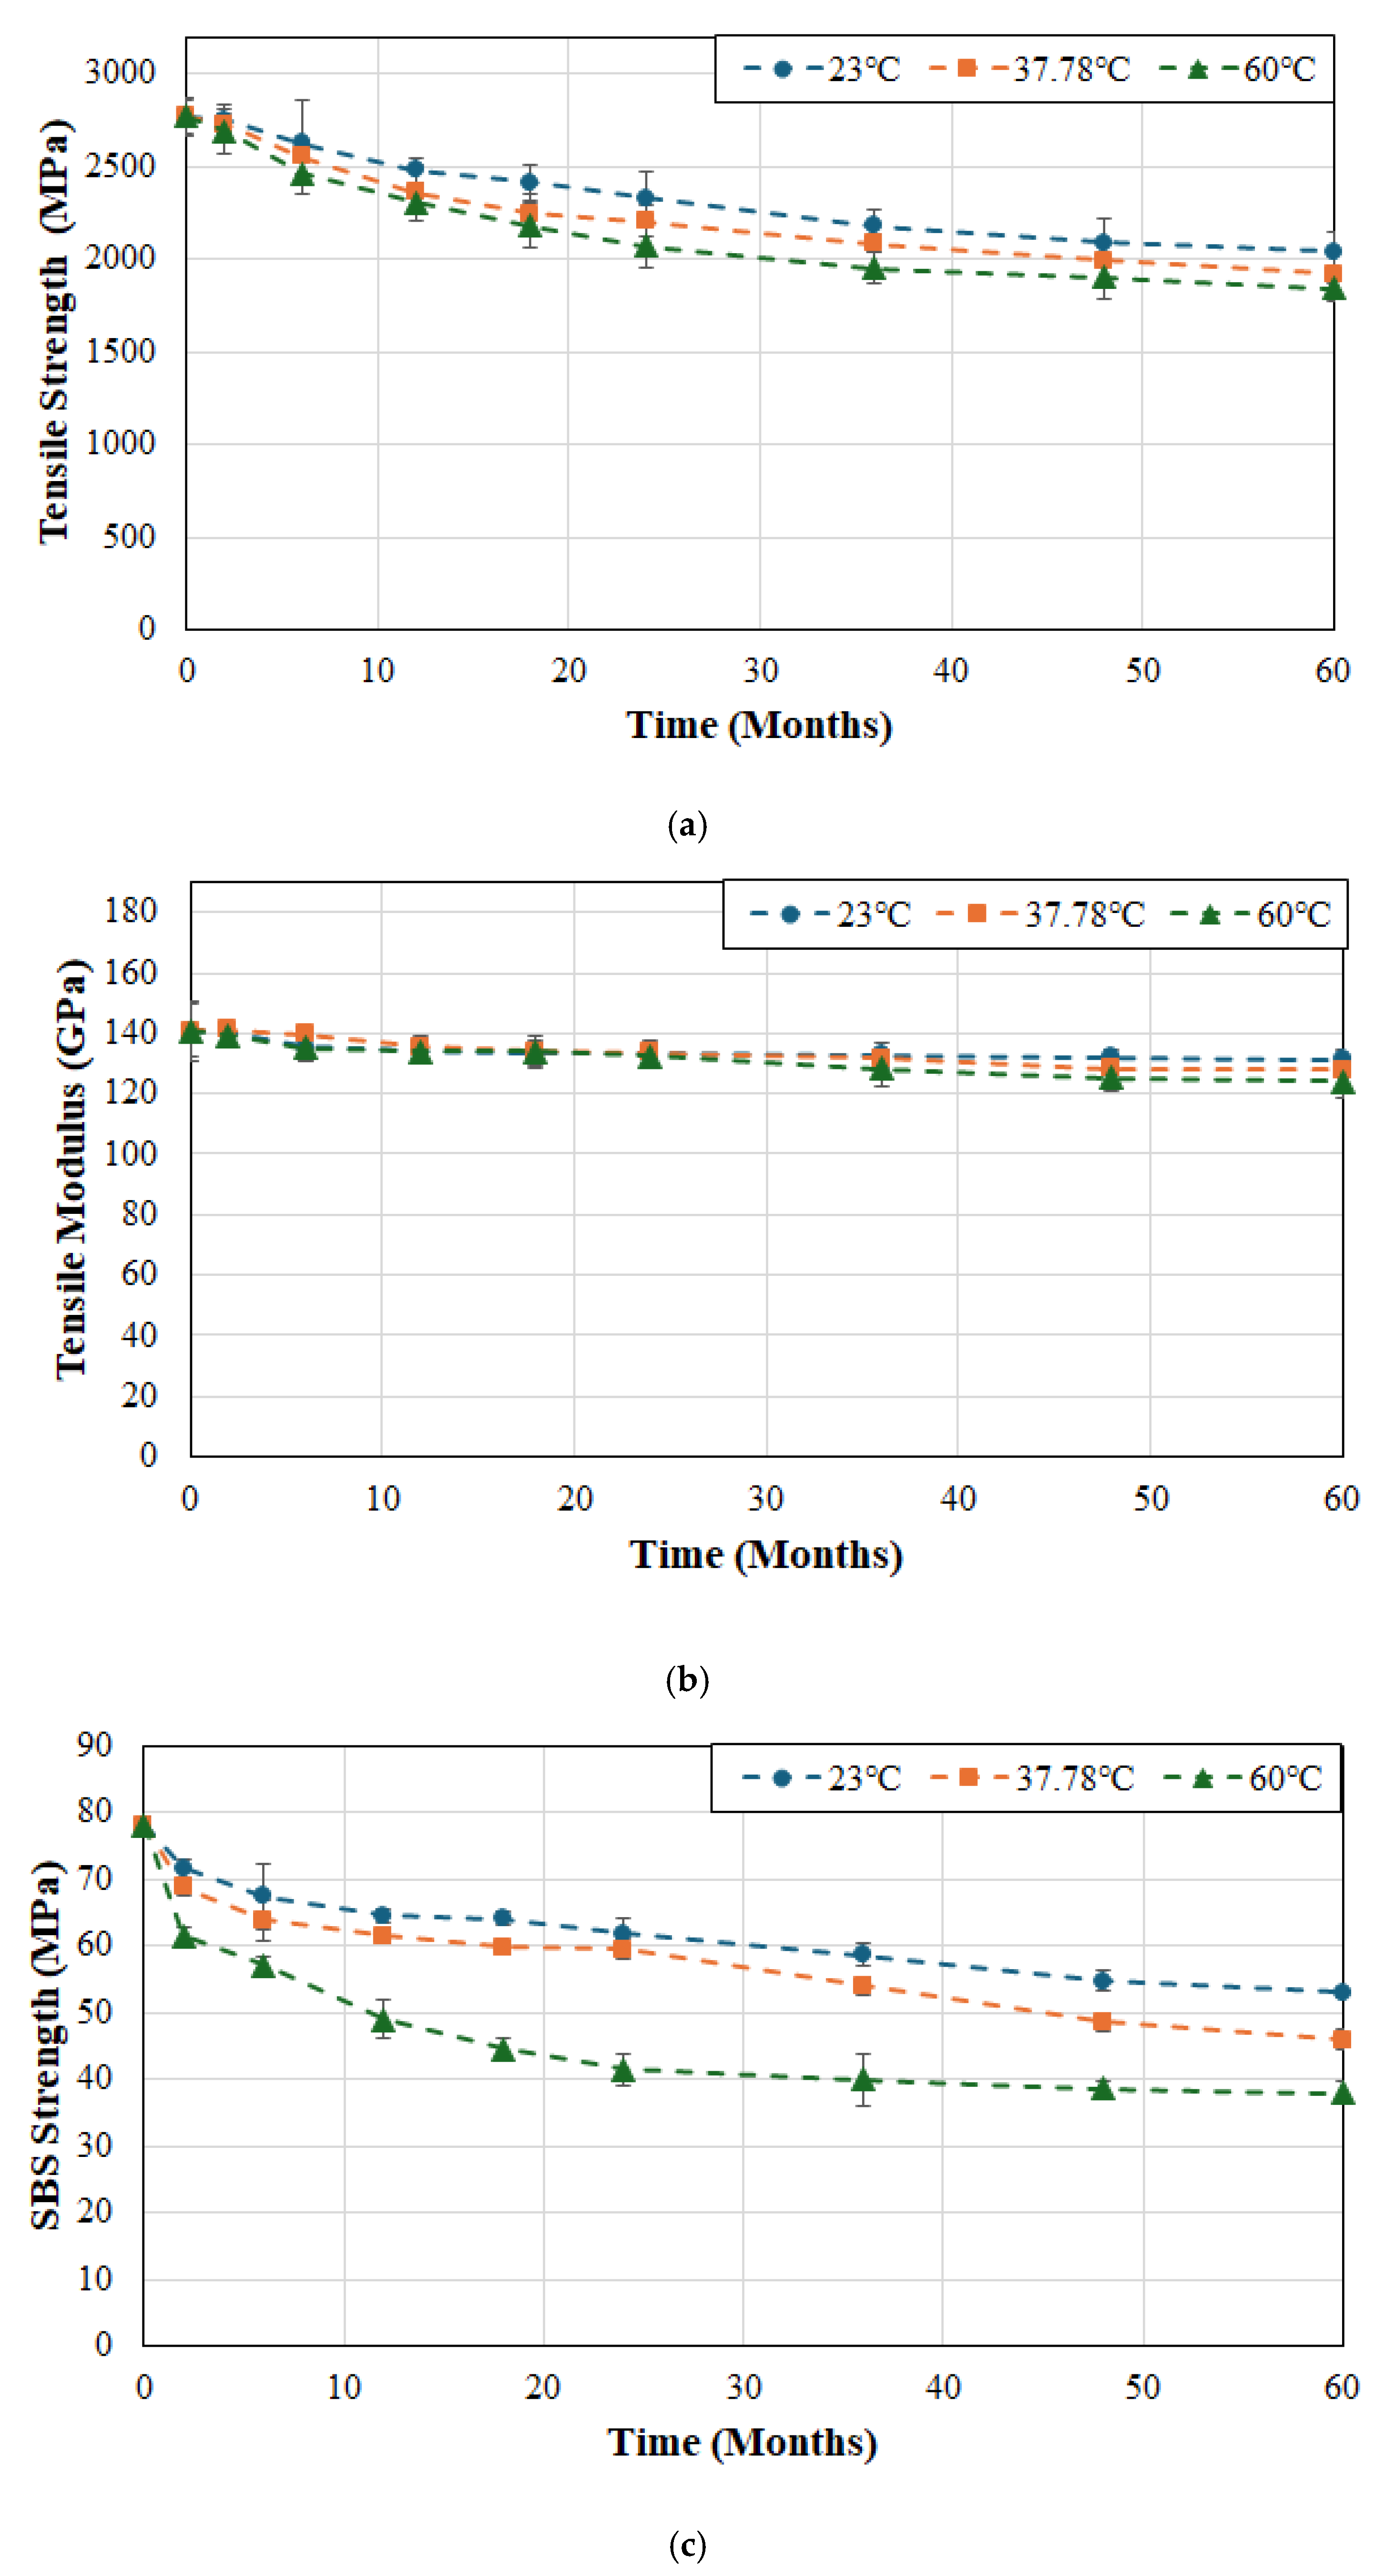
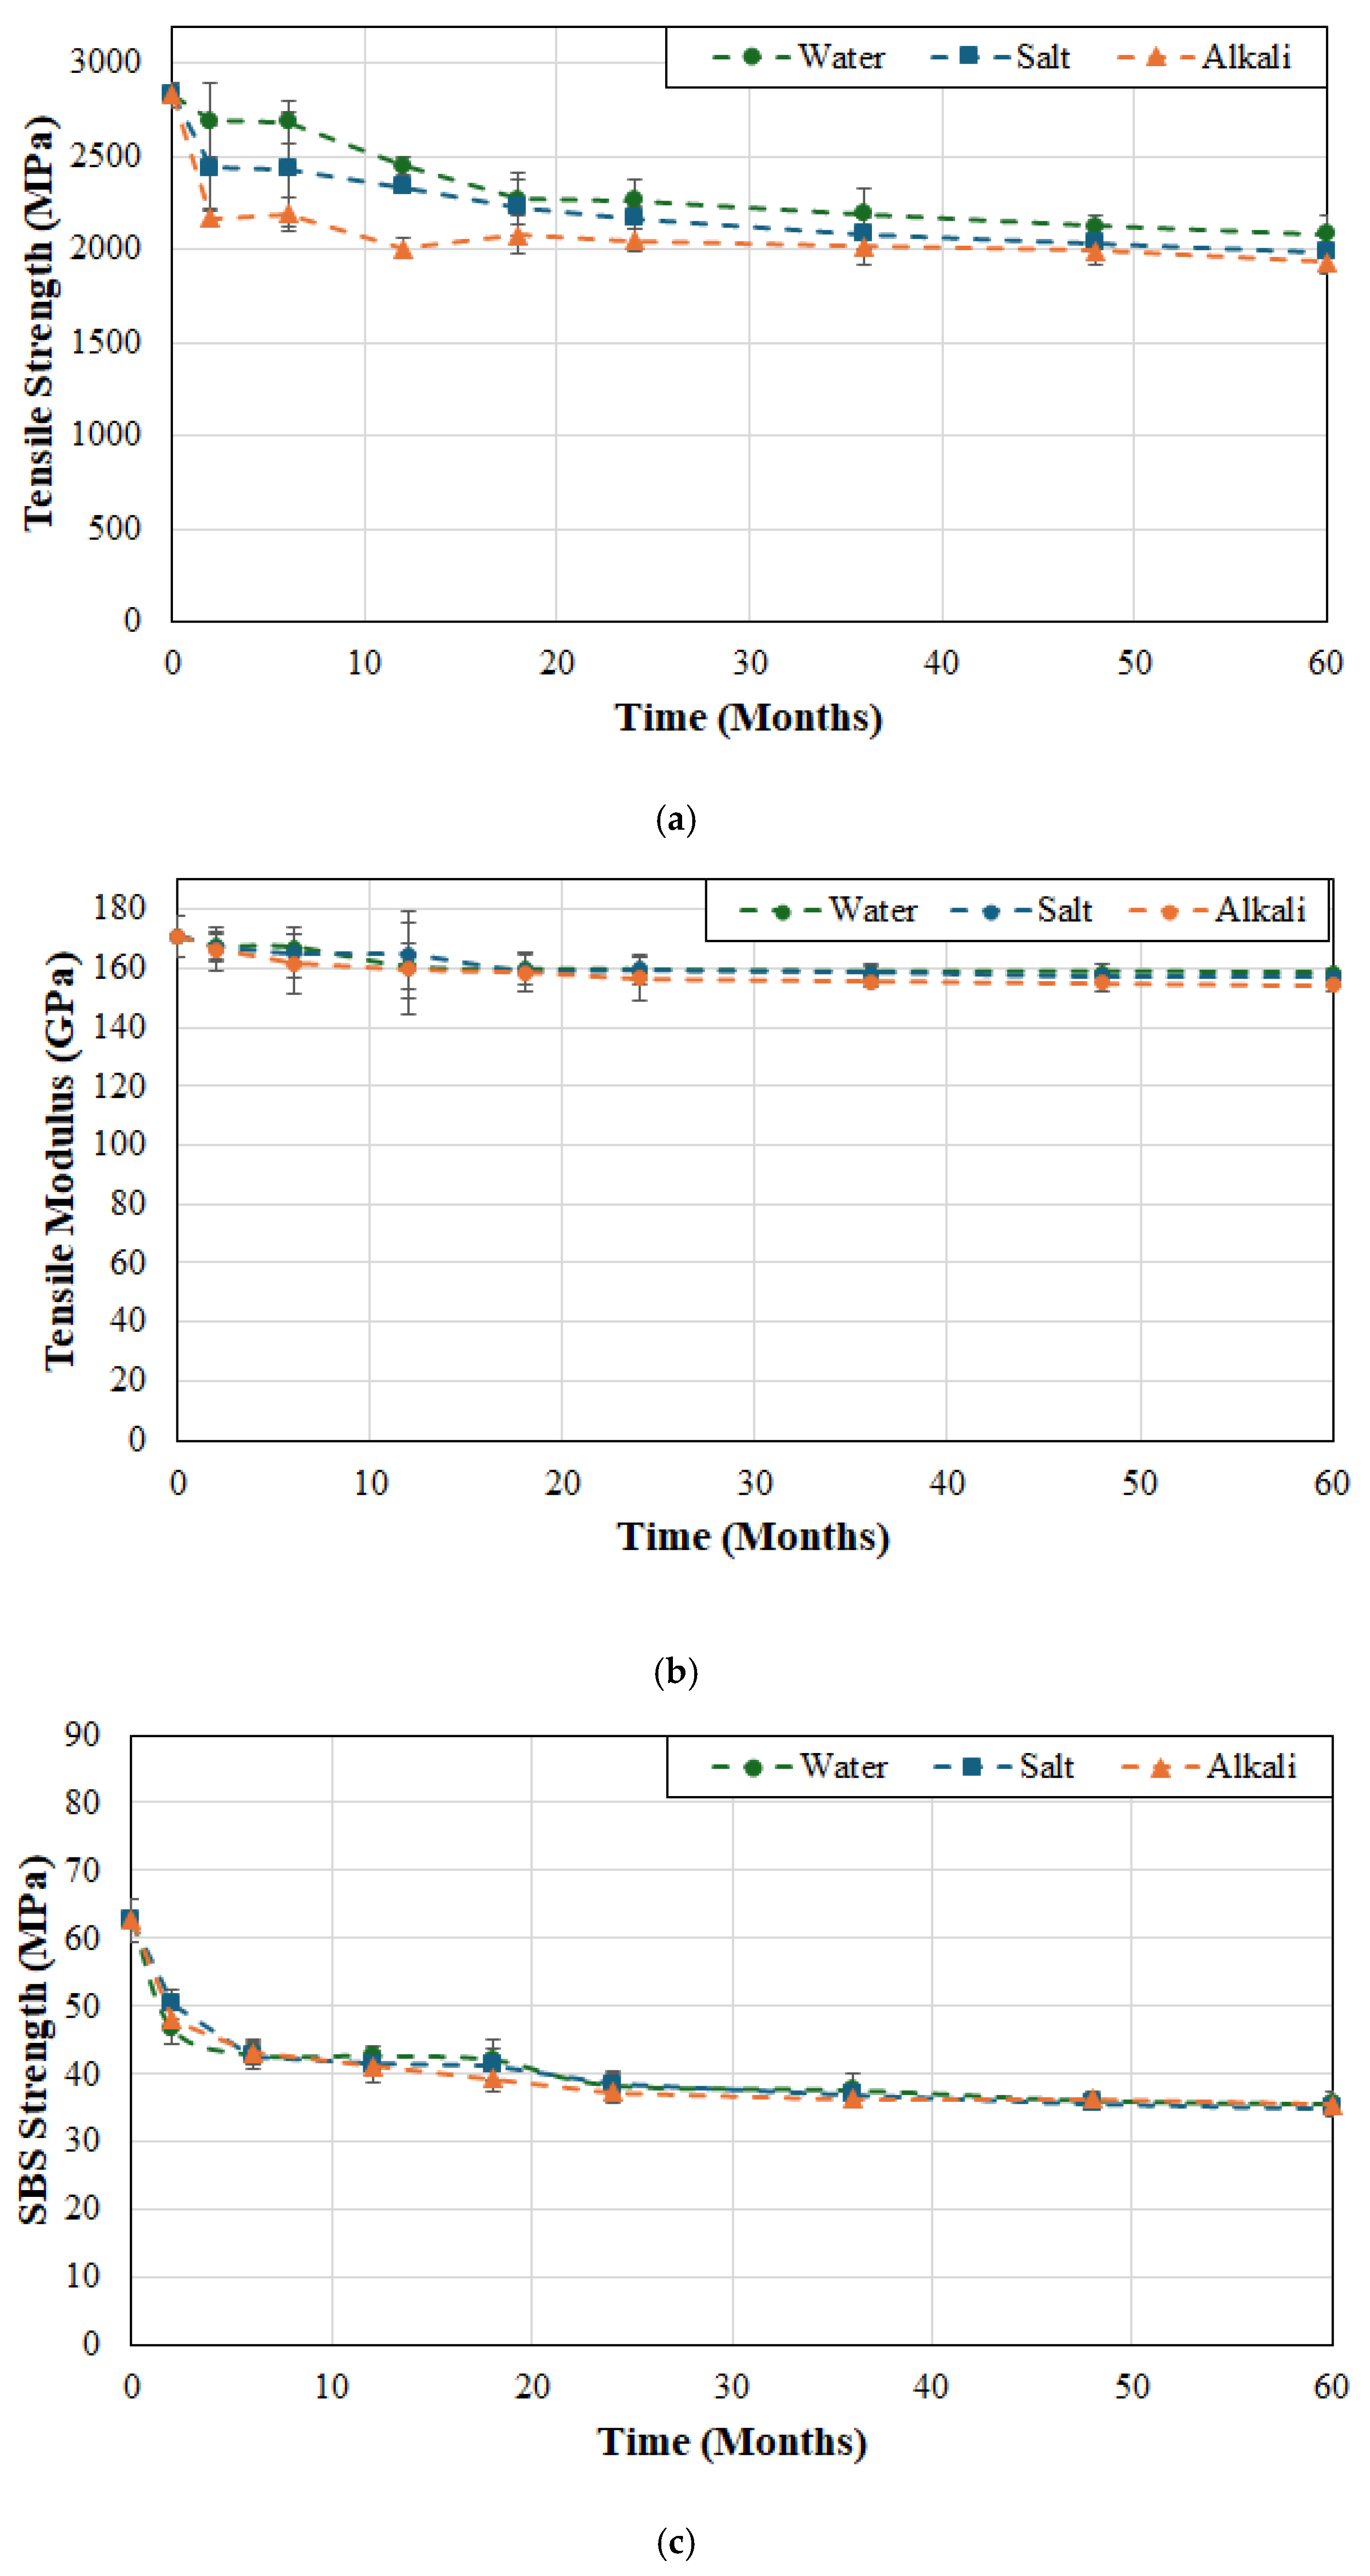
Since the resin and fiber–matrix interface are susceptible to degradation as a result of moisture uptake, tests were conducted by immersing specimens in deionized water as representative of exposure in a moist/humid environment. In order to assess the synergistic effects of heat and solution, tests were conducted using three different temperatures of 23, 37.8 and 60 °C, which not only enabled assessment of hydrothermal effects but also for the use of time–temperature superposition principles for prediction of long-term durability of these materials. It is expected that increasing the temperature of immersion would accelerate deterioration of the matrix, and the fiber–matrix interface. Effects of hydrothermal ageing on tensile strength, tensile modulus, and SBS strength for FRP system A are shown in
Figure 2a,
Figure 2b and
Figure 2c, respectively.
As can be seen from
Figure 2a the largest drop in tensile strength occurs in the first two months of immersion with rates being 2.39%, 7.47%, and 10.47% per month at 23, 37.8 and 60 °C, respectively, suggesting rapid fluid ingress and attack of the interface. The initial drop is followed by a short period (from 2 to 6 months) of significantly lower rates of deterioration (0.1%, 0.1% and 0.81% per month at the three temperatures) suggestive of initial attainment of moisture saturation. This is followed by an increase which, in the case of water at 23 °C, continues linearly from 6 to 18 months whereas at the two higher temperatures it occurs for a shorter period of 6–12 months, after which all three cases show slow continuing degradation with the rate of deterioration decreasing with increase in time except at the highest temperature of immersion. It is of interest to note that the deterioration at the end of the first 12-month period is 13.4%, 23.6% and 27.7% for the cases of immersion in deionized water at 23, 37.8 and 60 °C, respectively, which is a significant part of the overall deterioration in tensile strength at the end of 60 months of 26.4%, 30% and 35.3%, at the three temperatures of immersion. It is clear that an increase in temperature not only increases the level of deterioration, but also the overall rate. Similar results have been reported earlier for wet layup based carbon/epoxy strengthening systems [
57].
While the retention level of tensile strength depends to an extent on the integrity of the interface and the ability to transfer stresses from fibers to the matrix, the modulus of a unidirectional composite is fiber dominated and thus will result in a significantly lower level of degradation through environmental exposure, as is seen in
Figure 2b. It should be noted that moisture sorption primarily affects the resin and the interface rather than carbon fibers and, hence, the longitudinal modulus of a unidirectional composite is affected significantly less than its longitudinal tensile strength or SBs strength, and decreases result primarily from the degradation of the resin and interface. Zafar et al. found that the tensile modulus of an epoxy decreased by about 7.5% after immersion in water for 300 days compared to a reduction of 15–18% in its strength [
58]. There is a clear differentiation in the rate of degradation over the initial period of 2–6 months where rates are about 1%/month at 23 and 37.8 °C and 1.3–1.4%/month at 60 °C, after which rates decrease substantially. The level of degradation over the first 12 months is 6.1%, 6.5% and 8.6% for the cases of immersion in deionized water at 23, 37.8 and 60 °C, respectively, with the final level of degradation at the end of the 60-month period of investigation being 7.3%, 9.8% and 11.4%, at the three temperature levels. It is emphasized that the level of decrease in tensile modulus is significantly less than that that in tensile strength, which is in line with previously reported studies [
57,
59].
As seen in
Figure 2c the SBS strength results are similar to those of the tensile strength in that there is a rapid decline in the first two months with the major drop in the first six months after which there is a slow increase in the level of deterioration. This can be linked to the predominance of the interfacial bonding mechanisms in driving deterioration as reported earlier [
57,
60]. Although the tensile and SBS strengths decline at a faster rate at higher temperatures of immersion, studies have shown that after the initial period the curves present asymptotic trends [
36] with comparable overall profiles because of the initial water induced interfacial degradation [
59]. There is similarity in the modes of degradation, especially when the fiber volume fraction is high, which directly restricts the volume of bulk matrix and hence mechanisms therein. However, the extent of deterioration is significantly greater, emphasizing the effect of loss of interfacial bond integrity. It is of interest to note that the effect of the initial increase in temperature is minimal with the decrease at the end of the 60-month period of immersion at 37.8 °C is 46.6% versus 43.1% at 23 °C and a much greater level of 61.6% at 60 °C. The sharp initial drop in the first six months is related to diffusion and plasticization with the slower decline being due to longer-term hydrolysis and increased interface degradation and microcracking. Hong et al. [
55] reported the significantly greater drops in interlaminar strength in comparison to the fiber-dominated tensile strength and emphasized the need to include the assessment of SBS strength as an important aspect in determination of long-term durability.
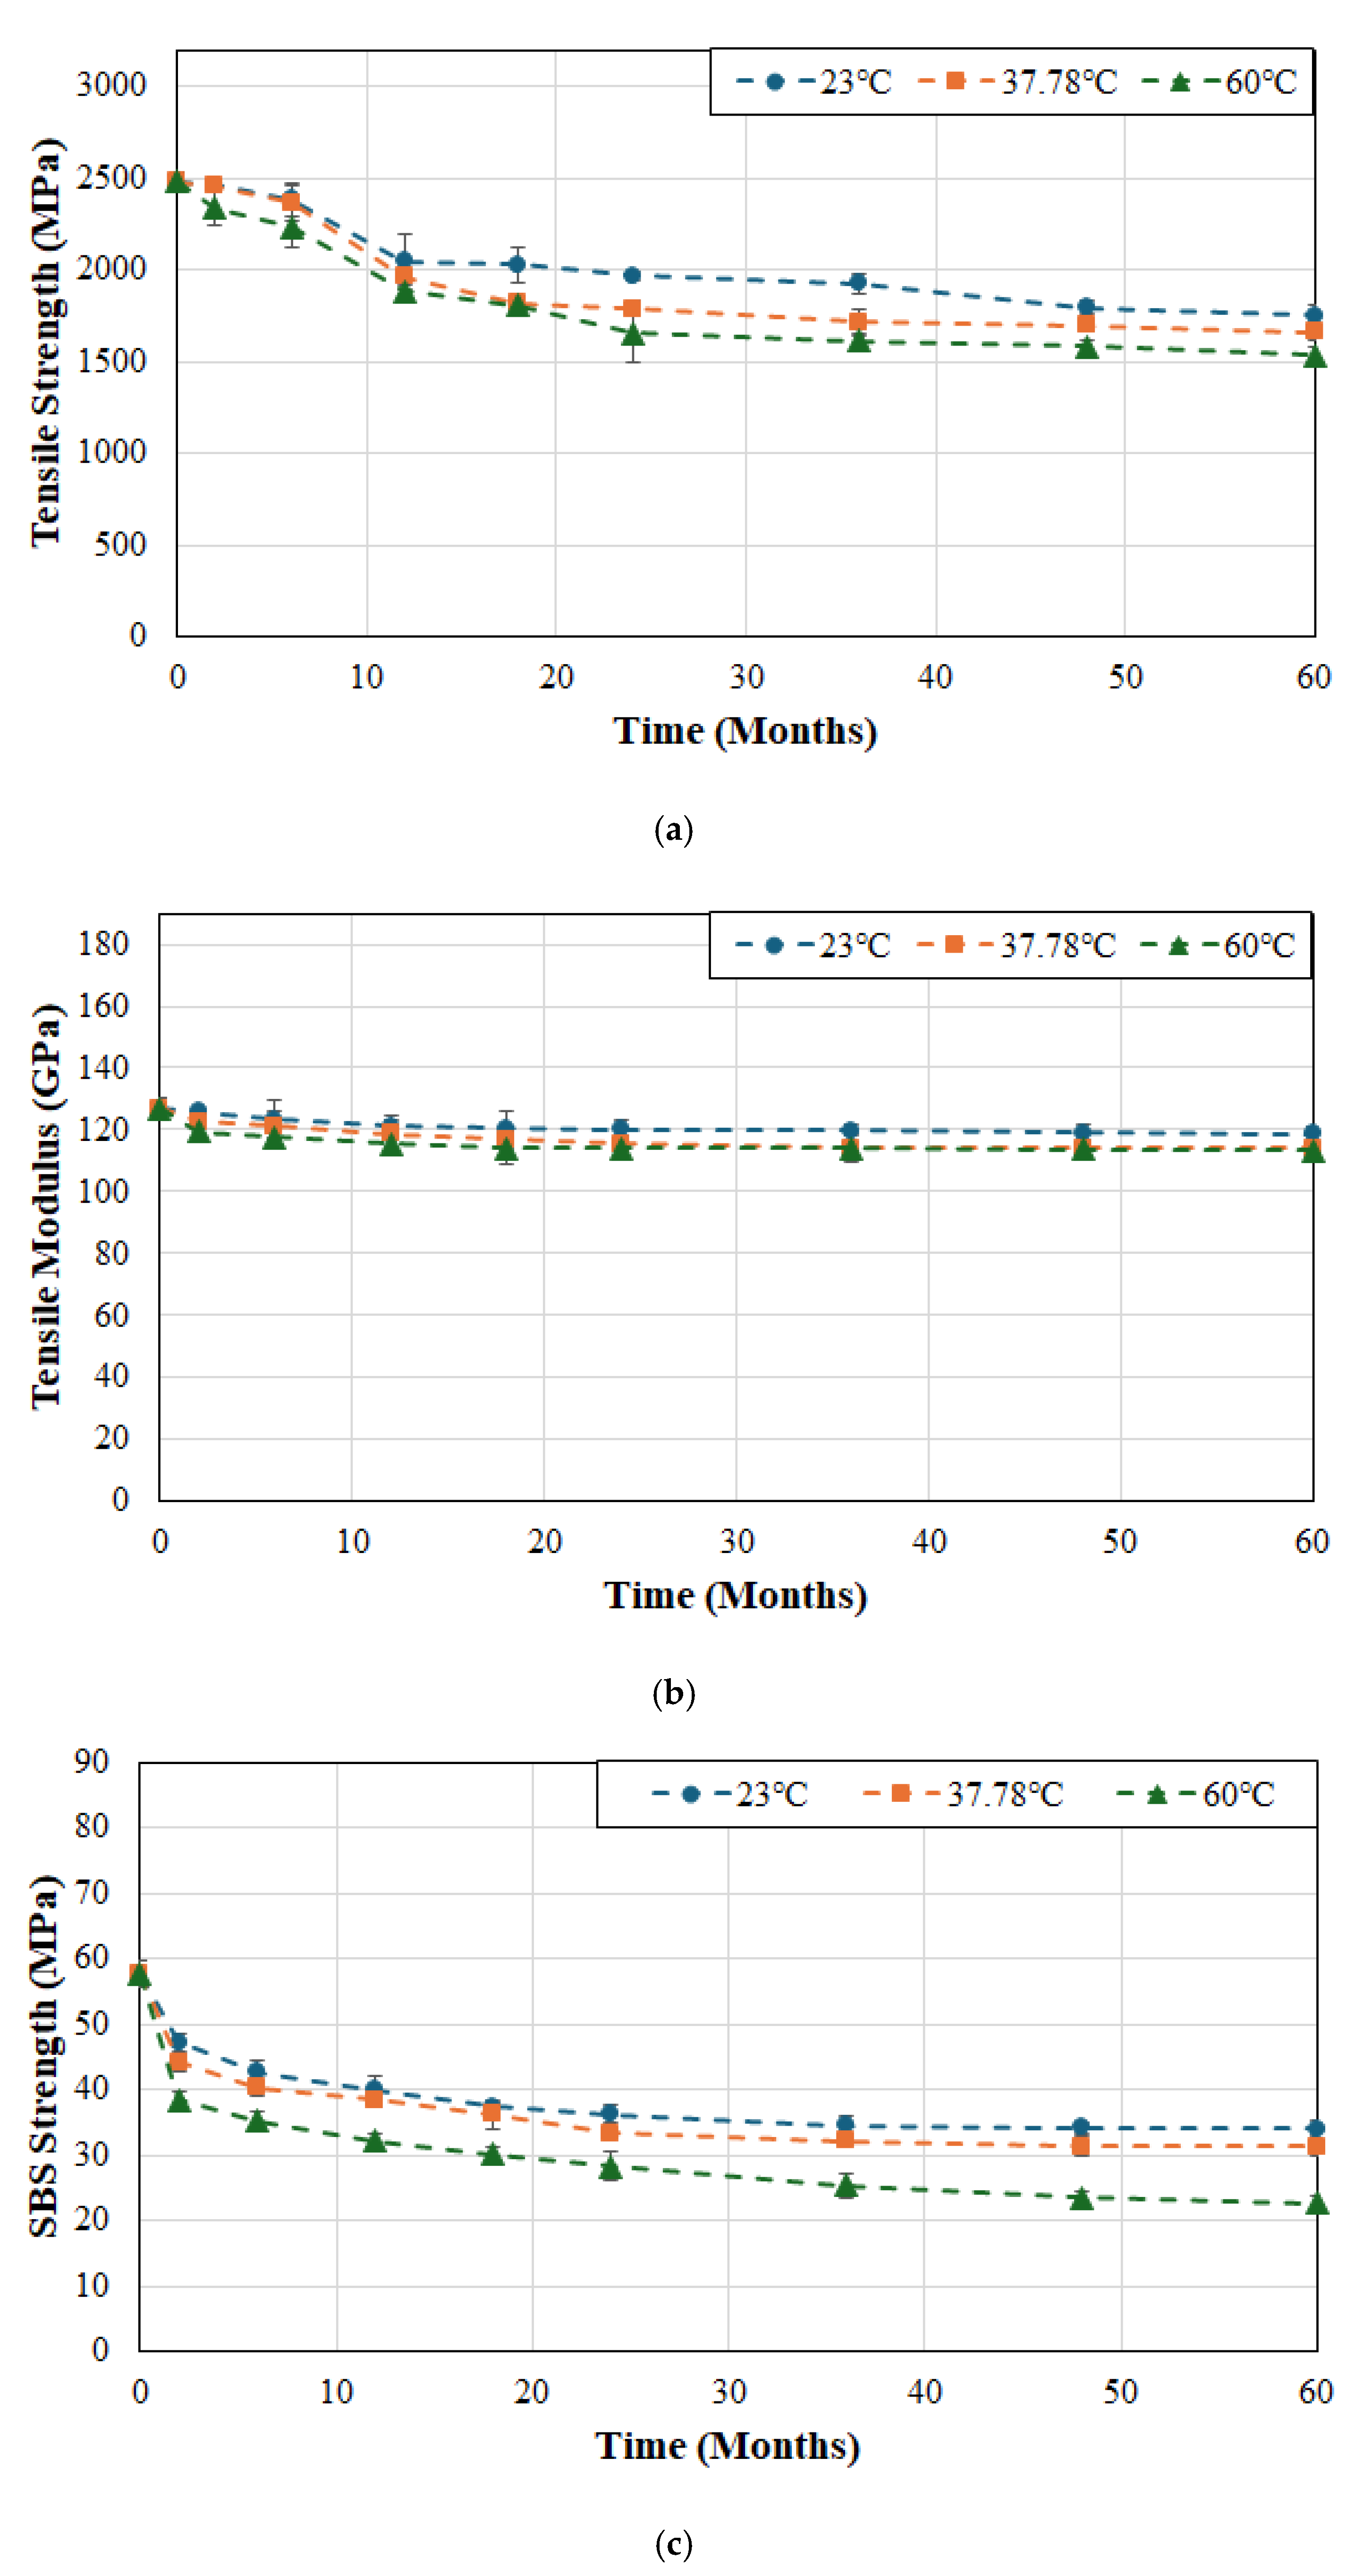
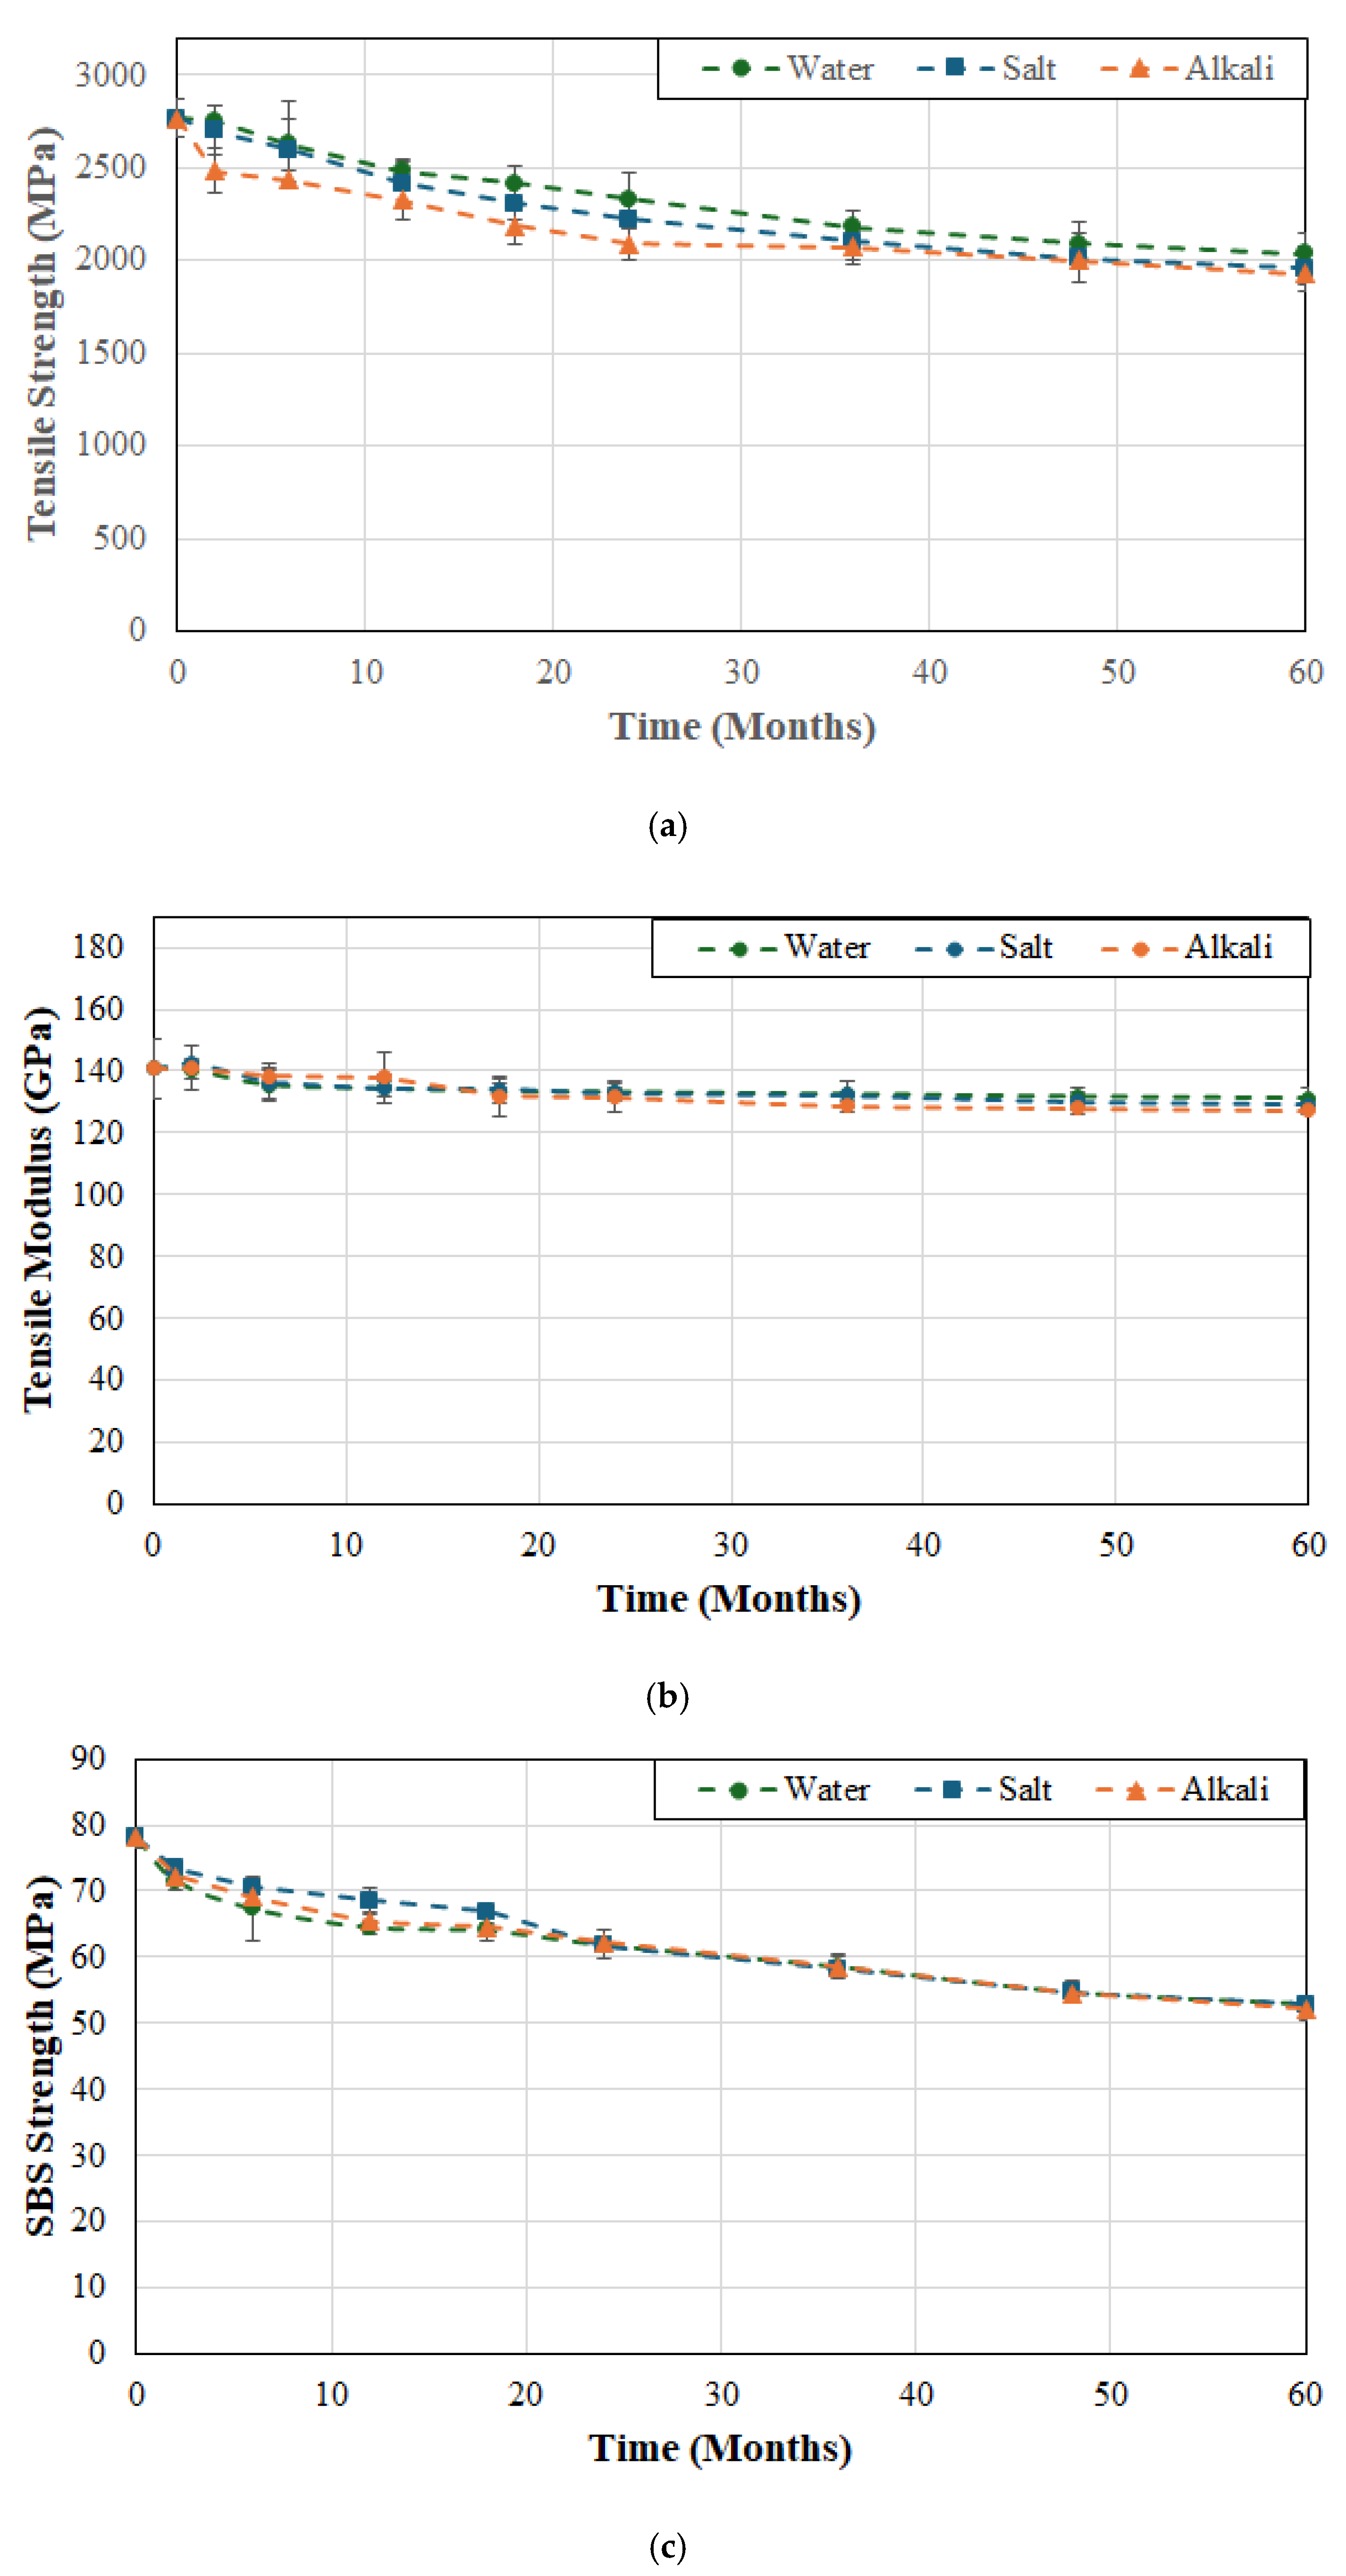
The effects of temperature of immersion on tensile strength, tensile modulus, and SBS strength of system B are shown in
Figure 3a,
Figure 3b and
Figure 3c, respectively. In comparison to system A the decrease in strength appears less rapid and extends over a longer period of time without the sudden initial drop suggesting slower uptake of moisture and hence decreased initial plasticization which is confirmed by the earlier studies by Karbhari and Ghosh [
61] on the same material systems. It is emphasized that the initial uptake of water, accelerated by an increase in temperature, leads to the weakening of inter-chain van der Waals forces and hydrogen bonds leading to plasticization and, hence, a decrease in mechanical performance [
62]. The overall drop in tensile strength after 6 months of exposure was 26.4%, 30.6%, and 33.4% for the three temperature levels of 23, 37.8 and 60 °C, which is very close to that of system A but follows a more gradual progression with time. This can be traced to the higher matrix volume fraction in system B which results in slower interfacial failure, which is in line with earlier results [
63,
64] showing that SBS strength decreases consistently with increase in fiber volume fraction. Overall, the drop in tensile modulus is fairly low at 6.7%, 9% and 11.9% at temperature levels of 23, 37.8 and 60 °C, respectively, roughly similar to that seen in system A. Given the more gradual drop in tensile strength it is expected that the SBS strength would also show a reduced level of deterioration. It is interesting to note that at the two lower temperatures the drop is continuous and gradual but at the highest temperature, 60 °C, the multi-phase response consists of an initial stage that shows rapid decrease attributed to plasticization and interface based capillarity, which is followed by a slower decrease, and often a third stage extending to an asymptotic trend over longer periods of exposure. In the current case there is a rapid drop of 21.3% in the first two months followed by an overall drop of 51.3% over the 60-month period of immersion. In comparison, at the two lower temperatures, 23 and 37.8 °C, the drop in the first two months was 8.3% and 12%, respectively, and that at the end of the 60-month period was 32.1% and 41.2%, respectively, with all levels showing levels of decline less than those of system A. The distinct difference in drops of tensile and SBS strength from the beginning of exposure with temperature of immersion follows similar trends reported by Liu et al. [
36] for SBS strength where they noted that the rates corresponded to the accelerated rates of diffusion with temperature, and that as saturation was attained the deteriorative effects on the interface weaken resulting in asymptotic response.
As seen in
Figure 4a the tensile strength for system C does not degrade significantly over the first 6 weeks of immersion at the two lower temperatures of 23 and 37.8 °C with drops of only 4% and 4.6% as compared to 10% after immersion in deionized water at 60 °C. The total loss at the end of the 60-month period of immersion was 29.4%, 33.2% and 38.2% at temperatures of 23, 37.8 and 60 °C, respectively. It is of interest to note that the rate of loss past the 24 month period of immersion is extremely low and fairly stable till the end of the overall period of immersion with drops of 10.9%, 7.2% and 7.4% over this time period for cases of immersion at 23, 37.8 and 60 °C, respectively. While it might appear counterintuitive for the drop to be greater at the lowest temperature of immersion it should be remembered that the deteriorative mechanisms are initially accelerated at the higher temperatures of immersion and thus the reactions at 23 °C are slower and the effects accrue over a longer period of time. As with the two other systems, the drop in modulus is significantly less at 6.3%, 10.2% and 10.7% for cases of immersion at 23, 37.8 and 60 °C, respectively, with the level of decrease being extremely slow and asymptotic after 12 months of immersion at which point the reductions were 4.3% (i.e., 68.3% of the overall decrease), 6.5% (i.e., 63.7% of the overall decrease) and 9% (i.e., 84.1% of the overall decrease) emphasizing that the maximum decrease occurs in the initial phase of moisture uptake due to plasticization and is largely reversible as reported earlier [
49]. The SBS strength shows a rapid decrease in the first 2 months (with drops of 18.2%, 23.4%, and 33.4% due to immersion in deionized water at 23, 37.8 and 60 °C, respectively), followed by a more gradual decrease till the end of the 60-month period, representative of damage saturation and slower hydrolysis and interface shear weakening. The initial plasticization is accompanied by faster kinetics of matrix and interface degradation at the higher temperatures of immersion with the deterioration continuing at a faster rate till the end due to the acceleration of thermally activated chemical and interface breakdown. It should be noted that over the last 12 months of immersion the rate of deterioration in SBS strength was 0.19%/month at the two lower temperatures but 0.26%/month at 60 °C, a 36.8% increase. The continued change in mechanical properties even after the point where saturation of moisture uptake can be expected follows the results reported by Ghabezi and Harrison [
65] who hypothesized that the effects of chemical based degradation can be higher than those due to moisture induced stresses and mechanisms.
It is clear that across all three systems an increase in temperature of immersion results in an acceleration of deterioration in performance with the greatest level of decrease being seen in SBS strength and the least in tensile modulus, which is in line with the characteristics of unidirectional carbon fiber reinforced composites processed at moderately high temperatures with fiber volume fractions above 60%. A comparison of performance retention of tensile strength, tensile modulus, and SBS strengths for the three systems as a result of immersion in deionized water at 23, 37.8 and 60 °C is shown in
Figure 5a,
Figure 5b and
Figure 5c, respectively. Given that the overall response can generically be divided into three zones with the initial being for the first two months, where effects are primarily due to initial moisture uptake and plasticization, the period from 2–12 months where there is hydrolysis and interface degradation, and then for the longer term up to 60 months where change is relatively slower and largely asymptotic, results are compared at the 2-month, 12-month, and 60-month levels for ease of comparison.
As can be seen from
Figure 5a, system A shows the least retention after 2 months of immersion in deionized water at 23 °C across all three performance characteristics. systems B and C show extremely similar retention levels for tensile strength and modulus at this time period but system C shows greater deterioration in SBS strength. At the 12-month level system C shows the least retention for tensile strength and is similar to that of system A for both tensile modulus and SBS strength, both of which are lower than system B. At the end of the 60-month period of immersion the retention of tensile strength (at 70.6–73.6%) and modulus (92.7–93.7%) are similar across all three systems and well within scatter. However, the SBS strength retention is substantially higher for system B which has the lowest fiber volume fraction and hence greater amount of bulk matrix resulting in better wetout of fibers. It is noted that higher levels of degradation of SBS strength are attributed to greater fiber–matrix debonding [
66] which would be decreased by better wetout.
Given this response, it is interesting to note that systems B and C both show very minor changes in levels of retention of tensile strength as the temperature of immersion is increased from 23 °C to 37.8 °C, while system A, which had a much higher fiber volume fraction, shows a significant drop in retention from 95.2% to 85.1% at these temperatures. This can be attributed to the greater propensity for capillary action of moisture transport between fibers that were perhaps not as well wet out in the higher fiber volume fraction material set [
49] and due to the greater number of voids that could exist at higher fiber volume fraction levels [
67] due to dry spots within fiber tow/bundles with insufficient wetout. Interestingly, at the 12-month level the increased temperature results in a drop of 3.6%, 4.2%, and 3.8% from levels seen at 23 °C for systems A, B, and C, respectively, with system C showing the lowest retention. The trends are similar for retention of tensile modulus with the lowest retention again being from system C at 89.8% which is a 3.9% drop from that noted at 23 °C. Systems A and B in comparison show lesser drops of 2.5% and 2.3%, respectively. While system B still shows the highest retention in SBS strength, the differences between the three systems after 60 months of immersion at this temperature are much smaller emphasizing the effects of plasticization in the resin after initial fiber–matrix debonding. While systems A and C showed a further drop of 3.5% and 4.7%, respectively, from that due to immersion in deionized water at 23 °C, system B showed a much larger drop of 9.4% from a retention level of 67.9% to 58.5%. At the highest temperature of immersion (60 °C) the deterioration is further accelerated with significant drops in both tensile strength and SBS strength. However, the tensile modulus, which is a fiber dominated characteristic, remains largely unaffected with the 60-month retention levels being 88.6%, 88.1% and 89.3% in comparison to levels of 92.7%, 93.3% and 93.7% at 23 °C. As with the other two temperatures, the three systems show very similar levels of retention at 60 °C, which can be traced to the dominant effects of carbon fibers in the longitudinal direction which are unaffected by deionized water. It is of interest to note that between 12 and 60 months, the averaged rates of decrease in tensile strength were 0.19%/month, 0.42%/month and 0.39%/month for systems A, B and C, respectively, indicating that while system A may have shown a larger decrease in the first phase (2 months) the overall system had better retention due to higher fiber volume fraction even after accelerated capillary action as related to moisture uptake. It is noted that an earlier investigation on the same systems reported significantly higher moisture uptake levels for system A in comparison to systems B and C which had about half the uptake [
61]. These results should hence be considered with caution in that even though there may be good retention in tensile strength and modulus under accelerated conditions of aging, the overall deterioration of the composite, especially at the interfacial and intralaminar level could be significantly higher as noted previously [
60]. Thus, consideration of only fiber-dominated characteristics of performance could result in misleading [
59] and non-conservative, predictions, and selection of design values.
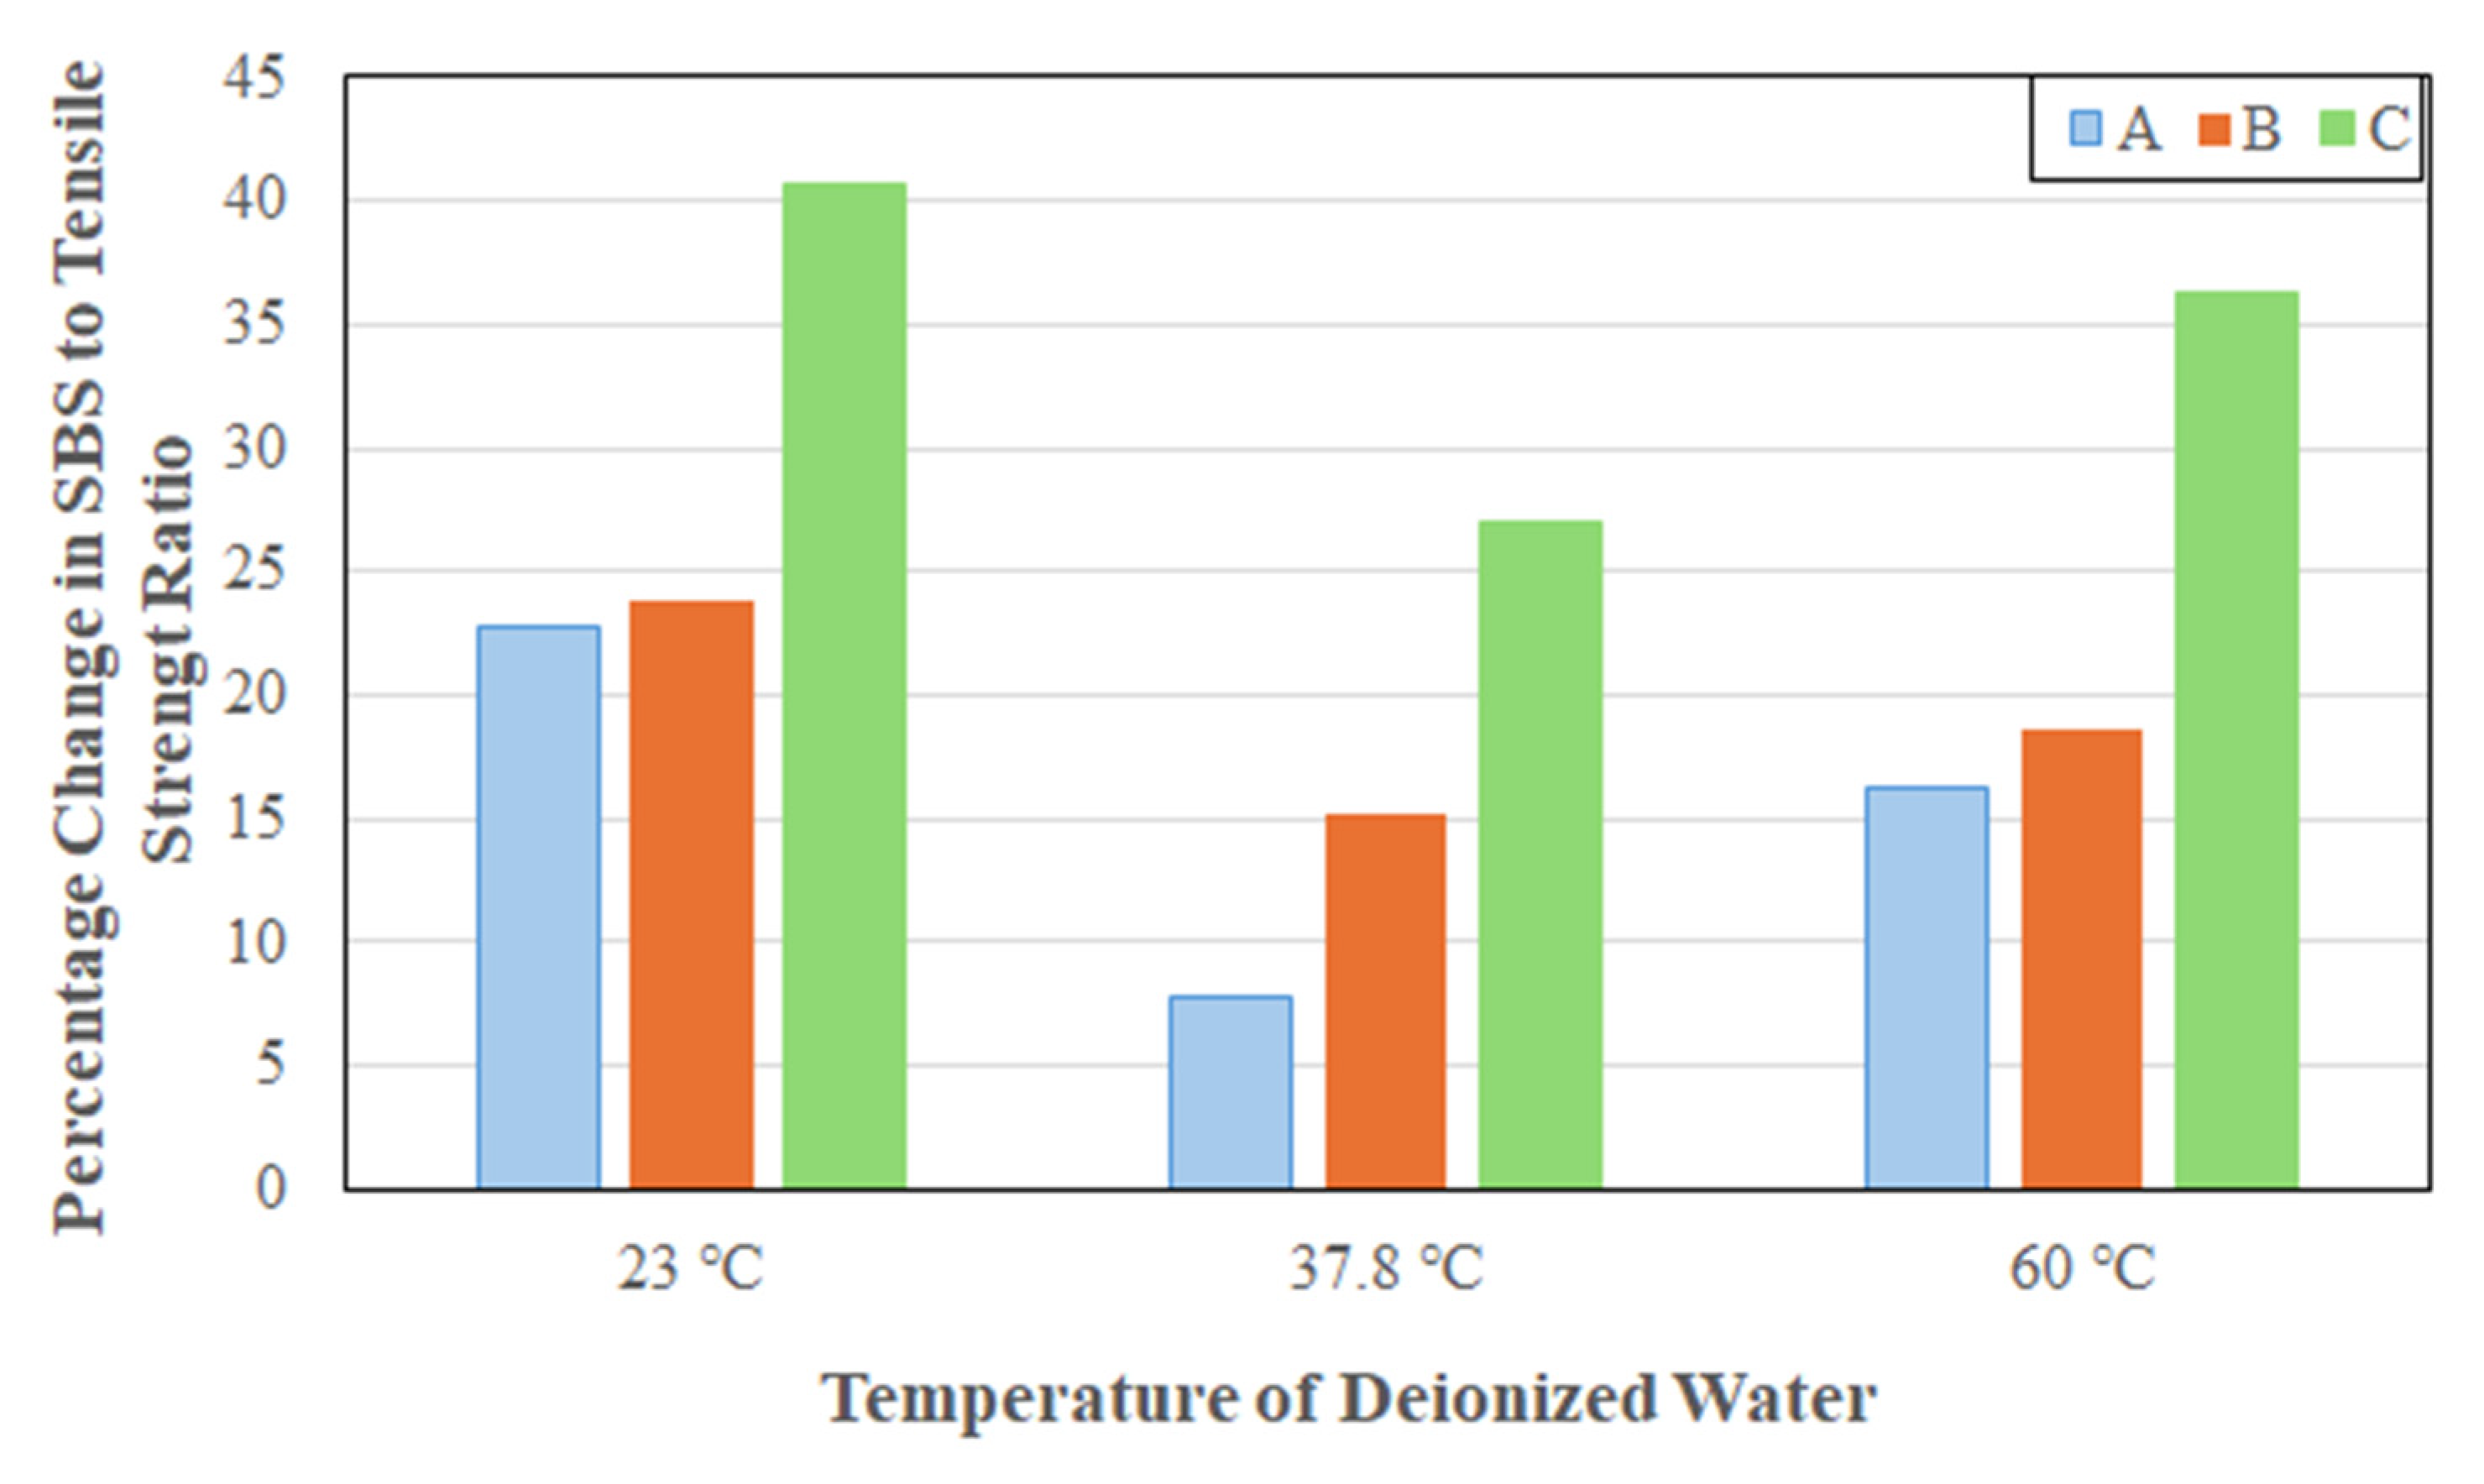
With this in mind, it is of interest to consider the ratio of SBS strength to tensile strength and its evolution with time, and temperature, of immersion in solution. The SBS strength is indicative of a materials resistance to interlaminar shear failure and is governed by the matrix-dominated behavior and the level of integrity of the fiber–matrix interface. On the other hand, the longitudinal tensile strength of a unidirectional composite reflects the effectiveness of stress transfer and hence the load-carrying capacity along the fiber direction, which is largely dominated by fiber strength characteristics. Thus, a low ratio indicates that the shear strength is much lower than the tensile strength, which is typical for carbon fiber reinforced unidirectional composites where matrix/interface failure governs the SBS strength. A higher ratio serves as an indication of better matrix or interfacial bonding, or composites designed with toughened matrices. The low ratio underscores a key design limitation of unidirectional composites in that they have excellent tensile characteristics in the direction of the fibers, but their through-thickness and shear performance are limited. This ratio is critical when designing against shear-driven failures especially as a function of exposure condition and time, with decreasing ratios indicative of greater level of degradation. It is thus of significant interest to assess the change in this ratio as a function of temperature of deionized water as shown in
Figure 6a,
Figure 6b, and
Figure 6c for systems A, B, and C, respectively.
As can be seen from
Figure 6a–c, the initial ratio is highest from system B at 2.82% compared to 2.22% for system A and 2.32% for system B. Cromwell et al. [
68] conducted tensile and SBS tests on unidirectional carbon/epoxy plates with a ratio of 2.56% which falls within the range shown by the three systems being investigated in this study. All three systems show very little difference in response at the two lower temperatures of 23 and 37.8 °C, with the highest temperature of immersion resulting in a significant drop in ratio. This indicates that the overall effect of the two lower temperatures is similar but that the highest temperature results in significant matrix and interface level deterioration. System A shows a steep drop over the first 6 months whereas systems B and C have a smaller drop over the first 2 months. In all cases after these time periods the changes are slower.
As seen in
Figure 6a the ratio for the three temperatures after the initial period of 6 months is similar with levels of 1.6% at both 23 and 37.8 °C and a lower level of 1.47% at the highest temperature of immersion of 60 °C. As a result of immersion at the highest temperature of 60 °C there is a drop from an initial level of 2.22% to 1.47% at 6 months followed by a slow decrease to 1.32% over the next 54 months, emphasizing the overall effect of initial plasticization and hydrolysis on overall hydrothermal damage. In the case of system B (
Figure 6b) the ratios at the end of the 60-month period of immersion are 2.6%, 2.4%, and 2.1%, showing similarity of response due to the two lower temperatures as seen for system A and indicating greater matrix and interfacial degradation at the highest temperature.
Figure 6c, which represents response of system C shows ratios of 1.95%, 1.89% and 1.48% at the three temperature levels of 23, 37.8, and 60 °C, respectively, showing similar trends.
As shown in
Figure 7, overall system A shows the highest overall drop at all three temperatures with system B showing the lowest. The overall response of a decrease in ratio with increasing time and temperature of immersion indicates that the interlaminar shear capacity is degrading faster than the tensile strength in the longitudinal direction. The initial rapid drop suggests matrix softening due to plasticization which leads to lower interlaminar shear strength. This is followed by a short period of continued decrease albeit at a slightly lower rate due to fiber–matrix debonding associated with moisture uptake and matrix microcracking. Over the longer-term, mechanisms of hydrolysis and increased fiber–matrix debonding result in continued deterioration at a much slower rate. This type of behavior suggests a reduced durability margin and indicates changes in failure modes with early-life failures being more predictable due to fiber-dominated mechanisms, but prolonged exposure leading to resin or interface-dominated failures. This again has implications for both prediction of long-term durability and the development of safety factors for design whereby there may be need to consider interlaminar properties in addition to the more commonly used in-plane ones for characteristics such as tensile strength and modulus for assessment of environmental durability.
3.3. Effect of Solution
Given the increasing use of external bonded FRP in rehabilitation/strengthening of marine infrastructure where the FRP strip is likely to be either immersed in sea water or be exposed to salt spray, and the cases where water could flow through the concrete structure to the FRP composite there is need to assess differences, if any, between the effects of water and those accruing from seawater and an alkali solution similar to that of pore water in concrete.
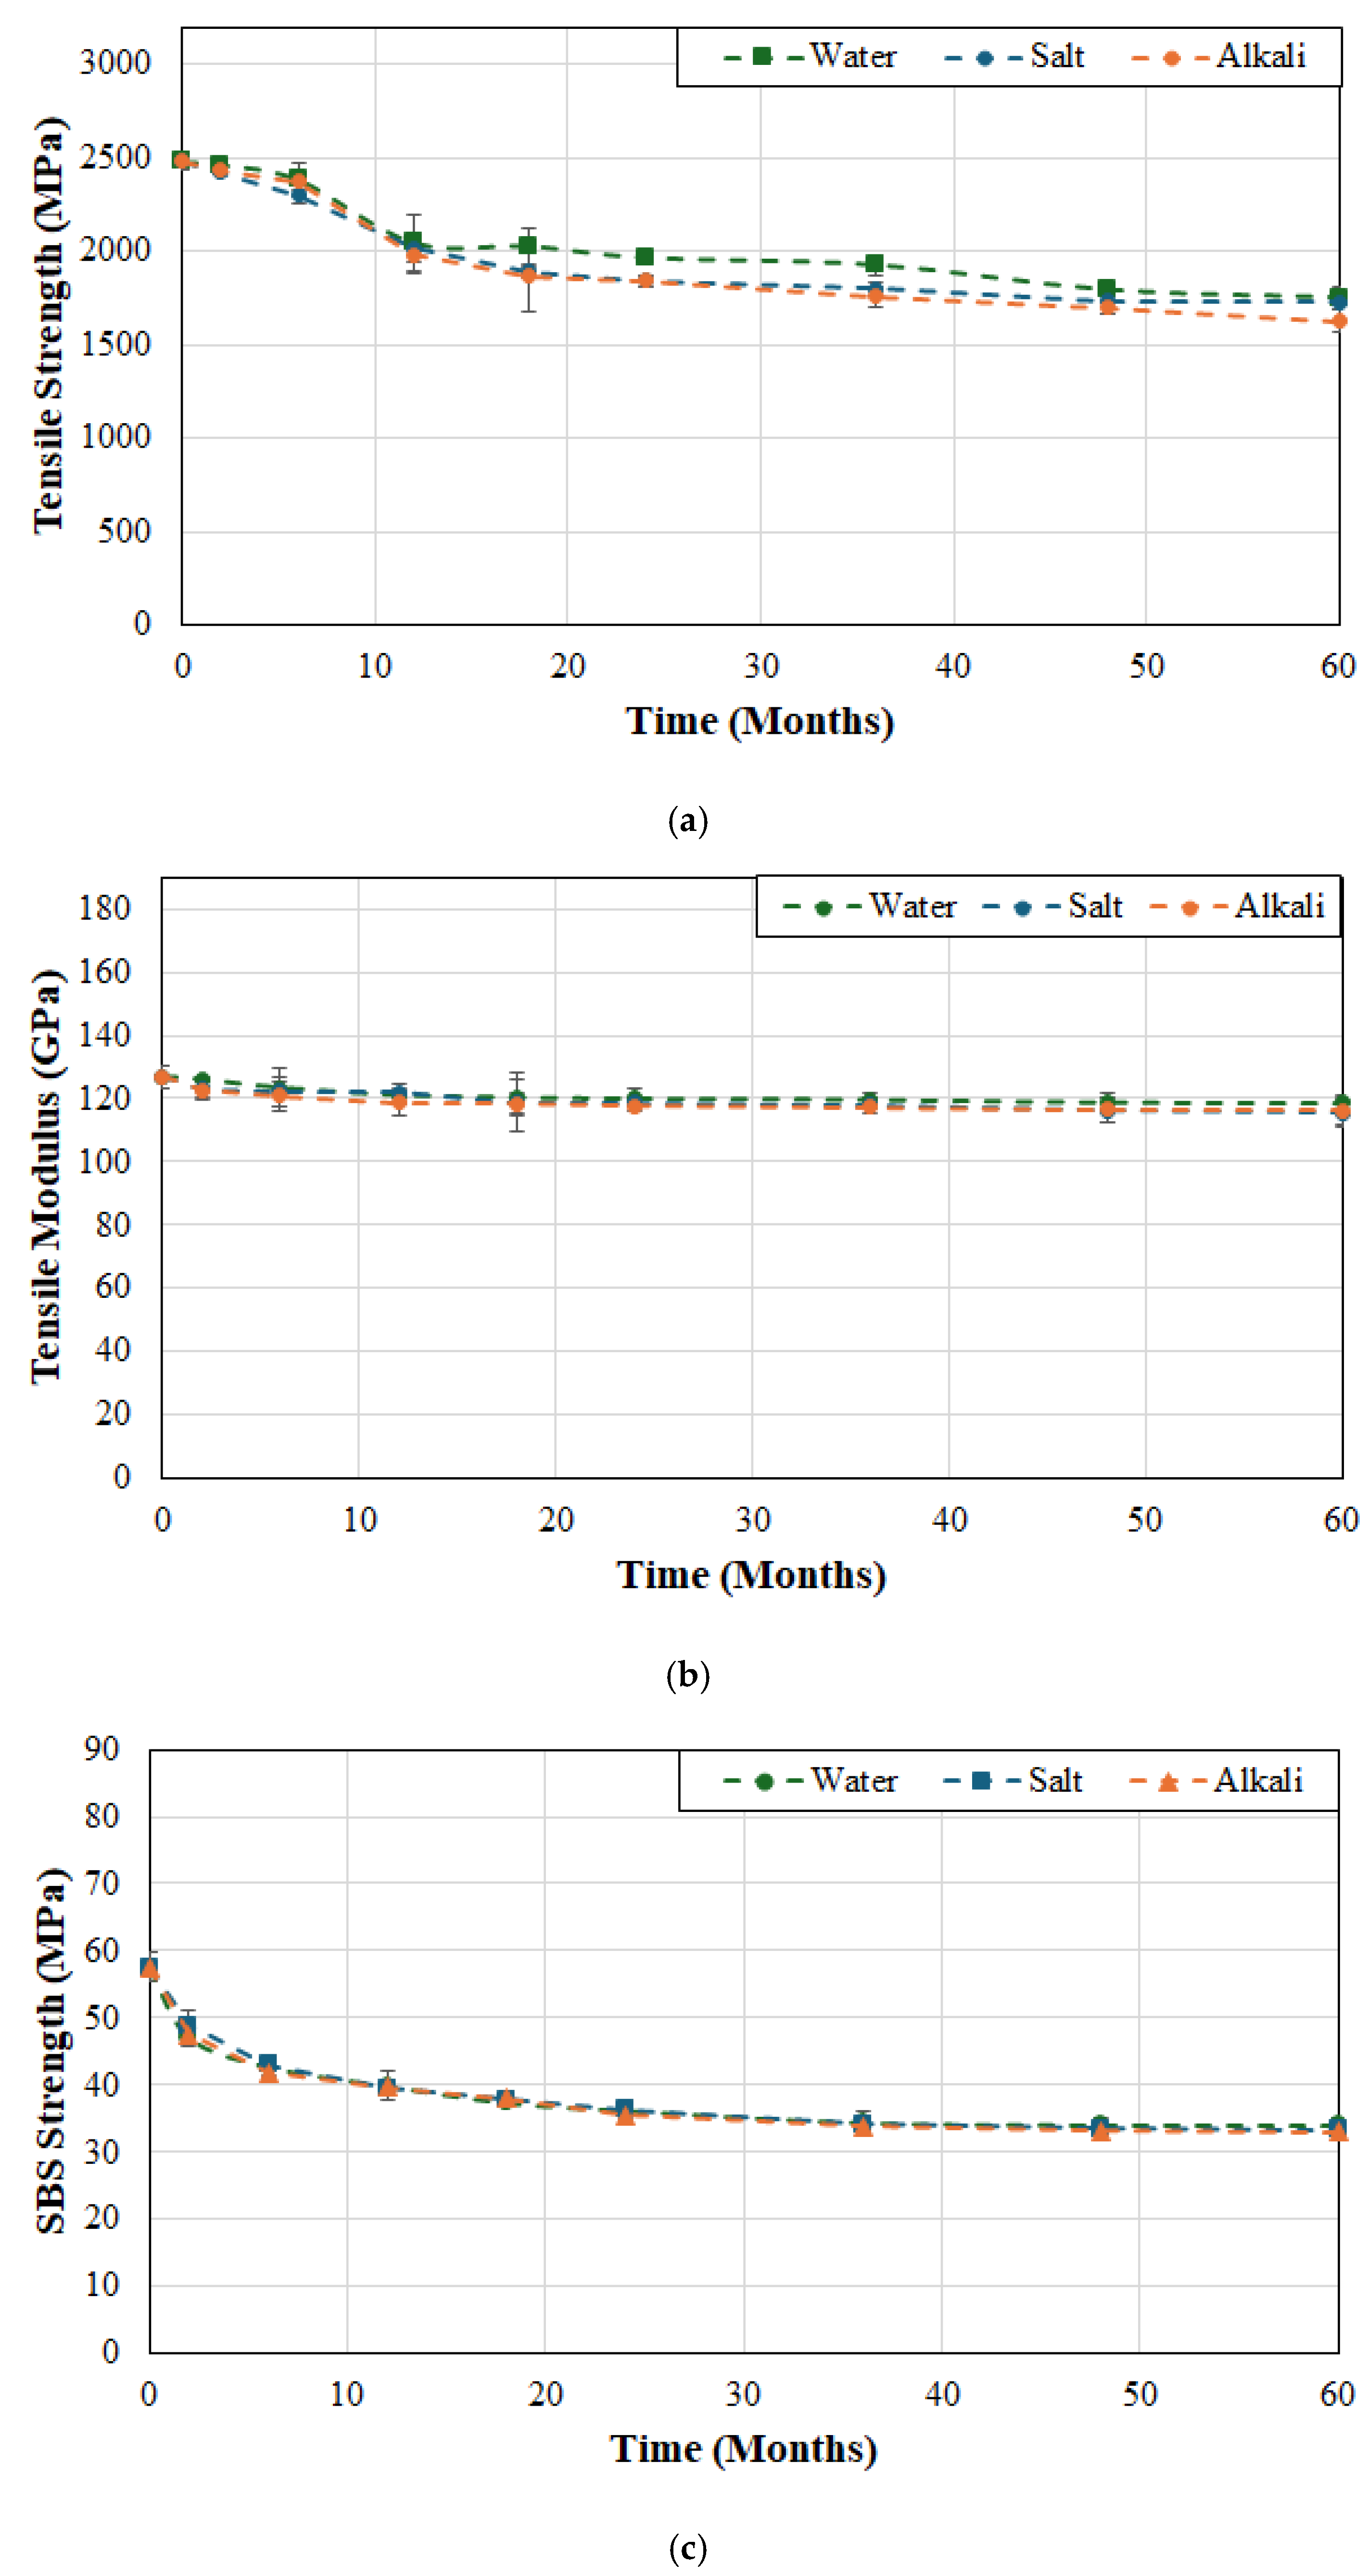
Figure 8a–c shows the differences accruing from the type of solution on tensile strength, modulus and SBS strength over the period of 60 months.
As can be seen from
Figure 8a the initial effects of both saltwater and alkali solutions result in an initially higher level of deterioration in tensile strength of FRP system A than deionized water. For the first two months the rate of decrease is 2.4%/month, 7.5%/month, and 10.5%/month as a result of immersion in deionized water, saltwater, and alkali solution, respectively. This is followed by a period of slower decrease between 2 and 6 months followed by an additional decrease over 6 and 18 months for water and saltwater and between 6 and 12 months for the alkali solution. It is interesting that while the overall level of decrease at the end of the 60 month period is 26.4%, 29.7% and 31.7% due to immersion in deionized water, saltwater, and alkali solution, respectively, the corresponding drop in the first 18 months is 19.7%, 21.4% and 26.5% indicating that between 72.1% and 83.6% of the overall drop occurs in the short-term. This is of special interest since most short-term effects are largely reversible on drying although repeated wet-dry cycles can result in matrix microcracking and fiber–matrix debonding which are then irreversible. Despite the large drop in tensile strength, it is interesting to note from
Figure 8b that there is very little degradation in tensile modulus with the decreases being 7.3%, 8.2%, and 9.7% due to immersion in deionized water, saltwater, and alkali solution, respectively. As expected from the earlier discussion of the correlation between tensile strength and SBS strength there is a significant drop in SBS strength over the 60-month period of immersion. However, as seen in
Figure 8c, the difference between the three solutions is minimal with levels of decrease over the first 6 months being 31.5%, 31.8%, and 34.4%, as a result of immersion in deionized water, saltwater, and alkali solution, respectively, with the corresponding drops over the 60-month period being 43.1%, 44.1% and 43.3%, respectively. While the responses at the end of the period of investigation are asymptotic and within overall scatter, it should be noted that the specimens immersed in the alkaline solution do have a slightly greater level of deterioration. Based on a significantly shorter period of exposure of 20 weeks, Kafodya et al. [
69] reported drops in SBS strength of 22.3% and 25.9% due to immersion in water and seawater, respectively, which compare well to the levels attained at the earlier periods of exposure in the current study. In addition, Li et al. [
70] reported reductions of 21.52%, 15.65%, and 10.59% in the interlaminar shear strength of CFRP after just 12 weeks of immersion in acidic solution, saline solution, and distilled water, again showing the least effect being due to immersion in water. Given that the extent of deterioration changes within specific time intervals, it is of interest to not just compare levels of decrease but also rates of decrease within the periods so as to better identify zones/stages where mechanisms may be different and/or accelerated. A comparison of rates shows that the rate of decrease for the three solutions—deionized water, saltwater and alkali solution—is 12.7%/month, 9.9%/month, and 11.7%/month over the first two months where immersion in deionized water is the highest, followed by rates of 2.1%/month, 3.7%/month, and 3.6%/month for the next 4 months changing the extent of effect, and then being 0.2%/month from 24 months to 60 months for deionized water, and 0.25%/month for seawater, but a significantly lower rate of decrease of 0.09%/month for alkaline solution resulting in the end level being similar even though the initial decrease due to immersion in alkaline solution was greater. This suggests that long-term degradation is due to fiber–matrix debonding rather than matrix level changes through reactions with different ions in solution.
As seen from
Figure 9a–c, while the response to solutions is more gradual in the case of FRP system B, the overall mechanisms and trends are similar with the effect of immersion in deionized water having the least overall effect and that due to alkaline solution having the most. In this case, however the effect of the three solutions is more similar with tensile strength decreasing over the 60-month period by 26.4%, 29.2% and 30.3% as a result of immersion in deionized water, saltwater, and alkali solution, respectively, suggesting better overall fiber–matrix integrity in the case of FRP system B, which was also seen as a result of elevation in temperatures of immersion in deionized water. The overall trend for the drop in tensile modulus, as seen in
Figure 9b, suggests that all three are within scatter bounds almost through the entire 60-month period with the decrease at the end being 7.7%, 8.3%, and 9.6% as a result of immersion in deionized water, saltwater, and alkali solution, respectively, which is roughly equivalent to that of system A, which is not unexpected for a fiber dominated characteristic. The convergence over longer periods of exposure across all three solutions again indicates that while solution-specific mechanisms can cause initial differences in levels of deterioration, interfacial debonding remains the dominant failure mechanism over extended periods of immersion and hence the asymptotic end stage is reached at different rates based on solution type. Uthaman et al. [
71] suggested that once the fiber–matrix interface attained a saturation/maximum state further exposure continues at comparable rates across environments. Given the lesser effect on tensile strength, it is not unexpected that the drop in SBS strength would also be less with decreases of 32.1%, 32.2% and 33.1% because of immersion in deionized water, saltwater, and alkali solution, respectively. It is of interest to note that the rate of decrease in the first two months is 4.1%, 2.95% and 3.7% for the three solutions showing that the effect of deionized water is initially greater. In the long-term period from 24 months to 60 months, the averaged rate of decrease is 0.4%/month for both deionized water and saltwater but slightly faster at 0.45%/month for the alkali solution.
Of the three FRP systems, system C indicates the least difference in response to immersion in the three different solutions. As shown in
Figure 10a, tensile strength shows a slow decline over the first 6 months with a decrease of 4%, 7.2%, and 4.3% as a result of immersion in deionized water, saltwater, and alkali solution, respectively, with a further drop to levels of 17.6%, 18.7% and 20.2% degradation at the end of 12 months. The overall decrease in tensile strength at the end of 60 months of immersion is noted to be 29.4%, 30.3%, and 34.4%, effectively indicating that about 60% of overall degradation occurs in the first 12 months. As seen in
Figure 10b there is very little difference in the trajectory of tensile modulus with time of immersion in the three different solutions with immersion in saltwater having the greatest effect at a 9% decrease and deionized water having the least at 8.5%. The change in SBS strength is much smoother than with the two other systems with the first 6 months still showing a majority of the overall decrease with levels of deterioration of 25.8%, 25.3%, and 27.2% as a result of immersion in deionized water, saltwater, and alkali solution, respectively, as compared to the overall corresponding deterioration of 40.9%, 42%, and 42.8% at the end of the 60-month period of immersion. Over the longer-term period from 24 to 60 months of immersion the averaged rate of decrease is 0.17%/month, 0.22%/month, and 0.2%/month, as a result of immersion in deionized water, saltwater, and alkali solution, respectively, resulting in similar, and the lowest overall, rates of all systems for water and seawater.
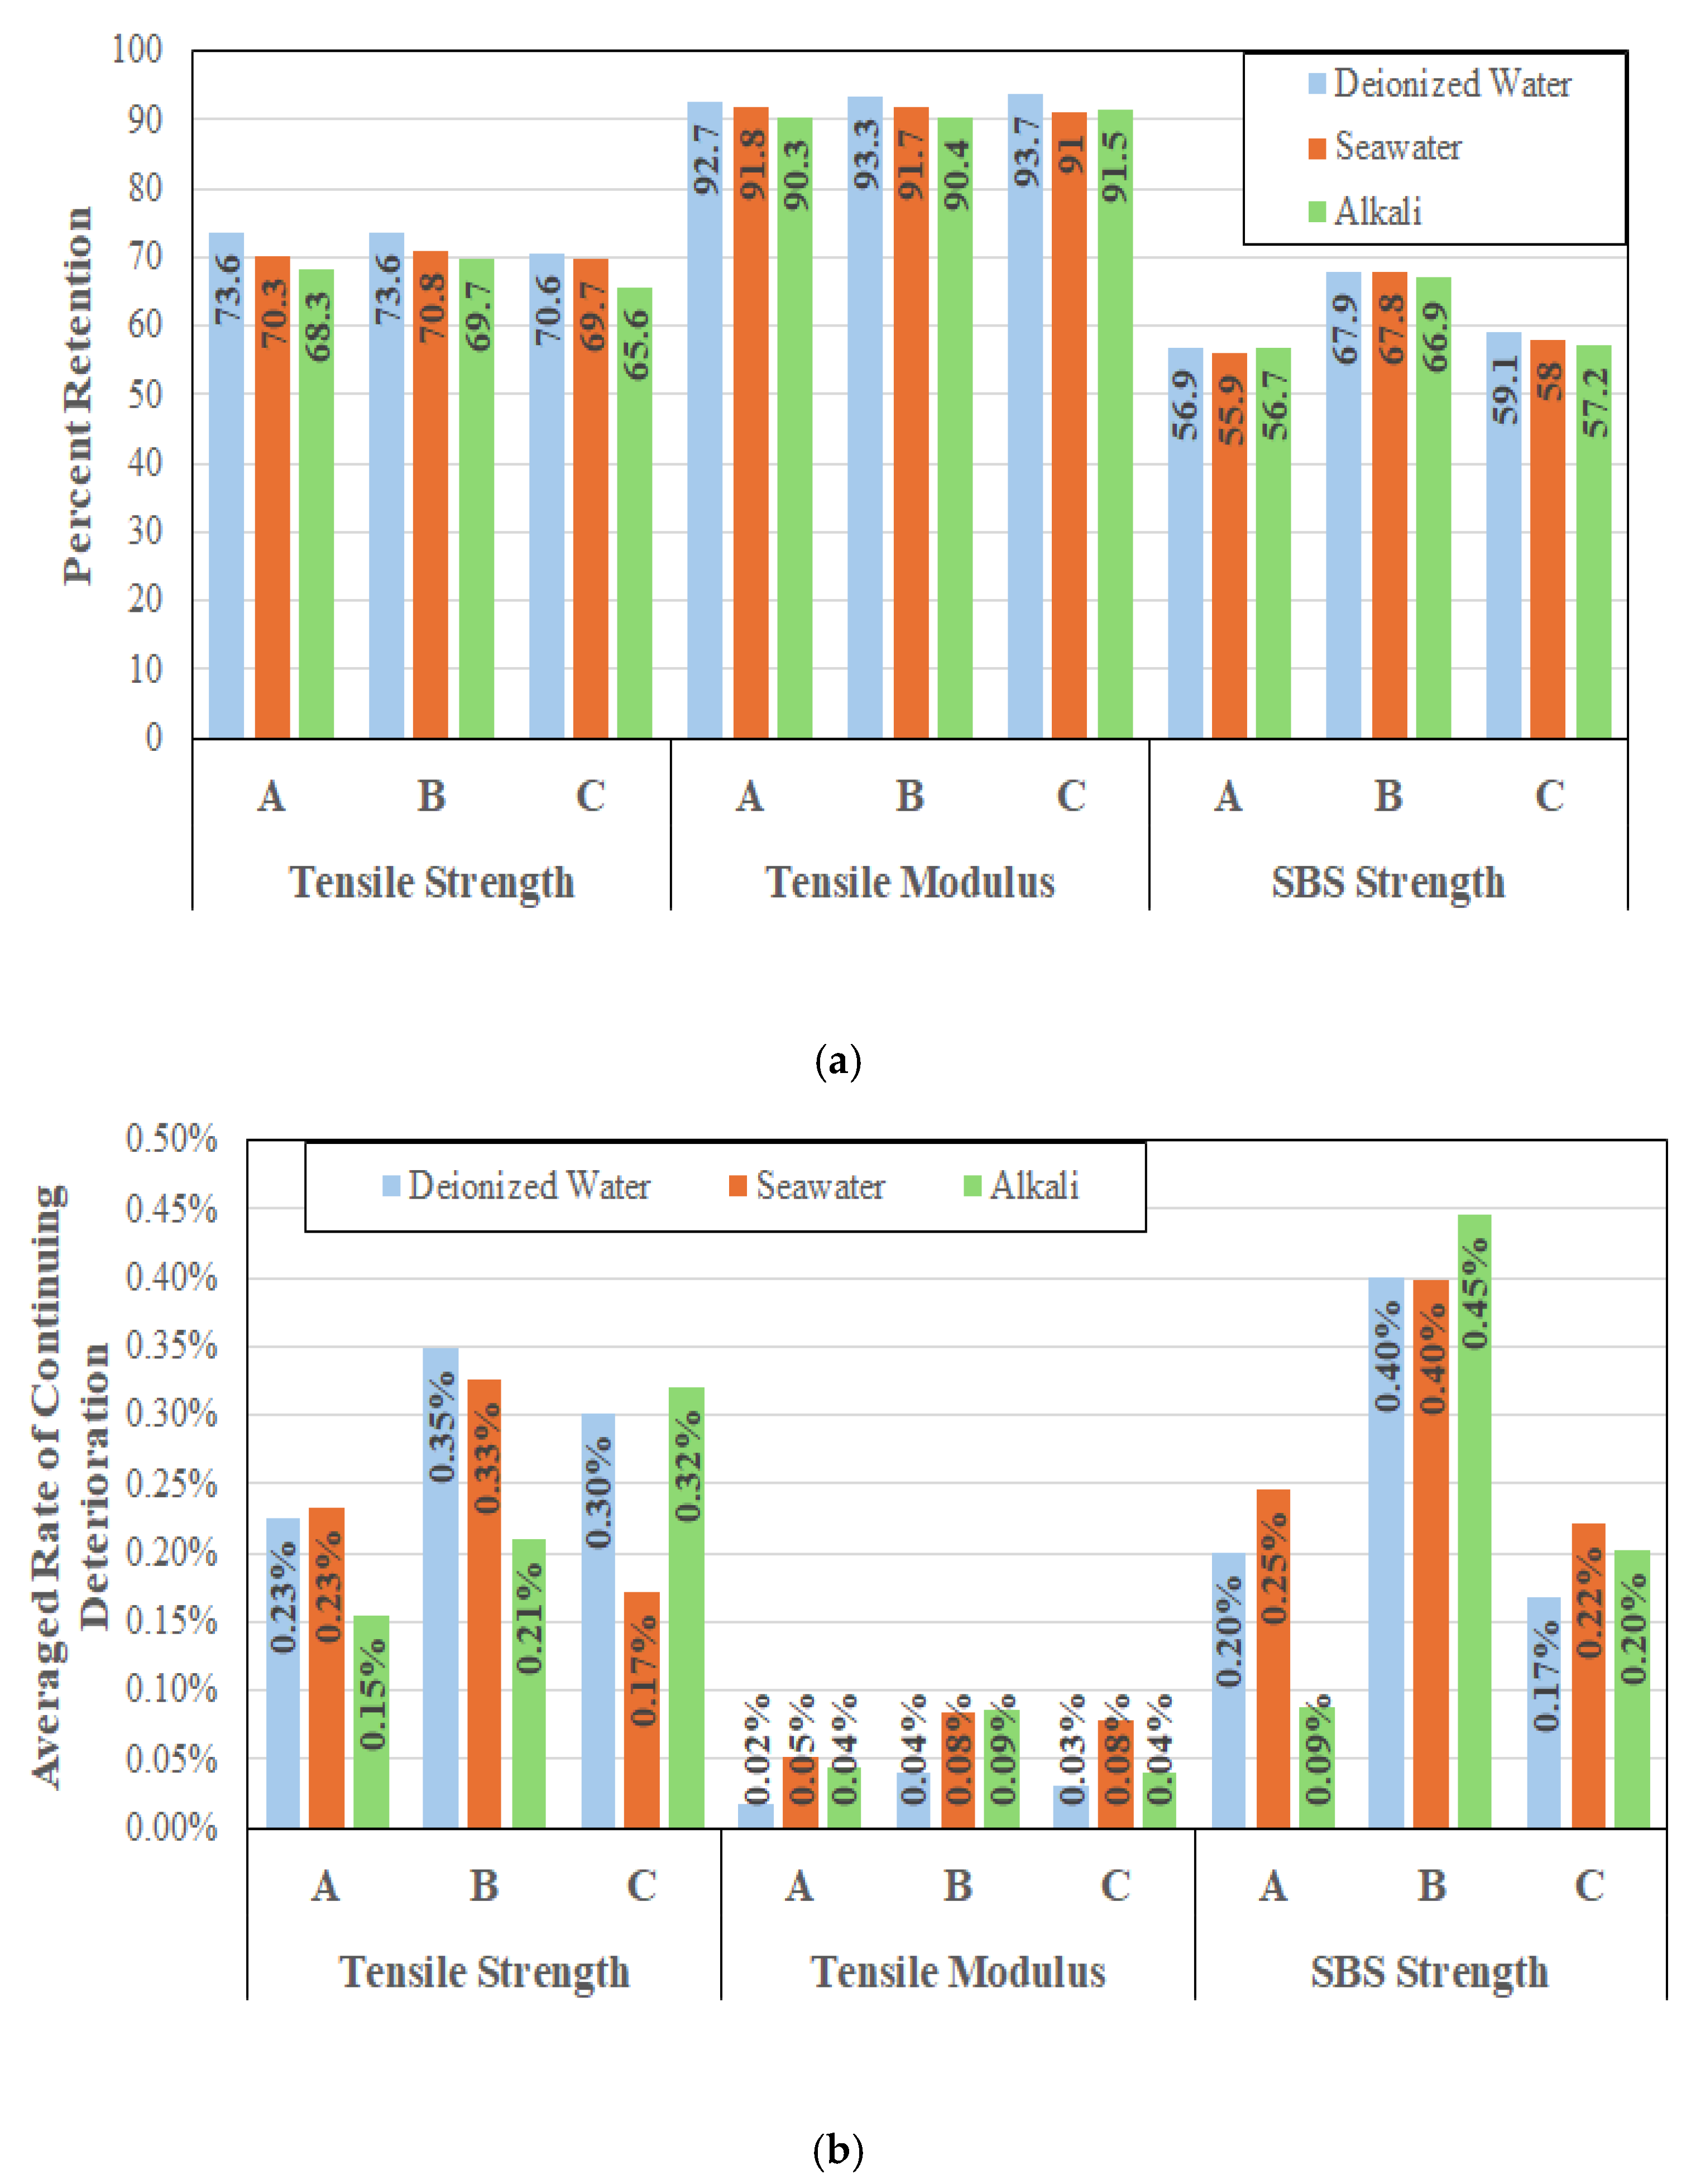
Given the interest in long-term characteristics it is of interest to compare responses of the three systems in terms of retention of tensile strength, tensile modulus, and SBS strength at the end of the 60-month period of immersion, as in
Figure 11a, and in terms of averaged rates of continued degradation for the three characteristics over the longer-term exposure period of 24 to 60 months, as in
Figure 11b.
As can be seen, immersion in alkali (concrete pore water) solution results in the greatest decrease in tensile strength with levels from immersion in deionized water and saltwater being similar albeit with slightly greater deterioration in saltwater. This suggests a level of interaction with the resin resulting in greater hydrolysis and resin deterioration in the presence of alkali ions. The accelerated, early stage, deterioration observed as a result of immersion in saltwater and alkali solution follows the results reported earlier [
57,
72] which identified ionic diffusion and ion-catalyzed hydrolysis as initiators of early weakening of the fiber–matrix interface. Cabral-Fonseca et al. [
31], through flexural tests, also concluded that alkaline solution caused the most severe deterioration. In comparison, modulus retention is extremely high over all three systems and solutions of immersion with very little actual difference overall and even between solutions. The tight range of 90.3–93.7% retention is well within scatter bounds and emphasizes that modulus is a fiber dominated characteristic and with all specimens being unidirectional and processed under tension there is very little, if any, change in linearity and hence in the tensile modulus in the longitudinal direction even with plasticization and fiber–matrix debonding. The largest decrease across all systems is in terms of SBS strength indicating loss in fiber–matrix bond integrity resulting in deterioration in interfacial characteristics. Again, the long-term effects of solution are not significantly different with immersion in the alkaline solution representing the greatest effect and those due to immersion in deionized water the least. While system B shows the best SBS retention, it is noted that the rates of continuing deterioration are also the highest, as shown in
Figure 11b, suggesting that over time this aspect may not hold.
It is worth noting that while
Figure 11b represents the continuing rates of deterioration averaged over the longer-term exposure period of 24 to 60 months where the deterioration appears to be largely asymptotic, as seen in
Figure 8,
Figure 9 and
Figure 10, the rates continue to decrease over time as would be expected.
Table 5 provides a comparison of deterioration rates over a range of longer-term periods for SBS strength of the three systems accruing from immersion in deionized water, seawater, and alkali solution. As can be seen, the rates in the last 12 months (from the 48th month to the 60th month of immersion) are significantly lower than those from the 36-month period of assessment if the asymptotic range of 24 to 60 months were considered, except in the case of system A, where the rate actually more than doubles as a result of immersion in the alkali solution suggesting specific susceptibility to the alkaline ions. The most dramatic change is in system C, where rates decrease significantly in the last 12 months, but even here the drop is less for the alkaline environment.
3.4. Prediction of Long-Term Aging
To estimate long-term response of the material sets considered in this investigation the Arrhenius model was used assuming that the rate at which degradation occurs, k, follows the form
where E
a is the activation energy, R is the universal gas constant, and T is the exposure temperature in degrees Kelvin. The primary, and gross, approximation and assumption used herein is that the material has a dominant mode of deterioration that does not change with time and temperature but is accelerated by increase in temperature. Notwithstanding the differences seen in the hygrothermal degradation of polymers and polymer matrix composites, the use of the Arrhenius model, especially as related to rates and relative activation energies, has been seen to provide useful information on the long-term durability of materials systems based on limited-term data, and for the development of design thresholds. In the current case, given that the dominant mode of deterioration relates to fiber–matrix interface weakening and debonding, followed by matrix hydrolysis, the assumption can be justified as a first-order approximation. While there are concerns related to the extrapolation of short-term data to very much longer time scales, the existence of 5 years of data in the current case mitigate this to a much larger extent than in previous cases where short-term data, from a few months to a year, were used. It should, however, be cautioned that the results provide a useful means for comparison between materials based on estimation of long-term response, rather than in predicting exact levels of service-life. Following the procedure in Litherland et al. [
73] and Proctor et al. [
74] and as used for E-glass/vinylester systems by Chin et al. [
75] and Karbhari [
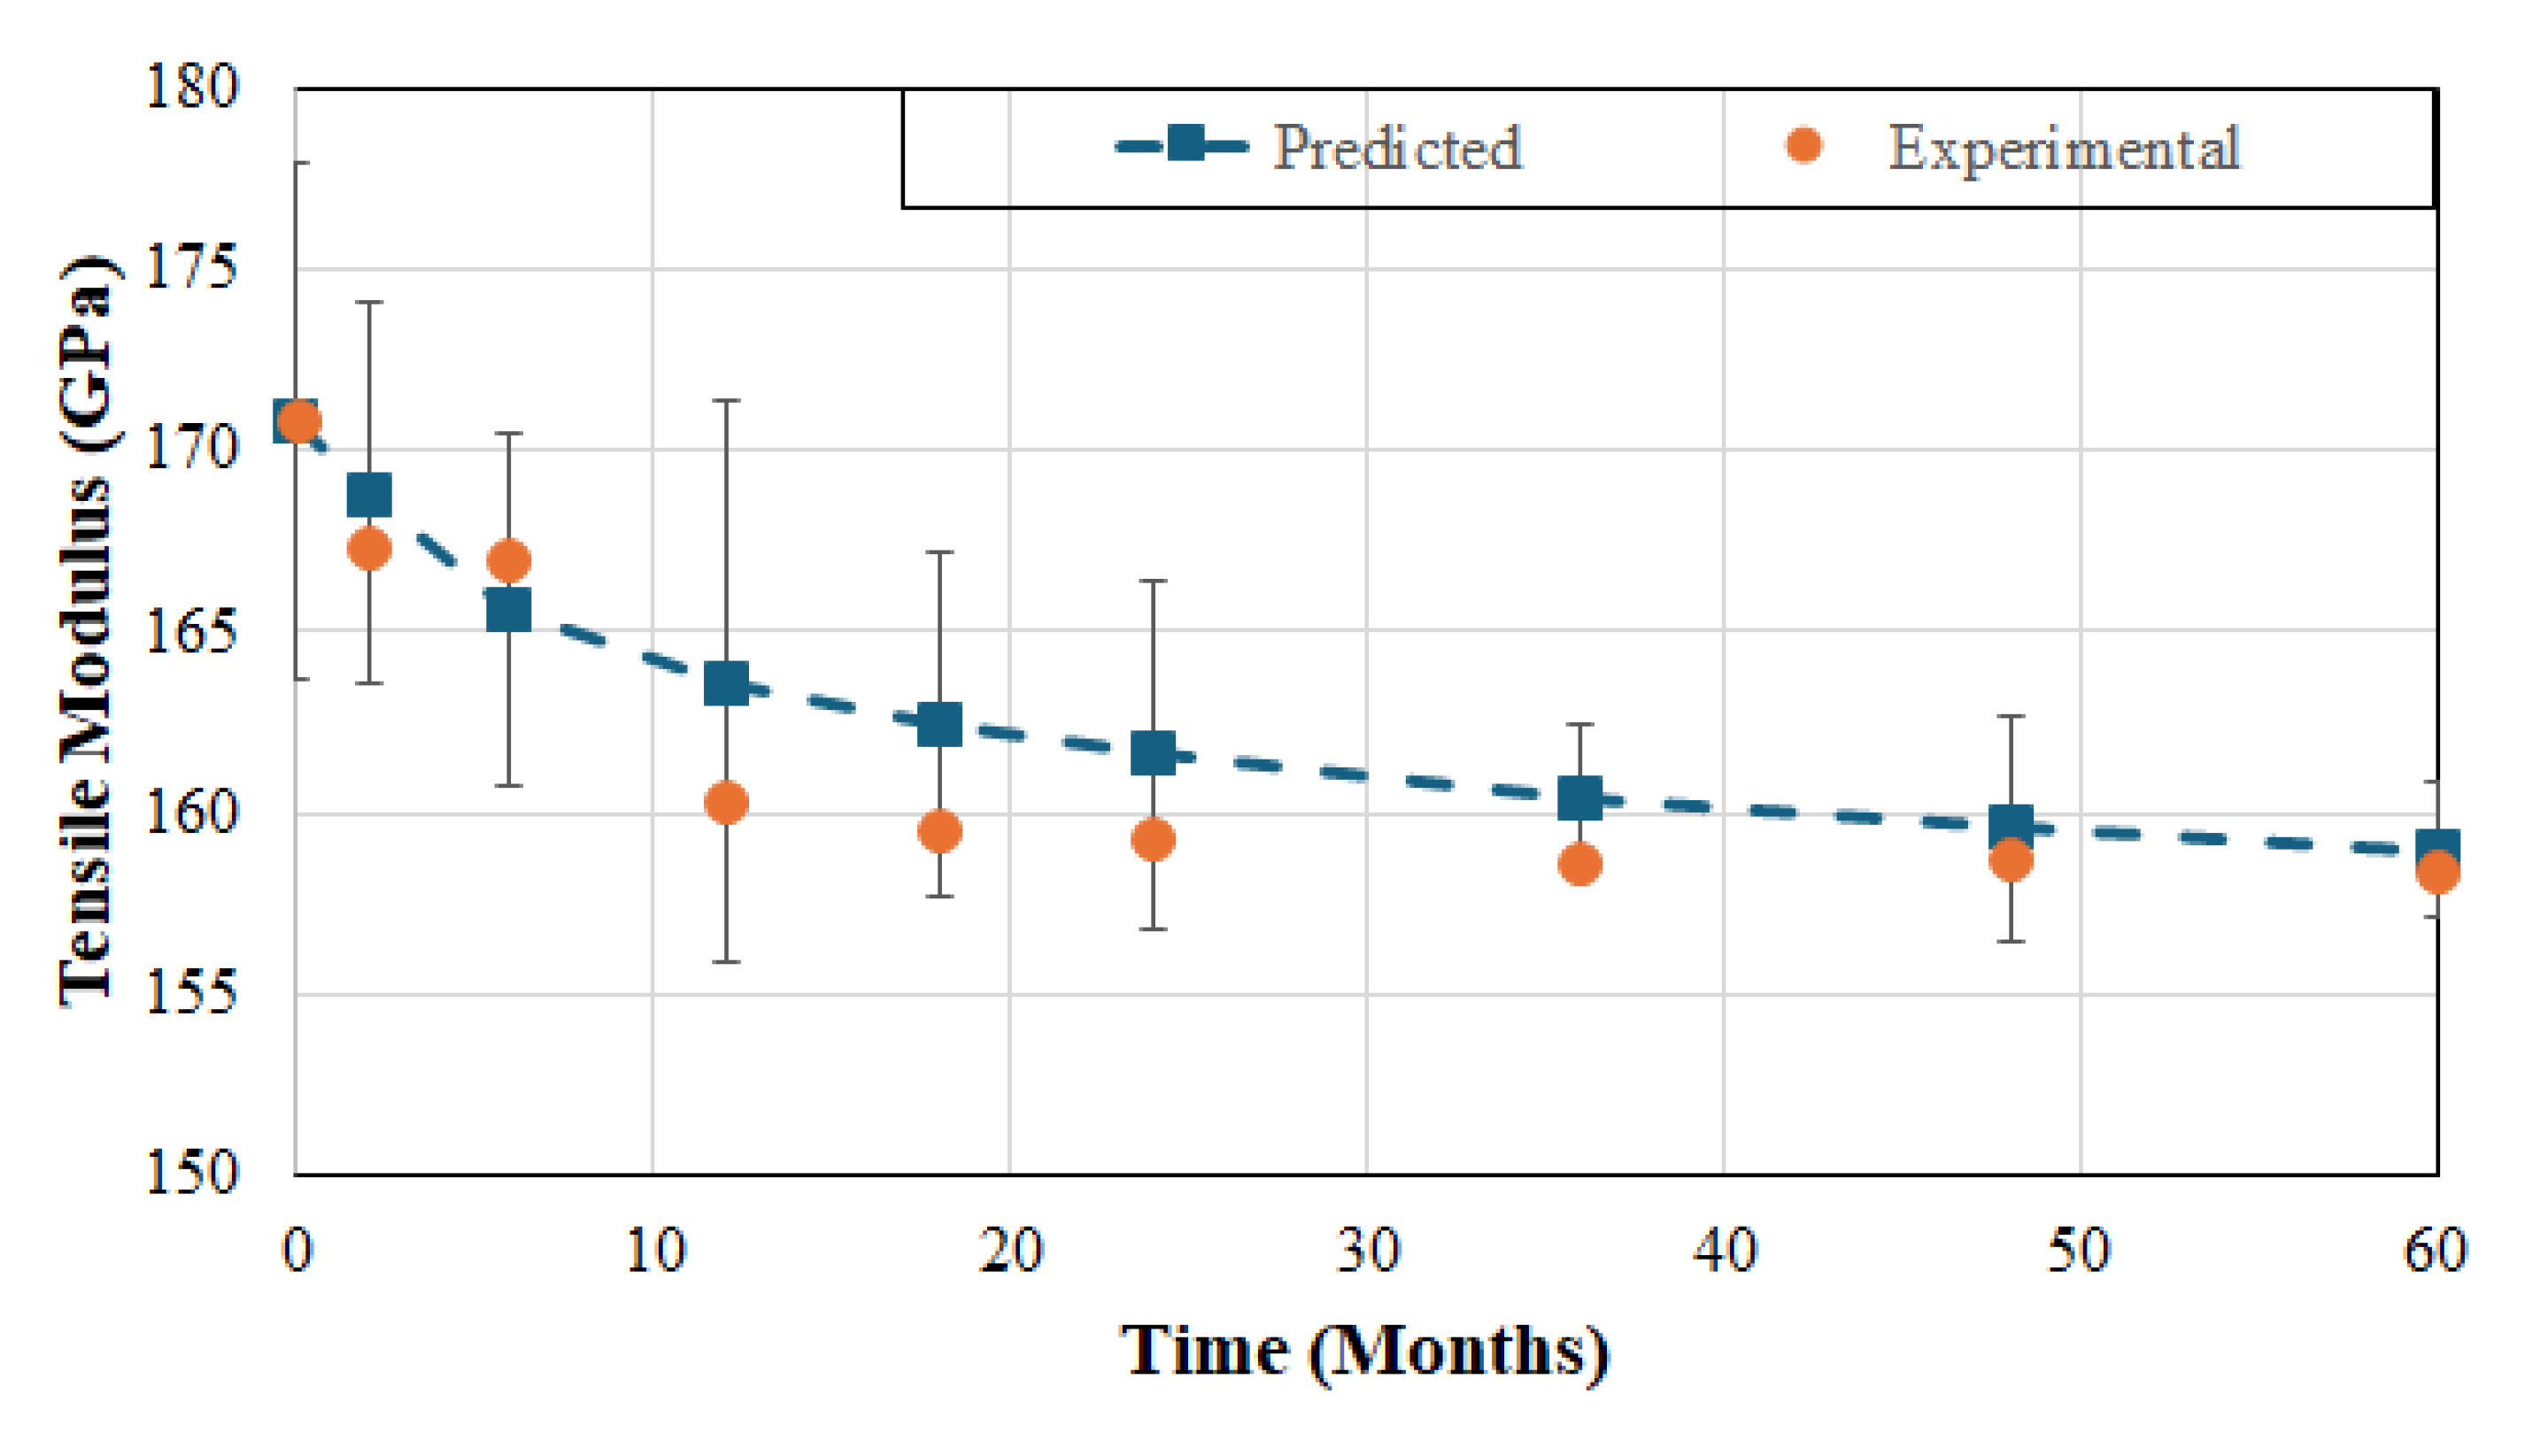
76], the natural logarithm of time to reach a set of levels of normalized performances versus 1/T can be used to predict service life at a given temperature normally taken as the ambient, or service, temperature. Using data from tests conducted after exposure at the three different temperatures, predictions were made for property retention as a function of time for the 23 °C immersion case. An example of the comparison between experimental data and predictions is shown in
Figure 12. As can be seen the predictions are well within the overall scatter levels (shown as maximum and minimum bars around the mean in
Figure 12) of the experimental data and compare well with the average levels at longer periods of exposure.
Equations for prediction of long-term performance can then be described by fitting an equation of the type
where P(t) and P
0 are performance characteristics at time, t, of exposure (in months) and the initial, unexposed, levels, respectively, and A is a degradation rate factor, such that the part within the braces (i.e., { }) represents retention of that characteristic at time, t. Equations for the three FRP systems as related to tensile strength, tensile modulus, and SBS strength as a result of long-term immersion in deionized water are given in
Table 6. As can be seen the rate constants change with both FRP systems and characteristic and follow the trends described earlier for deterioration rates.
These results can be extended to the two other immersion conditions of saltwater and alkali solution using procedures of partial safety factors introduced by Karbhari and Abanilla [
55] whereby Equation (5) is modified through the use of an environment based partial factor, f
env, as
where f
env is the factor representing the difference in deterioration between deionized water and other immersive environments under the assumption of self-similar damage mechanisms. Using the approach in Karbhari and Abanilla [
55] based on attainment of an asymptotic moisture absorption profile after 24 months, factors as listed in
Table 7 can be determined for f
env.
As can be seen from
Table 7, the consideration of saltwater or alkaline solution results in a slight decrease in the overall level of performance, with the alkaline environment, in general, having a larger effect which is in line with results reported by Xiong et al. [
77]. While the levels of decrease are small, 0–7% for the prefabricated strips, there is also significant similarity in overall response between the three systems, suggesting that all three would behave in a similar fashion over an extended period of immersion, as was indicated by a comparison of rates of deterioration over the longer term in an earlier section.
It should be emphasized that all these predictions are expected to reflect an aggressive set of exposures since they are based on full immersion over the entire period under consideration, rather than the more commonly seen conditions of humidity and/or periodic immersion. Further, the data are developed on specimens that have not been coated with protective coatings such as gel coats that are usually applied in an offshore/marine or aqueous environment to further reduce moisture uptake. Nonetheless, they present a useful means of estimating differences in response over extended periods of time between competing systems. While the characteristic and guaranteed values provide levels of design thresholds, they do not account for effects of environmental exposure which are considered through the addition of environmental reduction factors such as in ACI-440 [
30] wherein design levels are determined through the product of an environmental reduction factor, C
E, and the guaranteed level. The design ultimate strength, f
fu, for example, is determined as
where C
E = 0.85 for carbon fiber reinforced composites subject to exterior exposure and
is the guaranteed tensile strength. fiB [
52] defines the design tensile strength as
where f
fuk is the characteristic tensile strength (defined as the average minus 1.645 times the standard deviation), n
f is a reduction factor for relevant exposure in accordance with ISO 10406 [
78] taken as 0.7, and g
f for carbon fiber reinforced polymer strips is 1.3 at the maximum. Applying the format used for tensile strength in Equations (7) and (8) to the tensile modulus and SBS strength enables the determination of design thresholds for each, and these can then be used in conjunction with equations in
Table 6 to attain times to reach the thresholds which are reported in
Table 8.
As can be seen, the ACI-440 levels for tensile strength and SBS strength are attained at very short periods of exposure and well within the experimental period of investigation. In comparison, the levels prescribed by fiB for tensile strength are attained after over 50 years of immersion while those for SBS strength are still within the 5-year period for systems A and C. In all cases, the tensile modulus does not show any indicator of attaining the threshold till significantly past a 100-year estimate. Of all systems, FRP system B is seen to have the best overall response. It should, however, be emphasized again that conditions of full immersion without protective coatings is not expected in field applications and hence the actual design life can be expected to be significantly higher.
Given the low values of design life using the environmental reduction factor specified by ACI-440 [
30], it is of interest to determine the value of the factor that would be needed to be applied to attain a specified design life. This can be determined through restructuring of Equation (5) such that
where average and guaranteed refer to the average and guaranteed values of the mechanical performance characteristic, respectively, A is the degradation rate factor as listed in
Table 6, and t
T is the target design life in months (e.g., a target design life of 10 years would be t
T = 10 × 12 = 120 months). Values for the environmental reduction factor based on immersion in deionized water at 23 °C are listed in
Table 9.
As would be expected, all values decrease with the increase in intended design life, and with the exception of tensile modulus where the ACI-440 value of 0.85 is more than adequate, the values are lower than the threshold of 0.85. In particular the SBS strength levels are extremely different, which is not surprising considering that interfacial/shear failure within the composite is not considered by the standard since the traditionally required characteristics are those of unidirectional strength, modulus, and strain. However, shear response is a critical aspect in unidirectional composites and is a mechanism that could lead to catastrophic, albeit rare, failure and hence should be studied in greater depth. It is also noted that the values of CE do not drop substantially as design life is increased from 50 to 100 years because of the asymptotic nature of the predictive equation formulated based on the Arrhenius concept of single dominant mechanism and self-similar response over the extrapolated period of time. The reader is, however, cautioned that, as stated earlier, this is a gross approximation and the accuracy of extrapolations to such long periods of time based even on 5 years of experimental data cannot be validated, nor guaranteed. In general, however, a factor of 0.5 would suffice for all three systems, which is not significantly different from the value of 0.538 obtained from the ratio of used in the fiB standard.


