
Upcycling of Agro-Waste: Research on Performance of a Novel Super-Hygroscopic Material Prepared by Exploiting the Porous Structure of Steam-Exploded Modified Corn Stalk Pith

Abstract

1. Introduction
2. Materials and Methods
2.1. Materials
2.2. Preparation of SE-CSP
2.3. Carbohydrate Analysis
2.4. Structural Characterization
2.4.1. Confocal Laser Scanning Microscopy (CLSM)
2.4.2. Scanning Electron Microscopy (SEM)
2.4.3. Specific Surface Area and Pore Volume Analysis
2.4.4. Fourier Transform Infrared Spectroscopy (FTIR)
2.4.5. X-Ray Photoelectron Spectroscopy (XPS)
2.4.6. X-Ray Diffraction (XRD)
2.4.7. Thermogravimetric Analysis (TGA)
2.4.8. Contact Angle
2.5. Moisture Adsorption and Retention Experiment
2.6. Moisture Adsorption Model Fitting
2.7. Statistical Analysis
3. Results
3.1. Composition Analysis
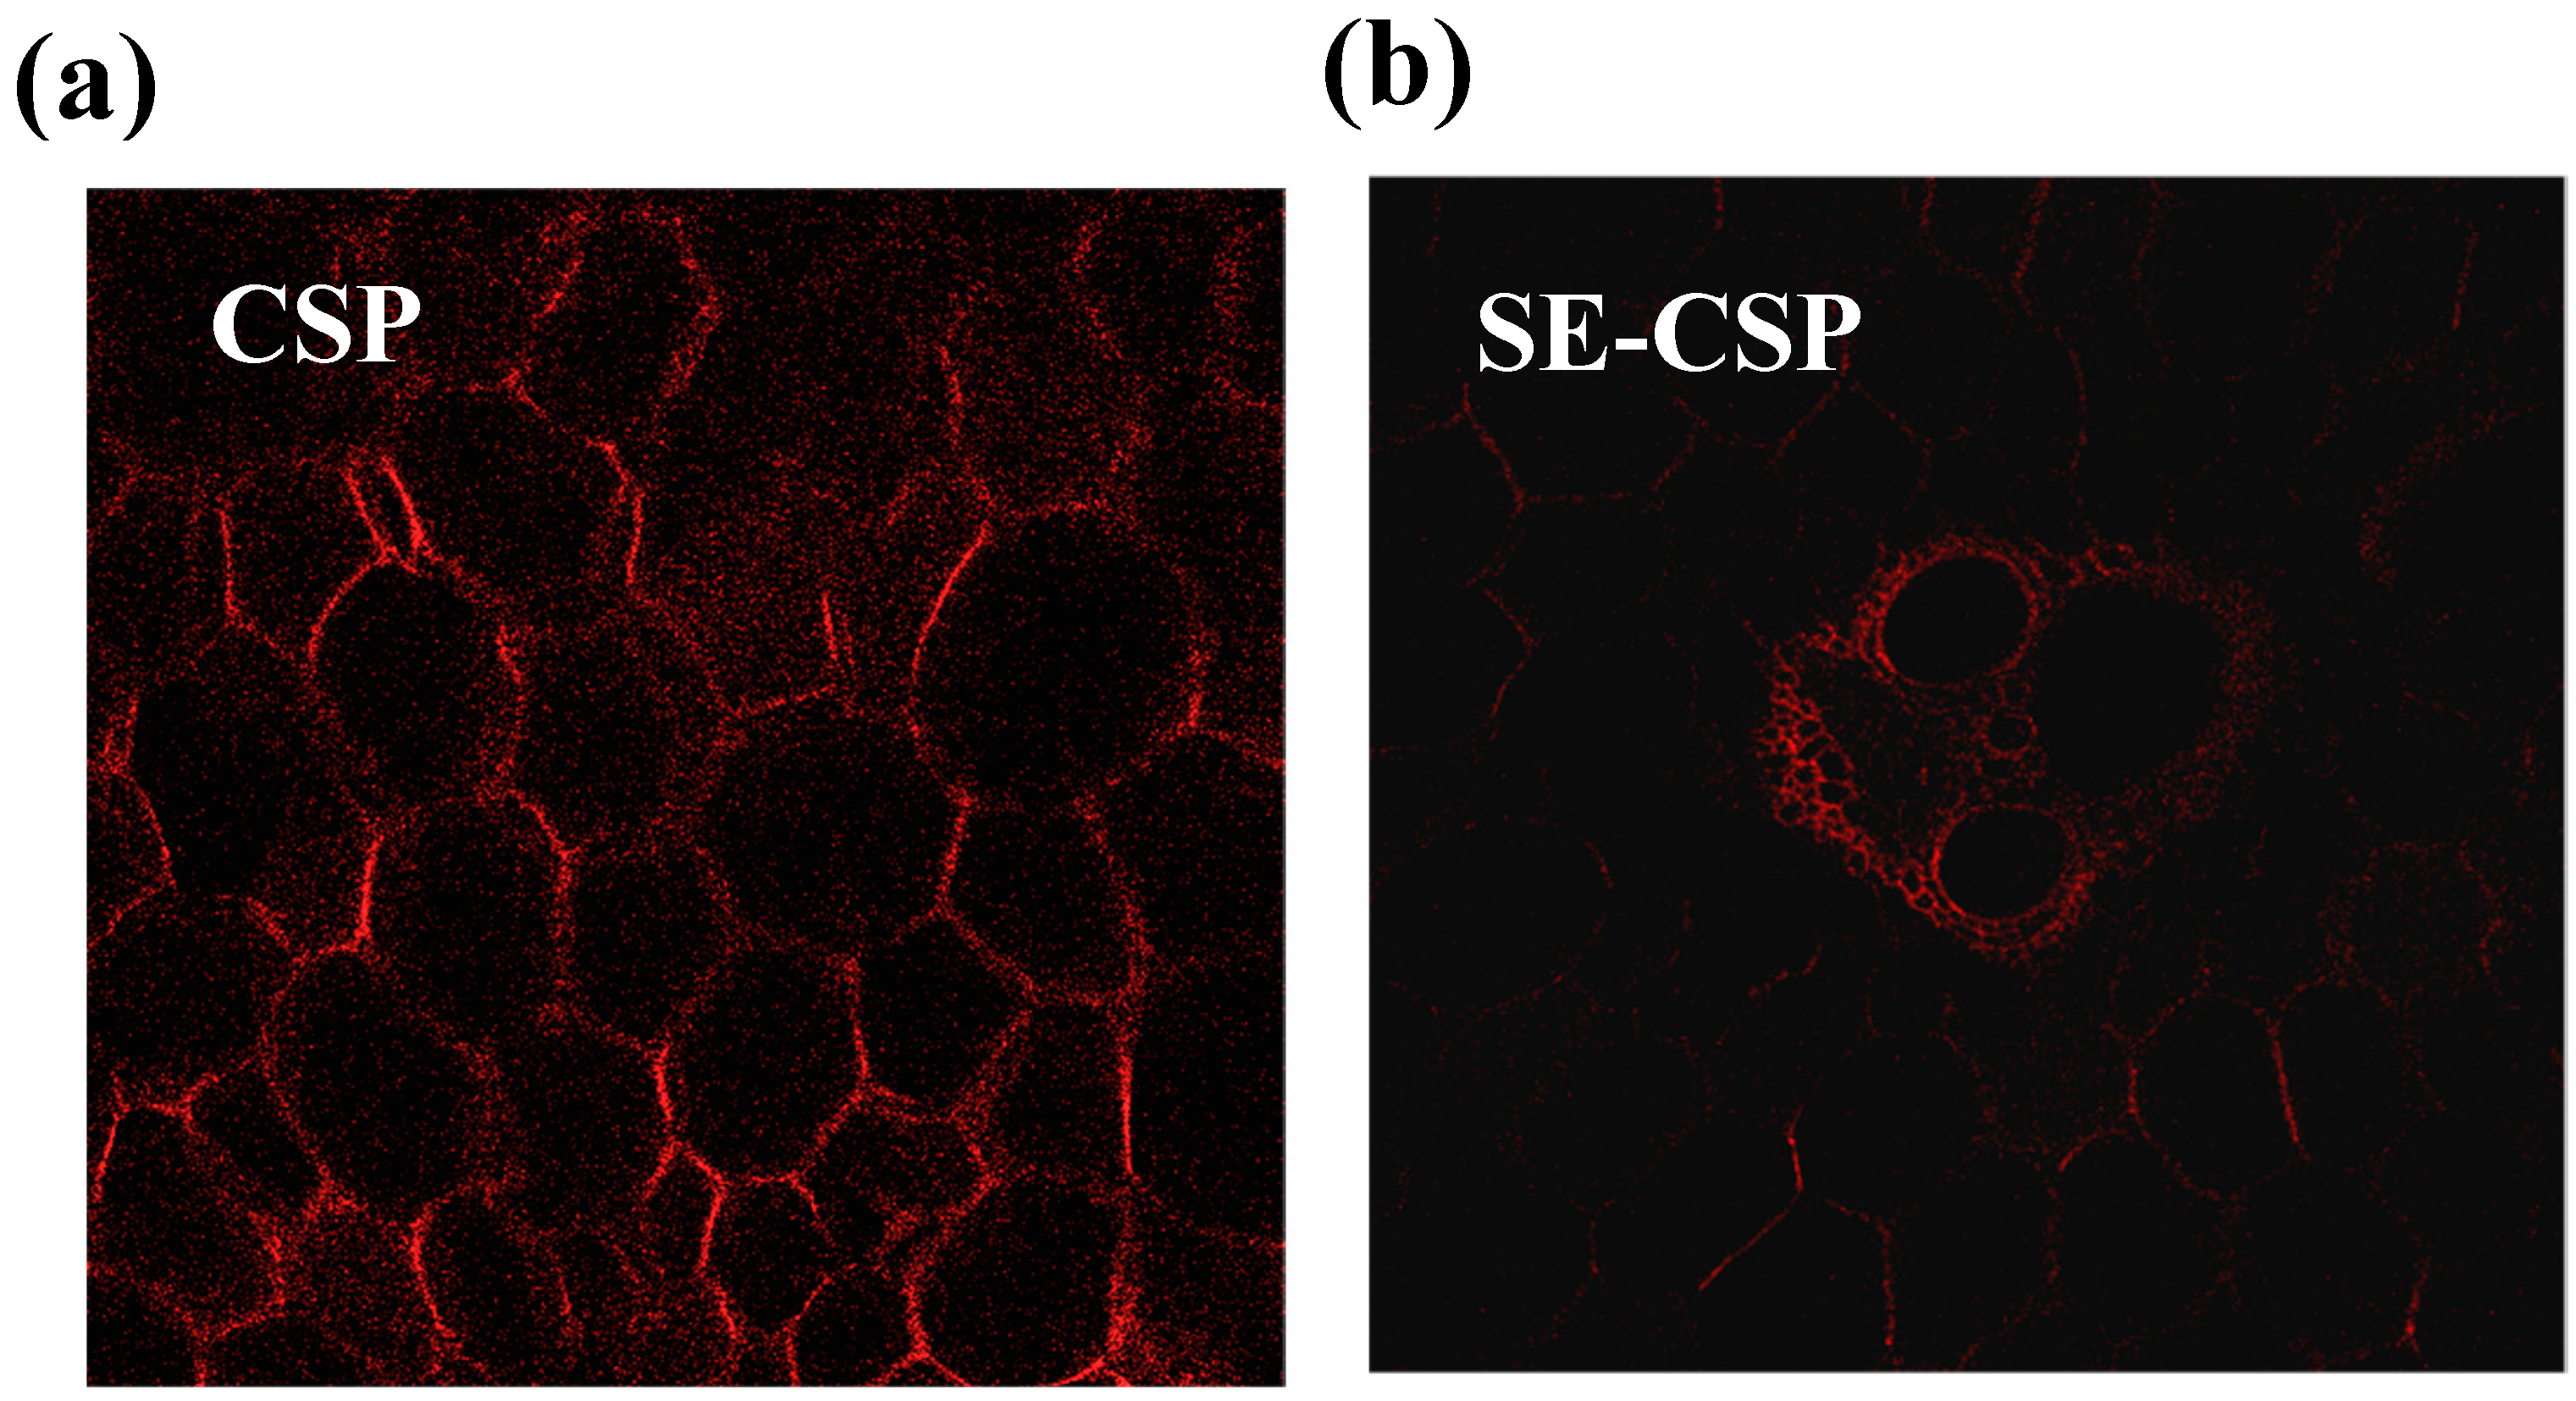
3.2. CLSM Analysis
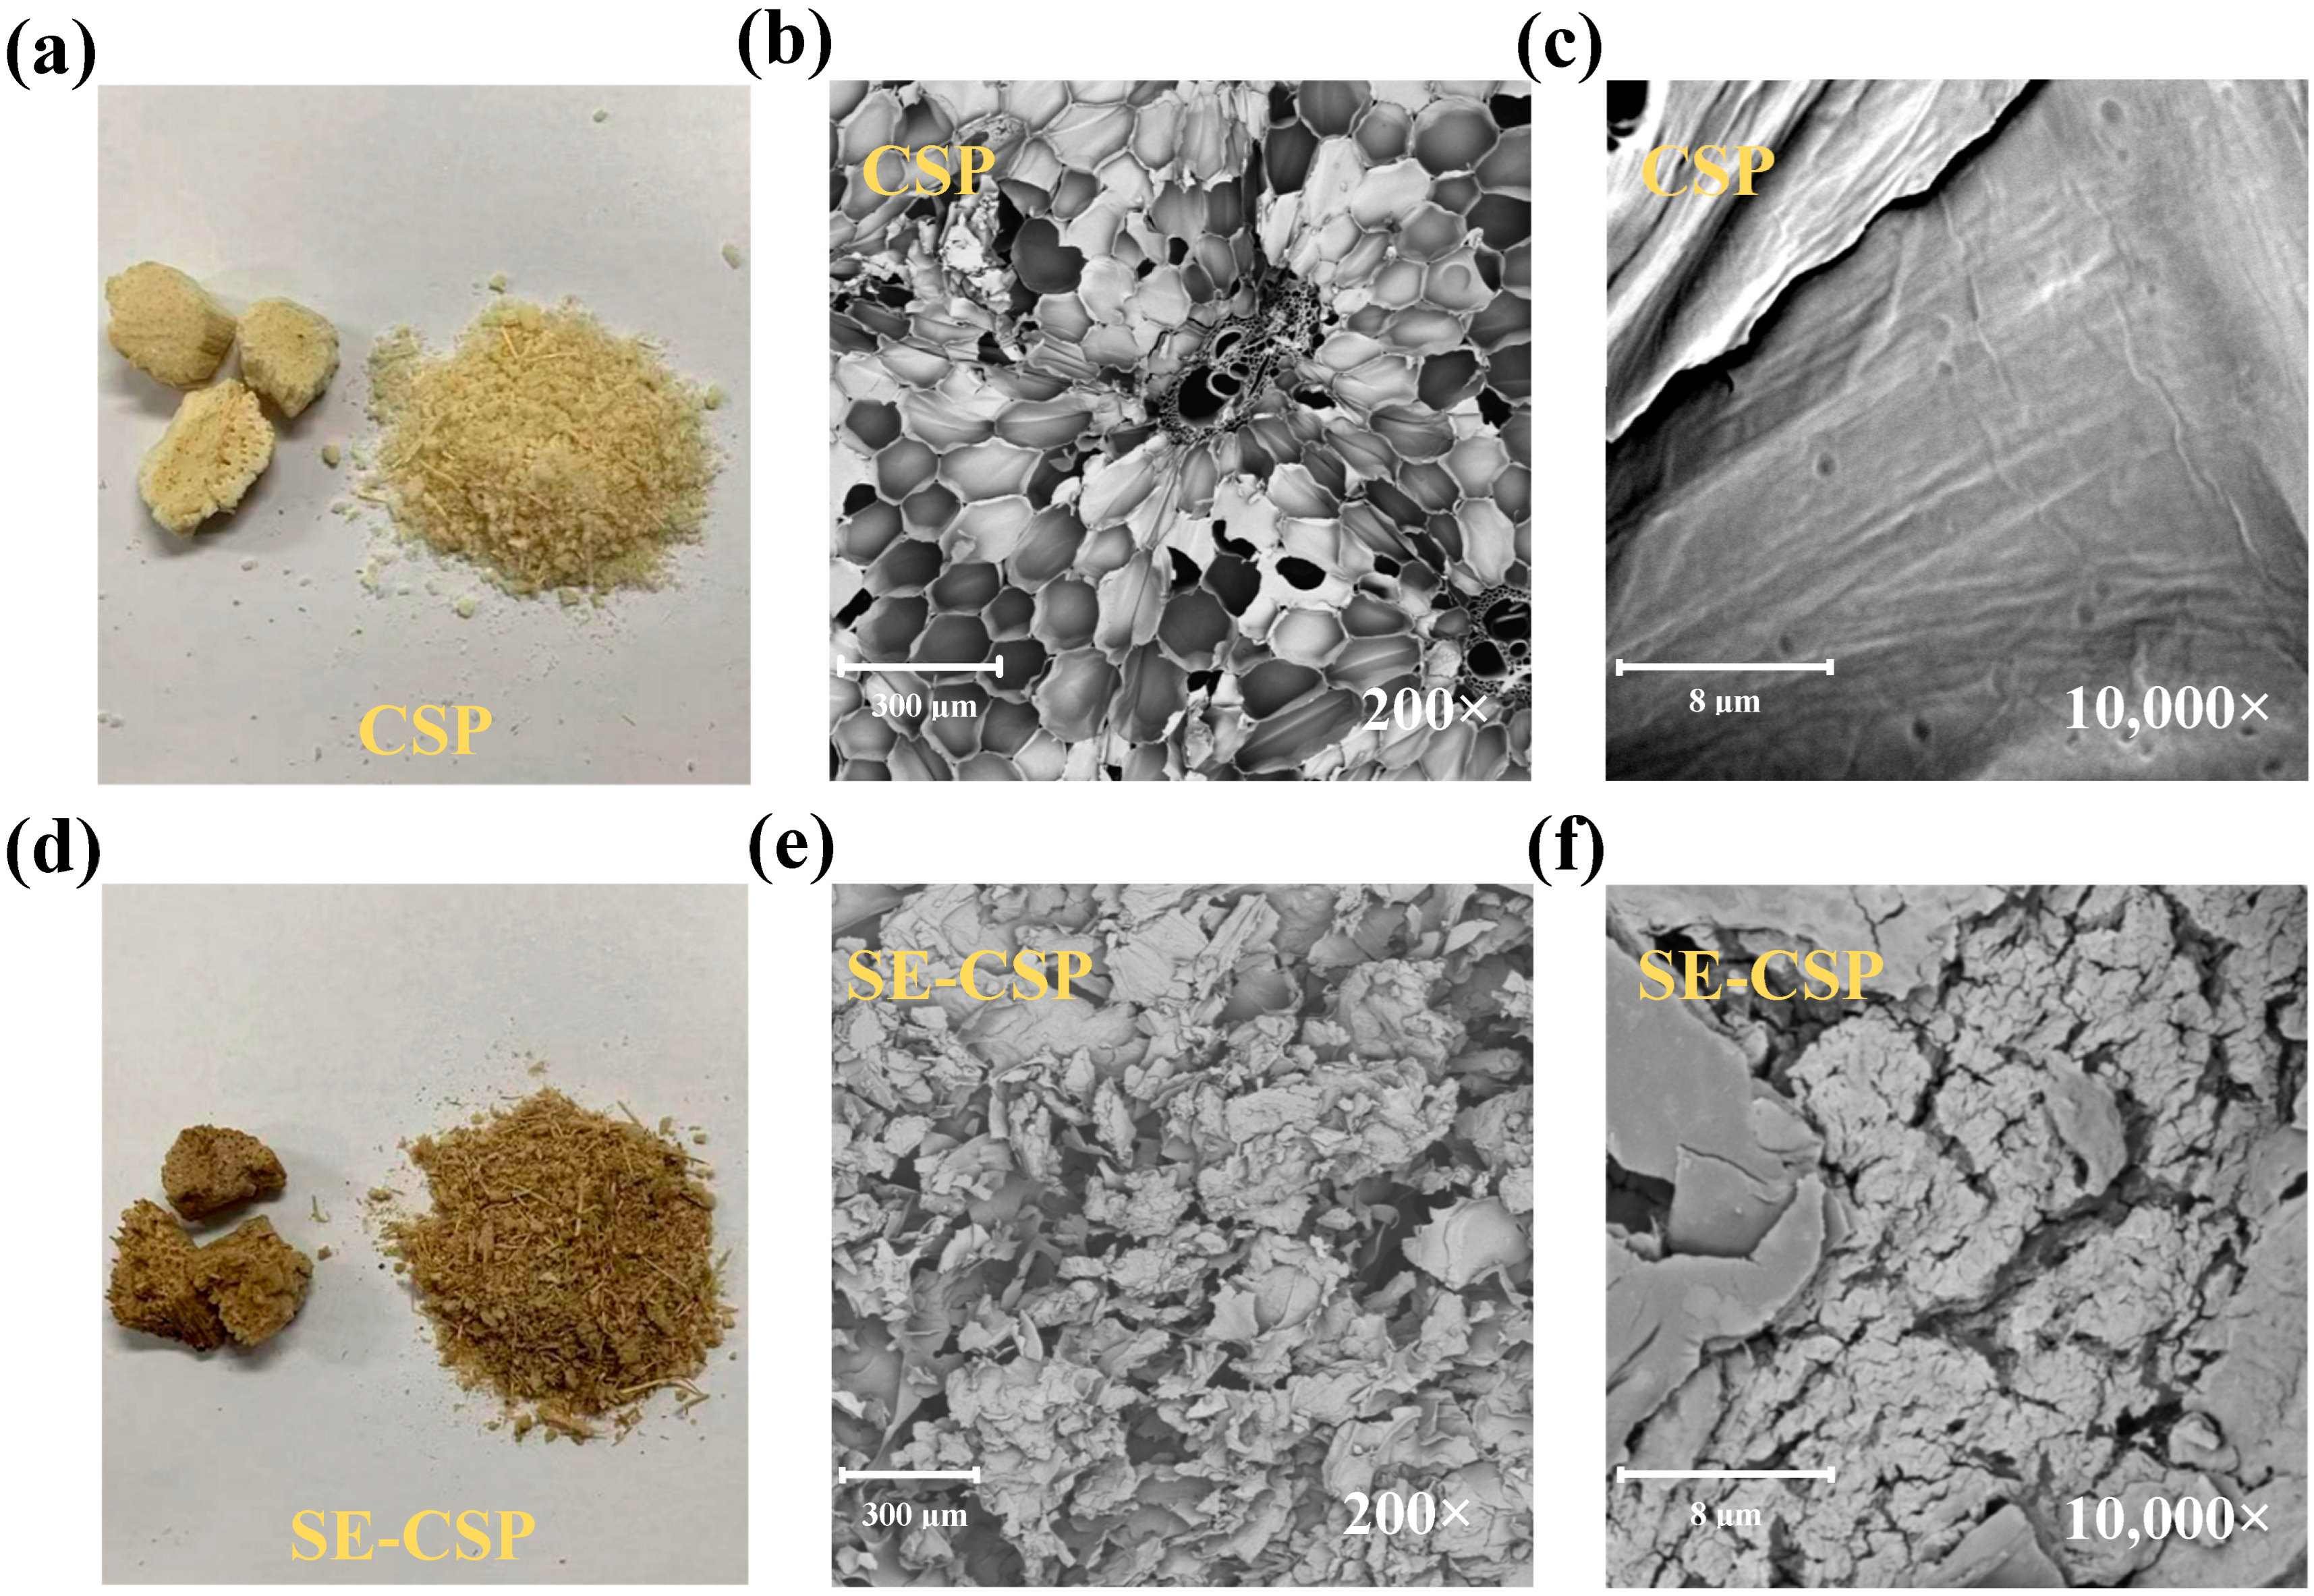
3.3. Morphology Analysis
3.4. Specific Surface Area and Pore Volume Analysis
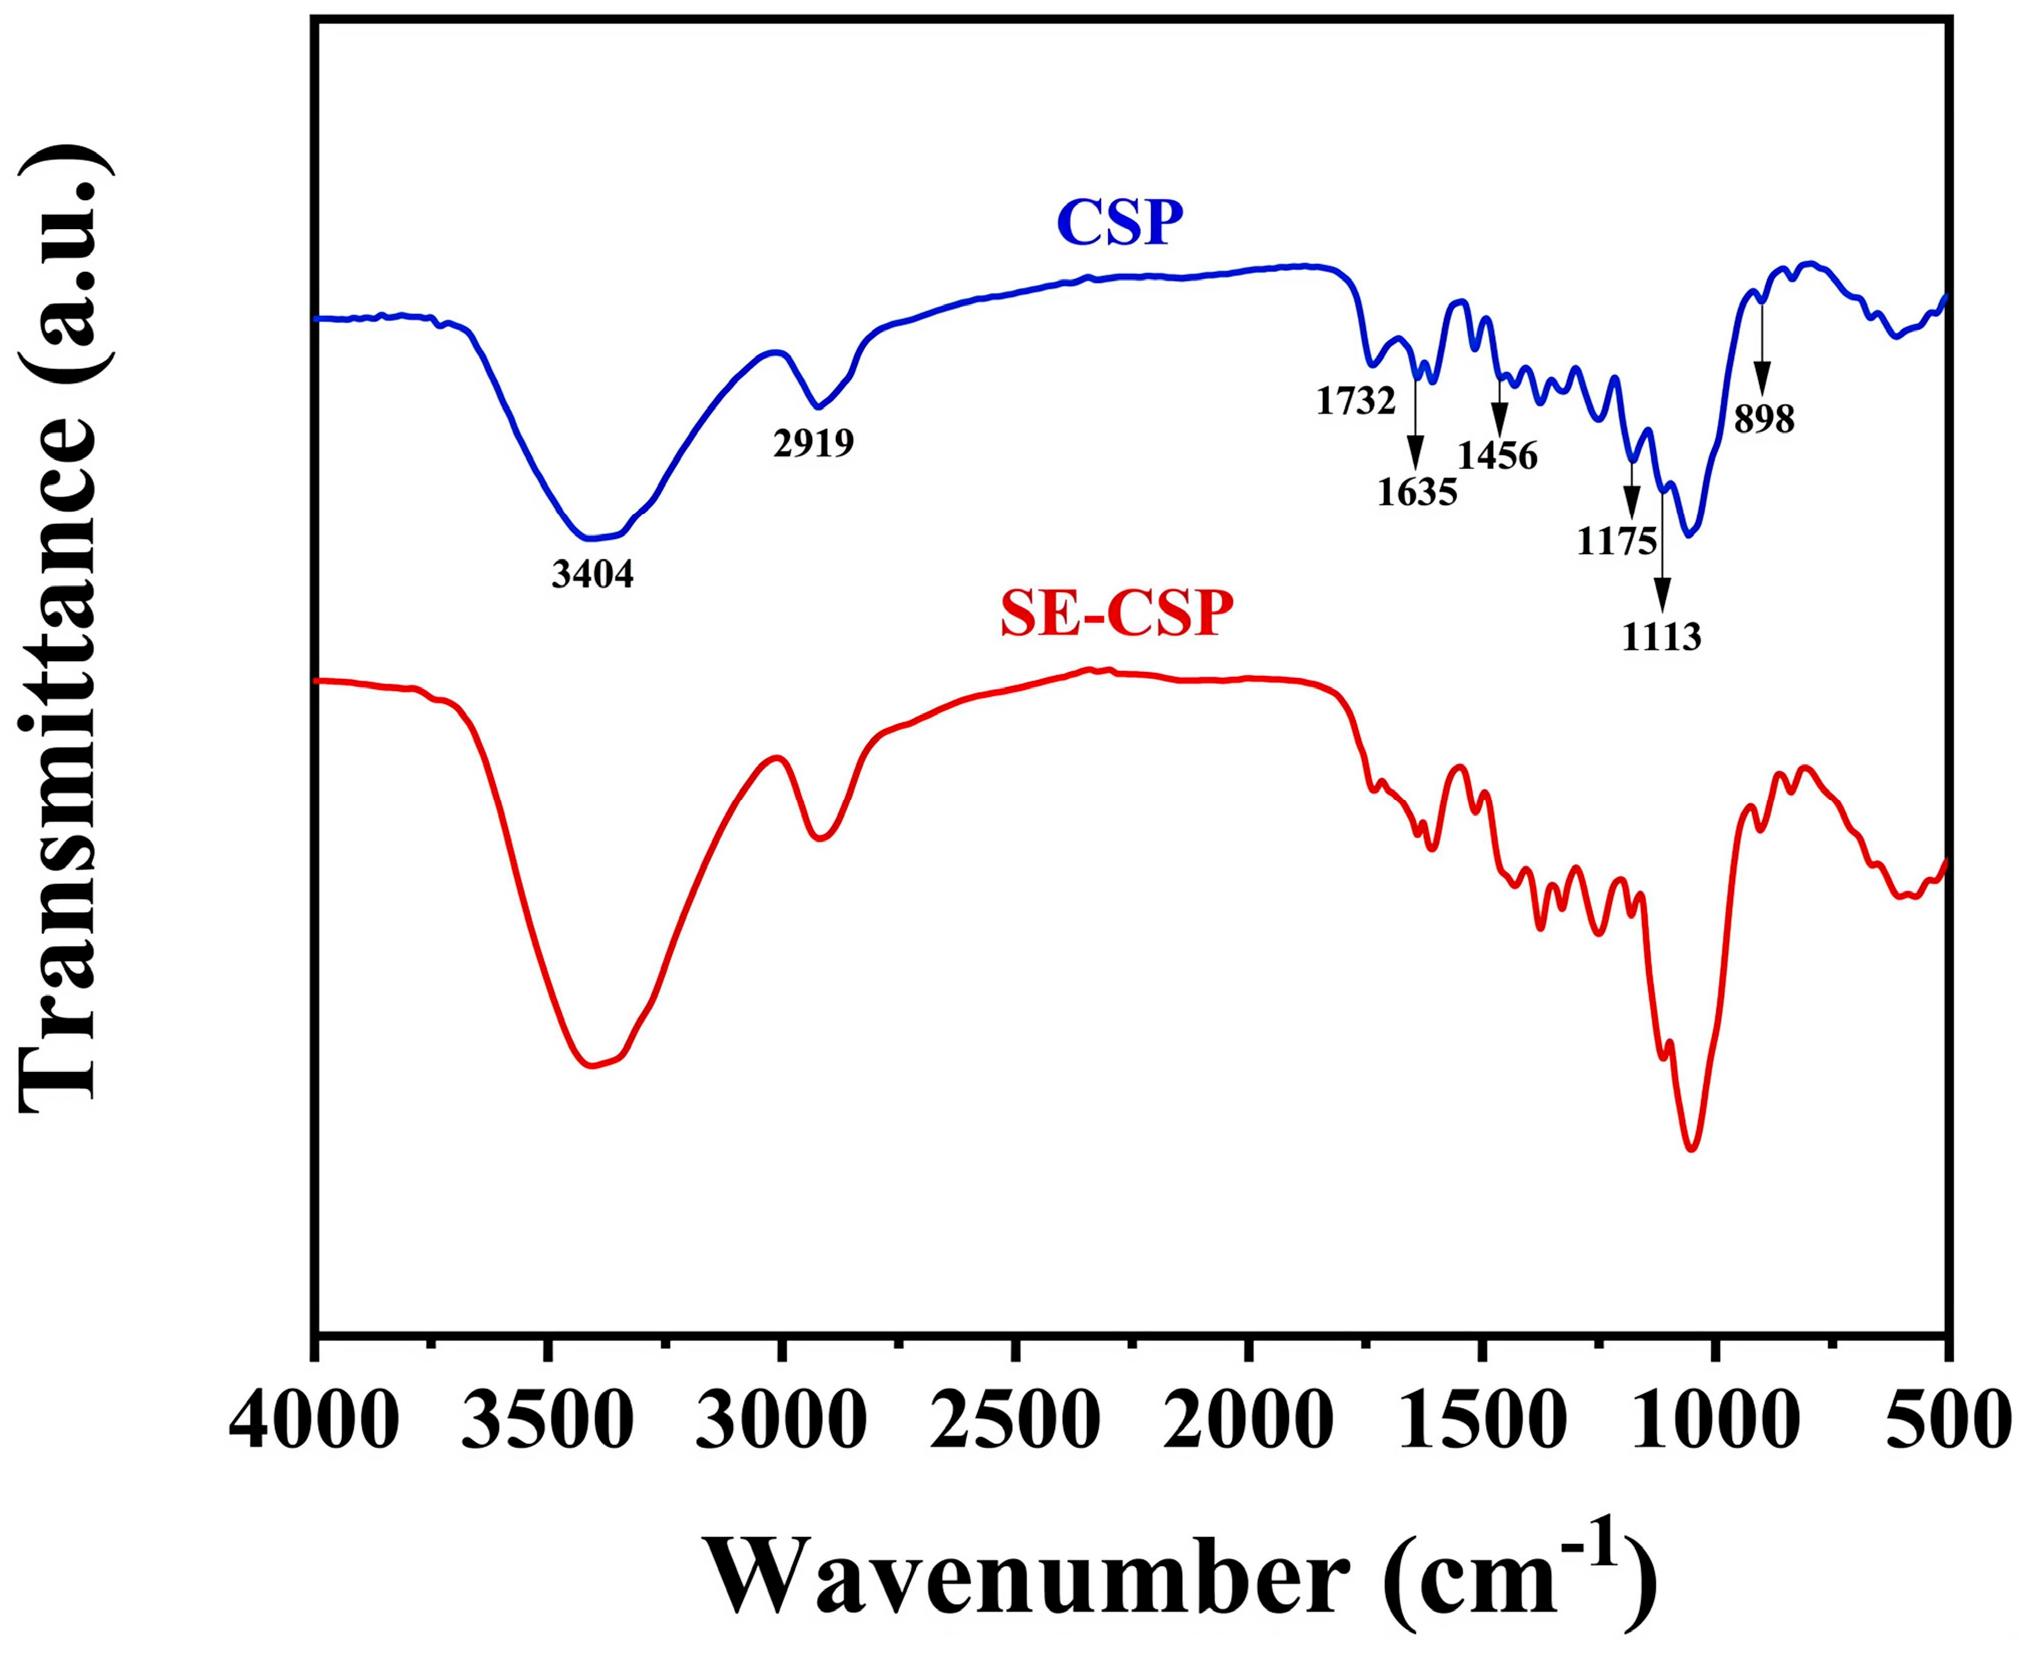
3.5. FTIR Analysis
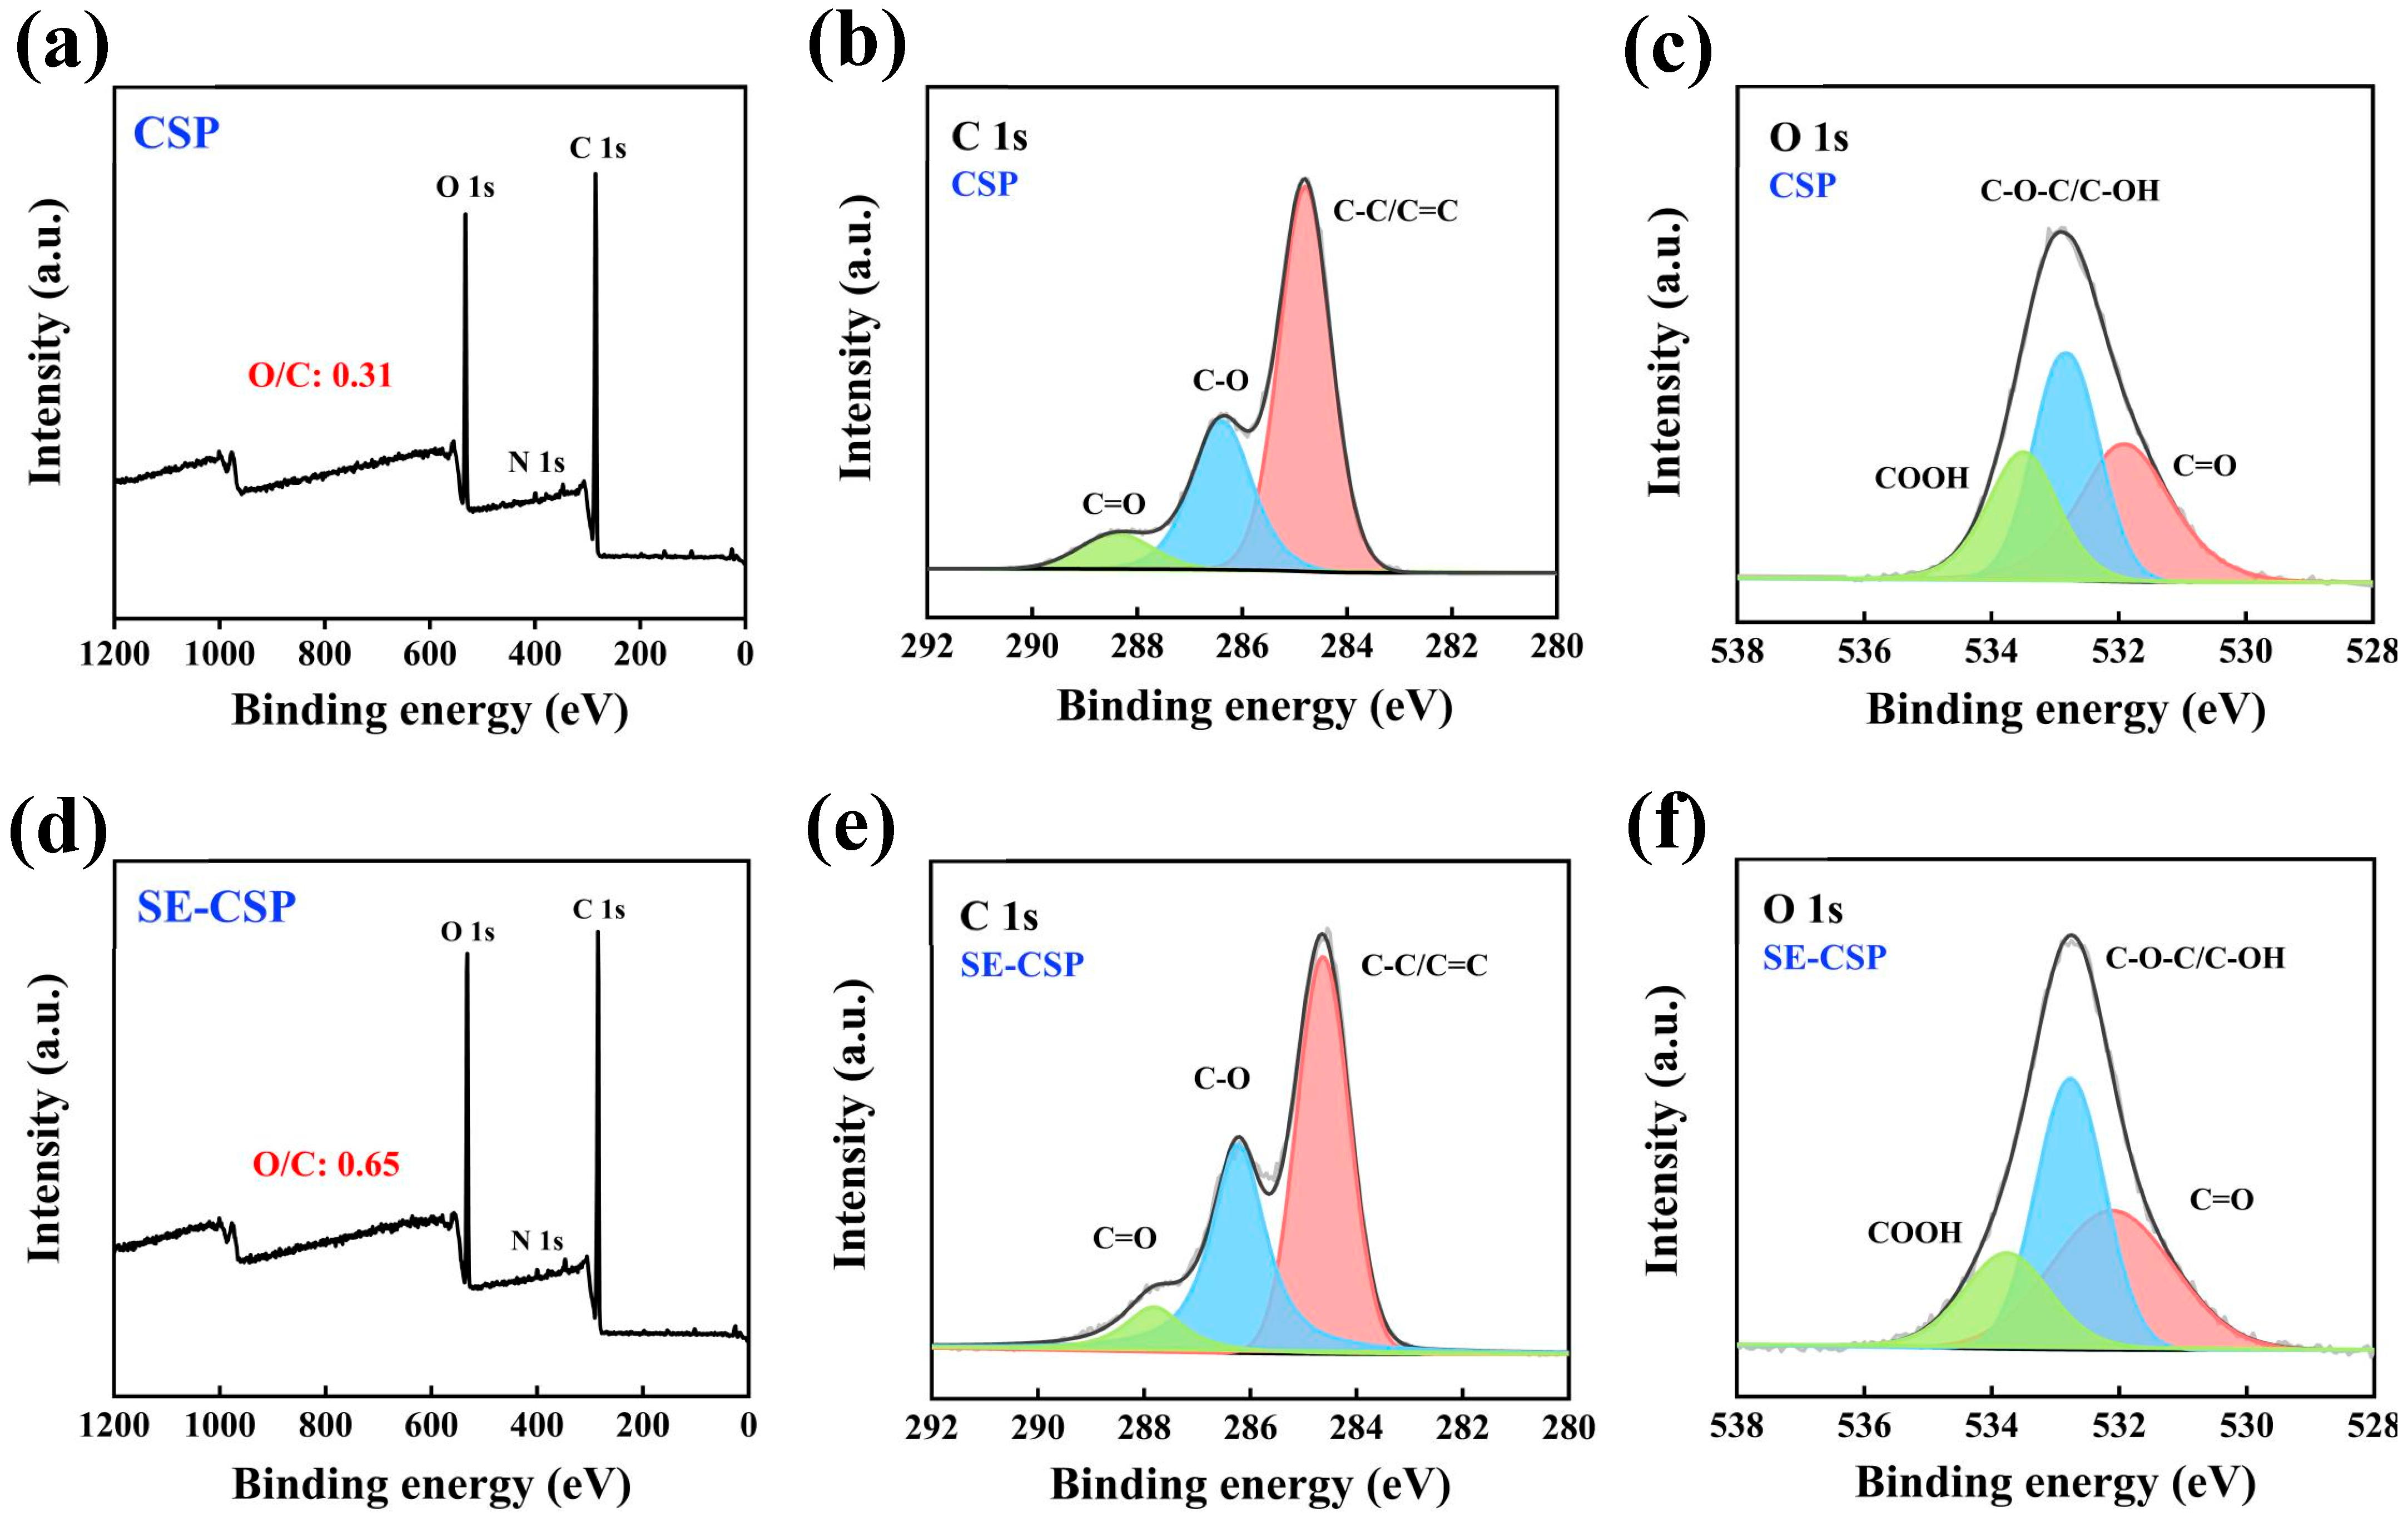
3.6. XPS Analysis
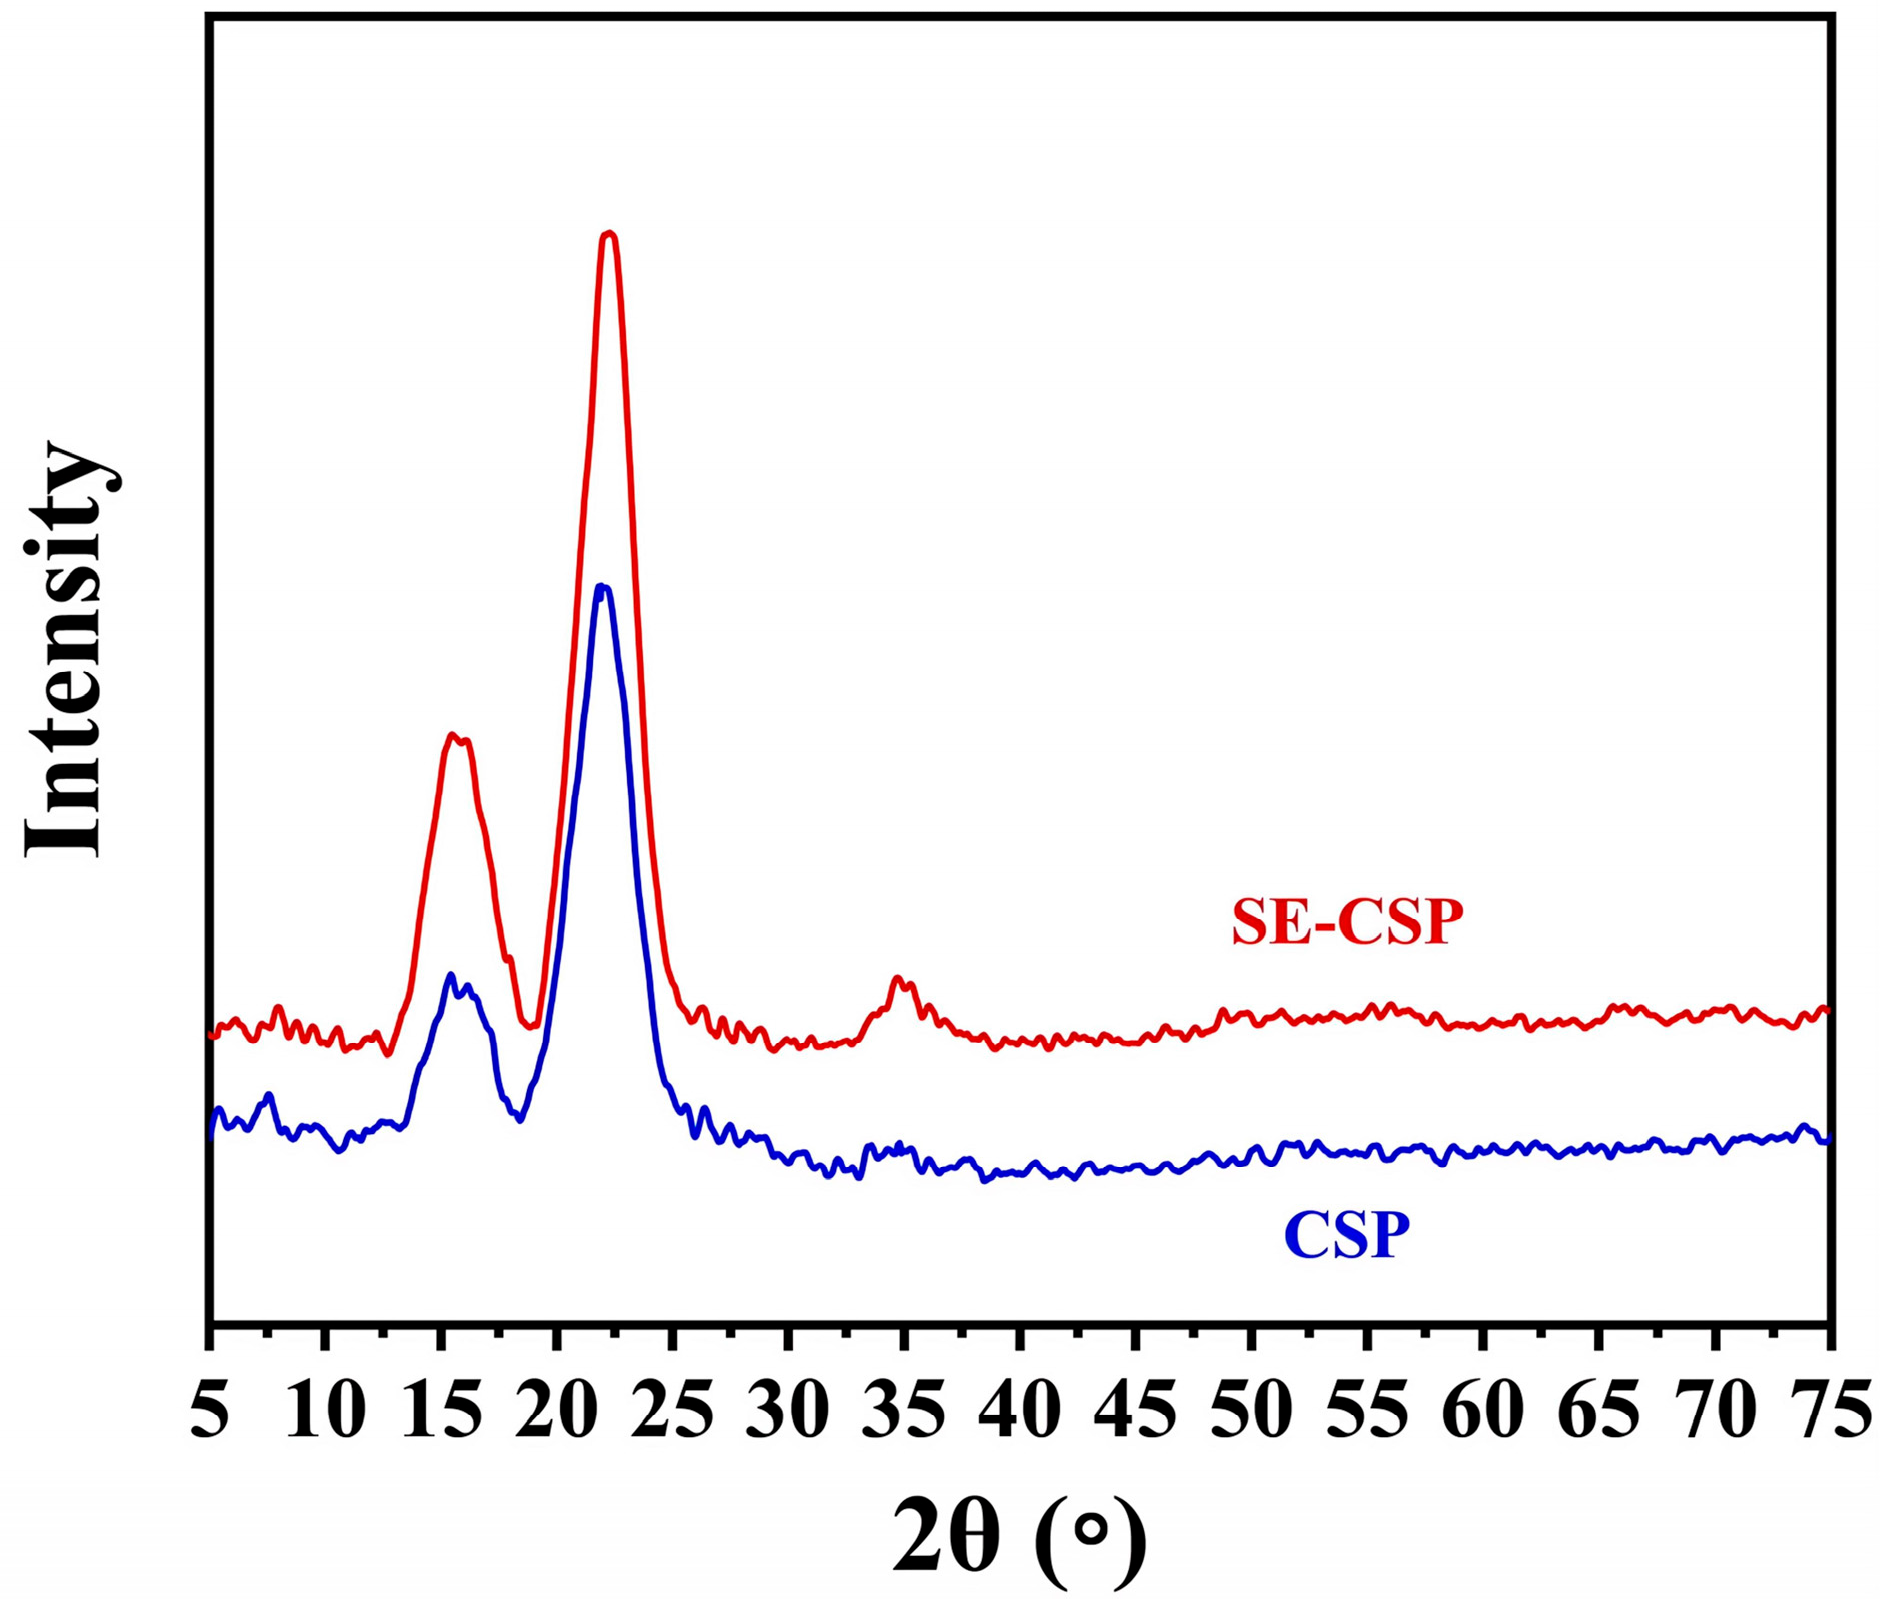
3.7. XRD Analysis
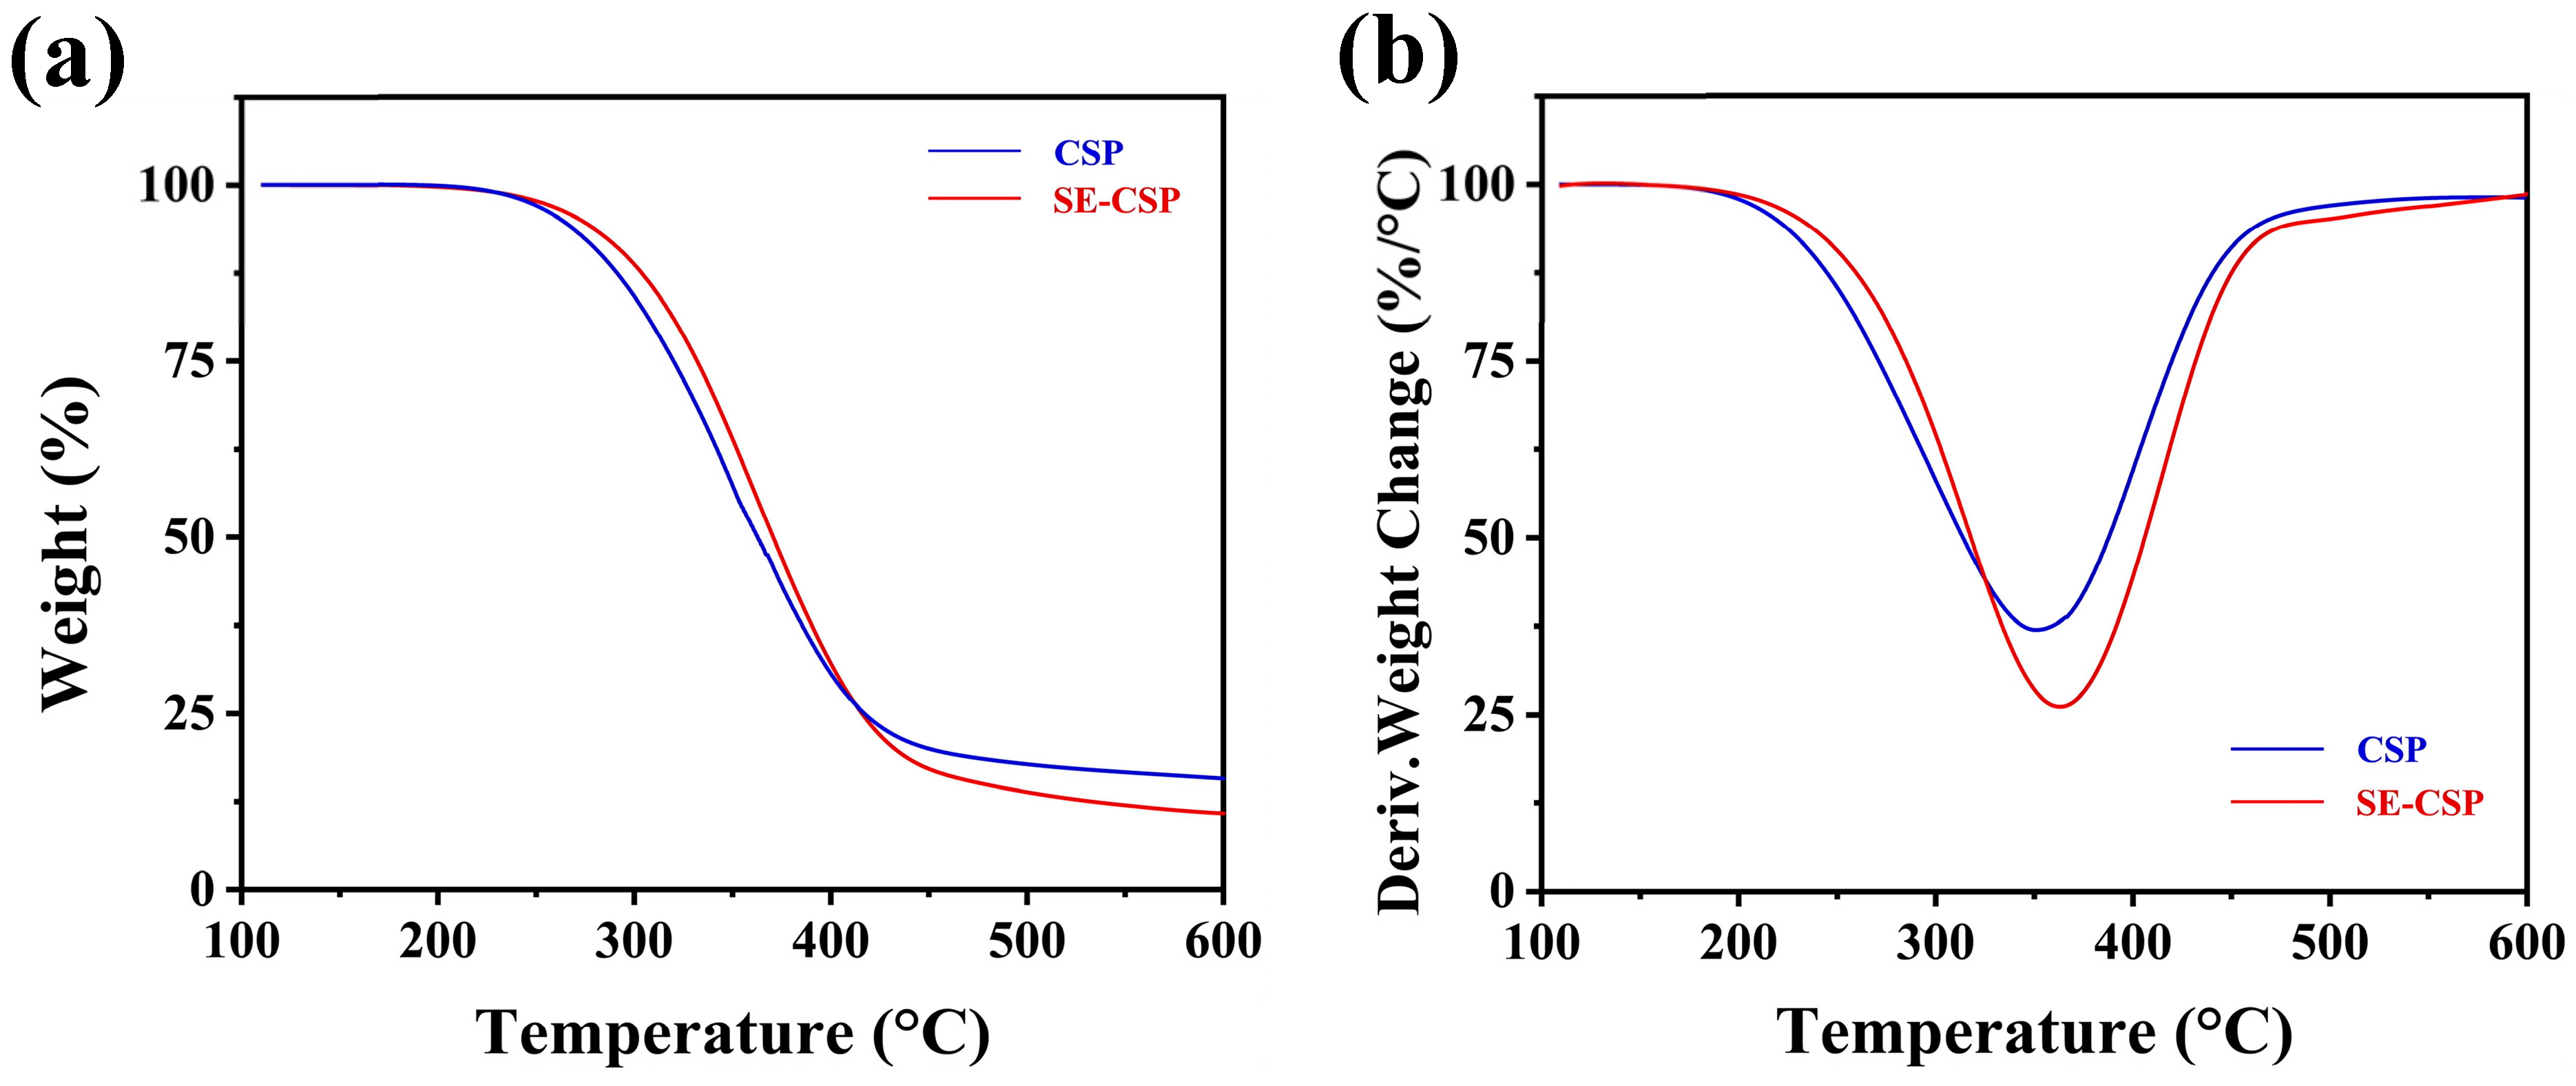
3.8. TGA
3.9. Surface Wettability Analysis
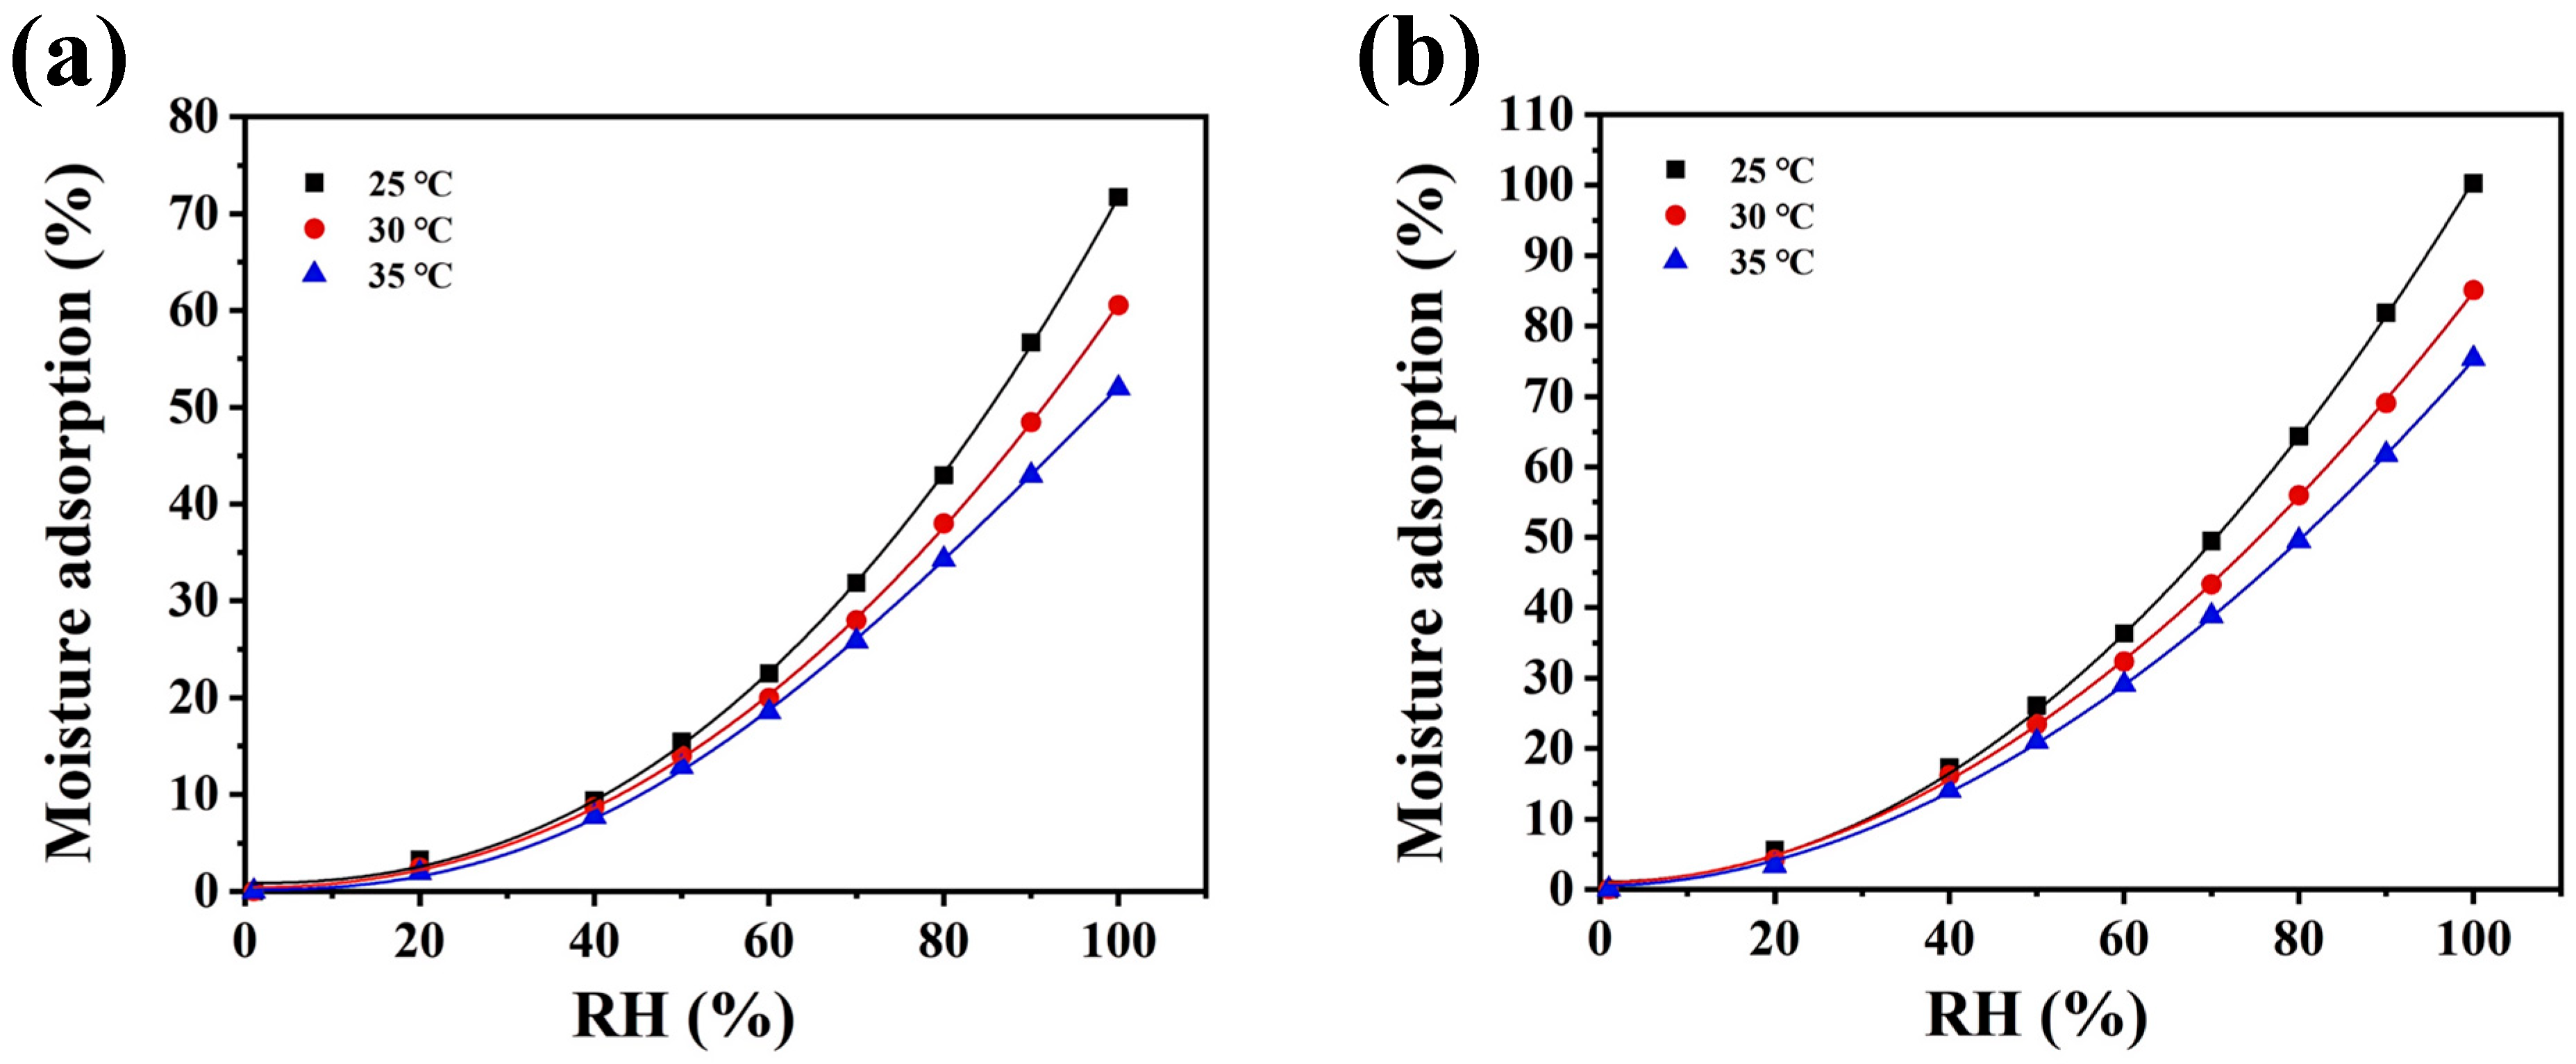
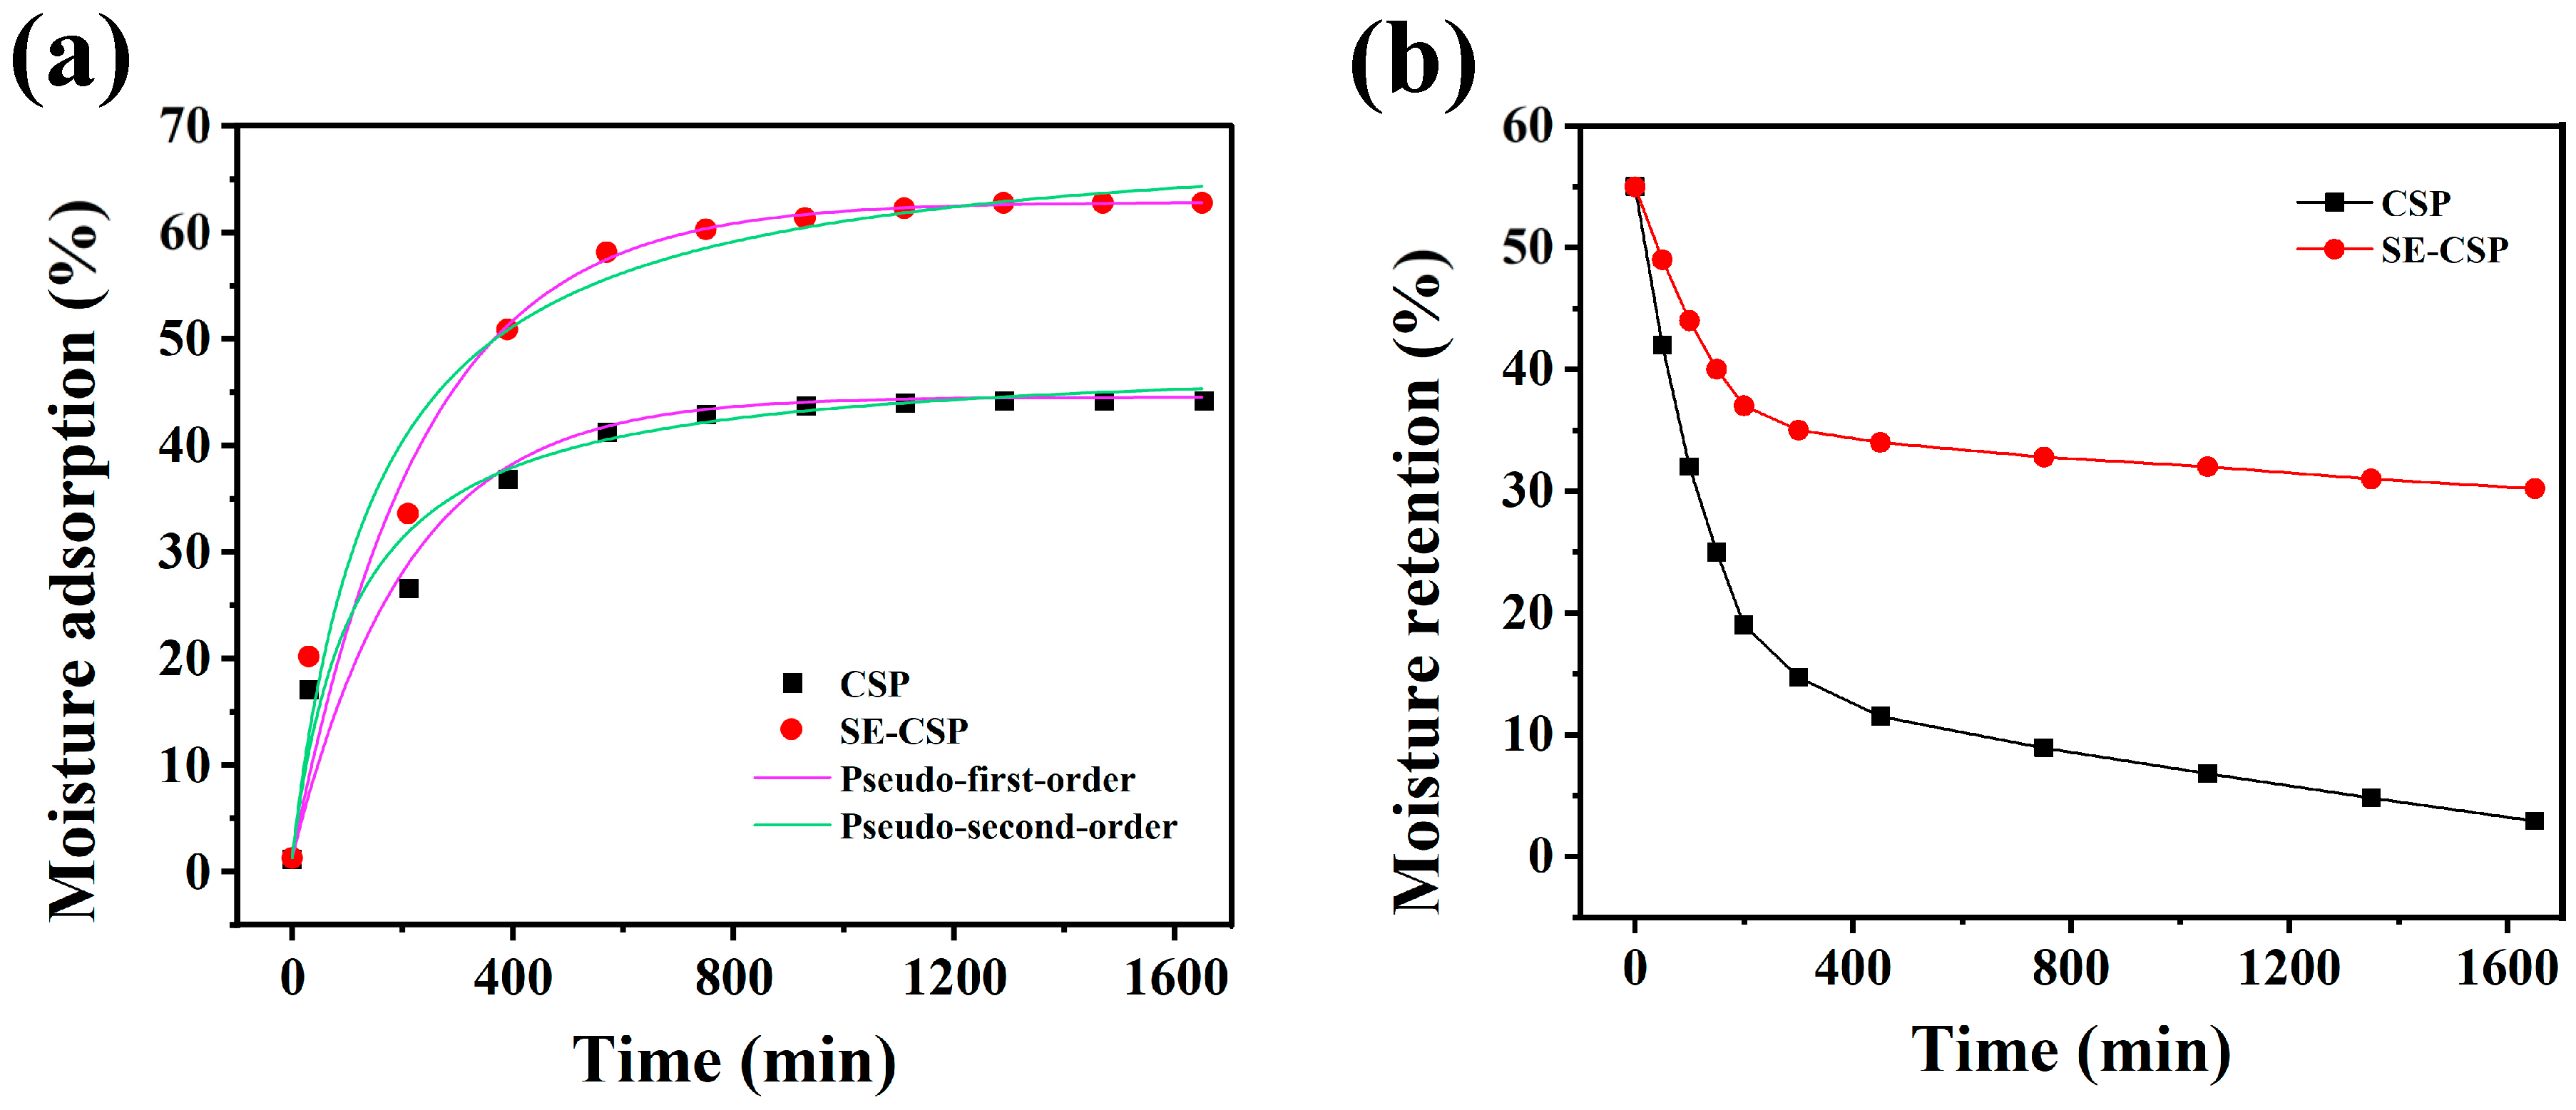
3.10. Moisture Adsorption and Retention Analysis
4. Conclusions
Author Contributions
Funding
Institutional Review Board Statement
Data Availability Statement
Conflicts of Interest
References
- Guo, S.; Wolf, S.D.; Sitti, M.; Serre, C.; Tan, S.C. Hygroscopic Materials. Adv. Mater. 2023, 36, 2311445. [Google Scholar] [CrossRef] [PubMed]
- Hua, Z.P.; Cai, S.S.; Xu, H.Y.; Yuan, W.H.; Li, S.; Tu, Z.K. Investigations of Silica/MOF composite coating and its dehumidification performance on a desiccant-coated heat exchanger. Energy 2024, 307, 132576. [Google Scholar] [CrossRef]
- Jeong, Y.; Sadeghi, K.; Seo, J. Effects of molecular weight of polyethylene glycol on the moisture-absorption capacity and morphology of the channeling structure in desiccant composite. Food Packag. Shelf Life 2023, 37, 101086. [Google Scholar] [CrossRef]
- Kong, F.; Singh, R. Chemical deterioration and physical instability of foods and beverages. In The Stability and Shelf Life of Food; Woodhead Publishing: Cambridge, UK, 2016; pp. 43–76. [Google Scholar] [CrossRef]
- Thu, K.; Mitra, S.; Saha, B.B.; Murthy, S.S. Thermodynamic feasibility evaluation of hybrid dehumidification–mechanical vapour compression systems. Appl. Energy 2018, 213, 31–44. [Google Scholar] [CrossRef]
- Chao, Y.C.; Wang, C.; Zhou, Z.H.; Yang, X.Q.; Du, Y.H.; Liang, Y.; Deng, N.; Liu, J.W. Recent advance of adsorbent materials for indoor dehumidification. Sep. Purif. Technol. 2025, 357, 130096. [Google Scholar] [CrossRef]
- Su, W.; Ma, D.X.; Lu, Z.F.; Jiang, W.X.; Wang, F.; Song, Z.X. A novel absorption-based enclosed heat pump dryer with combining liquid desiccant dehumidification and mechanical vapor recompression: Case study and performance evaluation. Case Stud. Therm. Eng. 2022, 35, 102091. [Google Scholar] [CrossRef]
- Zhang, Y.; Wang, W.N.; Zheng, X.; Cai, J.L. Recent progress on composite desiccants for adsorption-based dehumidification. Energy 2024, 302, 131824. [Google Scholar] [CrossRef]
- Wang, C.; Yang, B.F.; Ji, X.; Zhang, R.; Wu, H.L. Study on activated carbon/silica gel/lithium chloride composite desiccant for solid dehumidification. Energy 2022, 251, 123874. [Google Scholar] [CrossRef]
- Rajamani, M.; Maliyekkal, S.M. Chitosan reinforced boehmite nanocomposite desiccant: A promising alternative to silica gel. Carbohydr. Polym. 2018, 194, 245–251. [Google Scholar] [CrossRef]
- Garofalo, E.; Scarfato, P.; Maio, L.D.; Protopapa, A.; Incarnato, L. Zeolites as effective desiccants to solve hygroscopicity issue of postconsumer mixed recycled polyolefins. J. Clean. Prod. 2021, 295, 126379. [Google Scholar] [CrossRef]
- Zendehboudi, A.; Angrisani, G.; Li, X.T. Parametric studies of silica gel and molecular sieve desiccant wheels: Experimental and modeling approaches. Int. Commun. Heat Mass Transf. 2018, 91, 176–186. [Google Scholar] [CrossRef]
- Bhowmik, M.; Giampieri, A.; Bean, J.; Roskilly, A.P.; Ma, Z.W. Feasibility of a heat pump-assisted liquid desiccant system for continuous dehumidification and regeneration in temperate oceanic climatic greenhouses. Energy Convers. Manag. 2025, 323, 119256. [Google Scholar] [CrossRef]
- Li, L.; Chen, Q.F.; Zhao, C.S.; Guo, B.B.; Xu, X.Y.; Liu, T.; Zhao, L.X. A novel chitosan modified magnesium impregnated corn straw biochar for ammonium and phosphate removal from simulated livestock wastewater. Environ. Technol. Innov. 2022, 26, 102519. [Google Scholar] [CrossRef]
- Zhang, C.Y.; Chen, W.H.; Ho, S.H.; Park, Y.K.; Wang, C.Y.; Zhang, Y. Pelletization property analysis of raw and torrefied corn stalks for industrial application to achieve agricultural waste conversion. Energy 2023, 285, 129463. [Google Scholar] [CrossRef]
- Gu, H.M.; Gao, X.; Zhang, H.; Chen, K.L.; Peng, L.C. Fabrication and characterization of cellulose nanoparticles from maize stalk pith via ultrasonic-mediated cationic etherification. Ultrason. Sonochem. 2020, 66, 104932. [Google Scholar] [CrossRef]
- Li, J.Q.; Tang, X.N.; Zhang, H.; Gao, X.; Zhang, S.M.; Tan, T. Adsorption behavior of three-dimensional bio-adsorbent from maize stalk pith for methylene blue. Ind. Crops Prod. 2022, 188, 115717. [Google Scholar] [CrossRef]
- Wu, X.; Liu, Y.L.; Li, M.; Li, B.W.; Mao, X.H.; Wang, Q.K.; Tang, X.N.; Zhang, H.; Peng, L.C.; Gao, X. Sustainable water sterilization by nano-ZnO using anisotropicpolysaccharide columns derived from agro-waste stalk. Chem. Eng. J. 2024, 496, 153757. [Google Scholar] [CrossRef]
- Peng, D.; Li, H.; Li, W.J.; Zheng, L. Biosorbent with superhydrophobicity and superoleophilicity for spilled oil removal. Ecotoxicol. Environ. Saf. 2021, 209, 111803. [Google Scholar] [CrossRef]
- Zhang, L.L.; Liu, Z.Q.; Jiao, D.; Zhang, J.; Wang, S.G.; Zhang, H.; Zhang, Z.F. Natural cornstalk pith as an effective energy absorbing cellular material. J. Bionic Eng. 2021, 18, 600–610. [Google Scholar] [CrossRef]
- Peng, D.; Zhao, J.; Liang, X.J.; Guo, X.T.; Li, H.S. Corn stalk pith-based hydrophobic aerogel for efficient oil sorption. J. Hazard. Mater. 2023, 448, 130954. [Google Scholar] [CrossRef]
- Zhao, L.; Zhao, X.J.; Yang, G.F.; Liu, T.X.; Guo, Q.B.; Zhao, M.M.; Zhao, Q.Z. Physicochemical and emulsification properties of okara-derived soluble dietary fiber modified by steam explosion. Food Hydrocoll. 2024, 152, 109943. [Google Scholar] [CrossRef]
- Yan, J.T.; Li, Y.; Bai, S.Y.; Zheng, J.; Hassan, N.A.; Lu, B.; Hu, A.J. Comparison of structural, physicochemical and functional properties of dried coconut dietary fiber by steam explosion and extrusion modification. Ind. Crops Prod. 2024, 218, 118916. [Google Scholar] [CrossRef]
- Yu, Y.; Wu, J.; Ren, X.Y.; Lau, A.; Rezaei, H.; Takada, M.; Bi, X.T.; Sokhansanj, S. Steam explosion of lignocellulosic biomass for multiple advanced bioenergy processes: A review. Renew. Sustain. Energy Rev. 2022, 154, 111871. [Google Scholar] [CrossRef]
- Sabziparvar, A.; Boulos, L.; Foruzanmehr, M.R. Effect of fiber length and treatments on the hygroscopic properties of milkweed fibers for superabsorbent applications. Environ. Technol. Innov. 2022, 28, 102930. [Google Scholar] [CrossRef]
- Ma, X.F.; Wen, G.H. Development history and synthesis of super-absorbent polymers: A review. J. Polym. Res. 2020, 27, 136. [Google Scholar] [CrossRef]
- Nie, D.C.; Yao, L.Y.; Xu, X.K.; Zhang, Z.; Li, Y.L. Promoting corn stover degradation via sequential processing of steam explosion and cellulase/lactic acid bacteria-assisted ensilage. Bioresour. Technol. 2021, 337, 125392. [Google Scholar] [CrossRef]
- Zhao, C.; Zou, Z.S.; Li, J.S.; Jia, H.L.; Liesche, J.; Fang, H.; Chen, S.L. A novel and efficient bioprocess from steam exploded corn stover to ethanol in the context of on-site cellulase production. Energy 2017, 123, 499–510. [Google Scholar] [CrossRef]
- Bu, Y.X.; Wang, L.; Chen, H.Z. Recalcitrant structure analysis of the enzymatic residues in corn stover pretreated with steam explosion. Ind. Crops Prod. 2024, 222, 119772. [Google Scholar] [CrossRef]
- Bond, J.; Donaldson, L.; Hill, S.; Hitchcock, K. Safranine fluorescent staining of wood cell walls. Biotech. Histochem. 2008, 83, 161–171. [Google Scholar] [CrossRef]
- Chundawat, S.P.S.; Donohoe, B.S.; Sousa, L.D.; Elder, T.; Agarwal, U.P.; Lu, F.C.; Ralph, J.; Himmel, M.E.; Balan, V.; Dale, B.E. Multi-scale visualization and character-ization of lignocellulosic plant cell wall deconstruction during thermochemical pretreatment. Energy Environ. Sci. 2011, 4, 973–984. [Google Scholar] [CrossRef]
- Brunauer, S.; Emmett, P.H.; Teller, E. Adsorption of gases in multimolecularlayers. J. Am. Chem. Soc. 1938, 60, 309–319. [Google Scholar] [CrossRef]
- Barrett, E.; Joyner, L.; Halenda, P. The determination of pore volume and areadistributions in porous substances. I. Computations from nitrogen isotherms. J. Am. Chem. Soc. 1951, 73, 373–380. [Google Scholar] [CrossRef]
- Wang, N.; Fan, H.X.; Wang, J.X.; Wang, H.M.; Liu, T.T. Fabrication and characterization of curcumin-loaded compositenanoparticles based on high-hydrostatic-pressure-treated zein and pectin: Interaction mechanism, stability, and bioaccessibility. Food Chem. 2024, 446, 138286. [Google Scholar] [CrossRef] [PubMed]
- Chen, Y.; Zhang, H.; Feng, X.; Ma, L.; Zhang, Y.H.; Dai, H.X. Lignocellulose nanocrystals from pineapple peel: Preparation, characterization and application as efficient Pickering emulsion stabilizers. Food Res. Int. 2021, 150, 110738. [Google Scholar] [CrossRef]
- Wang, N.; Zheng, D.Y.; He, J.L.; Liu, X.L.; Liu, T.T. Preparation and characterization of a thymol nanoemulsion-loadedmultifunctional sustained-release corn straw cellulose nanocrystal/acetylated starch-based aerogel and its application in chilledmeat preservation. Carbohydr. Polym. 2025, 348, 122758. [Google Scholar] [CrossRef]
- Zhou, P.; Li, X.Z.; Yuan, H.; Zhou, J.; Qu, L.M.; Yang, Y.H.; He, G.; Luo, C.Y. A long-acting hygroscopic and antibacterial composite filler: A new approach to phytoextraction solid residues from Citrus aurantium L. Ind. Crops Prod. 2022, 187, 115505. [Google Scholar] [CrossRef]
- Cui, Y.; Gao, S.Y.; Zhang, R.Y.; Cheng, L.D.; Yu, J.Y. Study on the moisture absorption and thermal properties of hygroscopic exothermic fibers and related interactions with water molecules. Polymers 2020, 12, 98. [Google Scholar] [CrossRef] [PubMed]
- Ocieczek, A.; Zieba, M. Comparison of the sorption properties of fruit powder shampoos using the BET, GAB, and peleg models. ACS Omega 2020, 5, 14354–14359. [Google Scholar] [CrossRef]
- Singh, J.; Suhag, M.; Dhaka, A. Augmented digestion of lignocellulose by steam explosion, acid and alkaline pretreatment methods: A review. Carbohydr. Polym. 2015, 117, 624–631. [Google Scholar] [CrossRef]
- Haddis, D.Z.; Chae, M.; Asomaning, J.; Bressler, D.C. Evaluation of steam explosion pretreatment on the cellulose nanocrystals (CNCs) yield from poplar wood. Carbohydr. Polym. 2024, 323, 121460. [Google Scholar] [CrossRef]
- Chen, X.L.; Yu, J.; Zhang, Z.B.; Lu, C.H. Study on structure and thermal stability properties of cellulose fibers from rice straw. Carbohydr. Polym. 2011, 85, 245–250. [Google Scholar] [CrossRef]
- Yang, R.; Cao, Q.H.; Liang, Y.Y.; Hong, S.; Xia, C.L.; Wu, Y.J.; Li, J.Z.; Cai, L.P.; Sonne, C.; Le, Q.V.; et al. High capacity oil absorbent wood prepared through eco-friendly deep eutectic solvent delignification. Chem. Eng. J. 2020, 401, 126150. [Google Scholar] [CrossRef]
- Kang, X.H.; Zhang, Y.; Li, L.H.; Sun, Y.M.; Kong, X.Y.; Yuan, Z.H. Enhanced methane production from anaerobic digestion of hybrid Pennisetum by selectively removing lignin with sodium chlorite. Bioresour. Technol. 2020, 295, 122289. [Google Scholar] [CrossRef] [PubMed]
- Zhao, S.G.; Li, G.D.; Zheng, N.; Wang, J.Q.; Yu, Z.T. Steam explosion enhances digestibility and fermentation of corn stover by facilitating ruminal microbial colonization. Bioresour. Technol. 2018, 253, 244–251. [Google Scholar] [CrossRef]
- You, X.; Wang, R.H.; Zhu, Y.X.; Sui, W.J.; Cheng, D. Comparison of adsorption properties of a cellulose-rich modified rice husk for the removal of methylene blue and aluminum (III) from their aqueous solution. Ind. Crops Prod. 2021, 170, 113687. [Google Scholar] [CrossRef]
- Su, G.M.; Xiong, J.H.; Li, Q.S.; Luo, S.Y.; Zhang, Y.P.; Zhong, T.H.; Harper, D.P.; Tang, Z.G.; Xie, L.K.; Chai, X.J.; et al. Gaseous formaldehyde adsorption by eco-friendly, porous bamboo carbon microfibers obtained by steam explosion, carbonization, and plasma activation. Chem. Eng. J. 2023, 455, 140686. [Google Scholar] [CrossRef]
- Wang, J.; Zhang, X.Y.; Li, S.Q.; Zhang, T.T.; Sui, W.J.; Zhang, M.; Yang, S.Y.; Chen, H.X. Physical properties, phenolic profile and antioxidant capacity of Java tea (Clerodendranthus spicatus) stems as affected by steam explosion treatment. Food Chem. 2024, 440, 138190. [Google Scholar] [CrossRef]
- Zhao, Y.; Yu, K.; Tian, X.; Sui, W.; Wu, T.; Wang, S.; Jin, Y.; Zhu, Q.M.; Meng, J.; Zhang, M. Combined Modification of Soluble Dietary Fibers from Apple Pomace by Steam Explosion and Enzymatic Hydrolysis to Improve its Structural, Physicochemical and Functional Properties. Waste Biomass Valoriz 2022, 13, 4869–4879. [Google Scholar] [CrossRef]
- Wang, C.G.; Lin, M.F.; Li, Y.B.; Guo, Z.B. Improvement of soluble dietary fiber quality in Tremella fuciformis stem by steam explosion technology: An evaluation of structure and function. Food Chem. 2024, 437, 137867. [Google Scholar] [CrossRef]
- Yang, S.B.; Chen, K.L.; Zhu, Z.L.; Guan, Q.Q.; Zhou, H.J.; He, L. A green pretreatment approach of corn stalk wastes for obtaining micro/nano-cellulose fibers, monosaccharides and lignin fractions. Renew. Energy 2022, 194, 746–759. [Google Scholar] [CrossRef]
- Zhao, W.J.; Zhang, J.; Zhang, W.F.; Yuan, S.F.; Chen, H.; Wu, A.Q. Effect of bamboo unit morphology on the preparation of bamboo fibers by steam explosion. Ind. Crops Prod. 2023, 202, 117066. [Google Scholar] [CrossRef]
- Chen, L.J.; Li, J.B.; Lu, M.S.; Guo, X.M.; Zhang, H.Y.; Han, L.J. Integrated chemical and multi-scale structural analyses for the processes of acid pretreatment and enzymatic hydrolysis of corn stover. Carbohydr. Polym. 2016, 141, 1–9. [Google Scholar] [CrossRef] [PubMed]
- Wang, W.S.; Yang, S.Q.; Zhang, A.P.; Yang, Z.L. Preparation and properties of novel corn straw cellulose–based superabsorbent with water-retaining and slow-release functions. J. Appl. Polym. Sci. 2020, 137, 48951. [Google Scholar] [CrossRef]
- Kostic, M.; Milosevic, M.; Obradovic, B.M.; Korica, M.; Vesel, A.; Ivanovska, A.; Kuraica, M.; Svirčev, Z. Aging effect on surface chemistry and sorption properties of atmospheric pressure plasma treated lignocellulosic jute fibers. Carbohydr. Polym. 2024, 342, 122374. [Google Scholar] [CrossRef]
- Yang, Y.L.; Cannon, F.S. Biomass activated carbon derived from pine sawdust with steam burstingpretreatment; perfluorooctanoic acid and methylene blue adsorption. Bioresour. Technol. 2022, 344, 126161. [Google Scholar] [CrossRef]
- Chundawat, S.P.S.; Venkatesh, B.; Dale, B.E. Effect of particle size based separation of milled corn stover on AFEX pretreatment and enzymatic digestibility. Biotechnol. Bioeng. 2007, 96, 219–231. [Google Scholar] [CrossRef]
- Sun, Y.G.; Ma, Y.L.; Wang, L.Q.; Wang, F.Z.; Wu, Q.Q.; Pan, G.Y. Physicochemical properties of corn stalk after treatment using steam explosion coupled with acid or alkali. Carbohydr. Polym. 2015, 117, 486–493. [Google Scholar] [CrossRef]
- Baral, N.R.; Shah, A. Comparative techno-economic analysis of steam explosion, dilutesulfuric acid, ammonia fiber explosion and biological pretreatmentsof corn stover. Bioresour. Technol. 2017, 232, 331–343. [Google Scholar] [CrossRef]
- Khatun, M.H.A.; Wang, L.; Chen, H.Z. High solids all-inclusive polysaccharide hydrolysis of steam-exploded corn pericarp by periodic peristalsis. Carbohydr. Polym. 2020, 246, 116483. [Google Scholar] [CrossRef]
- Wang, T.L.; Xiao, Z.S.; Li, T.G.; Guo, G.; Chen, S.Y.; Huang, X.Q. Improving the quality of soluble dietary fiber from Poria cocos peel residue following steam explosion. Food Chem. X 2023, 19, 100829. [Google Scholar] [CrossRef]
- Bilatto, S.; Marconcini, J.M.; Mattoso, L.H.C.; Farinas, C.S. Lignocellulose nanocrystals from sugarcane straw. Ind. Crops Prod. 2020, 157, 112938. [Google Scholar] [CrossRef]
- Tanpichai, S.; Witayakran, S.; Boonmahitthisud, A. Study on structural and thermal properties of cellulose microfibers isolatedfrom pineapple leaves using steam explosion. J. Environ. Chem. Eng. 2019, 7, 102836. [Google Scholar] [CrossRef]
- Wang, J.; Zhang, X.Y.; Liu, J.Y.; Li, R.L.; Zhou, J.N.; Li, M.Y.; Lu, J.Y.; Zhao, G.Y.; Li, X.; Sui, W.J.; et al. Steam explosion improves extractability, antioxidant activity andα-glucosidase inhibitory activity of the constituents of Java tea (Clerodendranthus spicatus). Innov. Food Sci. Emerg. Technol. 2023, 86, 103350. [Google Scholar] [CrossRef]
- Zhang, T.F.; Gao, J.J.; He, L.X.; He, Z.B.; Yi, S.L. Effects of combined zinc chloride-ultrasound pretreatment and thermal modification on the physicochemical properties of Moso bamboo. J. Taiwan Inst. Chem. Eng. 2021, 126, 223–230. [Google Scholar] [CrossRef]
- Sing, K.S.W.; Everett, D.H.; Haul, R.; Moscou, L.; Pierotti, R.A.; Rouquerol, J. Reporting physical adsorption data for gas/solid systems. Pure Appl. Chem. 1985, 57, 603–619. [Google Scholar] [CrossRef]
- Shen, C.H.; Springer, G.S. Moisture absorption and desorption of composite materials. J. Compos. Mater. 1976, 10, 2–20. [Google Scholar] [CrossRef]
- Comino, F.; Romero, P.E.; Molero, E.; Adana, M.R.d. Experimental evaluation of a 3D printed air dehumidification system developed with green desiccant materials. Appl. Therm. Eng. 2023, 227, 120393. [Google Scholar] [CrossRef]
- Smagin, A. A physically based model for the entire soil water retention curve. Soil Sci. Soc. Am. J. 2025, 89, e70054. [Google Scholar] [CrossRef]
- Lin, G.Y.; Yang, H.P.; Wang, X.H.; Mei, Y.Y.; Li, P.; Shao, J.G.; Chen, H.P. The moisture sorption characteristics and modelling of agricultural biomass. Biosyst. Eng. 2016, 150, 191–200. [Google Scholar] [CrossRef]
- Promis, G.; Dutra, L.F.; Douzane, O.; Tran Le, A.D.; Langlet, T. Temperature-dependent sorption models for mass transfer throughout bio-based building materials. Constr. Build. Mater. 2019, 197, 513–525. [Google Scholar] [CrossRef]
- David, C.Q.Q.; Betsy, R.P.; Betsy, S.R.P.; Yudith, C.Q.Q.; Rolando, F.A.S.; Antonieta, M.Q.; Miriam, C.F.; Aydeé, M.S.R.; Miluska, M.Z.P.; Ybar, G.P.M.; et al. Storage conditions and adsorption thermodynamic properties for purple corn. Foods 2020, 11, 828. [Google Scholar] [CrossRef]
- Hssaini, L.; OuAMbou, R.; Charafi, J.; Idlimam, A.; Lamharrar, A.; Razouk, R.; Hanine, H. Hygroscopic proprieties of fig (Ficus carica L.): Mathematical modelling of moisture sorption isotherms and isosteric heat kinetics. S. Afr. J. Bot. 2020, 8, 1–10. [Google Scholar] [CrossRef]
- Choudhury, D.; Sahu, J.K.; Sharma, G.D. Moisture sorption isotherms, heat of sorption and properties of sorbed water of raw bamboo (Dendrocalamus longispathus) shoots. Ind. Crops Prod. 2011, 33, 211–216. [Google Scholar] [CrossRef]
- Ahmad, M.; Manzoor, K.; Venkatachalam, P.; Ikram, S. Kinetic and thermodynamic evaluation of adsorption of Cu(II) by thiosemicarbazide chitosan. Int. J. Biol. Macromol. 2016, 92, 910–919. [Google Scholar] [CrossRef]
- Wang, H.Y.; Wang, B.D.; Li, J.H.; Zhu, T.L. Adsorption equilibrium and thermodynamics of acetaldehyde/acetone on activated carbon. Sep. Purif. Technol. 2019, 209, 535–541. [Google Scholar] [CrossRef]
- Zhou, P.; Lin, S.Y.; Yu, L.L.; Tao, S.Q.; Song, G.L.; Yao, J.X.; Peng, Z. Synthesis of tannin-immobilized cellulose and its adsorption properties for berberine hydrochloride. J. Macromol. Sci. 2021, 58, 90–96. [Google Scholar] [CrossRef]
- Zhang, Z.S.; Li, X.D.; Jia, H.J.; Liu, Y.L. Moisture sorption isotherms and thermodynamic properties of tiger nuts: An oil-rich tuber. LWT-Food Sci. Technol. 2022, 167, 113866. [Google Scholar] [CrossRef]
- Ahmed, G.H.G.; Alshandoudi, L.M.; Awad, A.M.; Shaltout, W.A.; Hassan, A.F. High-performance copper terephthalic acid metal-organic framework/gum Arabic/carrageenan composite beads for efficient lead(II) removal from aqueous solutions. Int. J. Biol. Macromol. 2024, 282, 137448. [Google Scholar] [CrossRef]


| Model | Model Equations |
|---|---|
| GAB | |
| Oswin | |
| Smith | |
| Peleg | |
| Pseudo-first-order | |
| Pseudo-second-order |
| Total Dry Weight (% w/w) | ||
|---|---|---|
| CSP | SE-CSP | |
| Cellulose | 61.55 ± 1.55 a | 79.45 ± 2.23 b |
| Hemicellulose | 26.04 ± 1.86 a | 15.42 ± 2.03 b |
| Lignin | 12.41 ± 1.15 a | 5.13 ± 0.93 b |
| Parameter | CSP | SE-CSP |
|---|---|---|
| Specific surface area (m2/g) | 7.69 ± 1.07 a | 33.96 ± 1.84 b |
| Pore volume (cm3/g) | 0.03 ± 0.01 a | 0.05 ± 0.01 b |
| Region | Functional Group | CSP | SE-CSP | ||
|---|---|---|---|---|---|
| Binding Energy (eV) | Relative Content (%) | Binding Energy (eV) | Relative Content (%) | ||
| C 1s | C–C/C=C | 284.71 | 62.72 ± 2.21 a | 284.71 | 51.84 ± 1.58 b |
| C–O | 286.40 | 29.32 ± 1.96 a | 286.40 | 39.10 ± 1.24 b | |
| C=O | 288.41 | 7.96 ± 0.75 a | 288.41 | 9.06 ± 0.69 b | |
| O 1s | C=O | 531.92 | 35.63 ± 2.55 a | 531.92 | 38.09 ± 2.02 b |
| C−O−C/C−OH | 532.90 | 39.52 ± 1.43 a | 532.90 | 41.72 ± 2.01 b | |
| COOH | 533.50 | 24.85 ± 1.02 a | 533.50 | 20.19 ± 0.96 b | |
| Model | Samples | CSP | SE-CSP | ||||
|---|---|---|---|---|---|---|---|
| T/°C | 25 | 30 | 35 | 25 | 30 | 35 | |
| GAB | R2 | 0.9996 | 0.9994 | 0.9997 | 0.9997 | 0.9992 | 0.9997 |
| Residual sum of squares (RSS) | 0.72465 | 0.80924 | 0.43278 | 0.45688 | 1.25312 | 0.41499 | |
| Oswin | R2 | 0.9233 | 0.9478 | 0.9150 | 0.9378 | 0.9413 | 0.9407 |
| RSS | 86.8218 | 57.8938 | 105.3512 | 70.4709 | 54.0246 | 50.2566 | |
| Smith | R2 | 0.9764 | 0.9823 | 0.9503 | 0.9645 | 0.9733 | 0.9780 |
| RSS | 42.3156 | 30.0099 | 73.4073 | 60.1222 | 44.9087 | 42.8163 | |
| Peleg | R2 | 0.9998 | 0.9997 | 0.9992 | 0.9995 | 0.9998 | 0.9999 |
| RSS | 0.2342 | 0.2710 | 0.3896 | 0.3044 | 0.2367 | 0.2103 | |
| Samples | ΔS (kJ/mol·K) | ΔH (kJ/mol) | ΔG (kJ/mol) | ||
|---|---|---|---|---|---|
| 298 K | 303 K | 308 K | |||
| CSP | −0.042 | −16.81 | −4.29 | −4.08 | −3.87 |
| SE-CSP | −0.048 | −19.32 | −5.02 | −4.78 | −4.54 |
| Samples | qe-exp (%) | Pseudo-First-Order | Pseudo-Second-Order | ||||
|---|---|---|---|---|---|---|---|
| qe (%) | k1 (1/min) | R2 | qe (%) | k2 (g/mg·min) | R2 | ||
| CSP | 44.01 | 45.00 | 0.0047 | 0.9844 | 45.14 | 0.0002 | 0.9321 |
| SE-CSP | 62.50 | 62.67 | 0.0045 | 0.9723 | 64.21 | 0.0001 | 0.9506 |
Disclaimer/Publisher’s Note: The statements, opinions and data contained in all publications are solely those of the individual author(s) and contributor(s) and not of MDPI and/or the editor(s). MDPI and/or the editor(s) disclaim responsibility for any injury to people or property resulting from any ideas, methods, instructions or products referred to in the content. |
© 2025 by the authors. Licensee MDPI, Basel, Switzerland. This article is an open access article distributed under the terms and conditions of the Creative Commons Attribution (CC BY) license (https://creativecommons.org/licenses/by/4.0/).
Share and Cite
Wang, N.; Xia, C.; Liu, T.; Wang, D. Upcycling of Agro-Waste: Research on Performance of a Novel Super-Hygroscopic Material Prepared by Exploiting the Porous Structure of Steam-Exploded Modified Corn Stalk Pith. Polymers 2025, 17, 1779. https://doi.org/10.3390/polym17131779
Wang N, Xia C, Liu T, Wang D. Upcycling of Agro-Waste: Research on Performance of a Novel Super-Hygroscopic Material Prepared by Exploiting the Porous Structure of Steam-Exploded Modified Corn Stalk Pith. Polymers. 2025; 17(13):1779. https://doi.org/10.3390/polym17131779
Chicago/Turabian StyleWang, Nan, Chuntao Xia, Tingting Liu, and Dawei Wang. 2025. "Upcycling of Agro-Waste: Research on Performance of a Novel Super-Hygroscopic Material Prepared by Exploiting the Porous Structure of Steam-Exploded Modified Corn Stalk Pith" Polymers 17, no. 13: 1779. https://doi.org/10.3390/polym17131779
APA StyleWang, N., Xia, C., Liu, T., & Wang, D. (2025). Upcycling of Agro-Waste: Research on Performance of a Novel Super-Hygroscopic Material Prepared by Exploiting the Porous Structure of Steam-Exploded Modified Corn Stalk Pith. Polymers, 17(13), 1779. https://doi.org/10.3390/polym17131779