1. Introduction
Evaluation of the effectiveness of cryogenic insulation, which is frequently used to insulate tanks of liquid oxygen (LO
2) and liquid hydrogen (LH
2) as well as to store and transport liquefied natural gas. Among the various types of cryogenic insulation considered in the works [
1,
2,
3,
4] and others, and considering factors such as heat leaks, protection from water vapour penetration, avoidance of condensation and frost and ice formation, and weight and cost factors, polyurethane and polyisocyanurate foams occupy an important place.
Cryogenic foam insulation must have sufficient mechanical strength and good adhesion to the metal substrate (for sprayed foam). A lower thermal coefficient of linear expansion should help reduce shrinkages and cracking of the insulating material during cooling. Additionally, foam insulation should be dimensionally stable, low-flammable for locations that must adhere to strict fire safety regulations, and highly resistant to corrosion and UV rays, such as in offshore applications [
5].
However, the determining requirement for cryogenic insulation is the heat leakage rate through the insulation. The thermal conductivity value determines these losses. The thermal conductivity value depends on various factors., i.e., temperature, density of foam and moisture content, and the type of gas contained in foam cells. Therefore, moisture permeability and the associated cryogenic moisture uptake under actual use conditions are essential parameters for cryogenic insulation [
6].
Both thermal conductivity and other properties of polymer foam are not constant and change during ageing and weathering of cryogenic insulation. Therefore, the final stage of cryogenic insulation assessment is environmental exposure testing.
Despite the straightforward theoretical basis of thermal conductivity measurements, their practical execution under cryogenic conditions introduces substantial technical and non-technical challenges, leading to various established experimental configurations for determining effective thermal conductivity. A review of experimental methods on insulation thermal conductivity measurements at cryogenic temperatures is presented in [
7]. Among the numerous steady-state measurements is the Guarded Hot Plate approach. It is based on measuring the electrical power that provides the required temperature gradient between the plates [
8]. The primary idea behind the Boil-off Calorimetry method is to measure the rate at which the cryogenic liquid evaporates or boils off in the tank’s inner chamber in order to calculate heat flow Q [
3,
9,
10,
11]. The tank’s outside is maintained at a higher temperature. A gas flow meter or weight scale is used to measure the boil-off flow rate, which is directly proportional to the energy that the heat of vaporisation transfers through the test specimen.
There was previously little knowledge on how moisture can seep into the foam under significant temperature gradients when one side of the foam is exposed to the temperatures of liquid gases and the other side is exposed to room temperatures and high relative humidity. In order to study this phenomenon, specialised equipment was created. The impact of several variables on the amount of cryogenic moisture absorption was examined in [
6,
12,
13,
14].
This effect becomes most critical when the liquid gas in the tank is hydrogen, and the cryogenic insulation has not only a certain number of open cells, but also various defects in the form of voids or channels. Then this phenomenon is called cryopumping. When a void in a substance or structure is sufficiently cold to densify a contained volume of air gases, this phenomenon is known as cryopumping [
12]. A vacuum is produced as the gases condense; adjacent gases are drawn or pumped into the void if there is a conduit to the surface or adjacent voids. The densified gases expand and are pumped or ejected from the void when the material or structure is heated. The material may sustain the most damage during this cryopumping expansion phase. If the gases are densified into a void, the void is heated quickly, but the flow of gases from the void is constrained, leading to a rapid build-up of pressure; cryopumping can then be problematic for cryogenic materials and structures. The potential for cryopumping may be indicated by high cryogenic water uptake levels.
The EU has defined the goal of increasing energy independence [
15], which logically includes a directive on the promotion of the use of energy from renewable sources [
16] and the hydrogen strategy [
17]. Special emphasis in EU planning documents is placed on Green hydrogen—which is characterised by the fact that it is produced by electrolysers supplied by renewable electricity (and in some cases through other pathways based on bioenergy) [
18]. Hydrogen, as a future fuel, has a clear perspective; in the future, the price of Green hydrogen is expected to decrease from 3–4 USD/kg today to 1–1.5 USD/kg in 2050 [
19]. Initially, the biggest sources of potential for hydrogen applications are the aviation [
20], space [
21], and shipping [
22] industries. Furthermore, hydrogen, including Green hydrogen, production transportation, and storage, faces serious challenges, and the development of perfect cryogenic insulation material for LH
2 storage is crucial, where the smallest details matter.
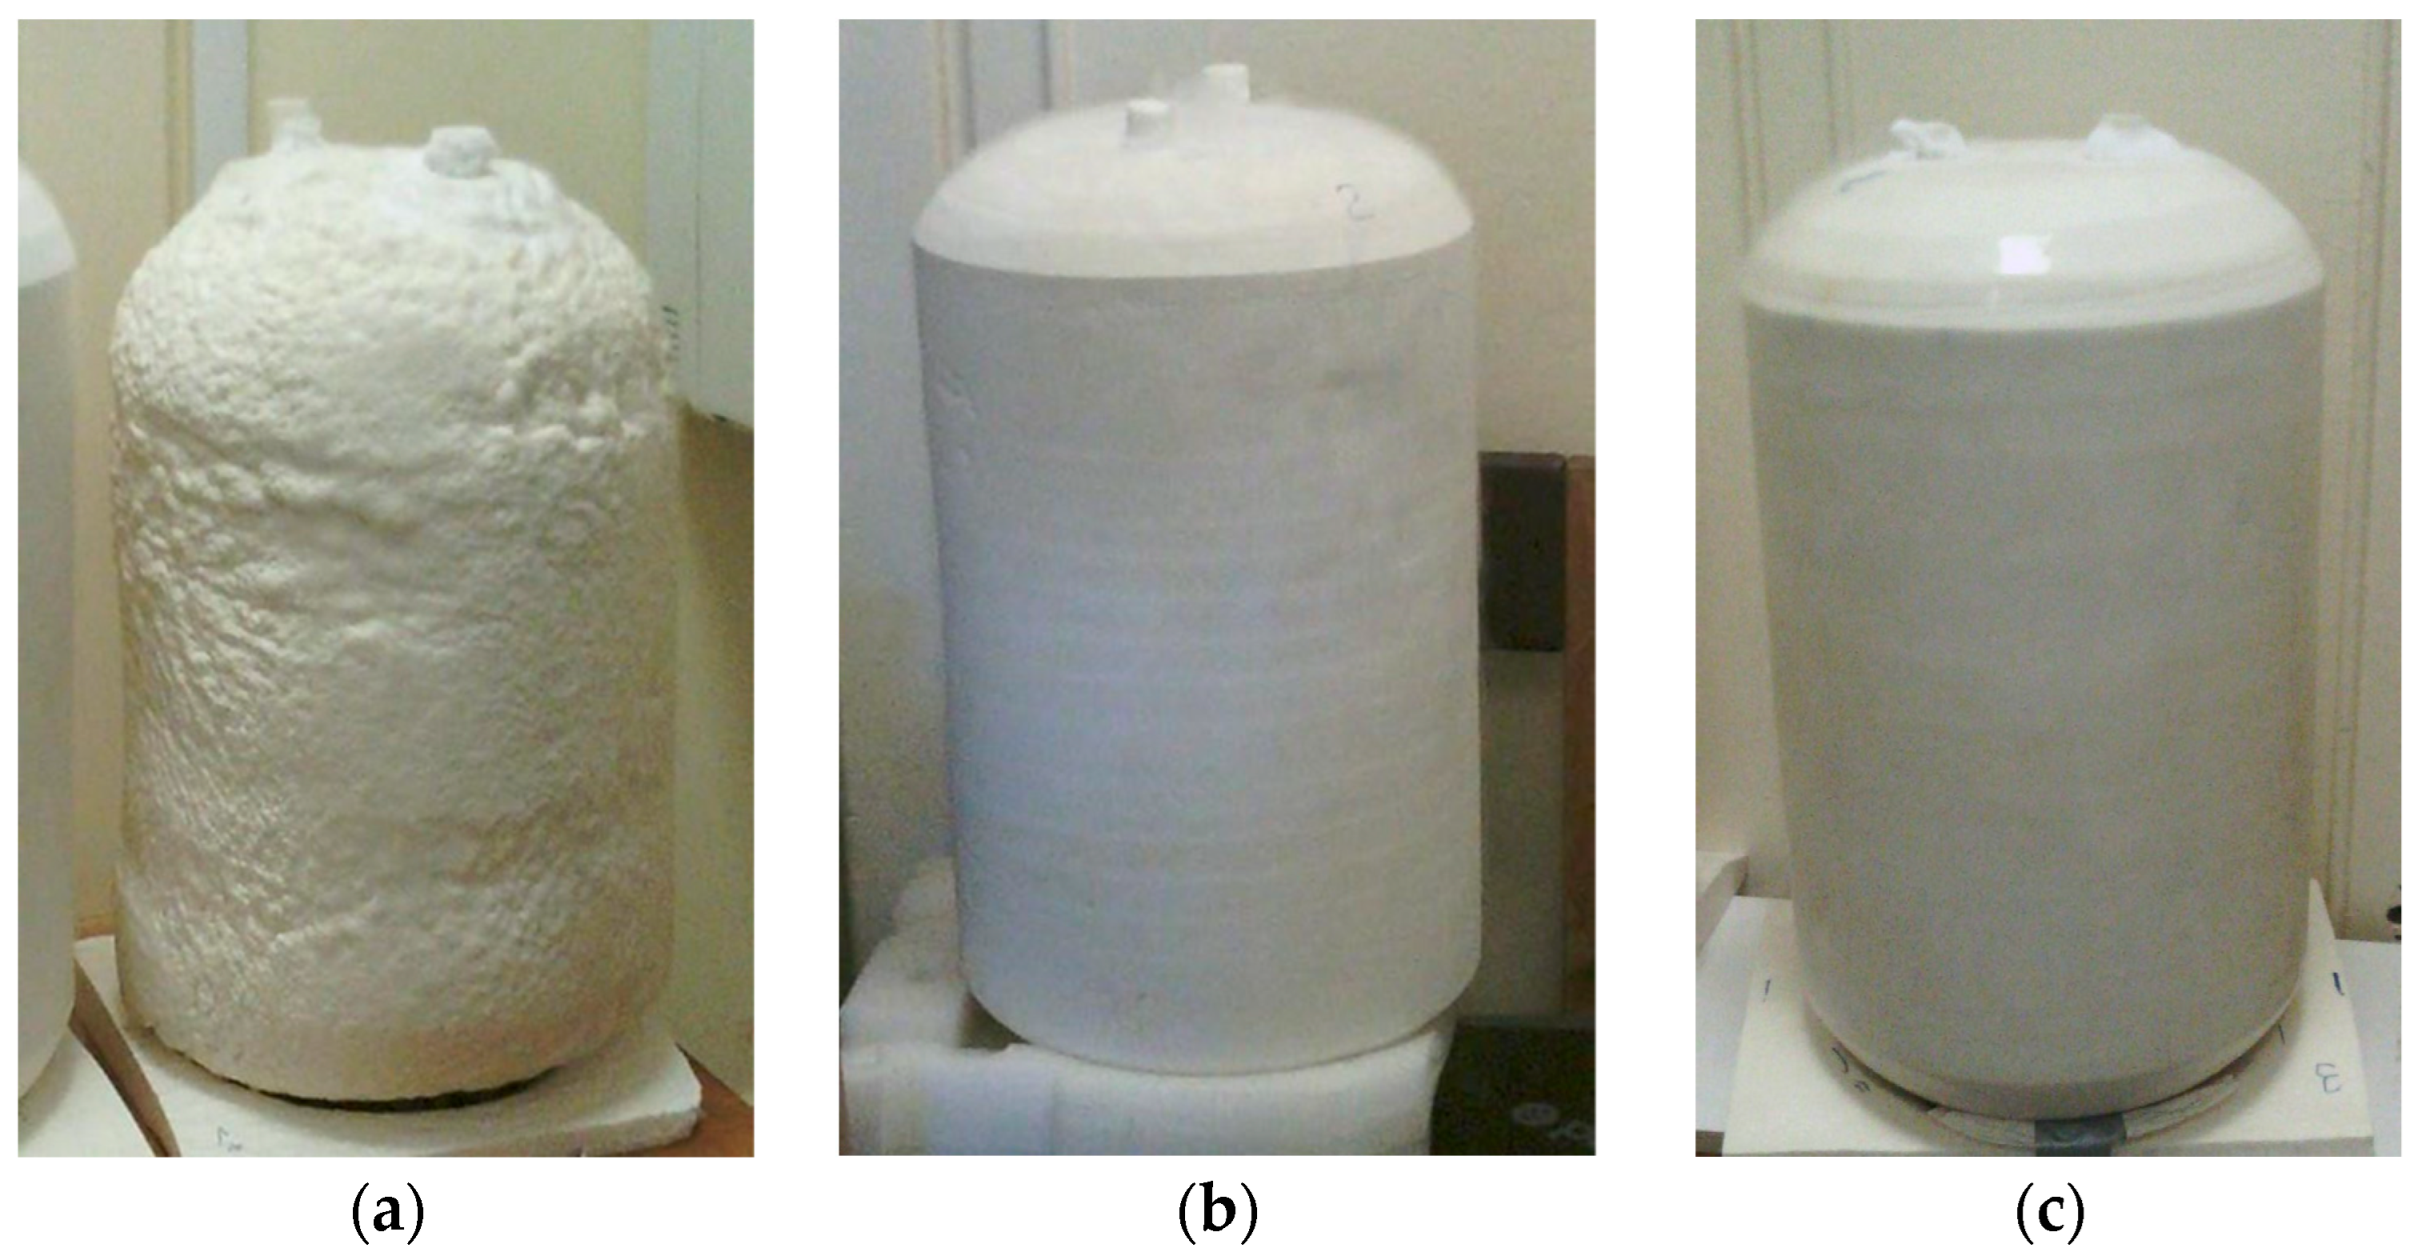
The purpose of this study was to evaluate the behaviour of a rigid polyurethane (PUR) foam spray that was created and applied to experimental aluminium containers that were filled with liquid nitrogen. The effect of the insulation thickness and its surface condition on cryogenic moisture uptake, effective thermal conductivity, and insulation integrity was evaluated.
3. Results and Discussion
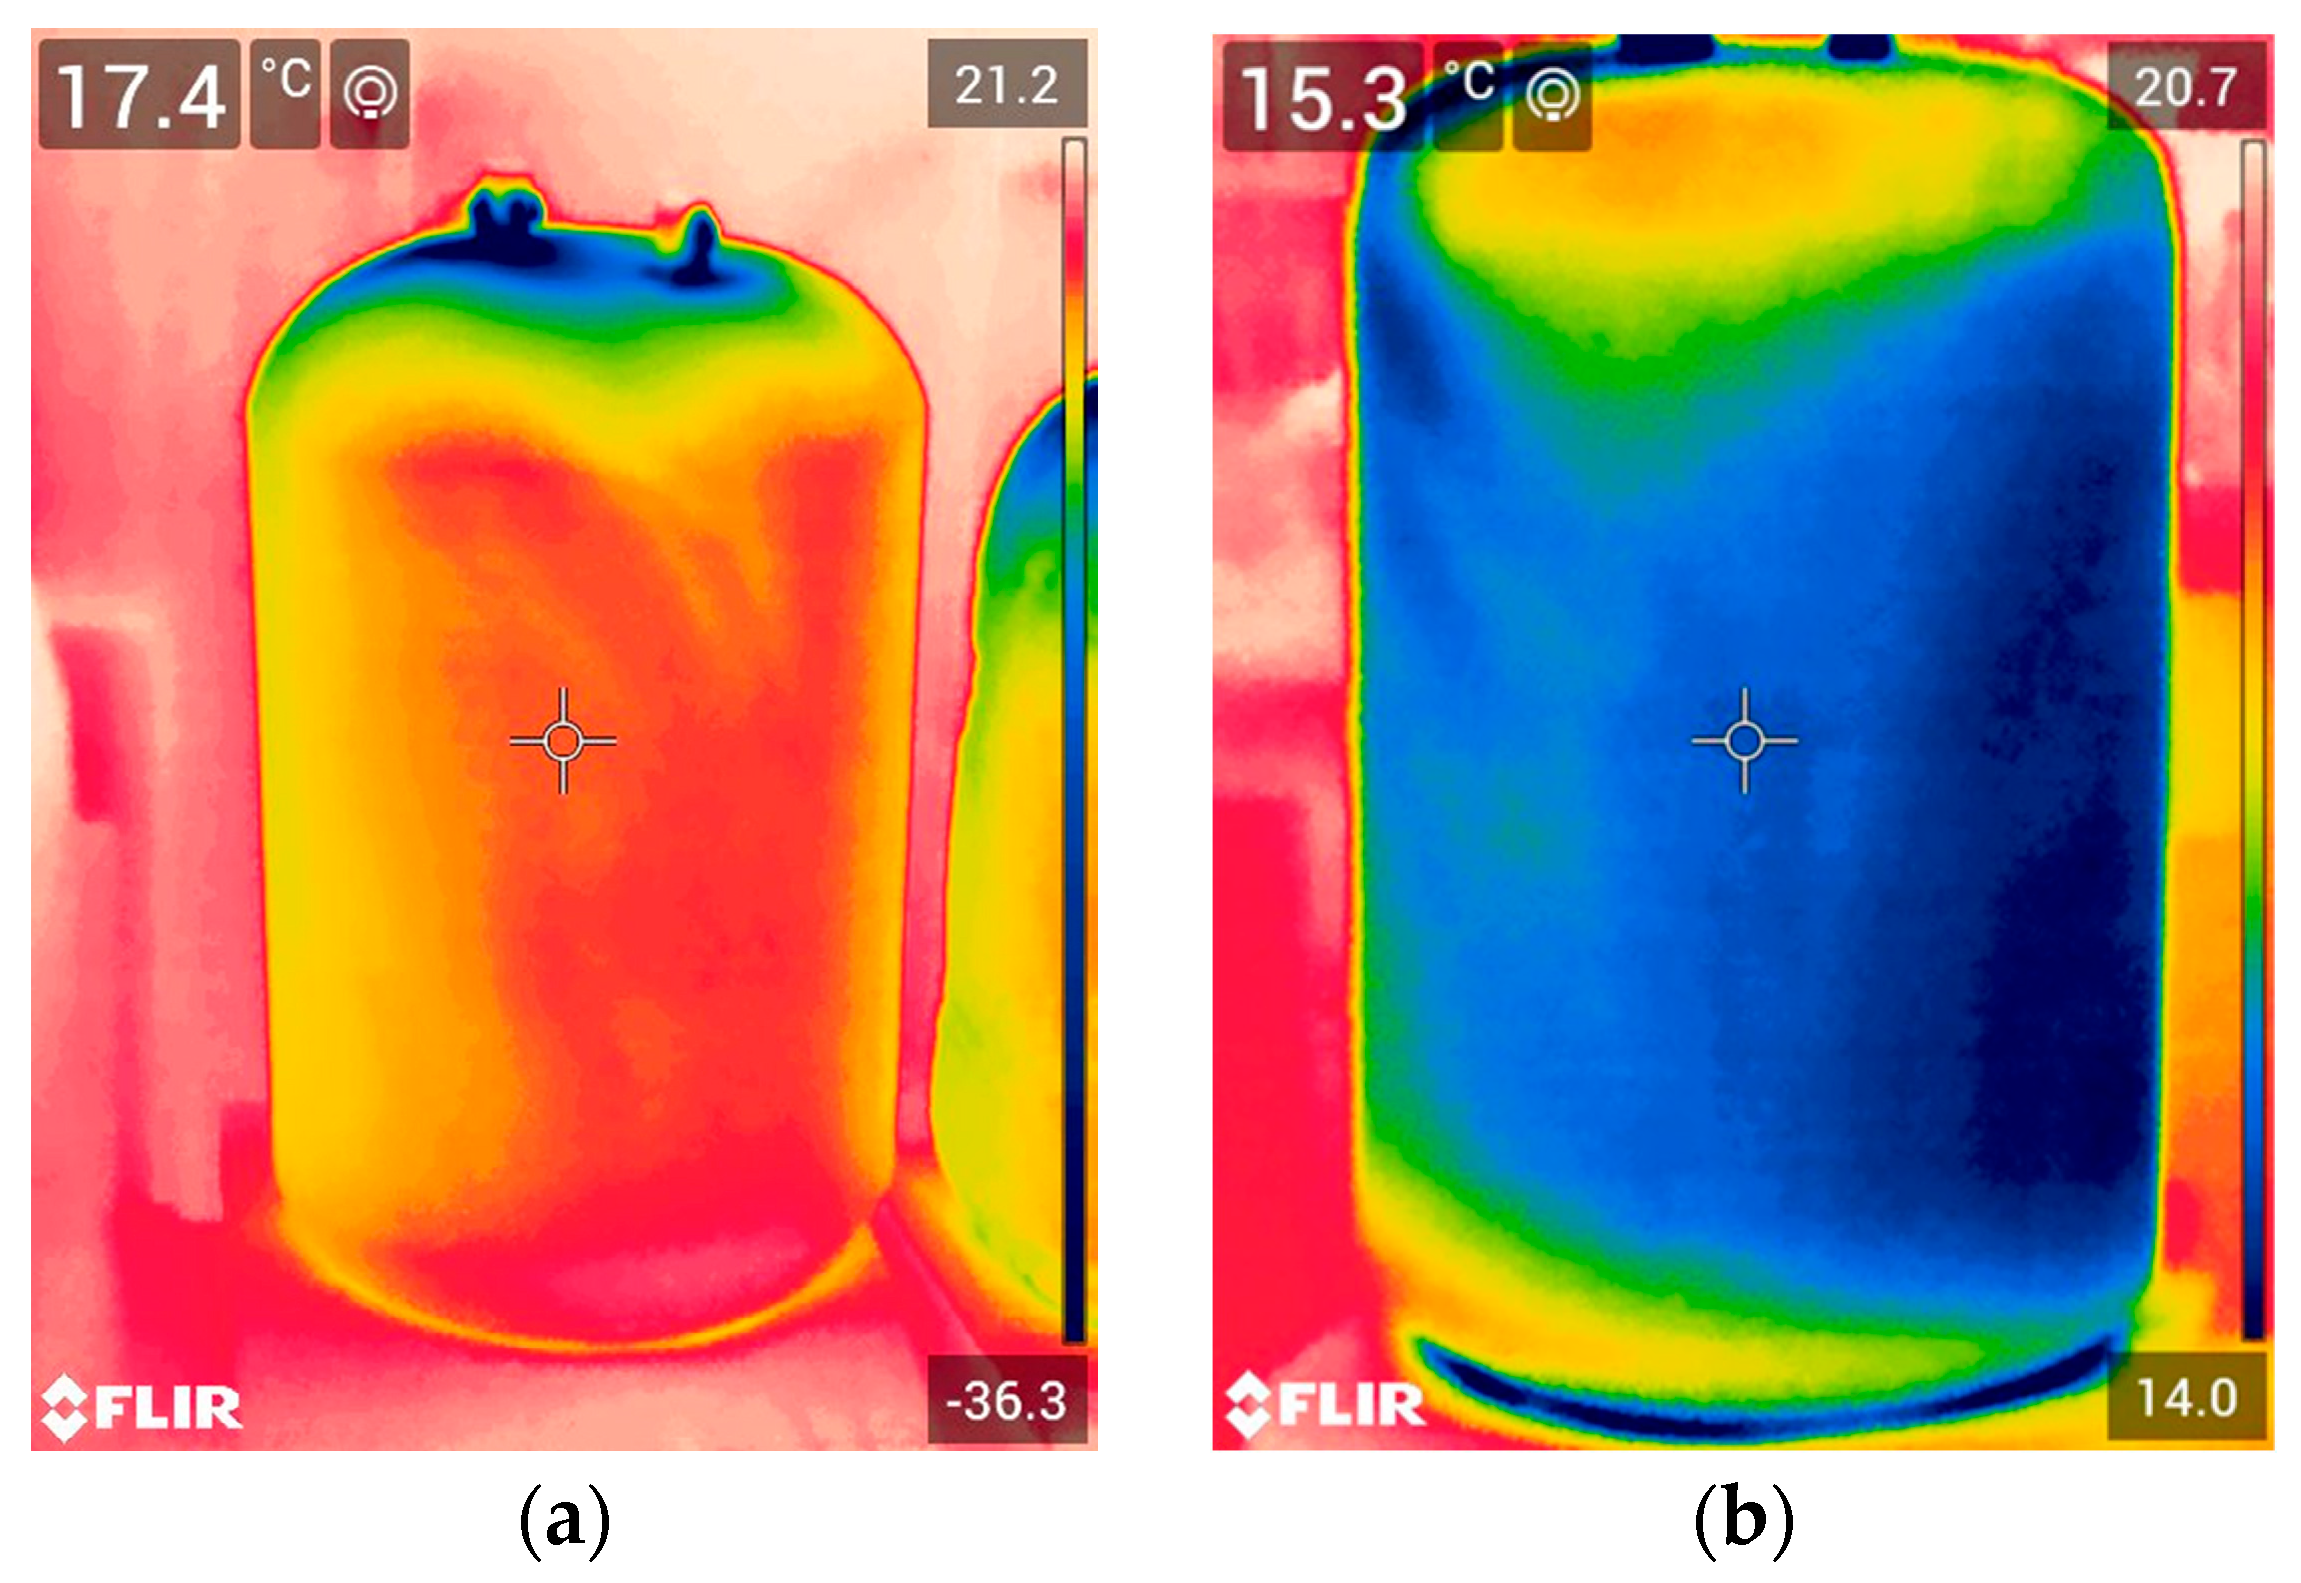
Filling an insulated vessel with liquefied gas is a quality test for any cryogenic insulation. All insulated vessels passed this test and did so repeatedly. During the filling of insulated test vessels, no crackling sound was heard. Both visually and using IR thermal images, control of filled insulated vessels also reveals no defects in the insulated test vessels. Typical IR thermal images of tested vessels filled with LN
2 are presented in
Figure 2. The rest of IR images are in
Figures S1–S5.
As can be seen at the beginning of the test, when the vessels were completely filled, the lower temperature of the upper part of the insulated vessel’s surface allowed air moisture to condense through LN2 evaporation through two non-hermetic, plugged holes. When a significant portion of the LN2 in the vessel evaporated, the temperature of the upper part of the PUR foam insulation surface became slightly higher than the temperature of the insulation surface of the lower part of the vessel, still filled with LN2. This was due to the fact that the upper part of the inner surface was no longer in contact with liquid nitrogen, but only with its vapours.
The surface temperature of the foam insulation of the tanks filled with LN
2 gradually dropped several degrees lower over the course of an hour, compared to the ambient air temperature (22.0 °C). The readings of thermometers with different operating principles are given in
Table 4. There are average values of the temperature at three fillings. Temperatures were measured 1 h after filling of bottles, when, in our opinion, a stable temperature regime was established in an insulated, thermostatically controlled room.
The temperatures measured by the thermocouple differ from those measured by the FLIR IR Camera, because the correct value of the emissivity coefficient for foam surfaces for PUR has not yet been established for the FLIR IR Camera. However, this does not change the trend. The lowest surface temperature was observed in Vessel_40-S, which had the thinnest insulation thickness. The highest surface temperature was found in Vessel_60-S, which had the greatest insulation thickness.
The surface temperature of all insulated vessels was lower than the dew point (18.9 °C) of air with 80% RH. Therefore, air moisture was condensed on the insulation surface. Before weighing the bottles, drops of condensed water were removed with filter paper.
The average amount of moisture absorbed by the PUR foam insulation of the vessels during evaporation of LN
2 from three tests is given in
Table 5. The higher quantity of absorbed moisture by Vessel_60-S may be explained by the longest time of liquid nitrogen evaporation from the test vessels (34 h). Vessel_50-R also had a higher value of moisture uptake because it was difficult to remove condensed drops of water from the uneven surface of the foam.
However, considering the thickness and mass of the applied PUR foam, the insulation of vessel B, which had the smallest thickness, exhibited the greatest cryogenic moisture uptake (10.4%). The insulation of Vessel_60-S, with the greatest thickness, adsorbed less moisture in percentage terms than other vessels without protective coatings. This is in a certain agreement with the data of [
29], which indicates that the moisture adsorbed by the insulation is primarily concentrated in the layer closest to the surface of the foam insulation. Only a small amount of moisture penetrates deep into the insulation layer.
The insulation of test Vessel_55-C, covered with urea coating, practically did not absorb moisture. On the other hand, on the smooth surface of the coating, the moisture in the air condensed well, and drops of it flowed down the vertical surface during the test.
Since all foam insulation materials are somewhat permeable to gases and water vapours, even high-quality, closed-cell polyurethane foams can retain water in actual insulated vessel applications. The accumulation of water due to water vapour driving into the foam in the presence of a temperature gradient, as well as the thermophysical transport mechanisms of vapour drive, condensation, and ice formation within foam insulation subjected to cold boundary conditions, are covered in [
18,
19] and other sources. In our instance, the absorption of water condensed on the PUR foam insulation’s surface complemented the effects of the gas permeability of the foam and the condensation of water vapour inside the foam.
Since the duration of the experiment was relatively short and the accumulated amount of moisture was not so great, after the test, all absorbed moisture evaporated within three days at room temperature and an air humidity of 50% RH. When the insulated vessel was refilled with LN2, the insulated vessel had the same mass as before the first test. With this duration of the experiment, no cumulative effect of moisture accumulation was observed.
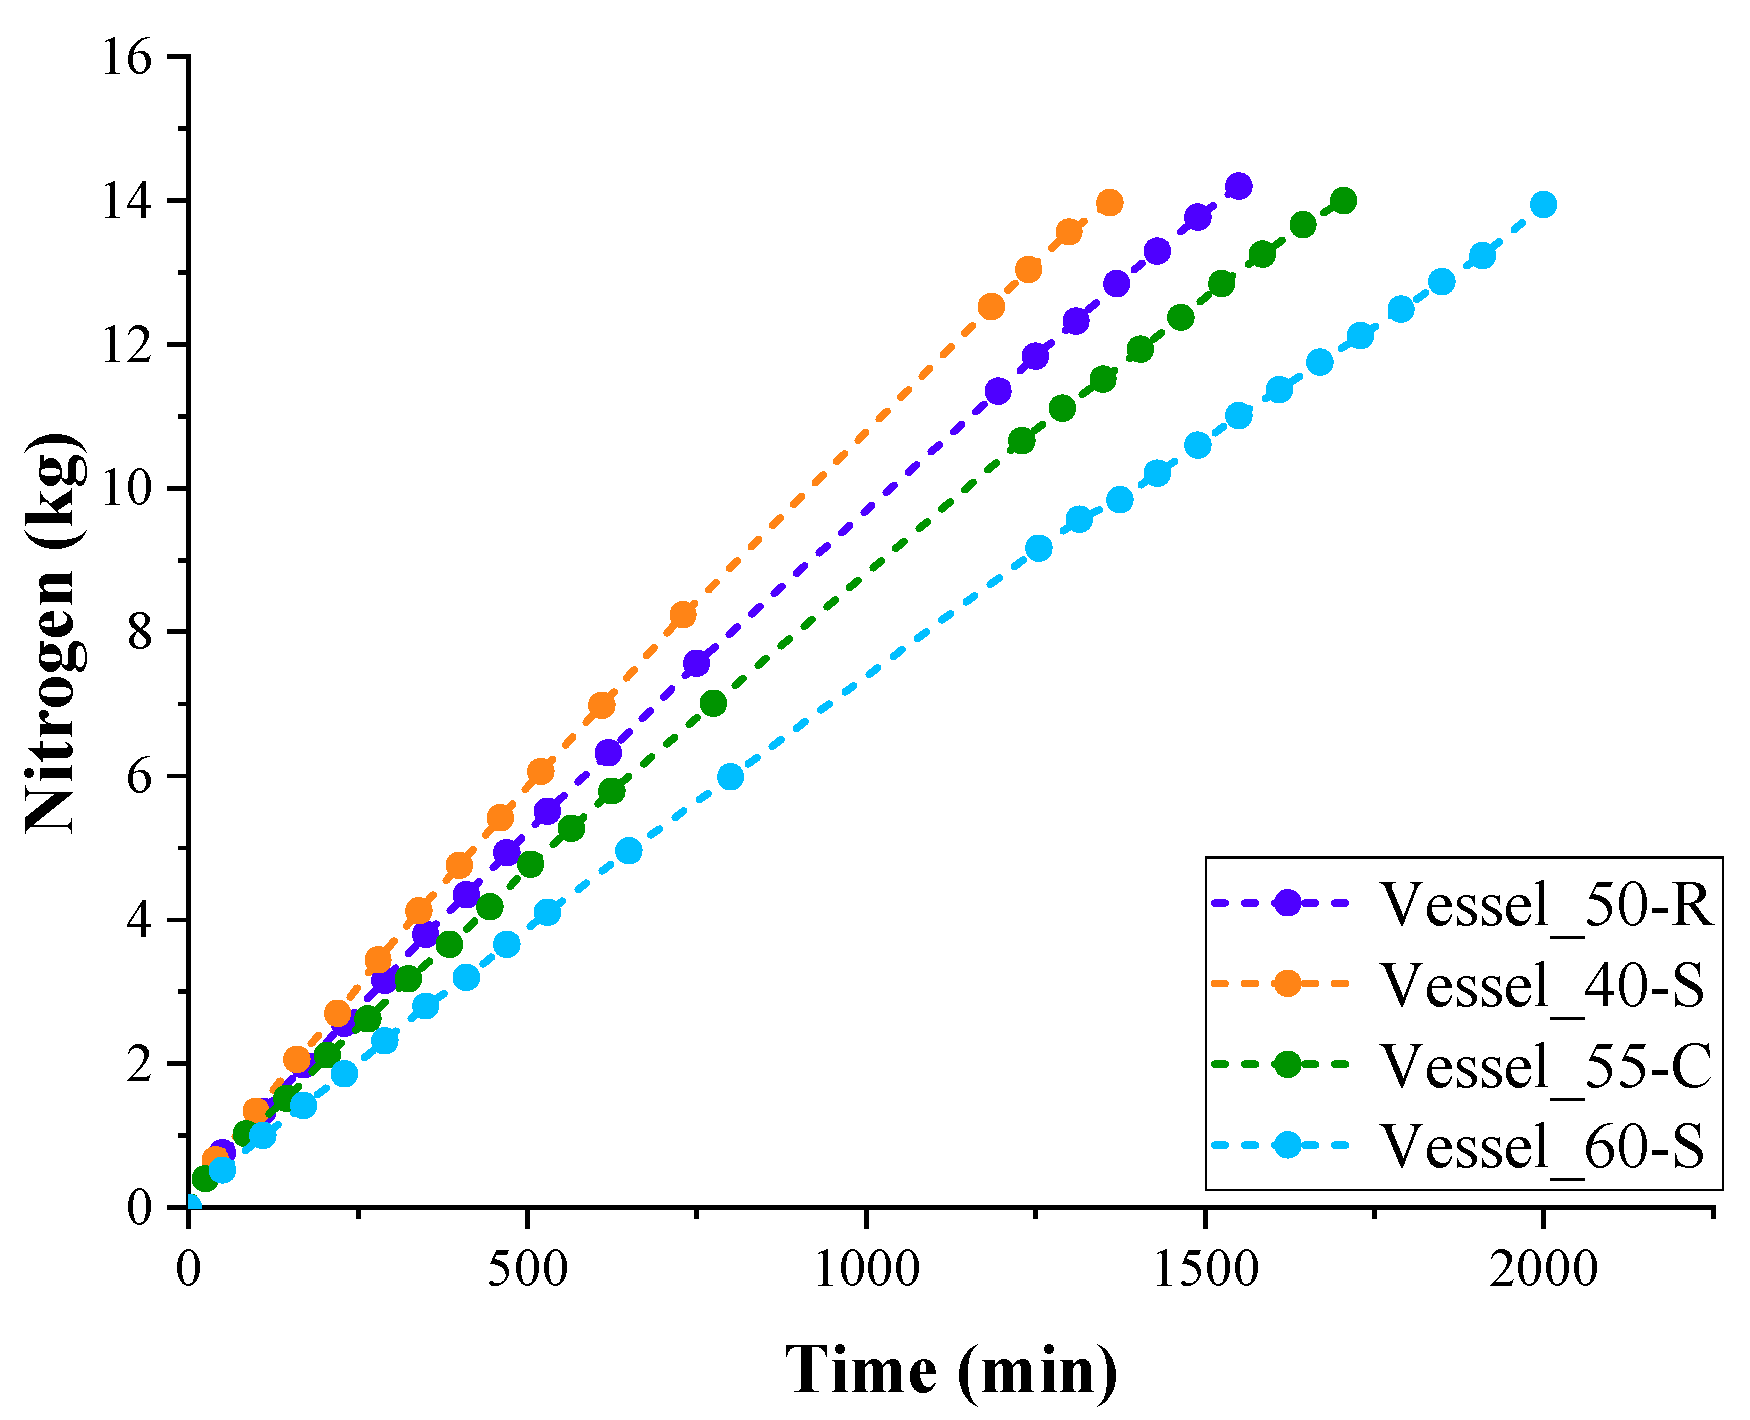
When filling the test vessel with LN2, the aluminium vessel first cooled rapidly, accompanied by violent boiling of the LN2. With an average mass of these containers of 3.57 kg and an average heat capacity of aluminium of 800 J/(kg∙K) in the temperature range of 77–293 K, at least 3.2 kg of LN2 was required to cool the vessel. Filling the vessel, accompanied by boiling of nitrogen, continued until the intensity of nitrogen evaporation, spent on cooling and filling the aluminium vessel, sharply decreased. On average, each vessel was filled with 14 kg of LN2. After placing the filled vessel in a special room, periodic weighing of the vessels with continuously evaporating LN2 began.
LN
2 evaporation curves of insulated test vessels are presented in
Figure 3. The evaporation rate of LN
2 in test Vessel_40-S with thinner PUR foam insulation was highest. The lowest evaporation rate of LN
2 was observed in test Vessel_60-S with the highest PUR foam insulation thickness.
The filling experiments with PUR foam vessels were repeated three times. The average values of evaporation time of LN
2 from the tested vessels filled with 14 kg of LN
2 are listed in
Table 6. As can be seen, the evaporation times of LN
2 from Vessel_50-R and Vessel_55-C with insulation thicknesses of 50 and 55 mm occupy an intermediate position between the evaporation times of LN
2 from Vessel_40-S and Vessel_60-S.
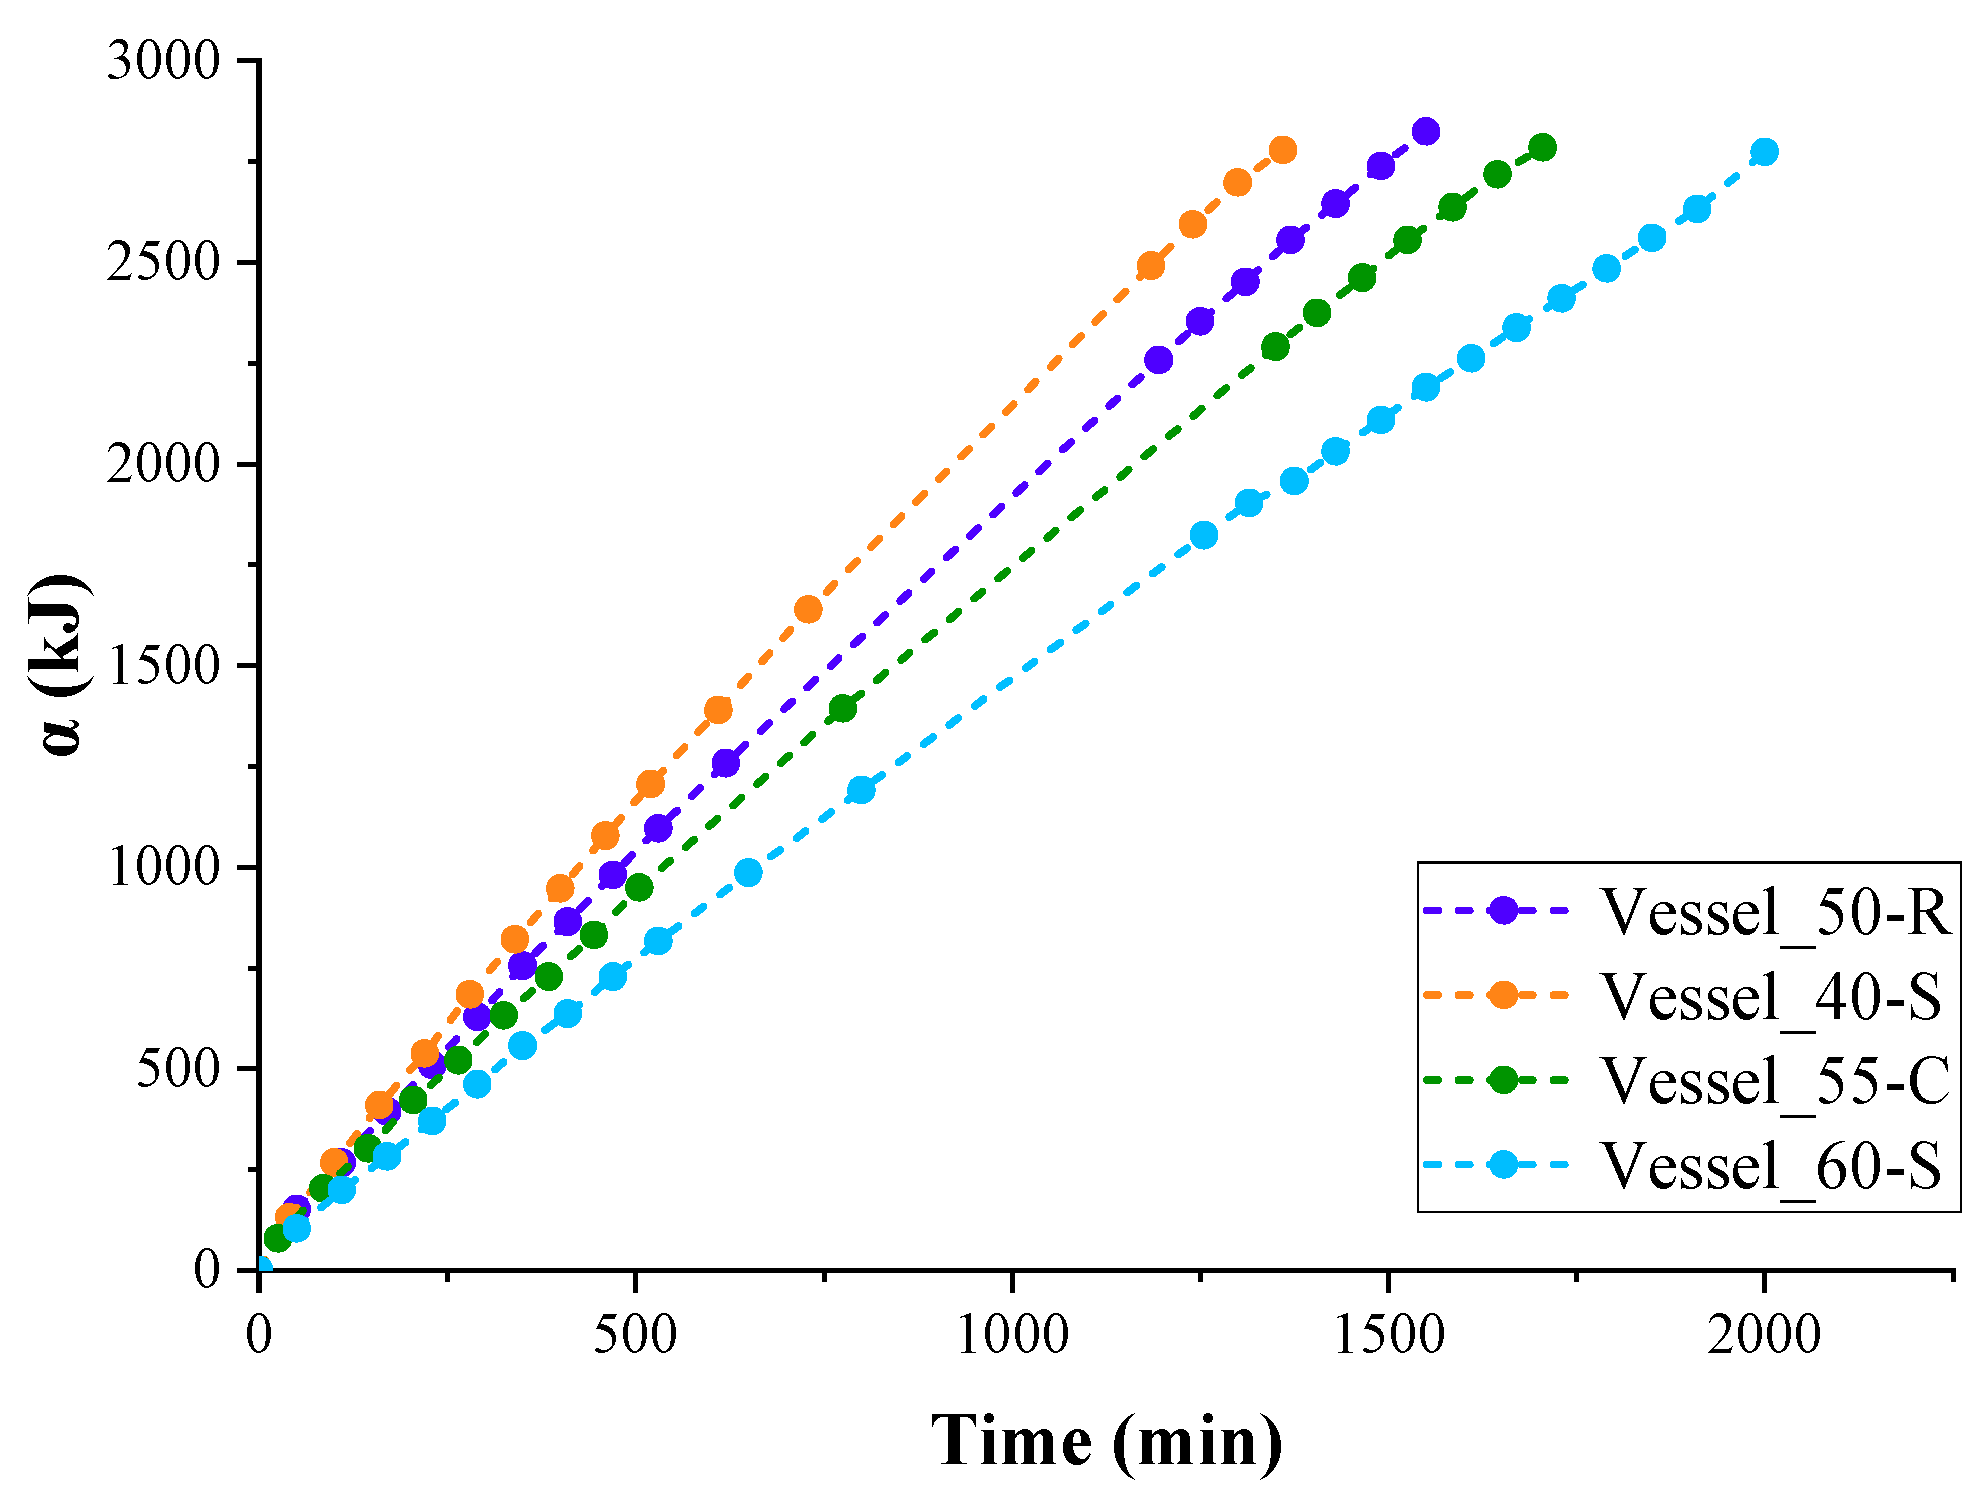
LN
2 receives all the heat necessary for evaporation from the surrounding air due to thermal conductivity, convection, and radiation of air. The total amount of heat received by LN
2 from the surrounding air and transferred by the PUR foam thermal insulation can be calculated when the heat of nitrogen vaporisation is known (5.57 kJ/mol or 198.9 kJ/kg). The curves of the total absorbed heat depending on the time of LN
2 boil-off are shown in
Figure 4.
As follows from the data shown in
Figure 3, the rate of evaporation of LN
2 gradually decreases as the vessels are emptied. Accordingly, the rate of absorption of heat spent on the evaporation of nitrogen decreased (
Figure 4). This occurred because the value of the heat flow absorbed by LN
2 during boiling, in relation to the evaporation surface, decreased as the liquid level in the container decreased.
Additionally, at the beginning of the experiment, all the heat transferred through the insulation and the vessel wall was transferred to the liquid, which had a high thermal conductivity coefficient. Over time, as the vessels emptied, an increasing portion of the heat was transferred to gaseous nitrogen vapours, which have a much lower thermal conductivity. Accordingly, the nitrogen vapours did not heat up as quickly as the liquid due to convection, and further evaporation of nitrogen in the container with saturated nitrogen vapours slowed down.
Analysis of both LN2 evaporation curves and absorption curves showed that second-degree polynomials approximate all experimental curves with a reliability of at least 0.98. Taking this into account, it was possible to calculate the value of the thermal conductivity coefficient of insulation by interpolating the value of the heat flow rate for the first minutes of the experiment, when almost the entire surfaces of both vessels and the insulation participated in the heat exchange process.
In shape, our vessel consisted of a cylinder and two hemispheres. Accordingly, it can be assumed that in the heat exchange process, the effective heat transfer area consists of the surface of the cylinder and the sphere. According to Fourier’s law, the heat flow in the insulation layer is directed from the hot surface to the cold one and is calculated using the thermal conductivity coefficient of the material, its geometric parameters, and the temperature difference. For a cylindrical surface, the heat flow rate (Q) is calculated using formula (1) [
30]:
Equation (1) shows that the temperature changes logarithmically across the thickness of a cylindrical wall, unlike a flat wall, where its profile is linear. This is because, with an increasing radius, the surface through which heat is transferred increases; i.e., the specific heat flow (related to the area) decreases with increasing radius.
The temperature field in a spherical wall with a constant thermal conductivity coefficient obeys the hyperbolic law. Therefore, the heat flow rate passing through a spherical insulation, W, is equal to (2) [
31]:
Summing these two flows, we obtain Equation (3):
where
Q—heat flow rate,
λ—thermal conductivity coefficient,
d1—internal diameter of cylinder and sphere,
d2—outer diameter of cylinder and sphere,
L—length of cylinder, and
T1 and
T2—temperature of internal and outer surfaces of insulation.
The thermal conductivity coefficient of the insulation is easily calculated from this equation.
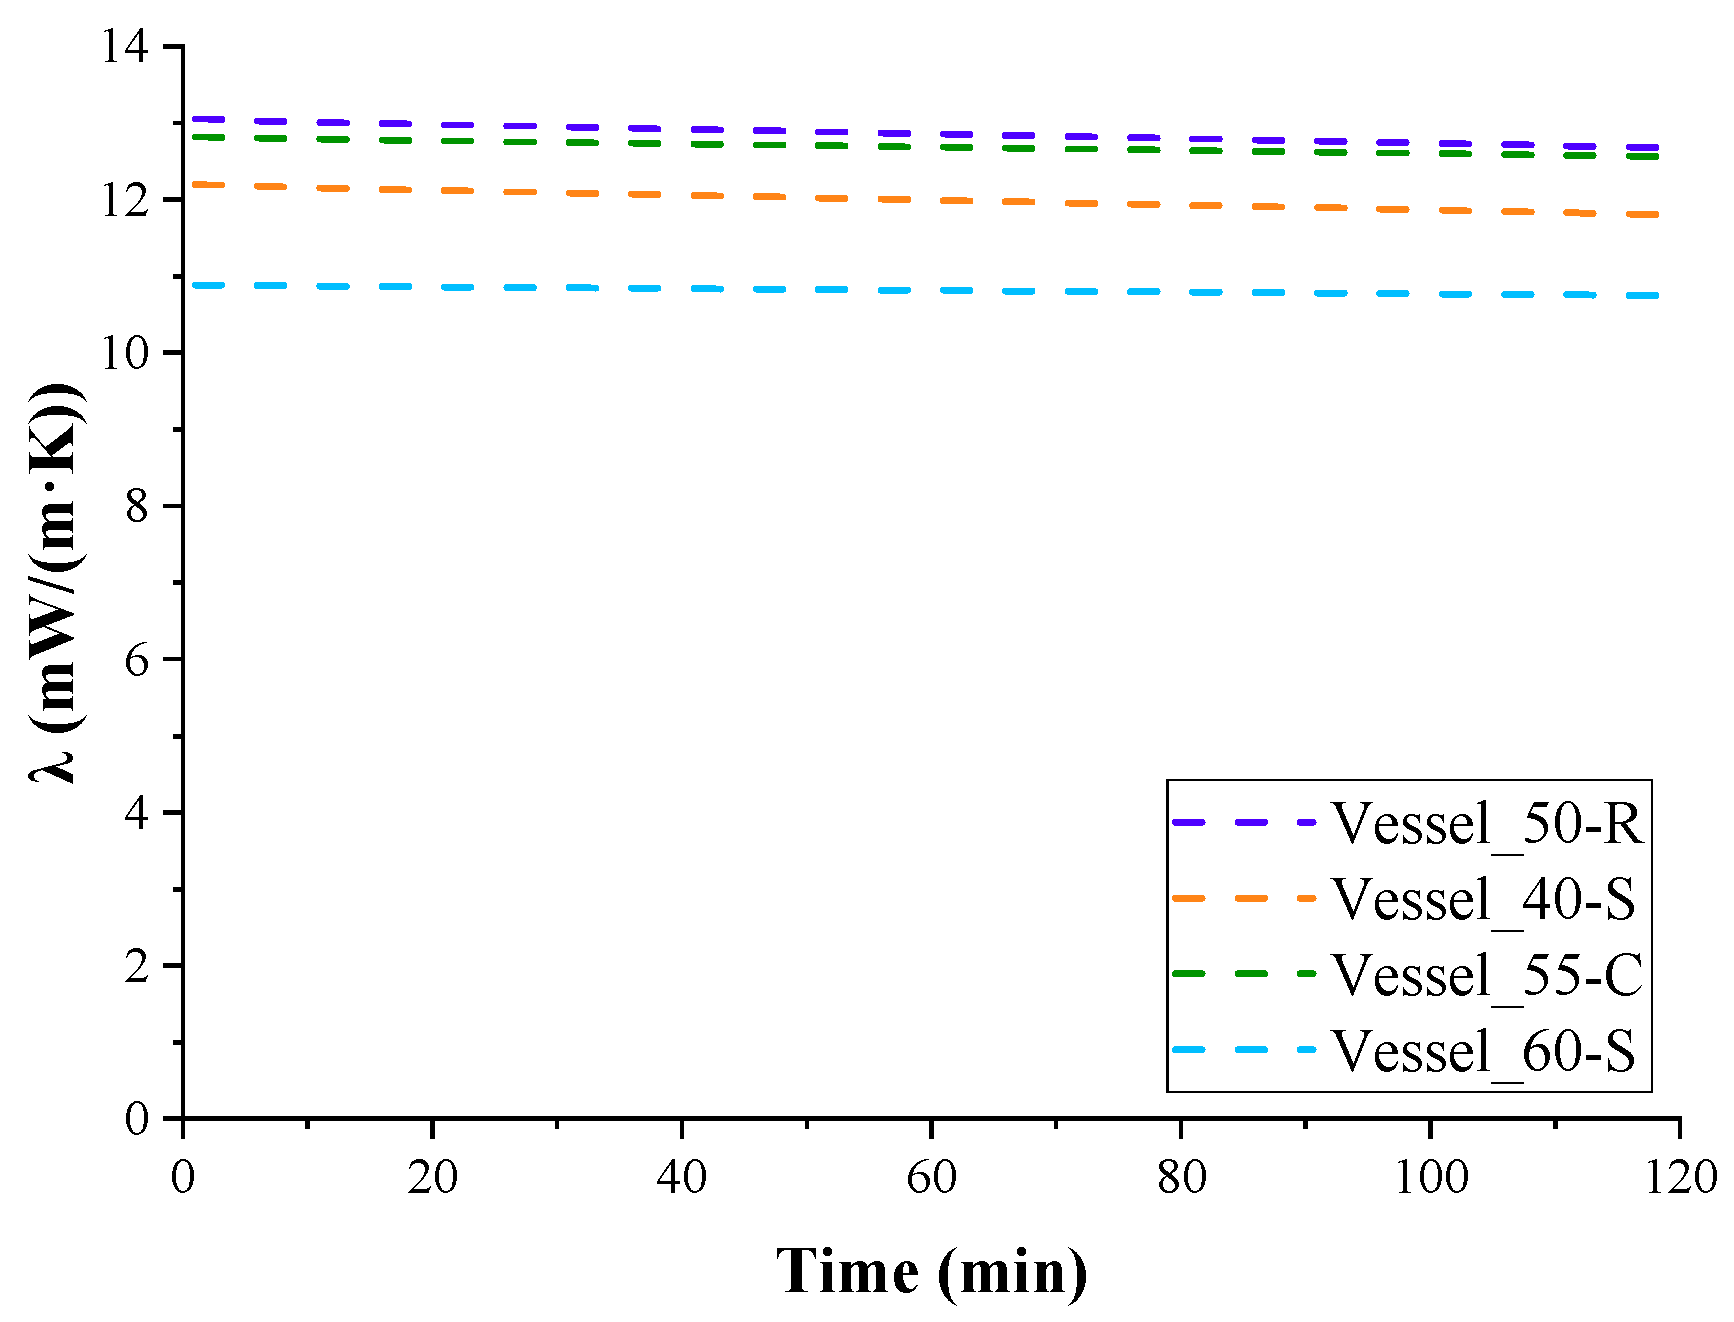
Figure 5 shows the change in the average calculated values of the thermal conductivity coefficient for three experiments, excluding the variation in contact area with LN
2. However, when interpolating the heat absorption curve data (
Figure 4) to the first minute of the experiment, when LN
2 contacts almost the entire surface of the vessel, the obtained thermal conductivity coefficient can be considered the effective thermal conductivity coefficient of the insulation in the temperature range 77–293 K.
The average values of the thermal conductivity coefficients for the insulation of the tested vessels, based on three measurements, are given in
Table 7. Since the total duration of all experiments did not exceed 3 weeks, no tendency for the thermal conductivity coefficients of the insulation to increase due to ageing of foam was observed. No cumulative effect of cryogenic moisture uptake was observed either. Therefore, the deviations of the measured and calculated indicators were within the experimental error.
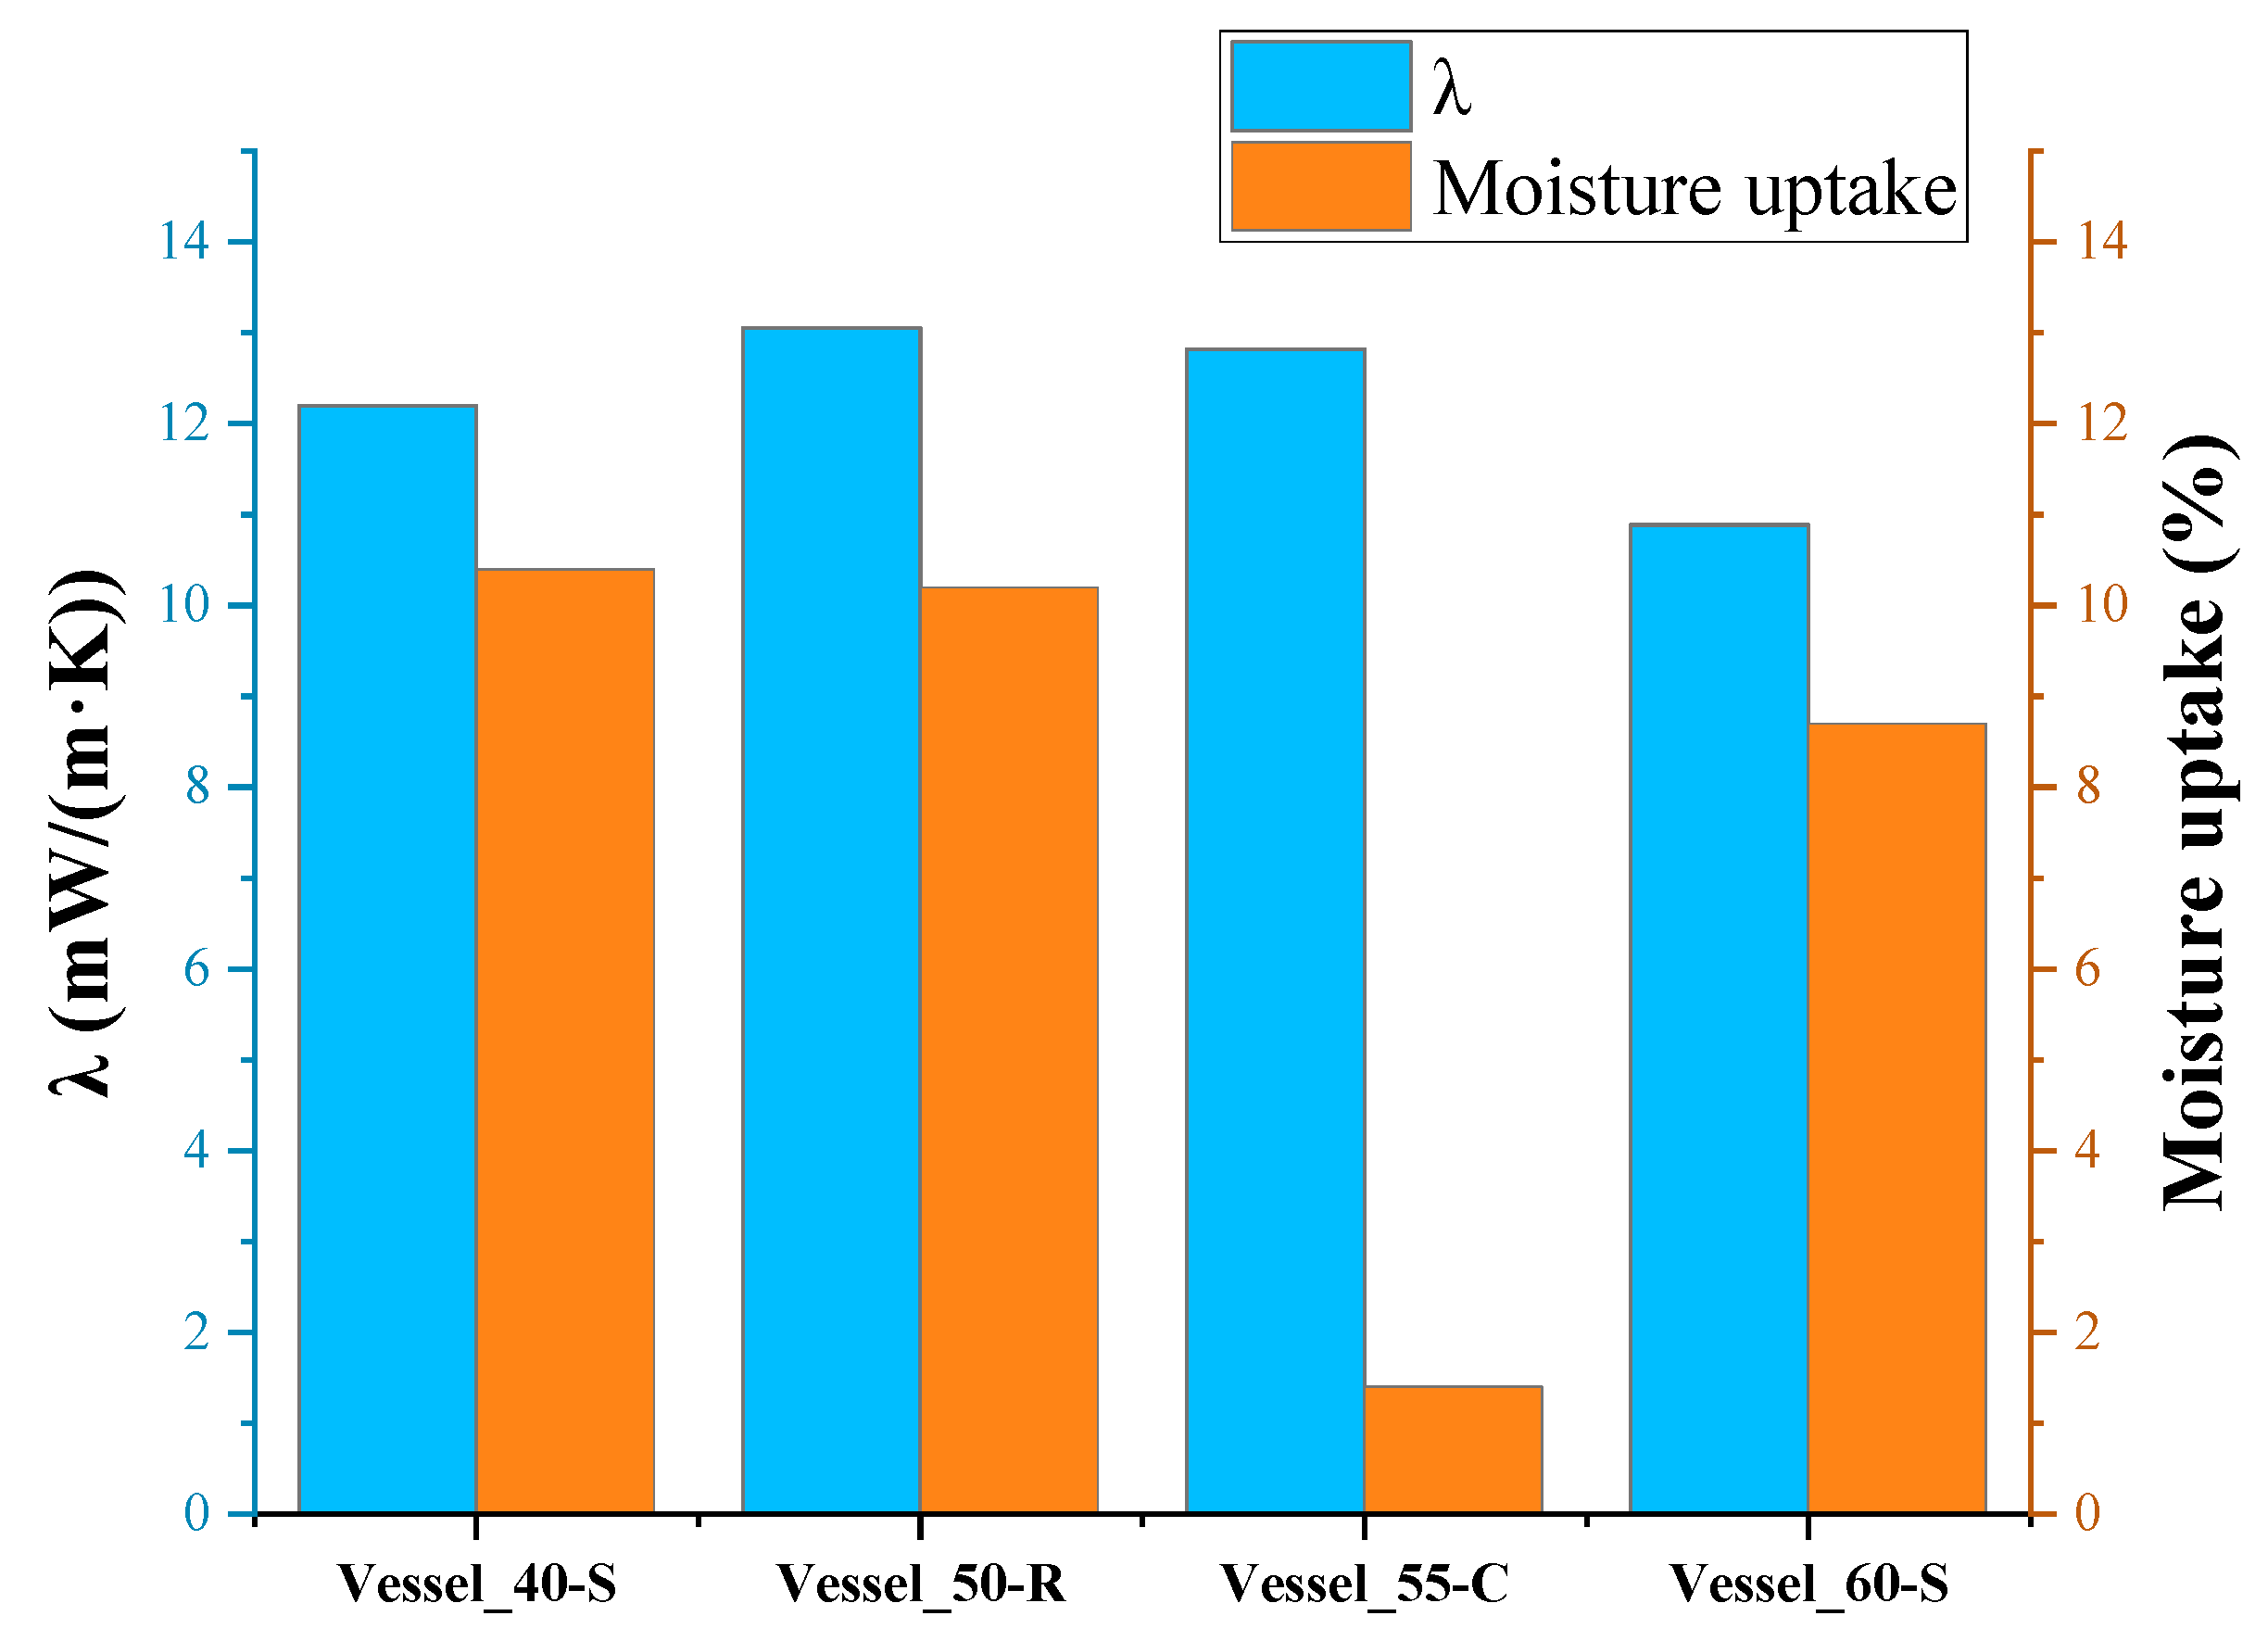
As can be seen, the lowest values of the thermal conductivity coefficient were observed in the insulation of test Vessel_60-S, which had the greatest thickness of insulation and, consequently, the smallest cryogenic moisture uptake in percentage of the total mass of insulation among insulated vessels without a protective coating.
The highest value of the effective coefficient of thermal conductivity was obtained for the insulation of Vessel_50-R, which had a denser, rough surface integral layer and, accordingly, a greater integral density of PUR foam insulation compared to the others, in which this layer was removed during processing.
The effective thermal conductivity coefficient of the insulation of Vessel_50-R was higher than the effective thermal conductivity coefficient of the insulation of Vessel_60-S, apparently due to the greater effect of the cryogenic moisture uptake (
Figure 6), which amounted to 10.4% of the total mass of the insulation. The insulation of Vessel_55-C had an even greater coefficient. Despite this, thanks to the protective coating, the insulation almost did not absorb moisture. However, the moisture condensed very intensely on the surface of the coating due to the greater heat capacity of the coating, which was cooled by several degrees. Drops of moisture flowed down from the smooth vertical coating, but its contribution to thermal conductivity was obviously significant. Additionally, due to the cooling of the coating, heat from the environment entered the insulation not only through air convection but also through the thermal conductivity of the coating material.


