

Mechanical Properties, Physical Properties and VOC Emissions of Three-Layer Particleboards with Recycled Automotive Plastics in the Core Layer

 , ,
, ,  , ,
, ,  , and
, and
Abstract
1. Introduction
2. Materials and Methods
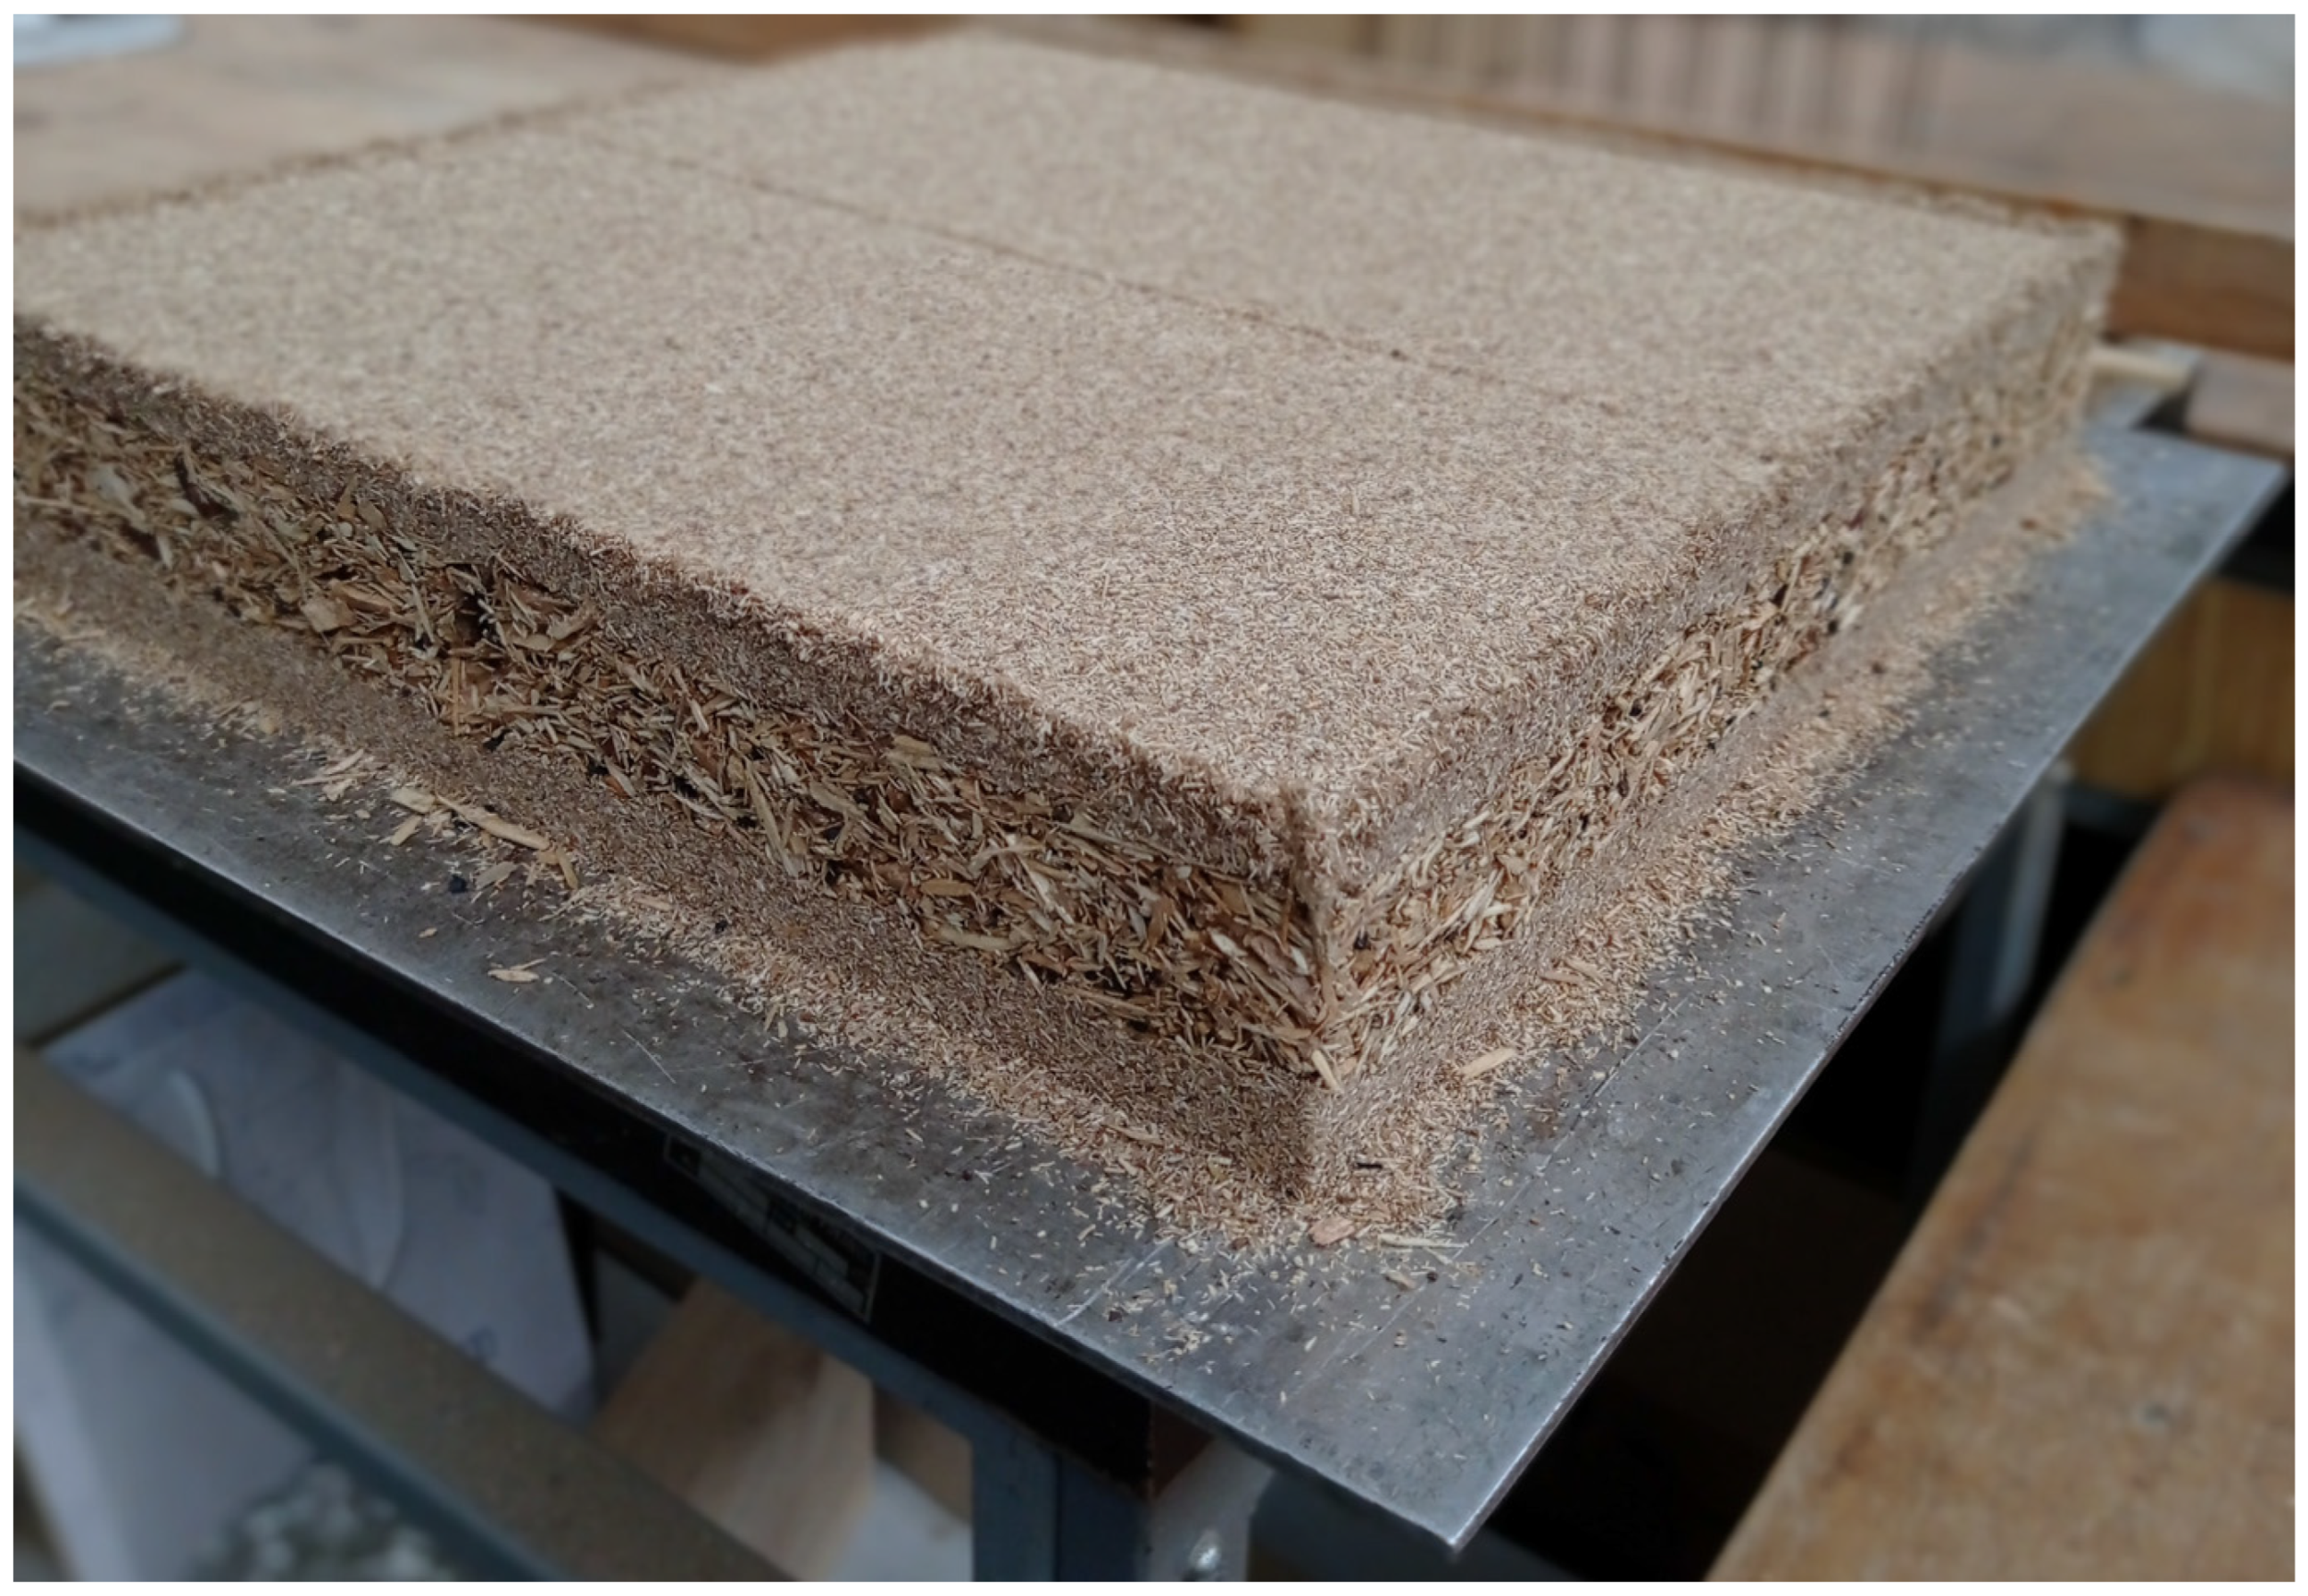
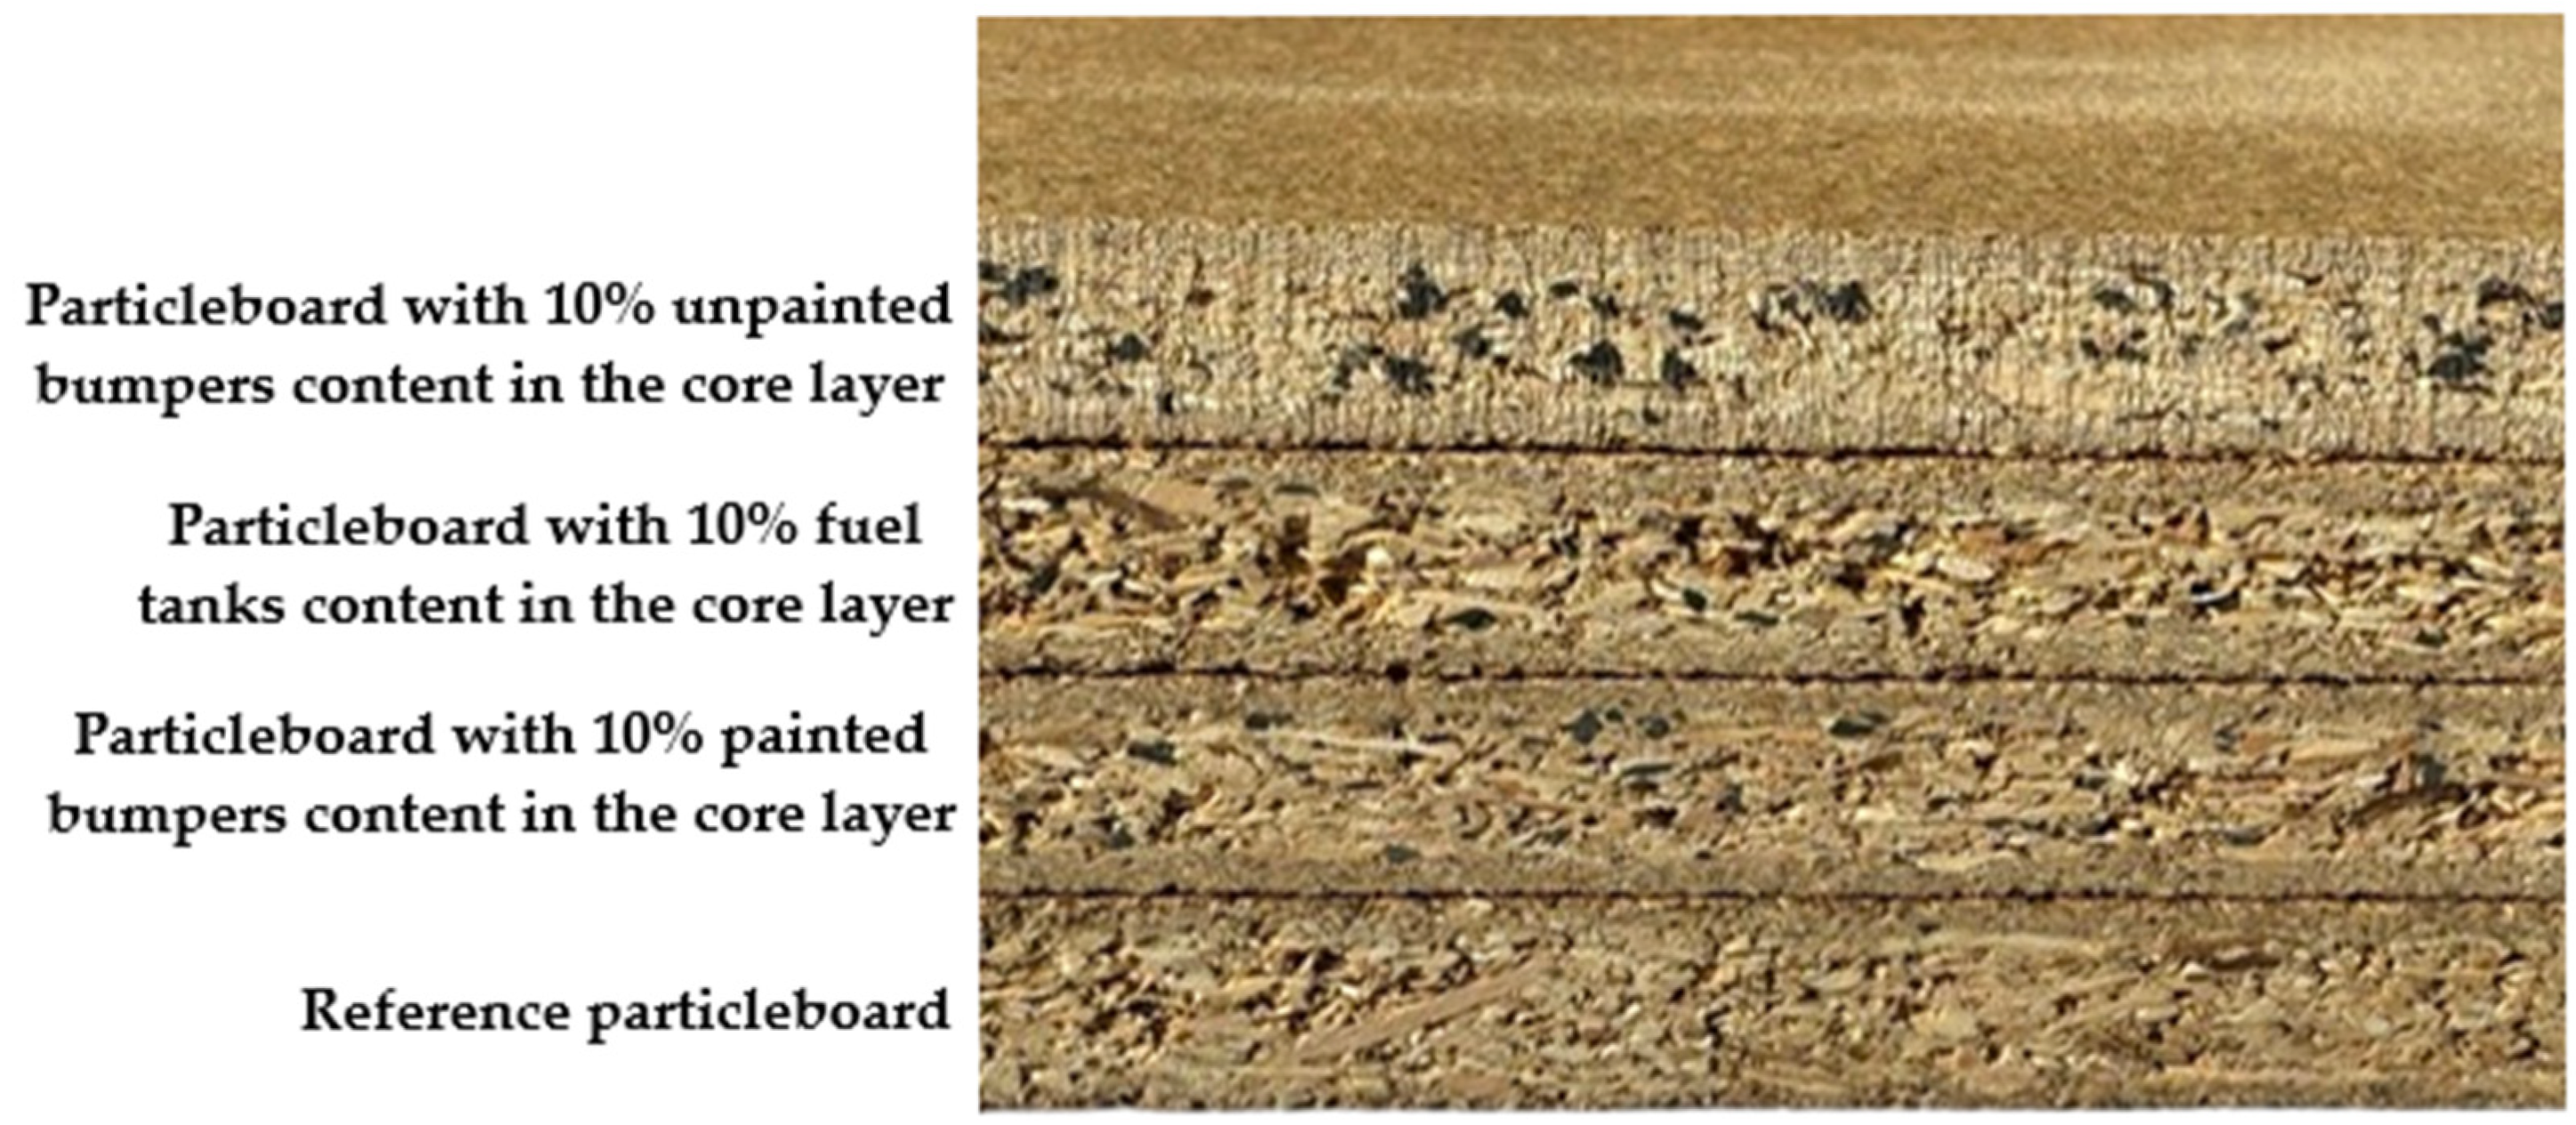
2.1. Material
2.2. Methods
2.2.1. Density
2.2.2. Water Absorption and Thickness Swelling
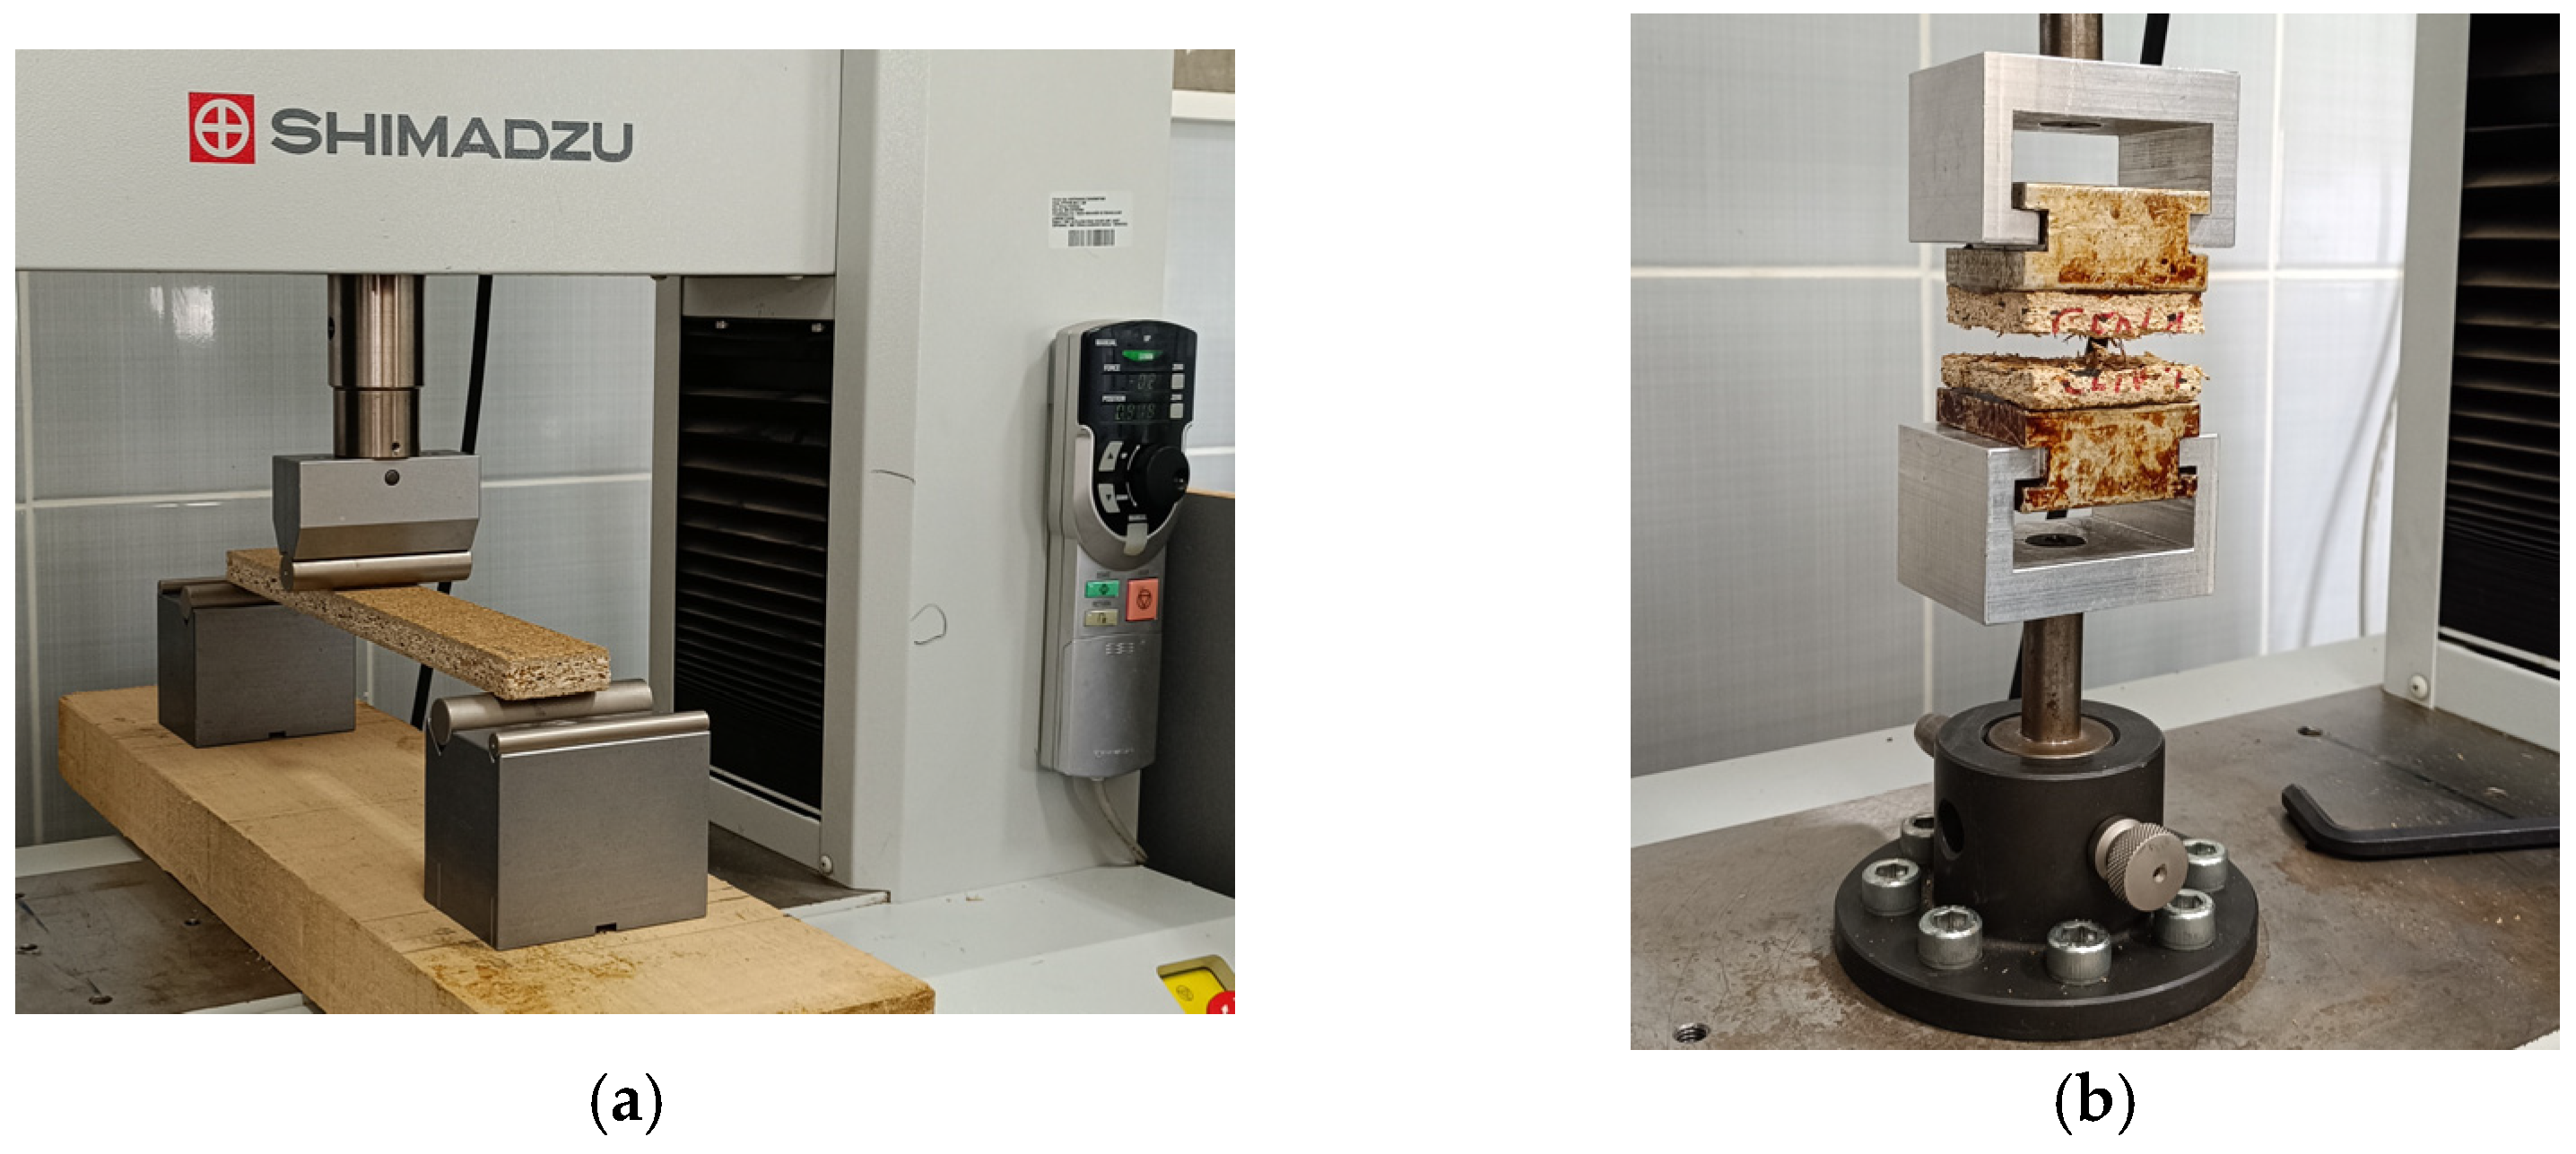
2.2.3. Mechanical Properties
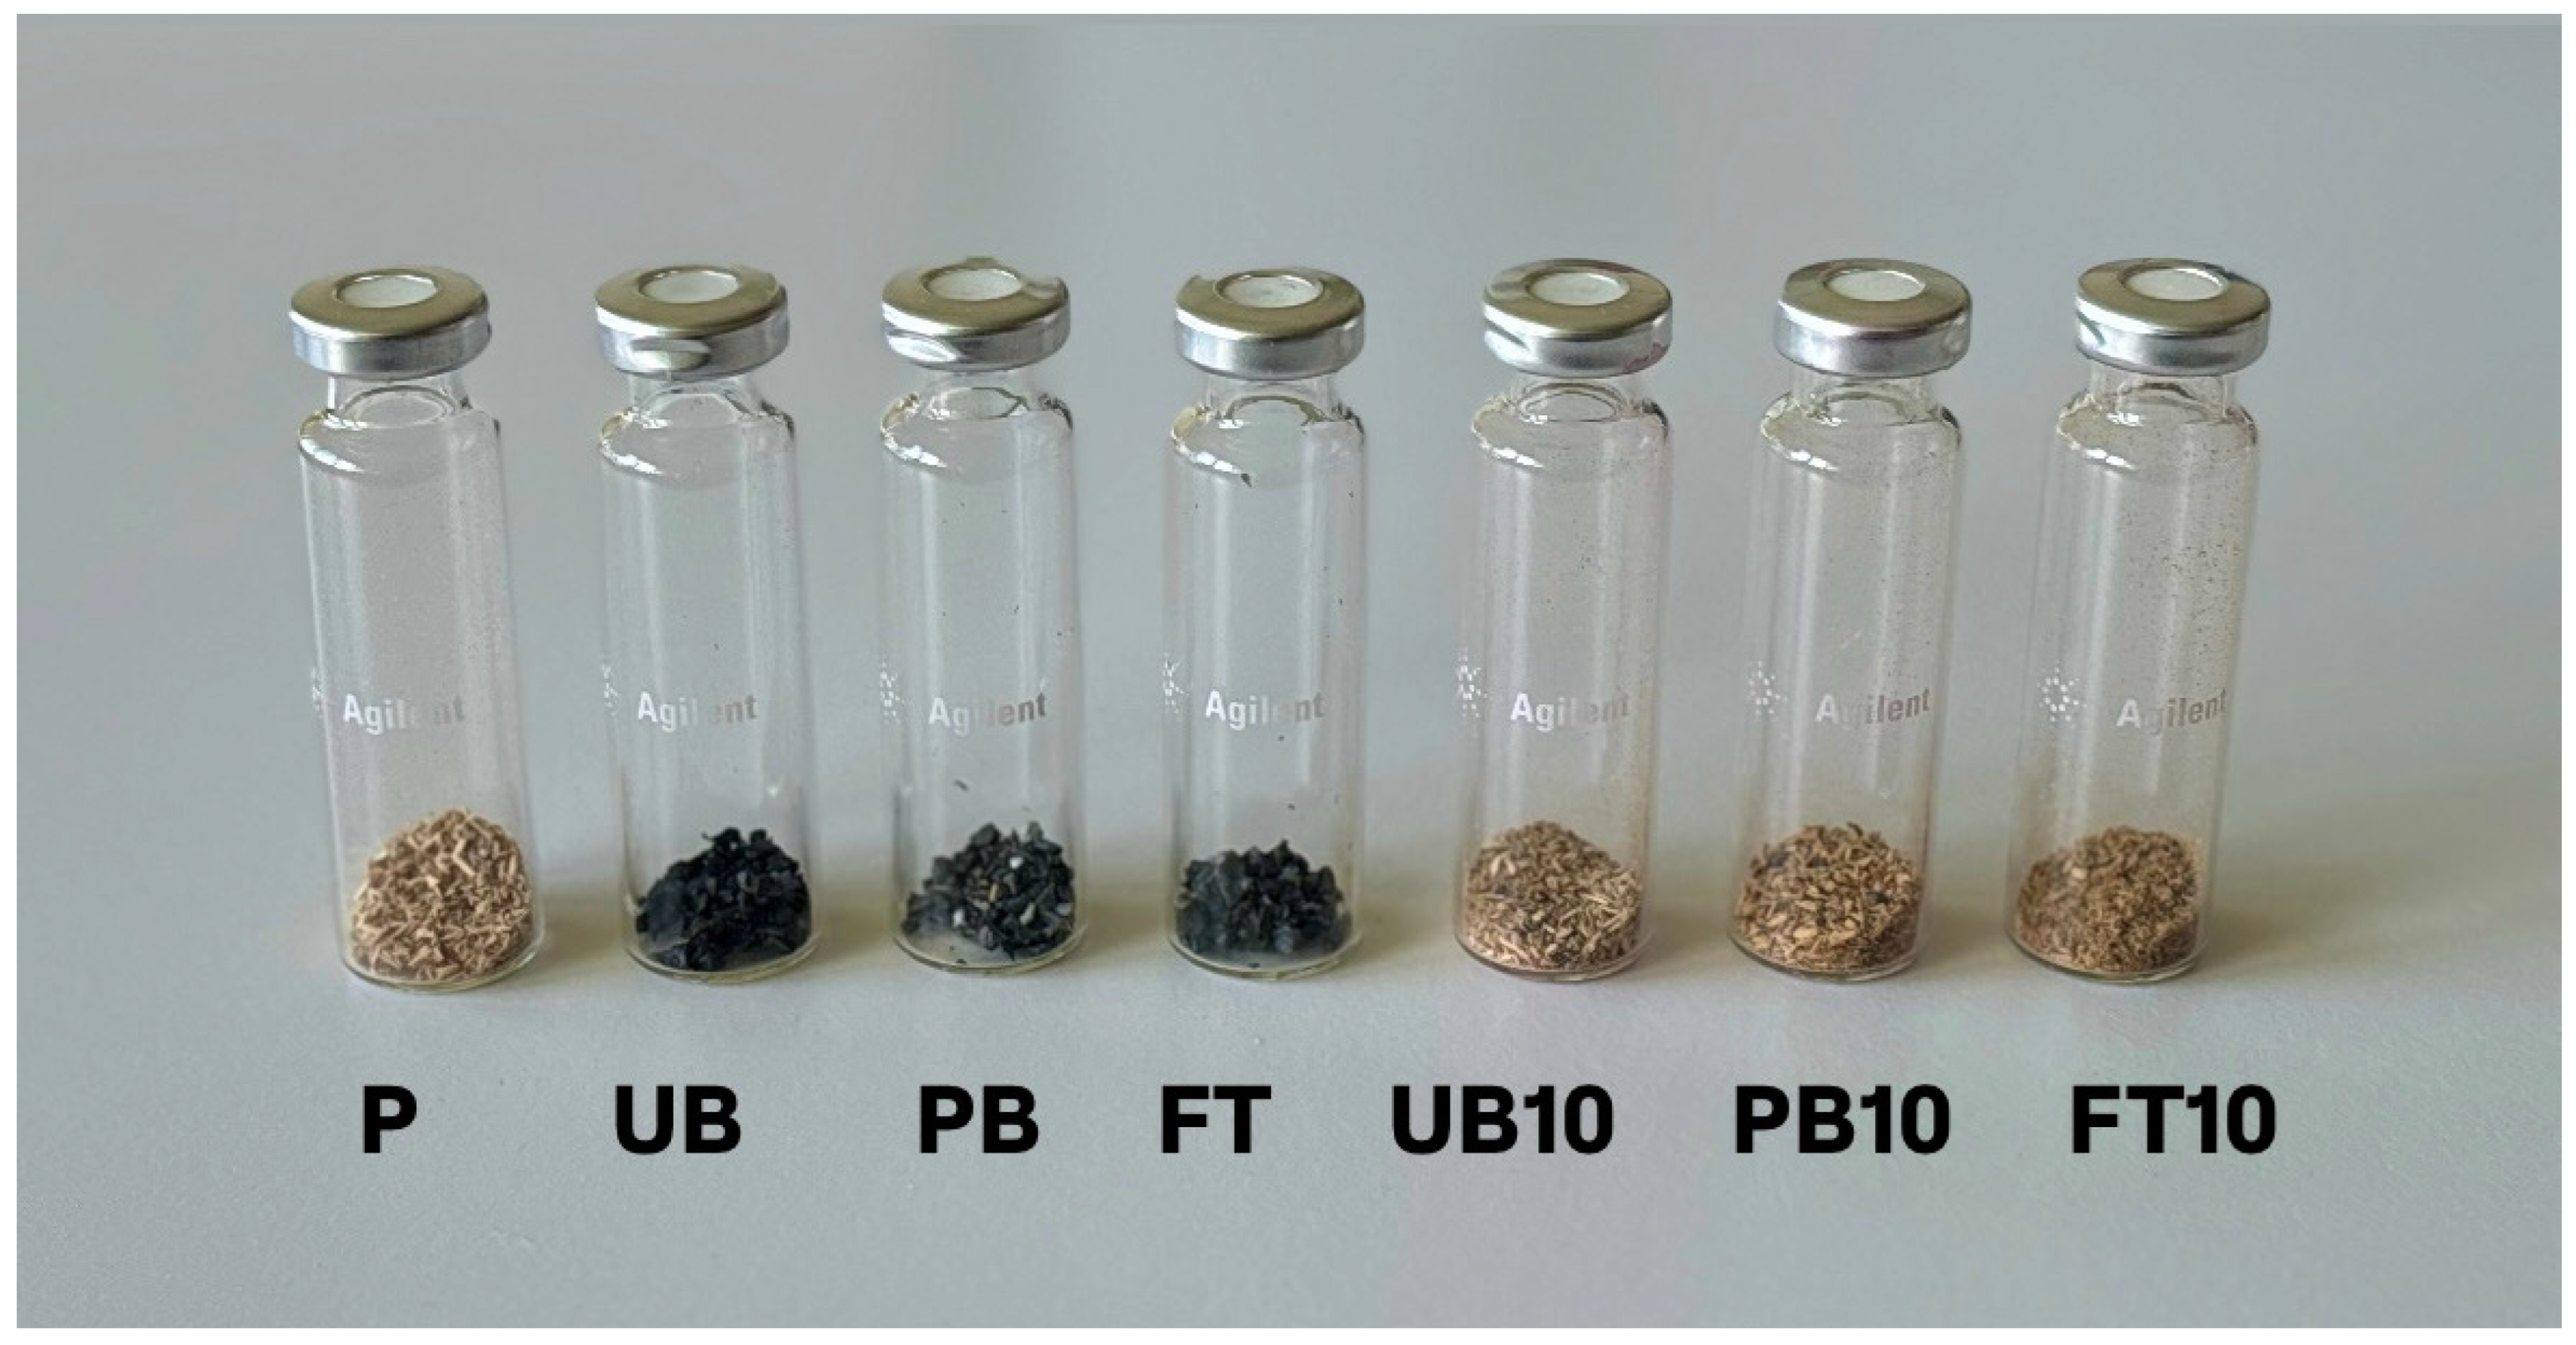
2.2.4. Volatile Organic Compounds
3. Results and Discussion
3.1. Physical Properties
3.1.1. Density of Prepared Particleboards
3.1.2. Water Absorption and Thickness Swelling of Prepared Particleboards
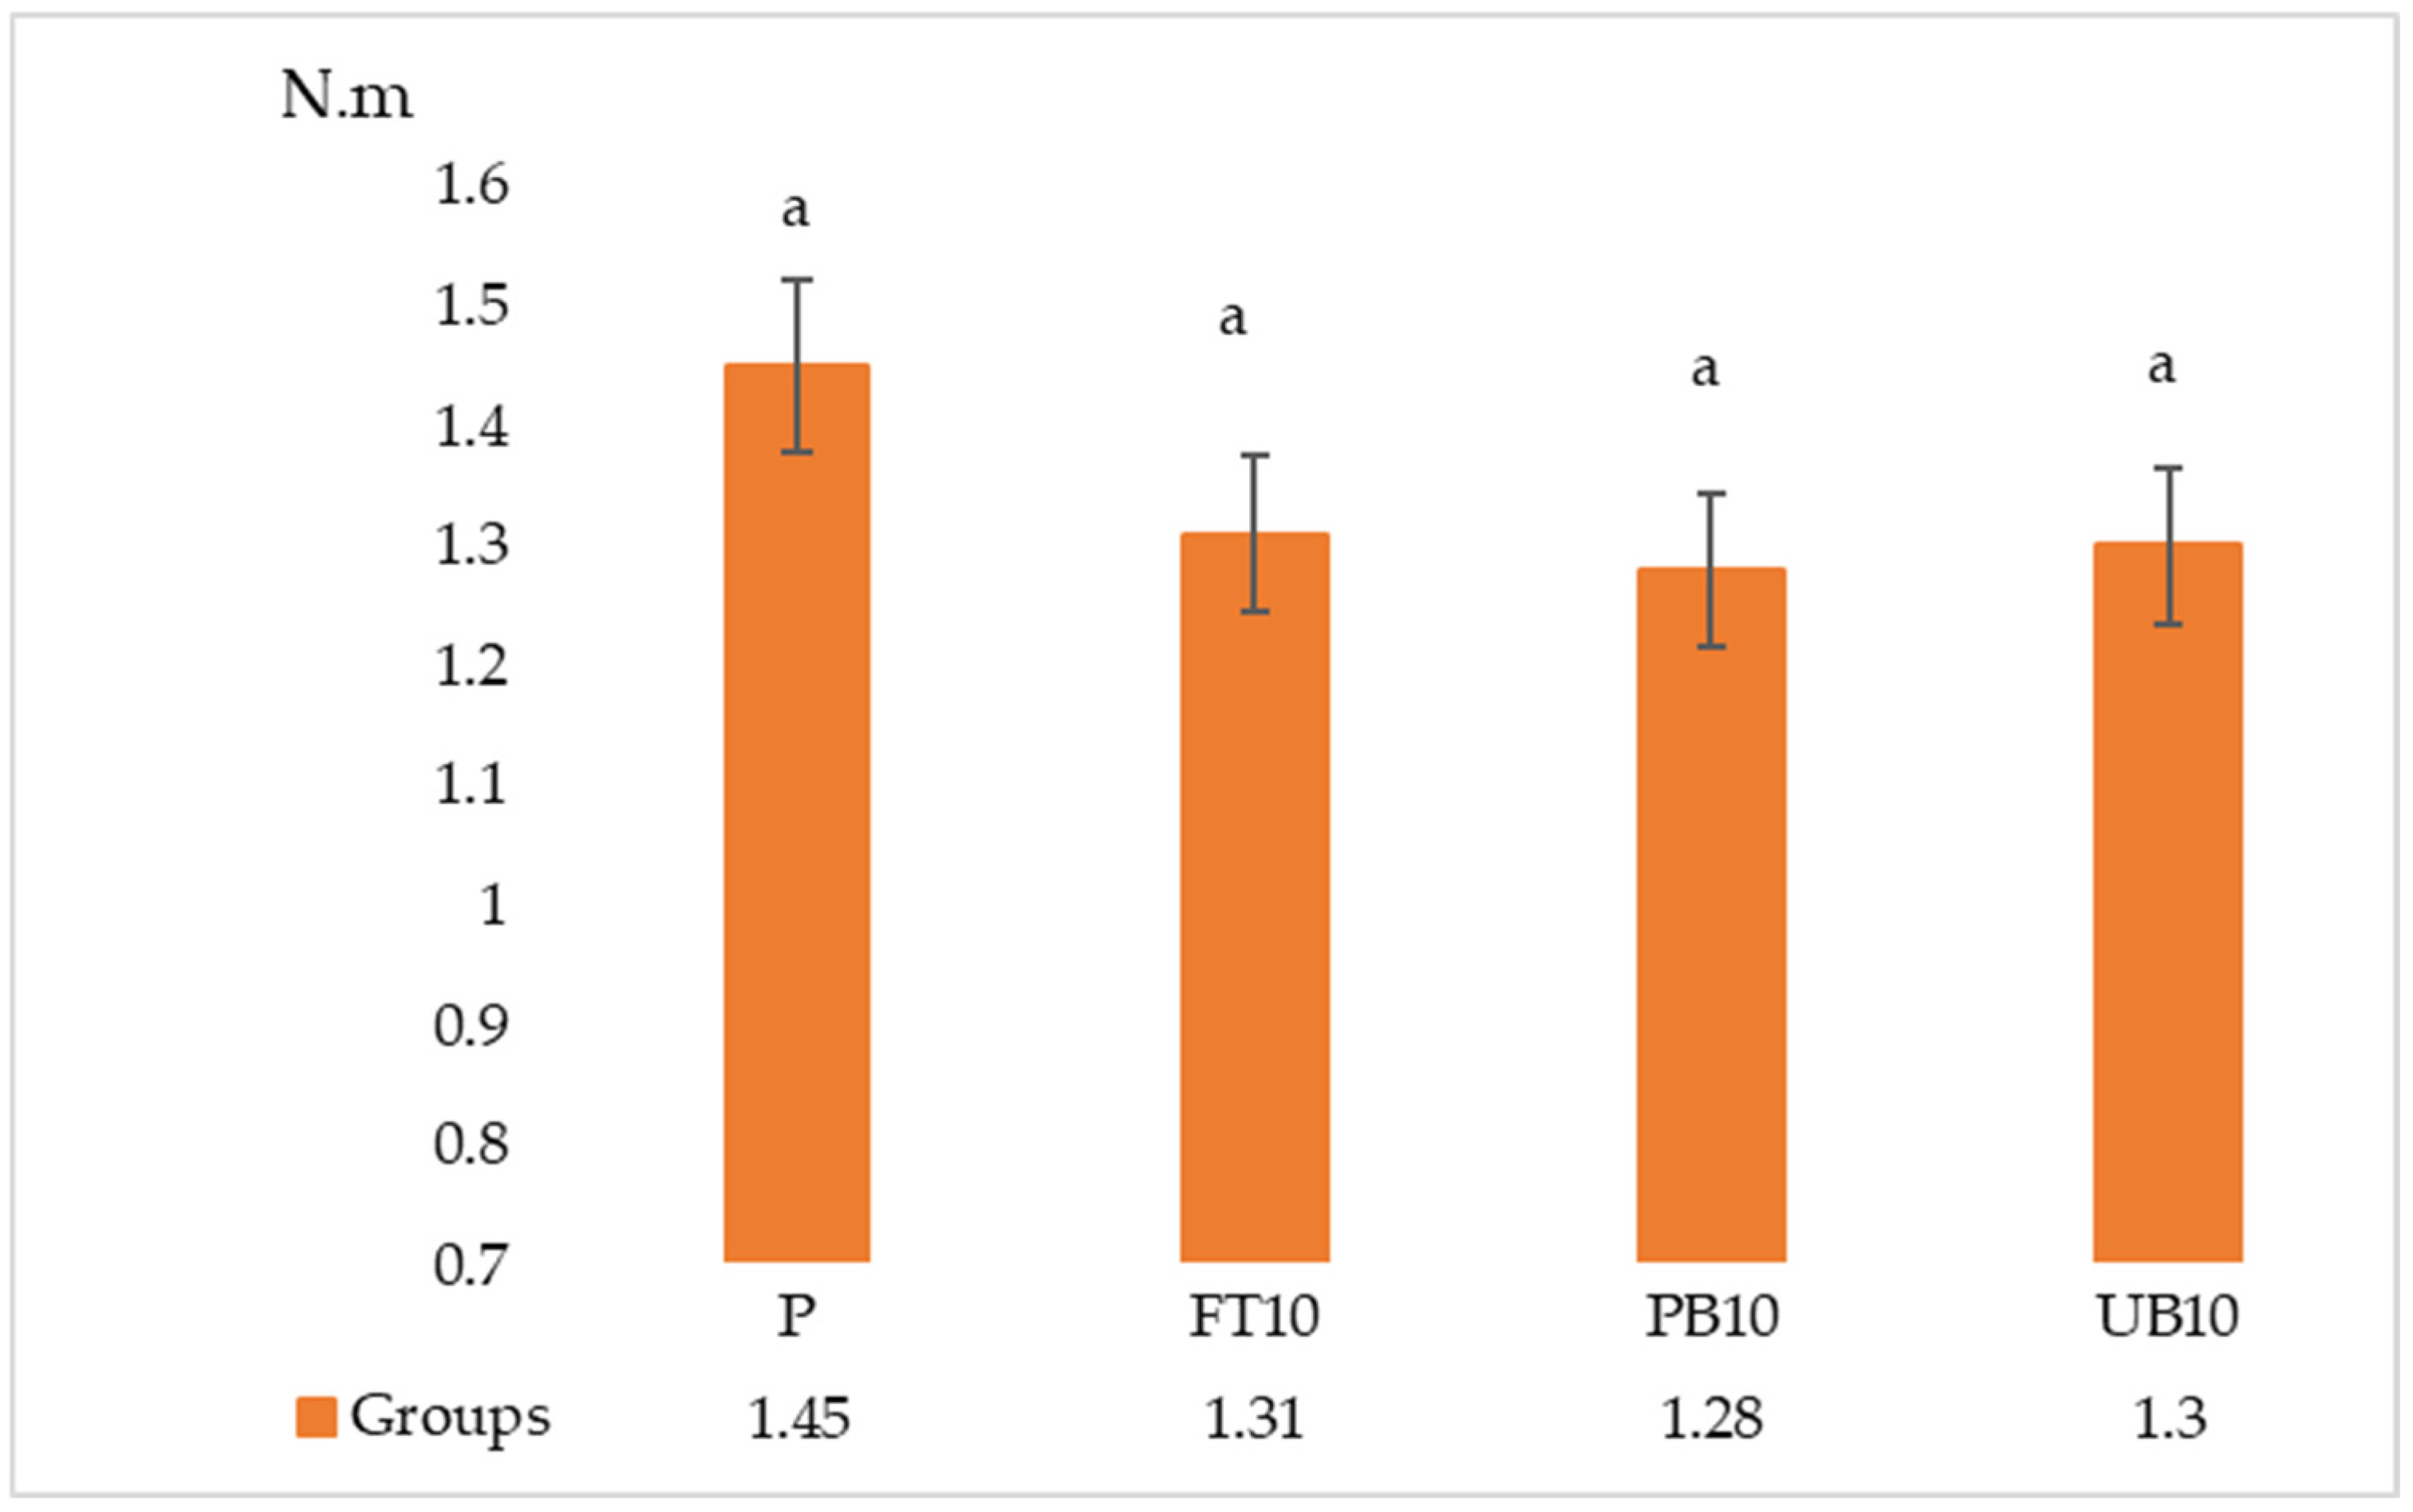
3.1.3. Mechanical Properties of Prepared Particleboards
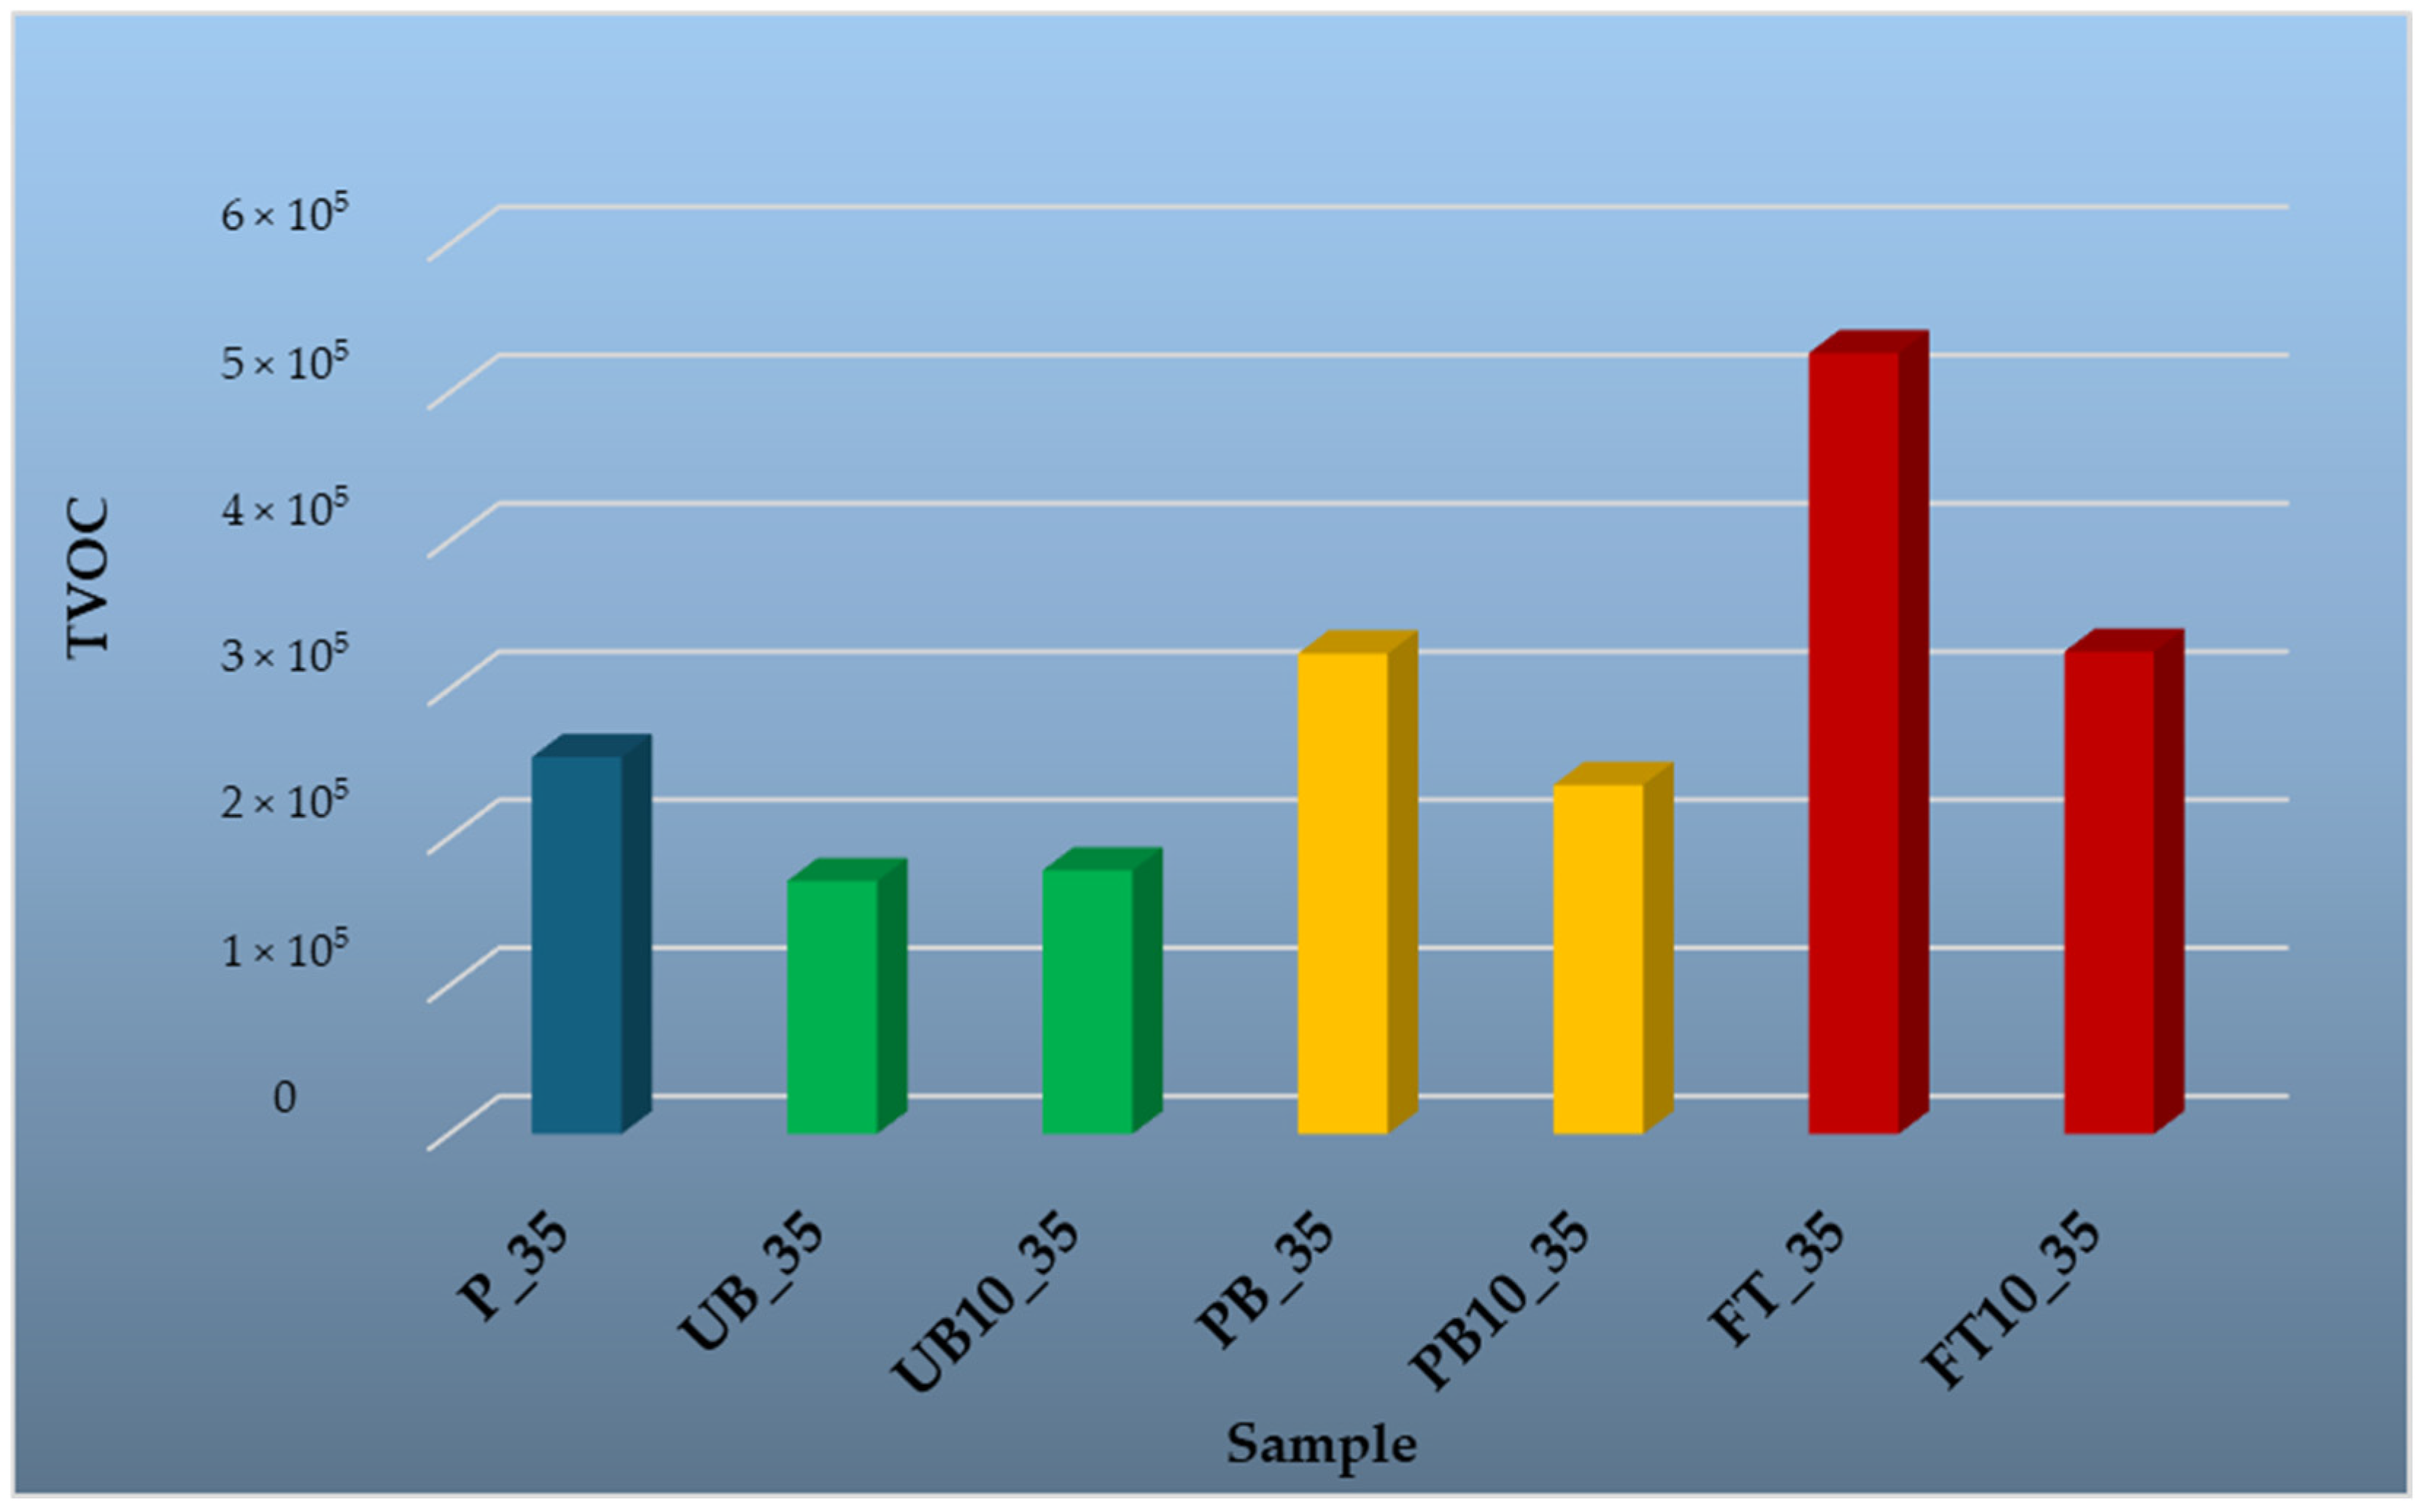
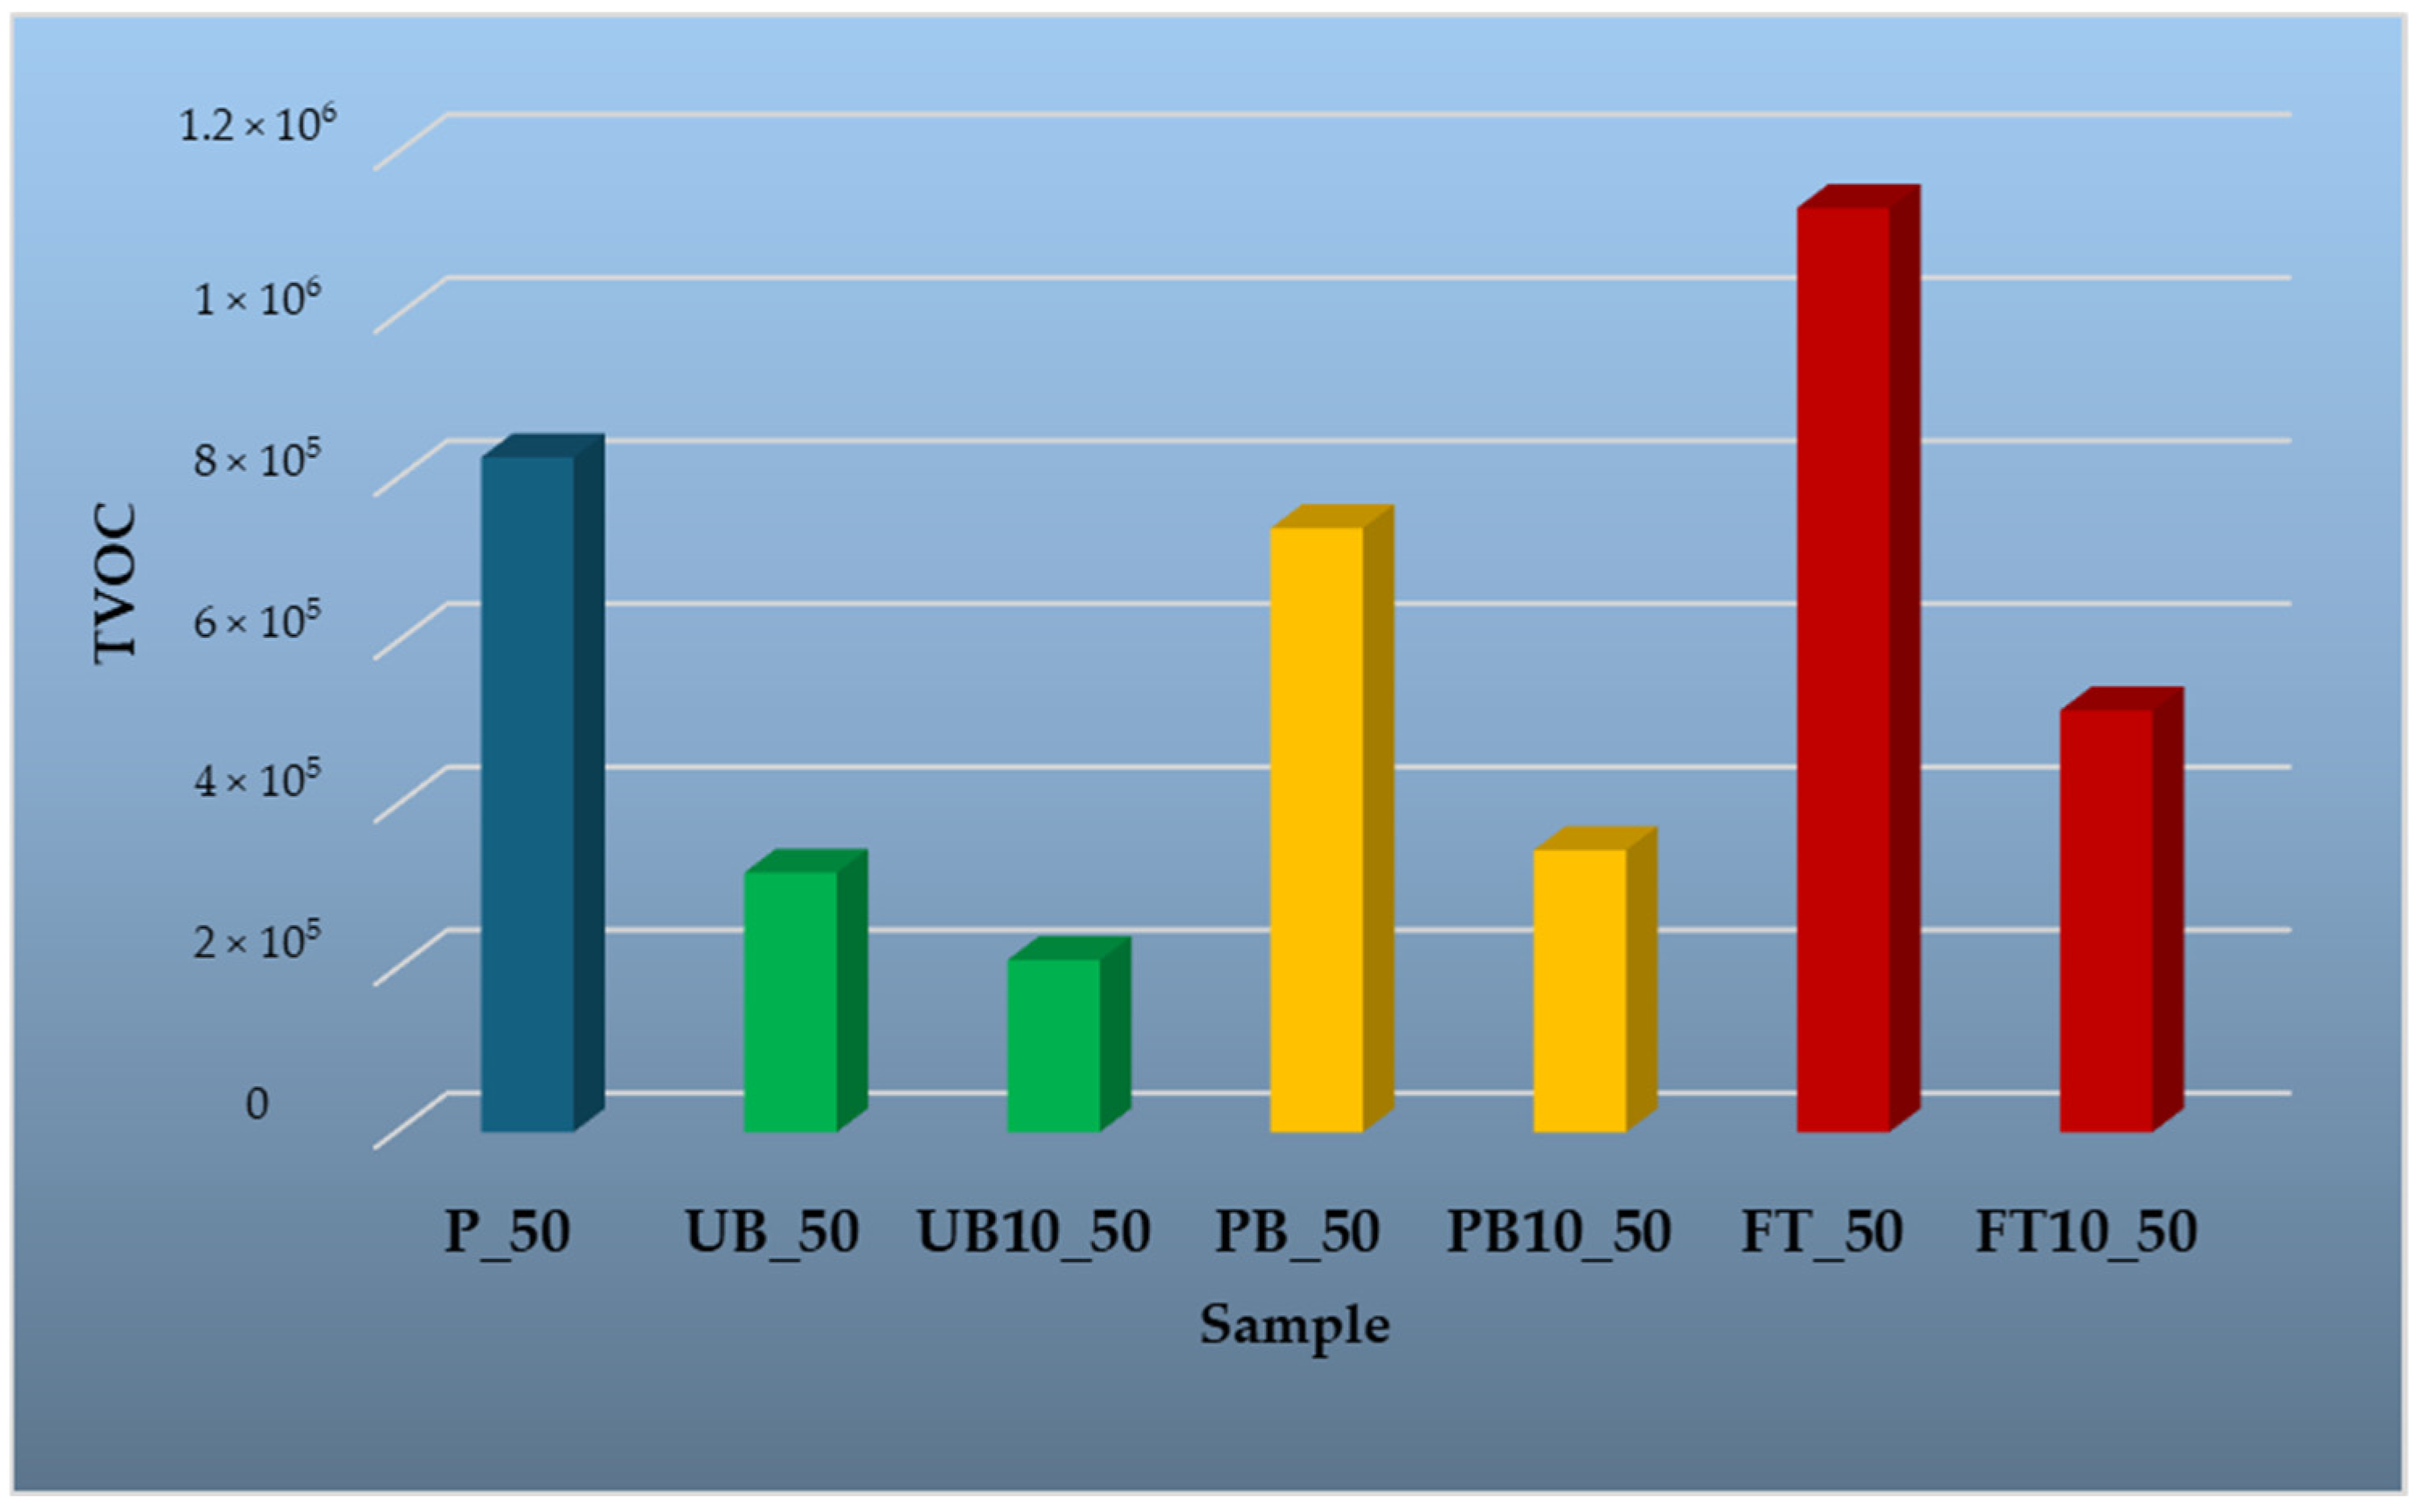
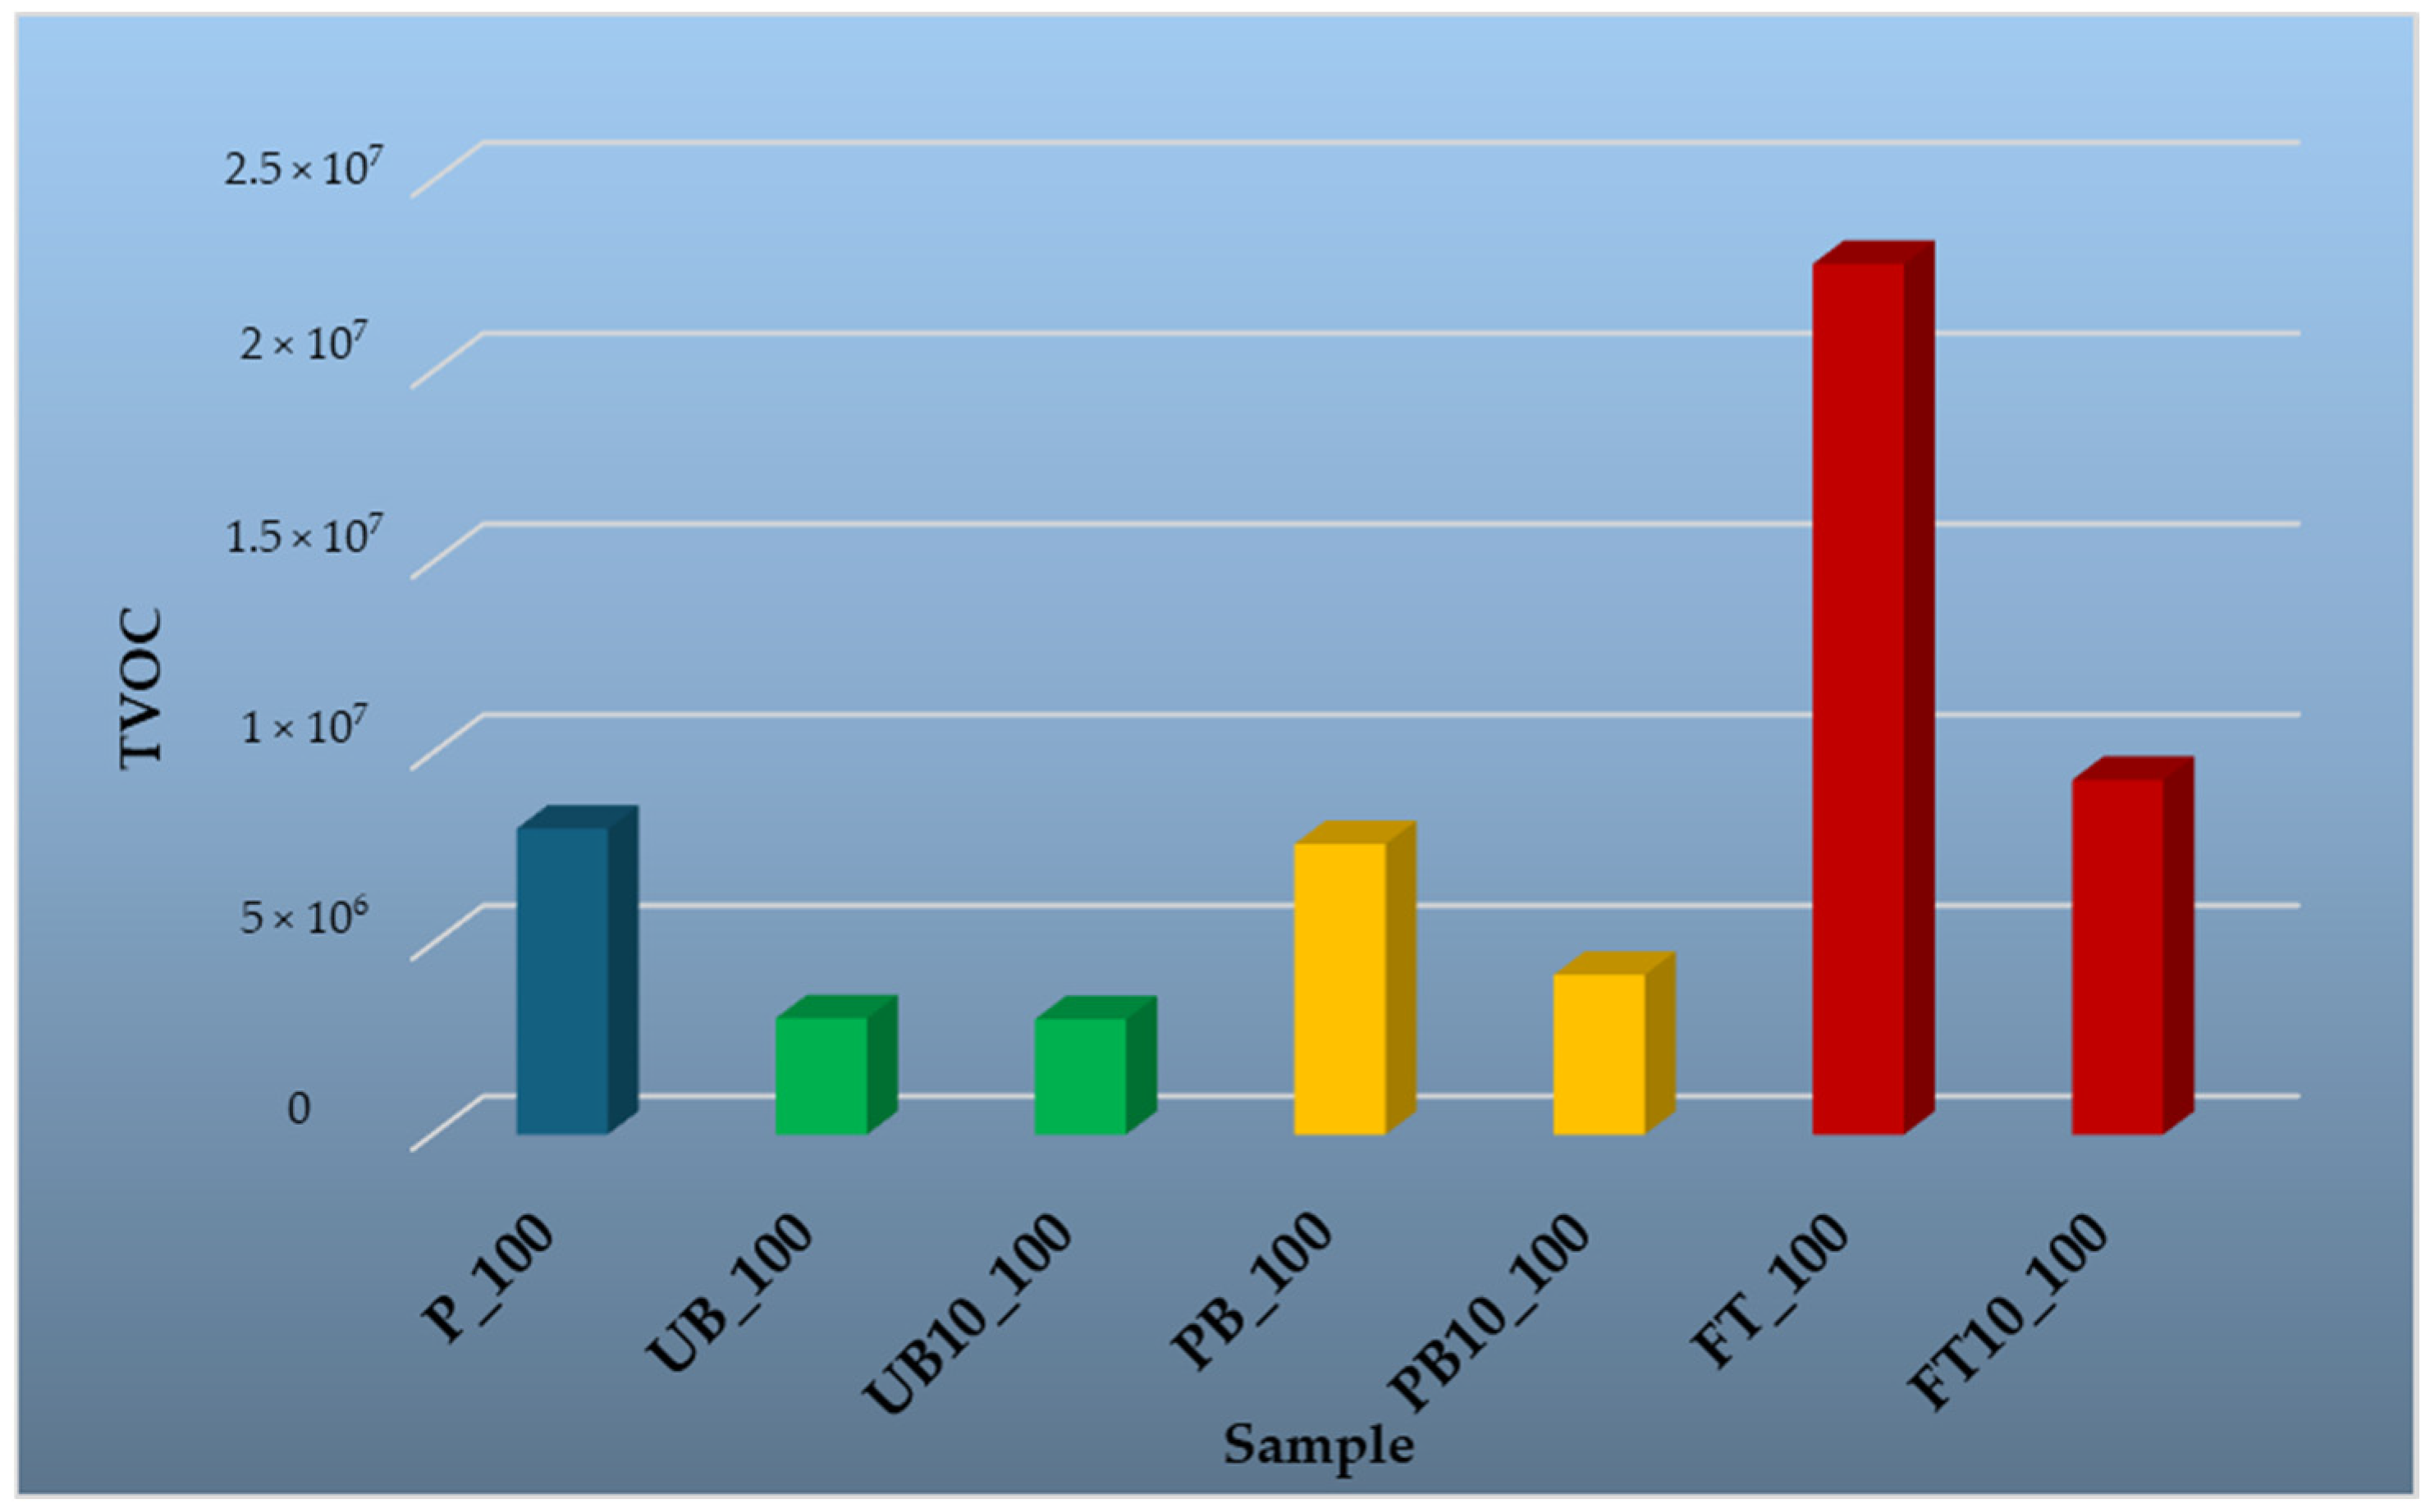
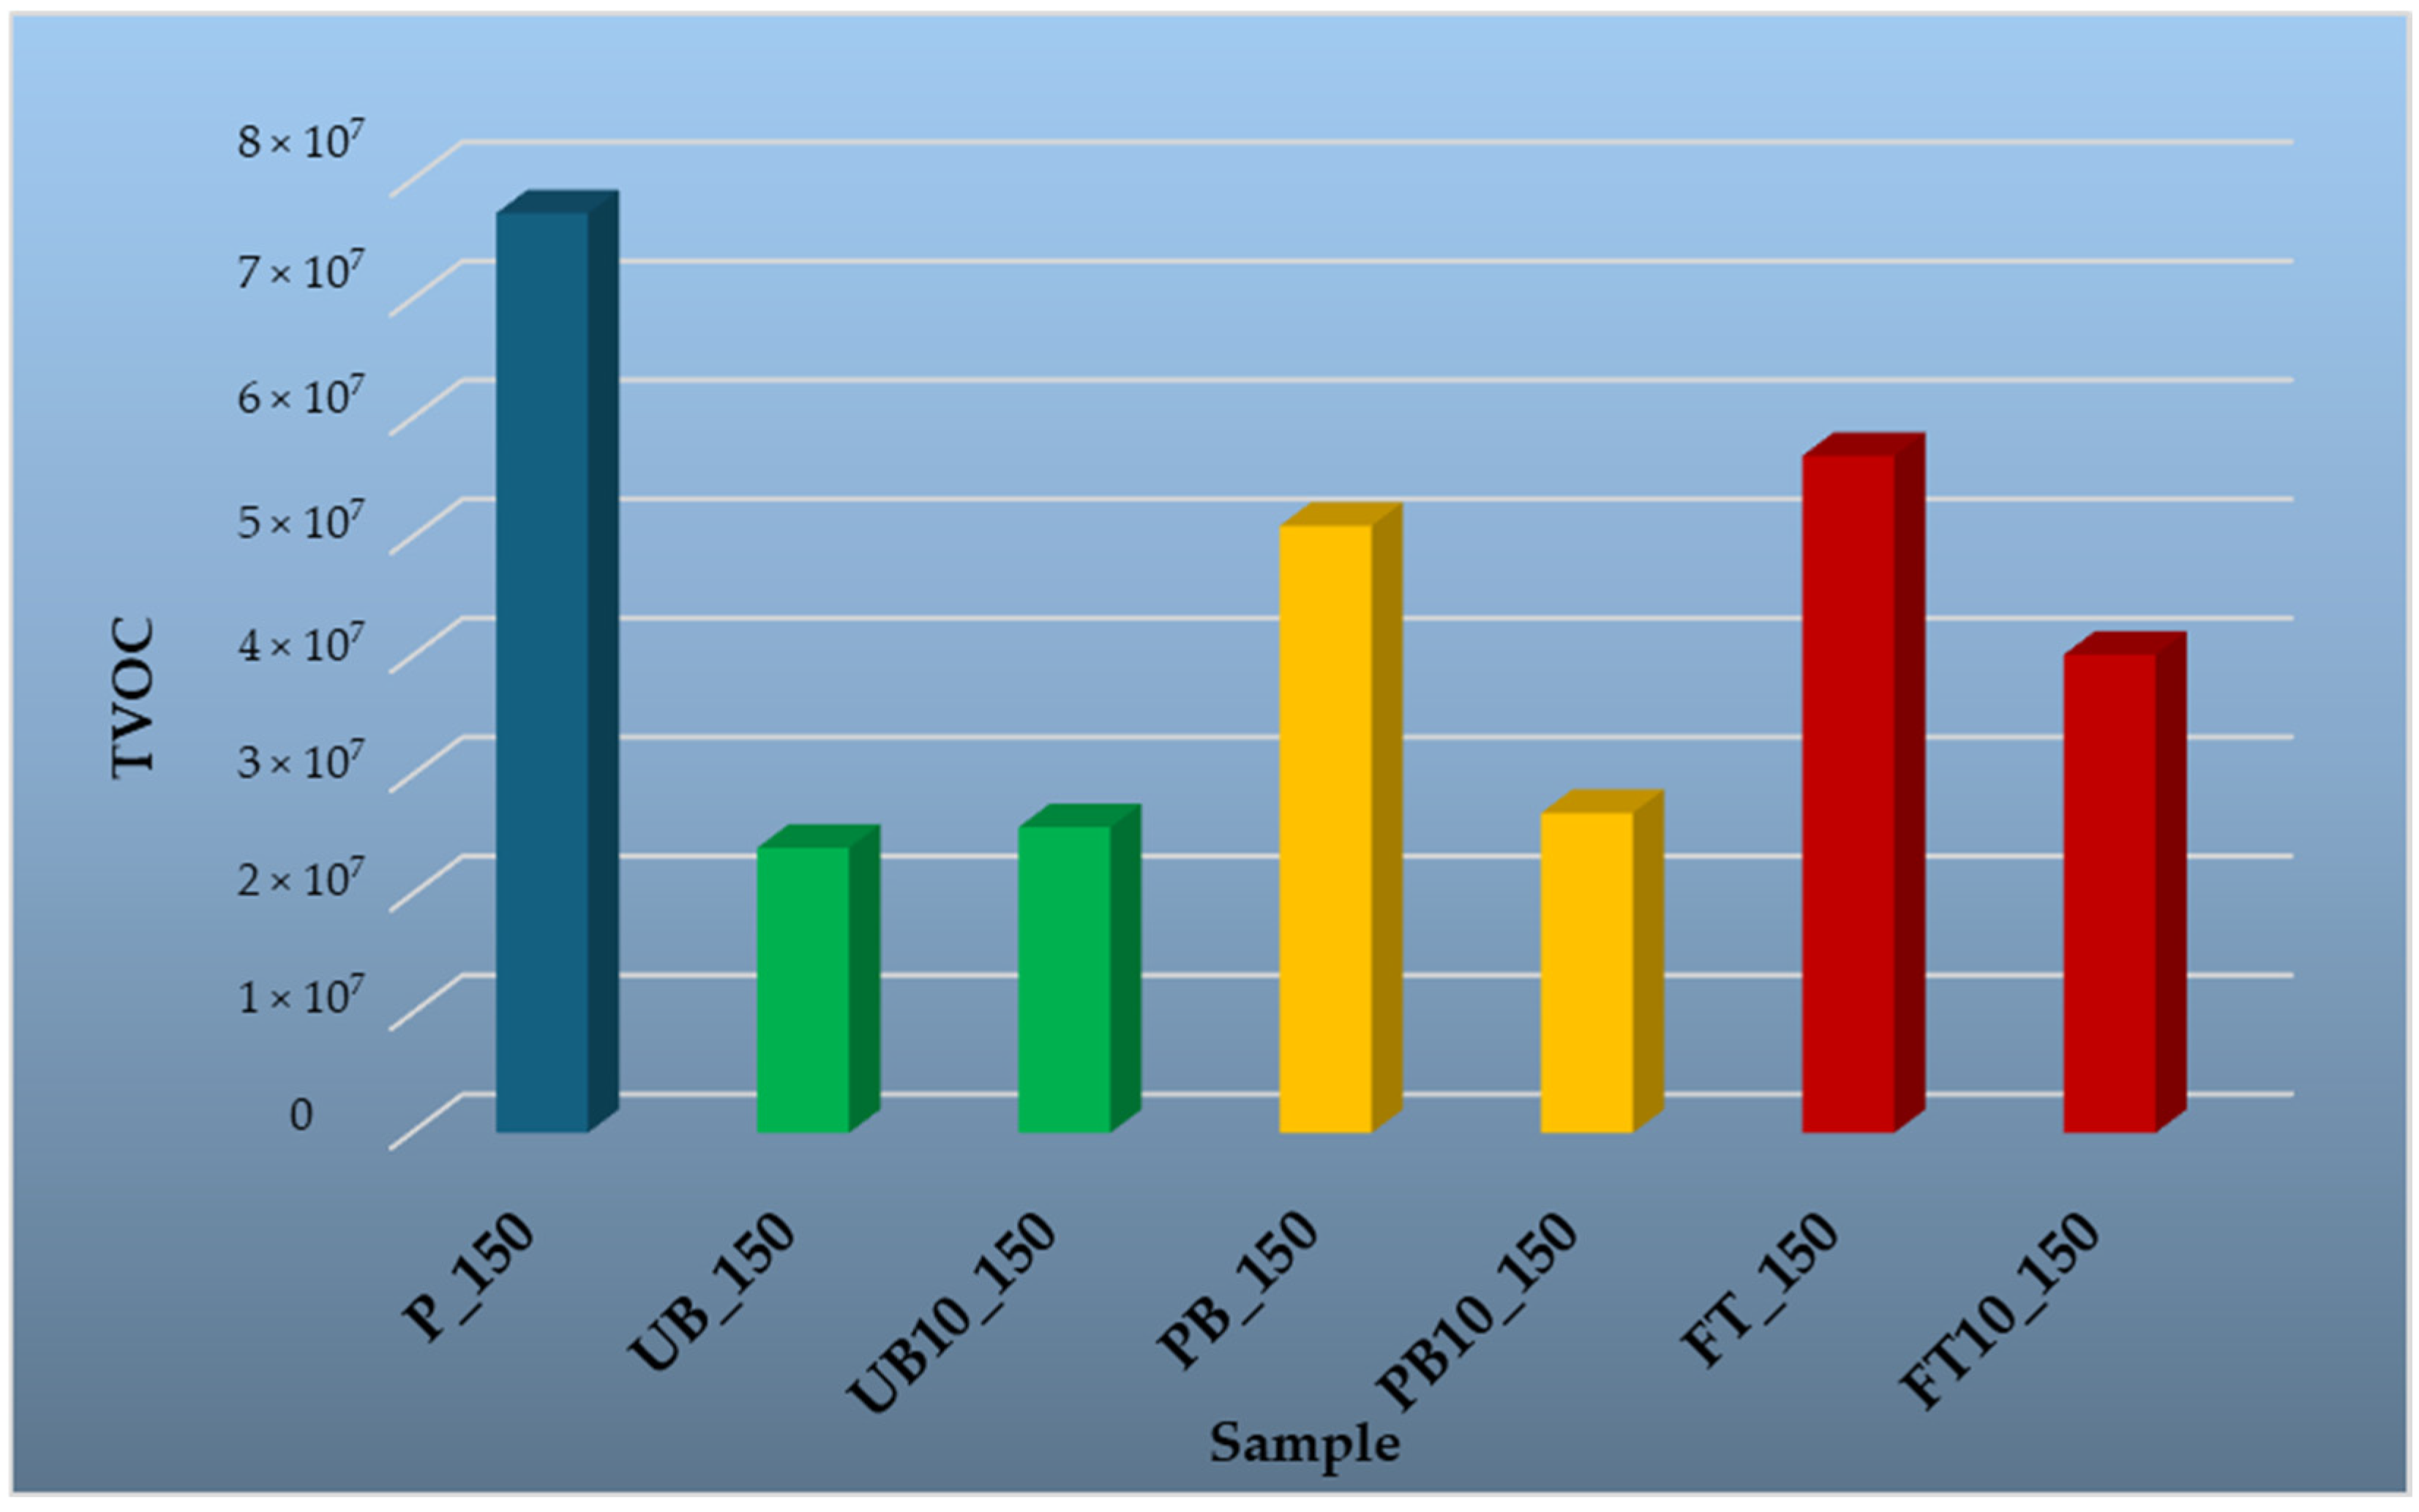
3.1.4. Volatile Organic Compounds Emitted from Prepared Particleboards
4. Conclusions
Supplementary Materials
Author Contributions
Funding
Institutional Review Board Statement
Data Availability Statement
Acknowledgments
Conflicts of Interest
Abbreviations
| P | Reference Particleboard |
| UB | Unpainted Bumpers |
| PB | Painted Bumpers |
| FT | Fuel Tanks |
| UF | Urea—Formaldehyde |
| HDPE | High Density Polyethylene |
| PP | Polypropylene |
| UB10 | Particleboard Containing 10% Unpainted Bumpers |
| PB10 | Particleboard Containing 10% Painted Bumpers |
| FT10 | Particleboard Containing 10% Fuel Tanks |
| WA | Water Absorption |
| TS | Thickness Swelling |
| IBS | Internal Bonding Strength |
| BS | Bonding Strength |
| MOR | Modulus of Rupture |
| MOE | Modulus of Elasticity |
| SDT | Screw Driving Torque |
| SeT | Seating Torque |
| StT | Stripping Torque |
| VOC | Volatile Organic Compound |
| GC-MS | Gas Chromatography—Mass Spectrometry |
| MAPP | Maleic Anhydride-Modified Polypropylene |
| MDF | Middle Density Fiberboard |
References
- Thoemen, H.; Irle, M.; Sernek, M. (Eds.) Wood-Based Panels: An Introduction for Specialists; Brunel University Press: London, UK, 2010; ISBN 978-1-902316-82-6. [Google Scholar]
- Forest Products Laboratory. Wood Handbook: Wood as an Engineering Material; General Technical Report FPL–GTR–113; U.S. Department of Agriculture, Forest Service, Forest Products Laboratory: Madison, WI, USA, 1999.
- Kurşun, C.; Onat, S.; Kelleci, O. Particleboard Density and Surface Quality. In Proceedings of the 2nd International Conference on Contemporary Academic Research, Konya, Turkey, 4–5 November 2023; Bartin University: Bartin, Turkey, 2023. [Google Scholar]
- Pothan, L.A.; Luyt, A.S.; Thomas, S. Polyolefin/Natural Fiber Composites. In Polyolefin Composites; Nwabunma, D., Kyu, T., Eds.; Wiley: Hoboken, NJ, USA, 2007; pp. 44–86. ISBN 978-0-471-79057-0. [Google Scholar]
- Klyosov, A. Wood-Plastic Composites; John Wiley & Sons, Inc.: Hoboken, NJ, USA, 2007; ISBN 978-0-470-14891-4. [Google Scholar]
- Carus, M.; Eder, A.; Dammer, L.; Korte, H.; Scholz, L.; Essel, R.; Breitmayer, E.; Barth, M. Wood-Plastic Composites (WPC) and Natural Fibre Composites (NFC): European and Global Markets 2012 and Future Trends in Automotive and Construction; Nova-Institut GmbH: Hürth, Germany, 2015. [Google Scholar]
- Clemons, C. Wood-Plastic Composites in the United States: The Interfacing of Two Industries. For. Prod. J. 2002, 52, 10–18. [Google Scholar]
- Meikle, J.L. Material Doubts: The Consequences of Plastic. Environ. Hist. 1997, 2, 278–300. [Google Scholar] [CrossRef]
- Haque, M.; Goda, K.; Ito, H.; Ogoe, S.; Okamot, M.; Ema, T.; Kagawa, K.; Nogami, H. Melt-Viscosity and Mechanical Behaviour of Polypropylene (PP)/Wood Flour Composites: Effect of Pulverization of Wood Flour with and without Water. Adv. Ind. Eng. Polym. Res. 2018, 2, 42–50. [Google Scholar] [CrossRef]
- Gogoi, R.; Manik, G. Mechanical Properties of Wood Polymer Composites; Mavinkere Rangappa, S., Parameswaranpillai, J., Kumar, M.H., Siengchin, S., Eds.; Composites Science and Technology; Springer: Singapore, 2021; pp. 113–136. [Google Scholar]
- Kazemi Najafi, S. Use of Recycled Plastics in Wood Plastic Composites—A Review. Waste Manag. 2013, 33, 1898–1905. [Google Scholar] [CrossRef]
- Wolcott, M.P. Wood–Plastic Composites. In Encyclopedia of Materials: Science and Technology; Buschow, K.H.J., Cahn, R.W., Flemings, M.C., Ilschner, B., Kramer, E.J., Mahajan, S., Veyssière, P., Eds.; Elsevier: Oxford, UK, 2001; pp. 9759–9763. ISBN 978-0-08-043152-9. [Google Scholar]
- Rowell, R.M. (Ed.) Handbook of Wood Chemistry and Wood Composites, 2nd ed.; CRC Press: Boca Raton, FL, USA, 2012; ISBN 978-1-4398-5381-8. [Google Scholar]
- Jambrekovic, V.; Antonovic, A.; Kljak, J.; Brezovic, M. The Applicability of Wood and Plastic Composites in Construction. In Wood in the Construction Industry: Durability and Quality of Wooden Construction Products, Proceedings of the 7th International Conference, Zagreb, Croatia, 22 April 2005; Faculty of Forestry, University of Zagreb: Zagreb, Croatia, 2005; pp. 93–98. [Google Scholar]
- Xu, H.; Yang, Y.; Li, L.; Liu, B.; Fu, X.; Yang, X.; Cao, Y. Mechanical Properties Variation in Wood—Plastic Composites with a Mixed Wood Fiber Size. Materials 2023, 16, 5801. [Google Scholar] [CrossRef]
- Khamedi, R.; Hajikhani, M.; Ahmaditabar, K. Investigation of Maleic Anhydride Effect on Wood Plastic Composites Behavior. J. Compos. Mater. 2019, 53, 1955–1962. [Google Scholar] [CrossRef]
- Selke, S.E.; Wichman, I. Wood Fiber/Polyolefin Composites. Compos. Part A Appl. Sci. Manuf. 2004, 35, 321–326. [Google Scholar] [CrossRef]
- Lei, Y.; Wu, Q.; Yao, F.; Xu, Y. Preparation and Properties of Recycled HDPE/Natural Fiber Composites. Compos. Part A Appl. Sci. Manuf. 2007, 38, 1664–1674. [Google Scholar] [CrossRef]
- Adhikary, K.B.; Pang, S.; Staiger, M.P. Dimensional Stability and Mechanical Behaviour of Wood–Plastic Composites Based on Recycled and Virgin High-Density Polyethylene (HDPE). Compos. Part B Eng. 2008, 39, 807–815. [Google Scholar] [CrossRef]
- Najafi, S.K.; Hamidinia, E.; Tajvidi, M. Mechanical Properties of Composites from Sawdust and Recycled Plastics. J. Appl. Polym. Sci. 2006, 100, 3641–3645. [Google Scholar] [CrossRef]
- Jayaraman, K.; Halliwell, R. Harakeke (Phormium Tenax) Fibre–Waste Plastics Blend Composites Processed by Screwless Extrusion. Compos. Part B Eng. 2009, 40, 645–649. [Google Scholar] [CrossRef]
- Salthammer, T.; Mentese, S.; Marutzky, R. Formaldehyde in the Indoor Environment. Chem. Rev. 2010, 110, 2536–2572. [Google Scholar] [CrossRef]
- Roffael, E. Volatile Organic Compounds and Formaldehyde in Nature, Wood and Wood Based Panels. Holz Als Roh-Werkstoff 2006, 64, 144–149. [Google Scholar] [CrossRef]
- Adamová, T.; Hradecký, J.; Pánek, M. Volatile Organic Compounds (VOCs) from Wood and Wood-Based Panels: Methods for Evaluation, Potential Health Risks, and Mitigation. Polymers 2020, 12, 2289. [Google Scholar] [CrossRef]
- Hodgson, A.; Beal, D.; McIlvaine, J.E.R. Sources of Formaldehyde, Other Aldehydes and Terpenes in a New Manufactured House. Indoor Air 2003, 12, 235–242. [Google Scholar] [CrossRef]
- Felix, J.S.; Domeno, C.; Nerin, C. Characterization of Wood Plastic Composites Made from Landfill-Derived Plastic and Sawdust: Volatile Compounds and Olfactometric Analysis. Waste Manag. 2013, 33, 645–655. [Google Scholar] [CrossRef]
- Vaisanen, T.; Laitinen, K.; Tomppo, L.; Joutsensaari, J.; Raatikainen, O.; Lappalainen, R.; Yli-Pirila, P. A Rapid Technique for Monitoring Volatile Organic Compound Emissions from Wood-Plastic Composites. Indoor Built Environ. 2018, 27, 194–204. [Google Scholar] [CrossRef]
- Benthien, J.T.; Ohlmeyer, M. Thickness Swelling and Water Absorption of WPC after Immersion in Cold and Boiling Water. Eur. J. Wood Prod. 2013, 71, 437–442. [Google Scholar] [CrossRef]
- Tenorio, C.; Roque, R.; Camacho, D. Physical and Mechanical Properties of Plywood Panels Manufactures with Tropical Plantaion Species for Structural Use. CERNE 2012, 18, 317–325. [Google Scholar] [CrossRef]
- Mancel, V.; Čabalová, I.; Krilek, J.; Olgun, Ç.; Öncel, M.; Tor, O.; Szul, T.; Woroniak, G.; Woroniak, J. Utilization of Waste Rubber Materials After the End of Their Life Cycle in the Production of Three-Layer Particleboards—Physical and Mechanical Properties. Polymers 2025, 17, 998. [Google Scholar] [CrossRef]
- Xu, J.; Sugawara, R.; Widyorini, R.; Han, G.; Kawai, S. Manufacture and Properties of Low-Density Binderless Particleboard from Kenaf Core. J. Wood Sci. 2004, 50, 62–67. [Google Scholar] [CrossRef]
- Tung, C.Y.; Wang, M.H. Comparison of Environmental Performance between Plastic and Steel Fuel Tanks. Proc. Inst. Mech. Eng. Part B-J. Eng. Manuf. 2002, 216, 1443–1457. [Google Scholar] [CrossRef]
- Benrabah, Z.; Thibault, F.; DiRaddo, R. Modeling of Fuel Permeation in Multilayer Automotive Plastic Fuel Tanks. SAE Int. J. Mater. Manuf. 2011, 4, 449–459. [Google Scholar] [CrossRef]
- Alvarado, P.J. Steel vs Plastics: The Competition for Light-Vehicle Fuel Tanks. JOM 1996, 48, 22–25. [Google Scholar] [CrossRef]
- Cho, D.L.; Shin, K.H.; Lee, W.J.; Kim, D.H. Improvement of Paint Adhesion to a Polypropylene Bumper by Plasma Treatment. J. Adhes. Sci. Technol. 2001, 15, 653–664. [Google Scholar] [CrossRef]
- Zhang, H.; Zheng, H. Artificial and Natural Aging of Polypropylene Used in Passenger Vehicle Bumpers. Mater. Plast. 2021, 58, 201–210. [Google Scholar] [CrossRef]
- Rajmohan, K.V.S.; Ramya, C.; Raja Viswanathan, M.; Varjani, S. Plastic Pollutants: Effective Waste Management for Pollution Control and Abatement. Curr. Opin. Environ. Sci. Health 2019, 12, 72–84. [Google Scholar] [CrossRef]
- Wright, S.L.; Kelly, F.J. Plastic and Human Health: A Micro Issue? Environ. Sci. Technol. 2017, 51, 6634–6647. [Google Scholar] [CrossRef]
- Liu, E.K.; He, W.Q.; Yan, C.R. ‘White Revolution’ to ‘White Pollution’—Agricultural Plastic Film Mulch in China. Environ. Res. Lett. 2014, 9, 091001. [Google Scholar] [CrossRef]
- Zhang, X.; Yu, J.; Yan, W.; Wang, Y.; Subramanian, N. A Comprehensive Review of Reverse Logistics in the Automotive Industry. IEEE Access 2023, 11, 47112–47128. [Google Scholar] [CrossRef]
- Krilek, J.; Čabalová, I.; Mancel, V.; Réh, R. Three-Layer Particleboard with Added Rubber. Utility Model No. 10249.2025. (In Slovak). Available online: https://wbr.indprop.gov.sk/WebRegistre/UzitkovyVzor/Detail/81-2024?HlaskaStav=VyhodHlasku&ItemPPType=NotSelected&SearchType=NoSearch&Lang=en&SearchResultsMaxReached=False&HighlightSearchCriteria=True&SearchExternalDatabases=False&IsFulltextSearch=False&SearchTimeout=False&SearchCBO_PoslednyRokPlatnosti=False&SearchCBO_AktualnaPlatnostKonciNasledujuciMesiac=False&IsSearchSimilarMPT=True&IsSearchSimilarMTD=True&IsSearchSimilarMTOP=True&IsSearchSimilarPrihlasovatelovMajitelov=True&IsSearchSimilarPovodcov=True&IsSearchSimilarZnenieReprodukciuOZ=True&IsSearchSimilarCisloZakladnehoPatentu=True&csrt=18118162609265738128 (accessed on 3 April 2025).
- Mancel, V.; Krilek, J.; Čabalová, I.; Réh, R.; Osvaldová, M.; Darabošová, A. Evaluation of selected mechanical and physical properties of particleboards containing waste plastics. Wood Res. 2024, 169–178. [Google Scholar] [CrossRef]
- Čabalová, I.; Krilek, J.; Bubenikova, T.; Ružiak, I.; Němec, M.; Lee, S.H.; Lubis, M.A.; Darabošová, A.; Mancel, V.; Kristak, L.; et al. Utilization of Waste Tire and Rubber from Automobiles in the Manufacturing of Particleboards and Evaluation of Its Properties. Eur. J. Wood Wood Prod. 2025, 83, 67. [Google Scholar] [CrossRef]
- Čabalová, I.; Ház, A.; Krilek, J.; Bubeníková, T.; Melicherčík, J.; Kuvik, T. Recycling of Wastes Plastics and Tires from Automotive Industry. Polymers 2021, 13, 2210. [Google Scholar] [CrossRef]
- ASTM D2395-17; Standard Test Methods for Density and Specific Gravity (Relative Density) of Wood and Wood-Based Materials. ASTM International: West Conshohocken, PA, USA, 2017.
- ASTM D1037-12(2020); Standard Test Methods for Evaluating Properties of Wood-Base Fiber and Particle Panel Materials. ASTM International: West Conshohocken, PA, USA, 2020.
- Požgaj, A.; Chovanec, D.; Kurjatko, S.; Babiak, M. Štruktúra a Vlastnosti Dreva; Druhé vydanie.; Príroda, a.s.: Bratislava, Slovakia, 1997; ISBN 80-07-00960-4. [Google Scholar]
- Deppe, H.-J.; Ernst, K. Taschenbuch Der Spanplattentechnik; DRW Verlag: Stuttgart, Germany, 1991. [Google Scholar]
- Piringer, O.G.; Baner, A.L. Plastic Packaging Materials for Food: Barrier Function, Mass Transport, Quality Assurance, and Legislation; John Wiley & Sons: Hoboken, NJ, USA, 2008; ISBN 978-3-527-61329-8. [Google Scholar]
- Gozdecki, C.; Wilczyński, A.; Kociszewski, M.; Zajchowski, S. Properties of Wood–Plastic Composites Made of Milled Particleboard and Polypropylene. Eur. J. Wood Prod. 2015, 73, 87–95. [Google Scholar] [CrossRef]
- Li, B.; Zheng, Y.; Pan, Z.; Hartsough, B. Improved Properties of Medium-Density Particleboard Manufactured from Saline Creeping Wild Rye and HDPE Plastic. Ind. Crops Prod. 2009, 30, 65–71. [Google Scholar] [CrossRef]
- Chaharmahali, M.; Tajvidi, M.; Kazemi, S. Mechanical Properties of Wood Plastic Composite Panels Made from Waste Fiberboard and Particleboard. Polym. Compos. 2008, 29, 606–610. [Google Scholar] [CrossRef]
- Bütün, F.Y.; Sauerbier, P.; Militz, H.; Mai, C. The Effect of Fibreboard (MDF) Disintegration Technique on Wood Polymer Composites (WPC) Produced with Recovered Wood Particles. Compos. Part A Appl. Sci. Manuf. 2019, 118, 312–316. [Google Scholar] [CrossRef]
- Kamdem, P.; Jiang, H.; Cui, W.; Freed, J.; Matuana, L. Properties of Wood Plastic Composites Made of Recycled HDPE and Wood Flour from CCA-Treated Wood Removed from Service. Compos. Part A Appl. Sci. Manuf. 2004, 35, 347–355. [Google Scholar] [CrossRef]
- Yu, X.; Tor, O.; Quin, F.; Seale, D.; Zhang, J. Screwdriving Torques in Particleboards. Wood Fiber Sci. J. Soc. Wood Sci. Technol. 2015, 47, 17–30. [Google Scholar]
- Tor, O.; Yu, X.; Zhang, J. Characteristics of Torques for Driving Screws into Wood-Based Composites. Wood Fiber Sci. 2015, 47, 2–16. [Google Scholar]
- Zhou, S.; Liu, H.; Ding, Y.; Wu, Y. The Effects of Temperature and Humidity on the VOC Emission Rate from Dry Building Materials. IOP Conf. Ser. Mater. Sci. Eng. 2019, 609, 042001. [Google Scholar] [CrossRef]
- Zhou, Y.; Wu, J. Thermodynamic Properties of O-Xylene, m-Xylene, p-Xylene, and Ethylbenzene. J. Phys. Chem. Ref. Data 2012, 41, 023103. [Google Scholar] [CrossRef]
- Danon, B.; van der Gryp, P.; Schwarz, C.E.; Görgens, J.F. A Review of Dipentene (Dl-Limonene) Production from Waste Tire Pyrolysis. J. Anal. Appl. Pyrolysis 2015, 112, 1–13. [Google Scholar] [CrossRef]
- Pakdel, H.; Pantea, D.M.; Roy, C. Production of Dl-Limonene by Vacuum Pyrolysis of Used Tires. J. Anal. Appl. Pyrolysis 2001, 57, 91–107. [Google Scholar] [CrossRef]
- Honnet, S.; Seshadri, K.; Niemann, U.; Peters, N. A Surrogate Fuel for Kerosene. Proc. Combust. Inst. 2009, 32, 485–492. [Google Scholar] [CrossRef]
- Romanenko, E.P.; Tkachev, A.V. Identification by GC–MS of Cymene Isomers and 3,7,7-Trimethylcyclohepta-1,3,5-Triene in Essential Oils. Chem. Nat. Compd. 2006, 42, 699–701. [Google Scholar] [CrossRef]
- Kim, S.; Kim, J.-A.; Kim, H.-J.; Kim, S.-D. Determination of Formaldehyde and TVOC Emission Factor from Wood-Base Composites by Small Chamber Method. Polym. Test. 2006, 25, 605–614. [Google Scholar] [CrossRef]
- Brown, S. Chamber Assessment of Formaldehyde and VOC Emissions from Wood-Based Panels. Indoor Air 1999, 9, 209–215. [Google Scholar] [CrossRef]
- Yrieix, C.; Dulaurent, A.; Laffargue, C.; Maupetit, F.; Pacary, T.; Uhde, E. Characterization of VOC and Formaldehyde Emissions from a Wood Based Panel: Results from an Inter-Laboratory Comparison. Chemosphere 2010, 79, 414–419. [Google Scholar] [CrossRef]
- Hyttinen, M.; Masalin-Weijo, M.; Kalliokoski, P.; Pasanen, P. Comparison of VOC Emissions between Air-Dried and Heat-Treated Norway Spruce (Picea abies), Scots Pine (Pinus sylvesteris) and European Aspen (Populus tremula) Wood. Atmos. Environ. 2010, 44, 5028–5033. [Google Scholar] [CrossRef]
- Judzentiene, A.; Kupcinskiene, E. Chemical Composition on Essential Oils from Needles of Pinus Sylvestris L. Grown in Northern Lithuania. J. Essent. Oil Res. 2008, 20, 26–29. [Google Scholar] [CrossRef]
- Guillory, J. The Merck Index: An Encyclopedia of Chemicals, Drugs, and Biologicals Edited by Maryadele J. O’Neil, Patricia E. Heckelman, Cherie B. Koch, and Kristin J. Roman. Merck, John Wiley & Sons, Inc., Hoboken, NJ. 2006. xiv + 2564 pp. 18 × 26 cm. ISBN-13 978-0-911910-001. $125.00. J. Med. Chem. 2007, 50, 590. [Google Scholar] [CrossRef]
- Marć, M. Emissions of Selected Monoaromatic Hydrocarbons as a Factor Affecting the Removal of Single-Use Polymer Barbecue and Kitchen Utensils from Everyday Use. Sci. Total Environ. 2020, 720, 137485. [Google Scholar] [CrossRef]
- Lin, S.-Y.; Tseng, J.-M.; Lee, M.-K.; Wu, T.-C.; Shu, C.-M. Thermal Runaway Evaluation of α-Methylstyrene and Trans-β-Methylstyrene with Benzaldehyde. J. Therm. Anal. Calorim. 2009, 95, 559–563. [Google Scholar] [CrossRef]
- Jia, C.; Batterman, S. A Critical Review of Naphthalene Sources and Exposures Relevant to Indoor and Outdoor Air. Int. J. Environ. Res. Public Health 2010, 7, 2903–2939. [Google Scholar] [CrossRef]
- Cui, Y.; Qu, Z. Study on Methenamine Detection in Starch Products through SERS Technology. In Selected Proceedings of the Chinese Society for Optical Engineering Conferences; Bao, W., Lv, Y., Eds.; SPIE: Bellingham, WA, USA, 2016; Volume 9796, p. 97960Z. [Google Scholar]
- Buy 1-Iodotridecane|35599-77-0|BenchChem. Available online: https://www.benchchem.com/product/b1606830 (accessed on 31 March 2025).
- Sitbon, C.; Paliyath, G. 4.28—Pre- and Postharvest Treatments Affecting Nutritional Quality. In Comprehensive Biotechnology, 2nd ed.; Moo-Young, M., Ed.; Academic Press: Burlington, NJ, USA, 2011; pp. 349–357. ISBN 978-0-08-088504-9. [Google Scholar]
- Jiang, C.; Li, D.; Zhang, P.; Li, J.; Wang, J.; Yu, J. Formaldehyde and Volatile Organic Compound (VOC) Emissions from Particleboard: Identification of Odorous Compounds and Effects of Heat Treatment. Build. Environ. 2017, 117, 118–126. [Google Scholar] [CrossRef]
- Montes, M.; Daugulis, A.J.; Veiga, M.C.; Kennes, C. Characterization of Absorbent Polymers for the Removal of Volatile Hydrophobic Pollutants from Air. J. Chem. Technol. Biotechnol. 2011, 86, 47–53. [Google Scholar] [CrossRef]
- Luo, Y.; Li, Z.; Li, X.; Liu, X.; Fan, J.; Clark, J.H.; Hu, C. The Production of Furfural Directly from Hemicellulose in Lignocellulosic Biomass: A Review. Catal. Today 2019, 319, 14–24. [Google Scholar] [CrossRef]
- Zhao, J.; Wang, X.; Hu, J.; Liu, Q.; Shen, D.; Xiao, R. Thermal Degradation of Softwood Lignin and Hardwood Lignin by TG-FTIR and Py-GC/MS. Polym. Degrad. Stabil. 2014, 108, 133–138. [Google Scholar] [CrossRef]
- Van Den Velde, S.; Van Steenberghe, D.; Van Hee, P.; Quirynen, M. Detection of Odorous Compounds in Breath. J. Dent. Res. 2009, 88, 285–289. [Google Scholar] [CrossRef]
- Pohleven, J.; Burnard, M.D.; Kutnar, A. Volatile Organic Compounds Emitted from Untreated and Thermally Modified Wood-a Review. Wood Fiber Sci. 2019, 51, 231–254. [Google Scholar] [CrossRef]
- Gierlinger, N.; Jacques, D.; Schwanninger, M.; Wimmer, R.; Pâques, L. Heartwood Extractives and Lignin Content of Different Larch Species (Larix sp.) and Relationships to Brown-Rot Decay-Resistance. Trees 2004, 18, 230–236. [Google Scholar] [CrossRef]
- Fuller, J.; White, D.; Yi, H.; Colley, J.; Vickery, Z.; Liu, S. Analysis of Volatile Compounds Causing Undesirable Odors in a Polypropylene—High-Density Polyethylene Recycled Plastic Resin with Solid-Phase Microextraction. Chemosphere 2020, 260, 127589. [Google Scholar] [CrossRef]
- Kang, D.H.; Choi, D.H.; Yeo, M.S.; Kim, K.W. Evaluation of VOC Emission and Sorption Characteristics of Low-VOC Adhesive-Bonded Building Materials. J. Adhes. Sci. Technol. 2013, 27, 683–698. [Google Scholar] [CrossRef]

| Layer | Wood Particles (g) | Resin (g) | Paraffin Emulsion (g) | Hardener (g) | Plastic Granulate (g) |
|---|---|---|---|---|---|
| Surface Up | 335 | 51.95 | 7.25 | 2.2 | 0 |
| Core layer | 888.3 | 99.1 | 16.3 | 8.4 | 98.7 |
| Surface Down | 335 | 51.95 | 7.25 | 2.2 | 0 |
| Signification | Composite Characteristics |
|---|---|
| P | Reference three-layer particleboard without plastic filler |
| FT10 | Three-layer particleboard with 10% fuel tanks in core layer |
| PB10 | Three-layer particleboard with 10% painted bumpers in core layer |
| UB10 | Three-layer particleboard with 10% unpainted bumpers in core layer |
| Sample | Explanation of the Designation |
|---|---|
| P_35; P_50; P_100; P_150 | Reference particleboard, VOC analysis at 35, 50, 100, and 150 °C |
| UB_35; UB_50; UB_100; UB_150 | Unpainted bumpers, VOC analysis at 35, 50, 100, and 150 °C |
| UB10_35; UB10_50; UB10_100; UB10_150 | Particleboard with 10% unpainted bumpers content in the core layer, VOC analysis 35, 50, 100, and 150 °C |
| PB_35; PB_50; PB_100; PB_150 | Painted bumpers, VOC analysis at 35, 50, 100, and 150 °C |
| PB10_35; PB10_50; PB10_100; PB10_150 | Particleboard with 10% painted bumpers content in the core layer, VOC analysis at 35, 50, 100, and 150 °C |
| FT_35; FT_50; FT_100; FT_150 | Fuel tanks, VOC analysis at 35, 50, 100, and 150 °C |
| FT10_35; FT10_50; FT10_100; FT10_150 | Particleboard with 10% fuel tanks content in the core layer, VOC analysis at 35, 50, 100, and 150 °C |
| Sample | Density (g·cm−3) |
|---|---|
| P | 0.72 ± 0.008 |
| FT10 | 0.72 ± 0.029 |
| PB10 | 0.70 ± 0.023 |
| UB10 | 0.71 ± 0.031 |
| Composite Sample | Water Absorption (%) | Thickness Swelling (%) | ||
|---|---|---|---|---|
| 2 h | 24 h | 2 h | 24 h | |
| P | 12.8 * ± 1.85 | 40.0 * ± 5.35 | 5.6 * ± 0.86 | 18.0 * ± 2.87 |
| FT10 | 12.7 * ± 2.15 | 41.9 * ± 7.53 | 4.7 * ± 0.20 | 16.8 * ± 2.26 |
| PB10 | 11.8 * ± 1.78 | 41.6 * ± 10.05 | 5.1 * ± 1.15 | 18.1 * ± 3.64 |
| UB10 | 10.8 * ± 1.38 | 36.9 * ± 4.78 | 5.5 * ± 1.37 | 16.8 * ± 1.73 |
| F | 1.831 | 0.754 | 1.025 | 0.505 |
| Sig. | 0.168 | 0.531 | 0.399 | 0.683 |
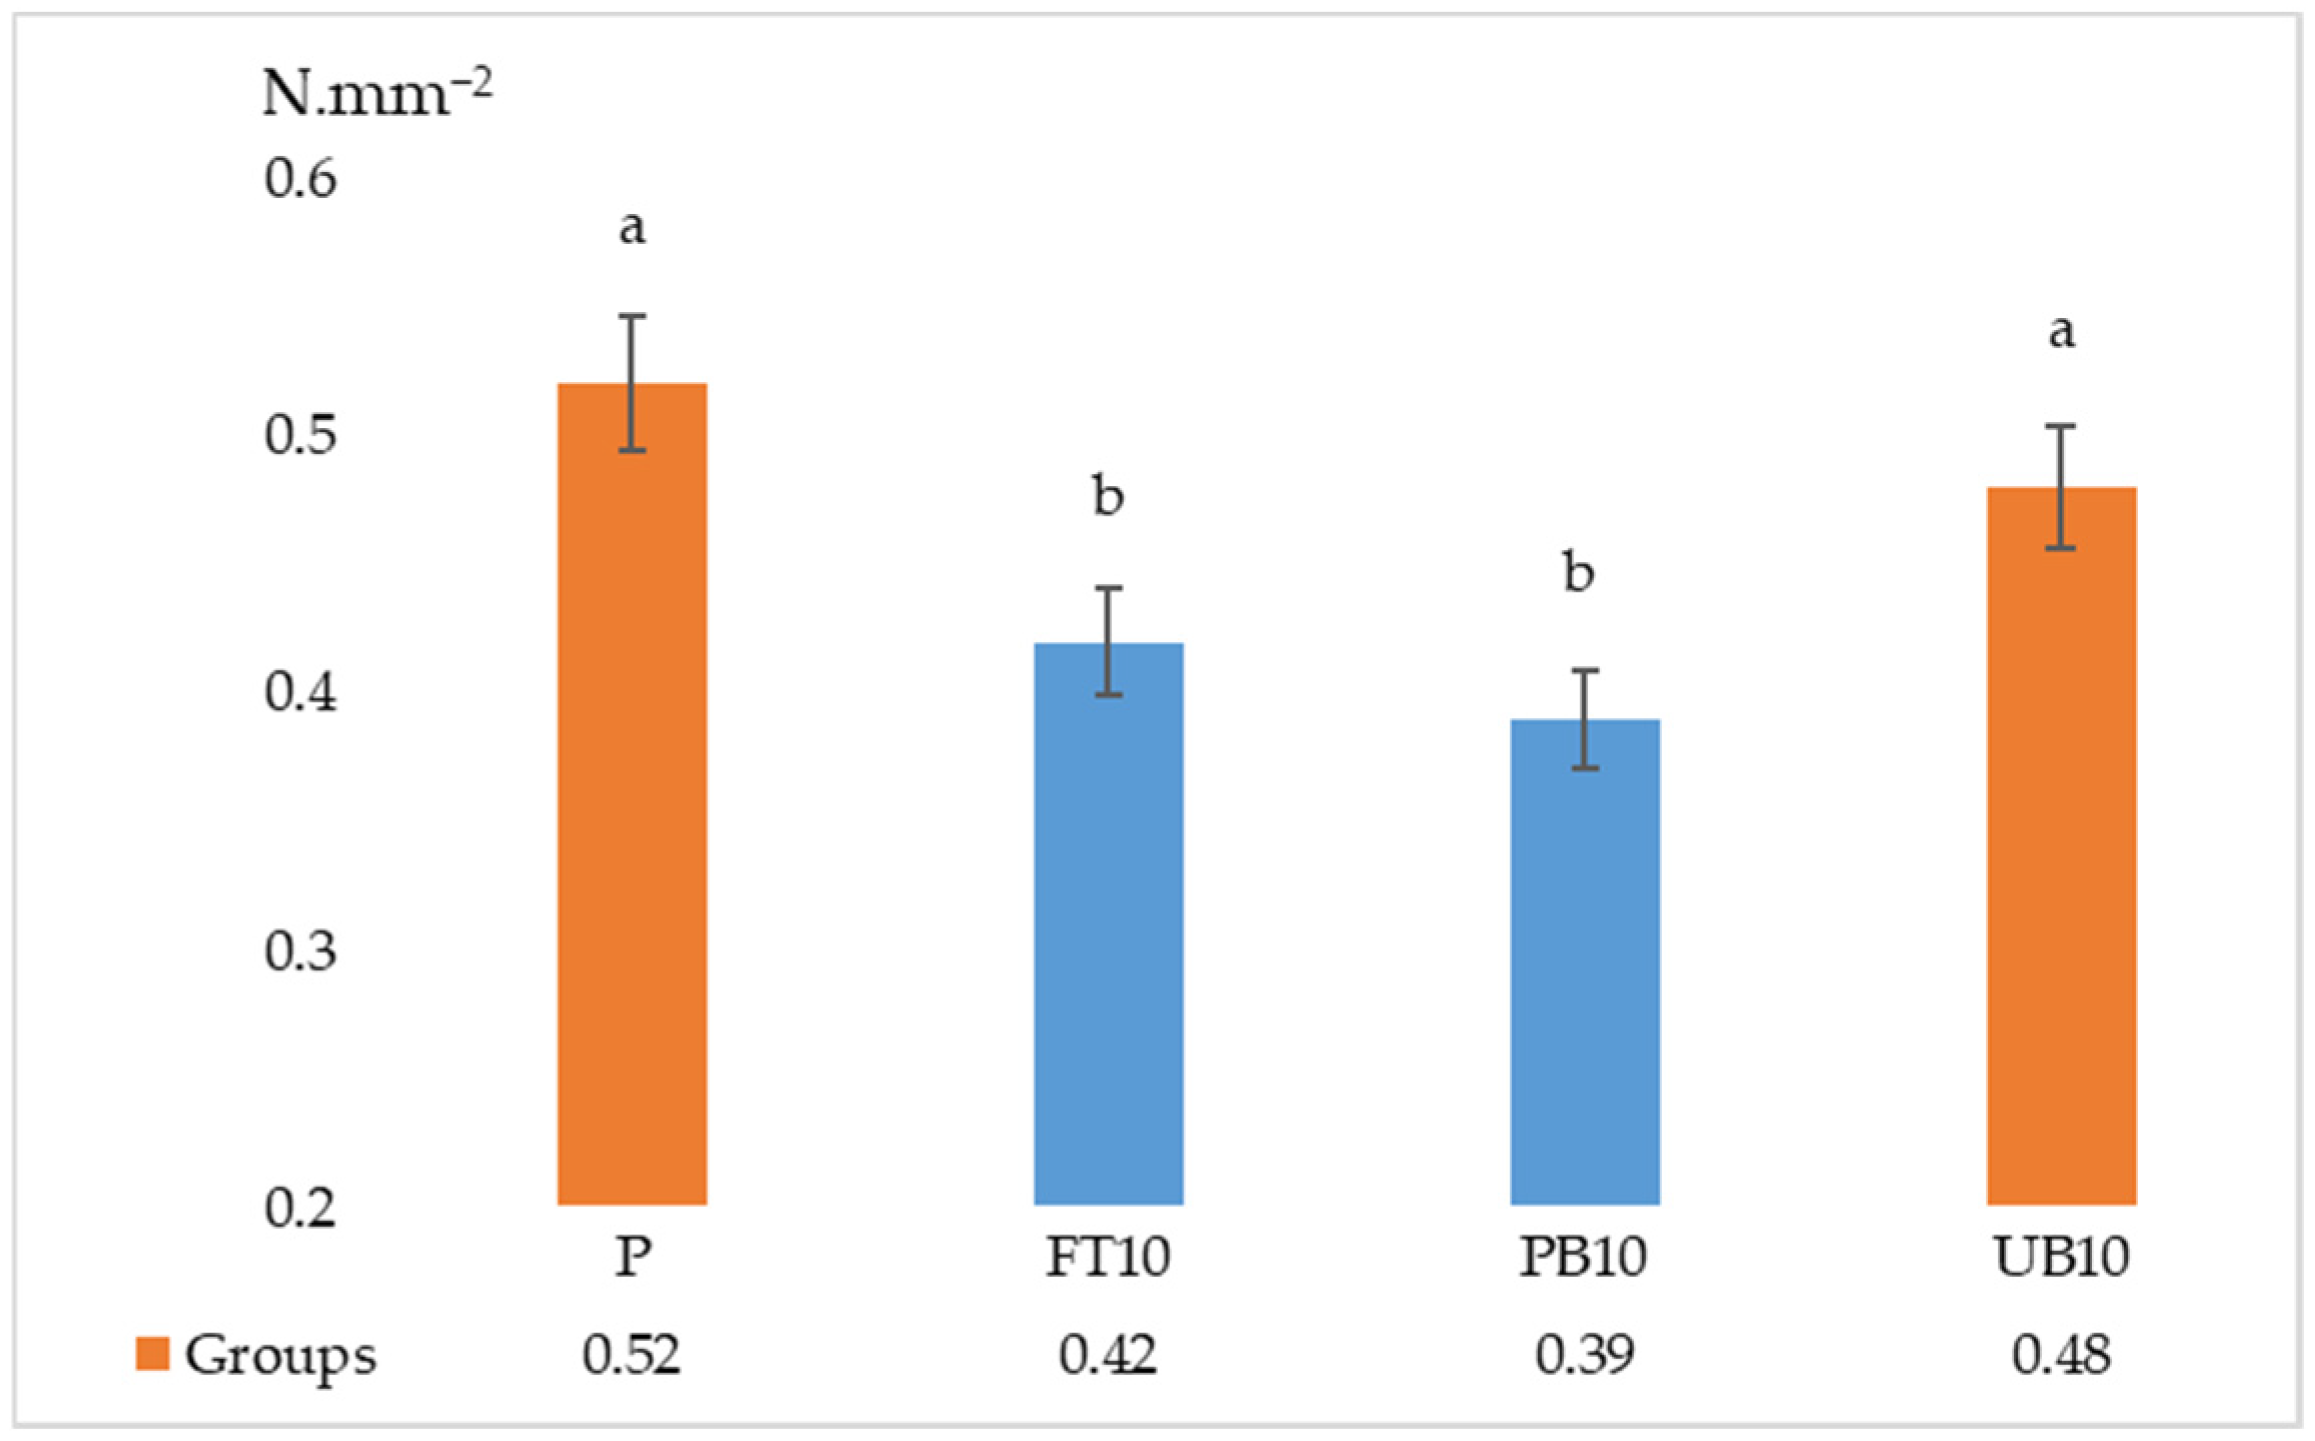
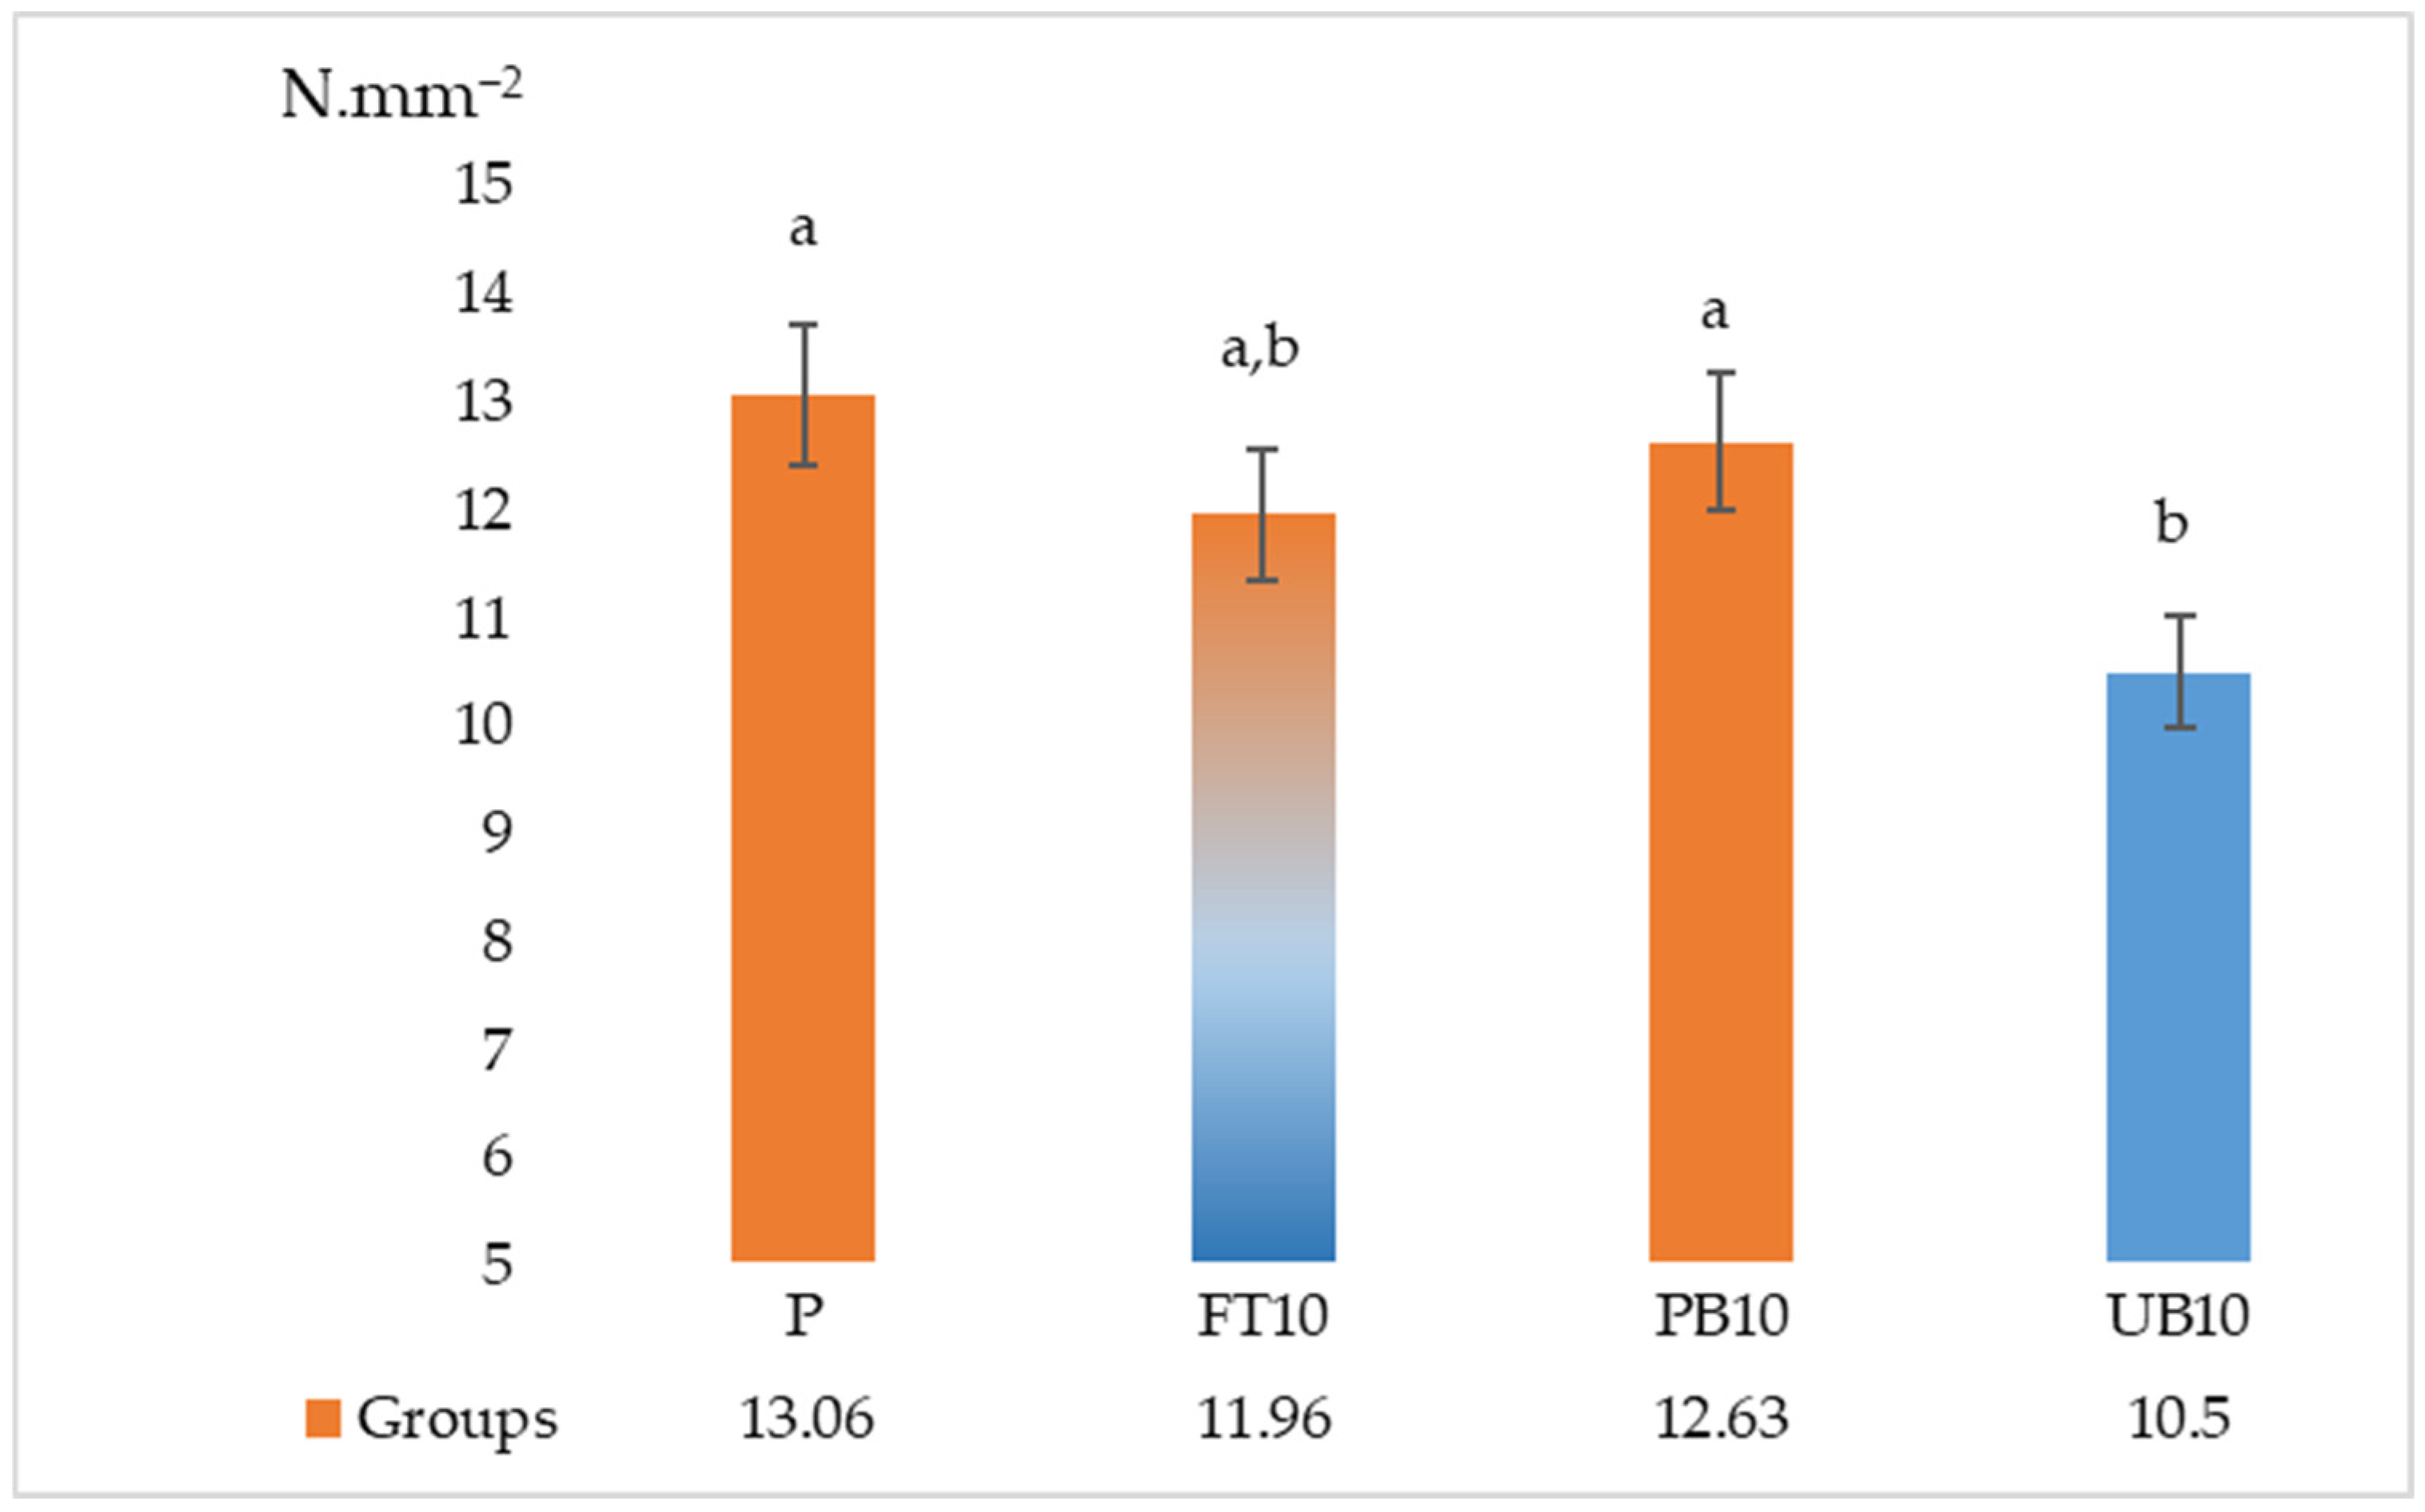
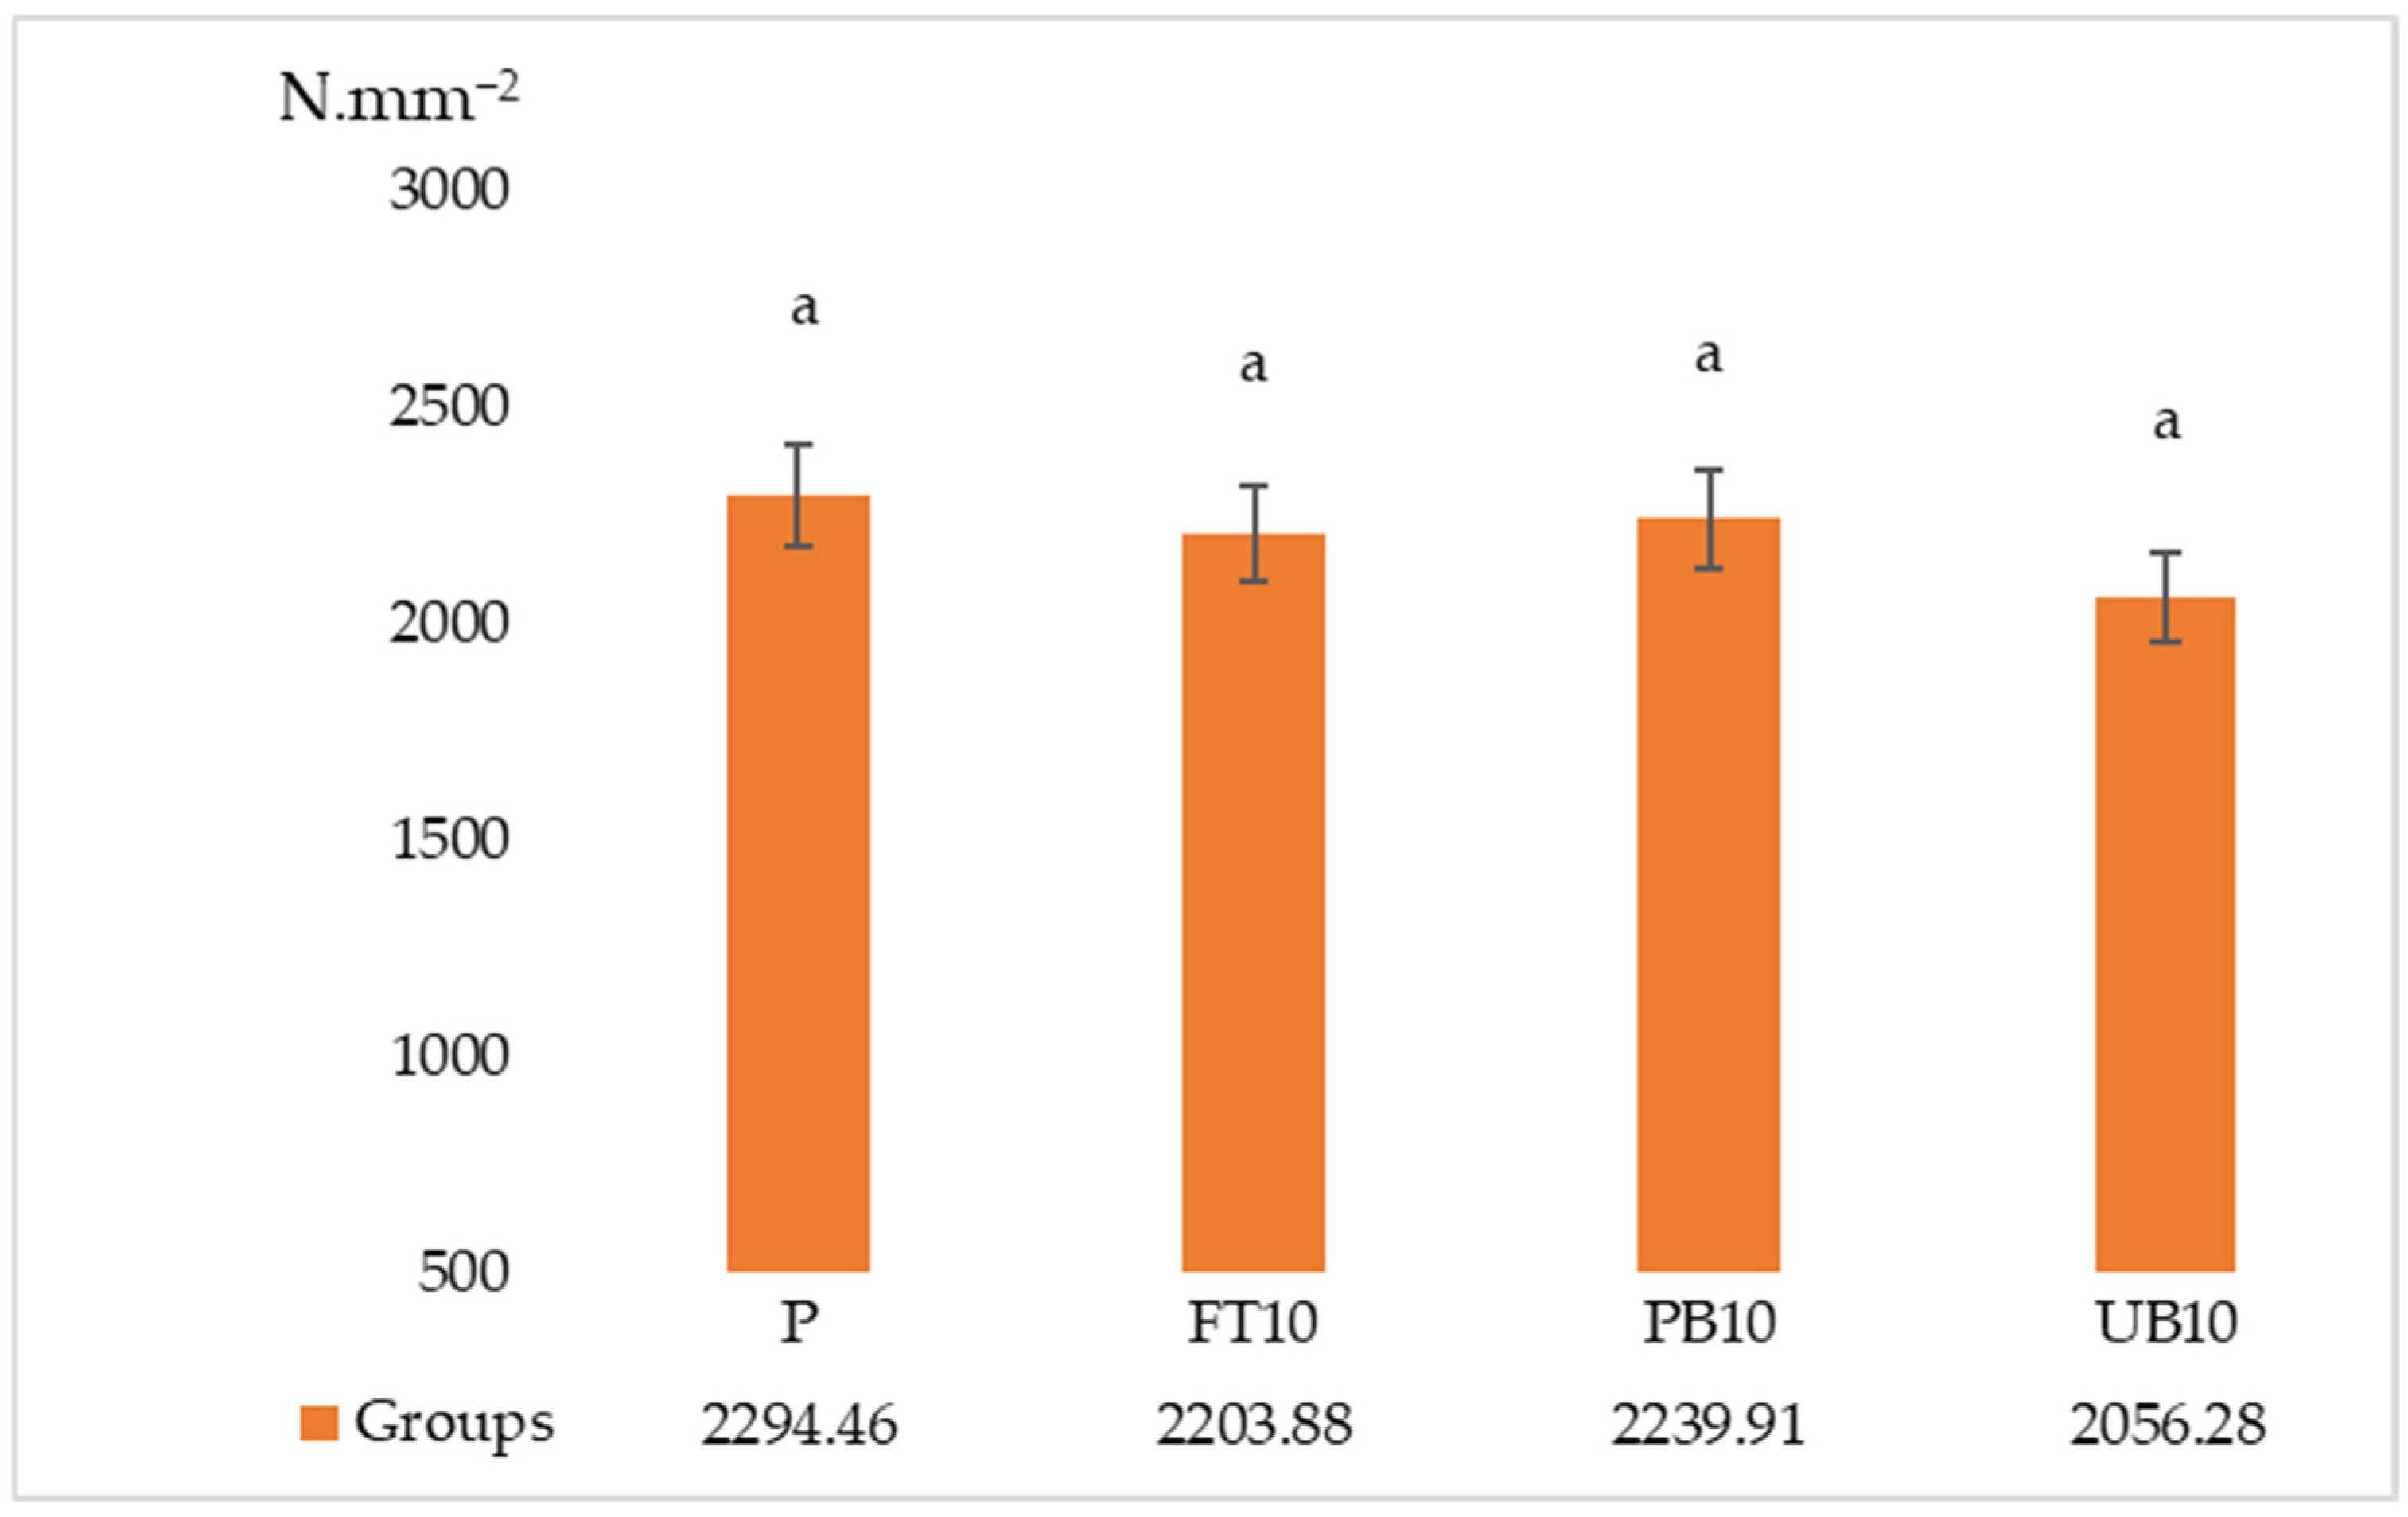
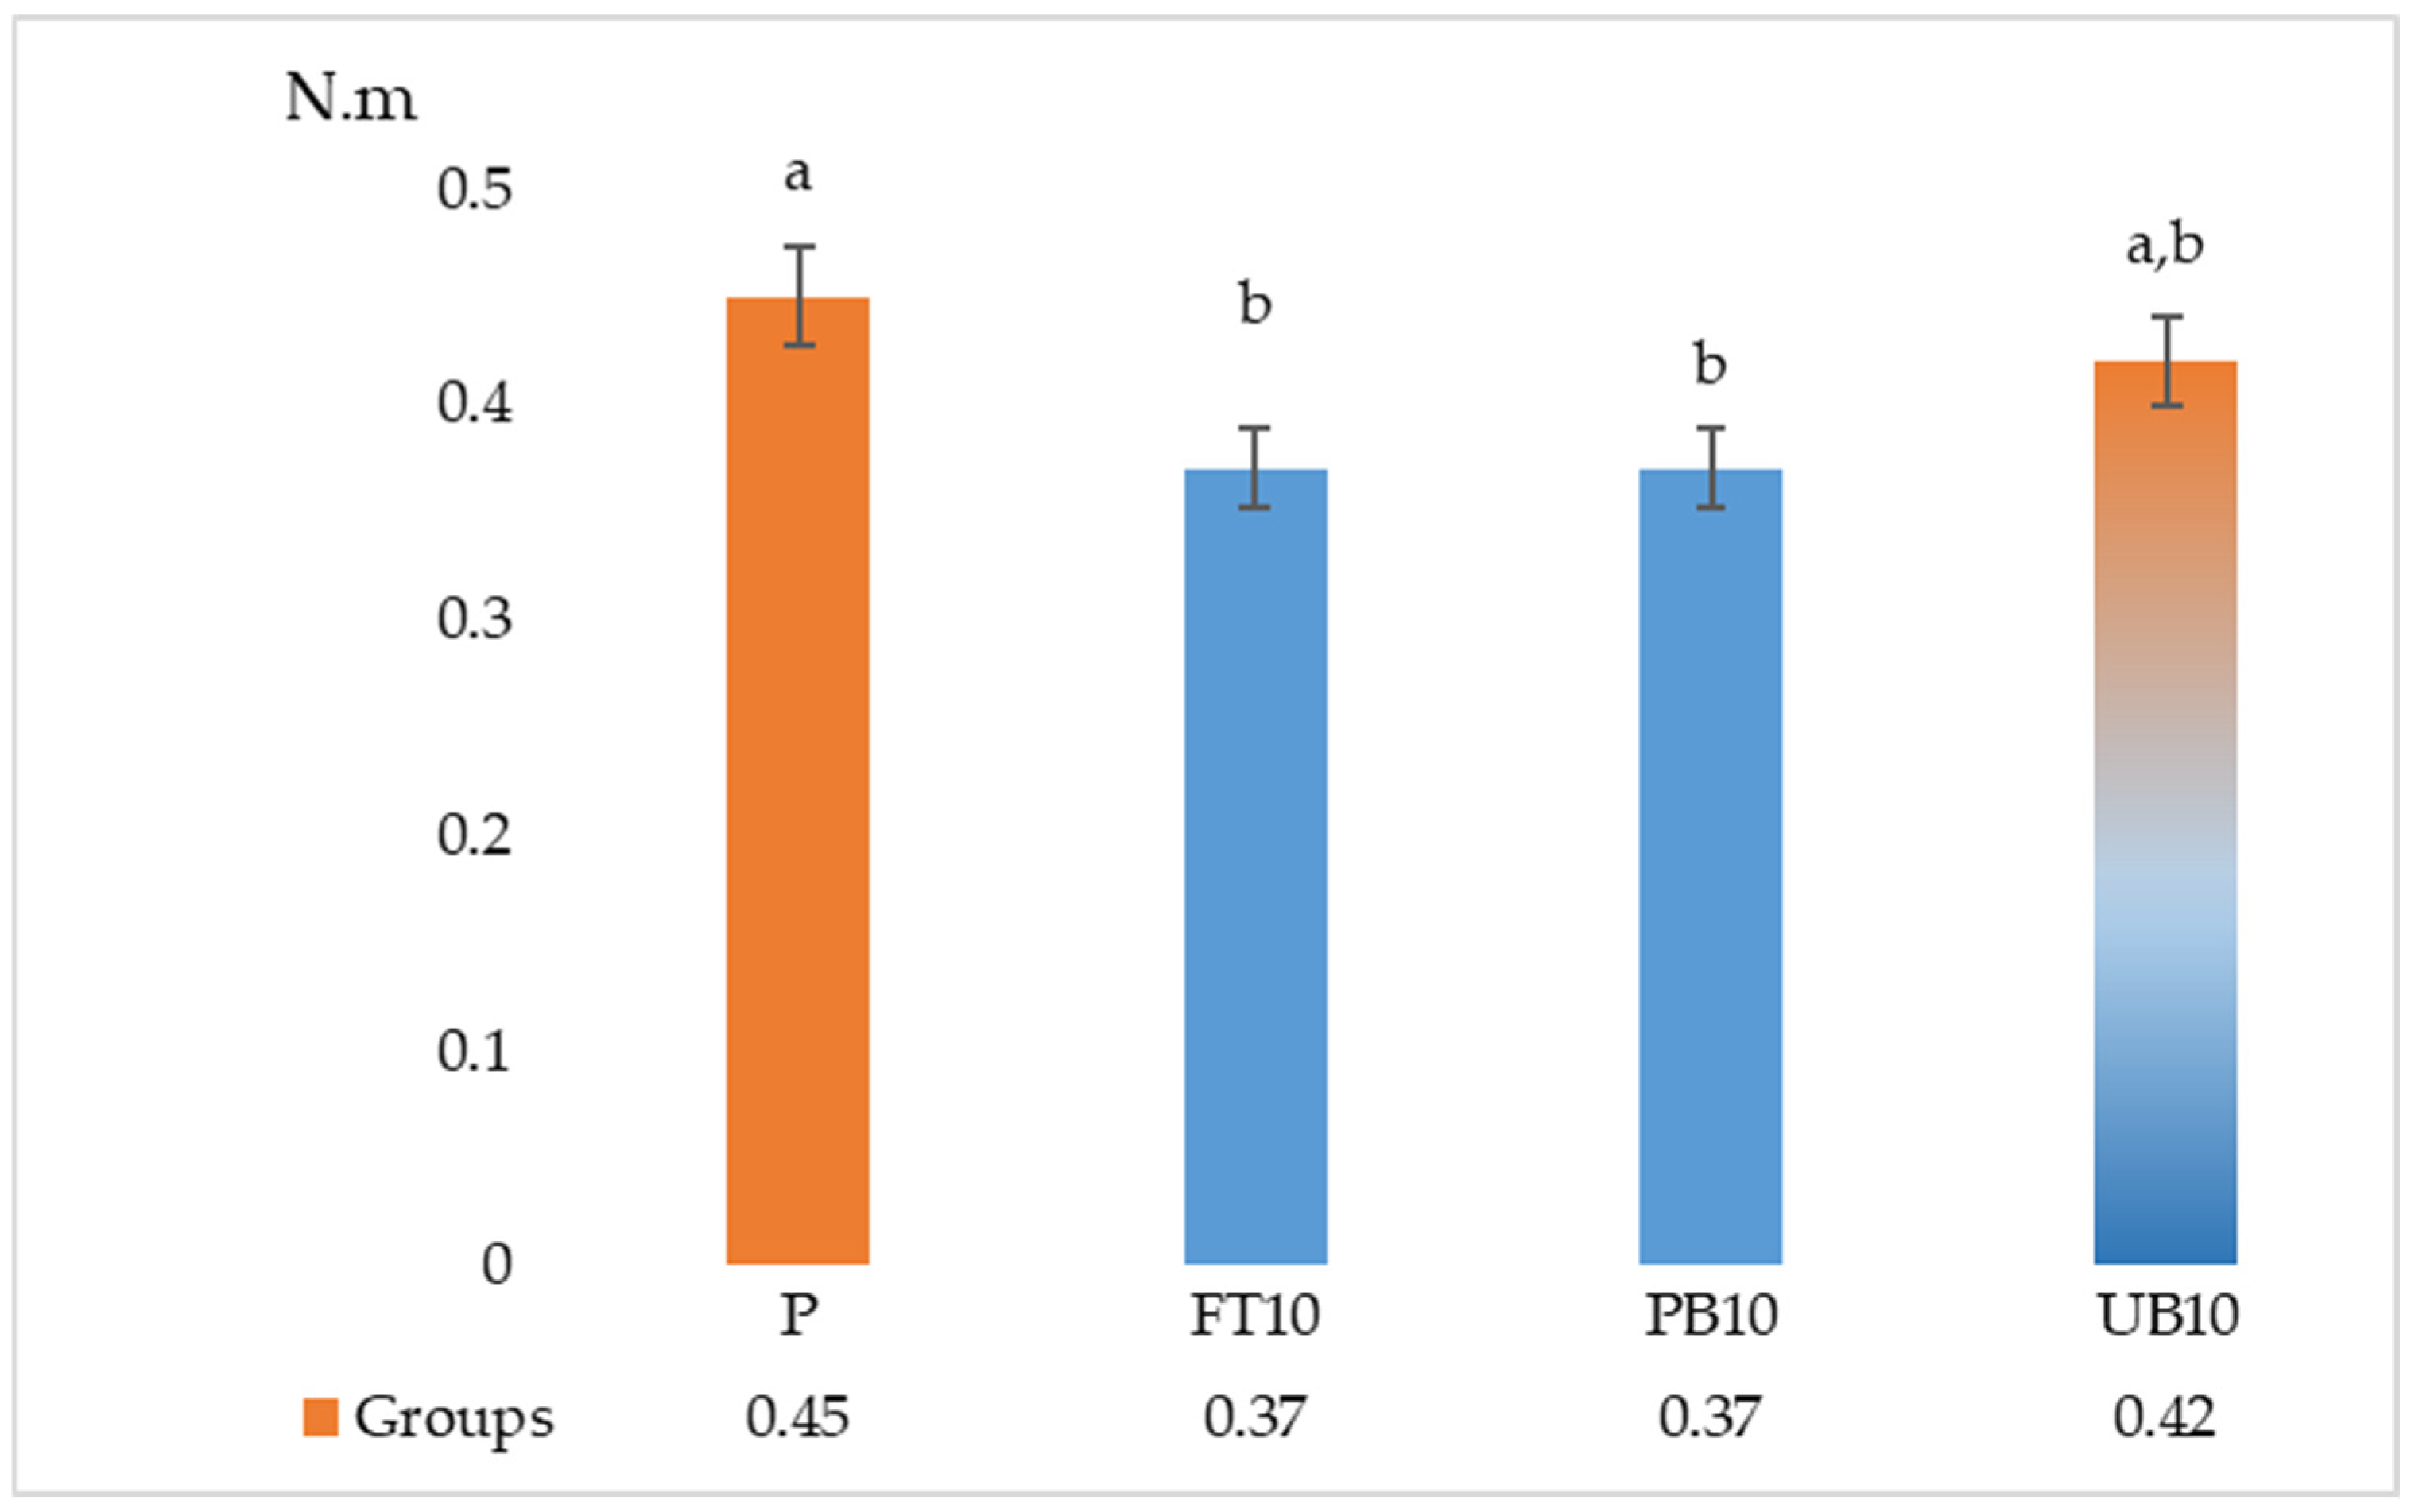
| Composite Sample | IB (MPa) | MOR (MPa) | MOE (MPa) | SDT (N·m) | |
|---|---|---|---|---|---|
| SeT | StT | ||||
| P | 0.52 a ± 0.05 | 13.06 a ± 1.25 | 2294.46 * ± 275.44 | 0.45 a ± 0.04 | 1.45 * ± 0.06 |
| FT10 | 0.42 b ± 0.05 | 11.96 ab ± 1.47 | 2203.88 * ± 146.27 | 0.37 b ± 0.03 | 1.31 * ± 0.14 |
| PB10 | 0.39 b ± 0.05 | 12.63 a ± 1.11 | 2239.91 * ± 207.33 | 0.37 b ± 0.03 | 1.28 * ± 0.06 |
| UB10 | 0.48 a ± 0.05 | 10.50 b ± 1.27 | 2056.28 * ± 199.57 | 0.42 ab ± 0.08 | 1.30 * ± 0.14 |
| F | 9.313 | 4.314 | 1.505 | 3.743 | 2.072 |
| Sig. | 0.000 | 0.017 | 0.244 | 0.024 | 0.131 |
Disclaimer/Publisher’s Note: The statements, opinions and data contained in all publications are solely those of the individual author(s) and contributor(s) and not of MDPI and/or the editor(s). MDPI and/or the editor(s) disclaim responsibility for any injury to people or property resulting from any ideas, methods, instructions or products referred to in the content. |
© 2025 by the authors. Licensee MDPI, Basel, Switzerland. This article is an open access article distributed under the terms and conditions of the Creative Commons Attribution (CC BY) license (https://creativecommons.org/licenses/by/4.0/).
Share and Cite
Darabošová, A.; Bubeníková, T.; Čabalová, I.; Badida, M.; Olgun, Ç.; Tor, Ö.; Öncel, M. Mechanical Properties, Physical Properties and VOC Emissions of Three-Layer Particleboards with Recycled Automotive Plastics in the Core Layer. Polymers 2025, 17, 1438. https://doi.org/10.3390/polym17111438
Darabošová A, Bubeníková T, Čabalová I, Badida M, Olgun Ç, Tor Ö, Öncel M. Mechanical Properties, Physical Properties and VOC Emissions of Three-Layer Particleboards with Recycled Automotive Plastics in the Core Layer. Polymers. 2025; 17(11):1438. https://doi.org/10.3390/polym17111438
Chicago/Turabian StyleDarabošová, Anna, Tatiana Bubeníková, Iveta Čabalová, Miroslav Badida, Çağrı Olgun, Önder Tor, and Mustafa Öncel. 2025. "Mechanical Properties, Physical Properties and VOC Emissions of Three-Layer Particleboards with Recycled Automotive Plastics in the Core Layer" Polymers 17, no. 11: 1438. https://doi.org/10.3390/polym17111438
APA StyleDarabošová, A., Bubeníková, T., Čabalová, I., Badida, M., Olgun, Ç., Tor, Ö., & Öncel, M. (2025). Mechanical Properties, Physical Properties and VOC Emissions of Three-Layer Particleboards with Recycled Automotive Plastics in the Core Layer. Polymers, 17(11), 1438. https://doi.org/10.3390/polym17111438