Article

Polymeric Membrane Contactors for CO2 Separation: A Systematic Literature Analysis of the Impact of Absorbent Temperature

by
Edoardo Magnone
,
Min Chang Shin
and
Jung Hoon Park
*
Department of Chemistry & Biochemical Engineering, Dongguk University, Manhae gwan, Room E629, 30, Pildong-ro 1gil, Jung-gu, Seoul 100-715, Republic of Korea
*
Author to whom correspondence should be addressed.
Polymers 2025, 17(10), 1387; https://doi.org/10.3390/polym17101387
Submission received: 21 April 2025 / Revised: 13 May 2025 / Accepted: 15 May 2025 / Published: 18 May 2025
(This article belongs to the Special Issue Polymer Materials for Environmental Applications)

Abstract

:
Global warming, driven significantly by carbon dioxide (CO2) emissions, necessitates immediate climate action. Consequently, CO2 capture is essential for mitigating carbon output from industrial and power generation processes. This study investigates the effect of absorbent temperature on CO2 separation performance using gas–liquid polymeric hollow fiber membrane (HFM) contactors. It summarizes the relationship between liquid-phase temperature and CO2 capture efficiency across various physical and chemical absorption processes. Twelve relevant studies (nine experimental, three mathematical), providing a comprehensive database of 104 individual measurements, were rigorously analyzed. Liquid-phase temperature significantly influences CO2 separation performance in HFM contactors. In particular, the present analysis reveals that, overall, for every 10 °C temperature increase, physical absorption performance decreases by approximately 3%, while chemical absorption performance improves by 3%, regardless of other parameters. This empirical law was confirmed by direct comparisons with additional experimental results. Strategies for further development of these processes are also proposed.

Graphical Abstract

1. Introduction

1.1. Background

The removal and recovery of carbon dioxide (CO2), the most significant greenhouse gas, has attracted a lot of attention as a consequence of an increase in greenhouse gas emissions [1]. Typically, two distinct contacting processes—such as absorption and stripping towers—are used for CO2 capture and then for its extraction from absorbents. This is particularly important when considering the presence of CO2 as an undesirable side product in various industrial processes, where gas streams require treatment before being dispersed in the environment [2].
Gas–liquid polymeric membrane contactors (MCs) represent an advanced phase-contacting device for CO2 removal [3,4]. The principle of an MC is to facilitate contact between two distinct phases using a porous membrane, which acts as a physical barrier between a CO2-rich gas phase and a CO2-poor liquid phase [3,4]. This enables the liquid phase on one side of the porous membrane to selectively capture CO2 from the other side. As CO2 is absorbed by the liquid, it is removed from the gas mixture. Unlike traditional approaches like cryogenic processes and pressure swing absorption, membrane separation techniques offered by MC present several advantages [5]. These encompass decreased energy consumption, diminished operational costs, compact unit sizes, large contact surfaces, and the absence of moving parts. Consequently, the utilization of polymeric hollow fiber membrane (HFM) systems holds particular promise due to their extensive contact areas and inherent scalability [6,7,8,9].
For a more comprehensive review of the gas separation concepts, gas transport mechanism, and fabrication process of HFMs, we recommend the recent reviews by Li et al. [8], Li et al. [10], and Imtiaz et al. [11].
HFMs offer benefits compared to flat sheet membranes, including a large membrane surface area and a sturdy structure with high-density packing [12]. A single polymeric HFM typically comprises a membrane material that shapes a hollow core to form a small tubular structure measuring approximately 0.5 to 10 mm in diameter. Normally, polymeric HFMs consist of microporous regions with a three-dimensional porous structure. They often have a solid layer either inside or outside and may exhibit radial finger-like formations [13].
CO2 separation through absorption using HFMs can be divided into physical and chemical absorption [14]. Physical absorption involves CO2 dissolving into a solvent (i.e., H2O) without any chemical reaction taking place, while chemical absorption entails a reaction between CO2 and the absorbing solvent [9,15,16]. In detail, chemical absorption involves a chemical reaction between CO2 and the liquid phase. In contrast, the driving force for CO2 removal in a physical solvent is based on the solubility of CO2 [16].
Efficient CO2 separation is essential for many clean energy applications [4]. This study aims to evaluate all existing evidence regarding the relationship between liquid-phase temperature and CO2 capture efficiency. The focus is on various physical and chemical absorption processes employed by different gas–liquid polymeric HFM devices. To the best of our knowledge, this is the first analysis examining the impact of liquid-phase temperature on CO2 capture performance in polymeric HFM contactors.

1.2. CO2 Capture Using a Physical Absorption Process

When CO2 gas dissolves in water, carbonic acid ( H 2 CO 3 aq ) is formed, from which hydrogen ions ( H 3 O + ) dissociate, increasing the acidity of the liquid system through the following reactions:
CO 2 g   CO 2 aq
H 2 O l + CO 2 g   H 2 CO 3 aq
H 2 CO 3 aq + H 2 O l   HCO 3 aq +   H 3 O +
HCO 3 aq +   H 2 O l CO 3 2 aq +   H 3 O +
where the enthalpy values (∆H) for Equations (1), (3), and (4) are approximately −20 kJ, 10 kJ, and 13 kJ, respectively [17].
Table 1 shows how CO2 solubility in water changes with temperature, ranging from 0 to 90 °C at atmospheric pressure [18]. CO2 solubility in water decreases significantly with rising water temperature, particularly between 0 and 20 °C [19,20]. In addition, CO2 physical solubility decreases with increasing temperature (0–90 °C [18]; 0–100 °C [20]) and increases with increasing pressure (0.49–9.87 atm [18]; 25–700 atm [20]). For example, Boributh et al. [21] observed a substantial decrease in CO2 removal rate, from approximately 9 × 10⁻⁴ mol/m2s to about 1.5 × 10⁻⁴ mol/m2s, as the water temperature increased from 5 °C to 85 °C. This demonstrates that CO2 solubility in water is highly sensitive to even small temperature changes. At 25 °C, it was 0.815 mol/mol, while at 30 °C (just 5 °C higher), it decreased to 0.706 mol/mol, as reported by Versteeg and Van Swaaij [22]. Consequently, optimal conditions for the physical CO2 removal process occur at low temperatures [16,23].

1.3. CO2 Capture Using a Chemical Absorption Process

The chemical mechanism, intuitively determined by the properties of the absorbents, involves the capture and removal of CO2 from the gas stream. Research primarily focuses on three types of chemical absorbents: aqueous alkaline solvents such as sodium hydroxide (NaOH) and potassium hydroxide (KOH), alkali salt solvents like sodium carbonate (Na2CO3) and potassium carbonate (K2CO3), and aqueous amine solvents.

1.3.1. Aqueous Alkaline Solvents

To enhance the solubility of CO2 in water (see Equations (1)–(4)), promoting increased deprotonation of H 2 CO 3 via Equations (3) and (4) with basic substances like Group I metal hydroxides is essential. Consequently, the chemical absorption process using an aqueous alkali hydroxide can be summarized by the following reaction:
2   NaOH aq + CO 2 g   Na 2 CO 3 aq +   H 2 O l
The CO2 from the CO2-rich phase is absorbed through the polymeric HFM system by an alkaline NaOH solution to produce dissolved sodium carbonate [17,24]. The CO2 removal reactions with NaOH and KOH are strongly exothermic, with a ∆H° of −90 kJ and −49 kJ, respectively [17]. This indicates an inverse relationship between temperature and the chemical affinity between CO2 molecules and the absorbent. Increasing the liquid absorbent’s temperature accelerates the chemical reaction between hydroxide ions and CO2 gas, which improves the CO2 capture reaction [25].
Furthermore, as the absorbent temperature increases, the viscosity of the liquid absorbent decreases while diffusion increases, leading to an enhancement in the mass transfer rate. For example, according to Vazquez et al. [26], the viscosities of 1 mol/dm3 NaOH at 25 °C and 40 °C were 0.9281 mPa s and 0.6817 mPa s, respectively. In conclusion, increasing the temperature of an aqueous alkaline solvent also proves beneficial in reducing its viscosity.

1.3.2. Alkali Salt Solvents

A second absorption system can be based on alkali salt solvents (e.g., Na2CO3, K2CO3, etc.) that primarily function through the CO2 chemical absorption with the formation of stable carbonate and bicarbonate complexes [27]. However, these solvents have some disadvantages that limit their use in polymeric HFM applications, like relatively slow reaction rates, low mass transfer rates, and high operating temperatures. While some references indicate compatibility with HFM materials, they do not specify which polymers were employed or their chemical–thermal stability characteristics [28,29,30]. An extensive review by Borhani et al. provides a state-of-the-art review of research on CO2 capture using potassium carbonate-based processes [31].

1.3.3. Aqueous Amine Solvents

The improvement of CO2 absorption by the use of aqueous amine solvents, particularly monoethanolamine (MEA; HOCH2CH2NH2; CAS 141-43-5), is the main focus of recent research on CO2 capture [32]. The reaction between a liquid primary amine like MEA and CO2 in a chemical absorption process is presented as follows:
CO 2 + 2 HOCH 2 CH 2 NH 2 HOCH 2 CH 2 NHCOO   HOCH 2 CH 2 NH 3 +
Instead, the reaction of secondary amines (i.e., DEA; HN(CH2CH2OH)2; CAS 111-42-2) for CO2 chemical absorption is presented as follows:
CO 2 + 2 HN CH 2 CH 2 OH 2 HOCH 2 CH 2 2 NCOO   HOCH 2 CH 2 2 NH 2 +
HOCH 2 CH 2 2 NCOO   HOCH 2 CH 2 2 NH 2 + + H 2 O HOCH 2 CH 2 2 NH 2 +   HCO 3 + HOCH 2 CH 2 2 NH ,
In these last two cases (Equations (7) and (8)), it can be observed that, theoretically, 1 mol of aqueous primary and secondary amines always reacts with 0.5 mol of CO2.
The reaction between aqueous tertiary amines (i.e., TEA; N(CH2CH2OH)3; CAS 102-71-6) and CO2 results in the formation of the bicarbonate ion ( HCO 3 ). This chemical reaction can be represented as follows:
CO 2 +   R R R N   + H 2 O HCO 3 +   R R R N   + H
CO 2 +   N CH 2 CH 2 OH 3 + H 2 O HCO 3 + HOCH 2 CH 2 3 N + H
The stoichiometric absorption capacity of CO2 for tertiary amines can reach 1.0 mol of CO2 per mole of amine. Tertiary amines react with CO2 at the lowest rates because the kinetics of bicarbonate production are typically slow [33].
Primary amines typically exhibit high CO2 absorption heats, ranging from −80 to −100 kJ/mole [34]. Secondary amines provide a balance, combining the faster reaction rates of primary amines with the lower reaction heats of tertiary amines, with their typical reaction heat falling between −70 kJ/mol and −90 kJ/mol [34]. Tertiary amines work differently; the reaction mechanism of tertiary amines involves promoting CO2 hydration through bicarbonate ion ( HCO 3 ) formation [35]. This fact makes the absorption rate slower compared to the others. However, their absorption heat, ranging between −50 and −70 kJ/mole, makes them appealing for CO2 capture using amine-based liquids due to the potential for reduced energy use during regeneration [34]. Thus, their relatively low absorption heat results in less heat generation during the reaction, requiring less energy for regeneration and leading to a more energy-efficient process.
The liquid feed temperature significantly affects the physical and chemical absorption of CO2. This, in turn, influences the overall CO2 capture performance of microporous HFM systems. Essentially, the optimal temperature for CO2 capture depends on achieving a balance between different properties. Increasing the liquid feed temperature can improve the CO2 chemical absorption properties. However, higher temperatures can also lead to increased water evaporation from the absorbent solution, potentially blocking the HFM pores and thereby reducing CO2 diffusion. On the other side, as temperature rises, the CO2 back-pressure can also increase, reducing the driving force for CO2 removal into the CO2-poor liquid phase [4]. In addition, temperature is also a critical factor in thermal amine degradation and corrosion risk when the CO2 loading is elevated [36].
This study investigates the role of liquid-phase temperature in optimizing CO2 separation processes using gas–liquid polymeric HFM contactors.

1.4. Outline

This study comprehensively examines the impact of liquid feed temperature on CO2 absorption within various polymeric HFM designs by selecting core literature on the topic of CO2 separation. Building on existing research, the paper is divided into two main parts. The first section provides a foundational overview of the fundamental mechanisms of CO2 capture, encompassing both physical absorption (using water as a solvent) and chemical absorption (using alkaline, alkali salt, and amine solvents).
The second section of the present work examines the effect of liquid feed temperature on CO2 capture performance in polymeric HFM devices, comprehensively analyzing the collective behavior observed across the gathered experimental data from various selected research studies.
Finally, the paper concludes with a summary of key findings and offers suggestions for future research directions. This work provides an overview of how liquid feed temperature affects CO2 separation in polymeric HFM devices, focusing on both physical and chemical absorption processes and examining the impact of temperature on each.

2. Methodology

To identify relevant literature, a comprehensive keyword search was conducted across three major academic databases (Google Scholar, Web of Science, and Scopus). The search focused on two key areas:
  • CO2 capture utilizing polymeric HFM devices;
  • the influence of liquid feed temperature on CO2 absorption performance.
The keyword search included terms such as “CO2”, “hollow fiber membrane(s)”, “polymeric hollow fiber(s)”, “separation”, “liquid”, “phase”, “feed”, and “temperature”. Approximately 5000 scientific papers were found in the first search.
To ensure the quality of the dataset, the initial search results were subsequently carefully screened. Studies were automatically excluded from the initial database based on the absence of essential chemical and physical information regarding HFM characteristics, device type, and polymer composition. Studies that did not investigate the effect of liquid feed temperature on CO2 removal performance were excluded. In particular, to provide a consistent dataset across different studies, the following criteria were used for the final selection:
  • HFM contactors: A candidate study must focus on polymeric HFM contactors for CO2 removal;
  • Data presentation: The selected study must also present CO2 separation efficiency (%) or CO2 absorption flux (mol/m2s) as a function of the liquid-phase temperature of a CO2-poor solution. These data need to be displayed graphically or reported in tabular form;
  • Additional information: The study must clearly report important information such as the nature of the polymeric HFM, its physical characteristics, and geometrical factors (e.g., geometry, number of fibers, HFM dimensions, etc.).
The final selection process resulted in a collection of relevant studies that will be comprehensively discussed in the following sections [21,29,37,38,39,40,41,42,43,44,45,46].

3. Results

To the best of our knowledge, this is the first analysis to specifically examine the relationship between liquid-phase temperature and CO2 absorption performance in polymeric HFM devices, considering both physical and chemical absorption processes. Ghobadi et al. observed that in the polytetrafluoroethylene (PTFE) all alkanolamine solvents exhibited increased flux and separation rates at higher temperatures. Ghobadi et al. [37] observed that with polytetrafluoroethylene (PTFE) HFM (liquid phase velocity = 0.105 m/s; gas phase velocity = 0.421 m/s; absorbent concentration = 1.0 M; feed gas = 2.5/97.5 CO2/CH4), all alkanolamine solvents showed increased flux and separation rates at higher temperatures in both counter-current and co-current flow patterns. However, increasing the water temperature hinders the flux and separation efficiency of CO2 due to decreased CO2 solubility and increased water evaporation.
Mansourizadeh et al. [38] found that CO2 flux through polyvinylidene fluoride (PVDF) HFM significantly increases with increasing temperature in chemical absorbents. In contrast, the CO2 flux decreases with the physical absorption temperature due to reduced CO2 solubility and capillary condensation in the membrane pores. In a counter-current flow system (liquid flow rate = 120 mL/min; gas flow rate = 200 mL/min; absorbent concentration = 1.0–0.2 M; pressure liquid–pressure gas = 0.2 × 10⁵ Pa), Mansourizadeh [39] reported that CO2 stripping flux via PVDF HFM is significantly influenced by liquid-phase temperature. Increased temperature and decreased pressure both contribute to reduced CO2 solubility, thereby impacting the stripping flux. Atchariyawut et al. [40] observed that increasing the temperature of a NaOH absorbent enhances the CO2 flux due to faster reaction kinetics in a counter-current flow membrane module (liquid phase velocity = 1.31 m/s; gas flow rate = 200 mL/min; feed gas = 20/80 CO2/CH4). On the other hand, when using water as the absorbent, the CO2 flux decreases with increasing temperature due to reduced gas solubility.
In a polypropylene (PP) HFM (counter-current flow pattern; gas flow rate = 16 L/h; CO2 inlet concentration = 40 wt.%), Golkhar et al. [41] observed a decrease in CO2 removal efficiency as the liquid temperature increased from 30 °C to 70 °C. This was attributed to a significant decrease in CO2 solubility in water and increased water evaporation. Mohammaddoost et al. [42] observed a decrease in CO2 absorption flux with increasing liquid temperature, which they attributed to increased membrane resistance caused by vaporization in PP HFMs in a co-current flow pattern (liquid flow rate = 0.4 L/min; gas velocity = 5.0 L/min; feed gas = 40%vol CO2). Rahim et al. [43] demonstrated that the effect of temperature on CO2 removal flux through PVDF HFM (counter-current flow pattern; liquid flow rate = 25 mL/min; gas flow rate = 100 cm3/min; absorbent concentration = 0.5 M; feed gas = 10/90 CO2/CH4) is a complex interplay of factors, including solubility, chemical reaction kinetics, diffusion, and absorbent evaporation. Unlike MEA and NaOH, CO2 removal for amino acid salt solutions exhibits a less pronounced temperature effect due to a balance between enhanced reaction rates and reduced solubility.
Cao et al. [44] observed an initial linear increase in terms of CO2 absorption flux by using a PTFE HFM device in a counter-current flow design (liquid phase velocity = 0.012 m/s; gas phase velocity = 0.239 m/s; CO2 partial pressure = 15 kPa) with increasing liquid temperature, followed by a period of slower flux growth. While higher temperatures can enhance CO2 diffusion and reaction rates, they must be carefully considered to avoid adverse thermodynamic effects such as increased solvent volatility and reduced CO2 solubility. As highlighted by Yan et al. [45], increasing absorbent concentration enhances mass transfer rates due to increased CO2 solubility. However, excessively high concentrations can lead to membrane-wetting issues when using PP HFMs (counter-current flow design; liquid flow rate = 0.0503 m/s; gas flow rate = 0.211 m/s; feed gas = 14/86 CO2/N2+O2). Therefore, optimizing absorbent concentration is crucial to maximize performance while avoiding operational challenges.
Collectively, the studies reviewed above [37,38,39,40,41,42,43,44,45] provide valuable insights, as a comprehensive analysis of the impact of liquid feed temperature on CO2 removal properties across various polymeric HFM devices has, to the best of our knowledge, been lacking in the literature. As outlined in the Introduction, this work aims to address this gap by analyzing existing literature, integrating findings from different studies, and exploring the overall influence of liquid temperature on both physical and chemical absorption processes within HFM systems.
The present analysis focuses exclusively on traditional absorbers, deliberately excluding innovative absorbents such as ionic liquids [47]. This decision was made for several reasons. Firstly, the temperature–performance relationship for these novel materials remains uncertain. As noted by Faisal Elmobarak et al. [48], the relative importance of chemical breakdown within the ionic liquid (specifically, at the cation–anion interface) under varying operating temperatures is not fully understood. Secondly, a more extensive body of research and data is available for the selected traditional absorbers, enabling a more comprehensive analysis of the influence of temperature on CO2 separation performance. Finally, our focus on traditional absorbers ensures the immediate applicability of this study to current industrial CO2 separation processes.
Selected papers report on nine different experimental studies [37,38,39,40,41,42,43,44,45] and three modeling studies [21,29,46], with a total of 104 data points. Data points are distributed as follows: water (H2O; 37 points) [37,38,39,40,41,42], sodium hydroxide (NaOH; 13 points) [38,40,43], N,N-dimethylethanolamine (DMEA; 5 points) [44], methyl diethanolamine (MDEA; 5 points) [45], diethanolamine (DEA; 3 points) [37], and triethanolamine (TEA; 3 points) [37]. Finally, 22 data points are extrapolated according to Refs. [21,29,46]. It is noteworthy that only two studies employed a co-current flow HFM device [41,42] to minimize the possibility of partial membrane wetting (as reported in [41]). In all other references (see Refs. [37,38,39,40,43,44]), a counter-current flow configuration was used for the gas and liquid absorbent streams.
Table 2 summarizes the collected data on CO2 removal by physical absorption using water in a liquid absorption process with a gas–liquid polymeric HFM device [37,38,39,40,41,42]. The table includes information on HFM polymer type, liquid temperature range (T), number of polymeric fibers (Nf) used in the HFM device, HFM outer diameter (F.Od), HFM inert diameter (F.Id), HFM length (F.l), HFM pore diameter (M.Pd), HFM porosity (M.P), HFM bubble point (B.p), module outer diameter (M.Od), module inert diameter (M.Id), module length (M.l), contact area (C.A.), and packing density (P.D.%). Table 2 is organized by the Nf in the polymeric HFM contactor.
The selected HFM devices employed a range of polymeric fibers (Nf) from a single unit (Nf = 1) [37] up to Nf = 1200 [42]. These devices mainly used commercially available HFMs [37,40,41,42] for physical CO2 capture in gas–liquid membrane systems, investigating the effect of liquid-phase temperature. In contrast to commercially available options [37,40,41,42], other studies fabricated the polymeric HFMs themselves using a wet phase-inversion process [38,39]. The analysis of polymeric HFM contactors for physical CO2 capture revealed a mean fiber outer diameter (F.Od) of 1.19 mm, with a standard error (SE) of 0.33 mm. The mean fiber inner diameter (F.Id) for this category was 0.87 mm, accompanied by a SE of 0.29 mm. These data suggest that the fibers utilized for physical capture exhibit reasonably comparable and overall small dimensions. As expected, it can be observed that increasing the number of fibers per device results in a practically straight increase in the contact area (cm2).
The investigated liquid-phase temperature ranges varied depending on the polymeric HFM material:
  • Polytetrafluoroethylene (PTFE) HFM: from 20 to 60 °C (ΔT = 40 °C) [37];
  • Polyvinylidene fluoride (PVDF) HFM: from 10 to 40 °C (ΔT = 30 °C) [38,39];
  • Polyvinylidene fluoride (PVDF) HFM: from 30 to 60 °C (ΔT = 30 °C) [40];
  • Polypropylene (PP) HFM: from 30 to 70 °C (ΔT = 40 °C) [41];
  • Polypropylene (PP) HFM: from 20 to 40 °C (ΔT = 20 °C) [42].
Figure S1a in the Supplementary Materials illustrates the ranges of liquid-phase temperatures investigated in the selected literature for physical CO2 capture using polymeric HFM contactors [37,38,39,40,41,42].
Table 3 summarizes key operational parameters for CO2 removal via chemical absorption in polymeric HFM-based liquid absorption processes [37,38,40,43,44,45].
The number of polymeric fibers (Nf) in the HFM devices used for chemical absorption studies ranged from 1 (PTFE HFM; MEA) [37] to 7000 (PP HFM; MDEA) [45]. The collected studies primarily employed PVDF HFMs [38,40,43], PTFE HFM [37,44], and PP HFMs [45]. The investigated liquid-phase temperature ranges were:
  • Polytetrafluoroethylene (PTFE) HFM: from 20 to 60 °C (ΔT = 40 °C) [37];
  • Polyvinylidene fluoride (PVDF) HFM: from 10 to 40 °C (ΔT = 30 °C) [38];
  • Polyvinylidene fluoride (PVDF) HFM: from 30 to 60 °C (ΔT = 30 °C) [40];
  • Polyvinylidene fluoride (PVDF) HFM: from 20 to 60 °C (ΔT = 40 °C) [43];
  • Polytetrafluoroethylene (PTFE) HFM: from 25 to 40 °C (ΔT = 15 °C) [44];
  • Polypropylene (PP) HFM: from 30 to 50 °C (ΔT = 20 °C) [45].
Figure S1b in the Supplementary Materials illustrates the ranges of liquid-phase temperatures investigated for chemical CO2 removal using polymeric HFM devices [37,38,40,43,44,45]. MEA [37,43,45] and NaOH [38,40,43] were the most frequently investigated chemical absorbents, representing over 64% of the data points in the collected literature. The remaining data points involve DEA [37], TEA [37], DMEA [37], and MDEA [45].
For chemical CO2 capture, the mean F.Od was 1.90 mm with a SE of 0.4 mm, and the mean F.Id was 1.41 mm with a SE of 0.37 mm. This suggests a reasonable uniformity in the dimensions of the polymeric HFMs utilized across different laboratories.
Overall, the dataset includes a balanced representation of data from physical absorption processes (35.5%), chemical absorption processes (43.3%), and modeling studies (21.2%). In conclusion, this comprehensive analysis includes 104 data points from experimental and modeling studies, providing a robust foundation for understanding the overall influence of liquid temperature on CO2 capture using polymeric HFM devices. The dataset encompasses a diverse range of polymers, absorbents, fiber configurations, and liquid-phase temperature ranges.

4. Discussion

All the selected experimental studies [37,38,39,40,41,42,43,44,45] clearly defined their objectives. Nearly all studies [37,38,39,40,41,42,43,44,45] utilized various polymeric HFMs with either physical or chemical absorbents to investigate the influence of key operating parameters on CO2 removal. These parameters included:
  • Absorbent pressure (Refs. [38,39]);
  • Absorbent concentration (Refs. [40,41,44,45]);
  • Liquid flow rate (Refs. [37,38,39,40,41,44,45]);
  • Gas flow rate (Refs. [37,39,40,41,44,45]);
  • CO2 concentration in flue gas (Refs. [41,44,45]);
  • Flow pattern (co-current and counter-current) (Ref. [37]);
  • Packing density (Ref. [37]);
  • pH solution (Ref. [43]).
For a meaningful comparison, the present study focuses solely on the effects of liquid-phase temperature on CO2 separation. The collected literature [21,29,37,38,39,40,41,42,43,44,45,46] can be categorized into three homogeneous groups:
  • Studies reporting CO2 separation efficiency as a percentage of CO2 absorbed (%) [37,41];
  • Studies presenting experimental results in terms of CO2 absorption flux (mol/m2s) [38,39,40,42,43,44,45].
The CO2 separation performance (μ) through an HFM device is defined in terms of CO2 removal efficiency in percent (%) in Refs. [41,45], using the following equation:
μ = Q in × C in   Q out × C out Q in × C in × 100
where Qin and Qout denote the inlet and outlet gas flow rates (m3/h) for the HFM module, respectively. Similarly, Cin and Cout represent the inlet and outlet CO2 volumetric concentrations in the gas phase, respectively [41,45]. In most cases [37,40,41,43,44,45], the CO2 absorption flux ( J C O 2 ) across the HFMs was estimated using the following equation:
J CO 2 = Q in × C in   Q out × C out × 273.15 × 1000 22.4 × T gas × S
where Tgas is the gas temperature (K) and S represents the mass transfer surface area (m2), as defined in Ref. [37] However, other studies define S as the overall gas–liquid interfacial area of HFMs [41,45]. Typically, CO2 absorption flux was determined by measuring the CO2 concentration at the inlet and outlet of the membrane modules using chemical titration methods. However, some references (see Refs. [38,39]) did not provide details regarding the specific titration methods used or potential errors from CO2 measurement methods. In contrast, some authors specified the titration methods used, including potassium hydrogen phthalate [40] and sulfuric acid/sodium hydroxide [42]. Ref. [42] provided the following titration reactions for these methods:
2   NaOH   + H 2 SO 4   Na 2 SO 4 + 2   H 2 O
2   NaOH   + CO 2   Na 2 CO 3 +   H 2 O
A critical limitation identified through the collected literature is the lack of clear explanations for the relationship between CO2 separation performance and liquid-phase temperature [37,41,42,43,44,45]. Many studies either fail to graphically illustrate or clearly describe the relationship between CO2 separation performance and liquid-phase temperature, often lacking sufficient detail [37,41,42,43,44,45], or do not provide additional discussion [38,39,40]. Consequently, no empirical equations describing the temperature dependence of CO2 absorption capacity were found in the reviewed literature [37,38,39,40,41,42,43,44,45].
Figure 1 graphically illustrates the relationship between temperature and CO2 removal performance based on data from the selected literature [21,29,37,38,39,40,41,42,43,44,45,46]. In Figure 1a, the x-axis represents temperature in degrees Celsius, and the y-axis represents the percentage of CO2 absorbed, as reported in the selected literature [37,41]. The numbers in parentheses following the chemical names indicate the number of polymeric fibers (Nf) used in each HFM device. Figure 1a presents data for both physical absorption with H2O (using HFM devices with 1 [37], 4 [37], 8 [37], and 400 [41] polymeric fibers) and chemical absorption using a variety of amines, including MEA (Nf = 1 and Nf = 8) [37], DEA (Nf = 1) [37], and TEA (Nf = 1) [37].
Analysis of the CO2 removal performances presented in Figure 1a (data from Refs. [37,41]) reveals two distinct trends based on the variation of liquid-phase temperature. In the first group, utilizing a physical solvent (i.e., water), CO2 removal performance through the microporous HFM device consistently decreases at varying rates with increasing temperature [37,41]. Conversely, the second group, characterized by chemical absorption involving a reaction between CO2 and the liquid phase (i.e., MEA, DEA, TEA), exhibits an increase in CO2 absorption capacity with increasing temperature [37]. A dotted line separates the two regions in Figure 1. As shown in Figure 1a, chemical CO2 removal through HFM systems generally exhibits higher CO2 capture performance compared to physical absorption.
Notably, the slopes of the lines representing chemical absorption vary significantly, suggesting differences in the temperature-dependent behavior of different absorbents. Additionally, a correlation was observed between the number of polymeric fibers (Nf) and CO2 removal performance within the single-HFM device configuration. With a single HFM, the CO2 capture efficiency follows the order: MEA > DEA > TEA [37]. This suggests that MEA is the most effective absorbent among these three amines for CO2 capture, followed by DEA and TEA. Furthermore, increasing the number of polymeric fibers (Nf) from one to eight with the same chemical absorbent (e.g., MEA) significantly improves CO2 capture performance [37]. A similar trend is observed for physical absorption using water, where CO2 separation efficiency increases with the number of polymeric fibers (Nf) from one to four and then to eight (see Figure 1a).
Based on an in-depth examination of the selected research [38,39,40,42,43,44,45], Figure 1b illustrates the complex relationship that exists between CO2 absorption flux and liquid-phase temperature. In particular, Figure 1b shows the CO2 flux (mol/m2s) for different absorption systems as a function of liquid-phase temperature (°C), as obtained experimentally in the literature [38,39,40,42,43,44,45]. Across all reported data, chemical absorption with NaOH [38,40,43], MEA [43,45], and DMEA [44] consistently demonstrates a higher CO2 removal flux compared to physical absorption with H2O [38,39,42]. This highlights the superior flux performance of chemical absorbents in capturing CO2, as already observed in Figure 1a for CO2 separation (%) [37,41]. The CO2 absorption flux for chemical absorption systems shows a marked increase with increasing liquid-phase temperature. This positive correlation suggests that elevated temperatures enhance the chemical interactions between the absorbent and CO2 molecules, facilitating efficient CO2 flux (mol/m2s).
In contrast to chemical absorption, the CO2 removal flux for physical absorption systems typically shows a slight decrease with increasing liquid-phase temperature [38,39,42]. This behavior implies that physical absorption is less sensitive to temperature changes compared to chemical absorption.
While the polymeric Nf significantly impacts CO2 capture performance in chemical absorption systems, its influence on physical absorption is less pronounced (see Refs. [38,39,42]). This result suggests that physical absorption is less dependent on the Nf employed in the HFM devices. When comparing chemical absorbents, NaOH appears to be better than MEA in terms of CO2 absorption flux, particularly with a low Nf (Nf = 16) [43]. This is further supported by comparing the flux performance achieved with Nf = 35 using NaOH [40] to that obtained with Nf = 7000 using MEA [45] within the same temperature range (30–50 °C). When comparing HFM contactors with a high Nf, such as in Ref. [45], a polymeric HFM contactor with Nf = 7000 in the presence of MEA again emerges as the more effective absorbent, exhibiting a higher CO2 absorption flux than MDEA.
Figure 1c presents the results of modeling studies conducted by various researchers and included in this analysis [21,29,46]. It illustrates the relationship between CO2 absorption flux (mol/m2s) and liquid-phase temperature. The thermal behavior characteristics observed in the modeling studies, including CO2 absorption into reactive 4-diethylamino-2-butanol solution (DEAB, Nf = 3600 [46]), K2CO3 solution (Nf = 1100 [29]), and physical absorption of CO2 in water (Nf = 3600 [46], and Nf = 15 [21]) through HFM devices, exhibited similar trends to those observed in the experimental studies described above.
Several key observations can be made from these results:
  • Regardless of the number of polymeric fibers (Nf) used, chemical absorption [21,46] generally exhibits higher CO2 capture efficiency than physical absorption [29,46], consistent with the findings presented in Figure 1a,b;
  • For chemical absorption systems, CO2 absorption flux typically increases significantly with increasing liquid-phase temperature, consistent with the trends observed in Figure 1a,b [29,46];
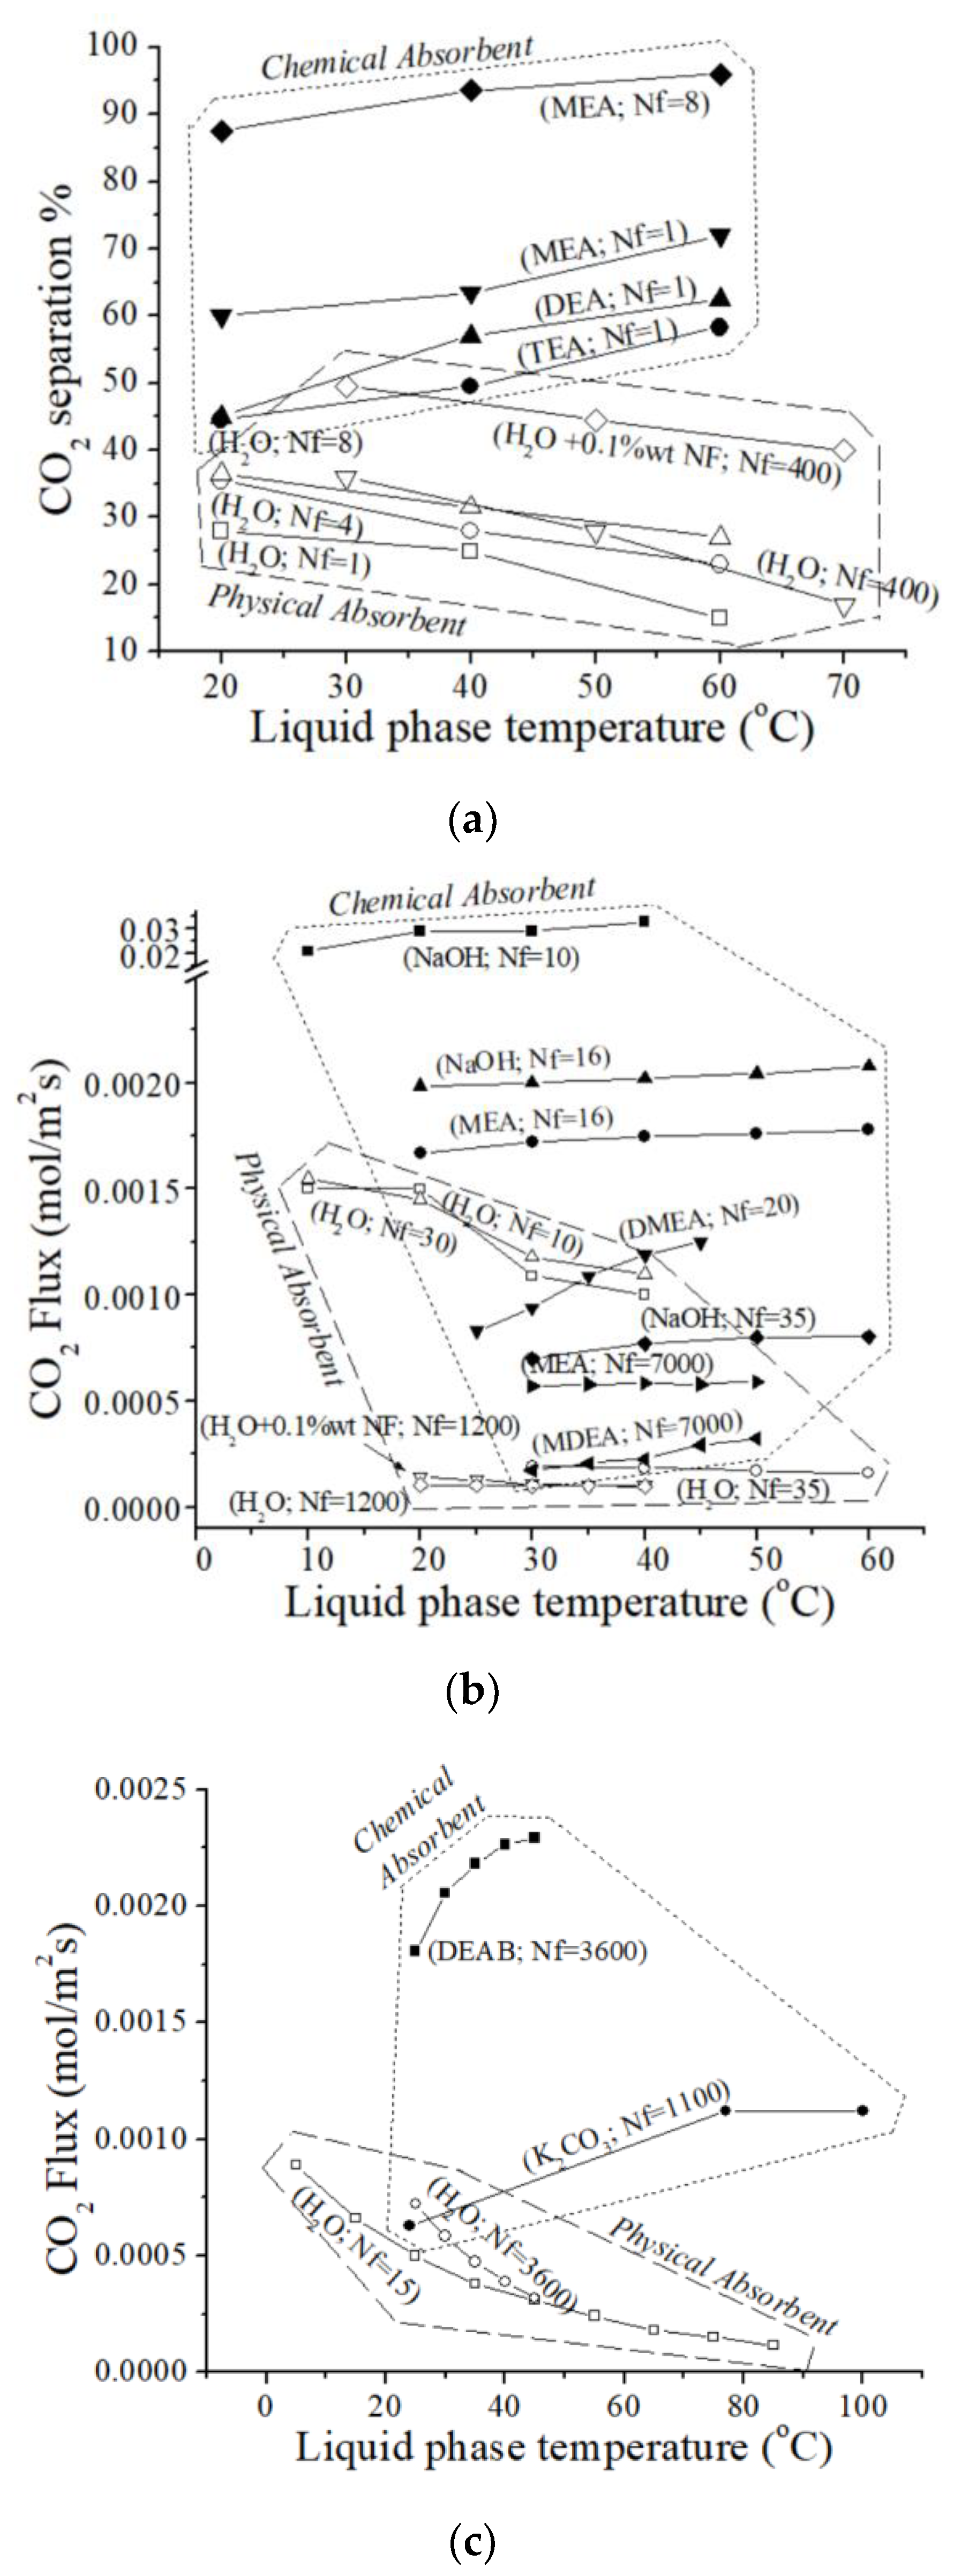
  • In contrast to chemical absorption, physical absorption generally shows a decrease in CO2 absorption flux as liquid-phase temperatures increase. For example, Saidi et al. [46] observed that increasing the temperature in a DEAB system from 25 °C to 45 °C led to a maximum CO2 flux of 8.28 mol/m2h. In contrast, in the same HFM device using water as the absorbent, increasing the temperature from 25 °C to 45 °C resulted in a decrease in CO2 absorption capacity from 2.57 to 1.27 mol/m2h [46]. This trend aligns with findings from other studies, which suggest that temperature has a greater influence on reaction rate than other factors limiting CO2 absorption, such as gas and liquid flow rates.
Overall, the trends observed in Figure 1c align with those observed in Figure 1a,b, further supporting the superior performance of chemical absorption for CO2 capture across a range of liquid-phase temperatures and polymeric HFM configurations. This is further supported by the contrasting temperature effects: physical absorption exhibits a decrease in CO2 flux with increasing temperature, while chemical absorption demonstrates a positive correlation, leading to an increased CO2 flux.
Figure 2 presents the normalized relationships between changes in CO2 separation efficiency and changes in liquid-phase temperature for the solvents used in the carbon capture process. In order to improve the visual comparison of the data points’ relative differences, normalization was applied in this work. Figure 2 was created using data points from the literature (see Table 2 and Table 3) [37,38,39,40,41,42,43,44,45]. For each of 104 experimental points ( T relative ), the minimum value ( T minimum   value ) of the x-axis baseline temperature was subtracted, and the results were normalized to zero ( T normalized 0 o C ) as follows:
T normalized 0 o C = T relative   T minimum   value
In this way, the x-axis of Figure 2 represents the relative ΔT of the liquid-phase temperature. This ΔT is the difference between the higher temperature of the liquid phase of the liquid solvent used in a given experiment and the liquid phase of the solvent at a lower temperature, as referred to in the literature [37,38,39,40,41,42,43,44,45]. The normalization to zero was also repeated for the performance (CO2 separation; y-axis) data collected from the literature [37,38,39,40,41,42,43,44,45], using the following equation:
Perform normalized 0 o C = Perform relative   Perform minimum   value
Figure 2a intuitively demonstrates that increasing temperature can lead to either an increase or a decrease in normalized CO2 separation performance, depending on the specific solvent. Similar to Figure 1a, Figure 2a presents 24 normalized experimental data points obtained from the literature for four different solvents: MEA [37], TEA [37], DEA [37], and H2O [37,41]. Data for MEA, TEA, and DEA were obtained using a single-fiber contactor (Nf = 1) [37], while additional data for MEA and H2O were collected using contactors with Nf ranging from 4 [37] to 400 [41].
The slopes of the individual experimental data points in Figure 2a visually represent the overall trend of CO2 separation performance for both physical and chemical absorption processes. In particular, Figure 2a shows an inverse relationship between normalized CO2 separation percentage and liquid-phase temperature for physical absorption processes. This indicates that as the temperature of the liquid phase increases, the amount of CO2 captured decreases. In contrast, chemical absorption processes generally exhibit an increase in performance with increasing liquid temperature.
Additionally, Figure 2a also reveals significant differences in the slopes of the normalized CO2 separation curves for different solvents. For example, the slopes for DEA (Nf = 1) and TEA (Nf = 1) are steeper than the slope obtained for MEA (Nf = 1) [37]. This trend persists even when compared with a higher Nf (Nf = 8) [37]. Figure 2a is also valuable for understanding the relationship between water temperature and carbon capture efficiency. As a first approximation, based on Figure 2a, it can be concluded that CO2 capture devices utilizing physical absorption with a high Nf (e.g., Nf = 400) exhibit a pronounced negative slope.
All data points for both physical and chemical processes were fitted to a linear regression model based on the equation presented in Figure 2a. The resulting linear regression equations are as follows:
CO 2   separation   percentage = + 0.32   T ° C
CO 2   separation   percentage = 0.33   T ° C
Notably, the average slopes of the linear regression lines for chemical process data (upper part of Figure 2a; Equation (17)) and physical process data (lower part of Figure 2a; Equation (18)) are remarkably similar, with values of approximately +0.3% and −0.3%, respectively. This suggests that regardless of the specific process, the average trend across a large number of experiments is consistent in magnitude but opposite in direction. Within the temperature range considered, there is a statistically significant complementary relationship between temperature effects on CO2 separation performance for physical and chemical processes.
Assuming this trend is specific to polymeric HFM systems—and applicable to ceramic-based HFMs—it can be summarized by the ’10-to-3’ rule: for every 10 °C change in temperature, a corresponding 3% change in performance can be expected, regardless of specific conditions or other variables. For example, the ‘10 to 3’ rule means that if the liquid-phase temperature increases by 40 degrees, the CO2 separation percentage in a CO2 chemical absorption process will be approximately 12%. This empirical law could have significant predictive and economic implications for HFM systems. It suggests that the polymeric HFM systems have a limited potential for performance improvement, with a maximum of 3% change for every 10 °C temperature adjustment. This inherent constraint implies little room for substantial energy savings or efficiency gains in polymeric-based HFM CO2 separation processes through temperature optimization alone. Consequently, from an economic perspective, investments in temperature control for performance enhancement may yield only marginal returns, potentially impacting the cost-effectiveness of HFM technology in CO2 separation applications. Another aspect to consider is that in the case of a gas–liquid absorption involving chemical reactions, it typically causes significant temperature changes in the liquid phase, particularly near the gas–liquid interface of the HFM. The CO2 reaction and dissolution processes generate heat, which is responsible for this temperature increase [49]. For example, Pandya [50] showed that in a second-order reaction (rate proportional to the product of CO2 and MEA concentrations) the liquid phase leaves the adiabatic packed column at more than 10 °C higher than the inlet liquid temperature. It should be noted that this phenomenon is never considered in the examined literature [21,29,37,38,39,40,41,42,43,44,45,46] nor in other studies on “isothermal” experiments for the CO2 chemical absorption process.
The empirical ’10-to-3’ rule was validated using simulation results from Jalali et al. [51] for physical CO2 removal in distilled water. In this section, we compare the results of the proposed easy rule with simulation data obtained from process optimization of CO2 removal using a PVDF-HFM system. These simulations were conducted using two-dimensional (2D) computational fluid dynamics (CFD) based on mass transfer equations for the HFM contactor (fiber outer diameter = 0.95 mm; fiber inner diameter = 0.60 mm; length = 150 mm; Nf = 30). The simulations assumed steady-state and laminar conditions and employed a finite-element approach [51]. Figure 2b presents the normalized CO2 separation percentages obtained from Ref. [51] for a PVDF HFM system at various H2O temperatures (5 °C, 26 °C, and 45 °C) and liquid velocities (4 m/s and 8 m/s). The results demonstrate that H2O temperature influences the convective mass transfer in the polymeric HFM. This process, described by the continuity equation, in turn affects the overall CO2 mass transfer. Figure 2b shows that the predictions based on the ’10-to-3’ rule align well with the simulation results across different liquid velocities for physical CO2 removal in distilled water.
Figure 2. Normalized values of (a) CO2 separation (%) (◆, ▼, ▲, ●, △, ▽, ○, □ [37]; ▽, ◇ [41]), and (b) comparison of proposed prediction based on the empirical ’10-to-3 law’ with normalized CO2 separation percentages obtained from Ref. [51] (●, liquid velocity = 4 m/s; ■, liquid velocity = 8 m/s) for a PVDF HFM contactor (H2O).
Polymers 17 01387 g002
Figure 3a presents a graph illustrating the relationship between normalized liquid-phase temperature and capture performance. The capture performance is expressed as CO2 flux (mol/m2s) obtained from a large number of experiments, as previously explained [38,39,40,42,43,44,45]. Similar to Figure 2, here delta liquid-phase temperature represents the difference between the higher and lower liquid-phase temperatures, while delta CO2 flux quantifies the change in CO2 flux associated with this temperature difference. Figure 3(a) presents detailed data for more than sixty experiments, standardized in this current analysis, using various absorbent types: DMEA [44], MDEA [45], NaOH [40,43], MEA [43,45], and H2O [38,39,40,42]. In addition, Figure 3a presents normalized data for different HFM contactors with varying Nf: 10 [38], 16 [43], 20 [44], 30 [39], 35 [40], 7000 [45], and 1200 [42]. All the selected experimental results investigated CO2 flux performance across a temperature range of 40 °C.
Some observations can be noted from Figure 3a. First, the figure shows that, in general, the normalized CO2 flux increases only slightly with increasing liquid-phase temperature in chemical absorption processes. Contrary to initial expectations, elevating the temperature does not significantly improve CO2 capture efficiency compared to operation at ambient temperatures. However, DMEA [44] appears to be an exception, exhibiting potentially better performance at elevated temperatures. Except for the cases described in Refs. [38,39], the performance of physical absorbers using water is minimally affected by relatively small increases in water temperature.
Figure 3a demonstrates that, from a graphical perspective, a high number of polymeric fibers (Nf) does not necessarily correspond to a large variation in performance for either chemical or physical absorption processes. Conversely, devices with a lower number of polymeric fibers seem to be more sensitive to temperature changes, regardless of the absorbent type. Interestingly, with a few exceptions—see Nf = 10 (H2O) [38], Nf = 20 (DMEA) [44], and Nf = 30 (H2O) [39]—HFM systems with a lower number of fibers exhibit a greater variation in performance with increasing temperature compared to systems with a larger number of fibers, e.g., Nf = 7000 (MEA-MDEA) [45] and Nf = 1200 (H2O) [42]. The overall change in liquid temperature has been confirmed to influence CO2 flux performance (either positively or negatively). However, this effect is less pronounced when considering the data as a whole.
The above observation might be linked to the interaction between fiber dimensions and temperature. For instance, Refs. [43,45] employ HFM contactors with significantly different fiber sizes. As an example, Ref. [43] describes an HFM contactor with 16 fibers (Nf = 16; NaOH), where the outer diameter (F.Od) and inner diameter (F.Id) are 1.1 mm and 0.42 mm, respectively. Conversely, the second HFM system [45] utilizes a significantly larger Nf (Nf = 7000; MEA-MDEA) with dimensions of 0.442 mm and 0.344 mm for F.Od and F.Id, respectively. This observation appears to be linked not only to the Nf but also to the overall length of the HFM device. To illustrate this point, consider an HFM contactor composed of three modules connected in series [52]. Each module is 20 cm long, resulting in a total length of 60 cm. These modules contain 20 PTFE HFMs with an F.Od of 1.7 mm and an F.Id of 1.0 mm. In this specific configuration, the relative temperature variation from 25 °C to 45 °C for the 3-diethylaminopropylamine (DEAPA) absorbent at two different concentrations (1 and 2 mol/L) is negligible compared to the effects observed in selected studies [40,43,44,45]. This is further supported by the performance results obtained by Chen et al. [52], which are presented in Figure S2 of the Supplementary Materials.
In addition, the fact that a polymeric HFM system with relatively few fibers exhibits performance similar to a more complex device with a very high Nf is confirmed in the work of Luqmani et al. [53]. The membrane devices comprising 10,200 microporous PP HFMs (fiber inert diameter = 240 μm; fiber wall thickness = 30 μm; length= 0.16 m) for a physical absorption process in H2O [53] showed the same qualitative and quantitative behavior of an HFM contactor with relatively few fibers [38,39]. Figure S3 in the Supplementary Materials shows the direct comparison between an HFM contactor studied by Luqmani et al. [53] with Nf = 10200 (H2O; liquid-phase velocity = 1.5 × 10⁻³ and 2.5 × 10⁻³ m/s) and two other HFM contactors with Nf = 10 (H2O) [38] and Nf = 30 (H2O) [39], respectively. Thus, from this direct comparison between two completely different HFM systems—one with Nf = 10,200 [53] and the other two with fewer fibers [38,39]—the final CO2 flux exhibits the same behavior with respect to temperature.
Figure 3b compares the normalized values of CO2 absorption flux (mol/m2s) obtained from various conventional split-flow absorber processes [46] and mathematical modeling studies [21,29] for different absorbents: DEAB (Nf = 3600 [46]), K2CO3 solution (Nf = 1100 [29]), and H2O (Nf = 3600 [46], and Nf = 15 [21]). For comparison, the x-axis also presents the solubility of CO2 in water (see Table 1) from Ref. [18]. The figure highlights key findings regarding the relationship between liquid temperature and CO2 removal performance.
For chemical absorption by reactive DEAB (Nf = 3600 [46]) and K2CO3 solution (Nf = 1100 [29]), Figure 3b shows two distinct curves that converge towards a common horizontal asymptote. Notably, DEAB reaches its maximum performance within a relatively narrow temperature range of approximately 20 °C, while K2CO3 requires a significantly larger temperature difference (approximately 80 °C) to achieve its peak performance. From an energy perspective, heating the DEAB absorber is generally more energy-efficient than heating the K2CO3 absorber.
Furthermore, the data suggest a significant decrease in CO2 absorption flux with increasing normalized temperature of H2O across the modeling studies [21,46]. This trend can be readily explained by the dependence of CO2 solubility on absorption flux. As liquid-phase temperature increases, the solubility of CO2 in water generally decreases (as shown on the left-side axes of Figure 3b). This decrease in solubility can limit the amount of absorbed CO2 in water and potentially contribute to the observed variations in CO2 absorption flux across the modeling studies, irrespective of other parameters. Against our expectations, the results obtained from different mathematical models [21,46] show excellent agreement with the well-known data on CO2 solubility in water, as reported in [18] (see Table 1).
In conclusion, CO2 gas mixtures are frequently produced by several industrial processes, including the production of biogas, coal gasification, and steam methane reforming [54,55]. By investigating the complex effect of liquid-phase temperature—a variable that has been relatively neglected in previous studies—in various gas–liquid polymeric HFM contactors, this work aimed to optimize CO2 separation. The results presented here fill the knowledge gap on polymeric HFM contactor operation for CO2 removal.

5. Conclusions

Efficient CO2 removal is indispensable for the successful implementation of various technologies. The present analysis aimed to investigate the overall effects of liquid-phase temperature on CO2 removal performance across several physical and chemical absorption processes utilizing polymeric HFM contactors. Overall, the findings of this study demonstrate the impact of liquid-phase temperature on CO2 separation performance.
Our work confirms that CO2 absorption flux consistently increases with increasing liquid-phase temperature in chemical absorption processes, while it consistently decreases with increasing temperature in physical absorption processes using water. Several key conclusions were drawn:
  • Superiority of Chemical Absorption: CO2 chemical absorption consistently outperforms physical absorption using H2O as the absorbent;
  • Temperature-Dependent Enhancement: CO2 chemical absorption flux exhibits a positive correlation with temperature, indicating enhanced performance at higher temperatures;
  • Inverse Relationship with Temperature: In contrast, CO2 removal capacity in H2O decreases with increasing temperature.
Furthermore, we have identified quantitative relationships between CO2 separation (%) and temperature for both chemical and physical absorption processes:
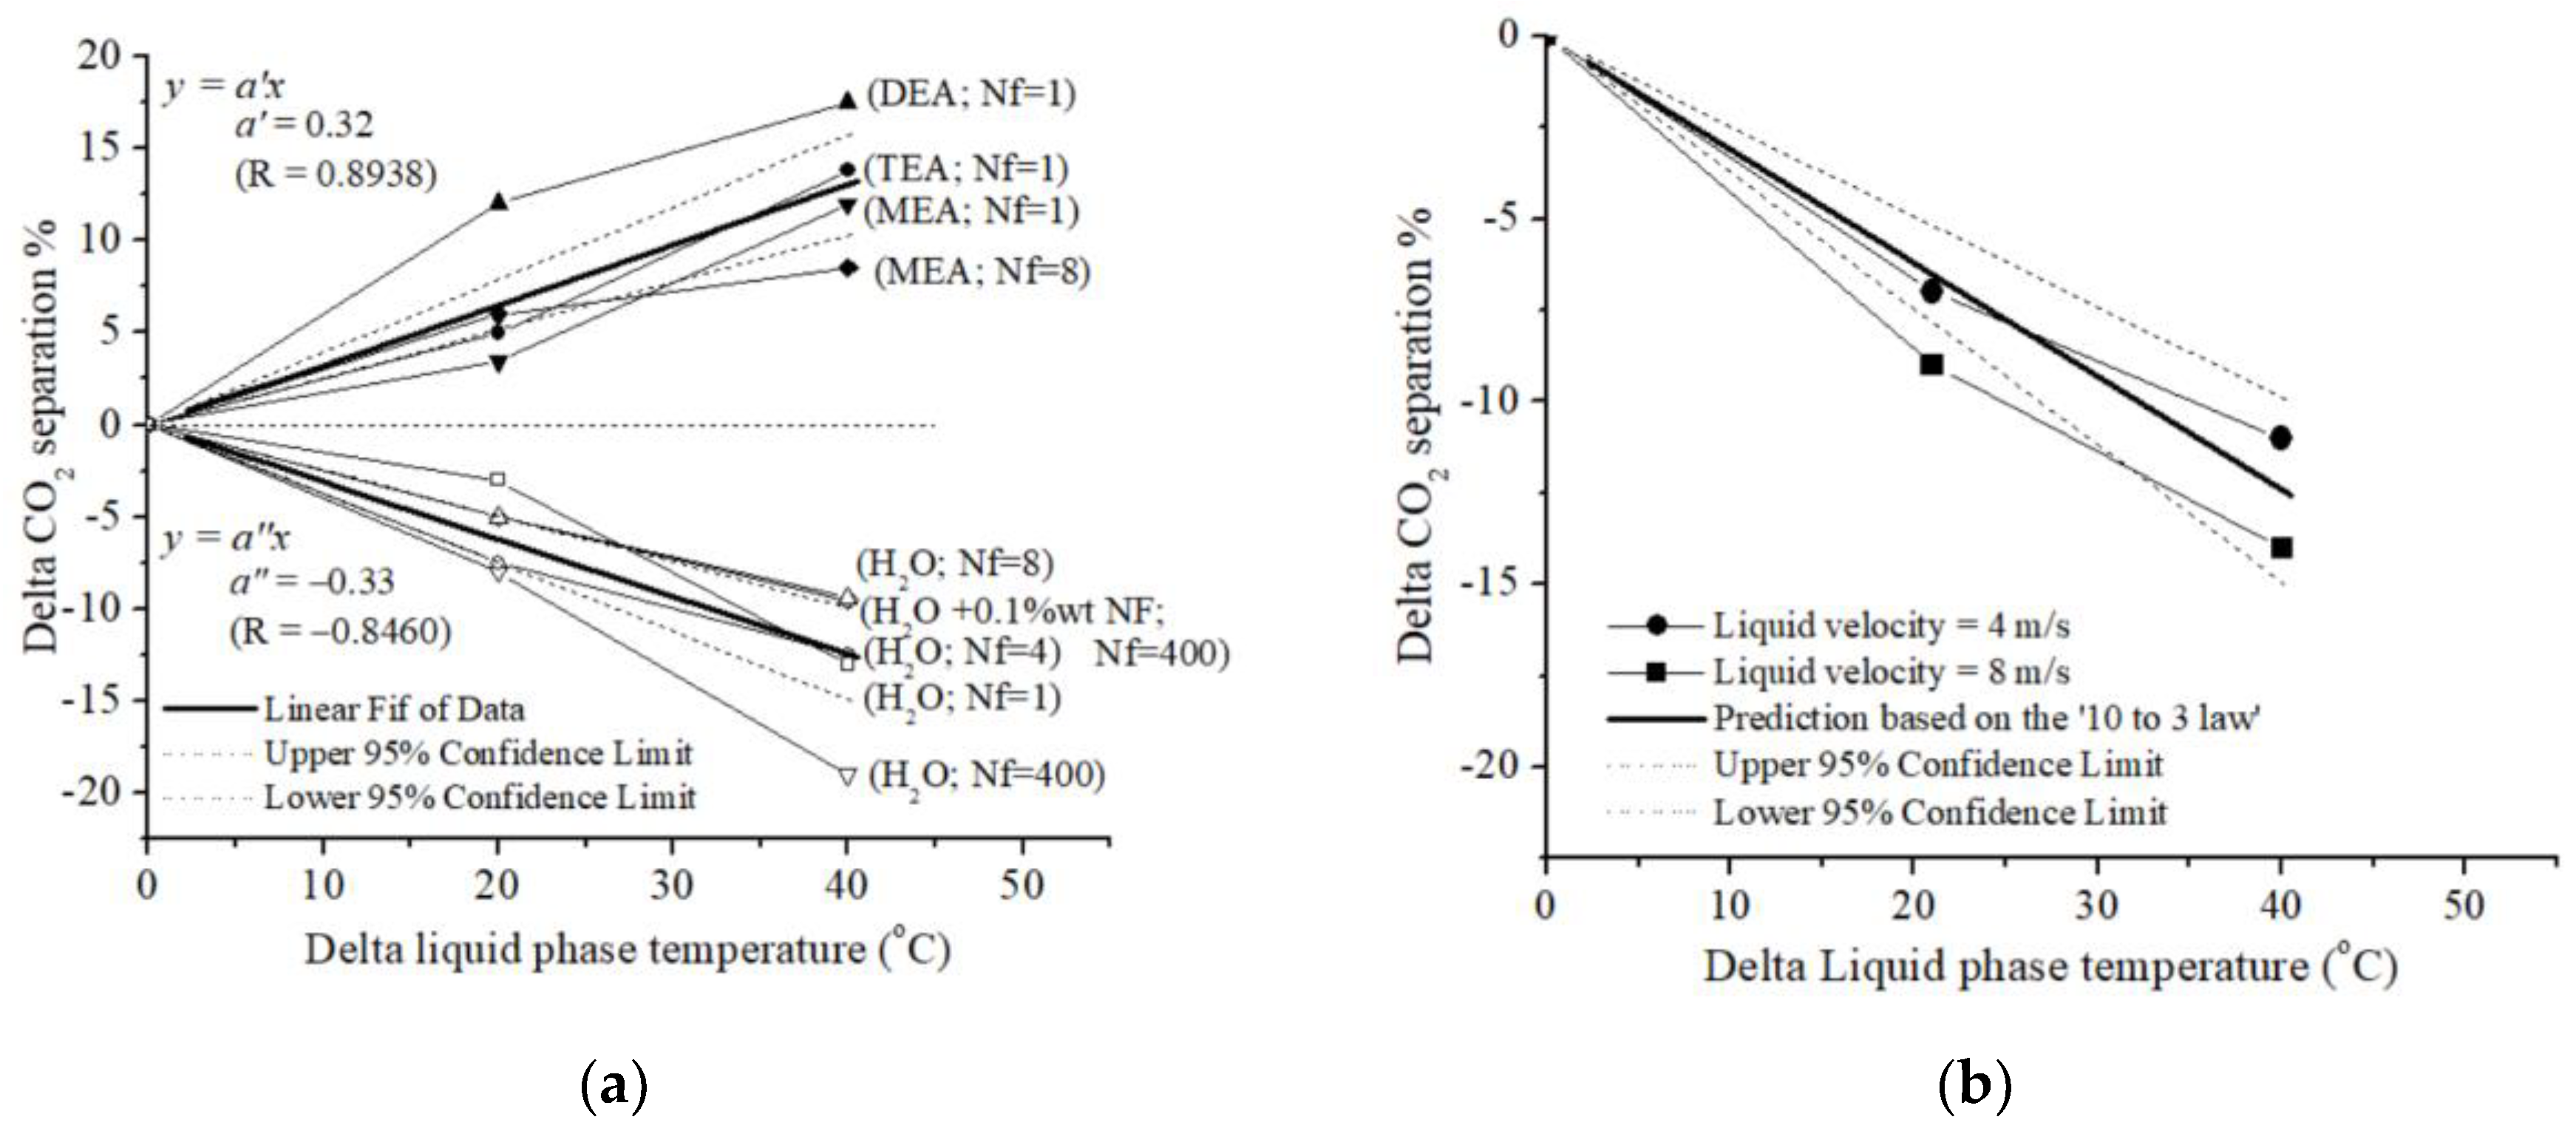
  • Chemical absorption → CO2 separation (%) = +0.3 T (°C);
  • Physical absorption → CO2 separation (%) = −0.3 T (°C).
Statistical analysis strongly supports these trends, with high R-values (>0.8) observed for both chemical and physical absorption processes. In addition, these two empirical laws were confirmed by direct comparisons with additional experimental results.
These considerations provide valuable tools for predicting CO2 separation performance under varying temperature conditions. Quantitatively, the equations predict a 3% increase in CO2 separation per 10 °C temperature rise for chemical absorption, while a 3% decrease is predicted for physical absorption. It is crucial to acknowledge that these equations provide rough predictions based on simplified models and may not be universally applicable.
Given the substantial volume of data analyzed, these findings are statistically significant and provide robust insights into the temperature–performance relationships and inherent limitations of these absorption processes. Actual CO2 separation values may deviate from these predicted values due to various factors, including operating conditions (e.g., gas composition, pressure), absorbent properties (e.g., type, concentration, flow rate), and membrane characteristics (e.g., HFM thickness, number of polymeric fibers, inner module radius, length, porosity, tortuosity). Furthermore, the presence of impurities and potential limitations in HFM stability can also influence performance.

6. Prospects

While CO2 capture utilizing polymeric HFM contactors has garnered significant interest in recent years, with promising results reported [6,8,9,10,11,56], a more comprehensive understanding of how liquid-phase temperature impacts both physical and chemical CO2 removal processes remains crucial. This section explores potential future research directions to further investigate gas–liquid polymeric HFM systems.

6.1. Economic Optimization of Liquid-Phase Temperature

A key area for future research is to determine the optimal liquid-phase temperature from an economic perspective. This involves understanding the trade-offs between:
  • Decreased efficiency in physical absorption due to the reduced solubility of CO2 at lower temperatures;
  • Enhanced efficiency in chemical absorption due to increased reaction kinetics at higher temperatures;
  • Energy costs associated with liquid-phase temperature control;
  • Energy costs associated with physical solvent regeneration (e.g., through temperature swing, pressure swing, or stripping with air or steam);
  • Energy costs associated with chemical solvent regeneration via the introduction of heat to regenerate the original chemical solvent and obtain pure CO2.

6.2. High-Pressure Liquid-Phase Studies

New detailed studies on the performance of HFM contactors under high liquid-phase pressure are crucial. Following some interesting results reported by Dindore et al. [57] with PP HFM, there is currently a lack of research on the performance of polymeric HFM devices operating under very high liquid-side pressures. Theoretically, increasing liquid-phase pressure can benefit both absorption processes:
  • Physical absorption: Higher liquid-phase pressure enhances the solubility of CO2 in the liquid absorbent (i.e., H2O) [18,20], leading to improved absorption capacity;
  • Chemical absorption: Elevated liquid-phase pressure can increase the density of the liquid, potentially enhancing mass transfer and CO2 chemical absorption [38].
To assess the applicability of high liquid pressure, it is crucial to investigate its impact on polymeric membrane wetting over extended operation periods. Furthermore, exploring the influence of correspondingly high pressure on the gas side is important to assess its potential role in mitigating wetting or affecting other performance aspects.

6.3. Low- and High-Temperature Liquid-Phase Studies

Future research should explore the development of new physical solvents suitable for chilled CO2 capture processes, specifically those capable of operating under ambient or sub-zero temperatures (−100 °C < T < 25 °C). Thermally stable chemical solvents suitable for high-temperature industrial processes can enhance CO2 capture and reduce regeneration energy requirements by narrowing the temperature gap between capture and regeneration.

6.4. Long-Term Stability Tests and Polymeric Nature

While the selected literature focuses on the effect of liquid-phase temperature on physical and chemical CO2 absorption using well-known polymeric HFM devices, significant gaps remain in our understanding of long-term stability and the behavior of novel polymeric HFM materials under varying liquid-phase temperatures. Here are some key areas for further investigation:
  • Long-Term Stability Tests: Current research focuses on CO2 capture within a limited temperature range of the liquid phase. However, industrial applications may necessitate operation at higher or lower temperatures. Long-term stability tests at different liquid-phase temperatures are crucial to evaluate the long-term performance of traditional polymeric HFM contactors under these more demanding conditions.
  • Membrane Wetting: Future studies should more explicitly investigate the potential for polymeric HFM wetting under varying operating conditions. This includes a systematic evaluation of the impact of elevated temperatures and the use of hydrophilic solvents on the long-term stability and performance of polymeric HFMs, as wetting can significantly hinder their efficiency.
  • Advanced HFM Materials: Expanding the investigation beyond polymeric HFMs is essential. New materials, such as advanced ceramics, thin-film composites, facilitated transport membranes, and mixed-matrix membranes, offer potential advantages like enhanced durability and improved selectivity, potentially even at temperatures other than room temperature.

Supplementary Materials

The following supporting information can be downloaded at https://www.mdpi.com/article/10.3390/polym17101387/s1, Figure S1: Liquid-phase temperature ranges studied in the selected literature for (a) physical CO2 capture as reported in Table 2 [37,38,39,40,41,42] in the manuscript, and (b) chemical CO2 capture (see Table 3) [37,38,40,43,44,45] using polymeric HFM contactors [37,38,39,40,41,42,43,44,45]. The figures show the location of all the literature data points used in this study [37,38,39,40,41,42,43,44,45]; Figure S2: Impact of normalized liquid-phase temperature on normalized CO2 flux (mol/m2s) for 3-diethylaminopropylamine (DEAPA) at two different concentrations (1 and 2 mol/L) across a microporous PTFE HFM contactor composed of three modules connected in series [52]. Each module is 20 cm long, resulting in a total length of 60 cm; Figure S3: Impact of normalized liquid-phase temperature (H2O) on normalized CO2 flux (mol/m2s) across a microporous (PP) HFM contactor recently studied by Luqmani et al. [53] with Nf = 10,200, and another two HFM contactors with Nf = 10 (H2O) [38] and Nf = 30 (H2O) [39], respectively.

Author Contributions

Conceptualization, E.M.; methodology, E.M.; validation, E.M., M.C.S., and J.H.P.; formal analysis, E.M.; investigation, E.M.; resources, J.H.P.; data curation, M.C.S.; writing—original draft preparation, E.M.; writing—review and editing, E.M.; visualization, E.M.; supervision, J.H.P.; project administration, J.H.P.; funding acquisition, J.H.P. All authors have read and agreed to the published version of the manuscript.

Funding

This research was supported by the Technology Innovation Program (20024287, Manufacturing technology and application product development of medical-grade hollow fiber membranes) funded by the Ministry of Trade, Industry, and Energy (MOTIE, Korea).

Institutional Review Board Statement

Not applicable.

Data Availability Statement

The raw data supporting the conclusions of this article will be made available by the authors upon request.

Conflicts of Interest

The authors declare no conflicts of interest.

References

  1. Cigala, R.M.; De Luca, G.; Ielo, I.; Crea, F. Biopolymeric Nanocomposites for CO2 Capture. Polymers 2024, 16, 1063. [Google Scholar] [CrossRef] [PubMed]
  2. Da Cunha, G.; De Medeiros, J.; Araújo, O. Carbon Capture from CO2-Rich Natural Gas via Gas-Liquid Membrane Contactors with Aqueous-Amine Solvents: A Review. Gases 2022, 2, 98–133. [Google Scholar] [CrossRef]
  3. Kalmykov, D.; Shirokikh, S.; Grushevenko, E.A.; Legkov, S.A.; Bondarenko, G.N.; Anokhina, T.S.; Molchanov, S.; Bazhenov, S.D. Stability of Porous Polymeric Membranes in Amine Solvents for Membrane Contactor Applications. Membranes 2023, 13, 544. [Google Scholar] [CrossRef]
  4. Sreedhar, I.; Vaidhiswaran, R.; Kamani, B.M.; Venugopal, A. Process and Engineering Trends in Membrane Based Carbon Capture. Renew. Sustain. Energy Rev. 2017, 68, 659–684. [Google Scholar] [CrossRef]
  5. Lee, Y.; Park, Y.-J.; Lee, J.; Bae, T.-H. Recent Advances and Emerging Applications of Membrane Contactors. Chem. Eng. J. 2023, 461, 141948. [Google Scholar] [CrossRef]
  6. Pabby, A.K.; Sastre, A.M. State-of-the-Art Review on Hollow Fibre Contactor Technology and Membrane-Based Extraction Processes. J. Membr. Sci. 2013, 430, 263–303. [Google Scholar] [CrossRef]
  7. Da Silva Biron, D.; Espíndola, J.C.; Subtil, E.L.; Mierzwa, J.C. A New Approach to the Development of Hollow Fiber Membrane Modules for Water Treatment: Mixed Polymer Matrices. Membranes 2023, 13, 613. [Google Scholar] [CrossRef] [PubMed]
  8. Li, G.; Kujawski, W.; Válek, R.; Koter, S. A Review—The Development of Hollow Fibre Membranes for Gas Separation Processes. Int. J. Greenh. Gas Control 2021, 104, 103195. [Google Scholar] [CrossRef]
  9. Li, J.-L.; Chen, B.-H. Review of CO2 Absorption Using Chemical Solvents in Hollow Fiber Membrane Contactors. Sep. Purif. Technol. 2005, 41, 109–122. [Google Scholar] [CrossRef]
  10. Li, L.; Ma, G.; Pan, Z.; Zhang, N.; Zhang, Z. Research Progress in Gas Separation Using Hollow Fiber Membrane Contactors. Membranes 2020, 10, 380. [Google Scholar] [CrossRef]
  11. Imtiaz, A.; Othman, M.H.D.; Jilani, A.; Khan, I.U.; Kamaludin, R.; Ayub, M.; Samuel, O.; Kurniawan, T.A.; Hashim, N.; Puteh, M.H. A Critical Review in Recent Progress of Hollow Fiber Membrane Contactors for Efficient CO2 Separations. Chemosphere 2023, 325, 138300. [Google Scholar] [CrossRef] [PubMed]
  12. Alammar, A.Y.; Choi, S.-H.; Buonomenna, M.G. Hollow Fiber Membrane Modification by Interfacial Polymerization for Organic Solvent Nanofiltration. Processes 2024, 12, 563. [Google Scholar] [CrossRef]
  13. Wojciechowski, C.; Wasyłeczko, M.; Lewińska, D.; Chwojnowski, A. A Comprehensive Review of Hollow-Fiber Membrane Fabrication Methods across Biomedical, Biotechnological, and Environmental Domains. Molecules 2024, 29, 2637. [Google Scholar] [CrossRef] [PubMed]
  14. Lee, H.J.; Magnone, E.; Park, J.H. Preparation, Characterization and Laboratory-Scale Application of Modified Hydrophobic Aluminum Oxide Hollow Fiber Membrane for CO2 Capture Using H2O as Low-Cost Absorbent. J. Membr. Sci. 2015, 494, 143–153. [Google Scholar] [CrossRef]
  15. Gargari, S.F.; Mirfendereski, S.M. Enhanced CO2 Removal in Hollow Fiber Membrane Contactors Using Amine-Based Nanofluids. J. Ind. Eng. Chem. 2023, 128, 356–368. [Google Scholar] [CrossRef]
  16. Khan, U.; Ogbaga, C.C.; Abiodun, O.-A.O.; Adeleke, A.A.; Ikubanni, P.P.; Okoye, P.U.; Okolie, J.A. Assessing Absorption-Based CO2 Capture: Research Progress and Techno-Economic Assessment Overview. Carbon Capture Sci. Technol. 2023, 8, 100125. [Google Scholar] [CrossRef]
  17. De Carvalho Pinto, P.C.; Batista, T.V.; De Rezende Ferreira, G.; Voga, G.P.; Oliveira, L.C.A.; Oliveira, H.S.; De Souza, L.A.; Belchior, J.C. Chemical Absorption of CO2 Enhanced by Solutions of Alkali Hydroxides and Alkoxides at Room Temperature. ChemistrySelect 2022, 7, e202202731. [Google Scholar] [CrossRef]
  18. Carroll, J.J.; Slupsky, J.D.; Mather, A.E. The Solubility of Carbon Dioxide in Water at Low Pressure. J. Phys. Chem. Ref. Data 1991, 20, 1201–1209. [Google Scholar] [CrossRef]
  19. Crovetto, R. Evaluation of Solubility Data of the System CO2–H2O from 273 K to the Critical Point of Water. J. Phys. Chem. Ref. Data 1991, 20, 575–589. [Google Scholar] [CrossRef]
  20. Wiebe, R.; Gaddy, V.L. The Solubility of Carbon Dioxide in Water at Various Temperatures from 12 to 40° and at Pressures to 500 Atmospheres. Critical Phenomena. J. Am. Chem. Soc. 1940, 62, 815–817. [Google Scholar] [CrossRef]
  21. Boributh, S.; Assabumrungrat, S.; Laosiripojana, N.; Jiraratananon, R. A Modeling Study on the Effects of Membrane Characteristics and Operating Parameters on Physical Absorption of CO2 by Hollow Fiber Membrane Contactor. J. Membr. Sci. 2011, 380, 21–33. [Google Scholar] [CrossRef]
  22. Versteeg, G.F.; Van Swaaij, W.P.M. Solubility and Diffusivity of Acid Gases (Carbon Dioxide, Nitrous Oxide) in Aqueous Alkanolamine Solutions. J. Chem. Eng. Data 1988, 33, 29–34. [Google Scholar] [CrossRef]
  23. Diamond, L.W.; Akinfiev, N.N. Solubility of CO2 in Water from −1.5 to 100 °C and from 0.1 to 100 MPa: Evaluation of Literature Data and Thermodynamic Modelling. Fluid Phase Equilibria 2003, 208, 265–290. [Google Scholar] [CrossRef]
  24. Zeman, F. Energy and Material Balance of CO2 Capture from Ambient Air. Environ. Sci. Technol. 2007, 41, 7558–7563. [Google Scholar] [CrossRef] [PubMed]
  25. Kucka, L.; Kenig, E.Y.; Górak, A. Kinetics of the Gas−liquid Reaction between Carbon Dioxide and Hydroxide Ions. Ind. Eng. Chem. Res. 2002, 41, 5952–5957. [Google Scholar] [CrossRef]
  26. Vázquez, G.; Alvarez, E.; Varela, R.; Cancela, A.; Navaza, J.M. Density and Viscosity of Aqueous Solutions of Sodium Dithionite, Sodium Hydroxide, Sodium Dithionite + Sucrose, and Sodium Dithionite + Sodium Hydroxide + Sucrose from 25 °C to 40 °C. J. Chem. Eng. Data 1996, 41, 244–248. [Google Scholar] [CrossRef]
  27. Ghosh, U.K.; Kentish, S.E.; Stevens, G.W. Absorption of Carbon Dioxide into Aqueous Potassium Carbonate Promoted by Boric Acid. Energy Procedia 2009, 1, 1075–1081. [Google Scholar] [CrossRef]
  28. Saidi, M.; Heidarinejad, S.; Rahimpour, H.R.; Talaghat, M.R.; Rahimpour, M.R. Mathematical Modeling of Carbon Dioxide Removal Using Amine-Promoted Hot Potassium Carbonate in a Hollow Fiber Membrane Contactor. J. Nat. Gas Sci. Eng. 2014, 18, 274–285. [Google Scholar] [CrossRef]
  29. Mehdipour, M.; Karami, M.R.; Keshavarz, P.; Ayatollahi, S. Analysis of CO2 Separation with Aqueous Potassium Carbonate Solution in a Hollow Fiber Membrane Contactor. Energy Fuels 2013, 27, 2185–2193. [Google Scholar] [CrossRef]
  30. Lee, Y.; Noble, R.D.; Yeom, B.-Y.; Park, Y.-I.; Lee, K.-H. Analysis of CO2 Removal by Hollow Fiber Membrane Contactors. J. Membr. Sci. 2001, 194, 57–67. [Google Scholar] [CrossRef]
  31. Borhani, T.N.G.; Azarpour, A.; Akbari, V.; Wan Alwi, S.R.; Manan, Z.A. CO2 Capture with Potassium Carbonate Solutions: A State-of-the-Art Review. Int. J. Greenh. Gas Control 2015, 41, 142–162. [Google Scholar] [CrossRef]
  32. Acampora, L.; Grilletta, S.; Costa, G. The Integration of Carbon Capture, Utilization, and Storage (CCUS) in Waste-to-Energy Plants: A Review. Energies 2025, 18, 1883. [Google Scholar] [CrossRef]
  33. Hamdy, L.B.; Goel, C.; Rudd, J.A.; Barron, A.R.; Andreoli, E. The Application of Amine-Based Materials for Carbon Capture and Utilisation: An Overarching View. Mater. Adv. 2021, 2, 5843–5880. [Google Scholar] [CrossRef]
  34. El Hadri, N.; Quang, D.V.; Goetheer, E.L.V.; Abu Zahra, M.R.M. Aqueous Amine Solution Characterization for Post-Combustion CO2 Capture Process. Appl. Energy 2017, 185, 1433–1449. [Google Scholar] [CrossRef]
  35. Sartori, G.; Savage, D.W. Sterically Hindered Amines for Carbon Dioxide Removal from Gases. Ind. Eng. Chem. Fund. 1983, 22, 239–249. [Google Scholar] [CrossRef]
  36. Krzemień, A.; Więckol-Ryk, A.; Smoliński, A.; Koteras, A.; Więcław-Solny, L. Assessing the Risk of Corrosion in Amine-Based CO2 Capture Process. J. Loss Prev. Process Ind. 2016, 43, 189–197. [Google Scholar] [CrossRef]
  37. Ghobadi, J.; Ramirez, D.; Jerman, R.; Crane, M.; Khoramfar, S. CO2 Separation Performance of Different Diameter Polytetrafluoroethylene Hollow Fiber Membranes Using Gas-Liquid Membrane Contacting System. J. Membr. Sci. 2018, 549, 75–83. [Google Scholar] [CrossRef]
  38. Mansourizadeh, A.; Ismail, A.F.; Matsuura, T. Effect of Operating Conditions on the Physical and Chemical CO2 Absorption through the PVDF Hollow Fiber Membrane Contactor. J. Membr. Sci. 2010, 353, 192–200. [Google Scholar] [CrossRef]
  39. Mansourizadeh, A. Experimental Study of CO2 Absorption/Stripping via PVDF Hollow Fiber Membrane Contactor. Chem. Eng. Res. Des. 2012, 90, 555–562. [Google Scholar] [CrossRef]
  40. Atchariyawut, S.; Jiraratananon, R.; Wang, R. Separation of CO2 from CH4 by Using Gas–Liquid Membrane Contacting Process. J. Membr. Sci. 2007, 304, 163–172. [Google Scholar] [CrossRef]
  41. Golkhar, A.; Keshavarz, P.; Mowla, D. Investigation of CO2 Removal by Silica and CNT Nanofluids in Microporous Hollow Fiber Membrane Contactors. J. Membr. Sci. 2013, 433, 17–24. [Google Scholar] [CrossRef]
  42. Mohammaddoost, H.; Azari, A.; Ansarpour, M.; Osfouri, S. Experimental Investigation of CO2 Removal from N2 by Water/TiO2 NFs in PP Hollow Fiber Membrane Contactors. In Proceedings of the 9th International Chemical Engineering Congress & Exhibition (IChEC 2015), Shiraz, Iran, 26–28 December 2015. [Google Scholar]
  43. Rahim, N.A.; Ghasem, N.; Al-Marzouqi, M. Absorption of CO2 from Natural Gas Using Different Amino Acid Salt Solutions and Regeneration Using Hollow Fiber Membrane Contactors. J. Nat. Gas Sci. Eng. 2015, 26, 108–117. [Google Scholar] [CrossRef]
  44. Cao, F.; Gao, H.; Xiong, Q.; Liang, Z. Experimental Studies on Mass Transfer Performance for CO2 Absorption into Aqueous N,N-Dimethylethanolamine (DMEA) Based Solutions in a PTFE Hollow Fiber Membrane Contactor. Int. J. Greenh. Gas Control 2019, 82, 210–217. [Google Scholar] [CrossRef]
  45. Yan, S.; Fang, M.-X.; Zhang, W.-F.; Wang, S.-Y.; Xu, Z.-K.; Luo, Z.-Y.; Cen, K.-F. Experimental Study on the Separation of CO2 from Flue Gas Using Hollow Fiber Membrane Contactors without Wetting. Fuel Process. Technol. 2007, 88, 501–511. [Google Scholar] [CrossRef]
  46. Saidi, M. Mathematical Modeling of CO2 Absorption into Novel Reactive DEAB Solution in Hollow Fiber Membrane Contactors; Kinetic and Mass Transfer Investigation. J. Membr. Sci. 2017, 524, 186–196. [Google Scholar] [CrossRef]
  47. Privalova, E.I.; Mäki-Arvela, P.; Murzin, D.Y.; Mikkhola, J.P. Capturing CO2: Conventional versus Ionic-Liquid Based Technologies. Russ. Chem. Rev. 2012, 81, 435–457. [Google Scholar] [CrossRef]
  48. Faisal Elmobarak, W.; Almomani, F.; Tawalbeh, M.; Al-Othman, A.; Martis, R.; Rasool, K. Current Status of CO2 Capture with Ionic Liquids: Development and Progress. Fuel 2023, 344, 128102. [Google Scholar] [CrossRef]
  49. Boucif, N.; Roizard, D.; Corriou, J.-P.; Favre, E. To What Extent Does Temperature Affect Absorption in Gas-Liquid Hollow Fiber Membrane Contactors? Sep. Sci. Technol. 2015, 50, 1331–1343. [Google Scholar] [CrossRef]
  50. Pandya, J.D. Adiabatic Gas Absorption and Stripping with Chemical Reaction in Packed Tower. Chem. Eng. Commun. 1983, 19, 343–361. [Google Scholar] [CrossRef]
  51. Jalali, A.; Lotfi, M.; Mohebbi, S.; Baghban, A. Modeling of CO2 Capture from Gas Stream Emissions of Petrochemical Industries by Membrane Contactor. Pet. Sci. Technol. 2018, 36, 1446–1454. [Google Scholar] [CrossRef]
  52. Chen, G.; Chen, G.; Cao, F.; Zhang, R.; Gao, H.; Liang, Z. Mass Transfer Performance and Correlation for CO2 Absorption into Aqueous 3-Diethylaminopropylamine Solution in a Hollow Fiber Membrane Contactor. Chem. Eng. Process.-Process Intensif. 2020, 152, 107932. [Google Scholar] [CrossRef]
  53. Luqmani, B.; Brookes, A.; Moore, A.; Vale, P.; Pidou, M.; McAdam, E.J. The Role of Solvent Temperature and Gas Pressure on CO2 Mass Transfer during Biogas Upgrading within Porous and Dense-Skin Hollow Fibre Membrane Contactors. J. Membr. Sci. 2023, 685, 121967. [Google Scholar] [CrossRef]
  54. Wang, B.; Shao, Y.; Yang, L.; Guo, K.; Li, X.; Sun, M.; Hao, Y. Sustainable Hydrogen Production with Negative Carbon Emission through Thermochemical Conversion of Biogas/Biomethane. Energies 2025, 18, 1804. [Google Scholar] [CrossRef]
  55. Singh, D.; Sirini, P.; Lombardi, L. Review of Reforming Processes for the Production of Green Hydrogen from Landfill Gas. Energies 2024, 18, 15. [Google Scholar] [CrossRef]
  56. Feng, C.Y.; Khulbe, K.C.; Matsuura, T.; Ismail, A.F. Recent Progresses in Polymeric Hollow Fiber Membrane Preparation, Characterization and Applications. Sep. Purif. Technol. 2013, 111, 43–71. [Google Scholar] [CrossRef]
  57. Dindore, V.Y.; Brilman, D.W.F.; Feron, P.H.M.; Versteeg, G.F. CO2 Absorption at Elevated Pressures Using a Hollow Fiber Membrane Contactor. J. Membr. Sci. 2004, 235, 99–109. [Google Scholar] [CrossRef]
Figure 1. (a) CO2 separation (%) (◆, ▼, ▲, ●, △, ▽, ○, □ [37]; ▽, ◇ [41]), (b) CO2 absorption flux (mol/m2s) (■, △ [38]; □ [39]; ○, ◆ [40], ▽, ◇ [42]; ●, ▲ [43]; ▼ [44]; ◀, ▶ [45]), and (c) modeling studies (□ [21]; ● [29]; ■, ○ [46]), as a function of liquid-phase temperature.
Polymers 17 01387 g001
Figure 3. Normalized values of (a) CO2 absorption flux (mol/m2s) (△ [38]; □ [39]; ○, ◆ [40], ▽, ◇ [42]; ●, ▲ [43]; ▼ [44]; ◀, ▶ [45]) and (b) comparison of modeling studies (□ [21]; ● [29]; ■, ○ [46]) with experimental data on CO2 solubility in water [18] (*). The left y-axis represents CO2 absorption flux (mol/m2s) [21,29,46], while the right y-axis shows CO2 solubility in water (see Table 1) [18].
Polymers 17 01387 g003
Table 1. Solubility of CO2 in water at atmospheric pressure (solubility in mole fraction of CO2 in the liquid phase × 1000) [18].
T (°C)0102030405060708090
Solubility1.3620.9620.7040.5310.4090.3190.2470.1850.1270.067
Table 2. Physical CO2 capture using polymeric HFM contactors [37,38,39,40,41,42]. Data organized and arranged using the number of polymeric fibers (Nf) as the primary classification criterion.
Ref.[37][37][37][38][39][40][41][42][42]
FiberPTFEPTFEPTFEPVDFPVDFPVDFPPPPPP
LiquidH2OH2OH2OH2OH2OH2OH2O NFH2O NFH2O NF
Ti (°C)202020101030302020
Tf (°C)606060404060704040
Nf14810303540012001200
F.Od (mm)3.521.841.210.9510.450.40.4
F.Id (mm)2.961.460.680.550.60.650.320.30.3
F.l (mm) 150150 400250250
M.Pd (µm)0.510.580.48 0.20.150.20.2
M.P (%)525252 77.10.75 * 5050
B.p (psi)12.31414.8
M.Od (mm)6.356.356.35
M.Id (mm)4.784.784.78141410203434
M.l (mm)230230230270270270
C.A. (cm2)4288115 1901600
P.D.545951204582
PTFE = polytetrafluoroethylene, PVDF = polyvinylidene fluoride, PP = polypropylene, NF = nanofluid, Ti = initial temperature, Tf = final temperature, Nf = number of fibers, F.Od = fiber outer diameter, F.Id = fiber inert diameter, F.l = fiber length, M.Pd = membrane pore diameter, M.P = membrane porosity, B.p = bubble point, M.Od = module outer diameter, M.Id = module inert diameter, M.l = module length, C.A. = contact area, P.D. = packing density in % [37] or m2/m3 [38,39]; * = no units (omitted by the authors).
Table 3. Chemical CO2 capture using polymeric HFM contactors [37,38,40,43,44,45]. Data organized and arranged using the number of polymeric fibers (Nf) as the primary classification criterion.
Ref.[37][37][37][37][38][43][43][44][40][45][45]
FiberPTFEPTFEPTFEPTFEPVDFPVDFPVDFPTFEPVDFPPPP
LiquidTEADEAMEAMEANaOHMEANaOHDMEANaOHMDEAMEA
Ti (°C)2020202010202025303030
Tf (°C)6060606040606044605050
Nf1118101616203570007000
F.Od (mm)3.523.523.523.5211.11.11.710.4420.442
F.Id (mm)2.962.962.962.960.550.420.4210.650.3440.344
F.l (mm) 150 800800
M.Pd (µm)0.510.510.510.5
M.P (%)52525252 500.75 *>45>45
B.p (psi)12.312.312.312.3
M.Od (mm)6.356.356.356.35 1515
M.Id (mm)4.784.784.784.781411111.8108080
M.l (mm)23023023023027016016020027010001000
C.A. (cm2)42424242 3434 19060,50060,500
P.D.5454545420417 *17 * 21.421.4
PTFE = polytetrafluoroethylene, PVDF = polyvinylidene fluoride, PP = polypropylene, NF = nanofluid, Ti = initial temperature, Tf = final temperature, Nf = number of fibers, F.Od = fiber outer diameter, F.Id = fiber inert diameter, F.l = fiber length, M.Pd = membrane pore diameter, M.P = membrane porosity, B.p = bubble point, M.Od = module outer diameter, M.Id = module inert diameter, M.l = module length, C.A. = contact area, P.D. = packing density in % [37] or m2/m3 [38,39]; * = no units (omitted by the authors).
Disclaimer/Publisher’s Note: The statements, opinions and data contained in all publications are solely those of the individual author(s) and contributor(s) and not of MDPI and/or the editor(s). MDPI and/or the editor(s) disclaim responsibility for any injury to people or property resulting from any ideas, methods, instructions or products referred to in the content.

