

Experimental Investigations on Microstructure, Properties and Wear Behavior of Chopped Basalt Fiber and Molybdenum Disulfide Reinforced Epoxy Matrix Composites


 ,
,
Abstract
1. Introduction
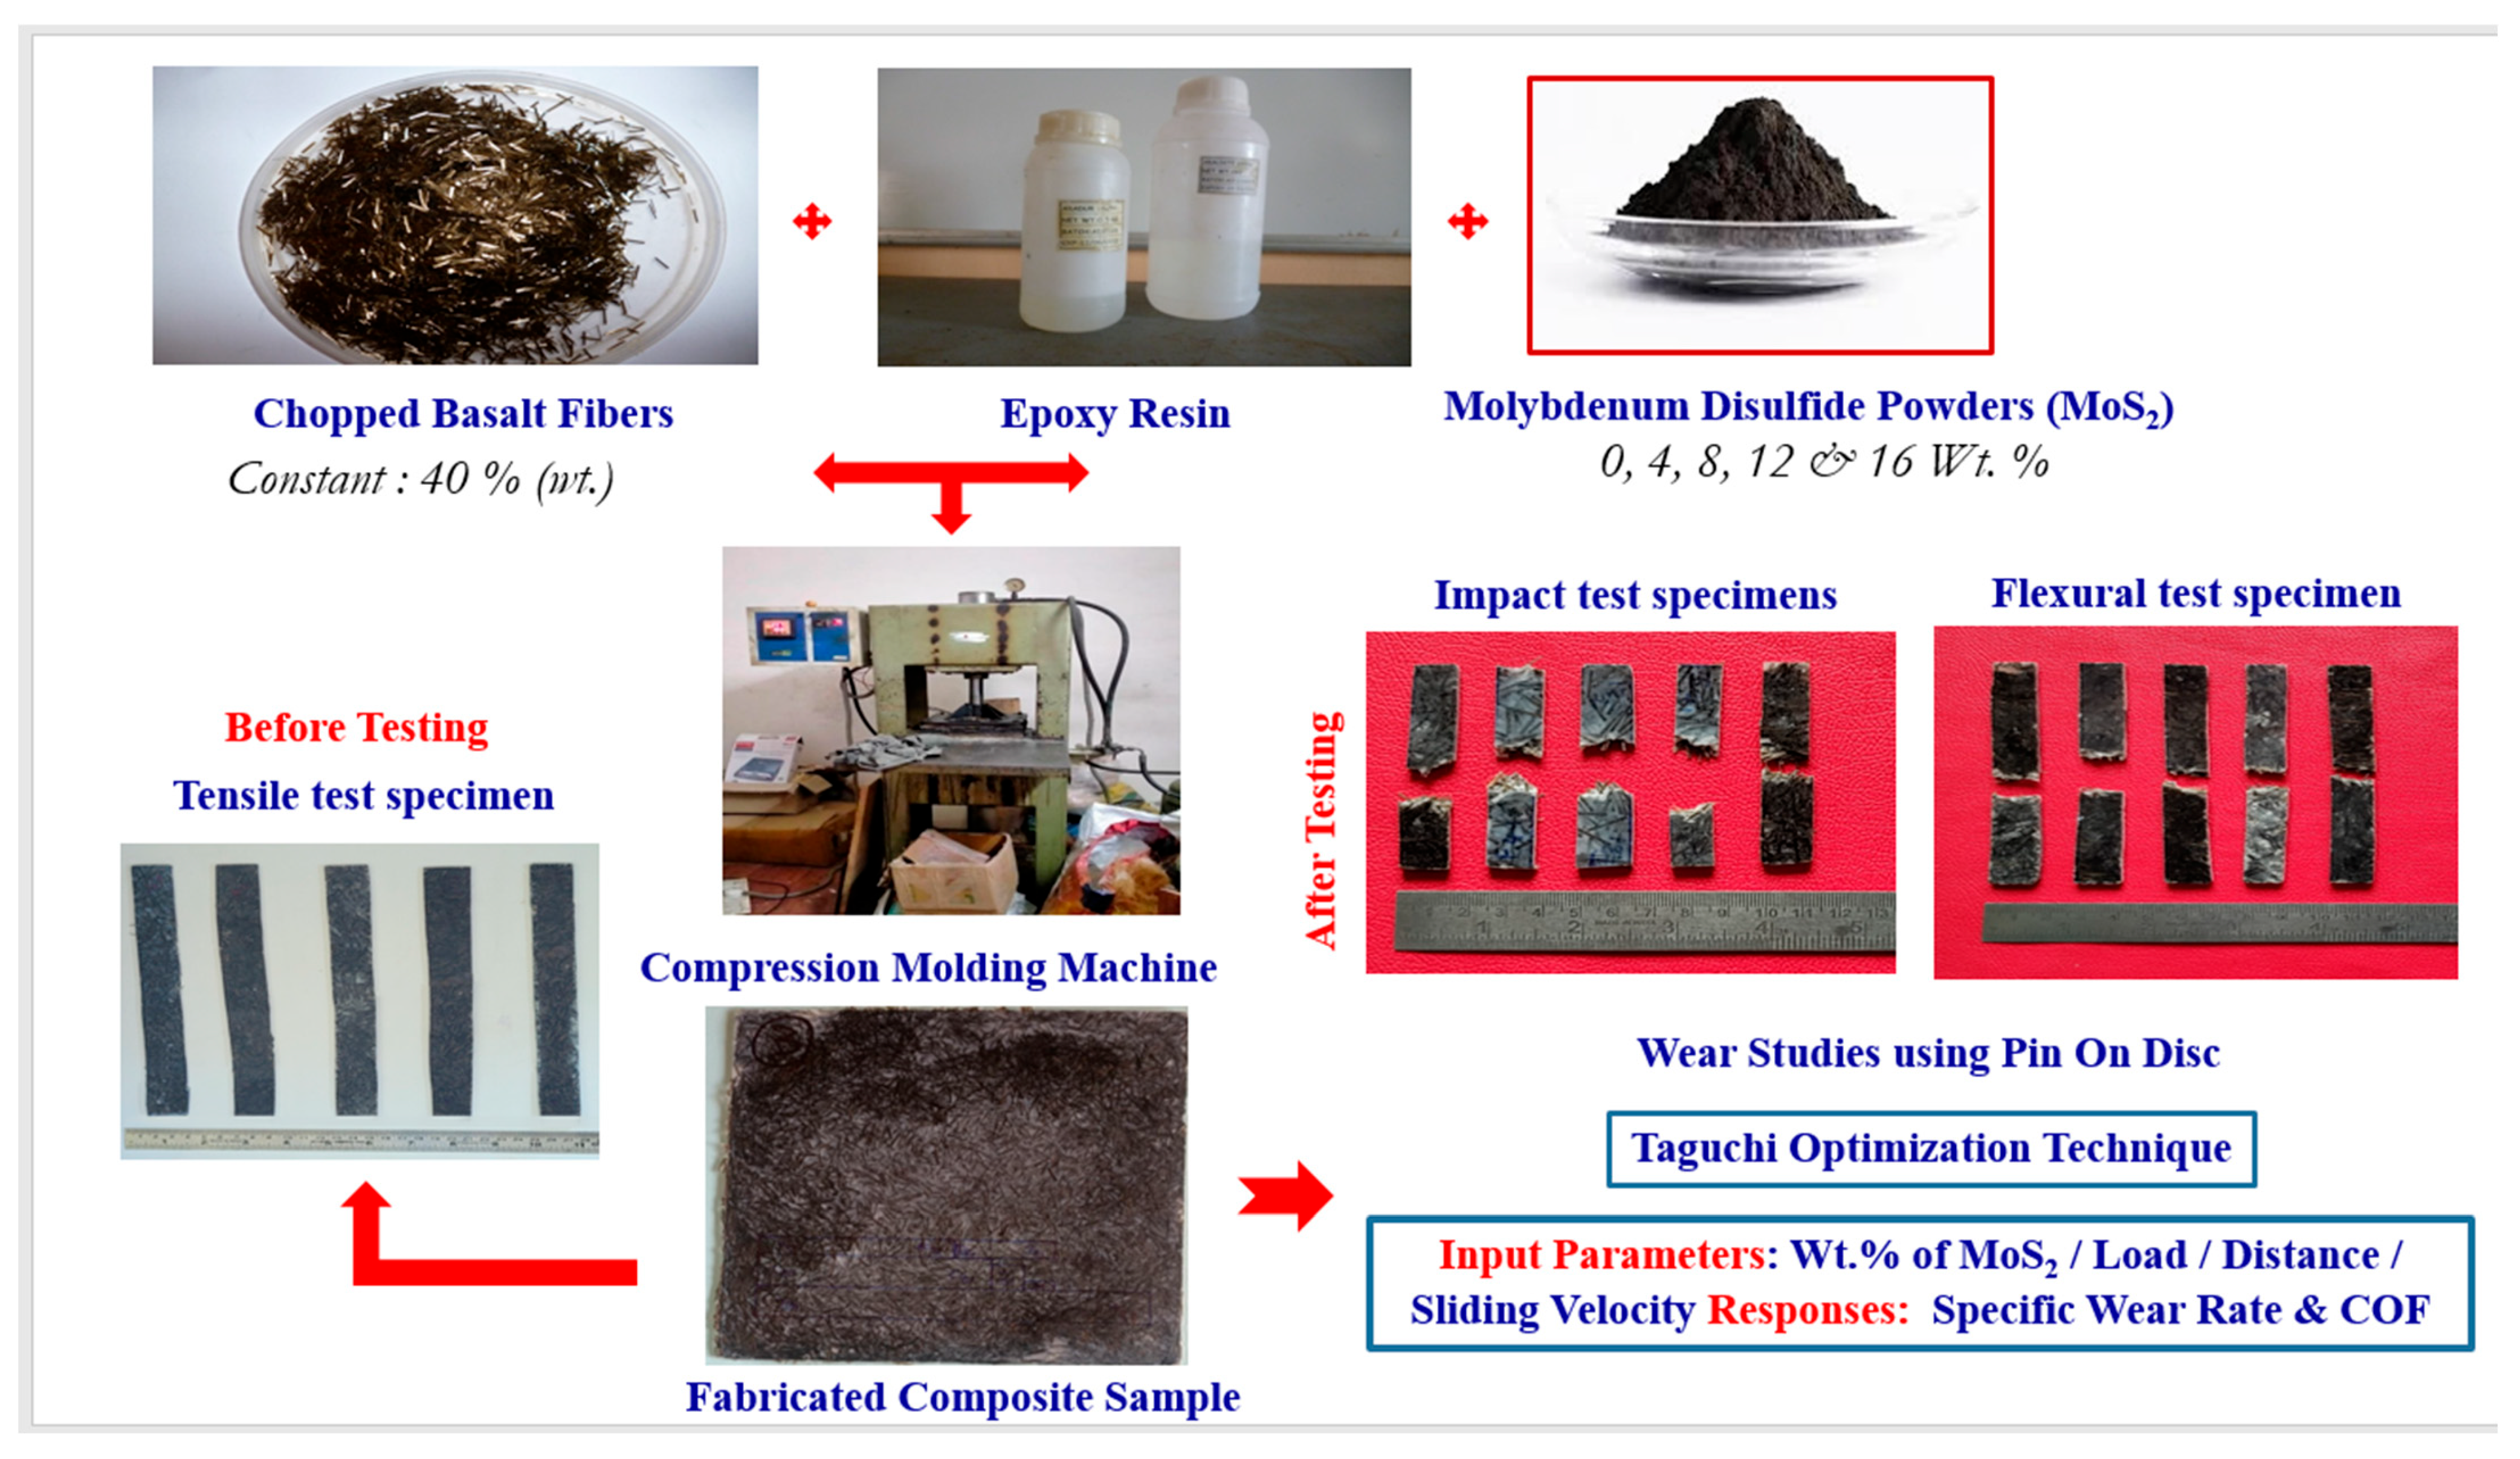
2. Materials and Methods
3. Results and Discussion
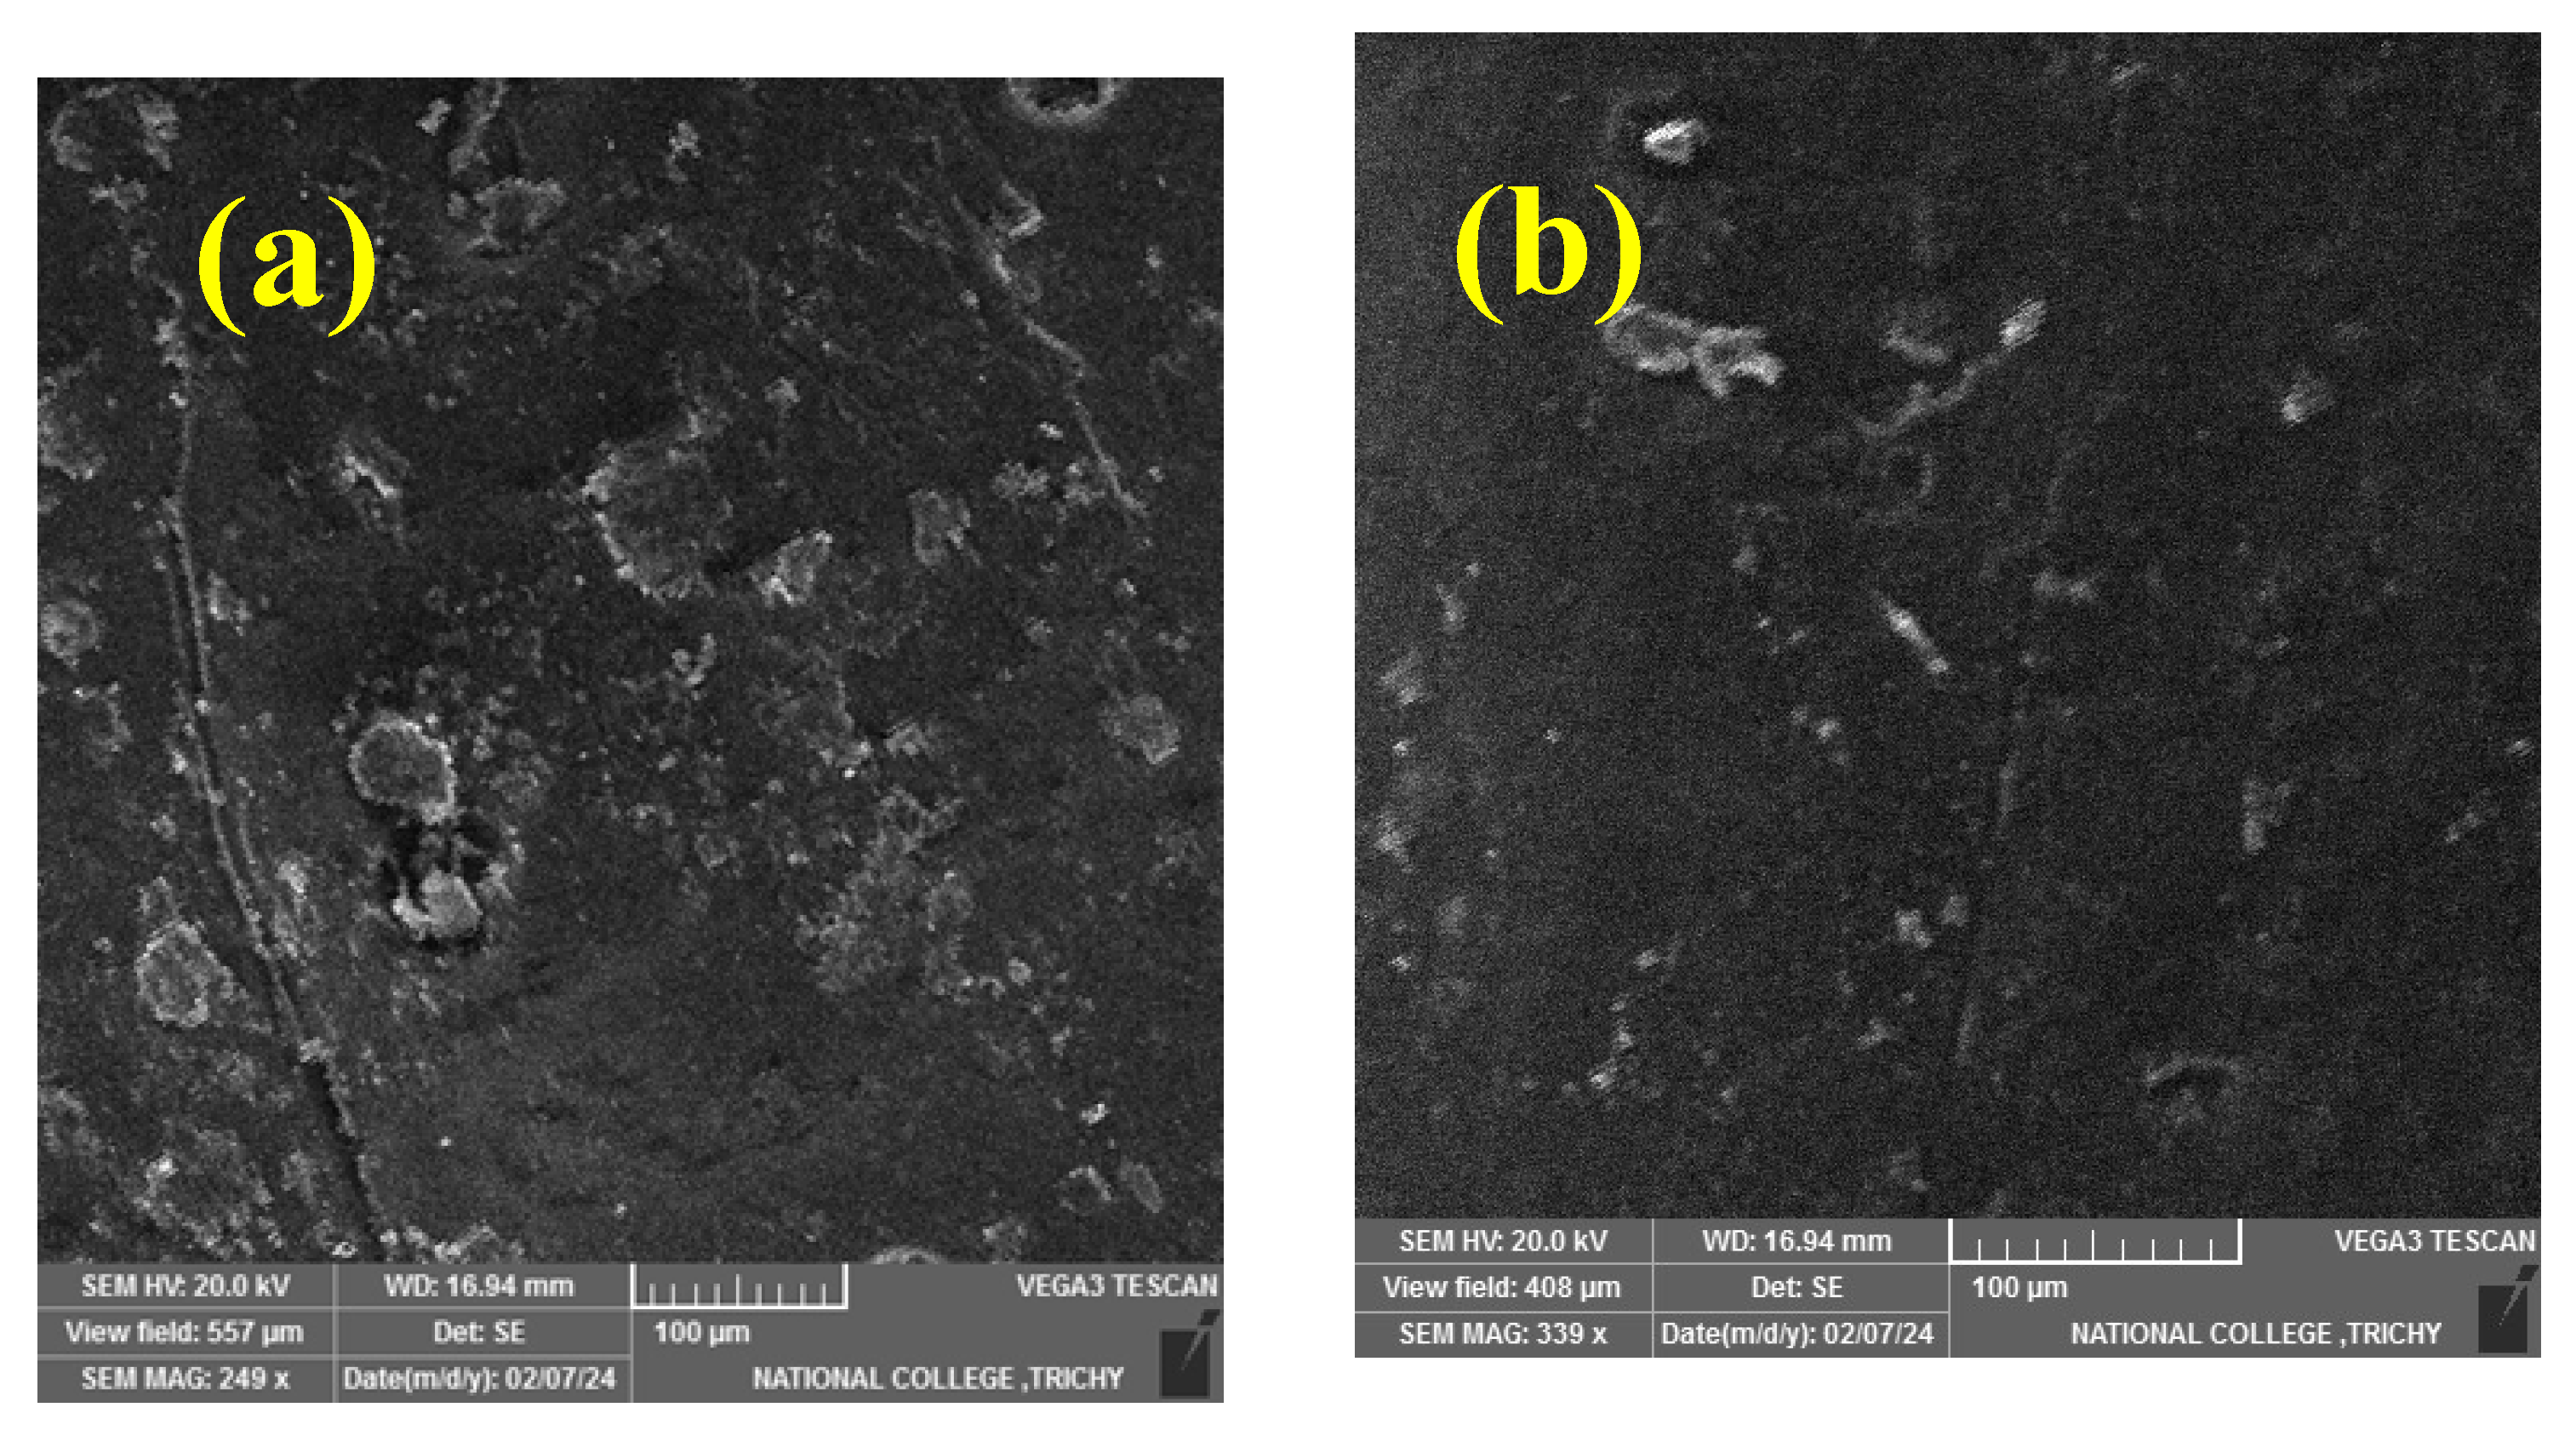
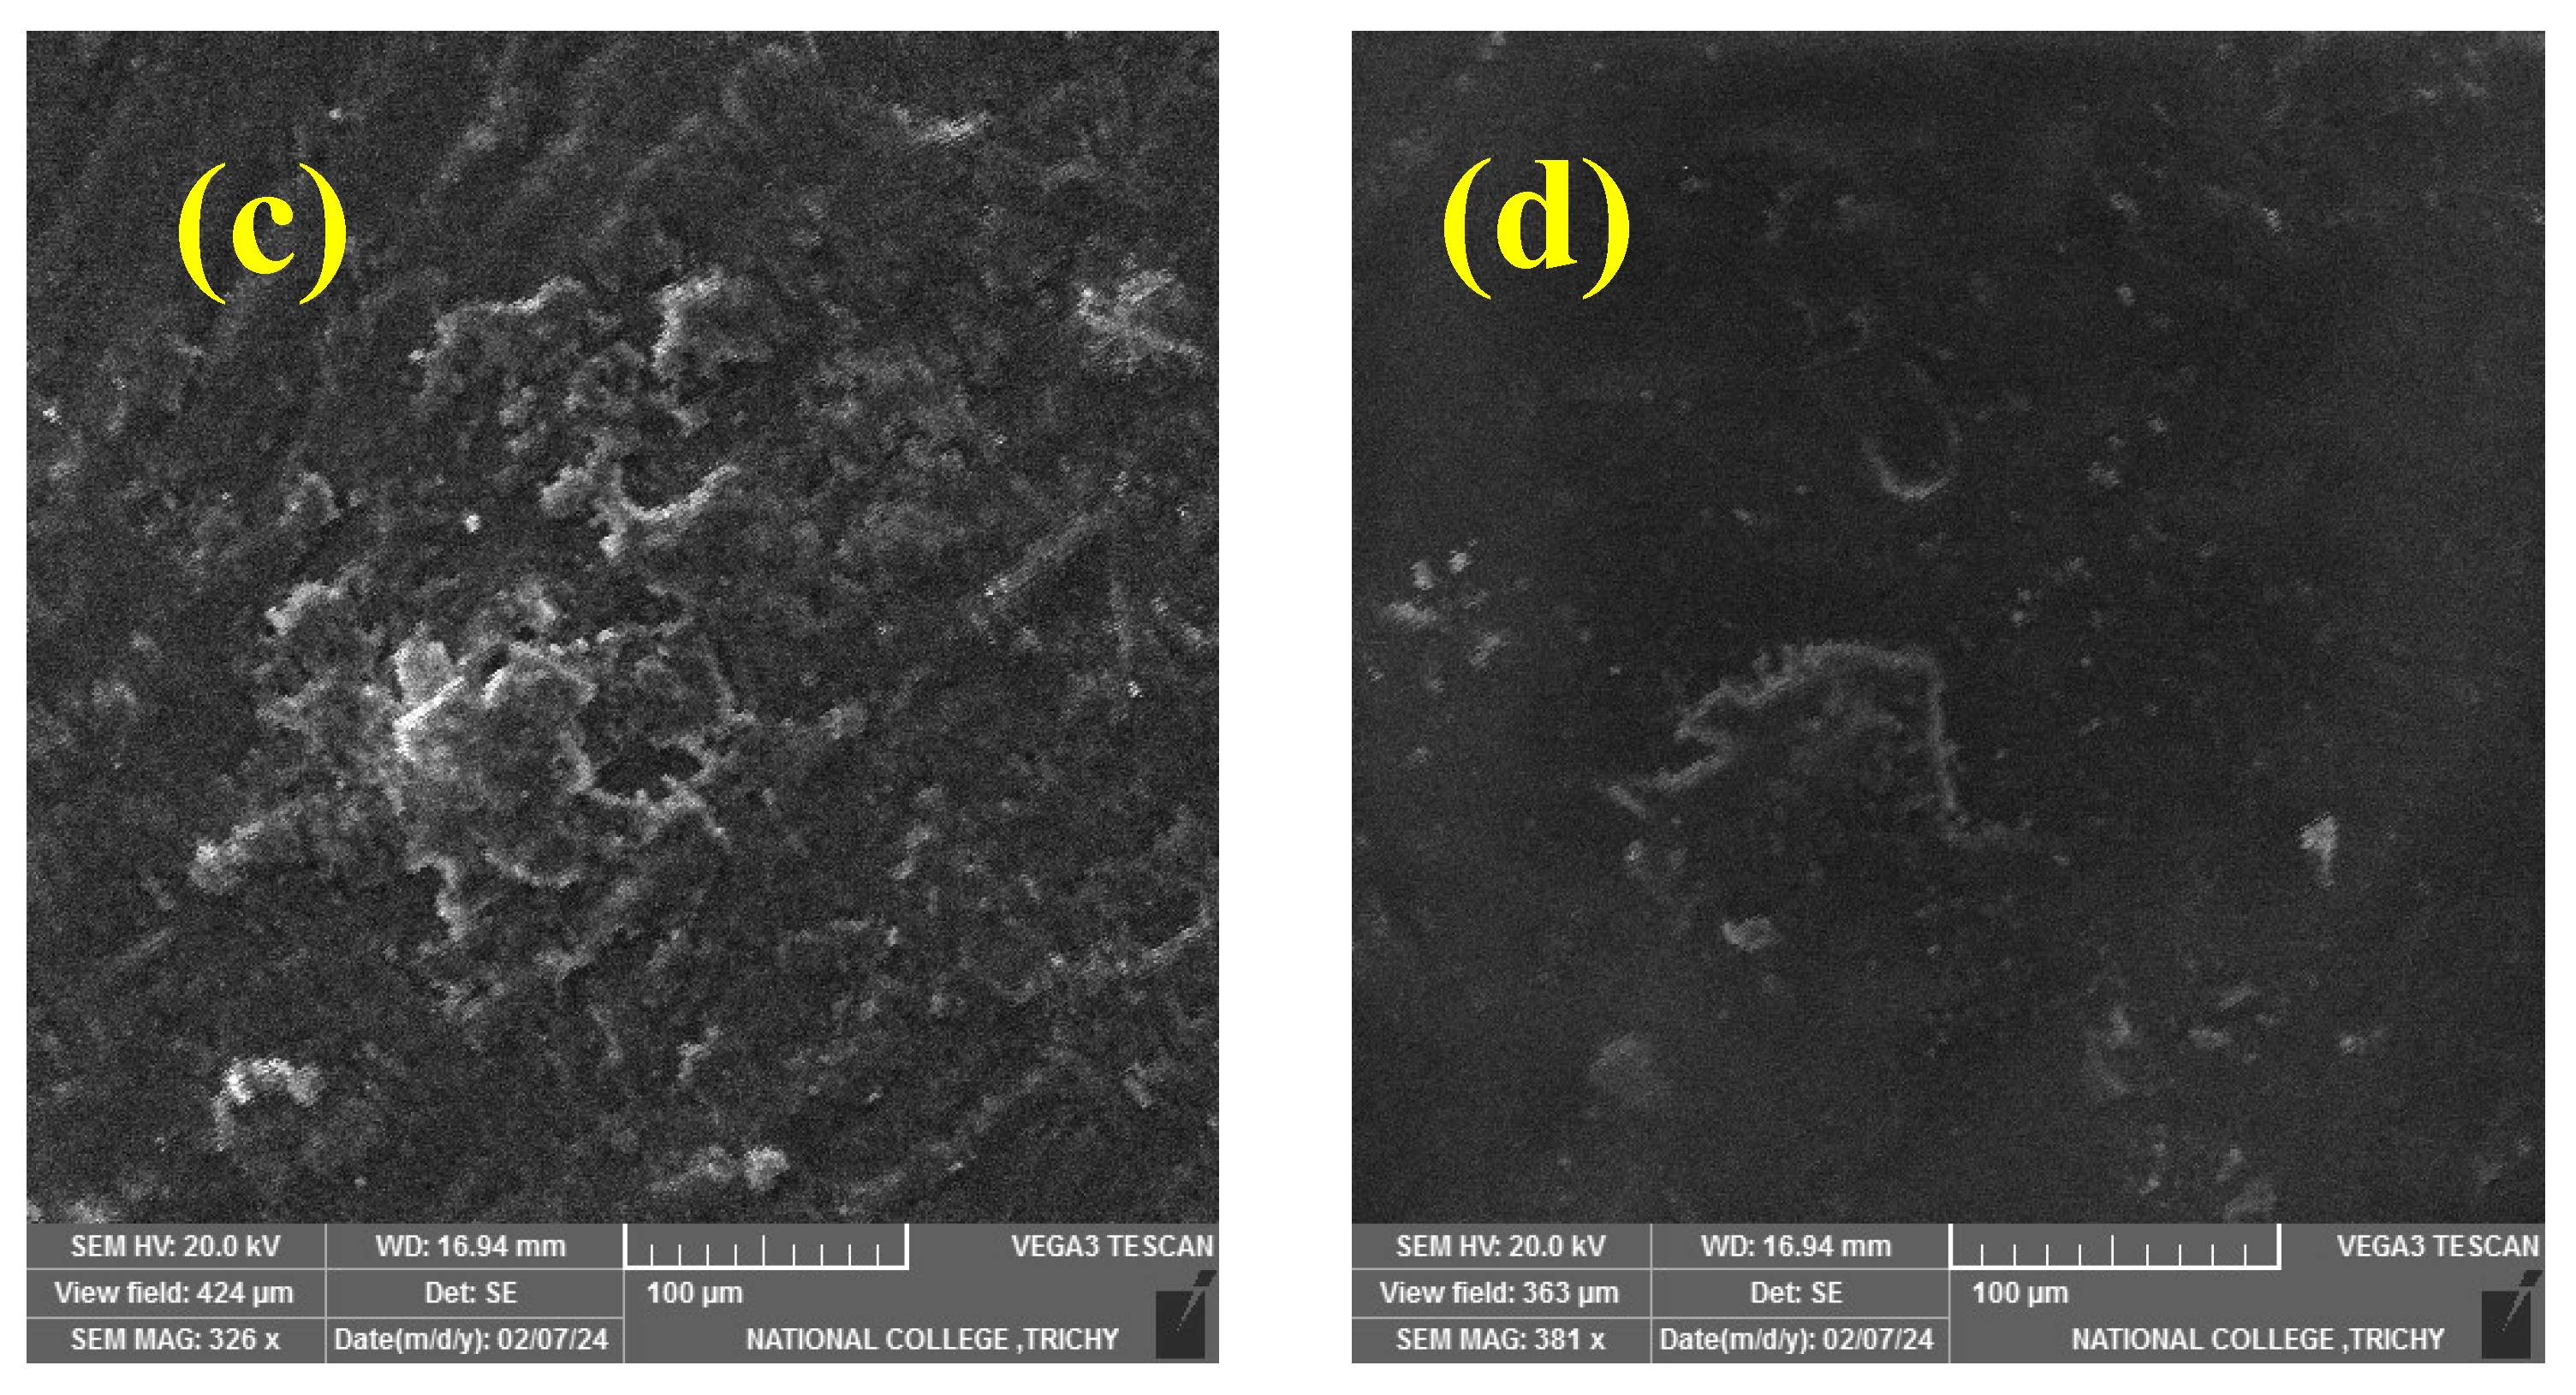
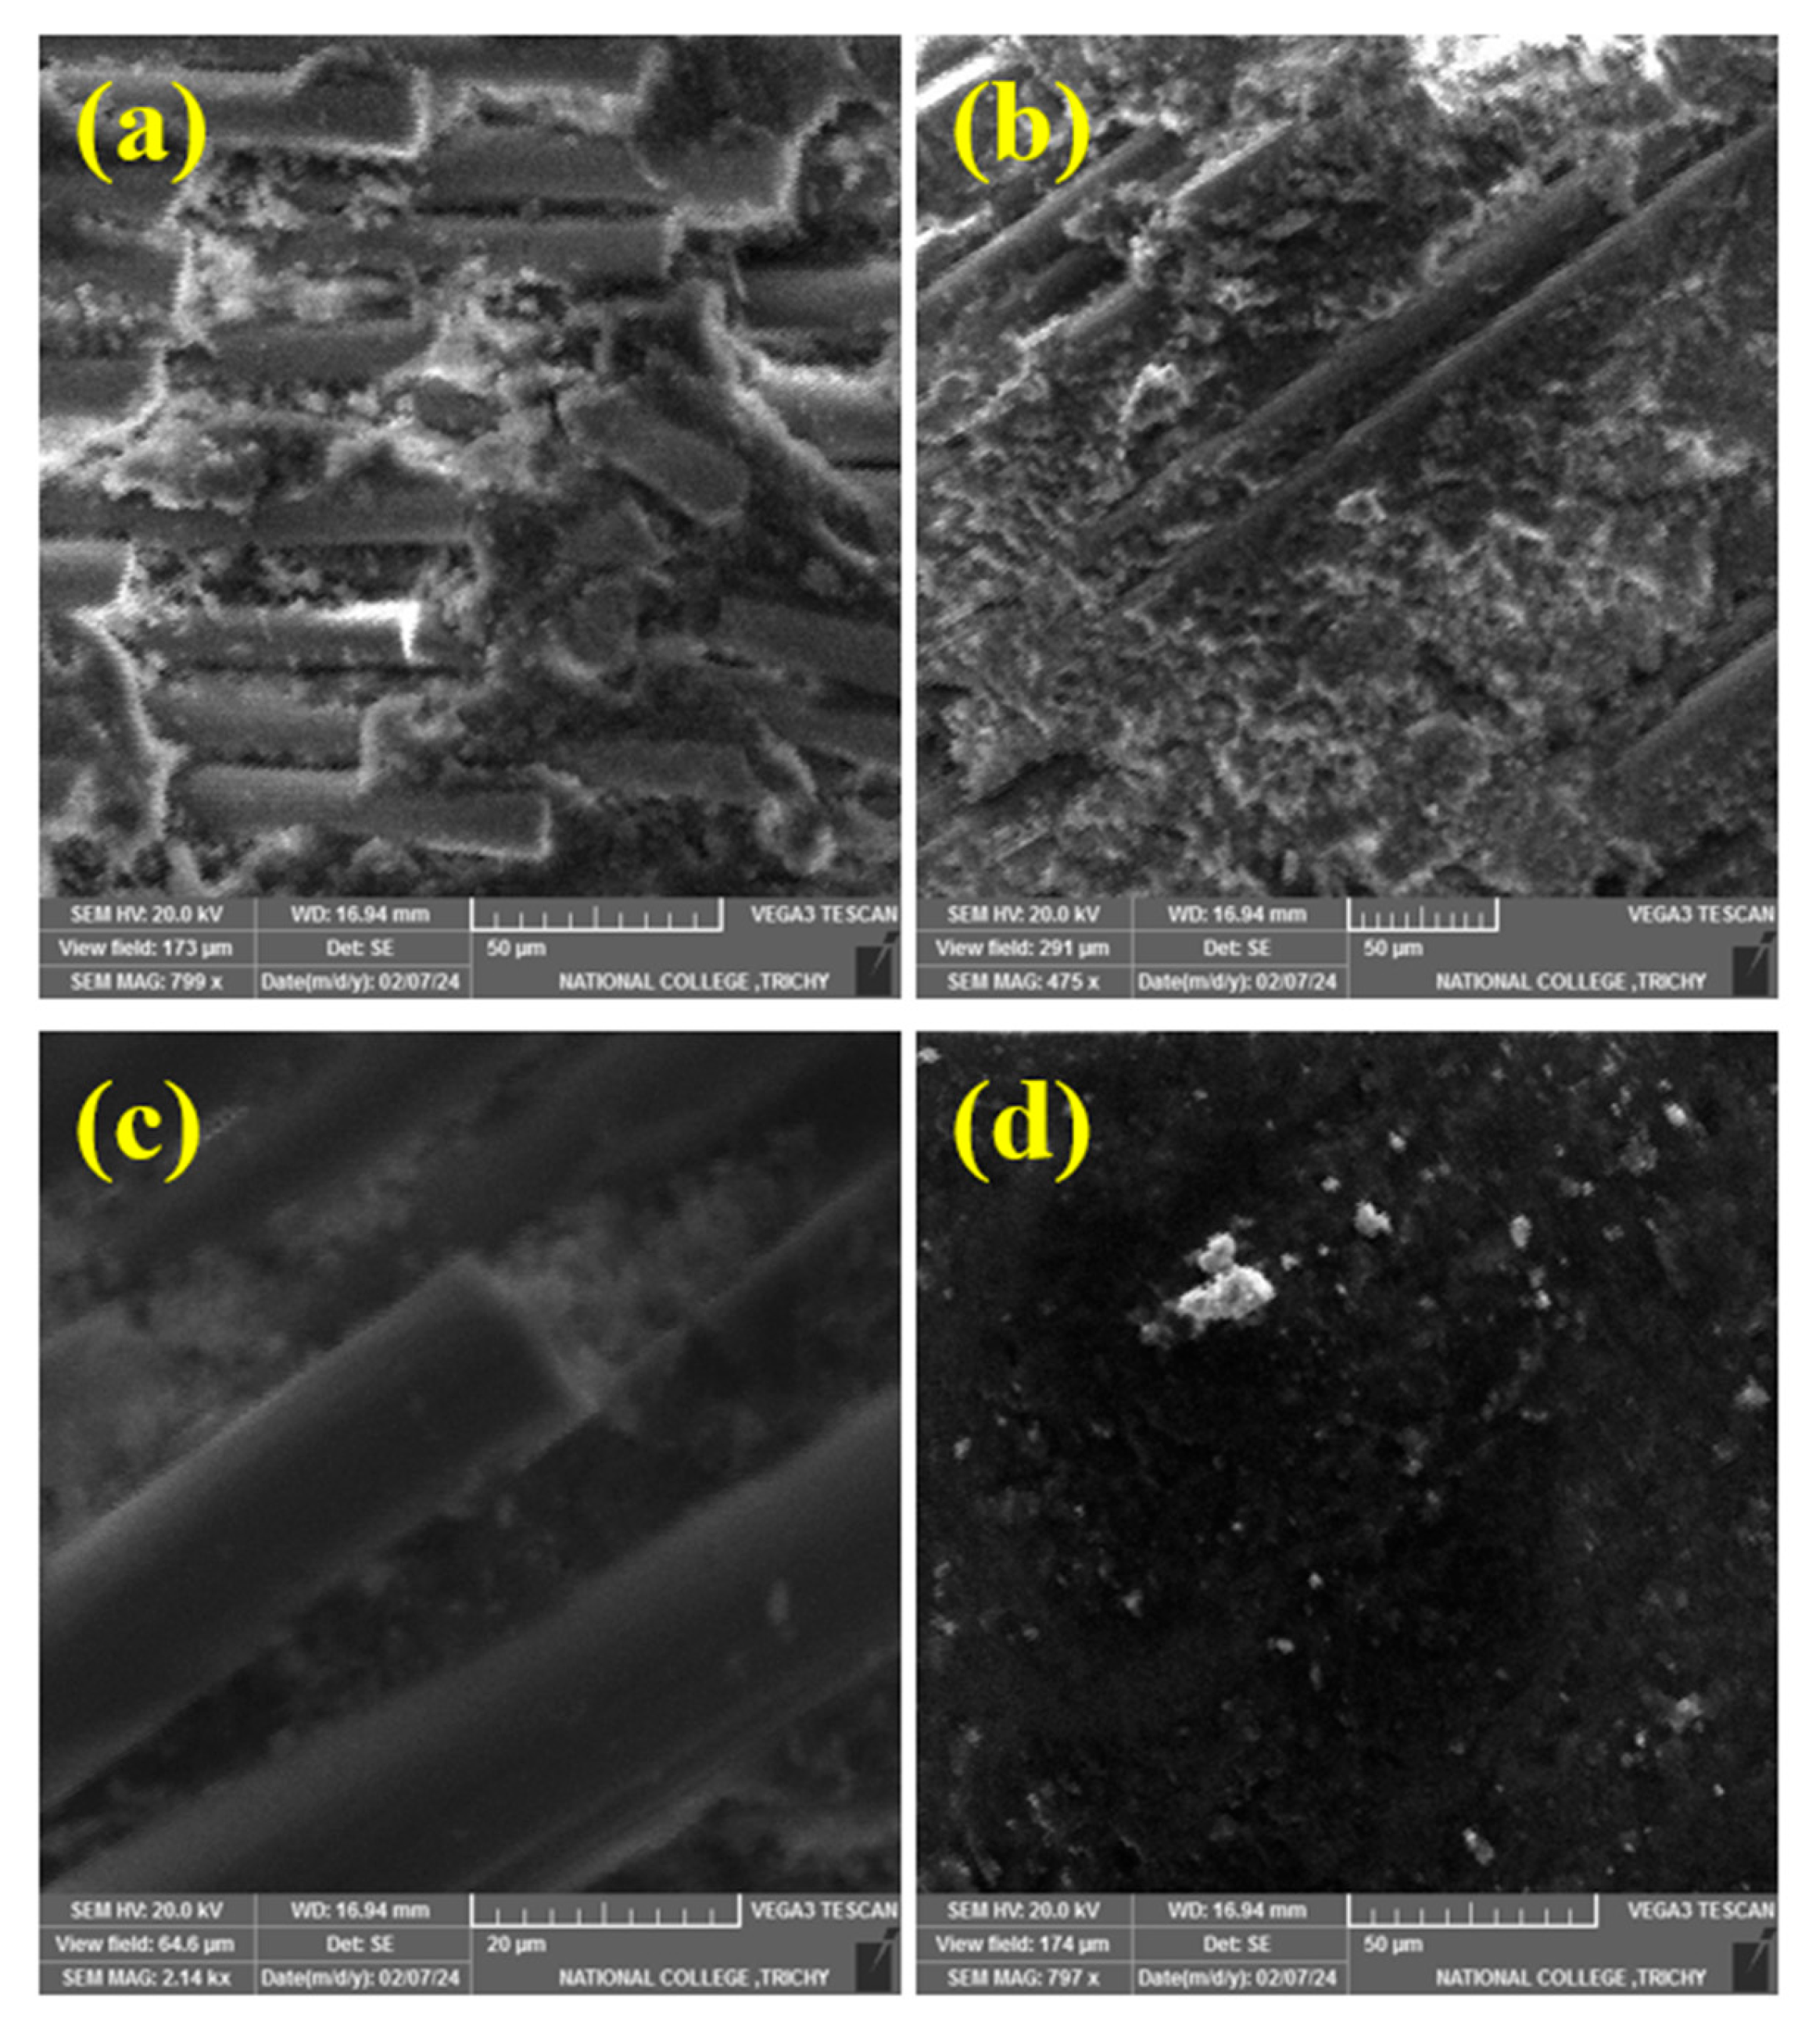
3.1. SEM Analysis
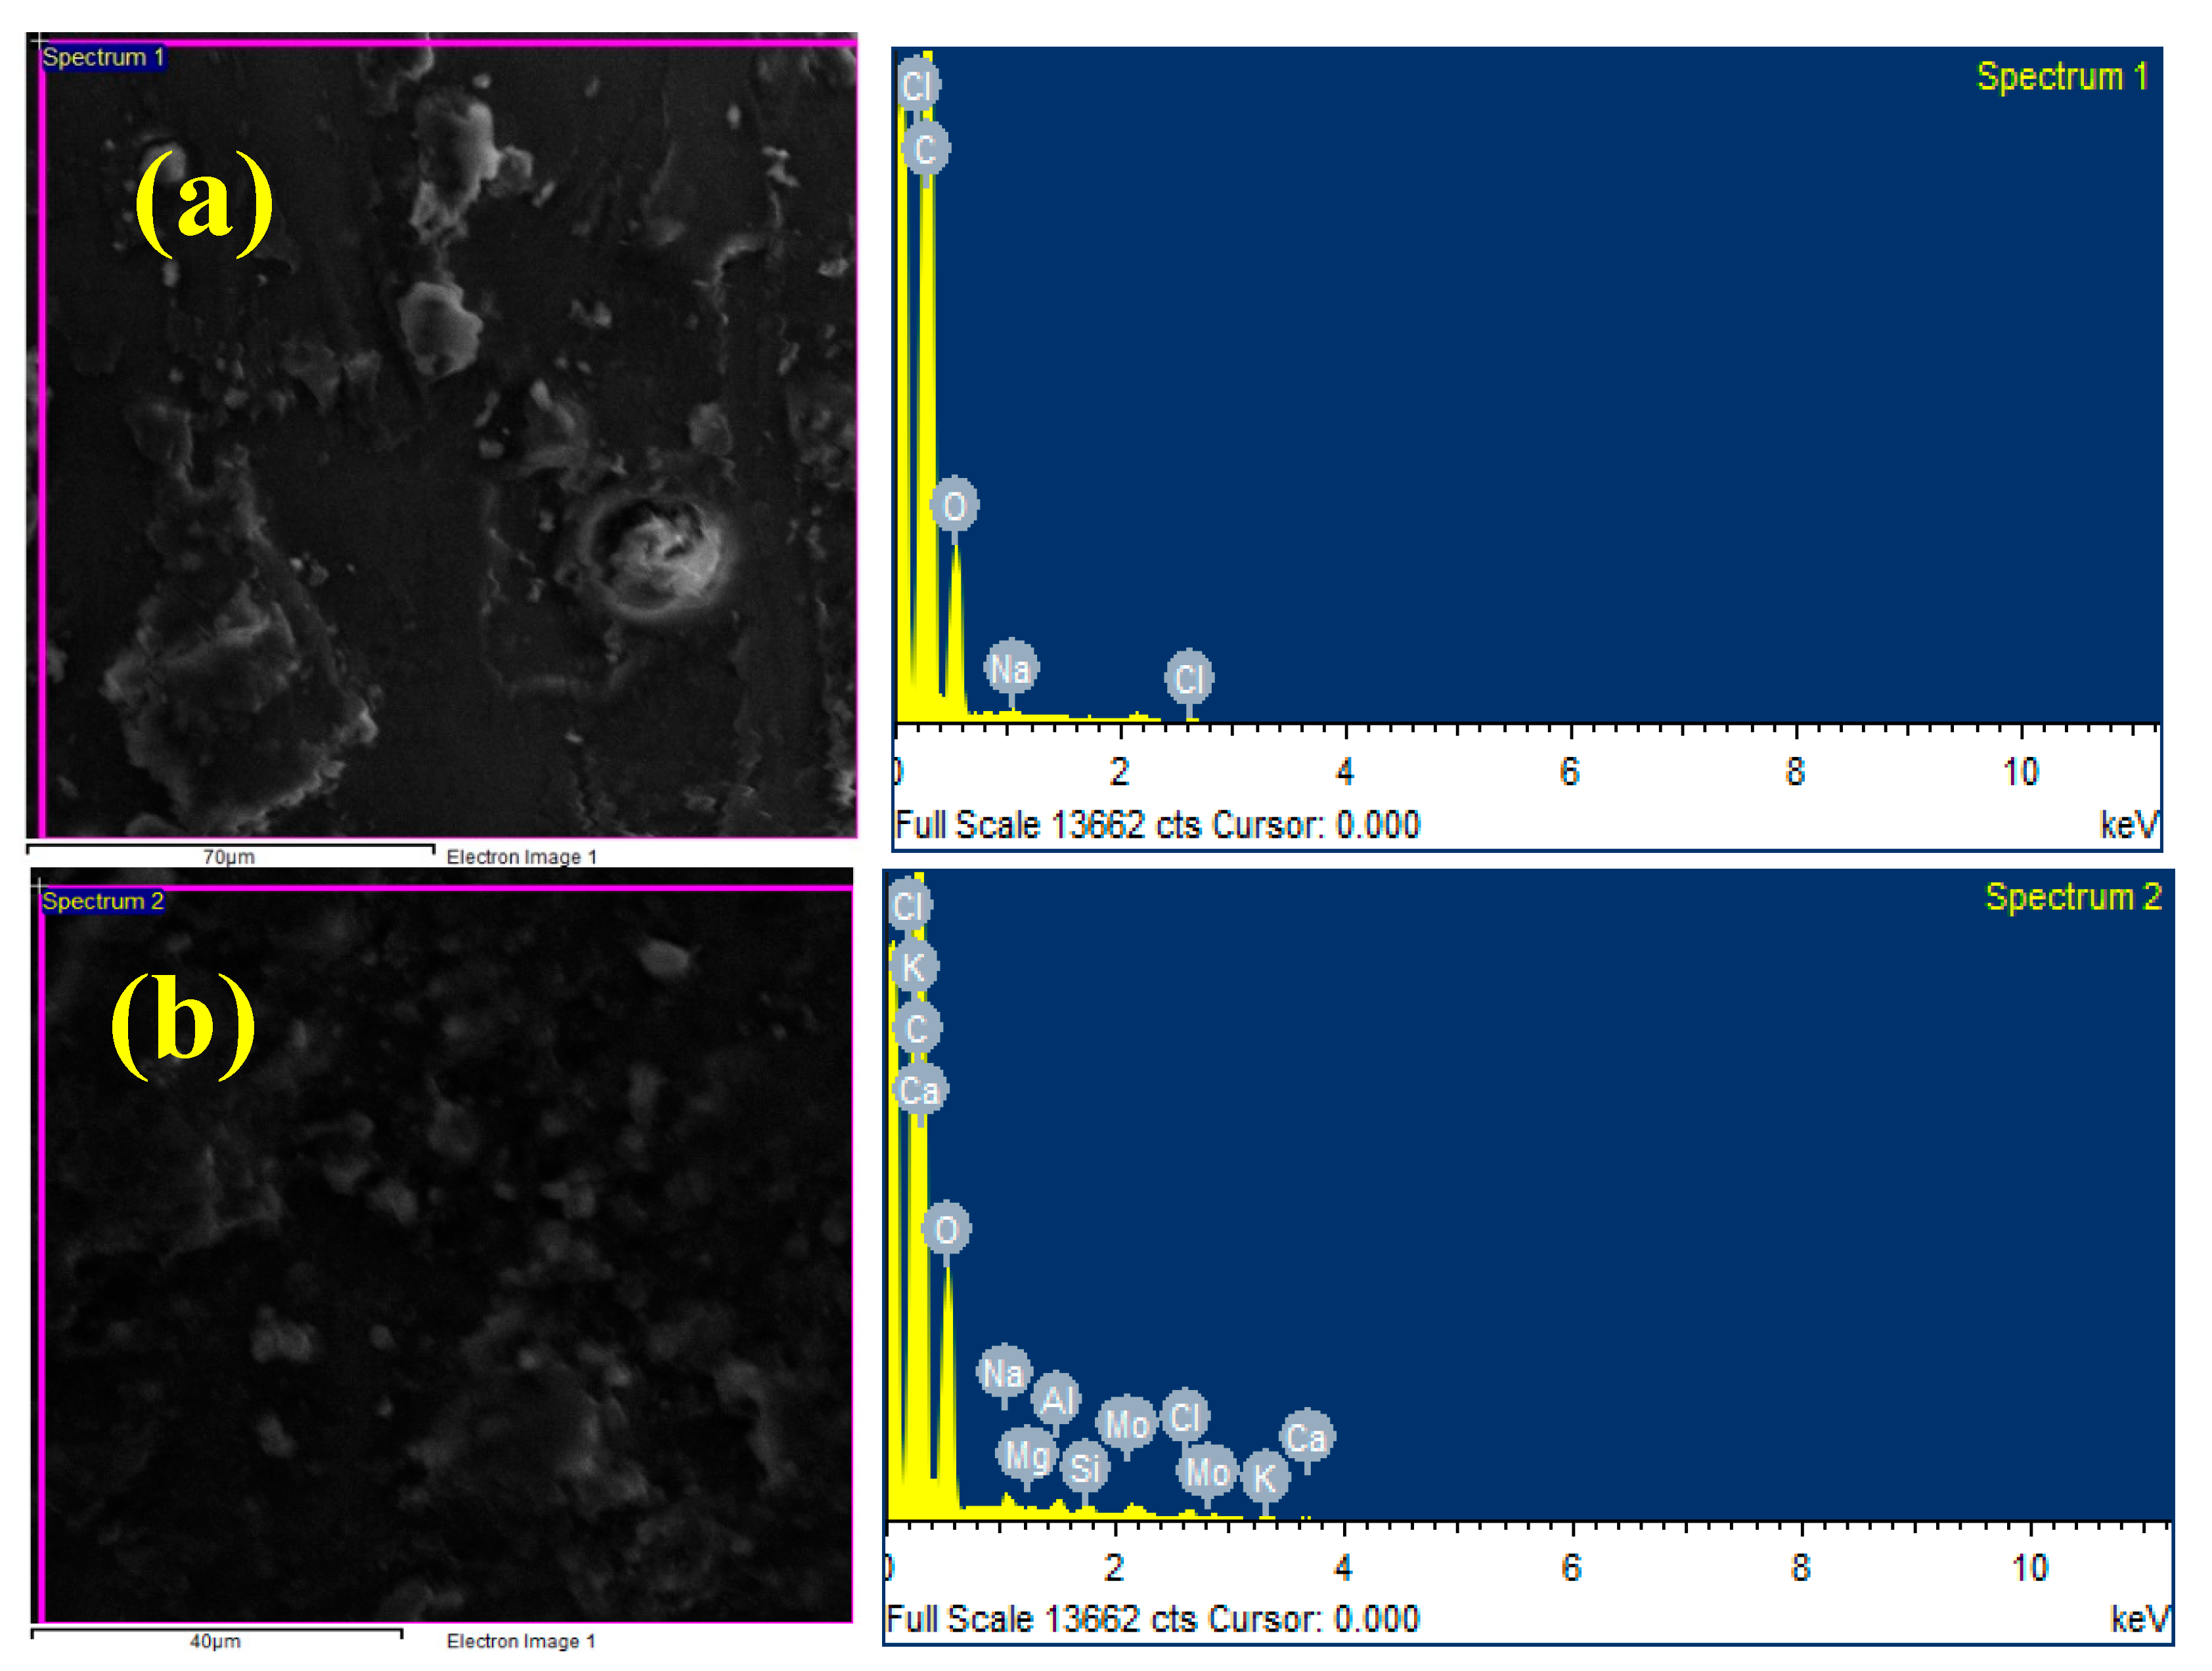
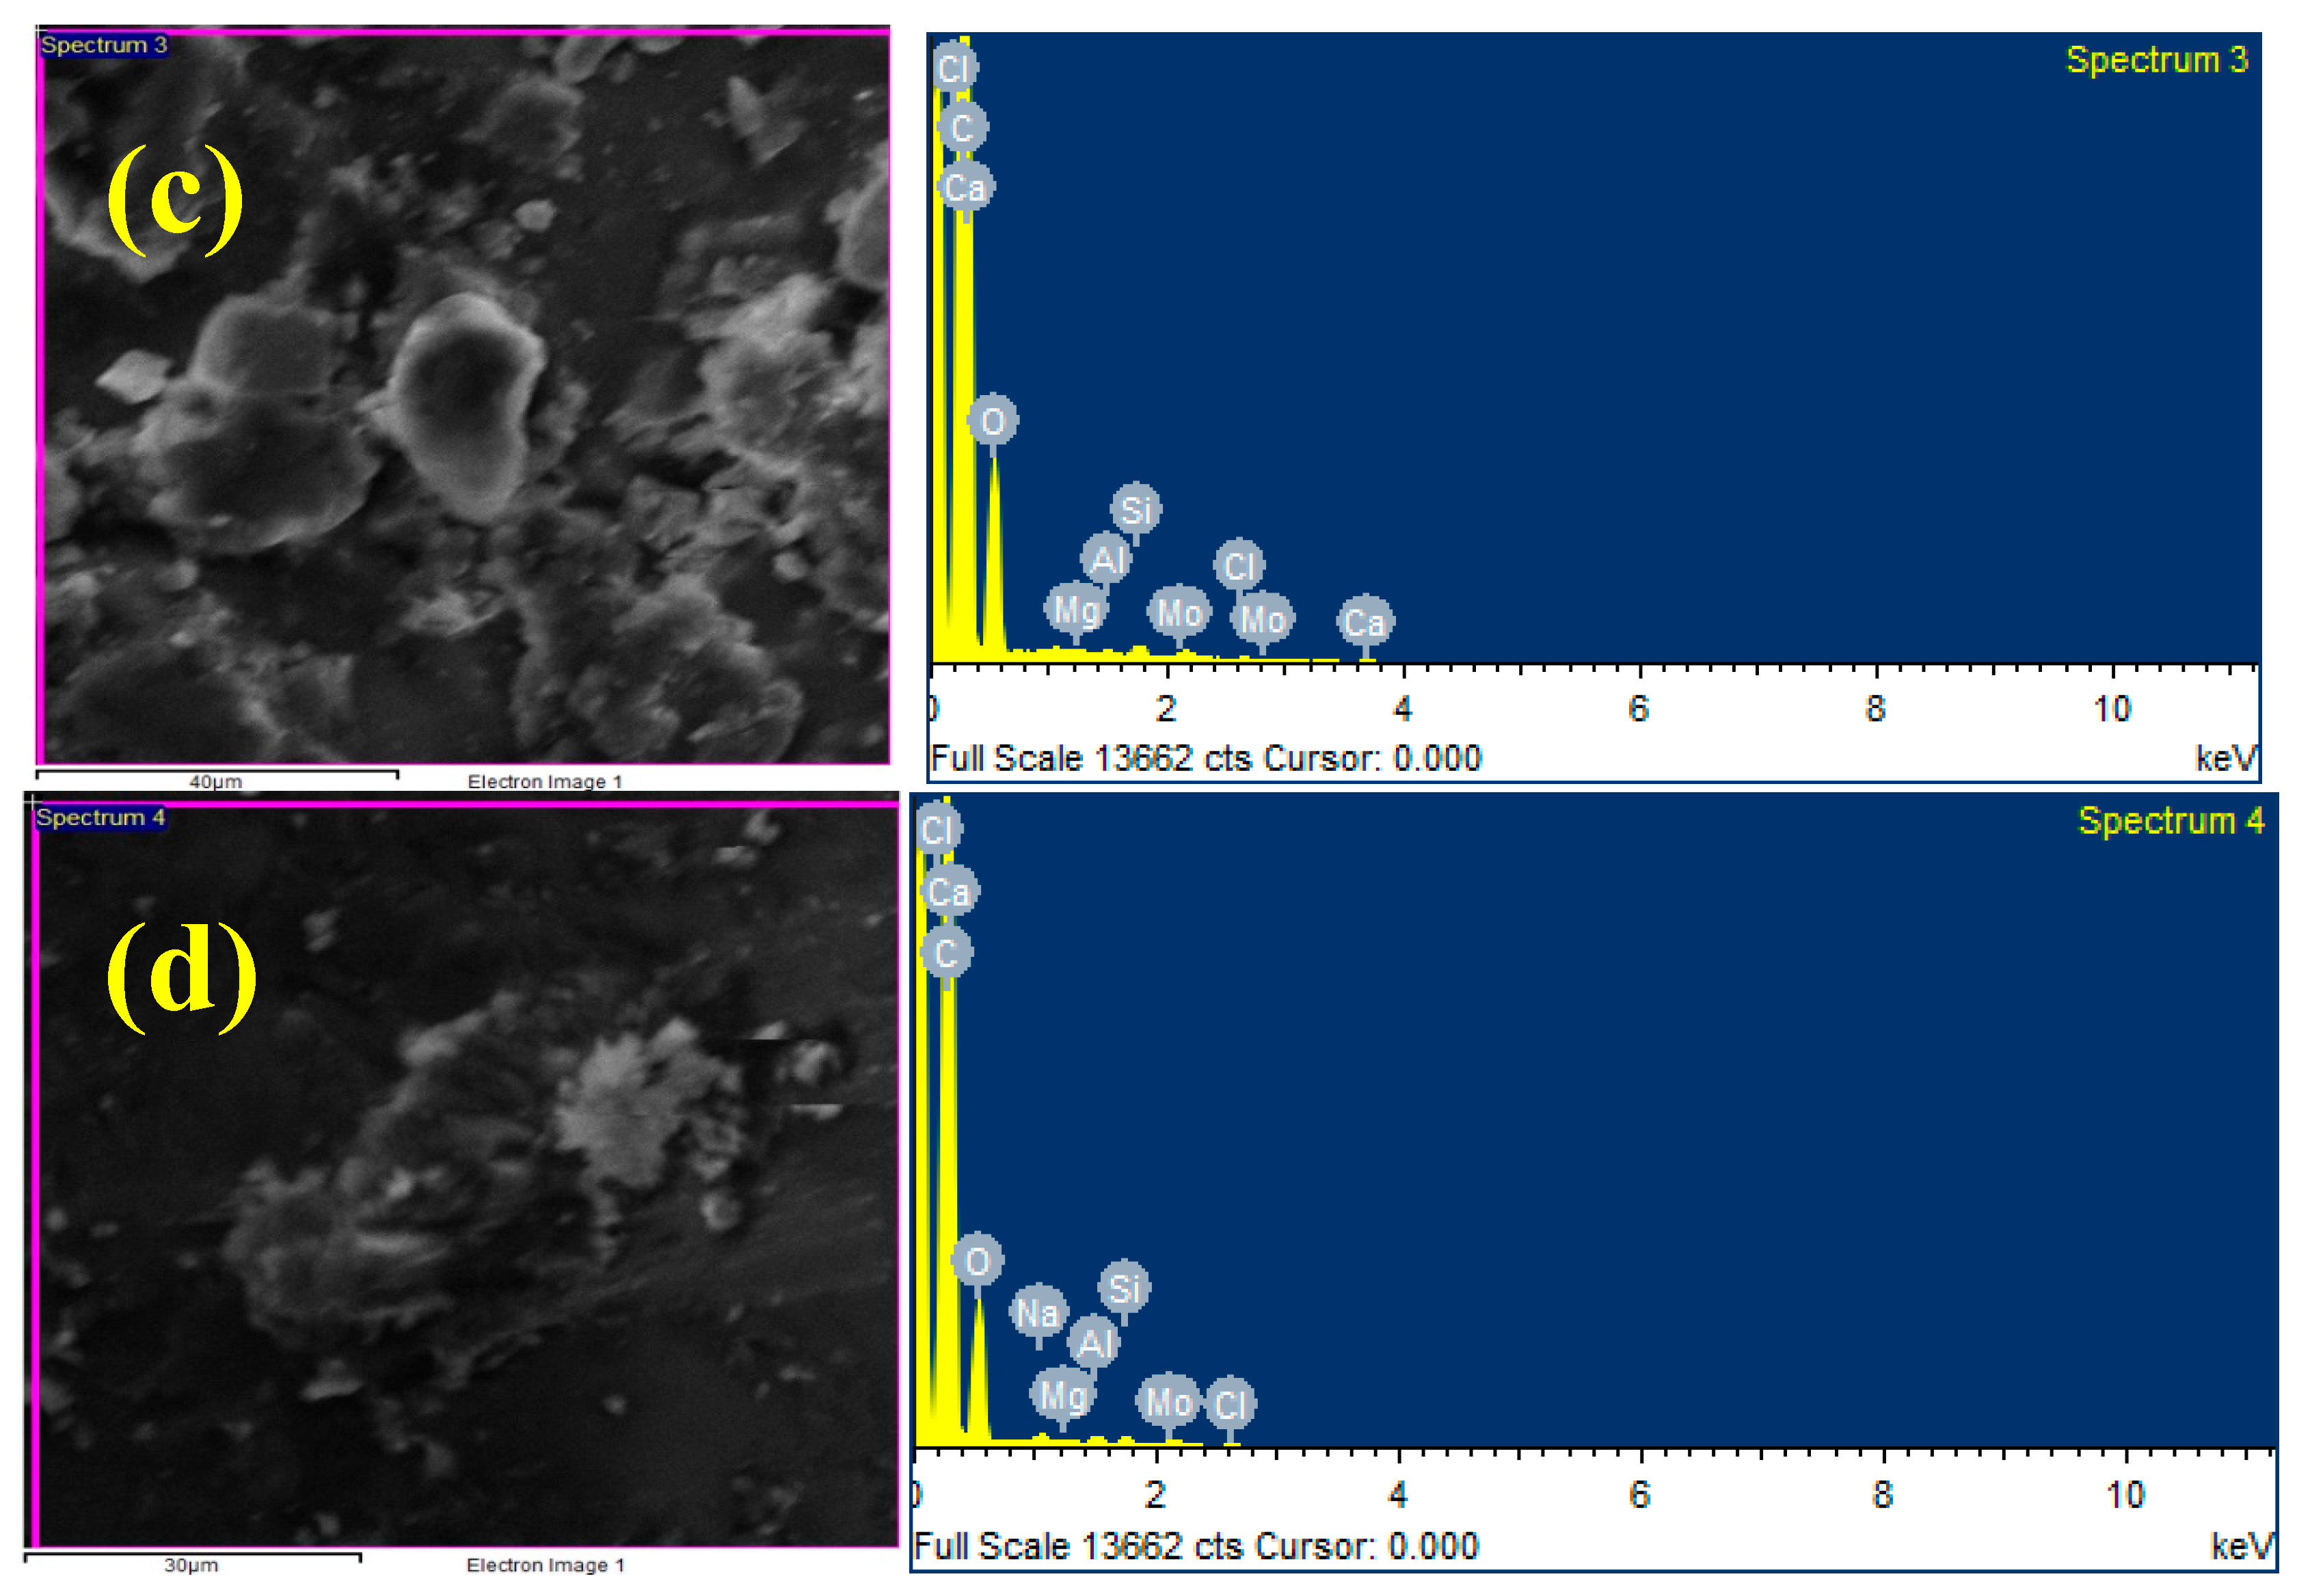
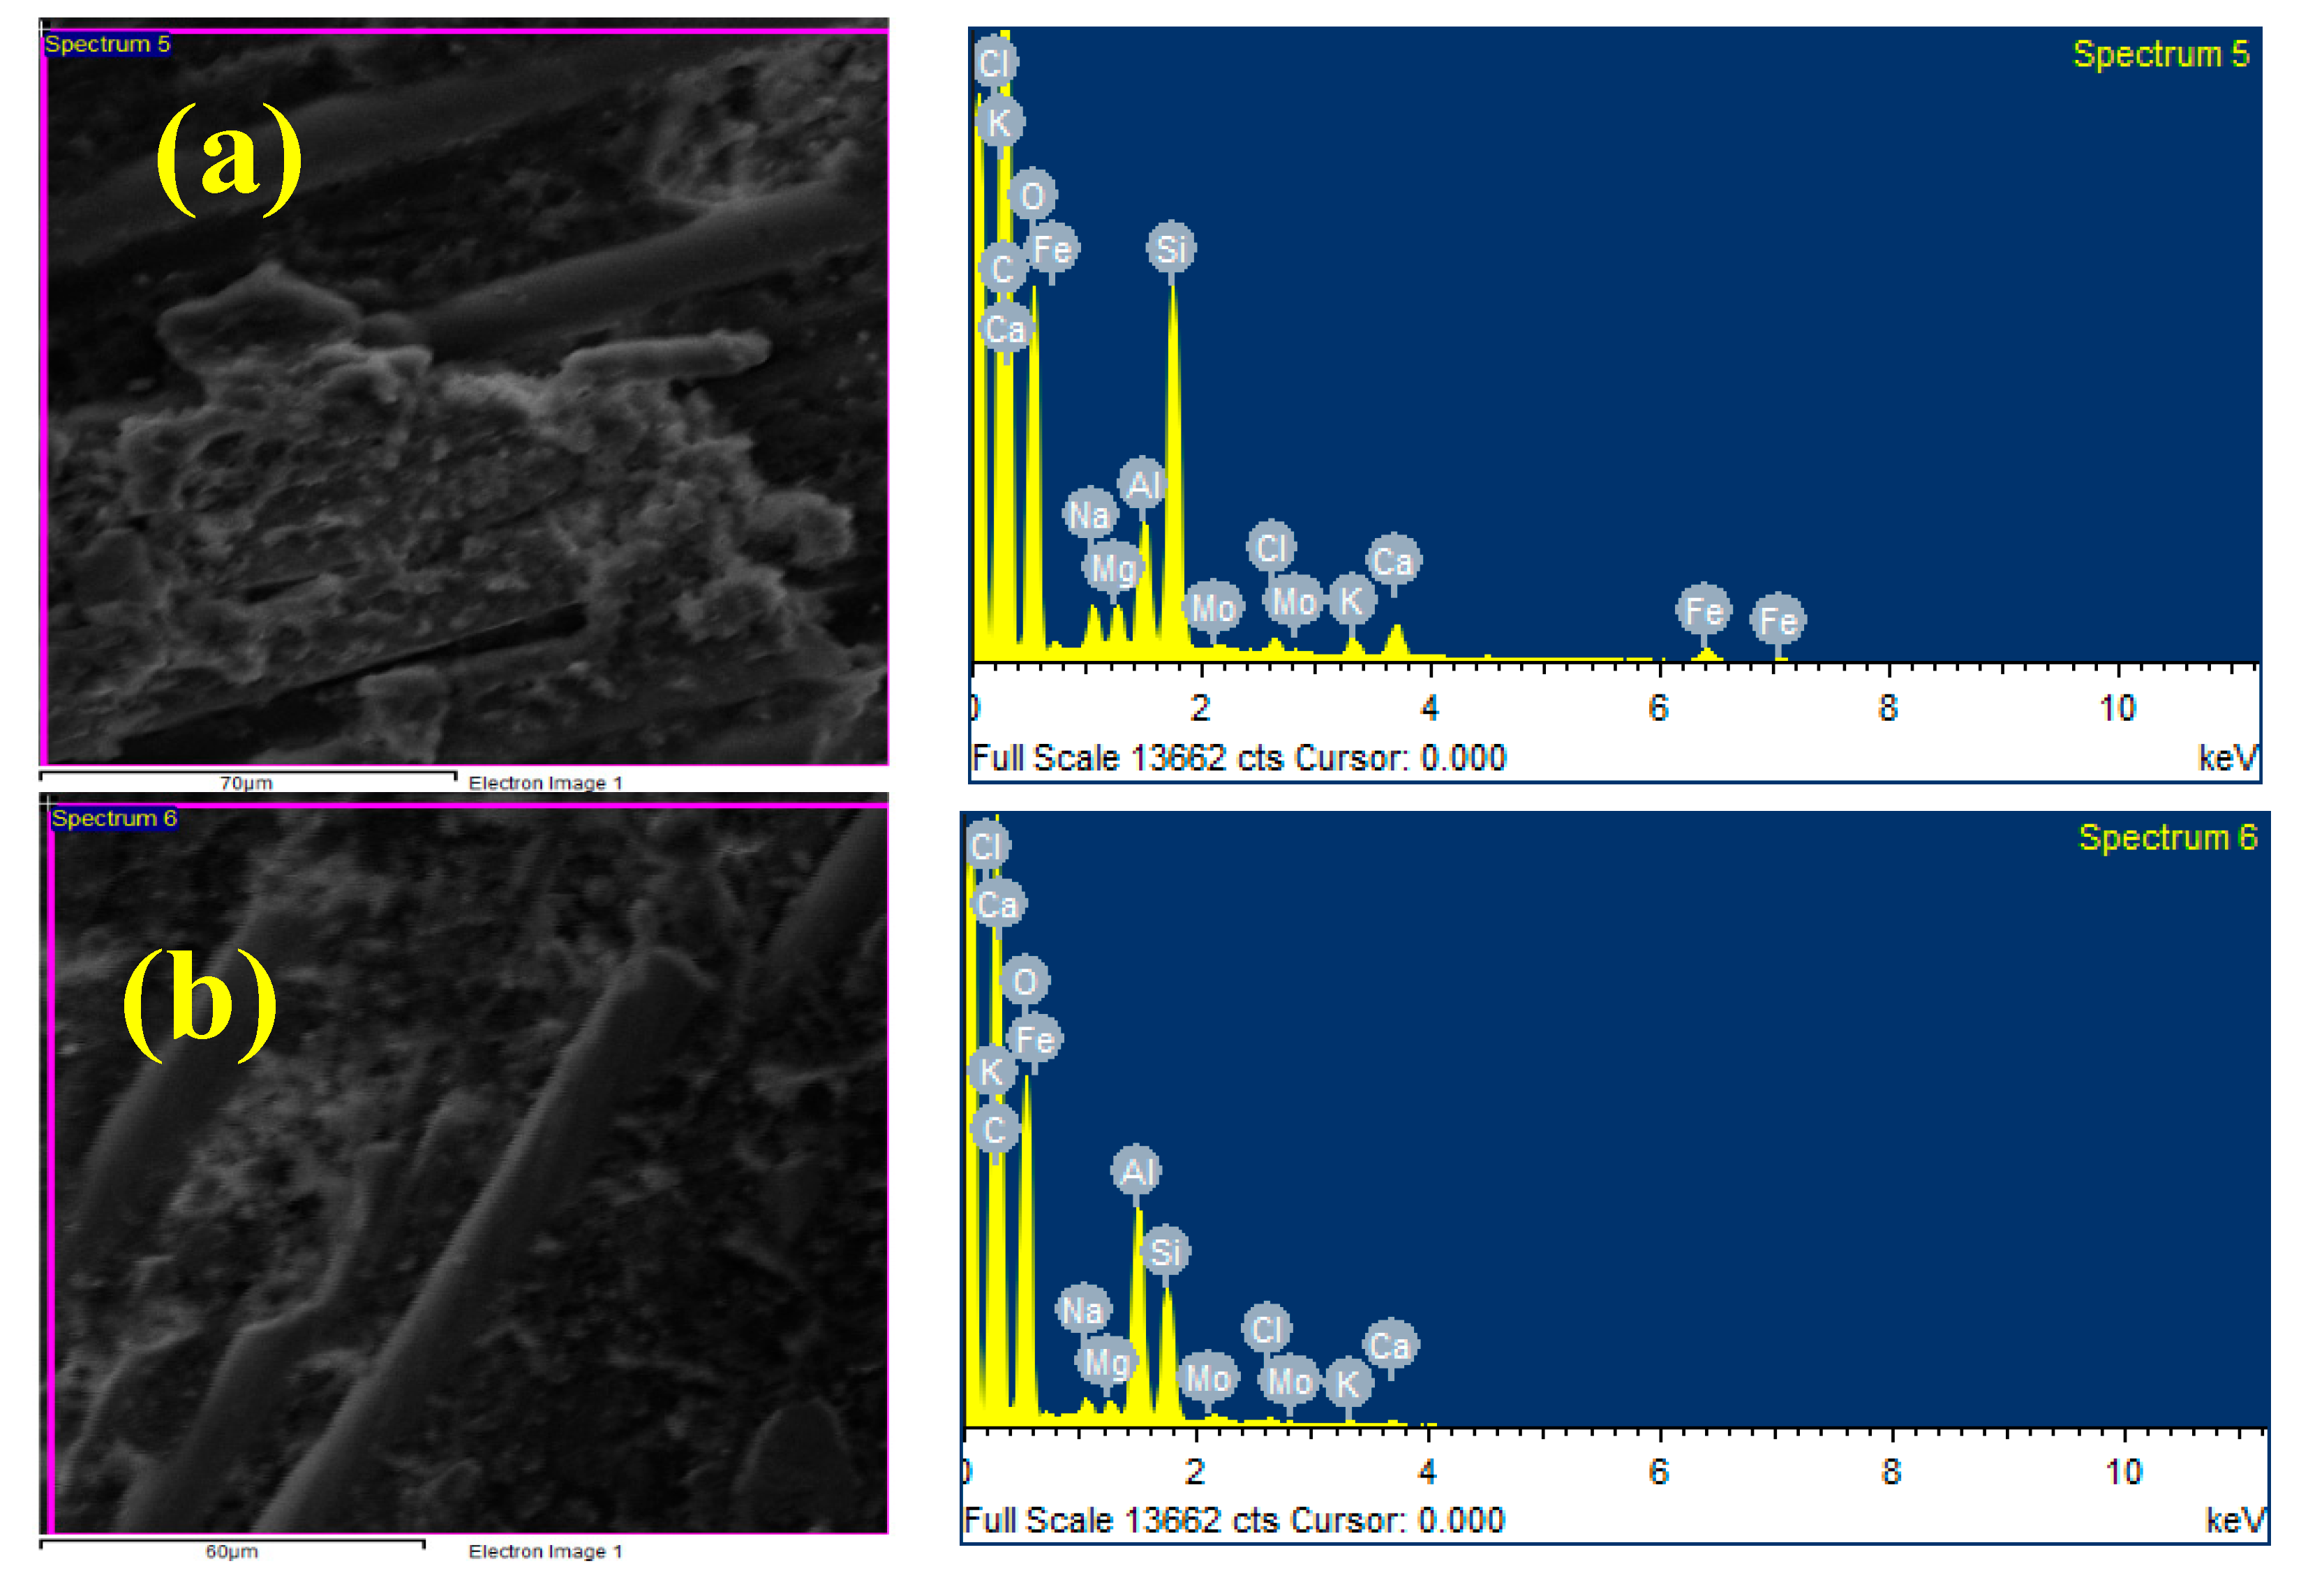
3.2. EDAX Analysis
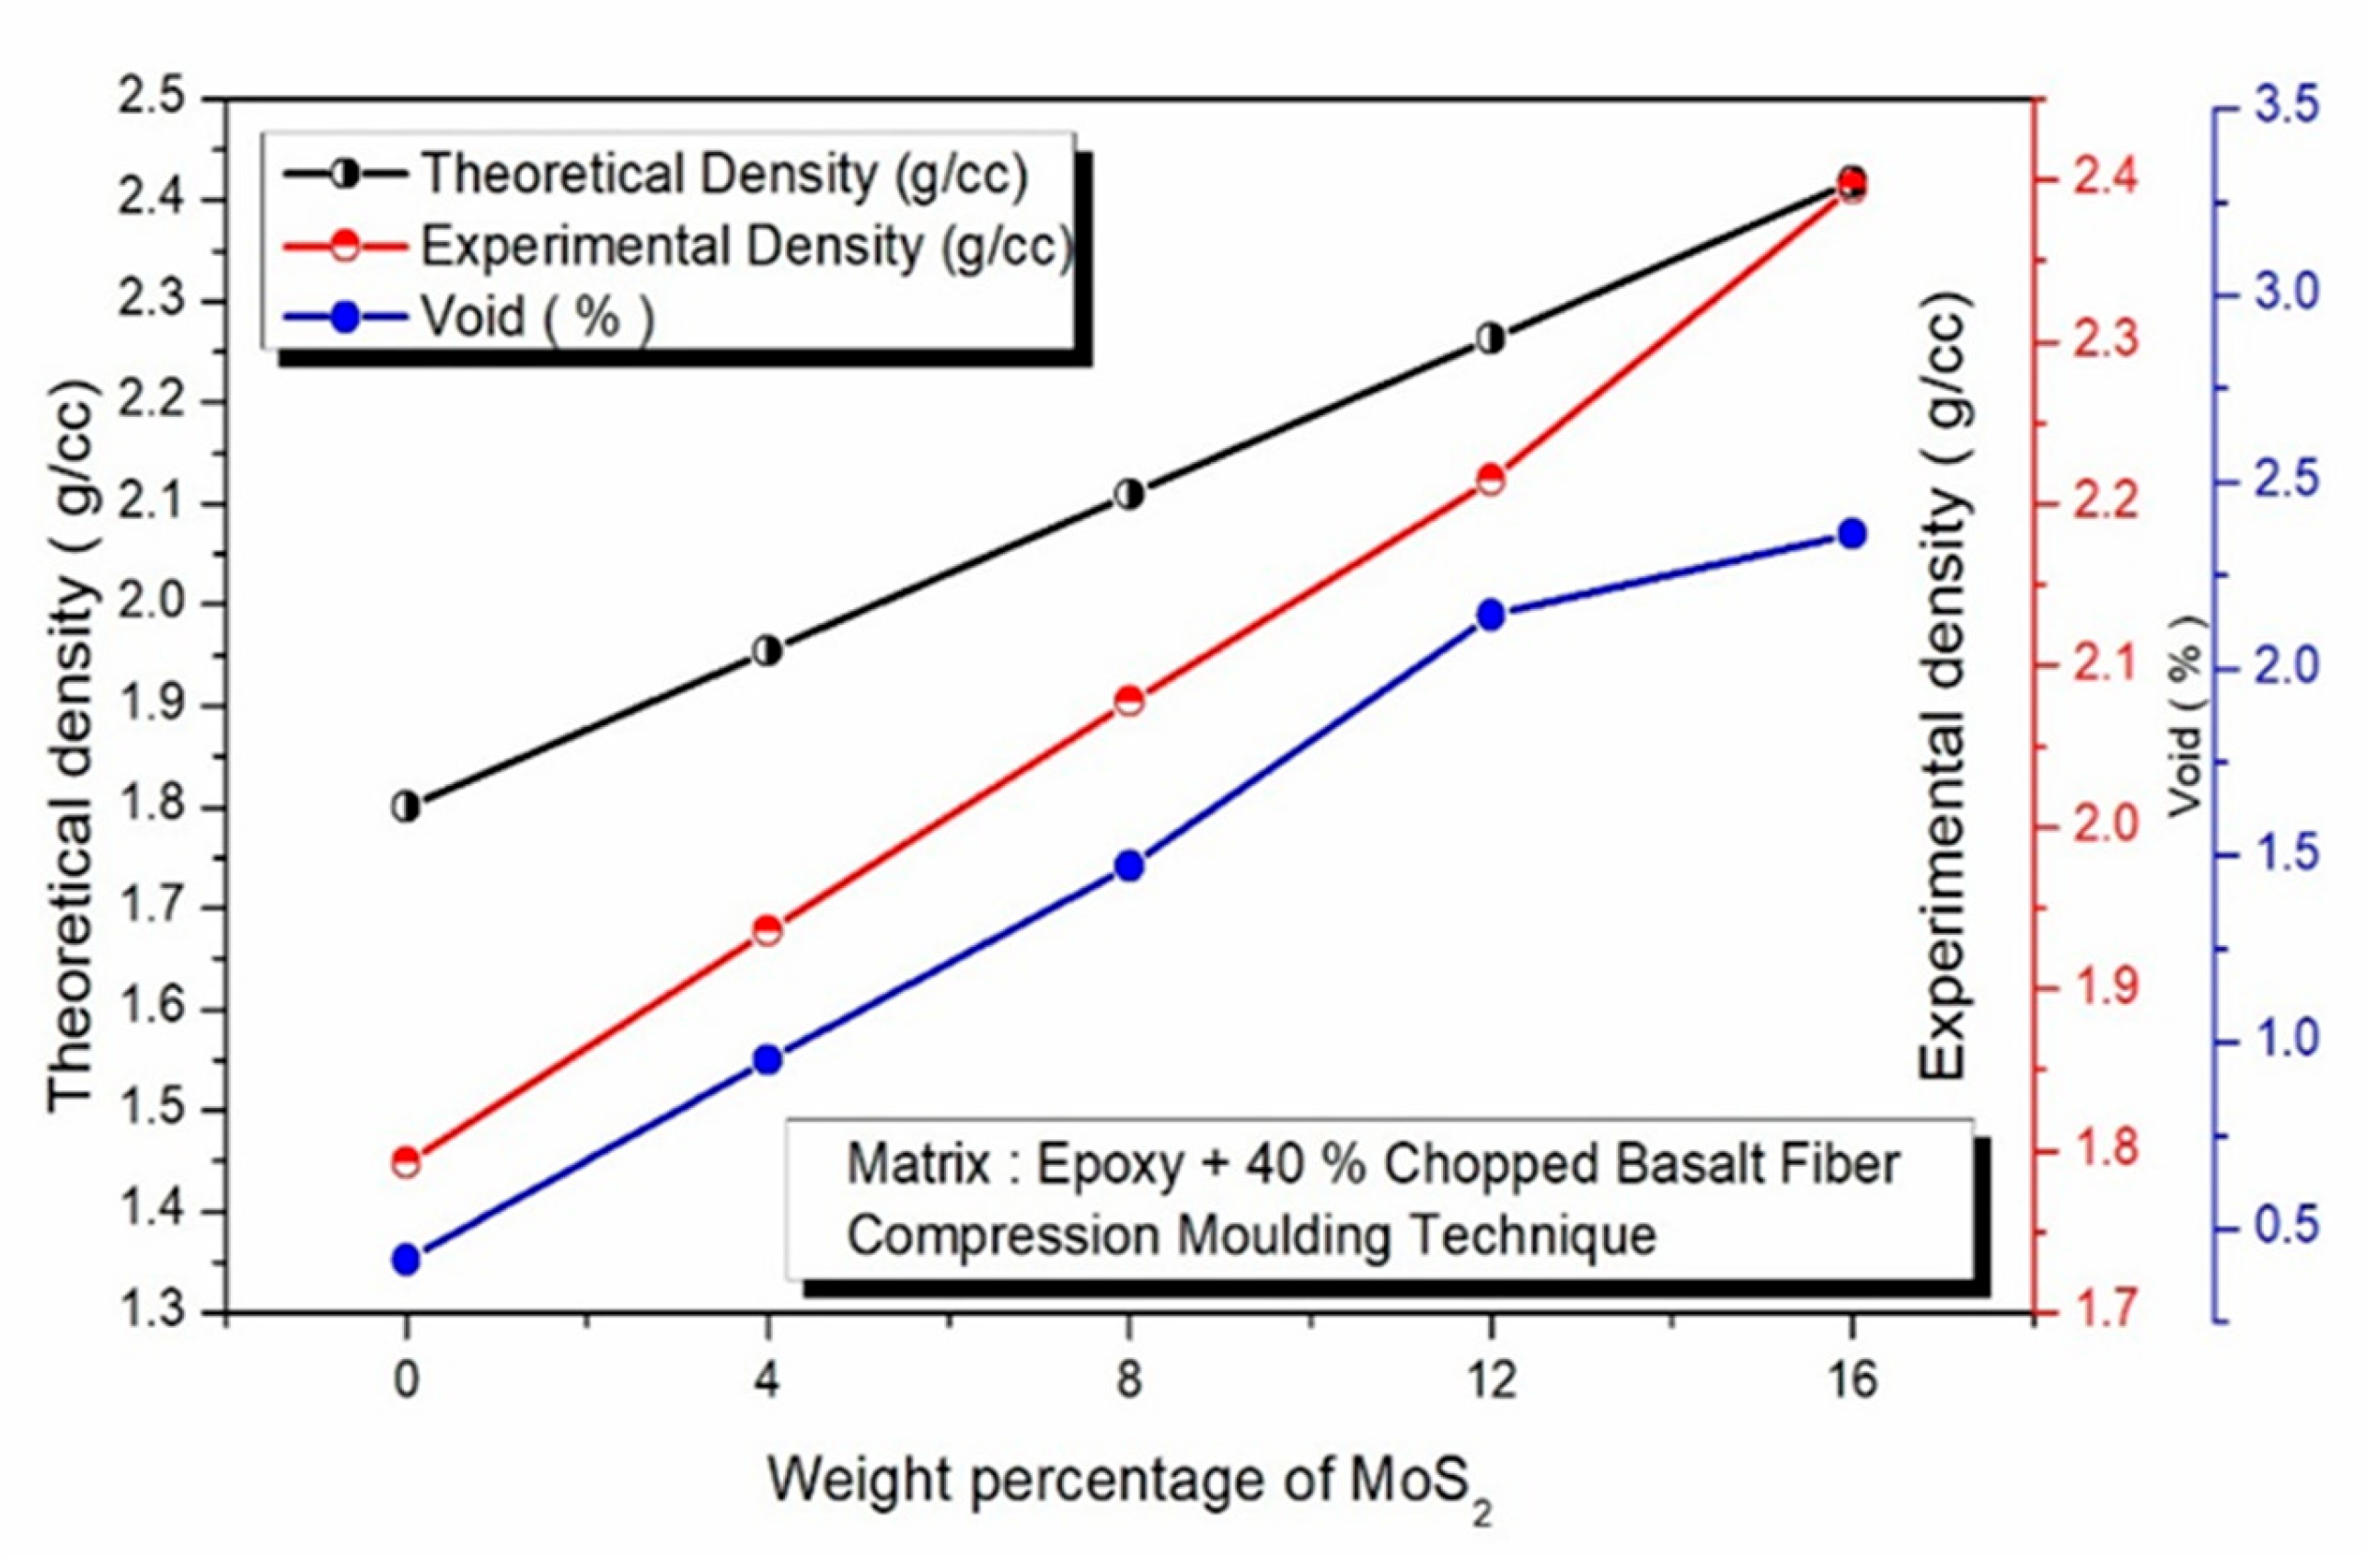
3.3. Physical Properties
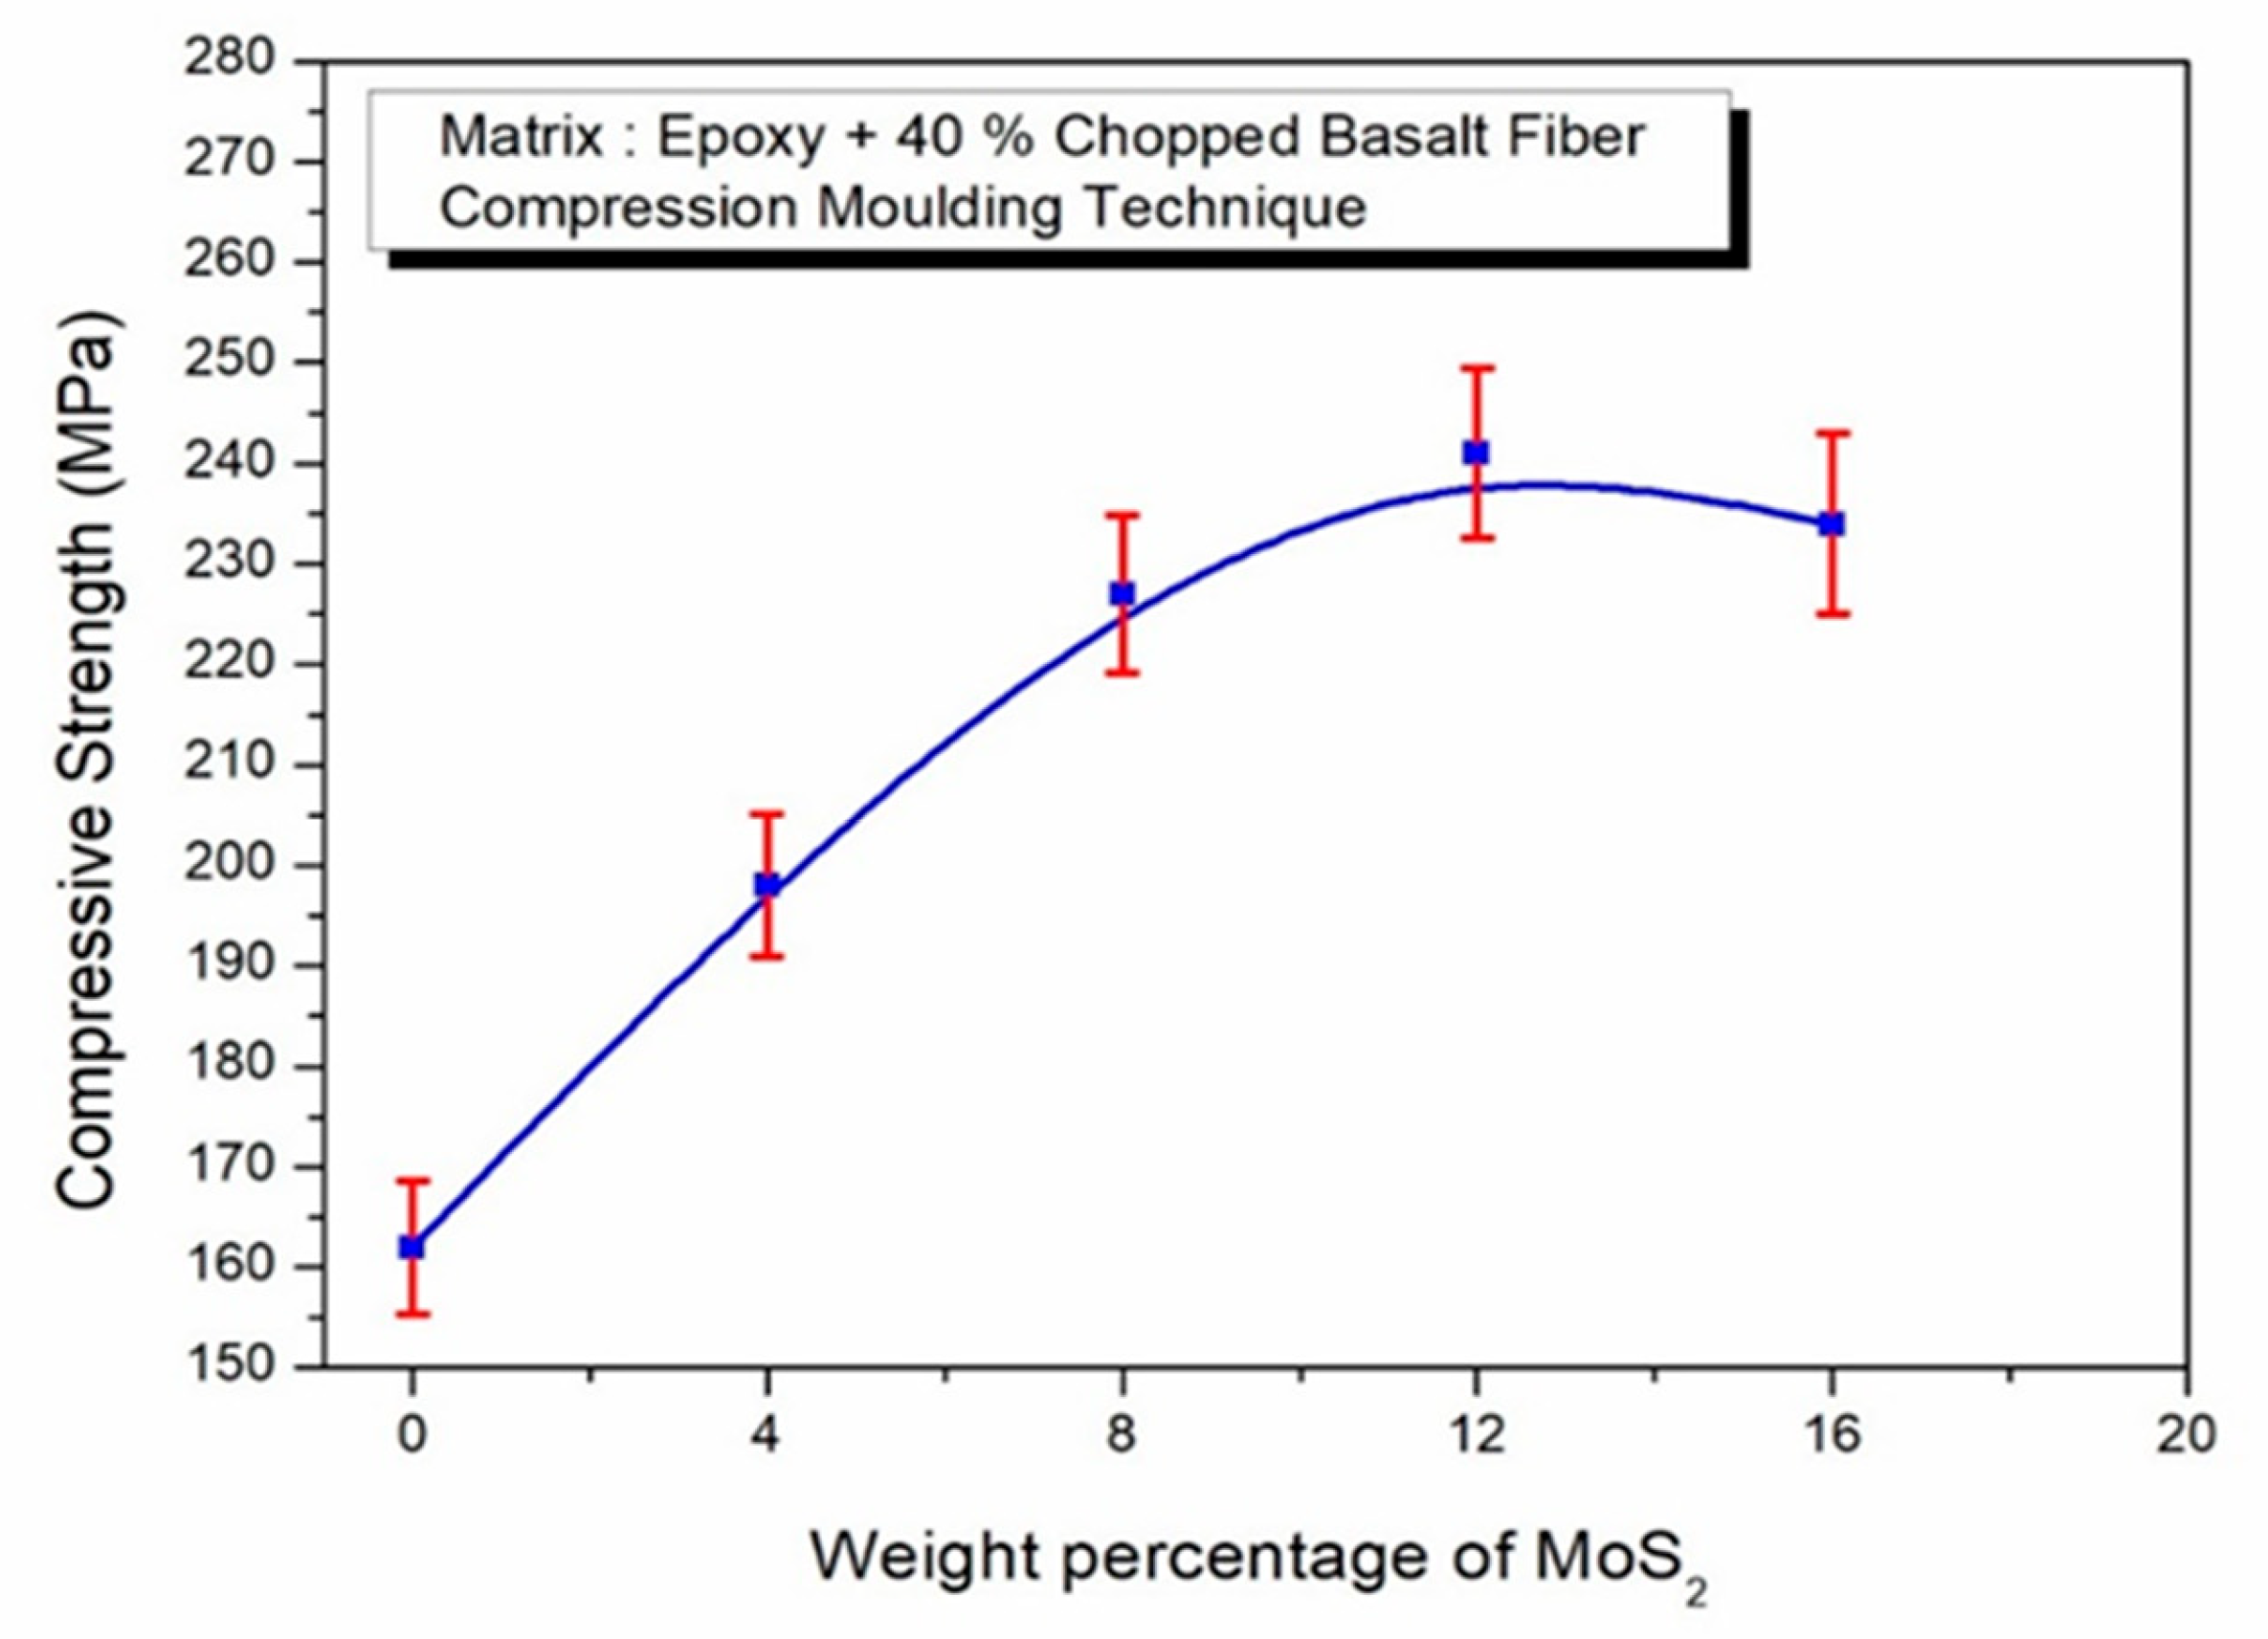
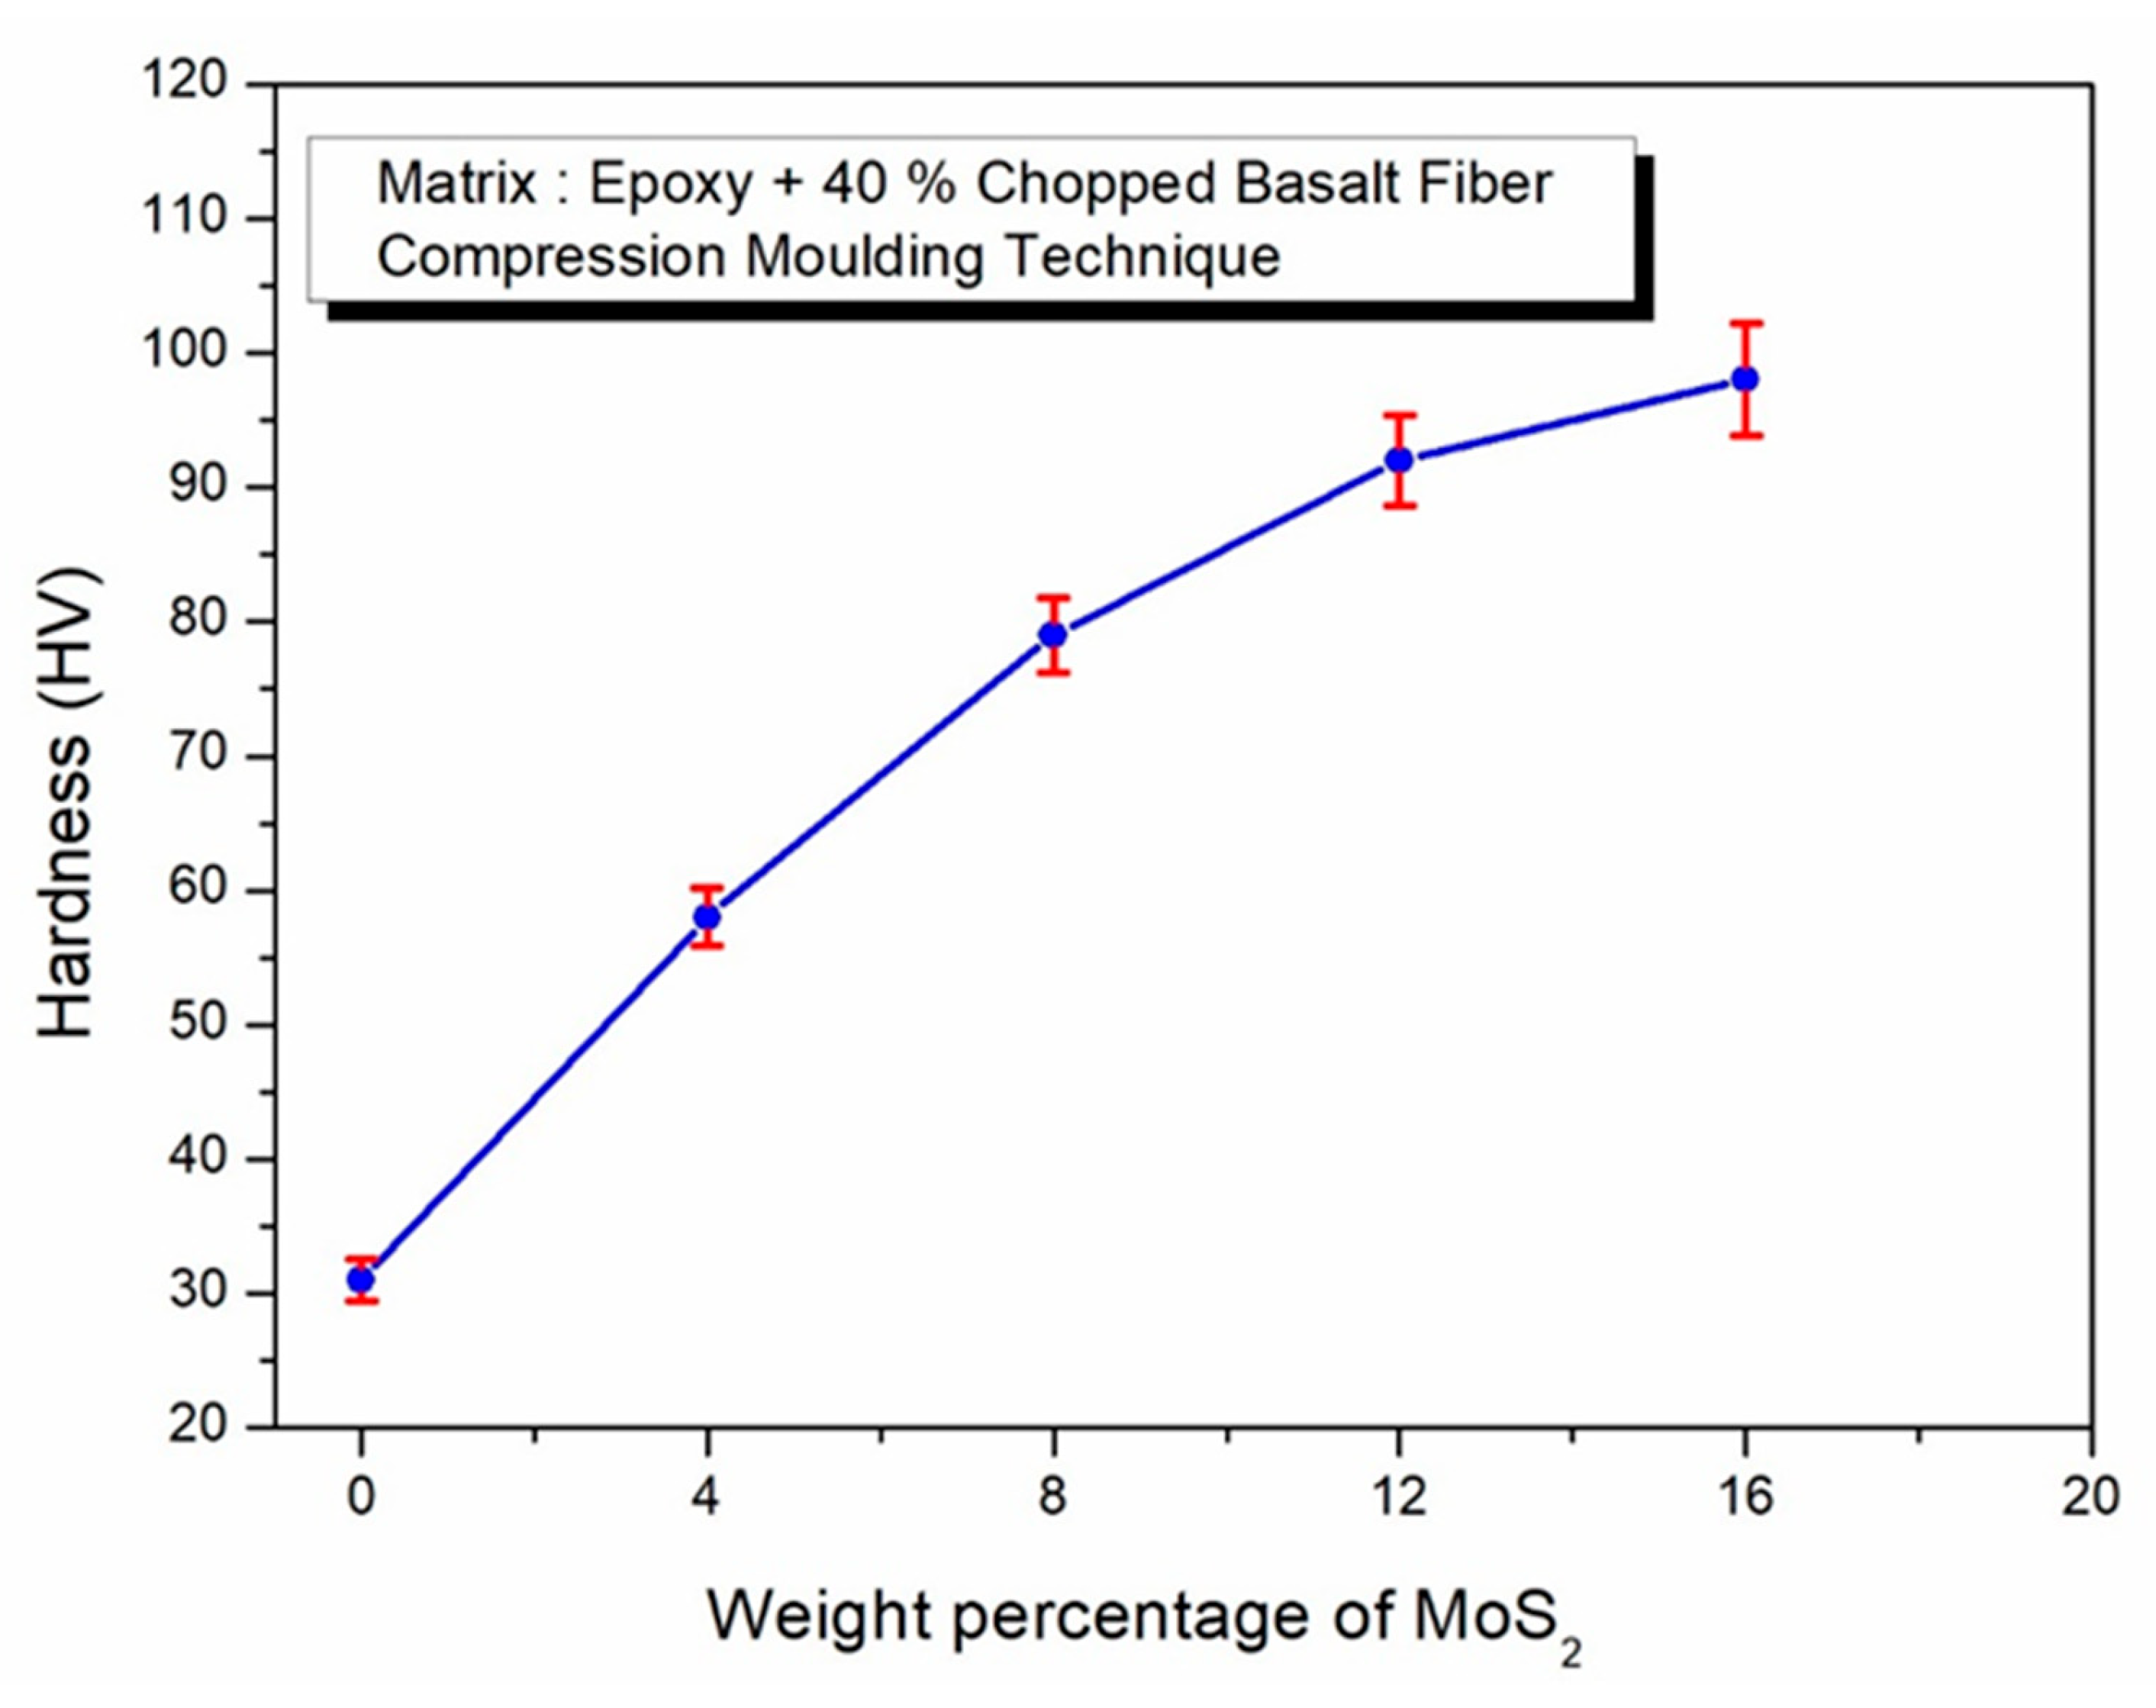
3.4. Mechanical Properties
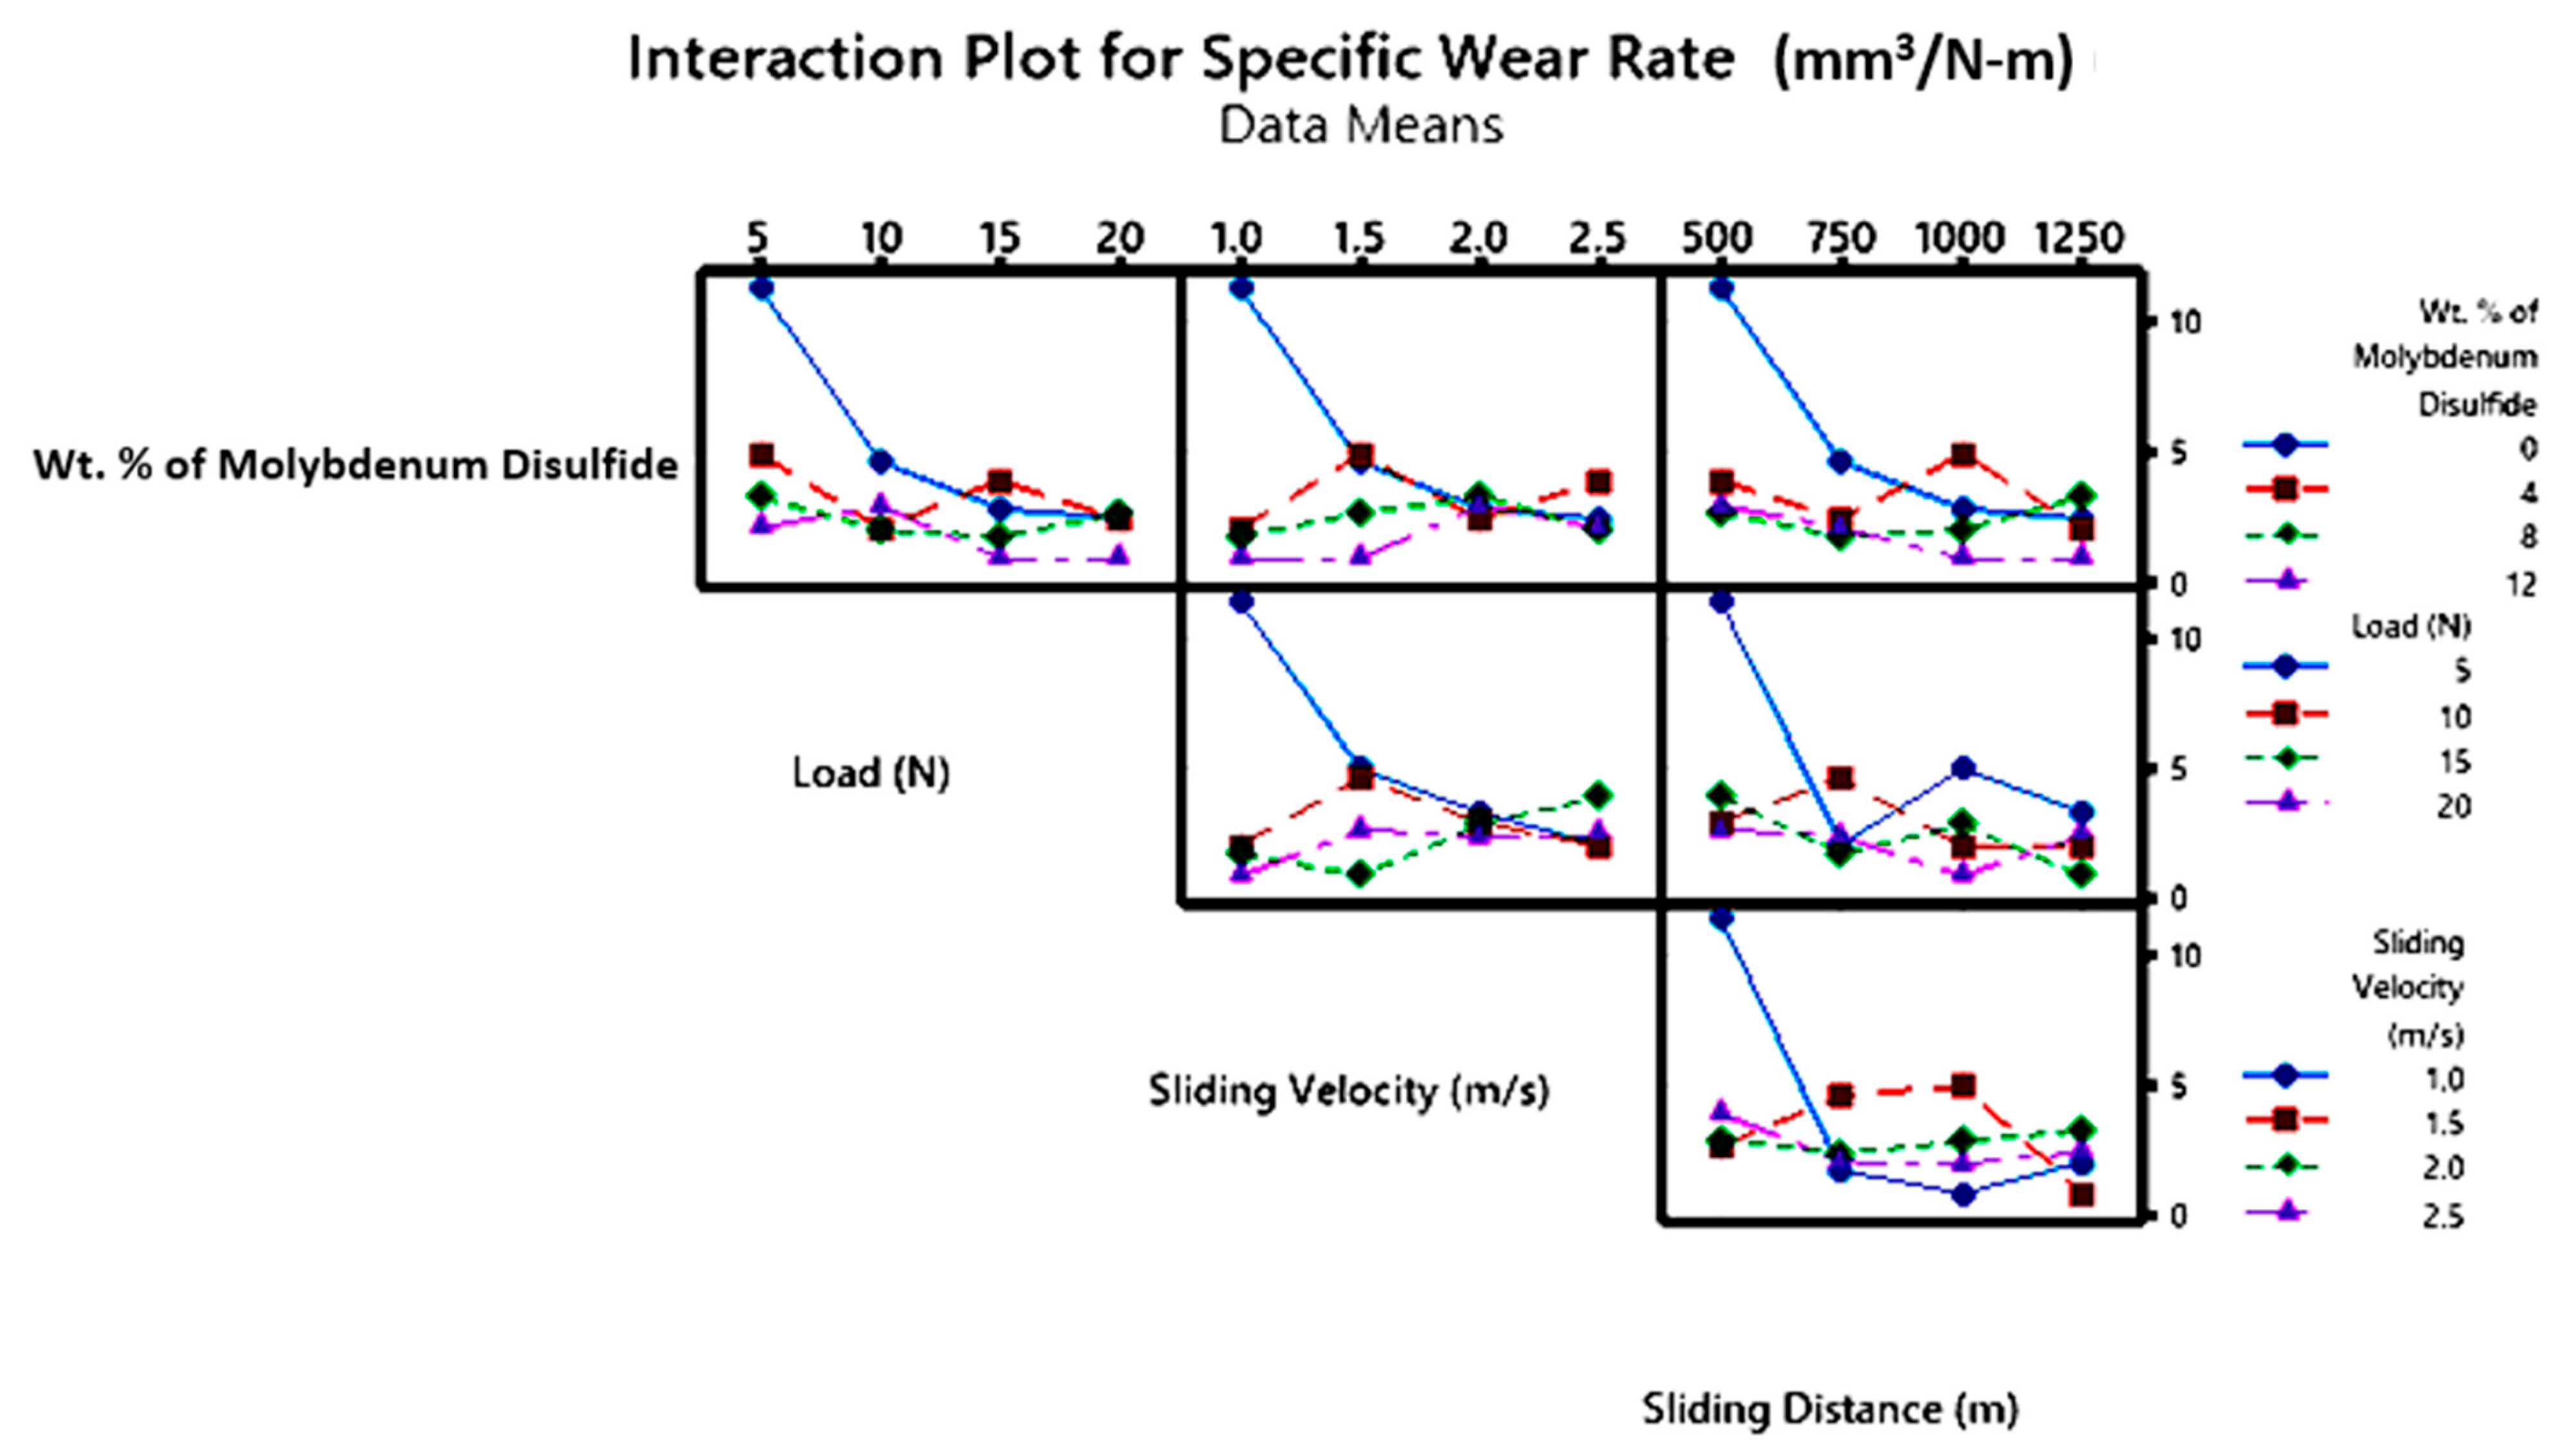
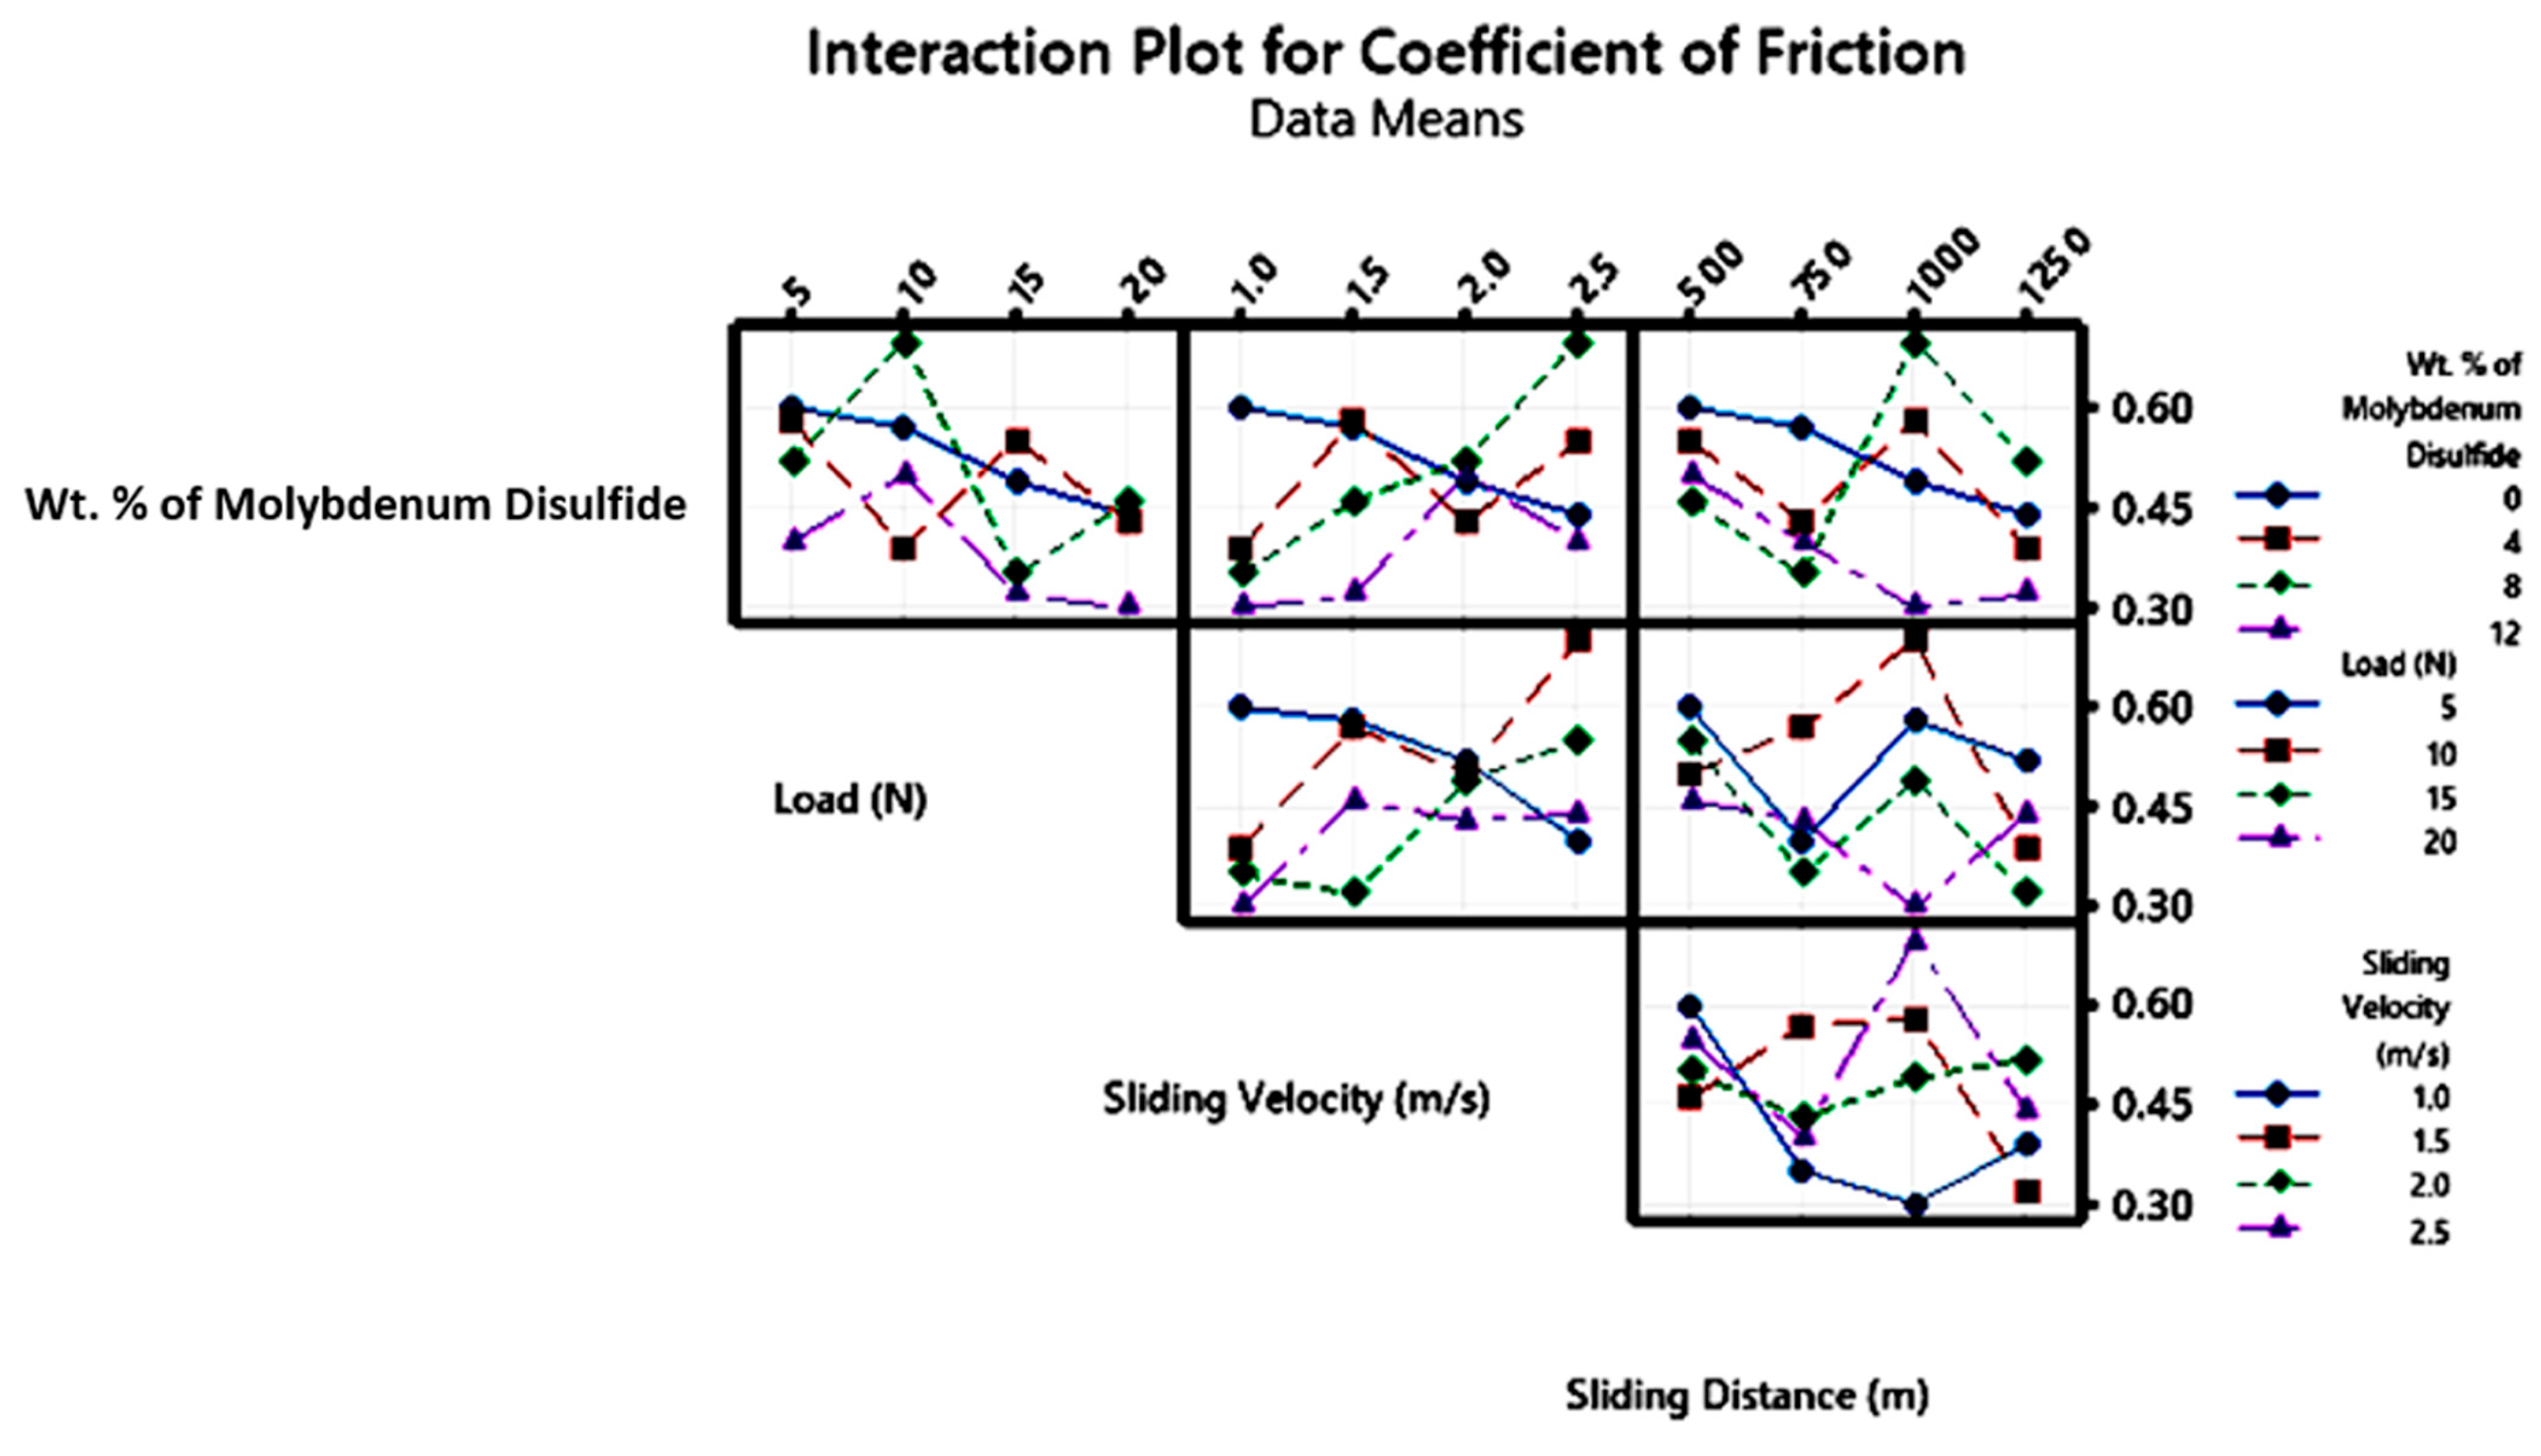
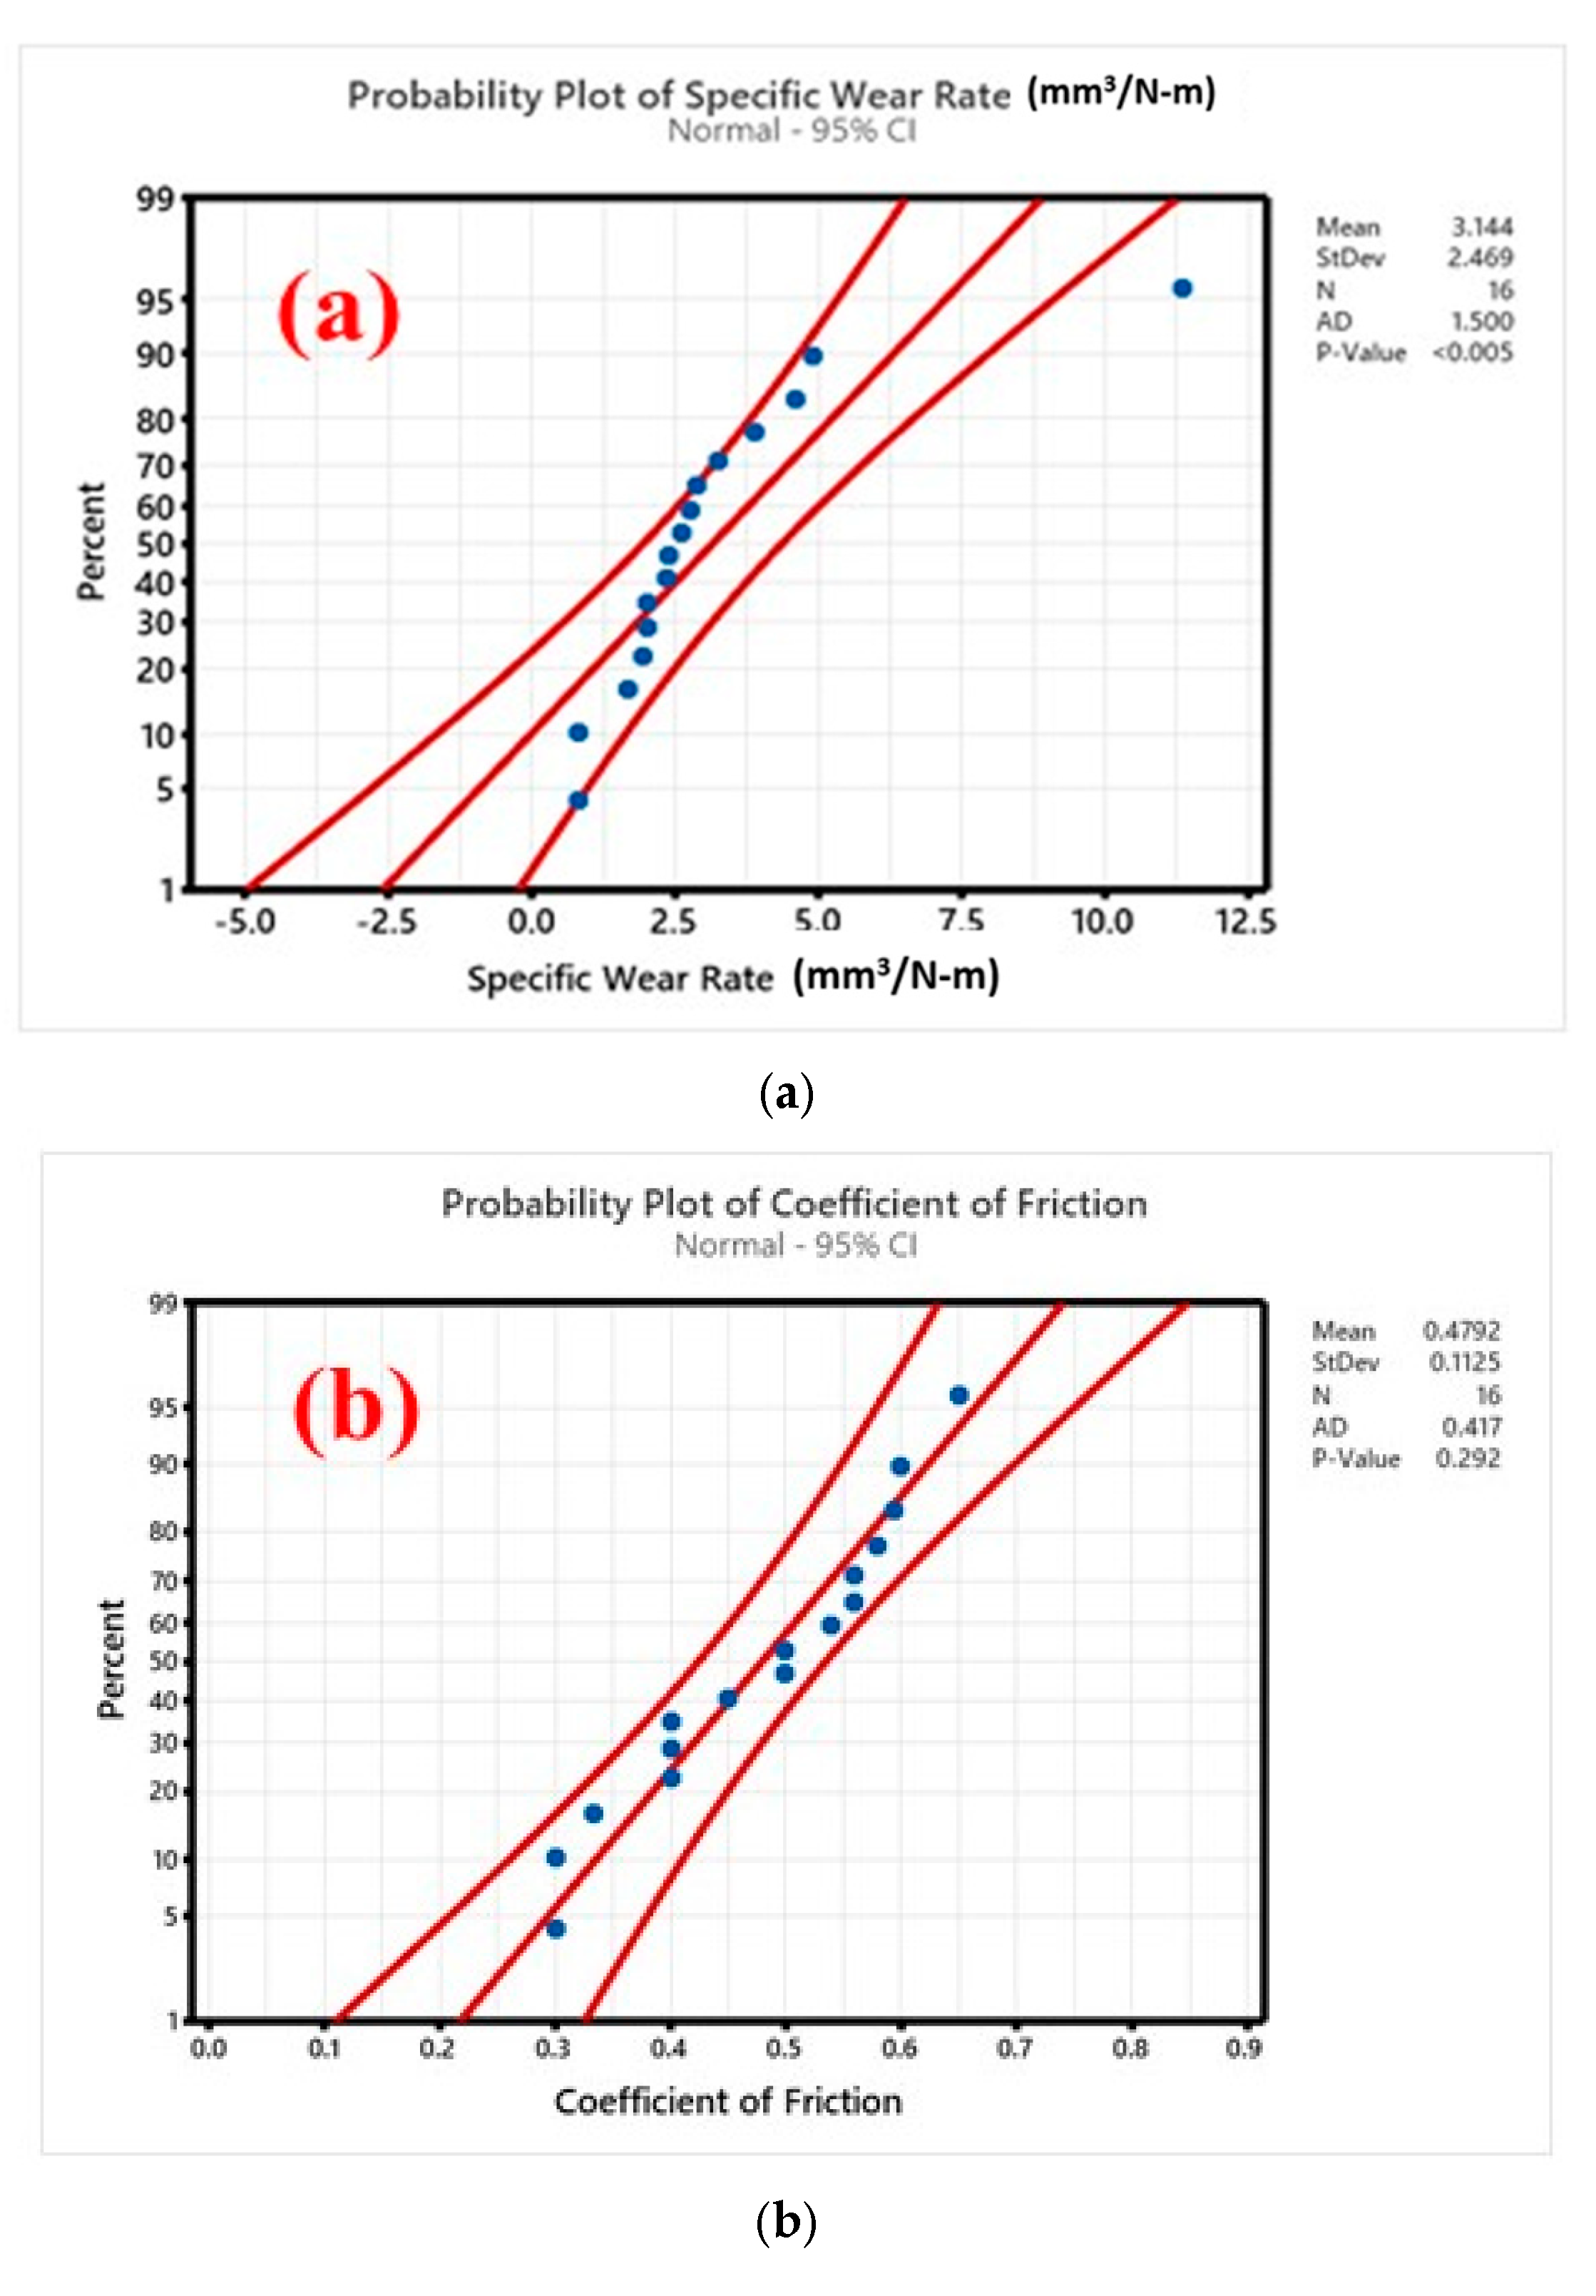
3.5. Wear Studies Using Taguchi Design
− 0.769 Wt. % of MoS2_8 − 1.504 Wt. % of MoS2_12 + 2.240 P (N)_5
− 0.286 P (N)_10 - 0.848 P (N)_15 - 1.105 P (N)_20 + 0.816 V (m/s)_1.0
+ 0.092 V (m/s)_1.5 − 0.324 V (m/s)_2.0 − 0.585 V (m/s)_2.5
+ 2.035 D (m)_500 − 0.479 D (m)_750 − 0.531 D (m)_1000
− 1.025 D (m)_1250
MoS2_4
+ 0.0325 Wt. % of MoS2_8 - 0.0950 Wt. % of MoS2_12 + 0.0500 ‘P’ (N)_5
+ 0.0650 ‘P’ (N)_10 - 0.0475 ‘P’ (N)_15 - 0.0675 ‘P’ (N)_20
− 0.0650 V (m/s)_1.0 + 0.0075 V (m/s)_1.5 + 0.0100 V (m/s)_2.0
+ 0.0475 V (m/s)_2.5 + 0.0525 D (m)_500 − 0.0375 D (m)_750
+ 0.0425 D (m)_1000 - 0.0575 D (m)_1250
3.6. Worn Morphology
4. Conclusions
- Epoxy composites were obtained integrated with the chopped basalt fibers and MoS2 dispersed at the weight concentrations of 0, 4, 8, 12, and 16 wt. %.
- The addition of the MoS2 to the matrix was confirmed through SEM and EDAX, and the even dispersion of the protective MoS2 particles in the matrix was also confirmed.
- When MoS2 was added, the density of the composites rose; nevertheless, because of the voids in the composites, the experimental density was somewhat lower than the predicted density.
- The addition of 16 wt. % MoS2, when incorporated into the chopped basalt fibers, resulted in the highest hardness of 98 HV.
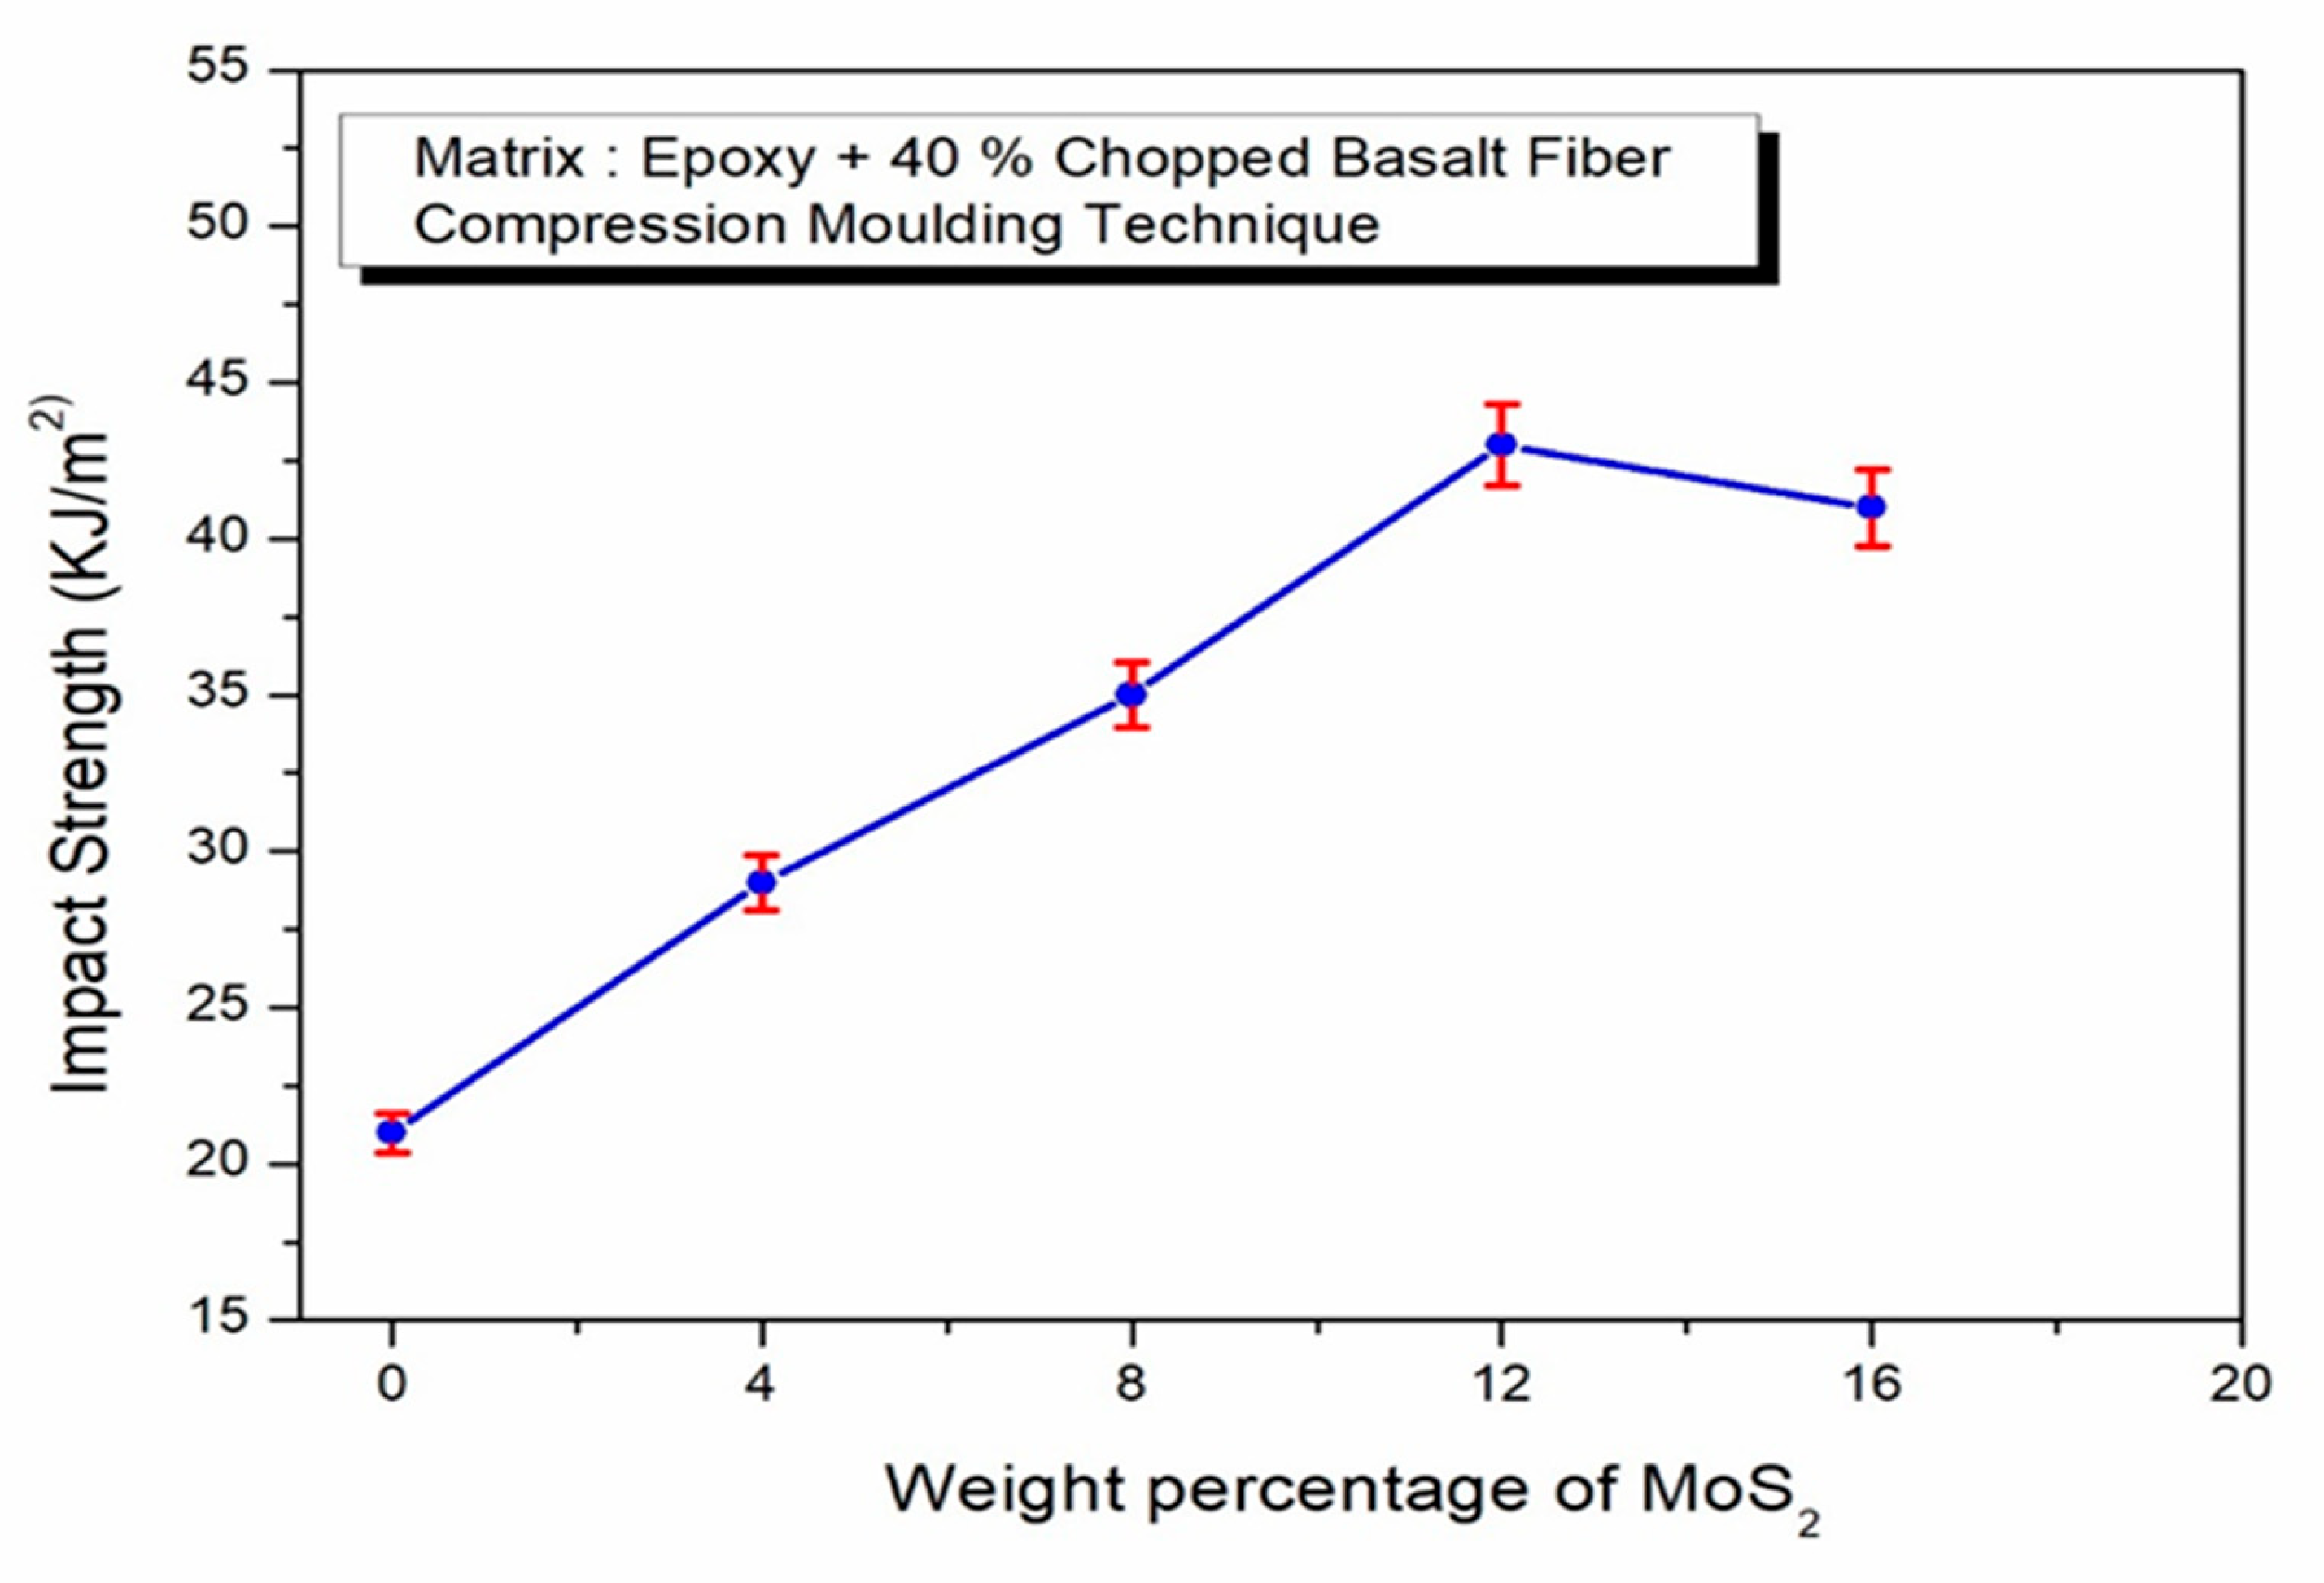
- Incorporating MoS2 fillers significantly enhanced the tensile strength of the composites, with the highest tensile strength recorded at 268 MPa for a 12% MoS2 addition, indicating effective stress and deformation resistance.
- The hardness of MoS2 and basalt fibers is responsible for the rise in compressive strength, which reached a peak of 241 MPa. During the compressive test, all components exhibited plastic deformation, with the hard basalt fibers embedding into the matrix.
- The investigation also found out that the MoS2 reinforcements delivered an enhancement of the flexural strength of the made composites. The MoS2-reinforced composites exhibited an improved flexural strength of about 269 MPa as compared to composites without fillers.
- It is also worth mentioning that the 16 wt. % MoS2 composite demonstrated reduced tensile, compressive, and flexural strengths as a consequence of a greater void fraction.
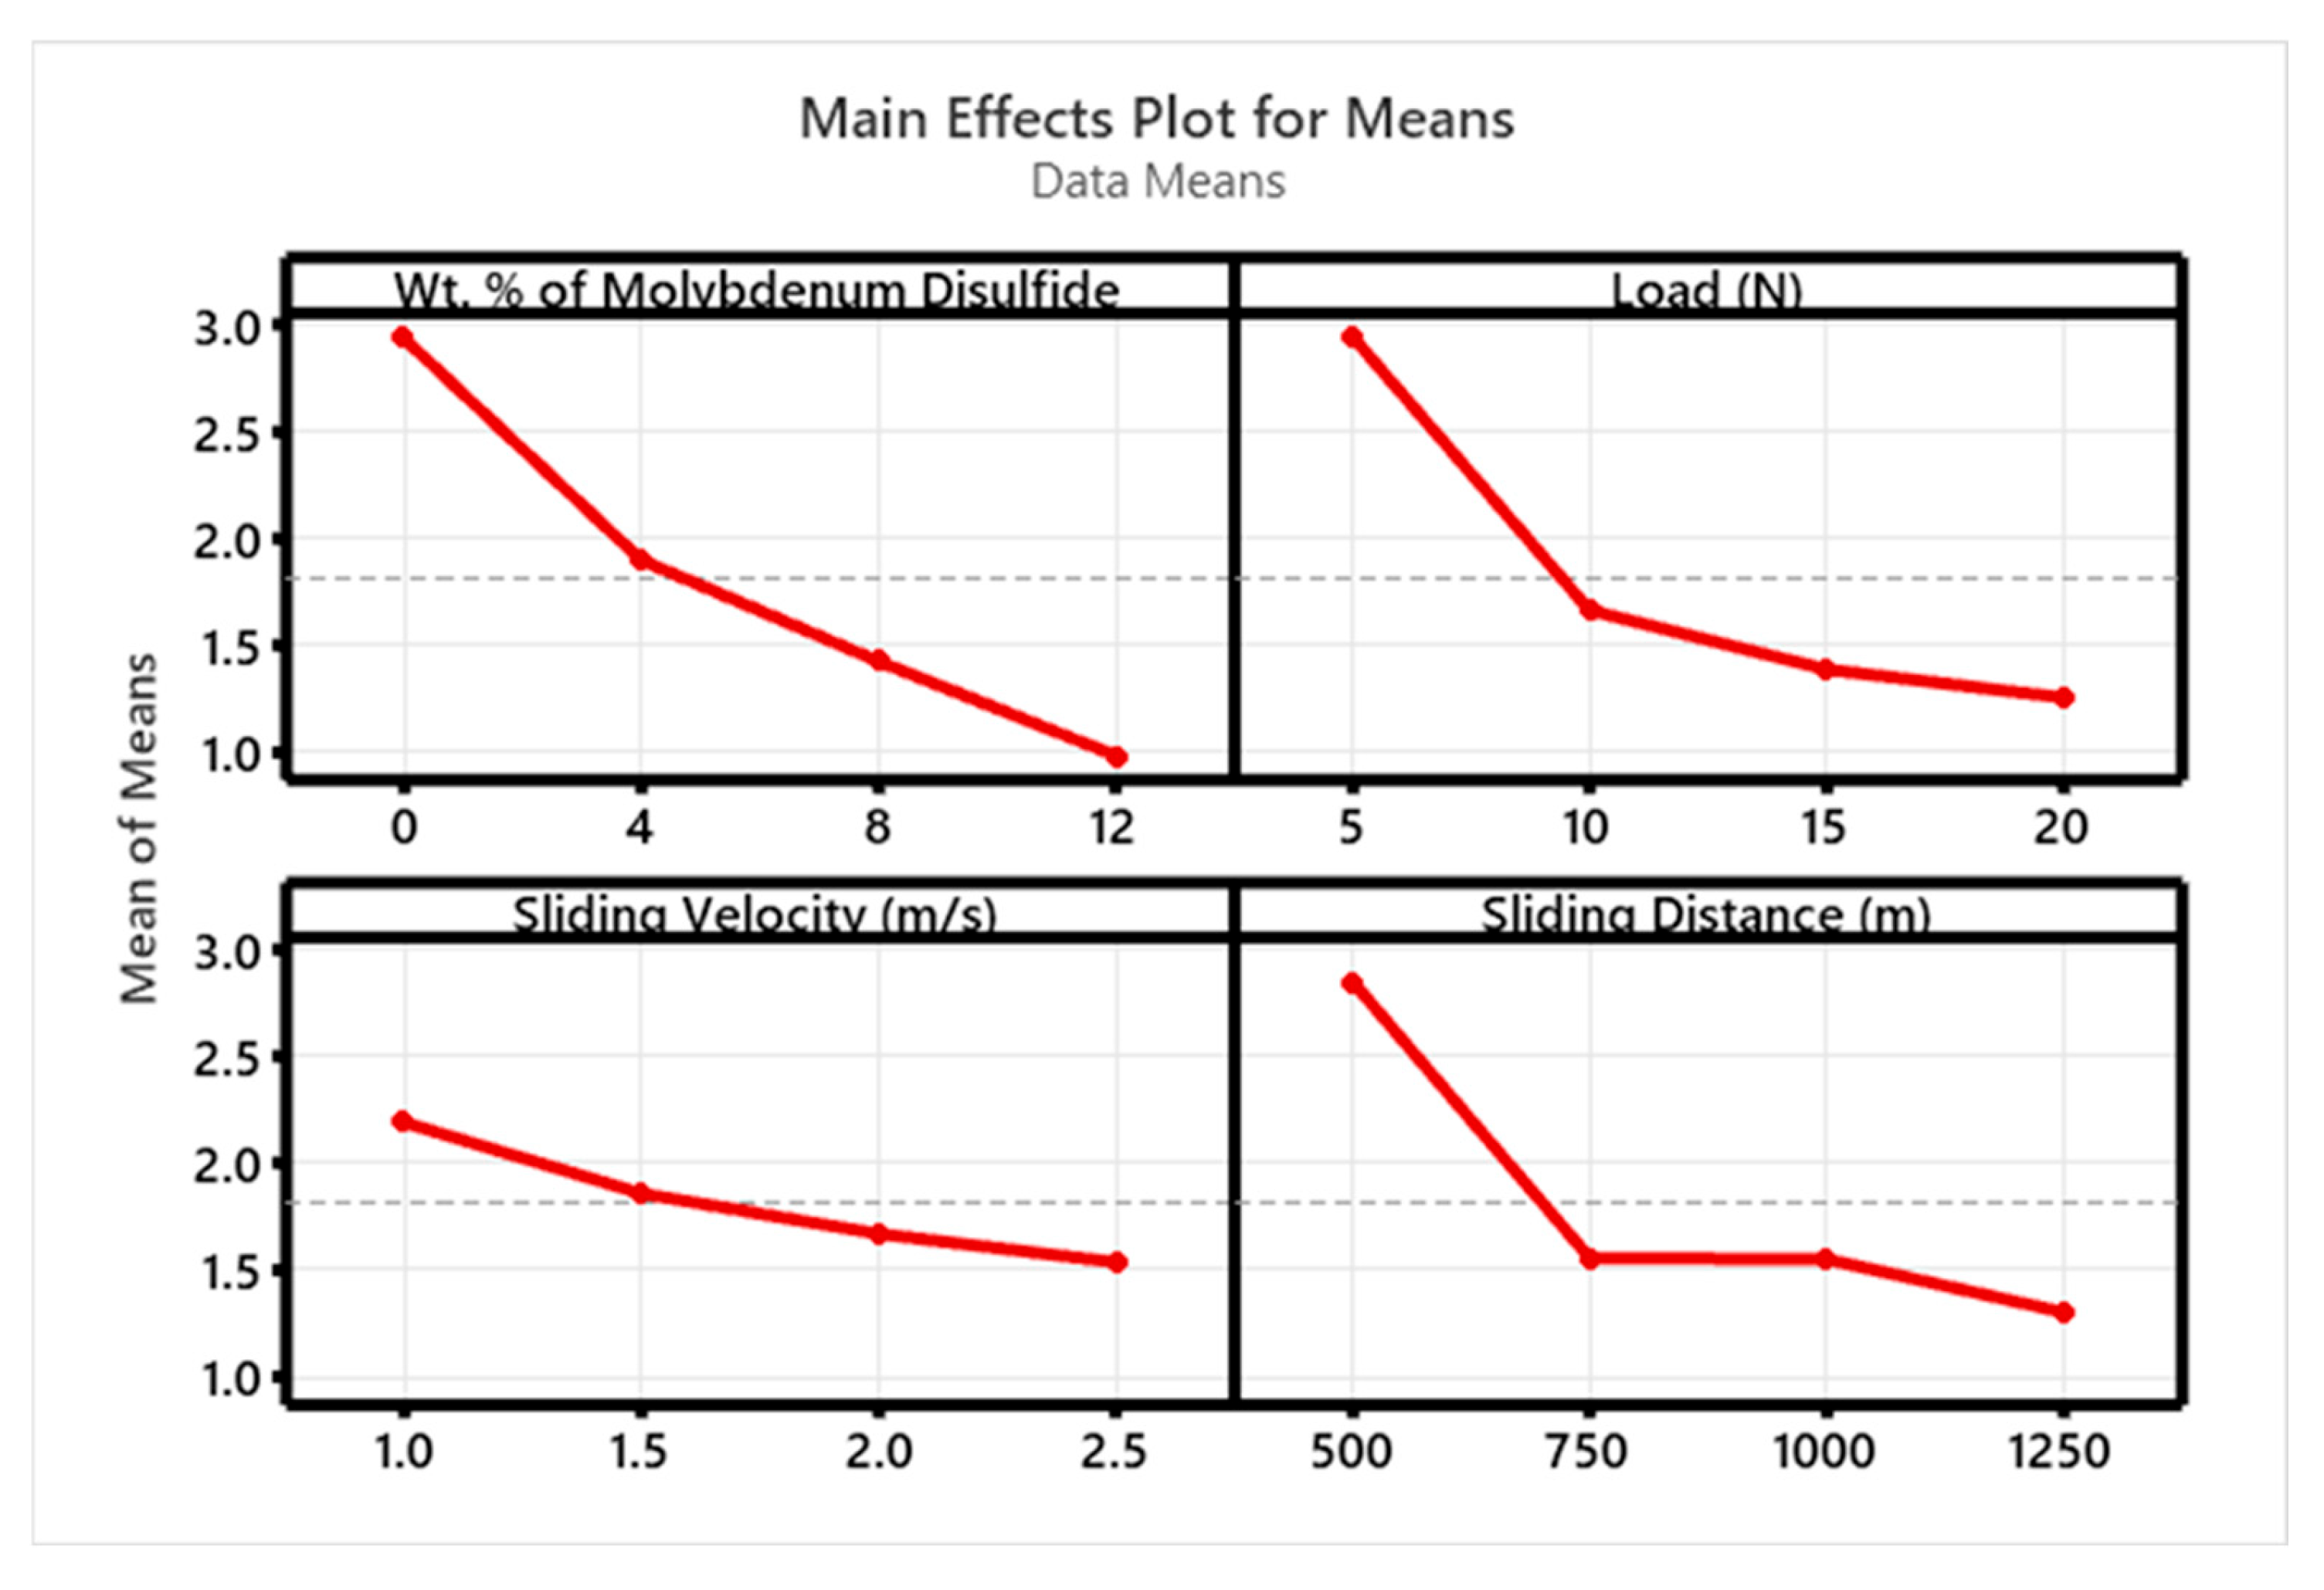
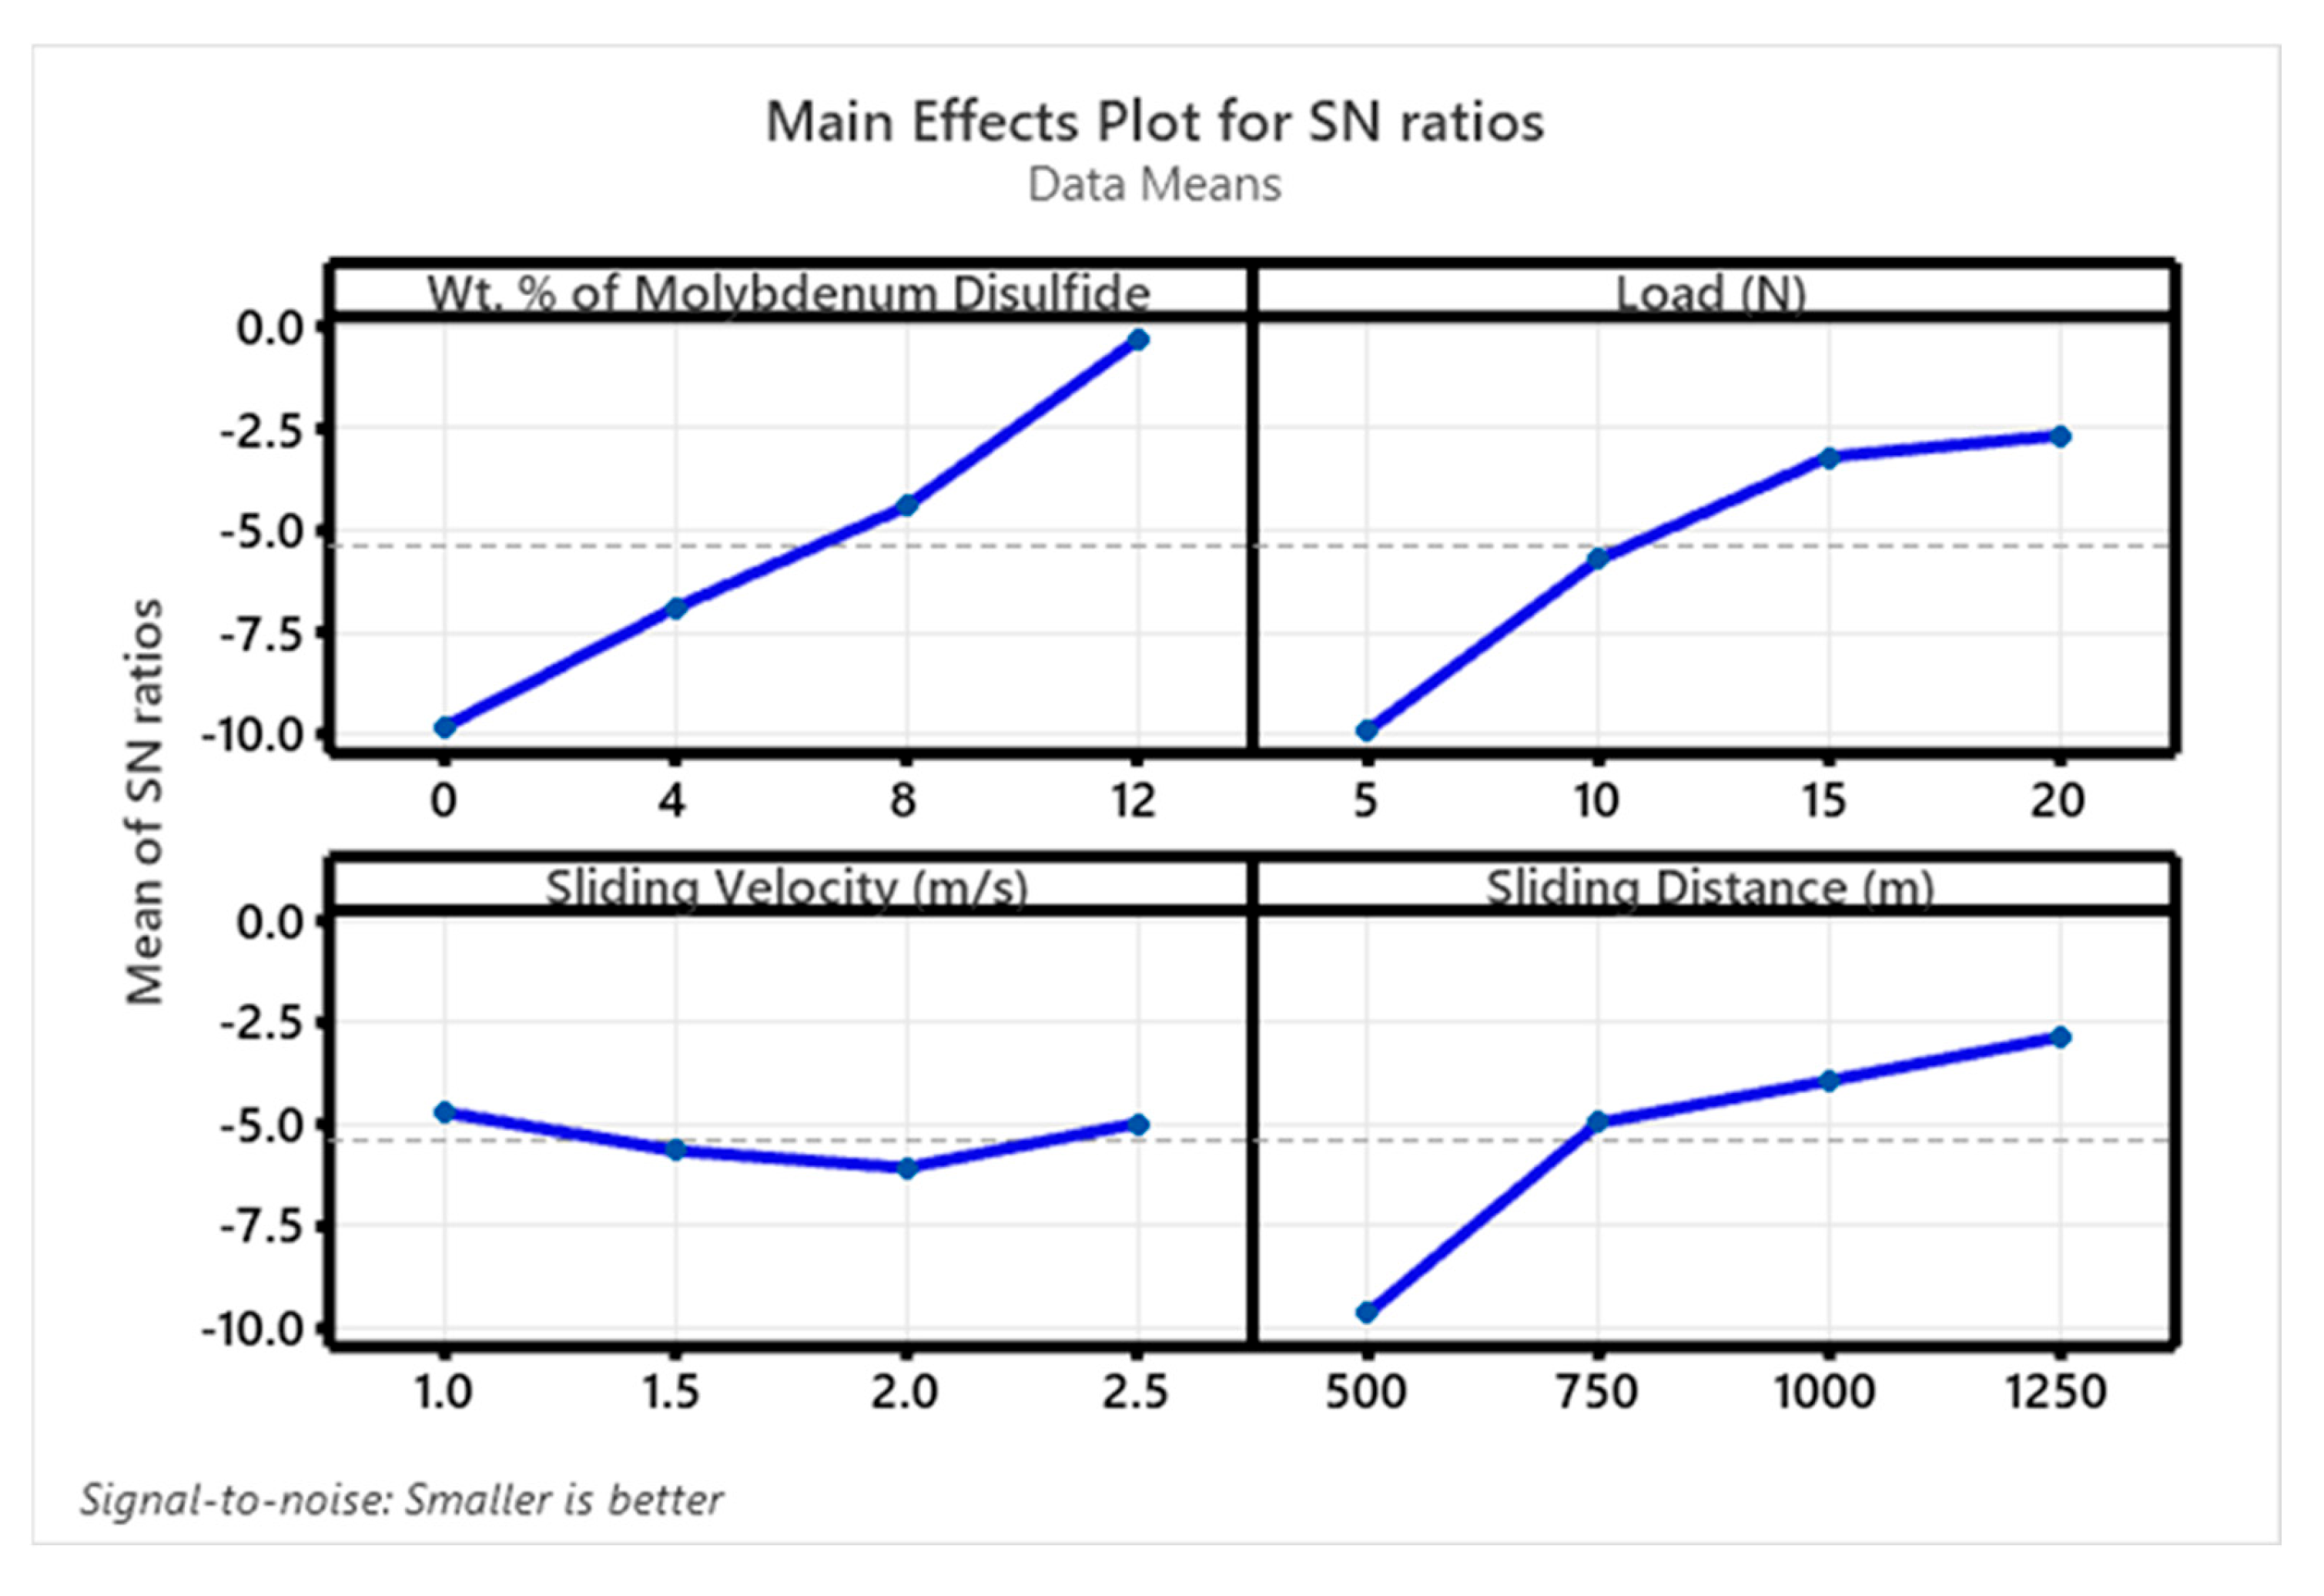
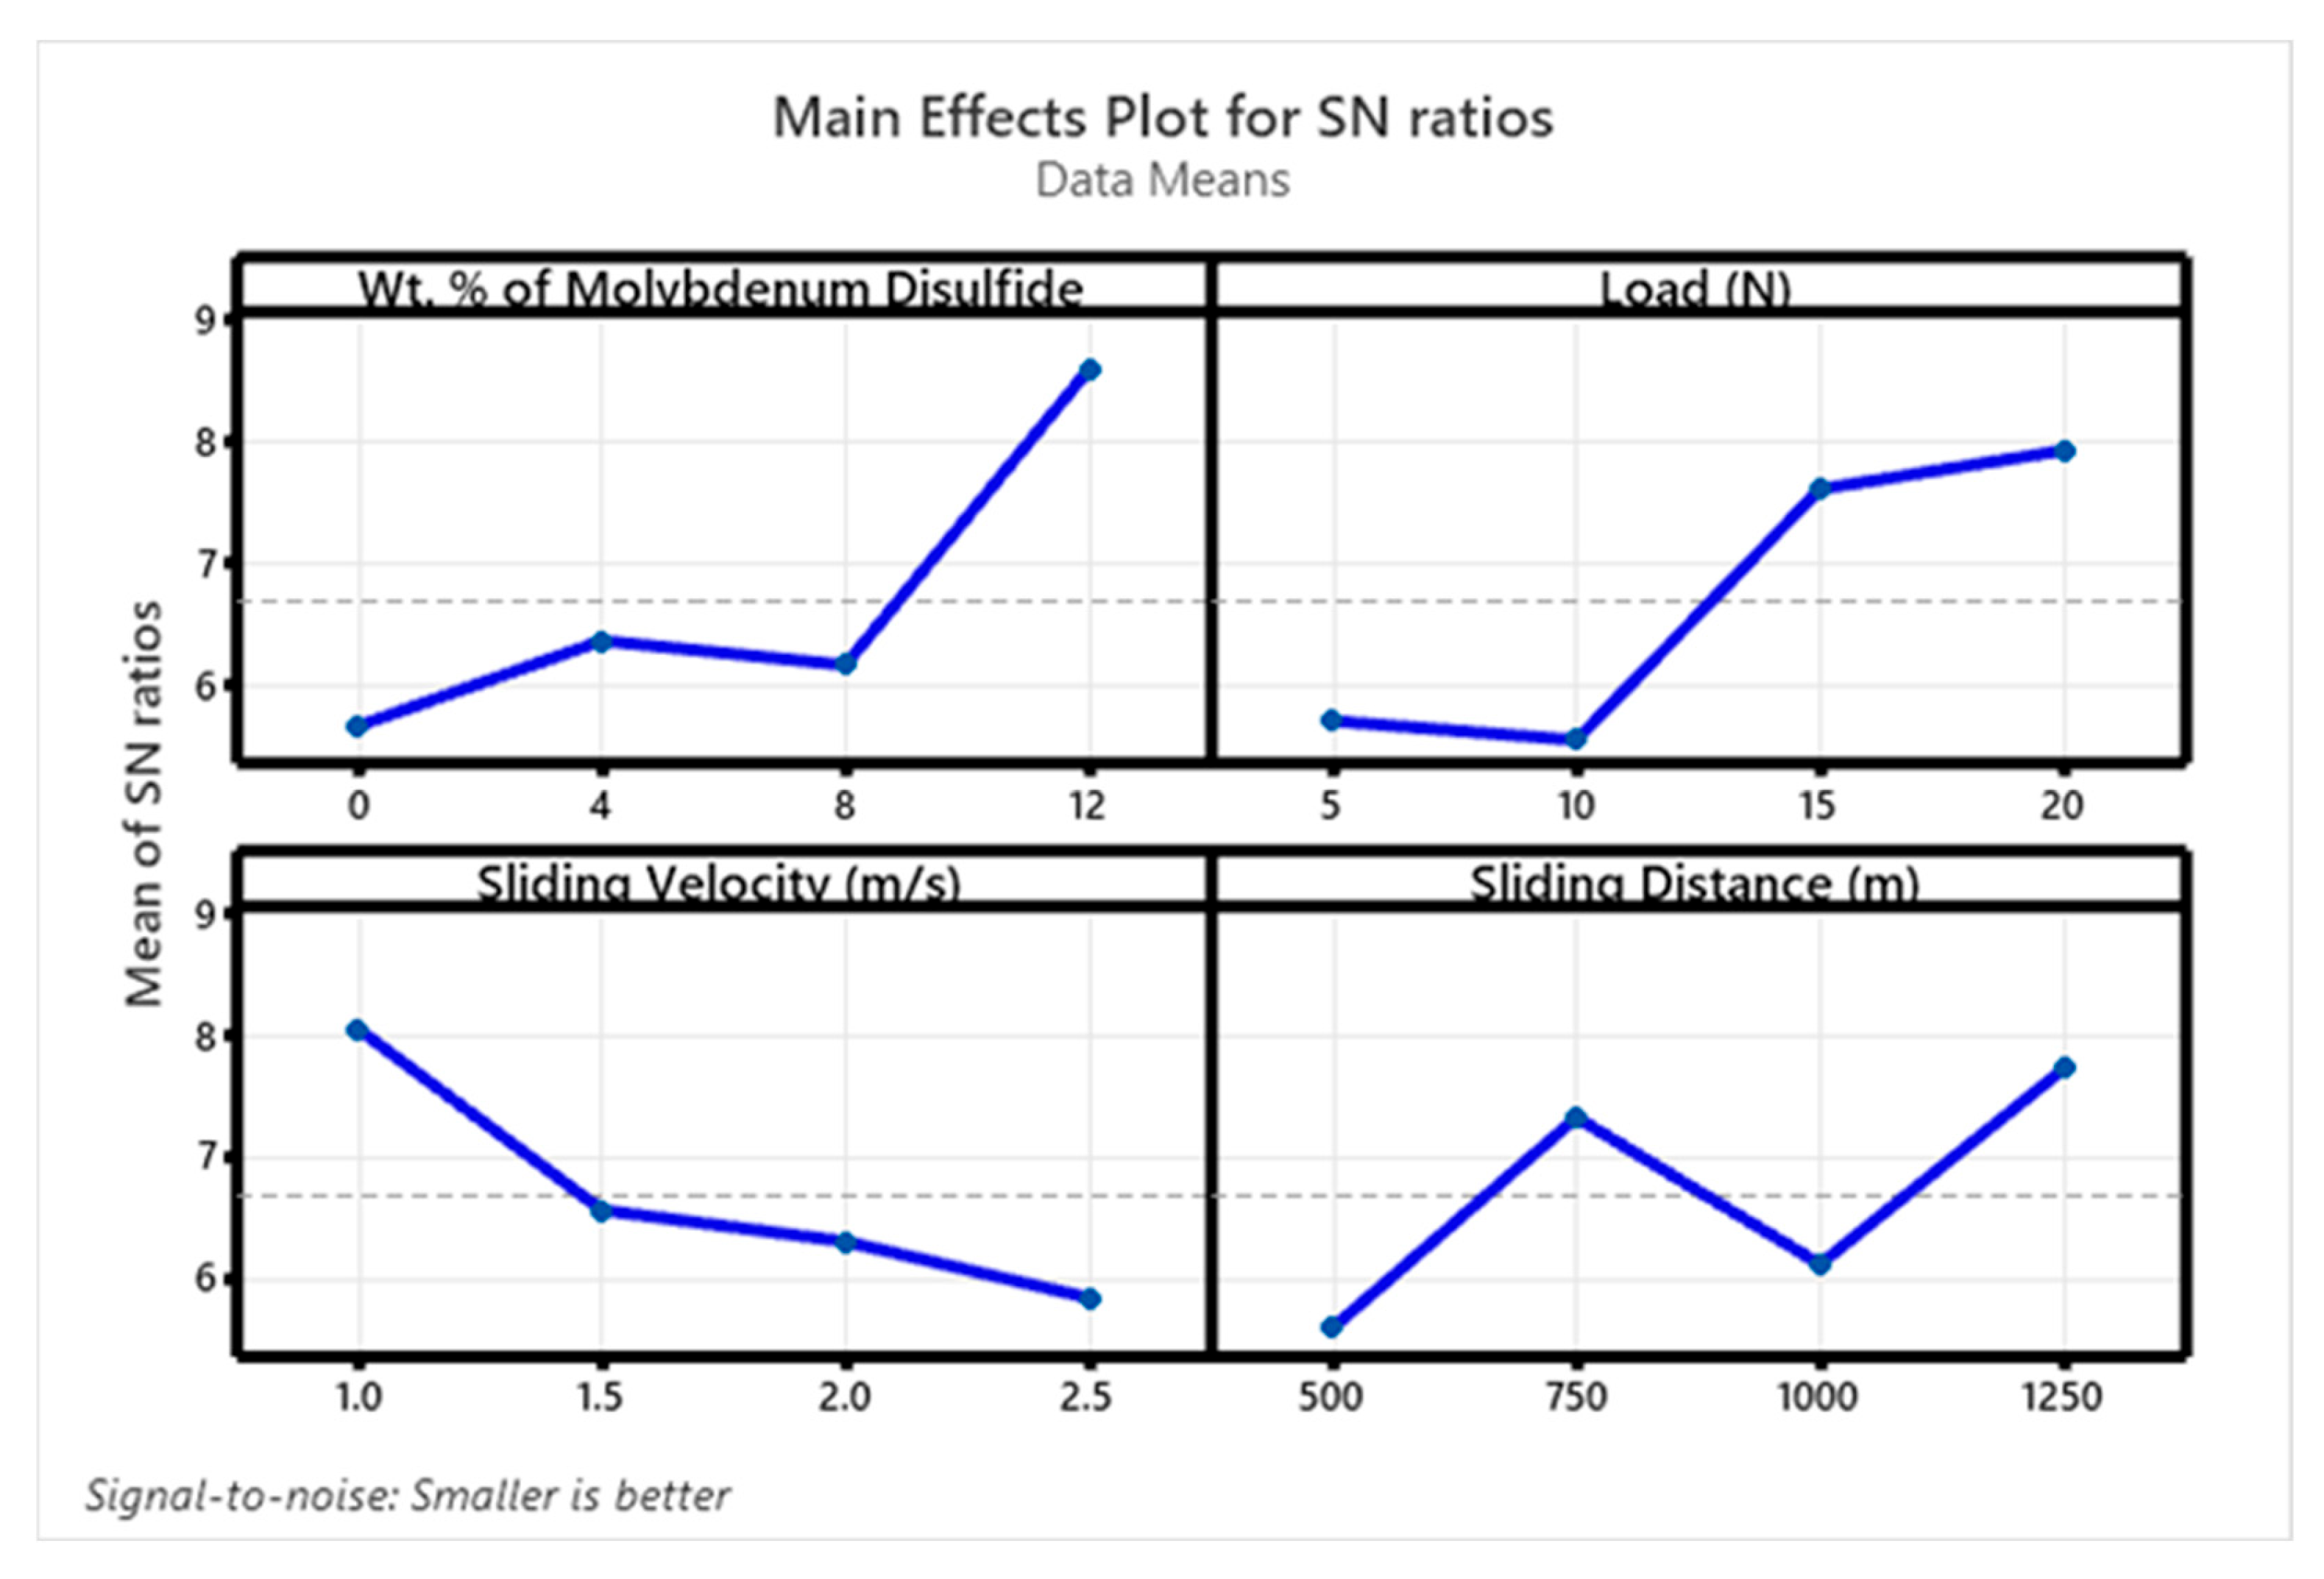
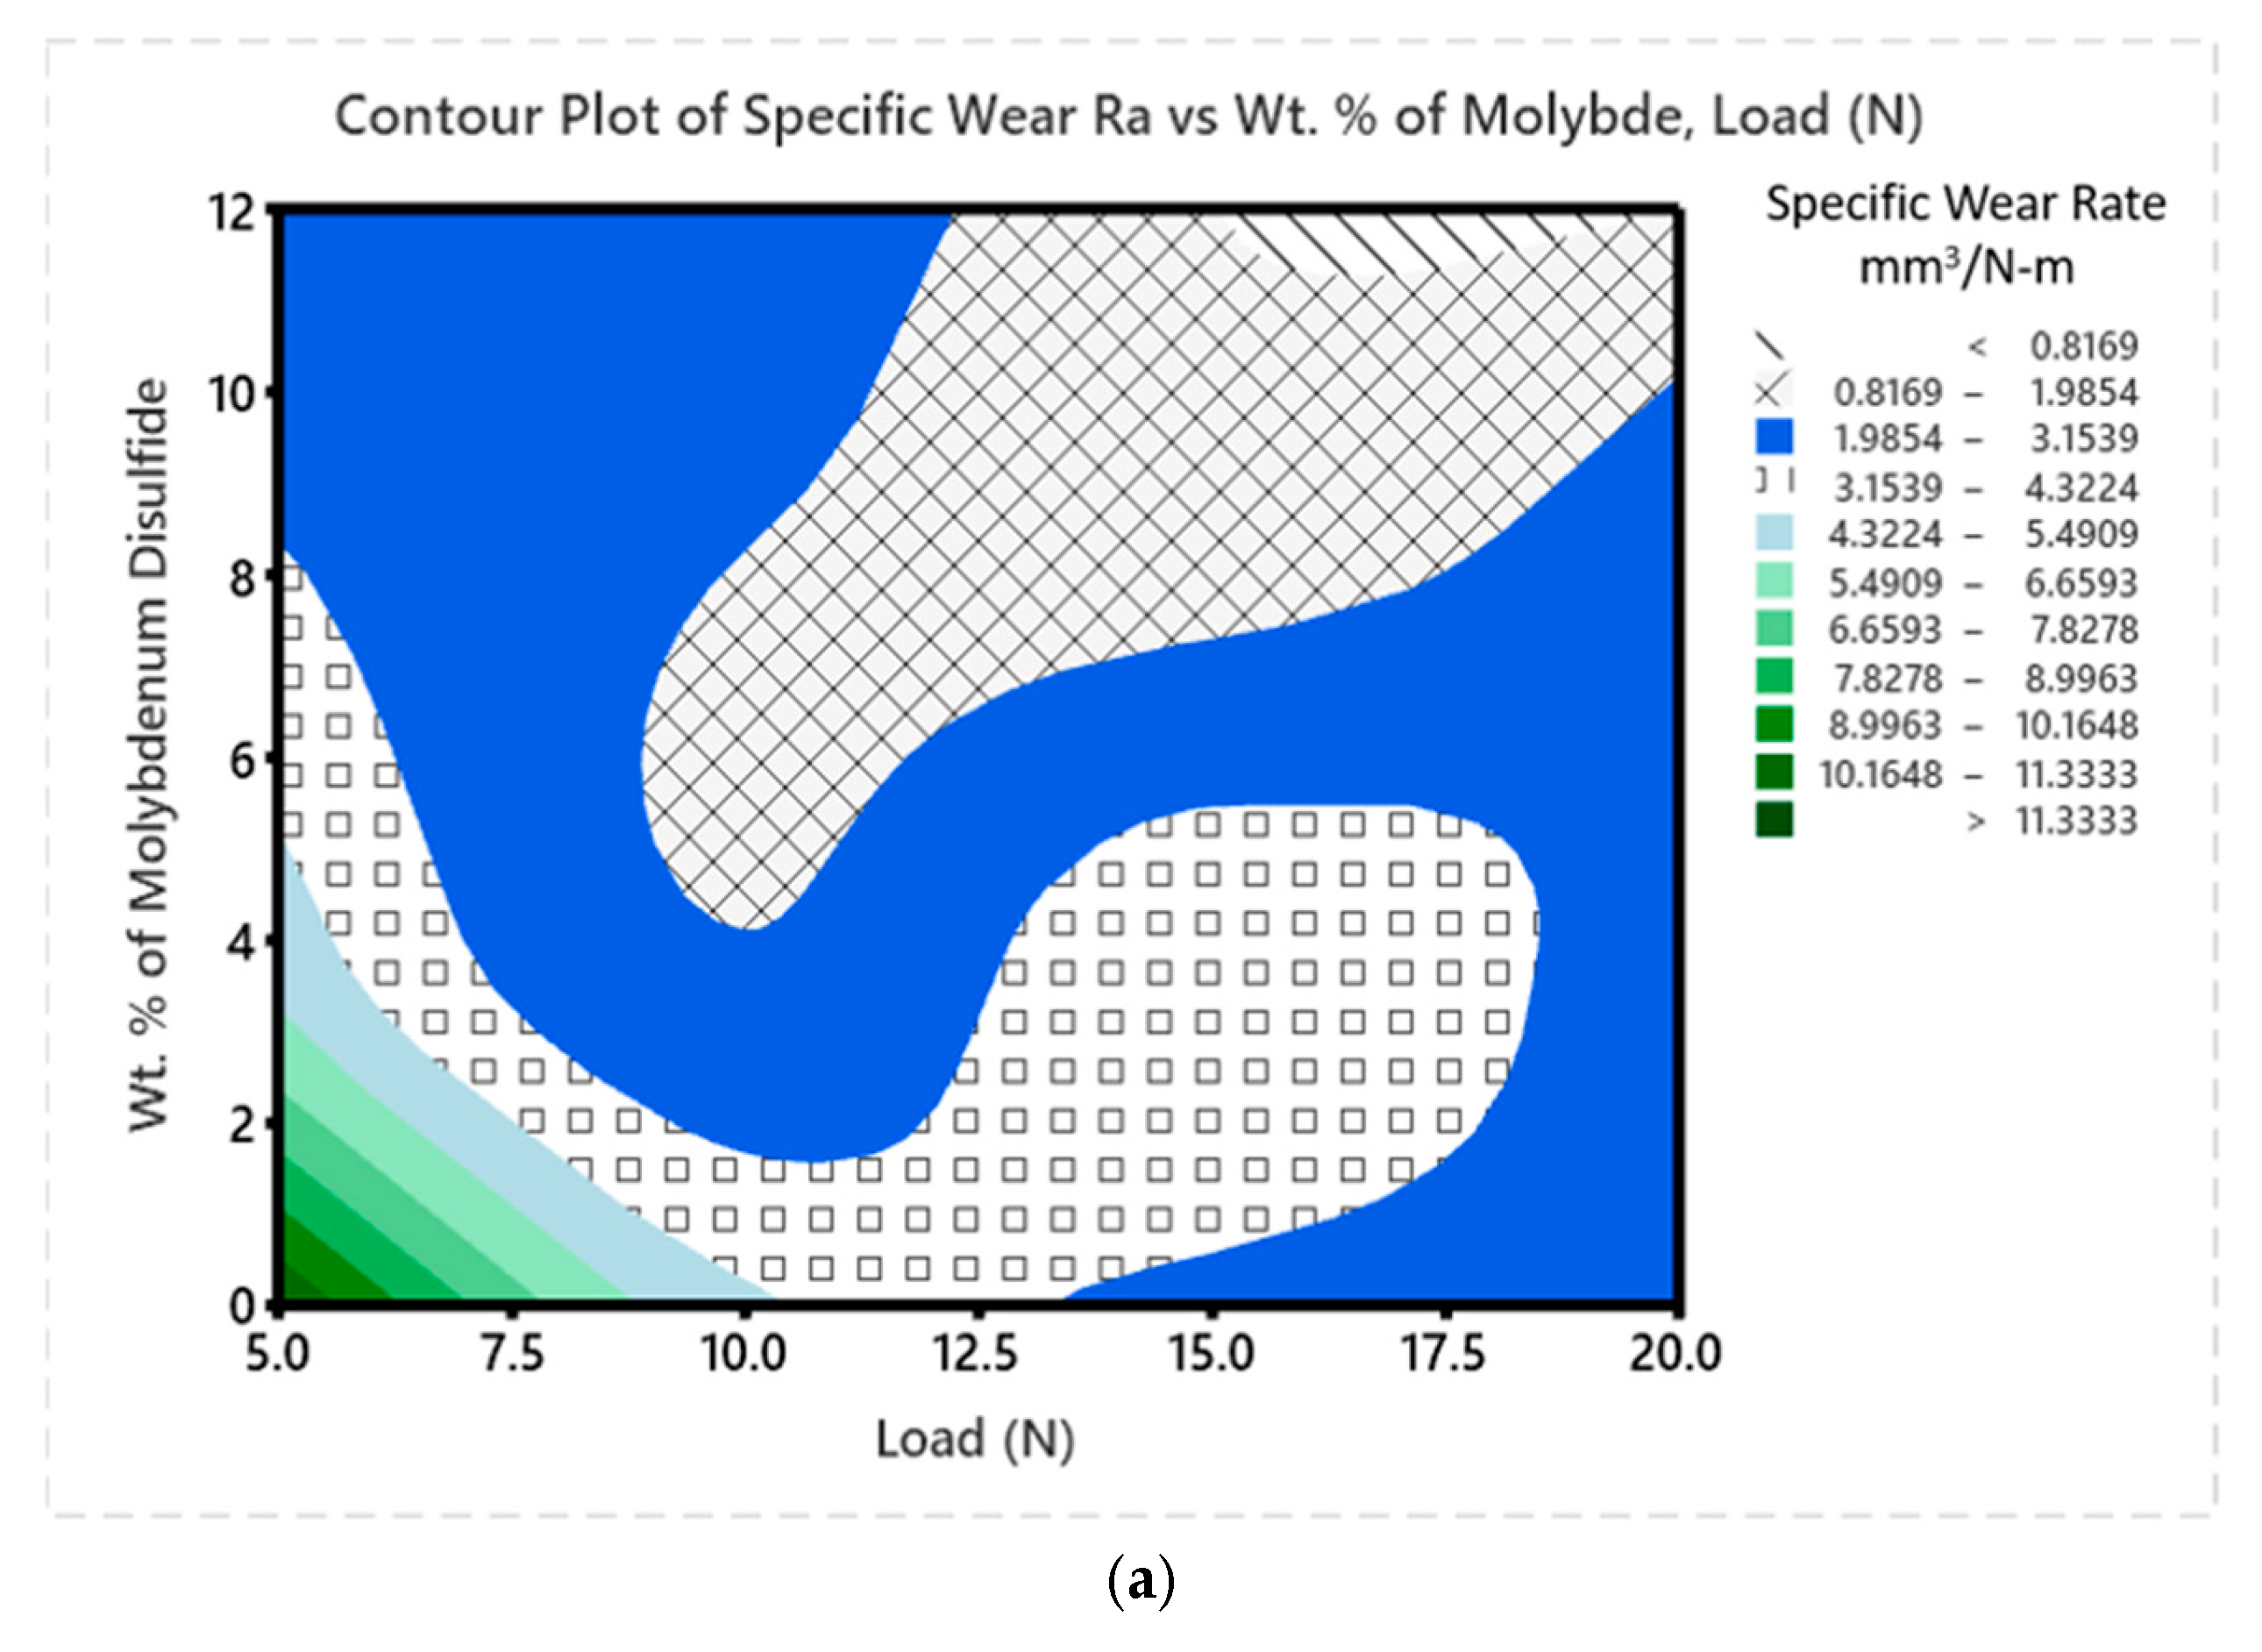
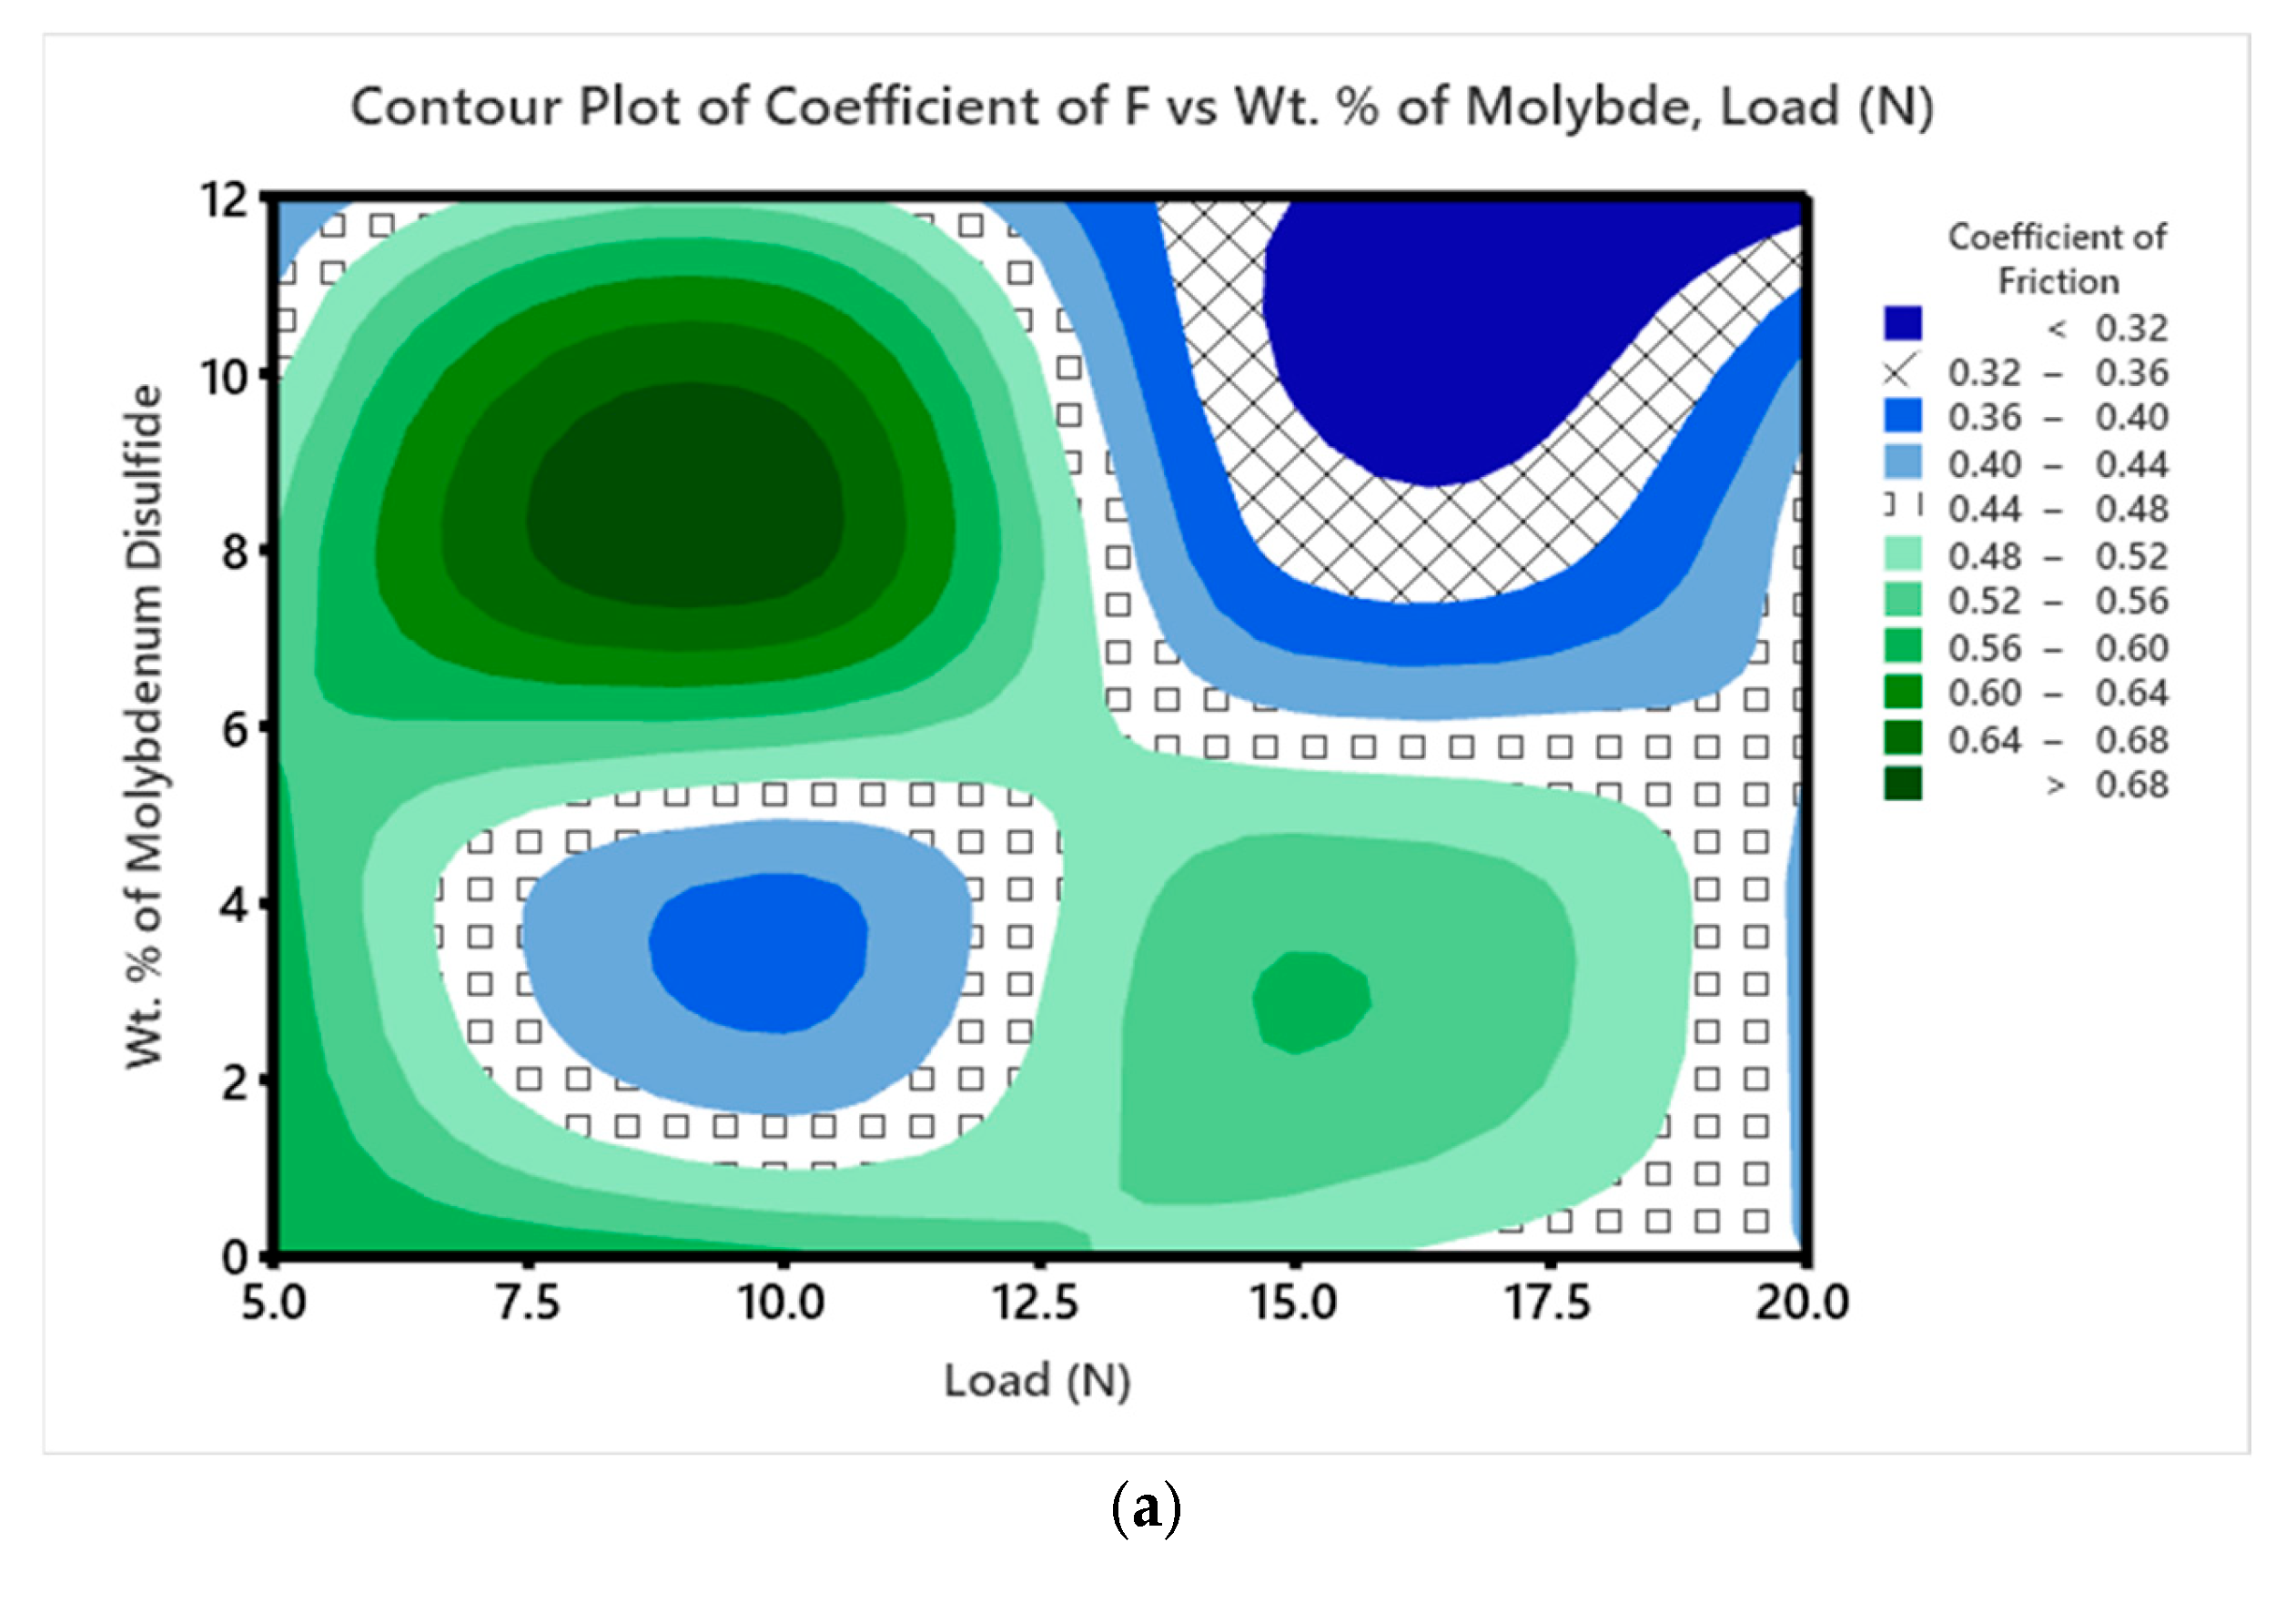
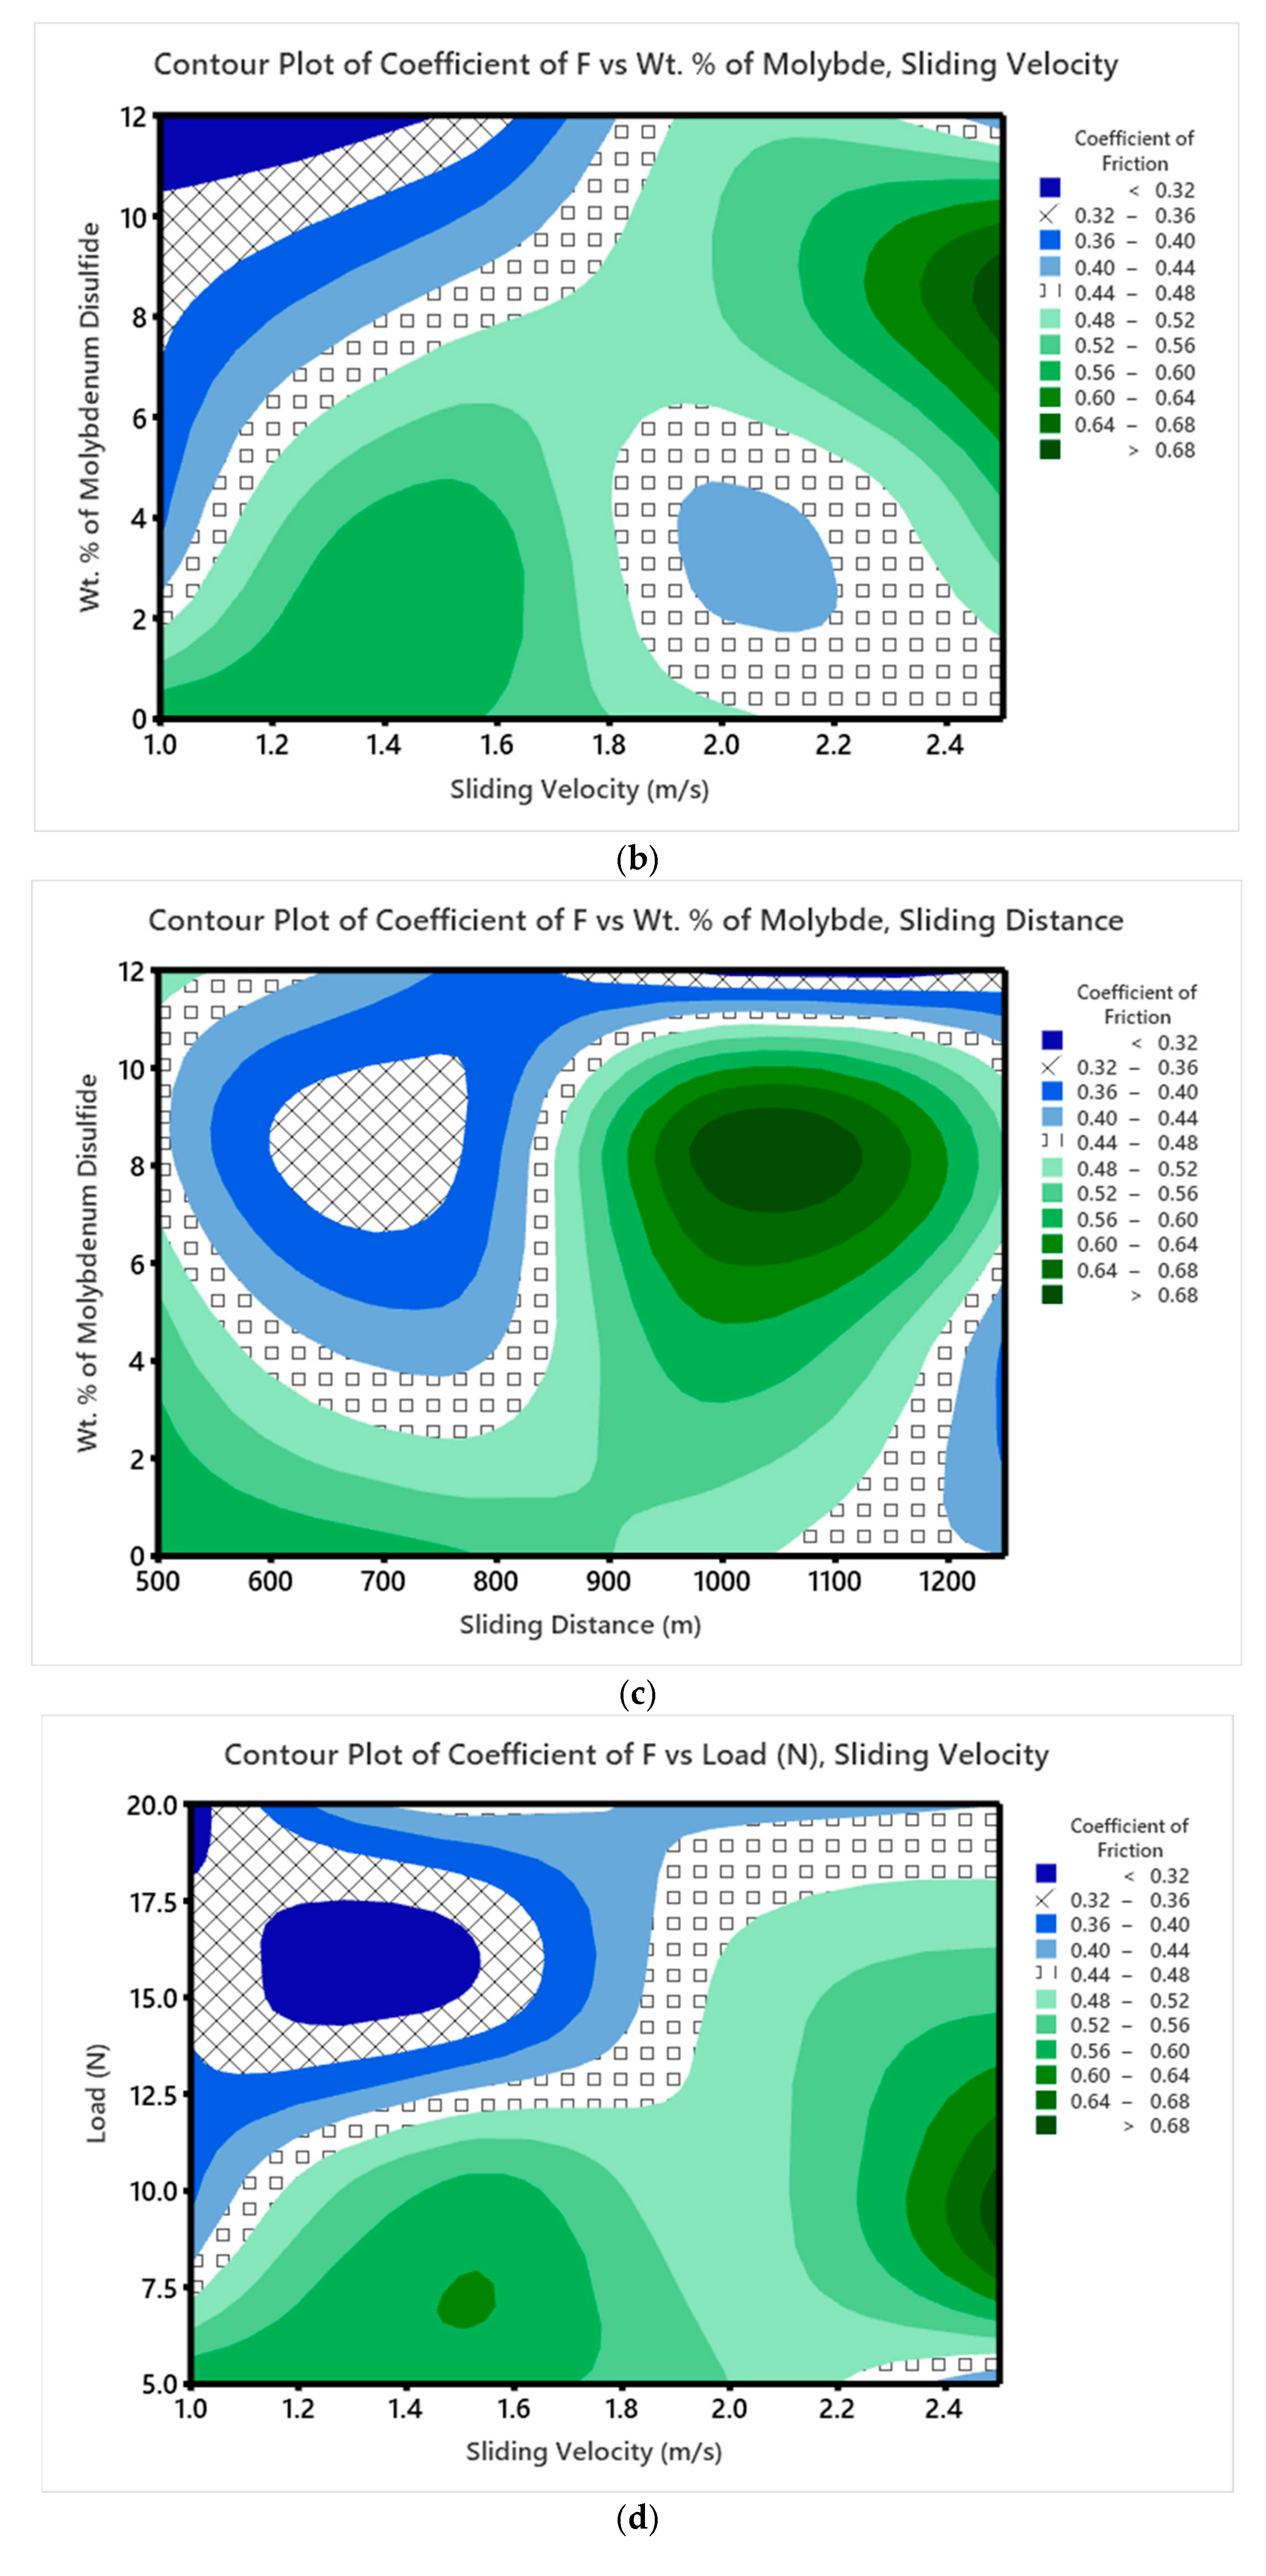
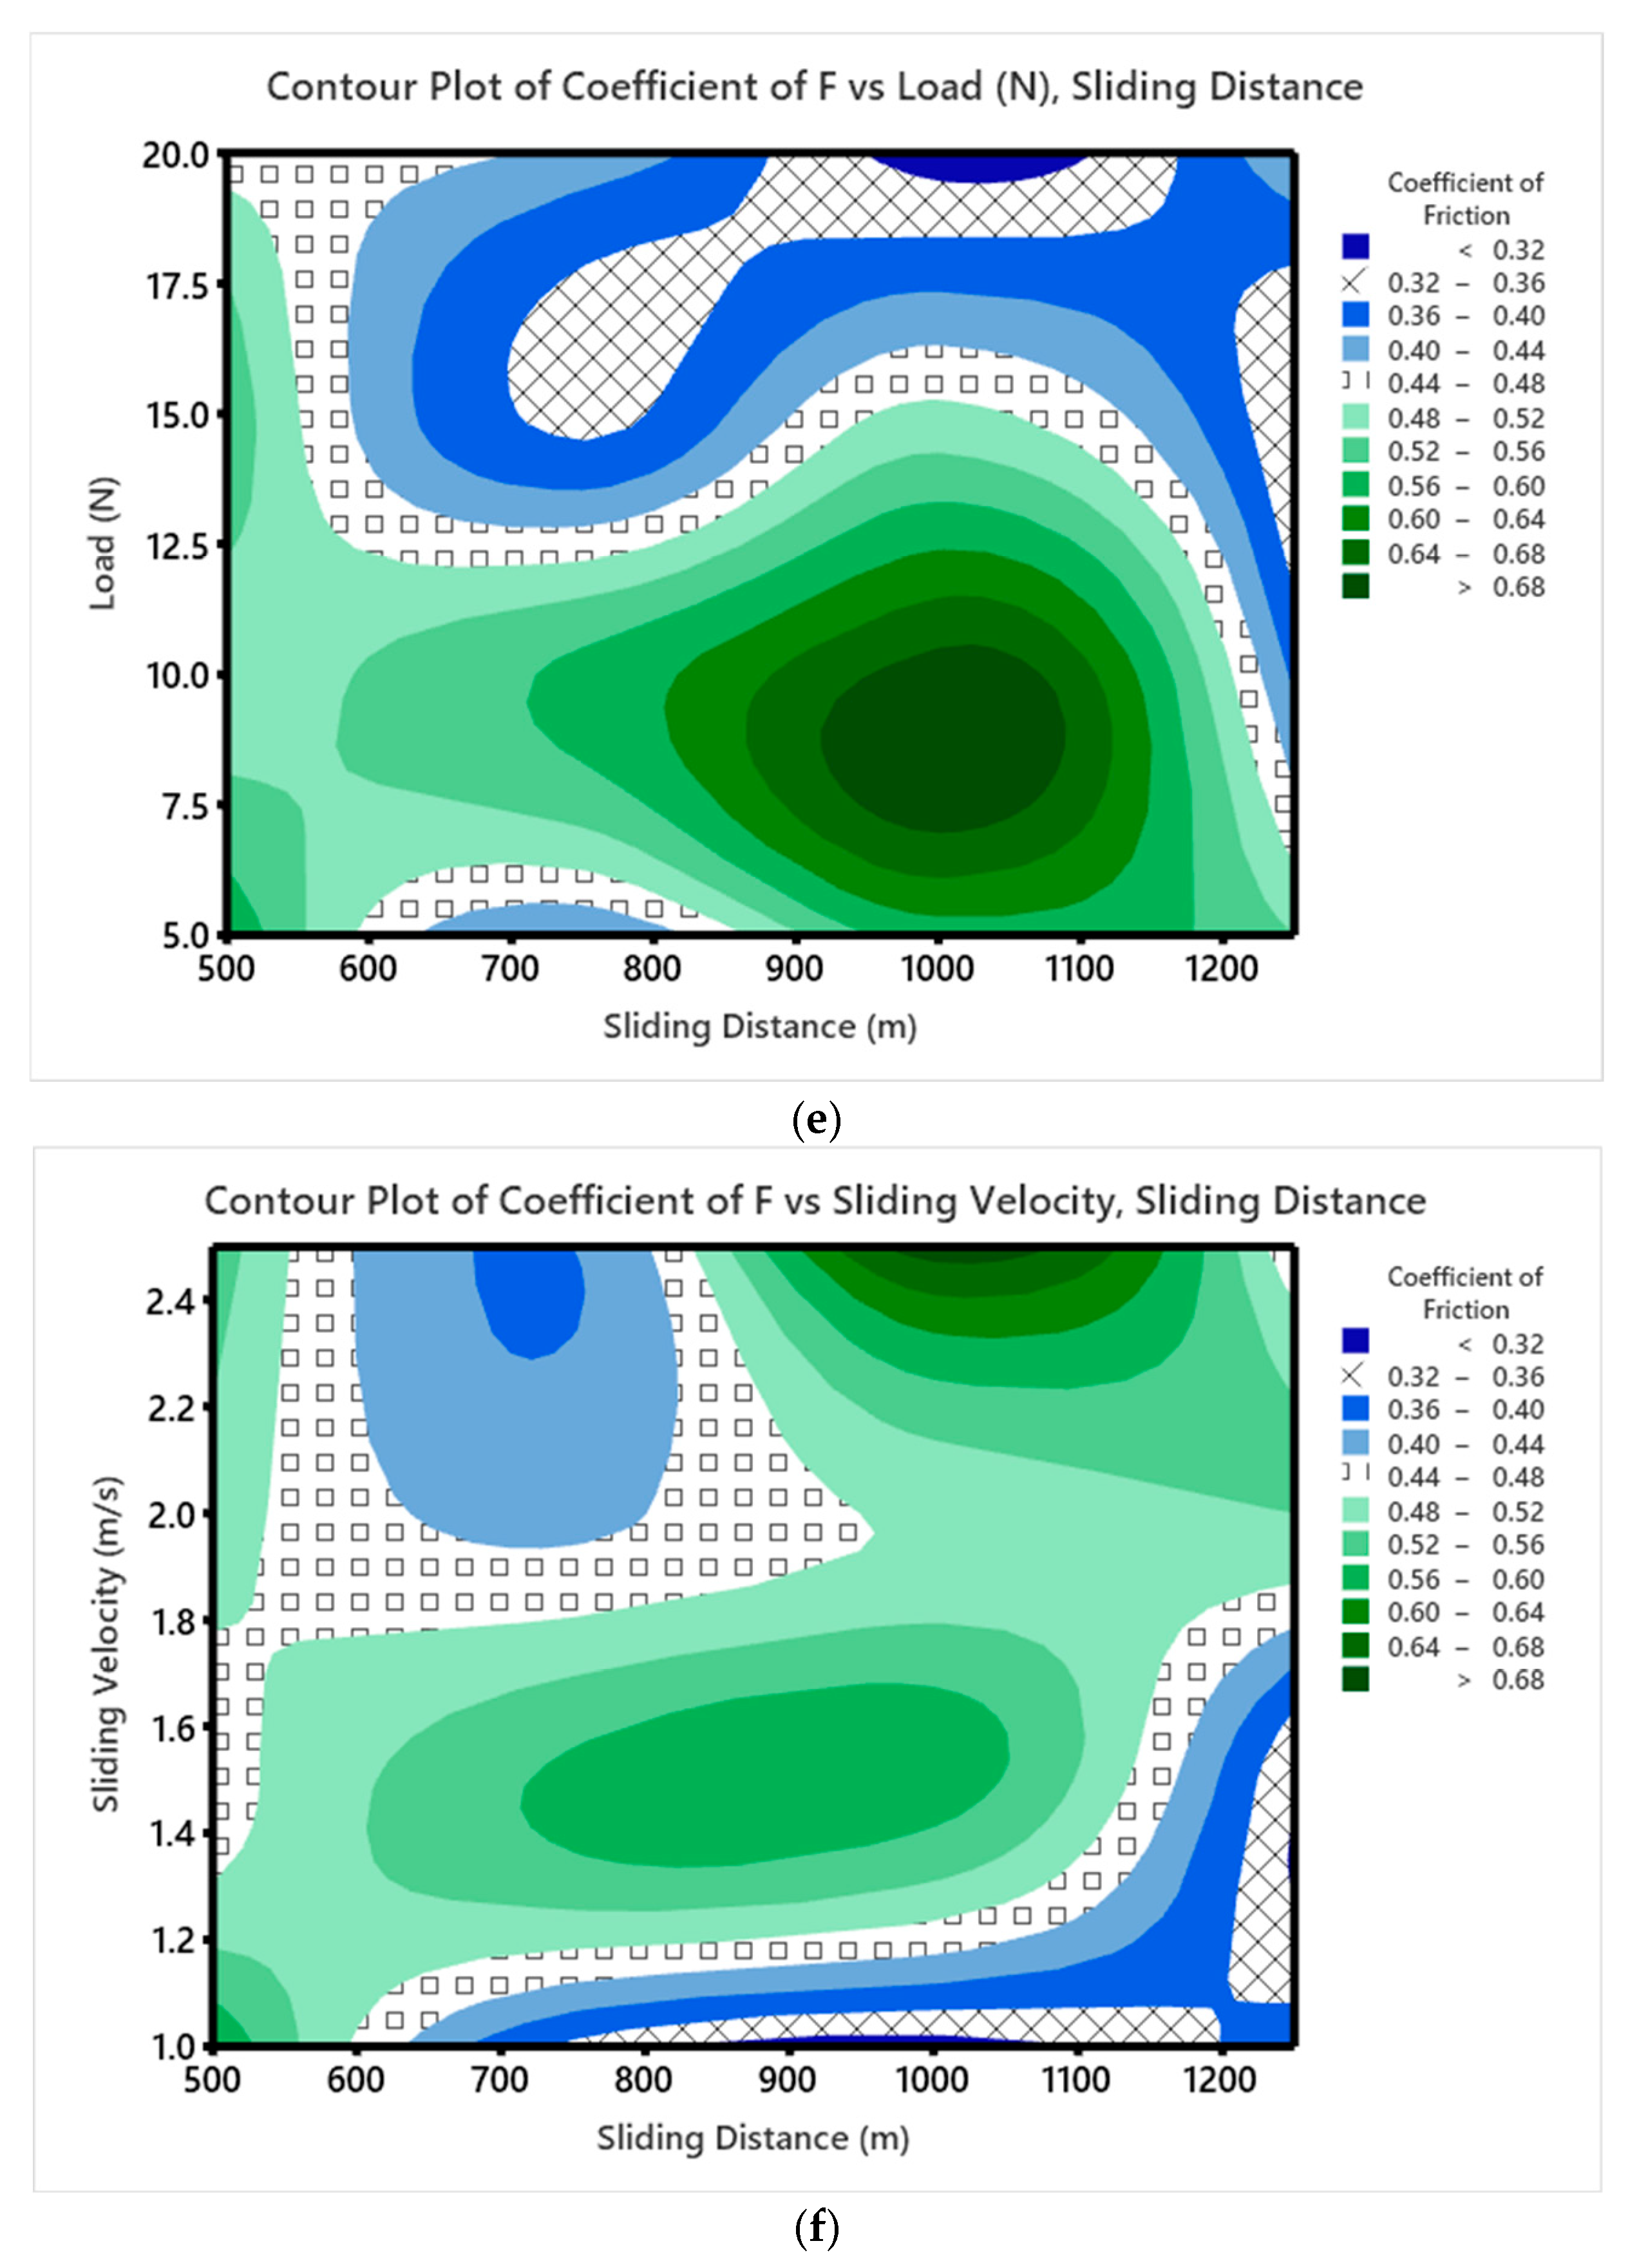
- To evaluate the wear characteristics of the composites, a L16 orthogonal array was deployed. The lowest ‘SWR’ and COF were registered at 0.8169 mm3/m at the loading conditions of 12 wt. %, 20 N ‘P’, 1.0 m/s velocity, and 1000 m sliding distance. High MoS2 concentrations minimized particle movement within the epoxy matrix, which lowered the ‘WR’, although ‘V’ only had a marginal impact.
- According to ANOVA results, the percentage of MoS2-reinforced weight had a greater impact on the composites’ ‘WR’ than the other components, with load and ‘D’ coming in second and third, respectively, while ‘V’ had no effect.
- SEM observation of worn composites confirmed mechanisms of matrix wear, fiber pull out, fiber breakage, and debris formation.
Author Contributions
Funding
Institutional Review Board Statement
Informed Consent Statement
Data Availability Statement
Conflicts of Interest
References
- Biswas, S.K.; Vijayan, K. Friction and wear of PTFE—A review. Wear 1992, 158, 193–211. [Google Scholar] [CrossRef]
- Wang, Y.Q.; Li, J. Sliding wear behavior and mechanism of ultra-high molecular weight polyethylene. Mater. Sci. Eng. A 1999, 266, 155–160. [Google Scholar] [CrossRef]
- Neves, A.C.C.; Rohen, L.A.; Mantovani, D.P.; Carvalho, J.P.R.G.; Vieira, C.M.F.; Lopes, F.P.D.; Simonassi, N.T.; Da Luz, F.S.; Monteiro, S.N. Comparative mechanical properties between biocomposites of Epoxy and polyester matrices reinforced by hemp fiber. J. Mater. Res. Technol. 2019, 9, 1296–1304. [Google Scholar] [CrossRef]
- Matykiewicz, D.; Barczewski, M.; Michałowski, S. Basalt powder as an eco-friendly filler for epoxy composites Thermal and thermo-mechanical properties assessment. Compos. B Eng. 2018, 164, 272–279. [Google Scholar] [CrossRef]
- Morova, N. Investigation of usability of basalt fibers in hot mix asphalt concrete. Constr. Build. Mater. 2013, 47, 175–180. [Google Scholar] [CrossRef]
- Fiore, V.; Scalici, T.; Di Bella, G.; Valenza, A. A review on basalt fibre and its composites. Compos. B Eng. 2015, 74, 74–94. [Google Scholar] [CrossRef]
- Colombo, C.; Vergani, L.; Burman, M. Static and fatigue characterisation of new basalt fibre reinforced composites. Compos. Struct. 2011, 94, 1165–1174. [Google Scholar] [CrossRef]
- Lopresto, V.; Leone, C.; De Iorio, I. Mechanical characterisation of basalt fibre reinforced plastic. Compos. B Eng. 2011, 42, 717–723. [Google Scholar] [CrossRef]
- Liu, Q.; Shaw, M.T.; Parnas, R.S.; McDonnell, A.-M. Investigation of basalt fiber composite mechanical properties for applications in transportation. Polym. Compos. 2005, 27, 41–48. [Google Scholar] [CrossRef]
- Raajeshkrishna, C.R.; Chandramohan, P. Effect of reinforcements and processing method on mechanical properties of glass and basalt epoxy composites. SN Appl. Sci. 2020, 2, 959. [Google Scholar] [CrossRef]
- Saravanan, D.; Palanisamy, C.; Raajeshkrishna, C.R. Tribological performance of multi walled carbon nanotubes–alumina hybrid/epoxy nanocomposites under dry sliding condition. Mater. Res. Express 2019, 6, 105067. [Google Scholar] [CrossRef]
- Bredikhin, P.A.; Kadykova, Y.A. Waste Stone Wool as an Effective Filler for Polyethylene. Int. J. Polym. Sci. 2017, 44, 41–44. [Google Scholar] [CrossRef]
- Kazemi-Khasragh, E.; Bahari-Sambran, F.; Siadati, S.M.H.; Eslami-Farsani, R.; Chirani, S.A. The effects of surface-modified graphene nanoplatelets on the sliding wear properties of basalt fibers-reinforced epoxy composites. J. Appl. Polym. Sci. 2019, 136, 47986. [Google Scholar] [CrossRef]
- Thooyavan, Y.; Kumaraswamidhas, L.A.; Raj, R.E.; Binoj, J.S. Influence of SiC micro and nano particles on tribological, water absorption and mechanical properties of basalt bidirectional mat/vinyl ester composites. Compos. Sci. Technol. 2021, 219, 109210. [Google Scholar] [CrossRef]
- Visconti, I.C.; Langella, A.; Durante, M. The Wear Behaviour of Composite Materials with Epoxy Matrix Filled with Hard Powder. Appl. Compos. Mater. 2001, 8, 179–189. [Google Scholar] [CrossRef]
- Saravanan, S.; Parkunam, N.; Navaneethakrishnan, G.; Karthikeyan, K.; Suthahar, S.T.J. Development of basalt based nanoparticles reinforced composites. IOP Conf. Ser. Mater. Sci. Eng. 2020, 923, 012052. [Google Scholar] [CrossRef]
- Cavdar, K.; Bingol, M. Investigation of Mechanical Properties of Basalt Particle-Filled SMC Composites. Int. J. Polym. Sci. 2016, 2016, 1231606. [Google Scholar] [CrossRef]
- Akinci, A.; Yilmaz, S.; Sen, U. Wear Behavior of Basalt Filled Low Density Polyethylene Composites. Appl. Compos. Mater. 2011, 19, 499–511. [Google Scholar] [CrossRef]
- Akinci, A.; Ercenk, E.; Yilmaz, S.; Sen, U. Slurry erosion behaviors of basalt filled low density polyethylene composites. Mater. Des. 2011, 32, 3106–3111. [Google Scholar] [CrossRef]
- Akinci, A. Mechanical and morphological properties of basalt filled polymer matrix composites. Arch. Mater. Sci. Eng. 2009, 35, 29–32. [Google Scholar]
- Chen, P.; Li, J.; Zhang, L. Analysis of mechanical characteristics of fly ash cenospheres reinforced epoxy composites. J. Wuhan Univ. Technol. Mater. Sci. Ed. 2018, 33, 139–145. [Google Scholar] [CrossRef]
- Mutalikdesai, S.; Hadapad, A.; Patole, S.; Hatti, G. Fabrication and Mechanical Characterization of Glass fibre reinforced Epoxy Hybrid Composites using Fly ash/Nano clay/Zinc oxide as filler. IOP Conf. Ser. Mater. Sci. Eng. 2018, 376, 012061. [Google Scholar] [CrossRef]
- Omran, A.A.B.; Mohammed, A.A.; Sapuan, S.M.; Ilyas, R.A.; Asyraf, M.R.M.; Rahimian Koloor, S.S.; Petrů, M. Micro- and Nanocellulose in Polymer Composite Materials: A Review. Polymers 2021, 13, 231. [Google Scholar] [CrossRef]
- Li, M.; Pu, Y.; Thomas, V.M.; Yoo, C.G.; Ozcan, S.; Deng, Y.; Nelson, K.; Ragauskas, A.J. Recent advancements of plant-based natural fiber–reinforced composites and their applications. Compos. B Eng. 2020, 200, 108254. [Google Scholar] [CrossRef]
- Jose, S.; Shanumon, P.S.; Paul, A.; Mathew, J.; Thomas, S. Physico-Mechanical, Thermal, Morphological, and Aging Characteristics of Green Hybrid Composites Prepared from Wool-Sisal and Wool-Palf with Natural Rubber. Polymers 2022, 14, 4882. [Google Scholar] [CrossRef]
- Dani, M.S.H.; Venkateshwaran, N. Role of Surface Functionalized Crystalline Nano-silica on Mechanical, Fatigue and Drop Load Impact Damage Behaviour of Effective Stacking Sequenced E-glass Fibre-reinforced Epoxy Resin Composite. Silicon 2013, 20, 757–766. [Google Scholar] [CrossRef]
- Park, C.H.; Lee, W.I. Compression Molding in Polymer Matrix Composites. In Manufacturing Techniques for Polymer Matrix Composites (PMCs); Woodhead Publishing Limited: New Delhi, India, 2012; pp. 47–94. [Google Scholar]
- Kim, H.-S.; Chang, S.-H. Simulation of compression moulding process for long-fibre reinforced thermoset composites considering fibre bending. Compos. Struct. 2019, 230, 111514. [Google Scholar] [CrossRef]
- Boobalan, V.; Sathish, T.; Al-Enizi, A.M.; Pandit, B.; Gupta, M.; Prakash, C. Evaluation of mechanical and erosive wear properties of hybrid nano composites basalt/E-glass fiber + MWCNTs/SiO2. J. King Saud Univ. Sci. 2024, 36, 103148. [Google Scholar] [CrossRef]
- Saravanana, K.; Dhurai, B. Effect of process parameters on impact strength of short jute fibre reinforced polypropylene composite board. Ind. J. Fibre Text. Res. 2013, 38, 92–95. [Google Scholar]
- Ekrem, M.; Düzcükoğlu, H.; Şenyurt, M.A.; Şahin, Ö.S.; Avcı, A. Friction and Wear Performance of Epoxy Resin Reinforced With Boron Nitride Nanoplatelets. J. Tribol. 2017, 140, 022001. [Google Scholar] [CrossRef]
- Şahin, Y.; Patrick, D.B. Effects of nano-Al2O3 and PTFE fillers on tribological property of basalt fabric-reinforced epoxy composites. Tribol. Mater. Surf. Inter. 2021, 15, 258–277. [Google Scholar] [CrossRef]
- Krishnaraj, M.; Arun, R.; Vaitheeswaran, T. Fabrication and Wear Characteristics Basalt Fiber Reinforced Polypropylene Matrix Composites; SAE Technical Papers on CD-ROM/SAE Technical Paper Series; SAE International: Warrendale, PA, USA, 2019. [Google Scholar]
- Satapathy, A.; Patnaik, A. Analysis of Dry Sliding Wear Behavior of Red Mud Filled Polyester Composites using the Taguchi Method. J. Reinf. Plast. Compos. 2008, 29, 2883–2897. [Google Scholar] [CrossRef]
- Athith, D.; Sanjay, M.R.; Gowda, T.Y.; Madhu, P.; Arpitha, G.; Yogesha, B.; Omri, M.A. Effect of tungsten carbide on mechanical and tribological properties of jute/sisal/E-glass fabrics reinforced natural rubber/epoxy composites. J. Ind. Text. 2017, 48, 713–737. [Google Scholar] [CrossRef]
- Mohanavel, V.; Kumar, S.S.; Vairamuthu, J.; Ganeshan, P.; NagarajaGanesh, B. Influence of Stacking Sequence and Fiber Content on the Mechanical Properties of Natural and Synthetic Fibers Reinforced Penta-Layered Hybrid Composites. J. Nat. Fibers 2021, 19, 5258–5270. [Google Scholar] [CrossRef]
- Fiore, V.; Di Bella, G.; Valenza, A. The effect of alkaline treatment on mechanical properties of kenaf fibers and their epoxy composites. Compos. B Eng. 2014, 68, 14–21. [Google Scholar] [CrossRef]
- ASTM International. ASTM D792-13; Standard Test Methods for Density and Specific Gravity (Relative Density) of Plastics by Displacement. ASTM International: West Conshohocken, PA, USA, 2013. [CrossRef]
- ASTM International. ASTM E384-17; Standard Test Method for Microindentation Hardness of Materials. ASTM International: West Conshohocken, PA, USA, 2017. [CrossRef]
- ASTM International. ASTM D4812-19e1; Standard Test Method for Unnotched Cantilever Beam Impact Resistance of Plastics. ASTM International: West Conshohocken, PA, USA, 2019. [CrossRef]
- ASTM International. ASTM D790-17; Standard Test Methods for Flexural Properties of Unreinforced and Reinforced Plastics and Electrical Insulating Materials. ASTM International: West Conshohocken, PA, USA, 2017. [CrossRef]
- ASTM International. ASTM D3410/D3410M-16(2024); Standard Test Method for Compressive Properties of Polymer Matrix Composite Materials with Unsupported Gage Section by Shear Loading. ASTM International: West Conshohocken, PA, USA, 2024. [CrossRef]
- ASTM International. ASTM G99-23; Standard Test Method for Wear and Friction Testing with a Pin-on-Disk or Ball-on-Disk Apparatus. ASTM International: West Conshohocken, PA, USA, 2023. [CrossRef]
- Shivamurthy, B.; Anandhan, S.; Bhat, K.U.; Thimmappa, B.H.S. Structure-property relationship of glass fabric/MWCNT/epoxy multi-layered laminates. Compos. Commun. 2020, 22, 100460. [Google Scholar] [CrossRef]
- Guo, P.; Chen, X.; Gao, X.; Song, H.; Shen, H. Fabrication and mechanical properties of well-dispersed multiwalled carbon nanotubes/epoxy composites. Compo. Sci. Tech. 2007, 67, 3331–3337. [Google Scholar] [CrossRef]
- Agarwal, B.D.; Broutman, L.J.; Chandrashekhara, K. Analysis and Performance of Fiber Composites, 3rd ed.; John Wiley & Sons: New Delhi, India, 2006; pp. 1–576. [Google Scholar]
- Ozsoy, İ.; Mimaroglu, A.; Ünal, H. Influence of micro- and nanofiller contents on friction and wear behavior of epoxy composites. Sci. Eng. Compos. Mater. 2017, 24, 485–494. [Google Scholar] [CrossRef]
- Raajeshkrishna, C.R.; Chandramohan, P.; Obadele, A.B. Friction and thermo mechanical characterization of nano basalt reinforced epoxy composites. Int. J. Polym. Anal. Charact. 2021, 26, 425–439. [Google Scholar] [CrossRef]


| Sl. No. | Factors | Values |
|---|---|---|
| 1 | wWt. % of MoS2 | 0, 4, 8, 12 |
| 2 | ‘P’ (N) | 5, 10, 15, 20 |
| 3 | ‘V’ (m/s) | 1.0, 1.5, 2.0, 2.5 |
| 4 | ‘D’ (m) | 500, 750, 1000, 1250 |
| Exp. No. | % of MoS2 | ‘P’ (N) | ‘V’ (m/s) | ‘D’ (m) | SWR X 10-4 (mm3/Nm) | COF | SN Ratio (SWR) | Mean (SWR) | SN Ratio (COF) | Mean (COF) |
|---|---|---|---|---|---|---|---|---|---|---|
| (A) | (B) | (C) | (D) | |||||||
| 1 | 0 | 5 | 1.0 | 500 | 11.3333 | 0.60 | −18.0874 | 5.9466 | 4.4370 | 0.60 |
| 2 | 0 | 10 | 1.5 | 750 | 4.5925 | 0.57 | −10.2996 | 2.5863 | 4.8825 | 0.57 |
| 3 | 0 | 15 | 2.0 | 1000 | 2.7777 | 0.49 | −6.0617 | 1.6888 | 6.1961 | 0.49 |
| 4 | 0 | 20 | 2.5 | 1250 | 2.3777 | 0.44 | −4.8261 | 1.5138 | 7.1309 | 0.44 |
| 5 | 4 | 5 | 1.5 | 1000 | 4.9119 | 0.58 | −10.8670 | 2.7260 | 4.7314 | 0.58 |
| 6 | 4 | 10 | 1.0 | 1250 | 2.0057 | 0.39 | −3.2045 | 1.2028 | 8.1787 | 0.39 |
| 7 | 4 | 15 | 2.5 | 500 | 3.8886 | 0.55 | −8.8857 | 2.2410 | 5.1927 | 0.55 |
| 8 | 4 | 20 | 2.0 | 750 | 2.3536 | 0.43 | −4.6163 | 1.4268 | 7.3306 | 0.43 |
| 9 | 8 | 5 | 2.0 | 1250 | 3.2625 | 0.52 | −7.3869 | 1.9112 | 5.6799 | 0.52 |
| 10 | 8 | 10 | 2.5 | 1000 | 1.9442 | 0.70 | −3.0428 | 1.2221 | 3.0980 | 0.70 |
| 11 | 8 | 15 | 1.0 | 750 | 1.6860 | 0.35 | −1.7649 | 1.0430 | 9.1186 | 0.35 |
| 12 | 8 | 20 | 1.5 | 500 | 2.6081 | 0.46 | −5.4436 | 1.5290 | 6.7448 | 0.46 |
| 13 | 12 | 5 | 2.5 | 750 | 2.0263 | 0.40 | −3.2181 | 1.1631 | 7.9588 | 0.40 |
| 14 | 12 | 10 | 2.0 | 500 | 2.8875 | 0.50 | −6.2828 | 1.6437 | 6.0206 | 0.50 |
| 15 | 12 | 15 | 1.5 | 1250 | 0.8308 | 0.32 | 3.9721 | 0.5820 | 9.8970 | 0.32 |
| 16 | 12 | 20 | 1.0 | 1000 | 0.8168 | 0.30 | 4.2178 | 0.5584 | 10.4576 | 0.30 |
| Level | Wt. % of MoS2 | ‘P’ (N) | ‘V’ (m/s) | ‘D’ (m) |
|---|---|---|---|---|
| 1 | −9.8187 | −9.8899 | −4.7098 | −9.6749 |
| 2 | −6.8934 | −5.7074 | −5.6595 | −4.9747 |
| 3 | −4.4096 | −3.1850 | −6.0869 | −3.9384 |
| 4 | −0.3278 | −2.6671 | −4.9932 | −2.8613 |
| Delta | 9.4909 | 7.2228 | 1.3771 | 6.8135 |
| Rank | 1 | 2 | 4 | 3 |
| Level | Wt. % of MoS2 | ‘P’ (N) | ‘V’ (m/s) | ‘D’ (m) |
|---|---|---|---|---|
| 1 | 2.9339 | 2.9368 | 2.1877 | 2.8401 |
| 2 | 1.8992 | 1.6638 | 1.8559 | 1.5548 |
| 3 | 1.4264 | 1.3887 | 1.6677 | 1.5489 |
| 4 | 0.9869 | 1.2571 | 1.5350 | 1.3025 |
| Delta | 1.9471 | 1.6797 | 0.6527 | 1.5376 |
| Rank | 1 | 2 | 4 | 3 |
| Level | wt. % of MoS2 | ‘P’ (N) | ‘V’ (m/s) | ‘D’ (m) |
|---|---|---|---|---|
| 1 | 5.662 | 5.702 | 8.048 | 5.599 |
| 2 | 6.358 | 5.545 | 6.564 | 7.323 |
| 3 | 6.160 | 7.601 | 6.307 | 6.121 |
| 4 | 8.583 | 7.916 | 5.845 | 7.722 |
| Delta | 2.922 | 2.371 | 2.203 | 2.123 |
| Rank | 1 | 2 | 3 | 4 |
| Level | wt. % of MoS2 | ‘P’ (N) | ‘V’ (m/s) | ‘D’ (m) |
|---|---|---|---|---|
| 1 | 0.5250 | 0.5250 | 0.4100 | 0.5275 |
| 2 | 0.4875 | 0.5400 | 0.4825 | 0.4375 |
| 3 | 0.5075 | 0.4275 | 0.4850 | 0.5175 |
| 4 | 0.3800 | 0.4075 | 0.5225 | 0.4175 |
| Delta | 0.1450 | 0.1325 | 0.1125 | 0.1100 |
| Rank | 1 | 2 | 3 | 4 |
| Source | DF | Adj SS | Adj MS | F-Value | p-Value |
|---|---|---|---|---|---|
| Wt. % of MoS2 | 3 | 29.579 | 9.860 | 4.62 | 0.120 |
| ‘P’ (N) | 3 | 28.151 | 9.384 | 4.40 | 0.127 |
| ‘V’ (m/s) | 3 | 4.487 | 1.496 | 0.70 | 0.611 |
| ‘D’ (m) | 3 | 22.821 | 7.607 | 3.57 | 0.162 |
| Error | 3 | 6.396 | 2.132 | ||
| Total | 15 | 91.433 |
| Source | DF | Adj SS | Adj MS | F-Value | p-Value |
|---|---|---|---|---|---|
| Wt. % of MoS2 | 3 | 0.05095 | 0.016983 | 4.03 | 0.141 |
| ‘P’ (N) | 3 | 0.05415 | 0.018050 | 4.28 | 0.132 |
| ‘V’ (m/s) | 3 | 0.02655 | 0.008850 | 2.10 | 0.279 |
| ‘D’ (m) | 3 | 0.03710 | 0.012367 | 2.93 | 0.200 |
| Error | 3 | 0.01265 | 0.004217 | ||
| Total | 15 | 0.18140 |
Disclaimer/Publisher’s Note: The statements, opinions and data contained in all publications are solely those of the individual author(s) and contributor(s) and not of MDPI and/or the editor(s). MDPI and/or the editor(s) disclaim responsibility for any injury to people or property resulting from any ideas, methods, instructions or products referred to in the content. |
© 2025 by the authors. Licensee MDPI, Basel, Switzerland. This article is an open access article distributed under the terms and conditions of the Creative Commons Attribution (CC BY) license (https://creativecommons.org/licenses/by/4.0/).
Share and Cite
P. C., S.K.; Ravichandran, M.; Mohanavel, V.; Radhika, N. Experimental Investigations on Microstructure, Properties and Wear Behavior of Chopped Basalt Fiber and Molybdenum Disulfide Reinforced Epoxy Matrix Composites. Polymers 2025, 17, 1371. https://doi.org/10.3390/polym17101371
P. C. SK, Ravichandran M, Mohanavel V, Radhika N. Experimental Investigations on Microstructure, Properties and Wear Behavior of Chopped Basalt Fiber and Molybdenum Disulfide Reinforced Epoxy Matrix Composites. Polymers. 2025; 17(10):1371. https://doi.org/10.3390/polym17101371
Chicago/Turabian StyleP. C., Santhosh Kumar, Manickam Ravichandran, Vinayagam Mohanavel, and Nachimuthu Radhika. 2025. "Experimental Investigations on Microstructure, Properties and Wear Behavior of Chopped Basalt Fiber and Molybdenum Disulfide Reinforced Epoxy Matrix Composites" Polymers 17, no. 10: 1371. https://doi.org/10.3390/polym17101371
APA StyleP. C., S. K., Ravichandran, M., Mohanavel, V., & Radhika, N. (2025). Experimental Investigations on Microstructure, Properties and Wear Behavior of Chopped Basalt Fiber and Molybdenum Disulfide Reinforced Epoxy Matrix Composites. Polymers, 17(10), 1371. https://doi.org/10.3390/polym17101371