
Influence of Crosslink Density on Electrical Performance and Rheological Properties of Crosslinked Polyethylene

Abstract
1. Introduction
2. Experimental Details
2.1. Sample Preparation
2.2. Crosslinking Degree Measurement
2.3. Branching Degree Measurement
2.4. Melt Crystallization Analysis
2.5. Rheological Behavior Study
2.6. Thermal Analysis
2.7. Crystalline Performance Analysis
2.8. Space Charge Analysis
3. Results and Discussion
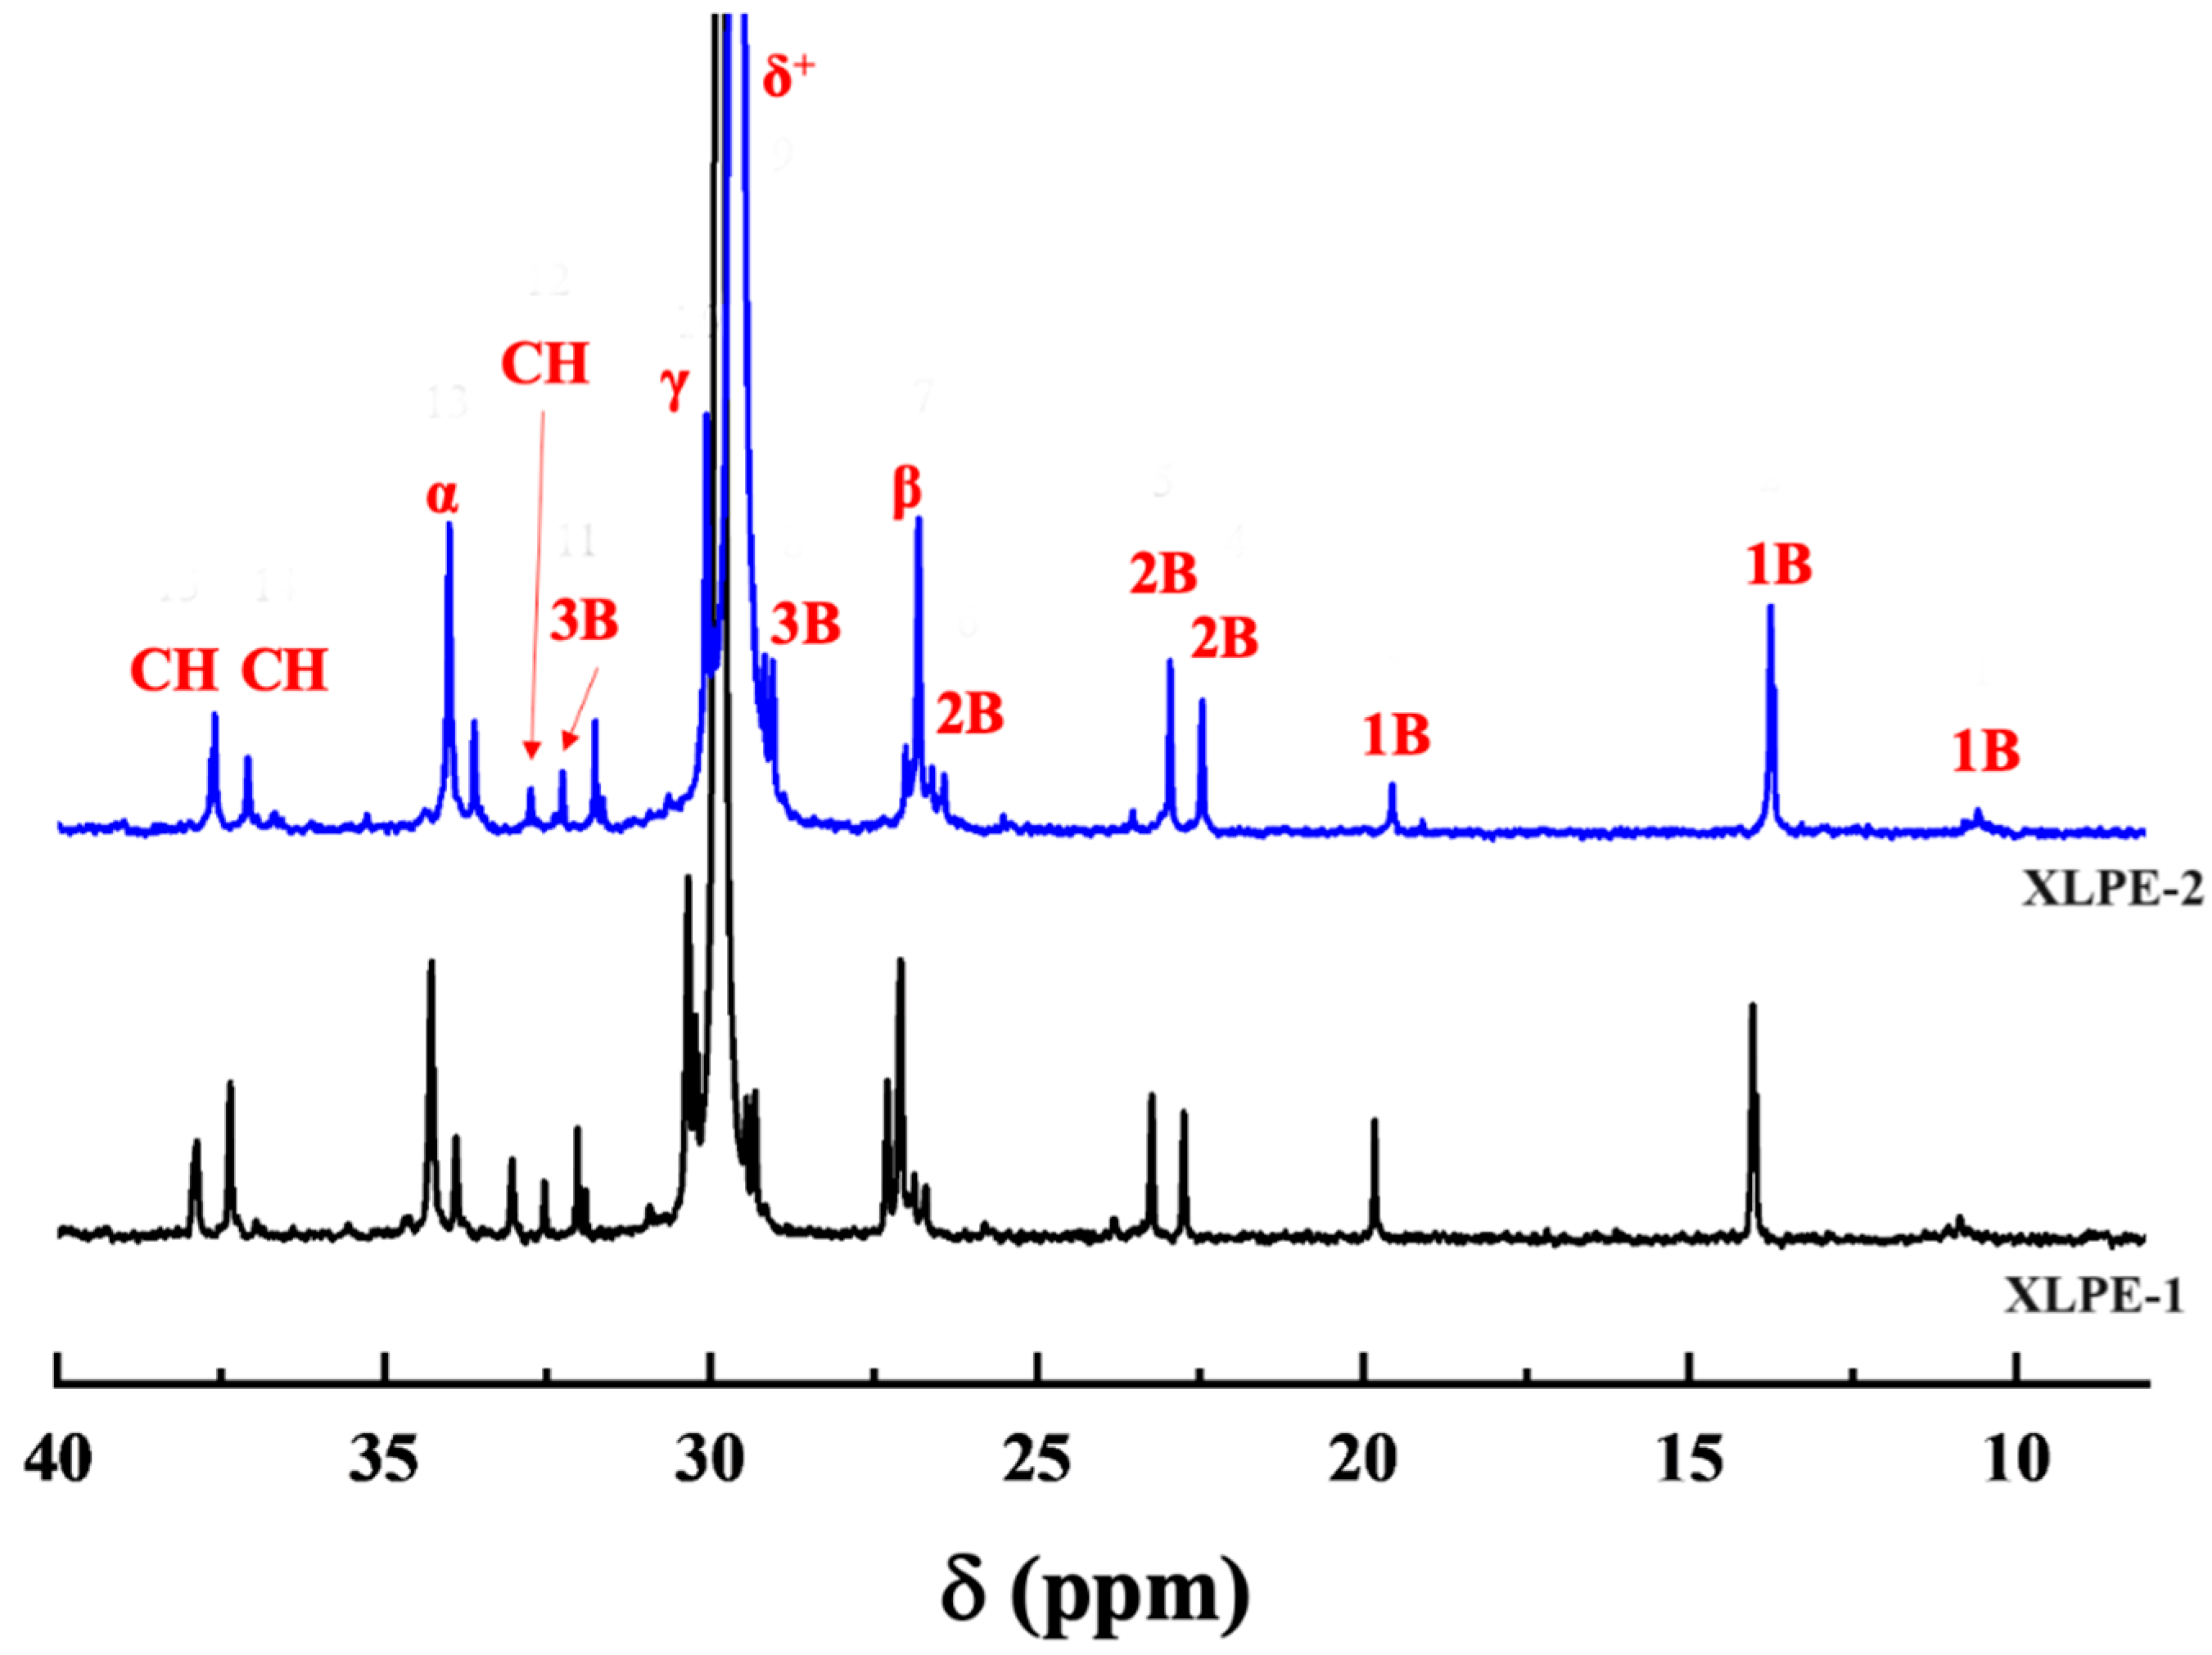
3.1. Degree of Branching
3.2. PLM
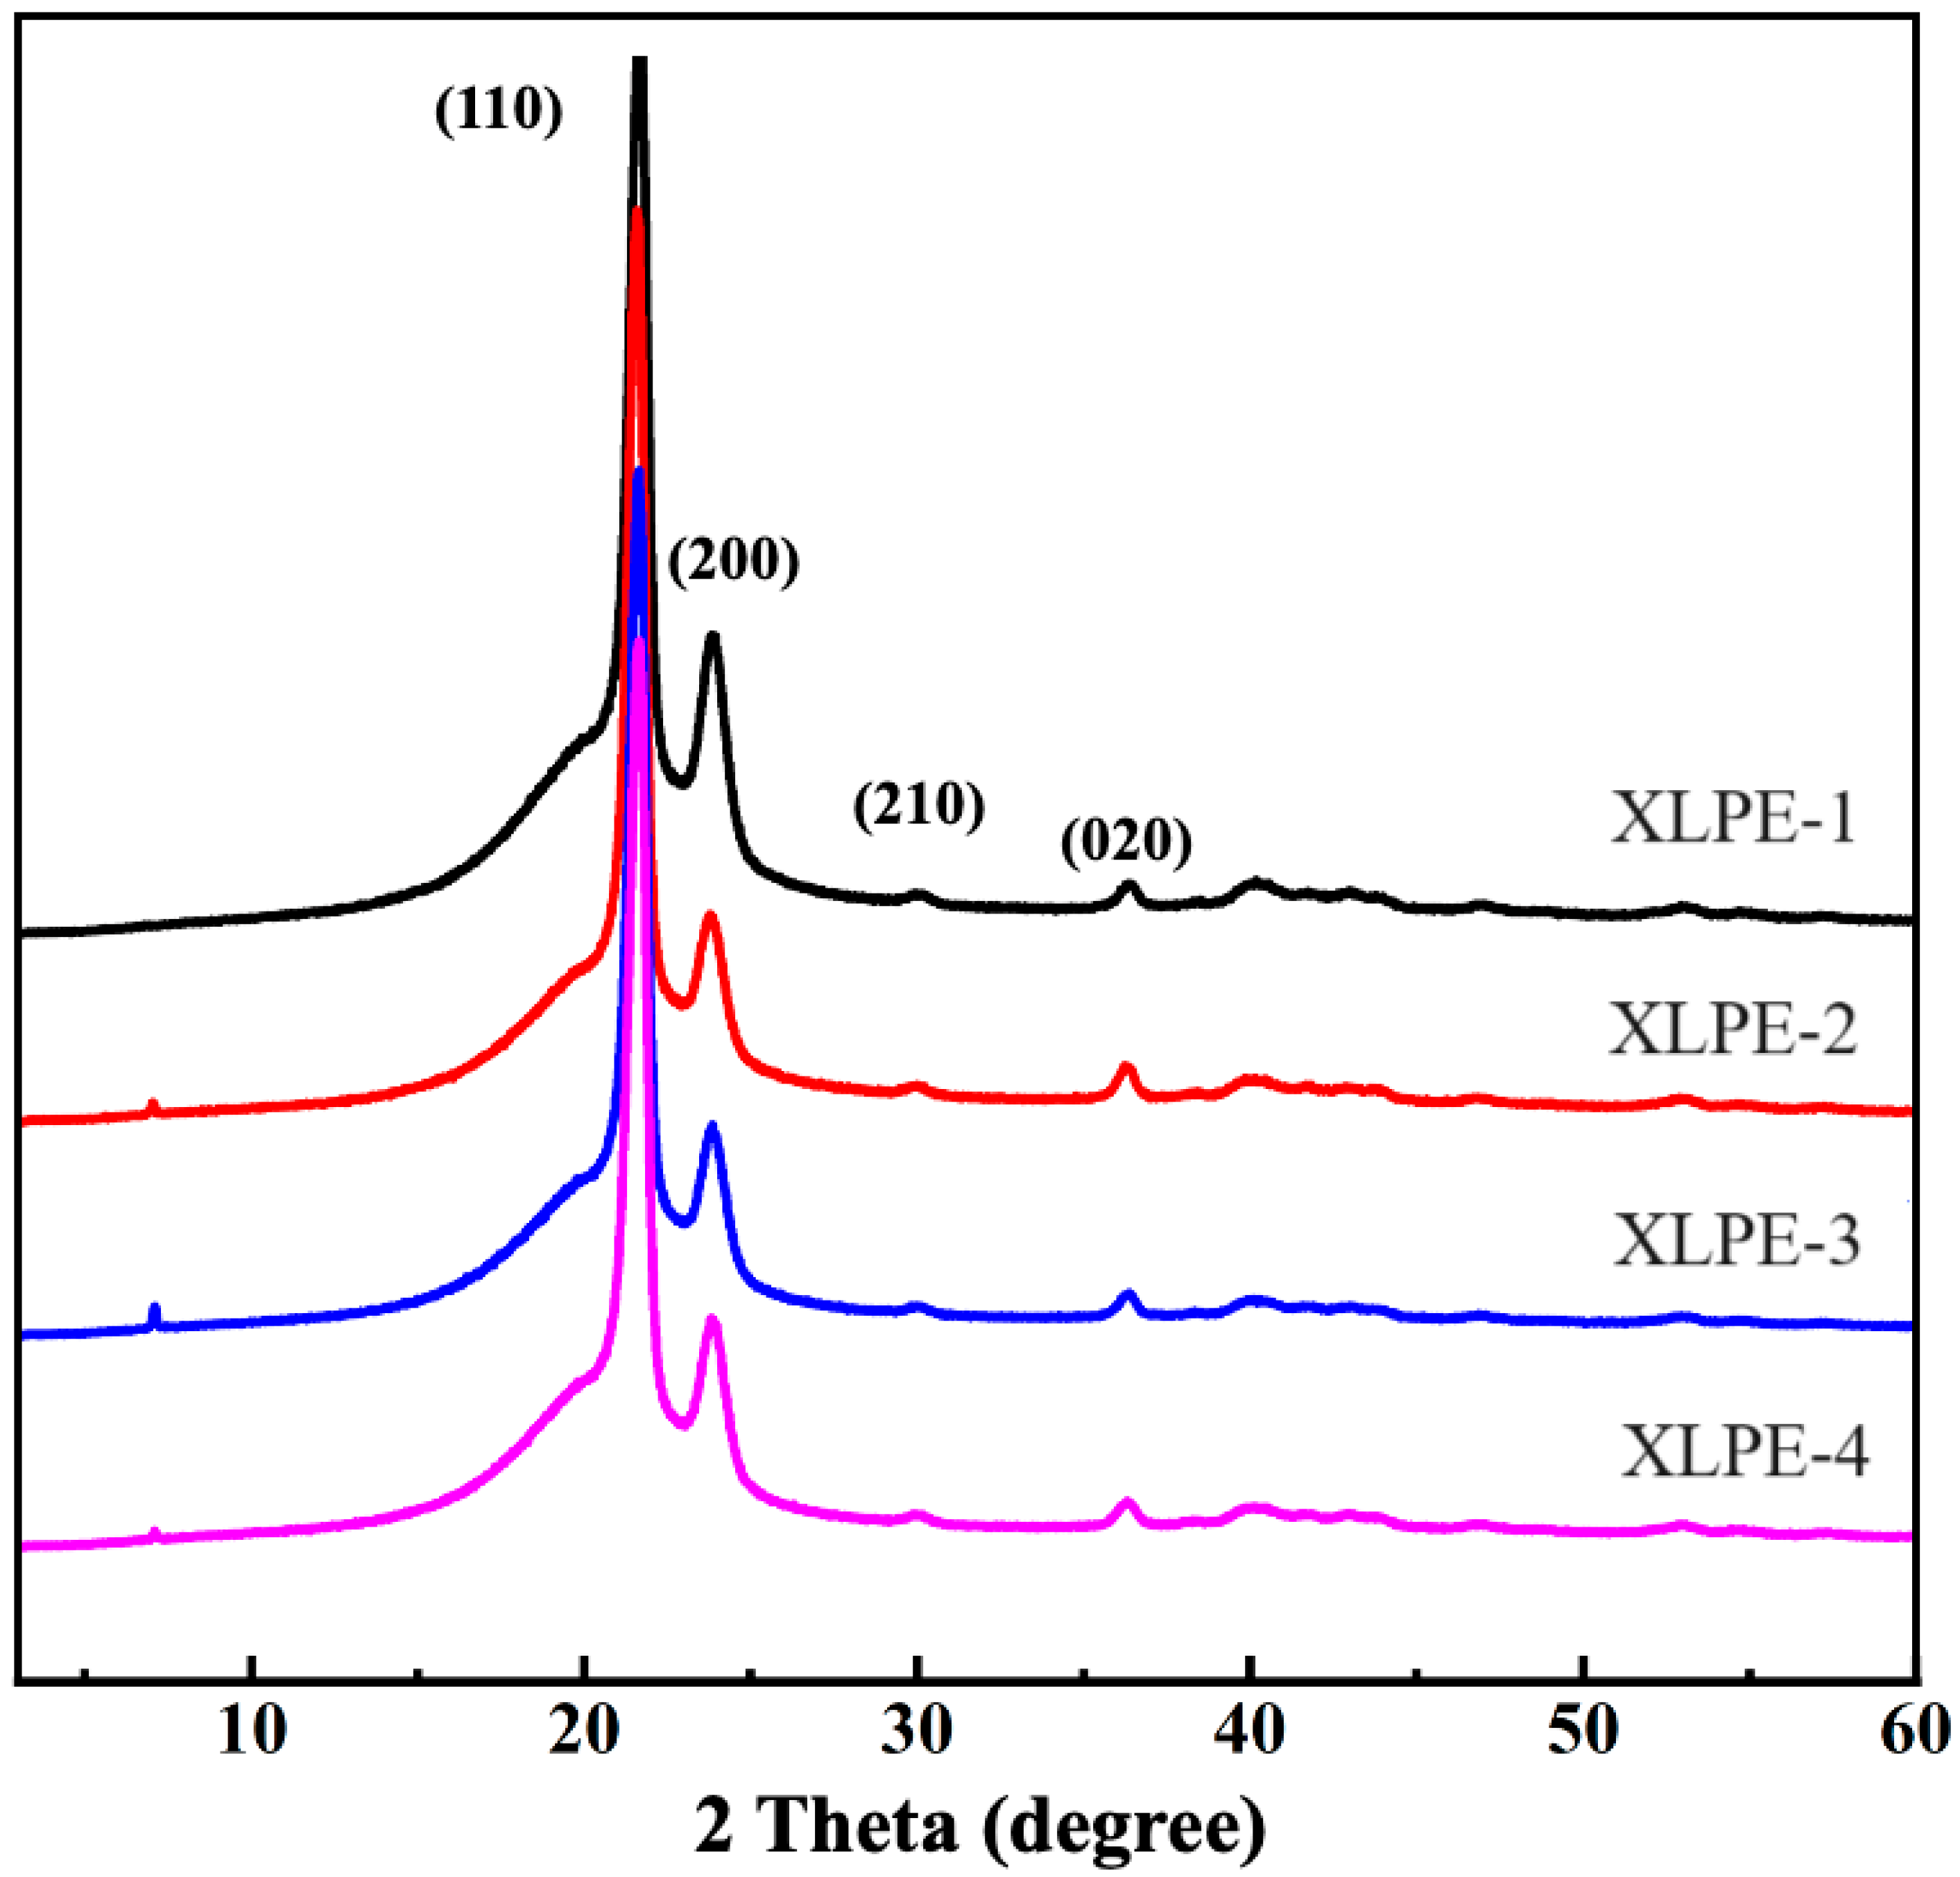
3.3. XRD
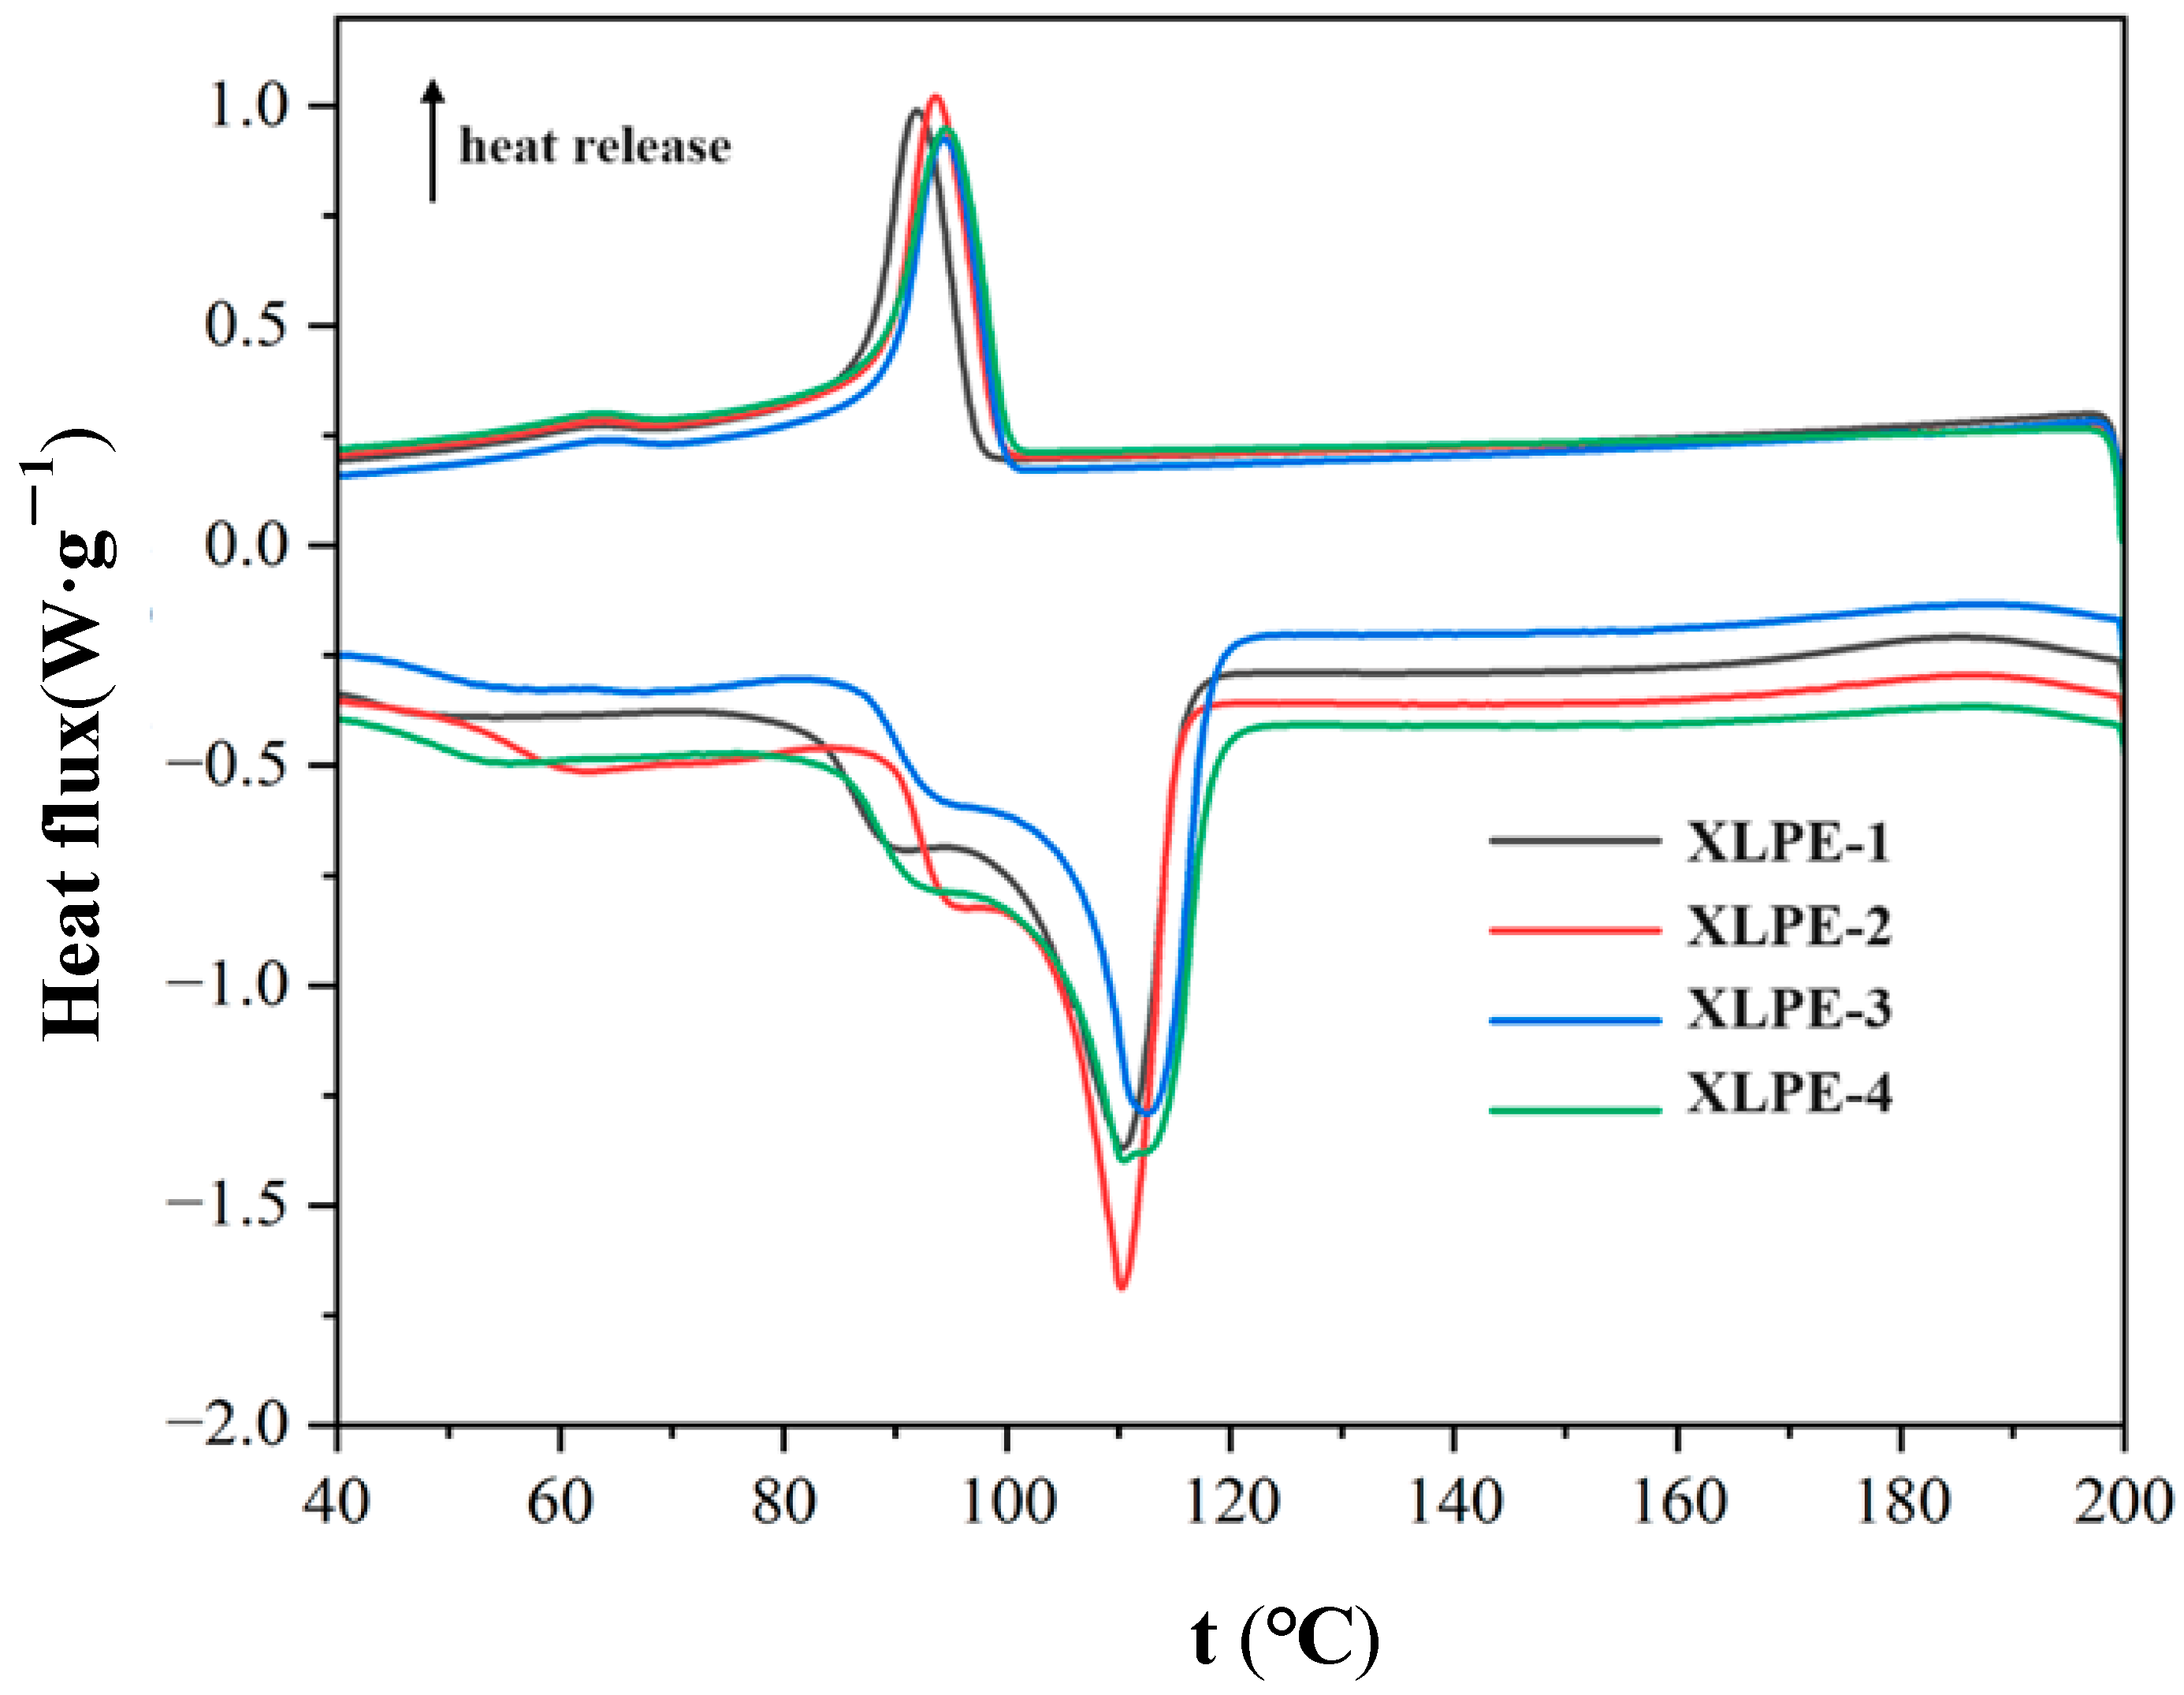
3.4. Thermal Properties
3.5. Crosslinking Degree Measurement
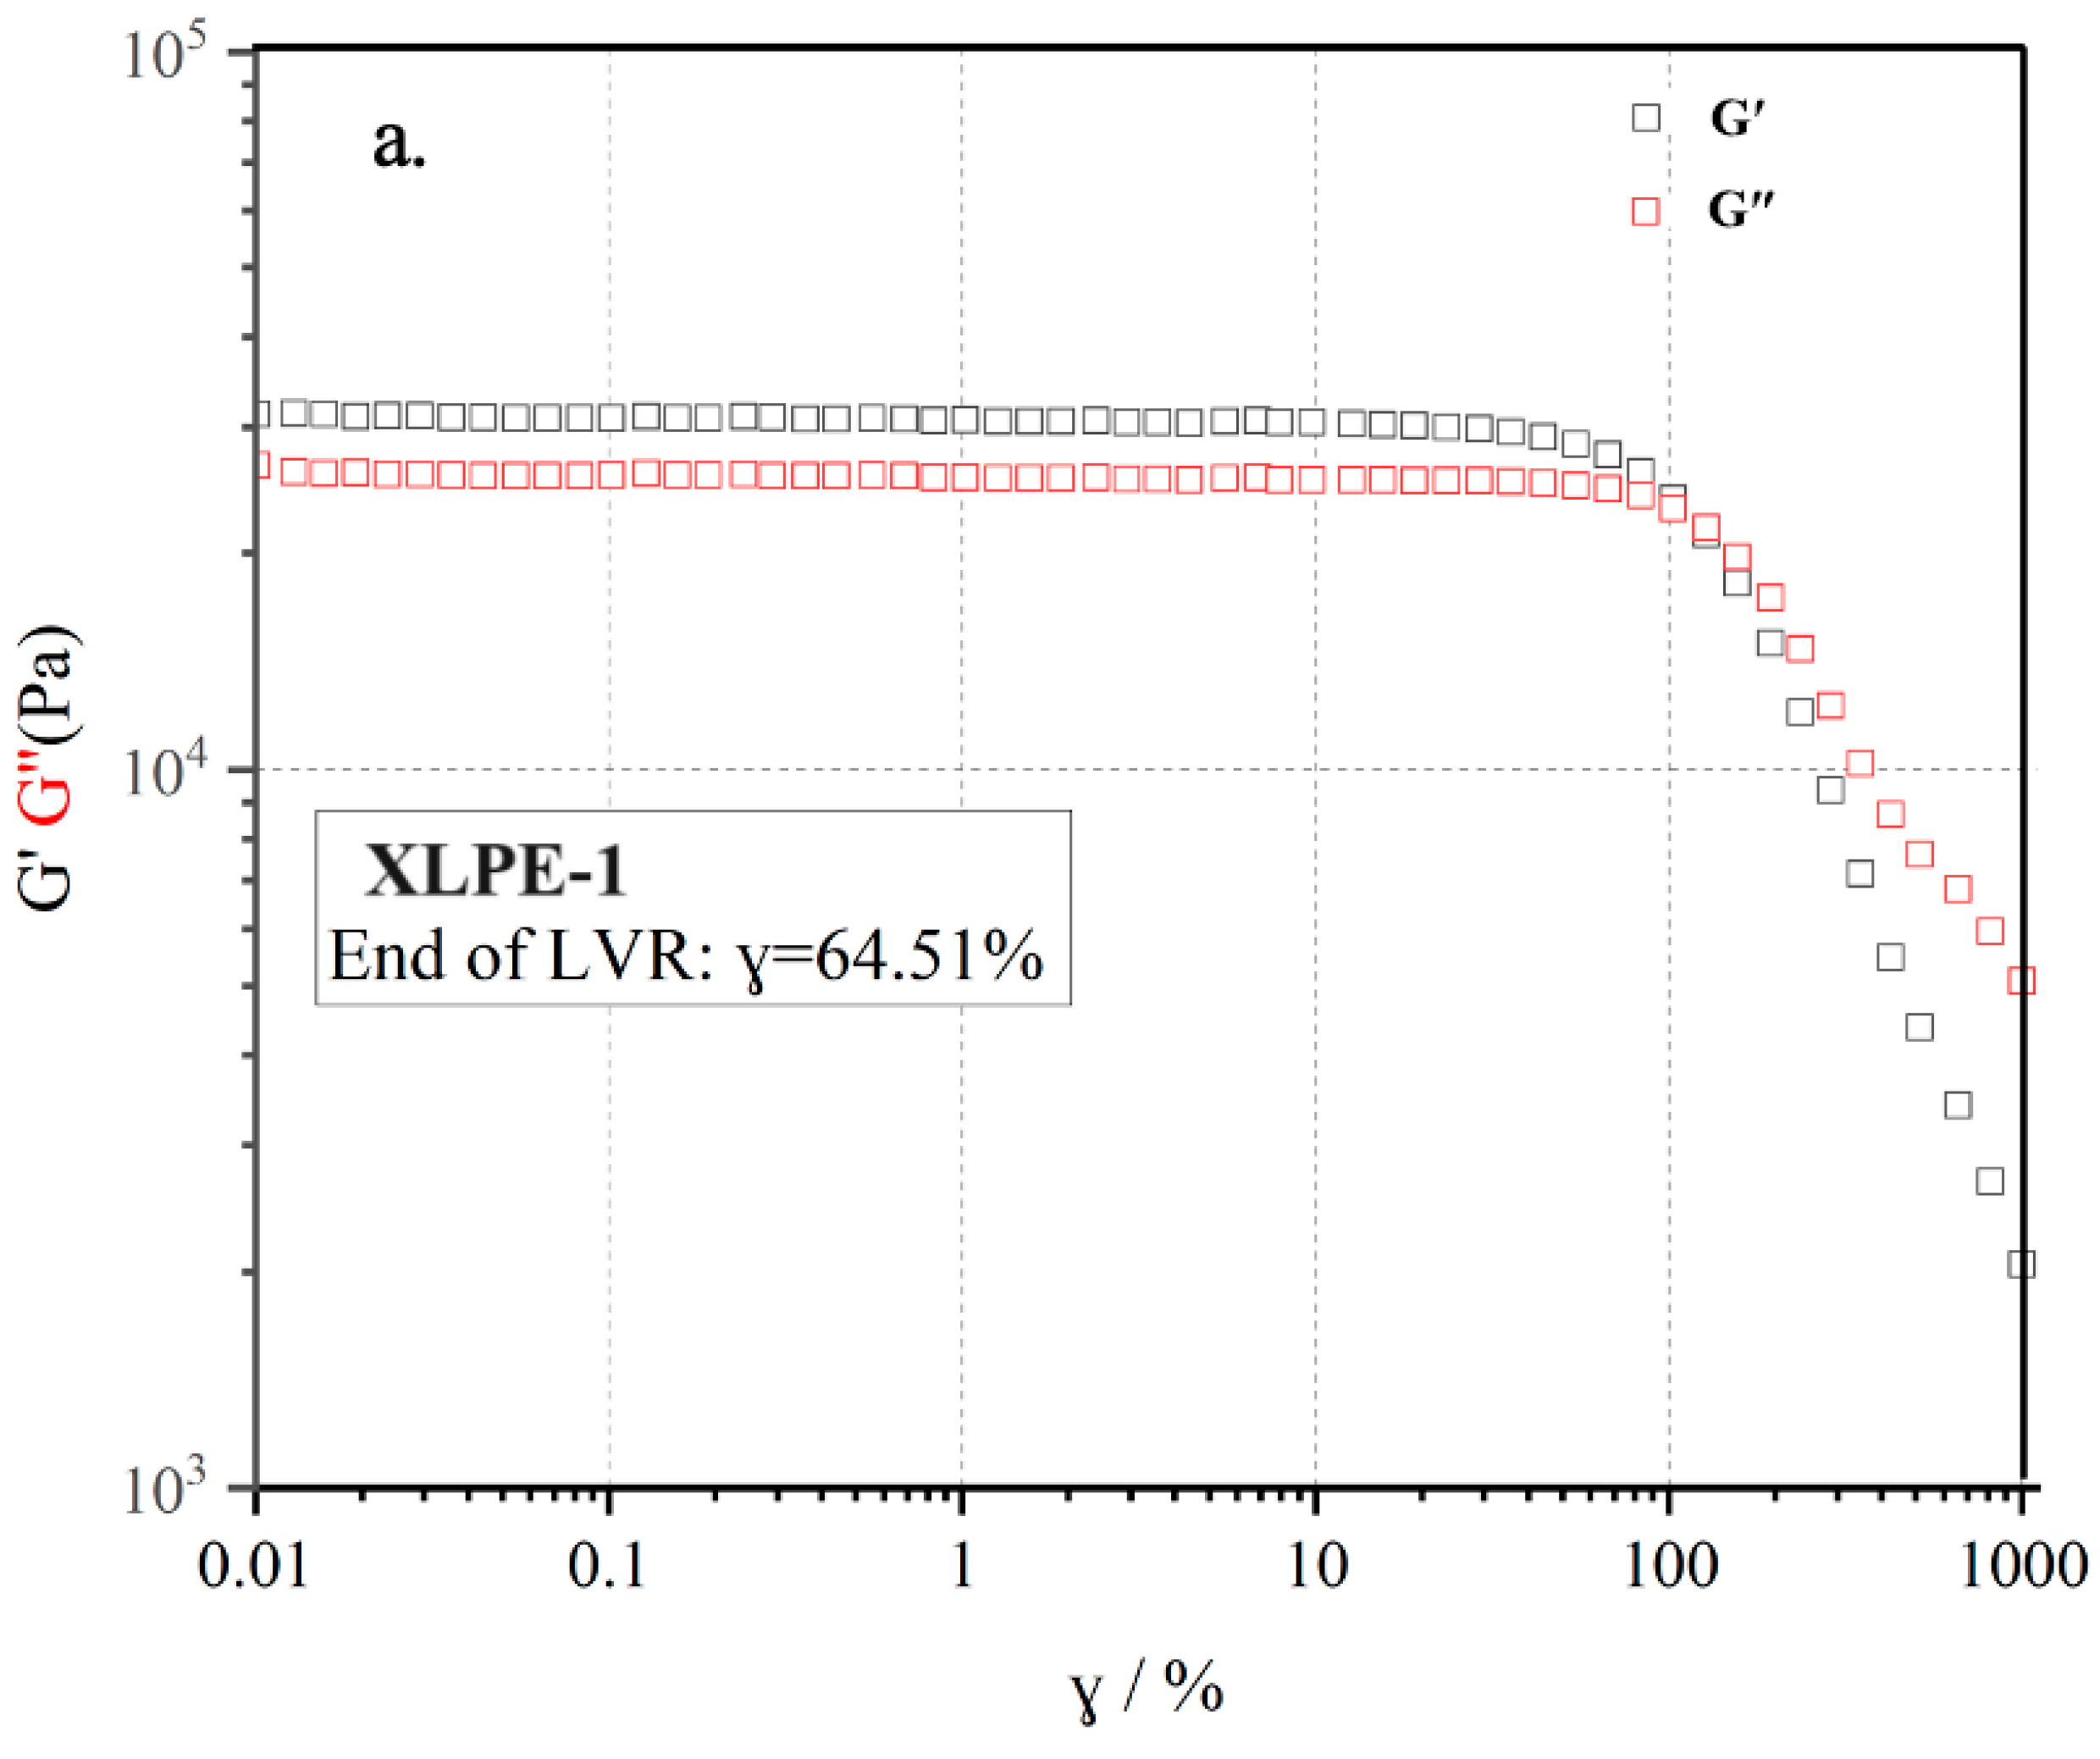
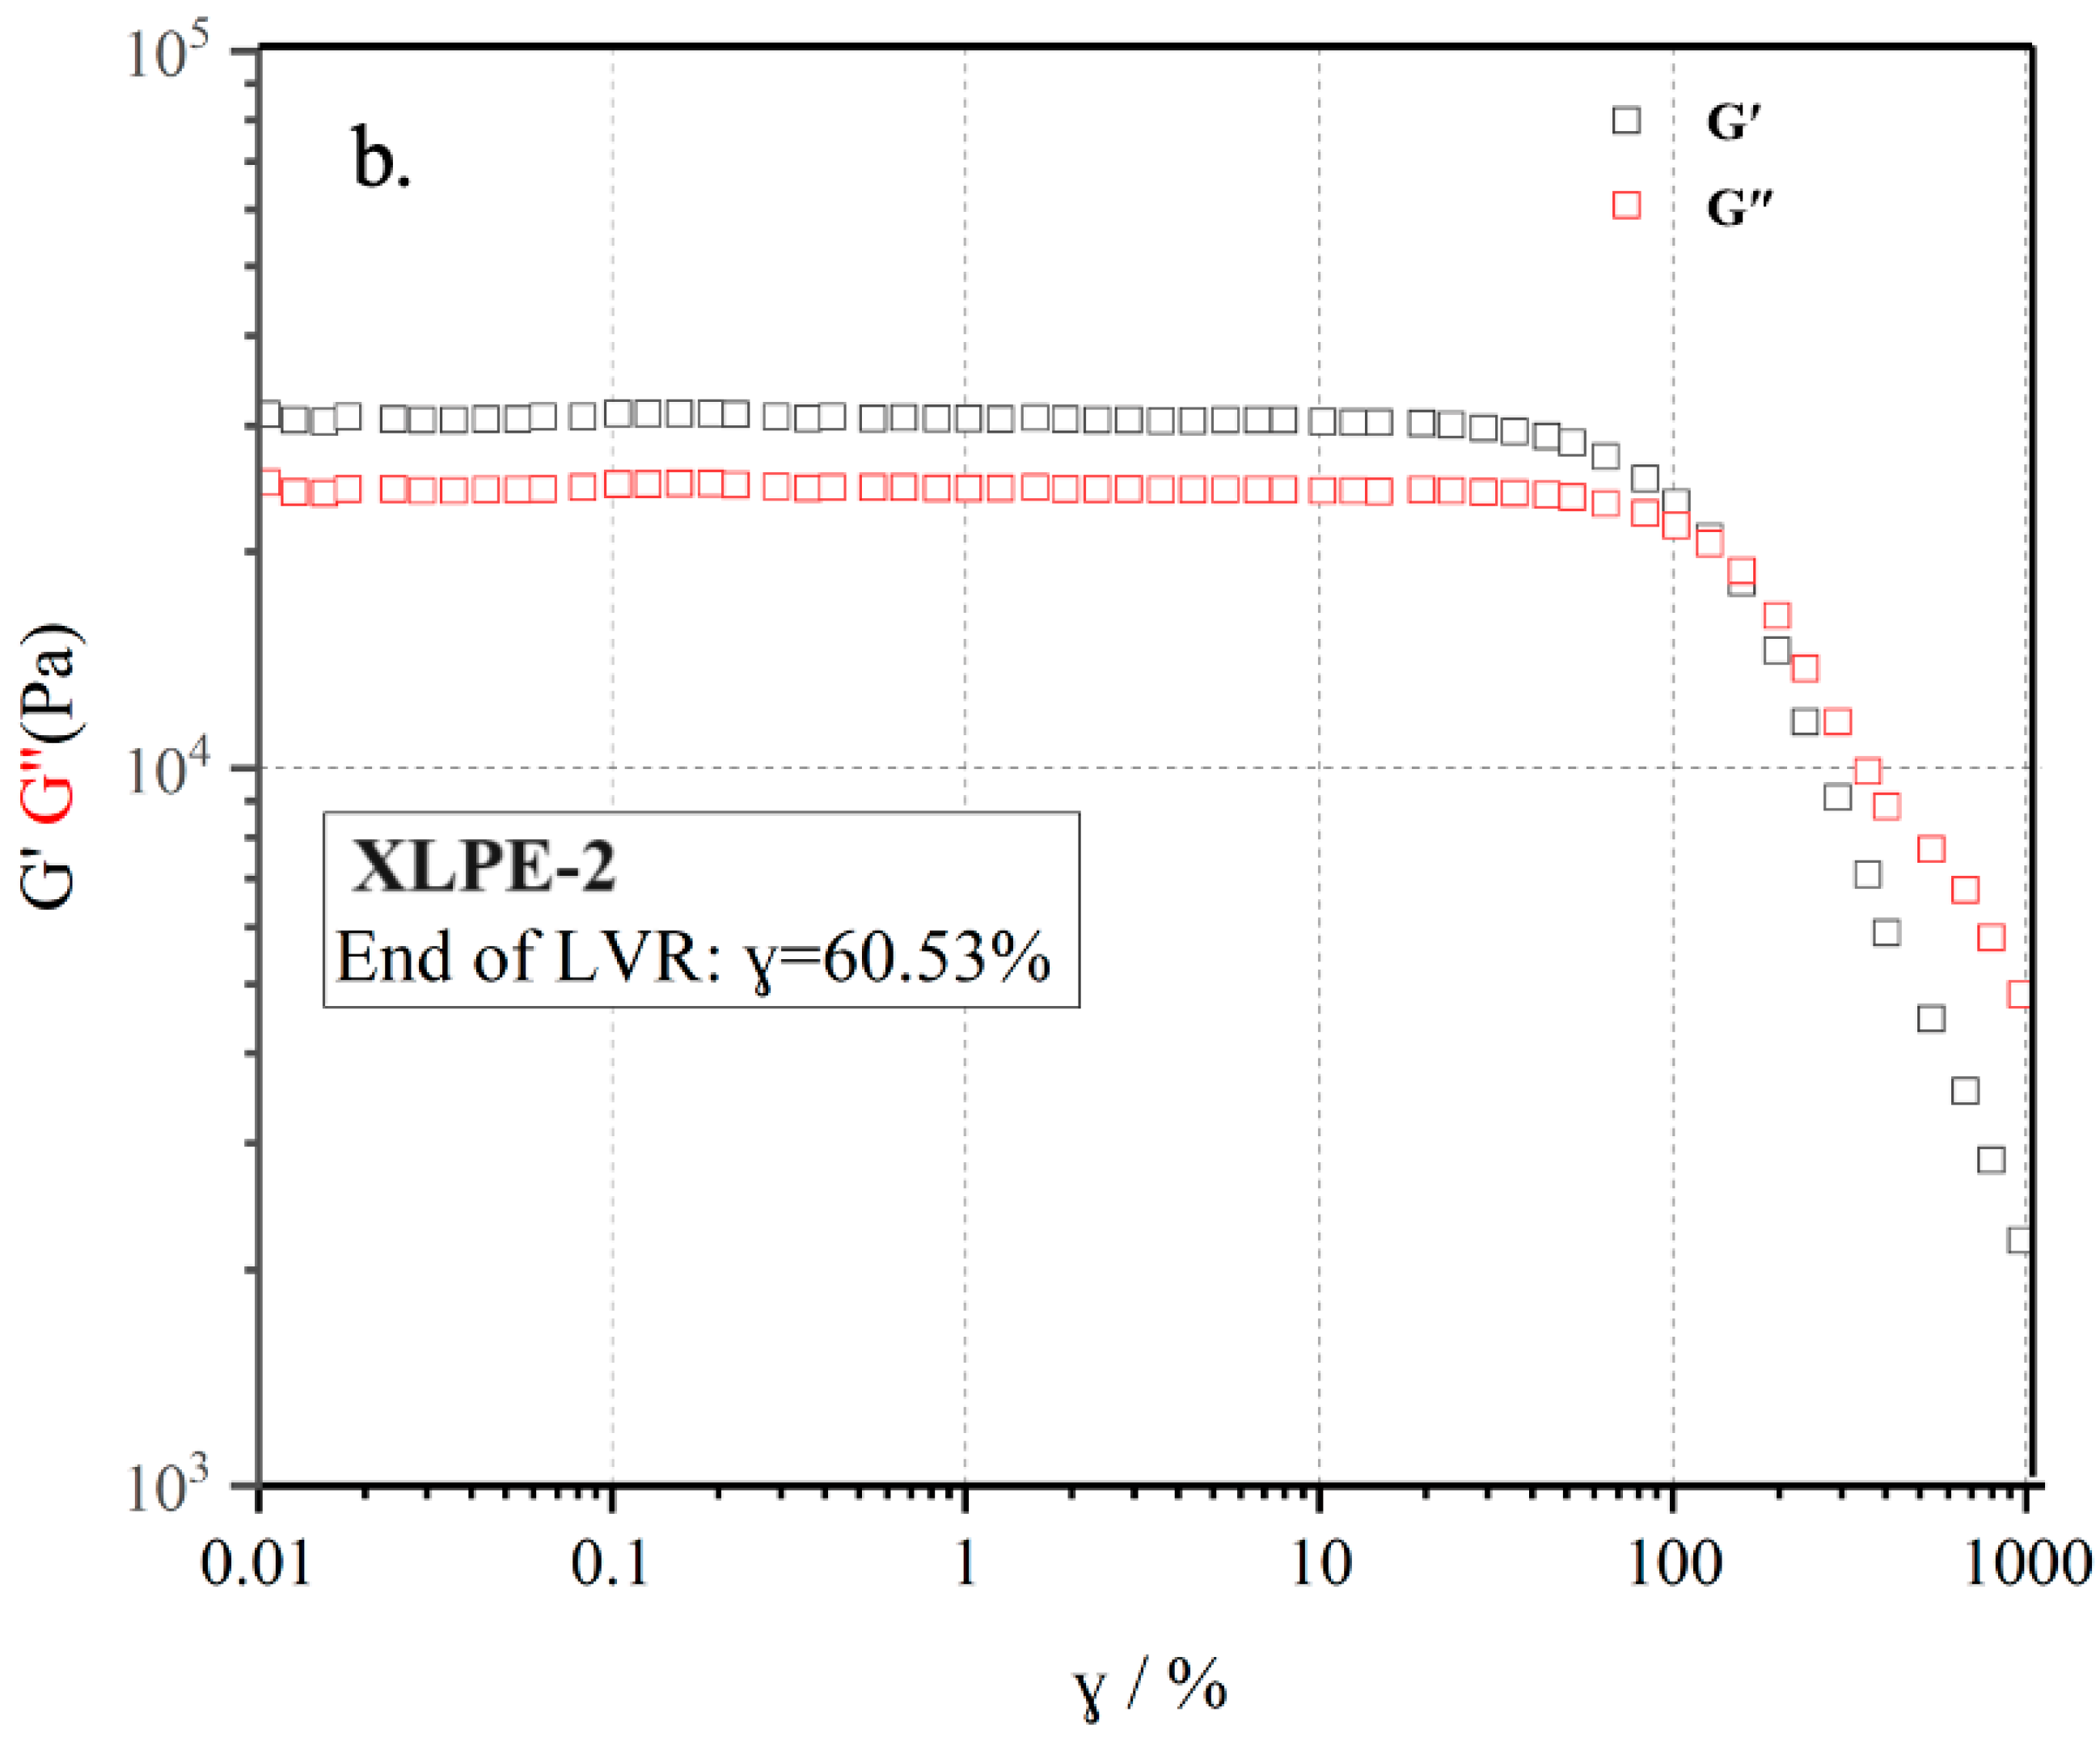
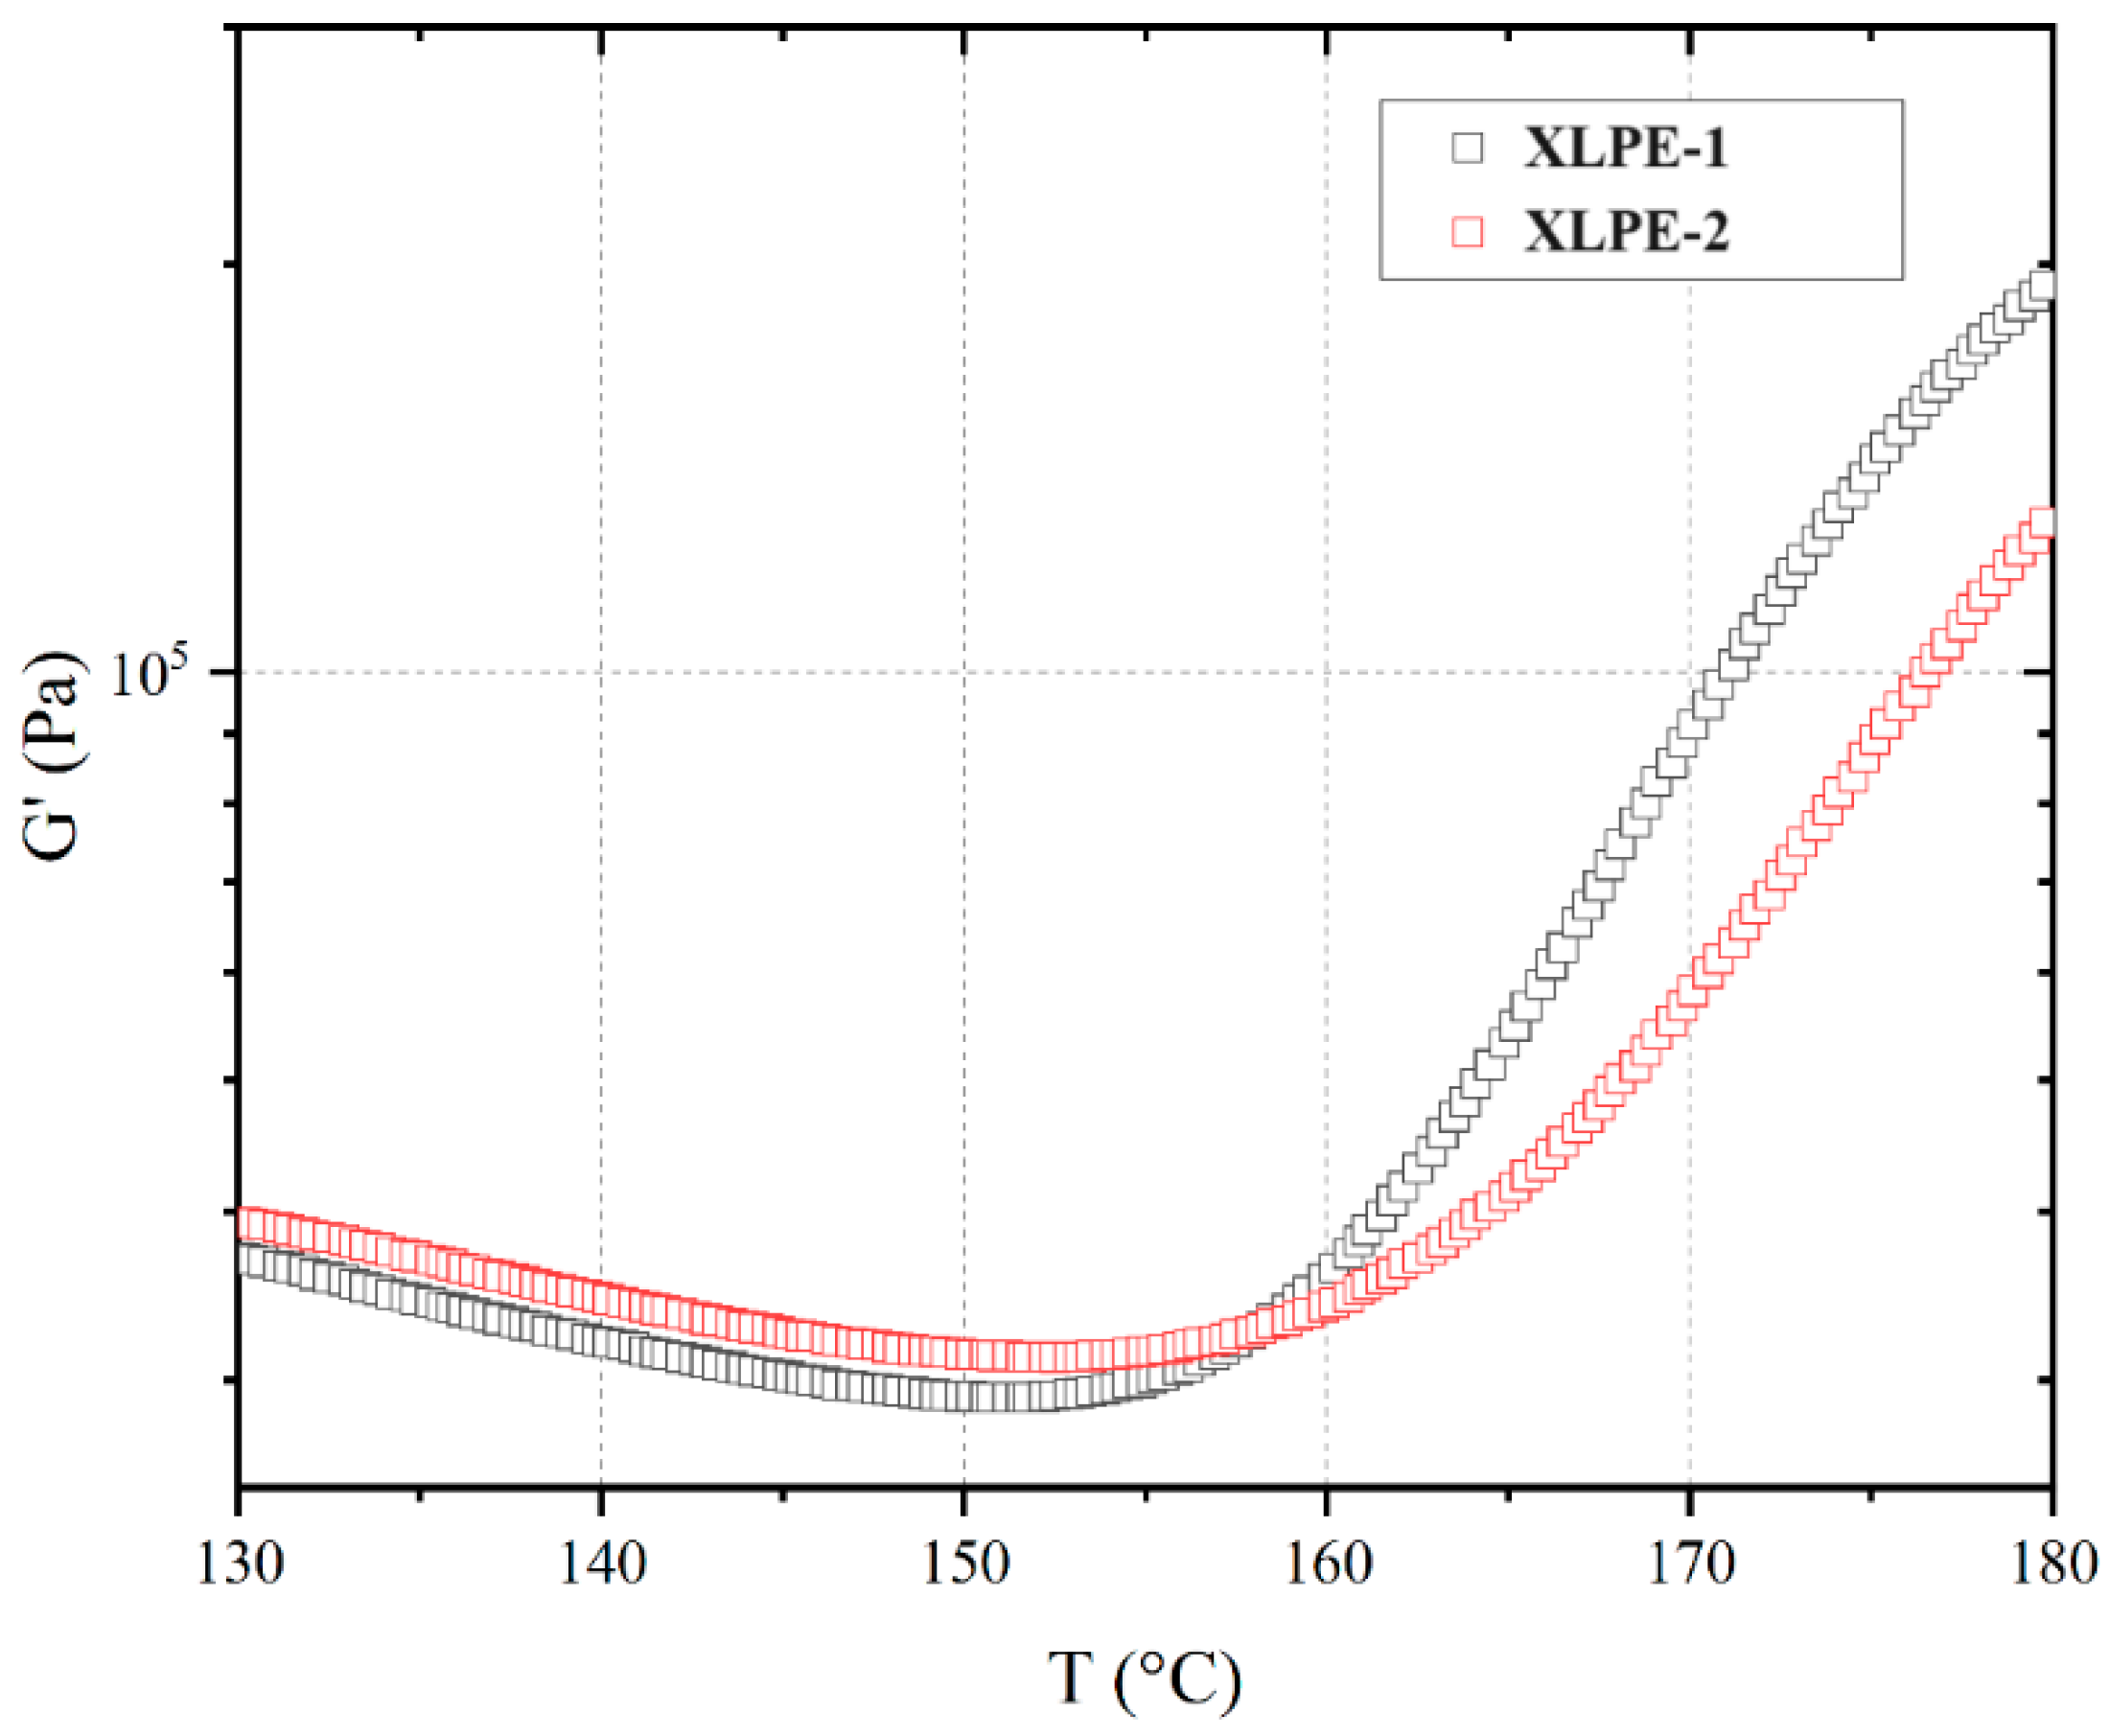
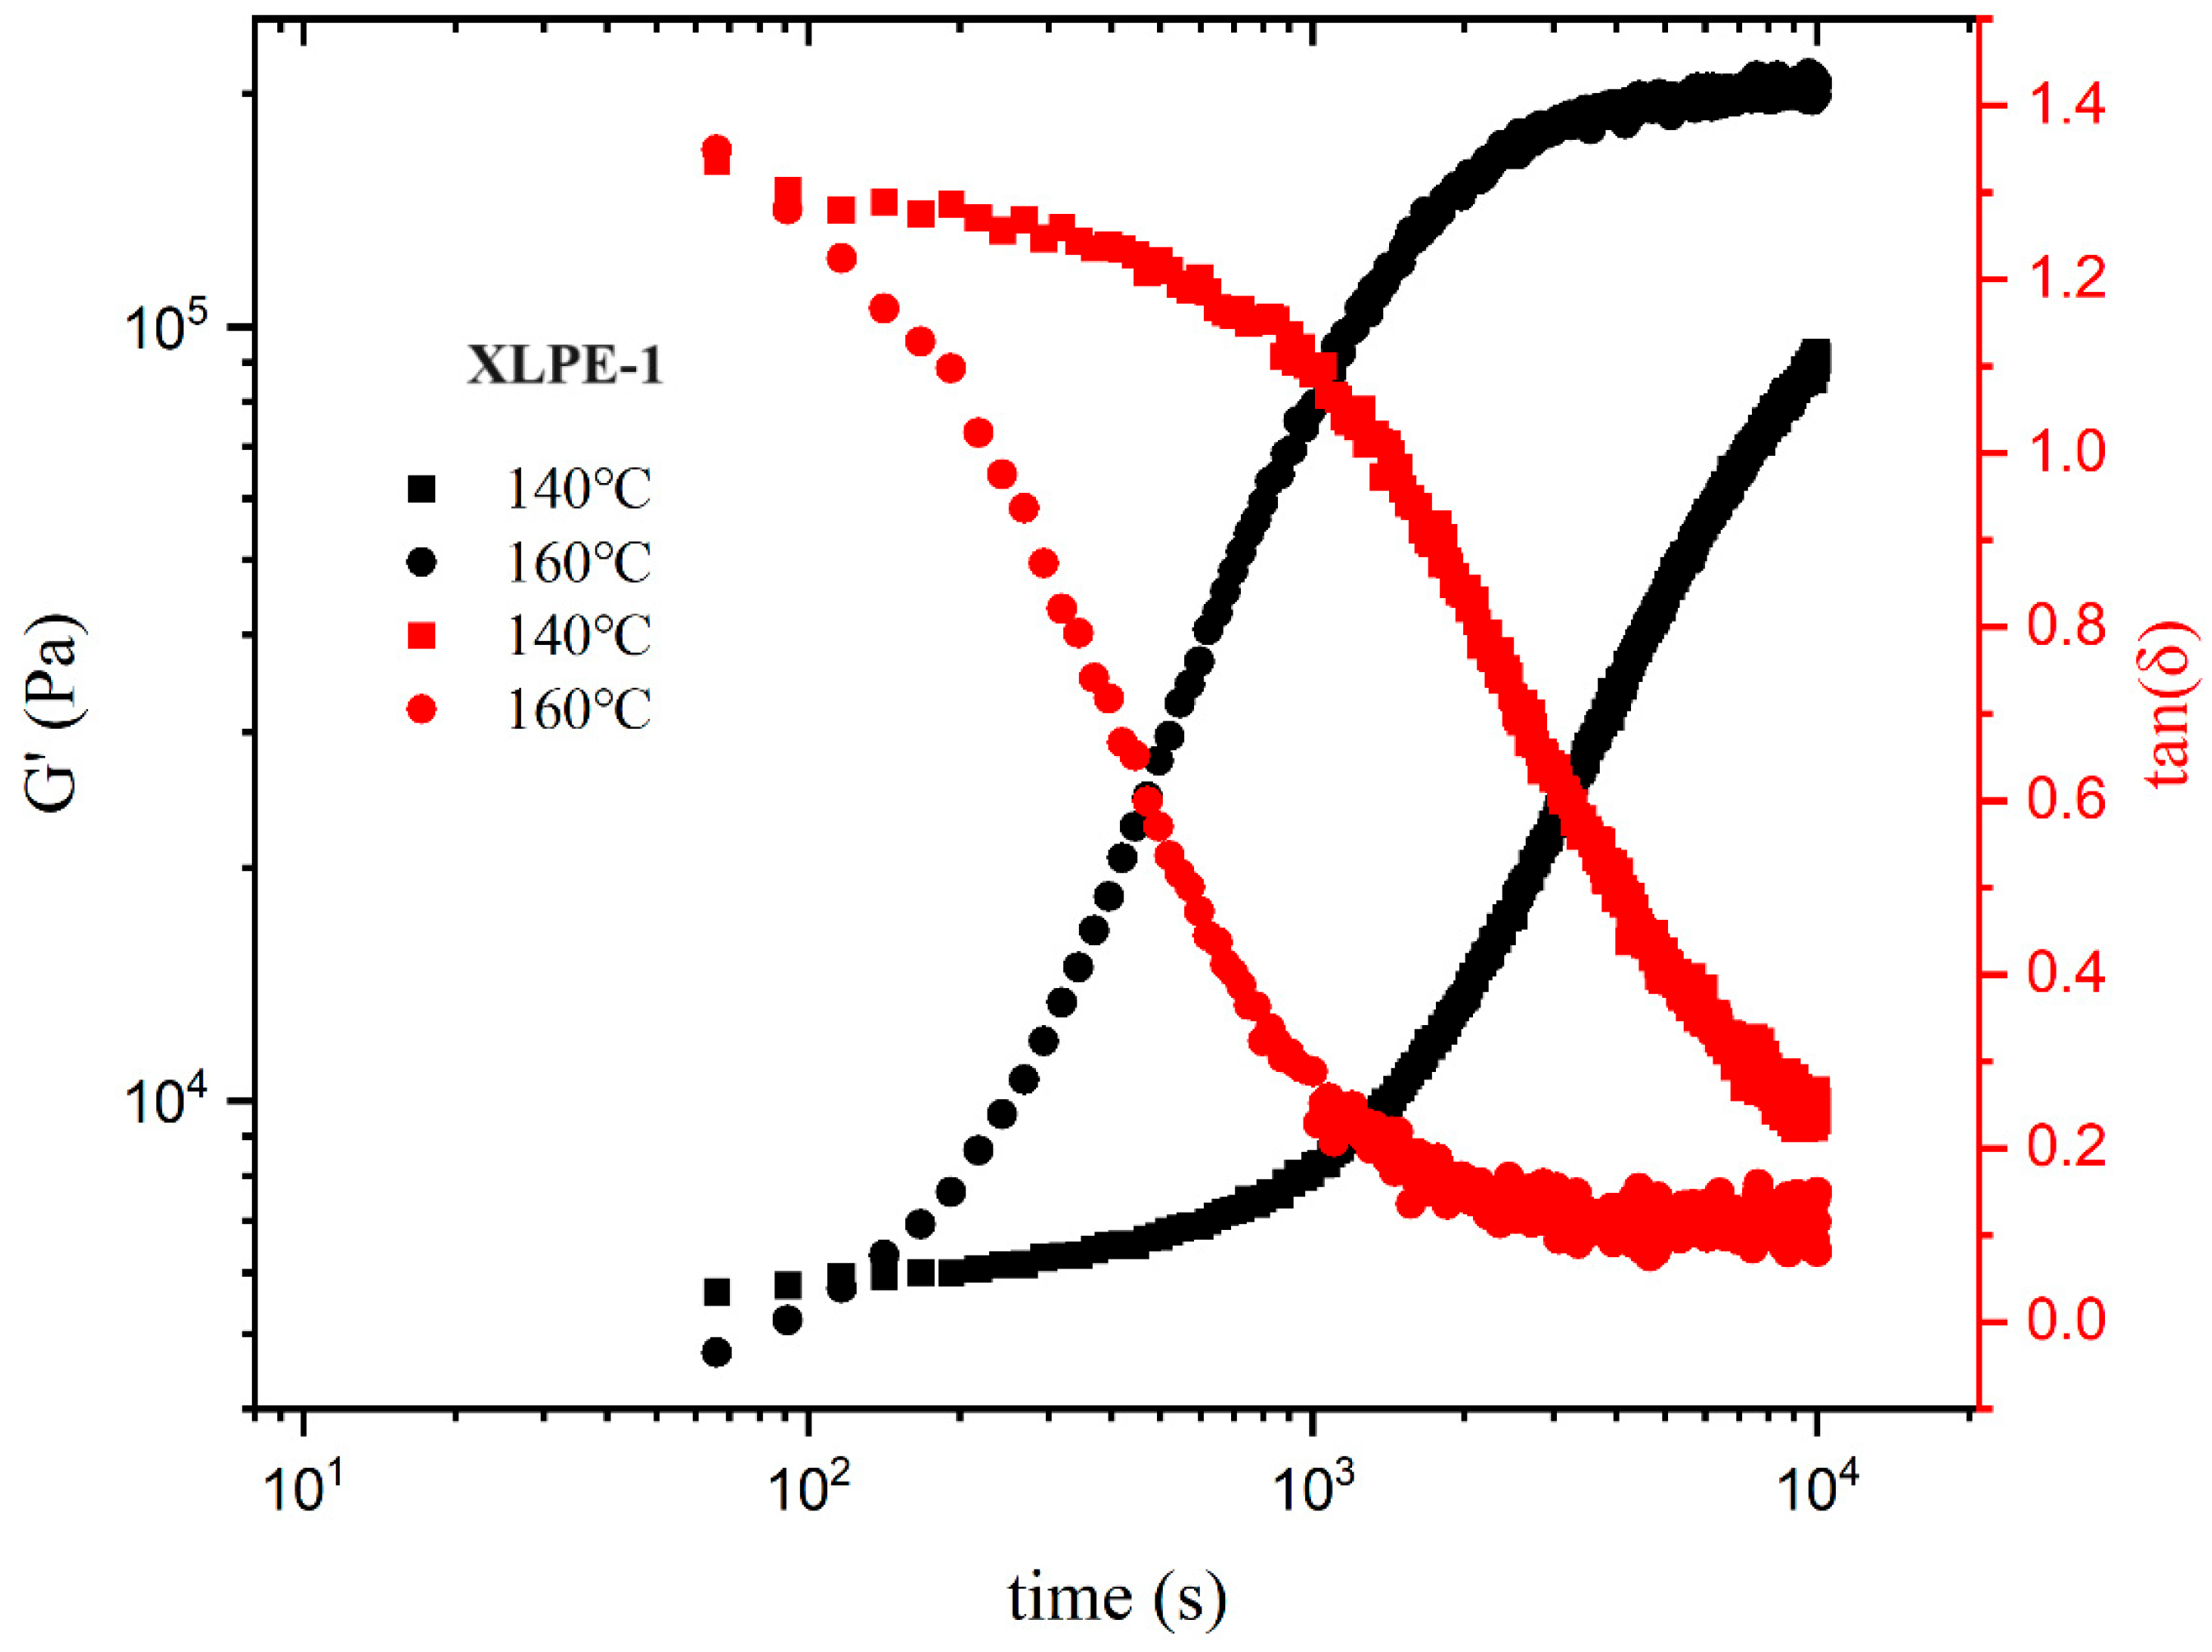
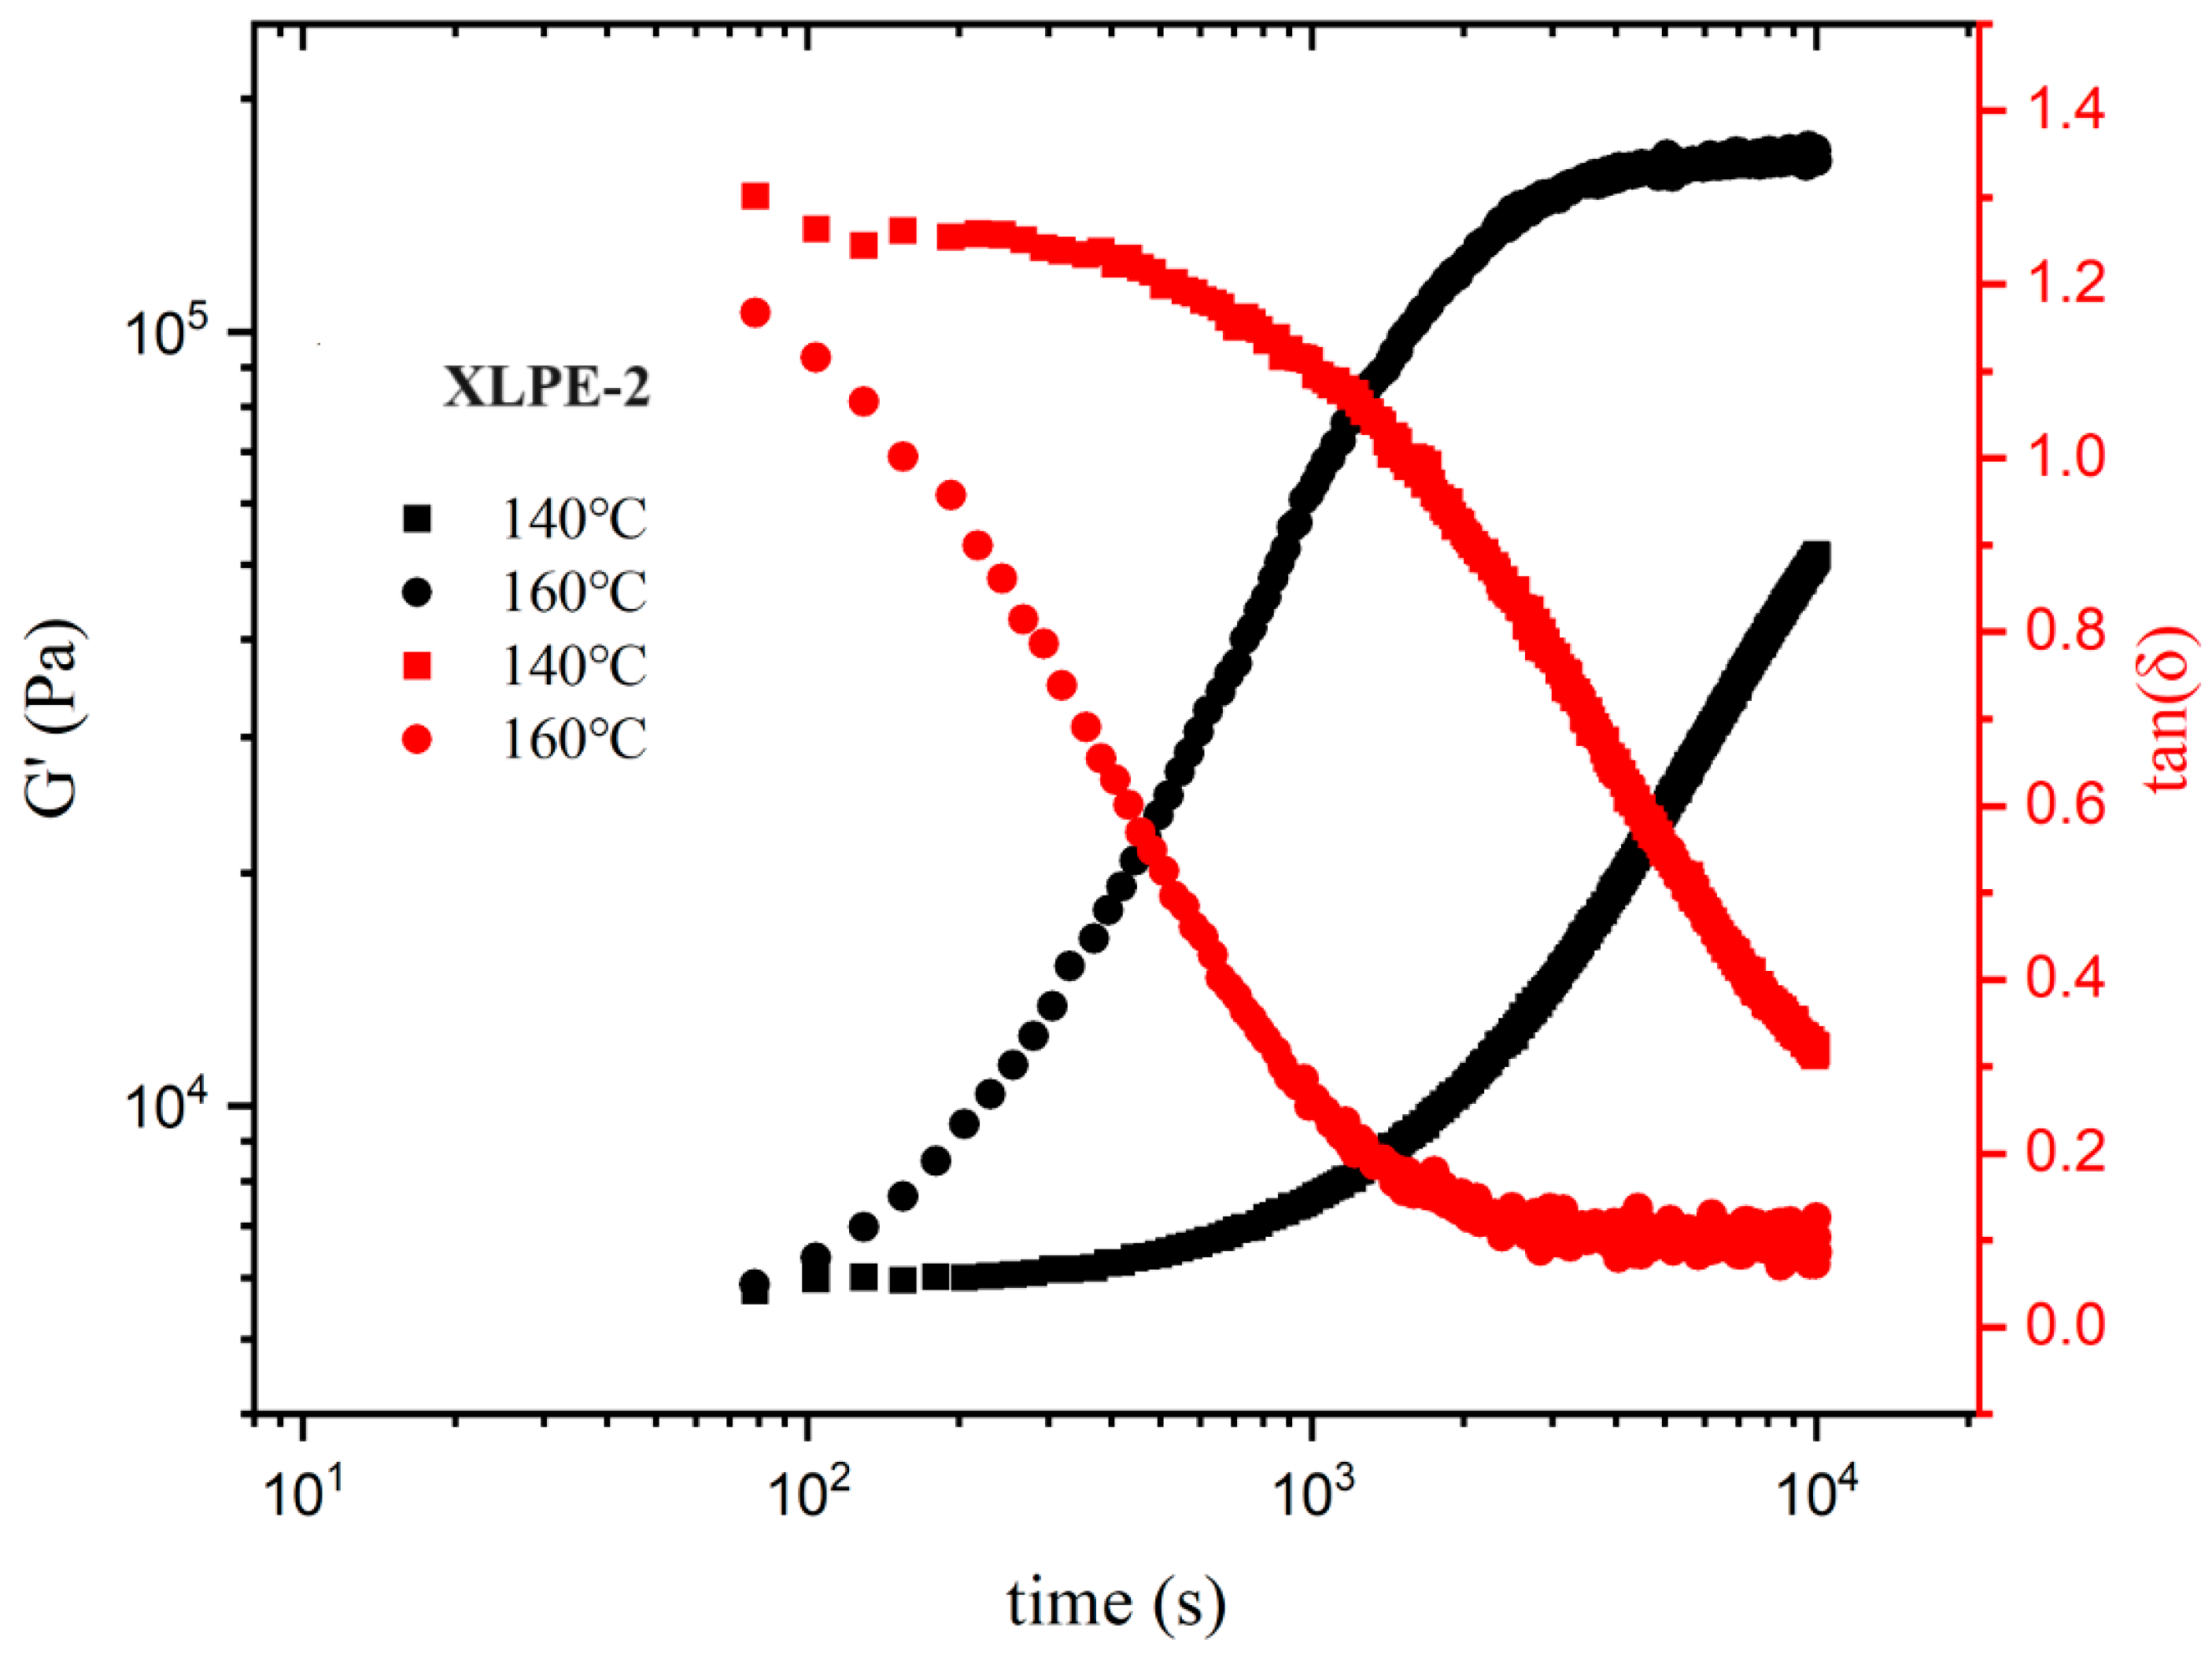
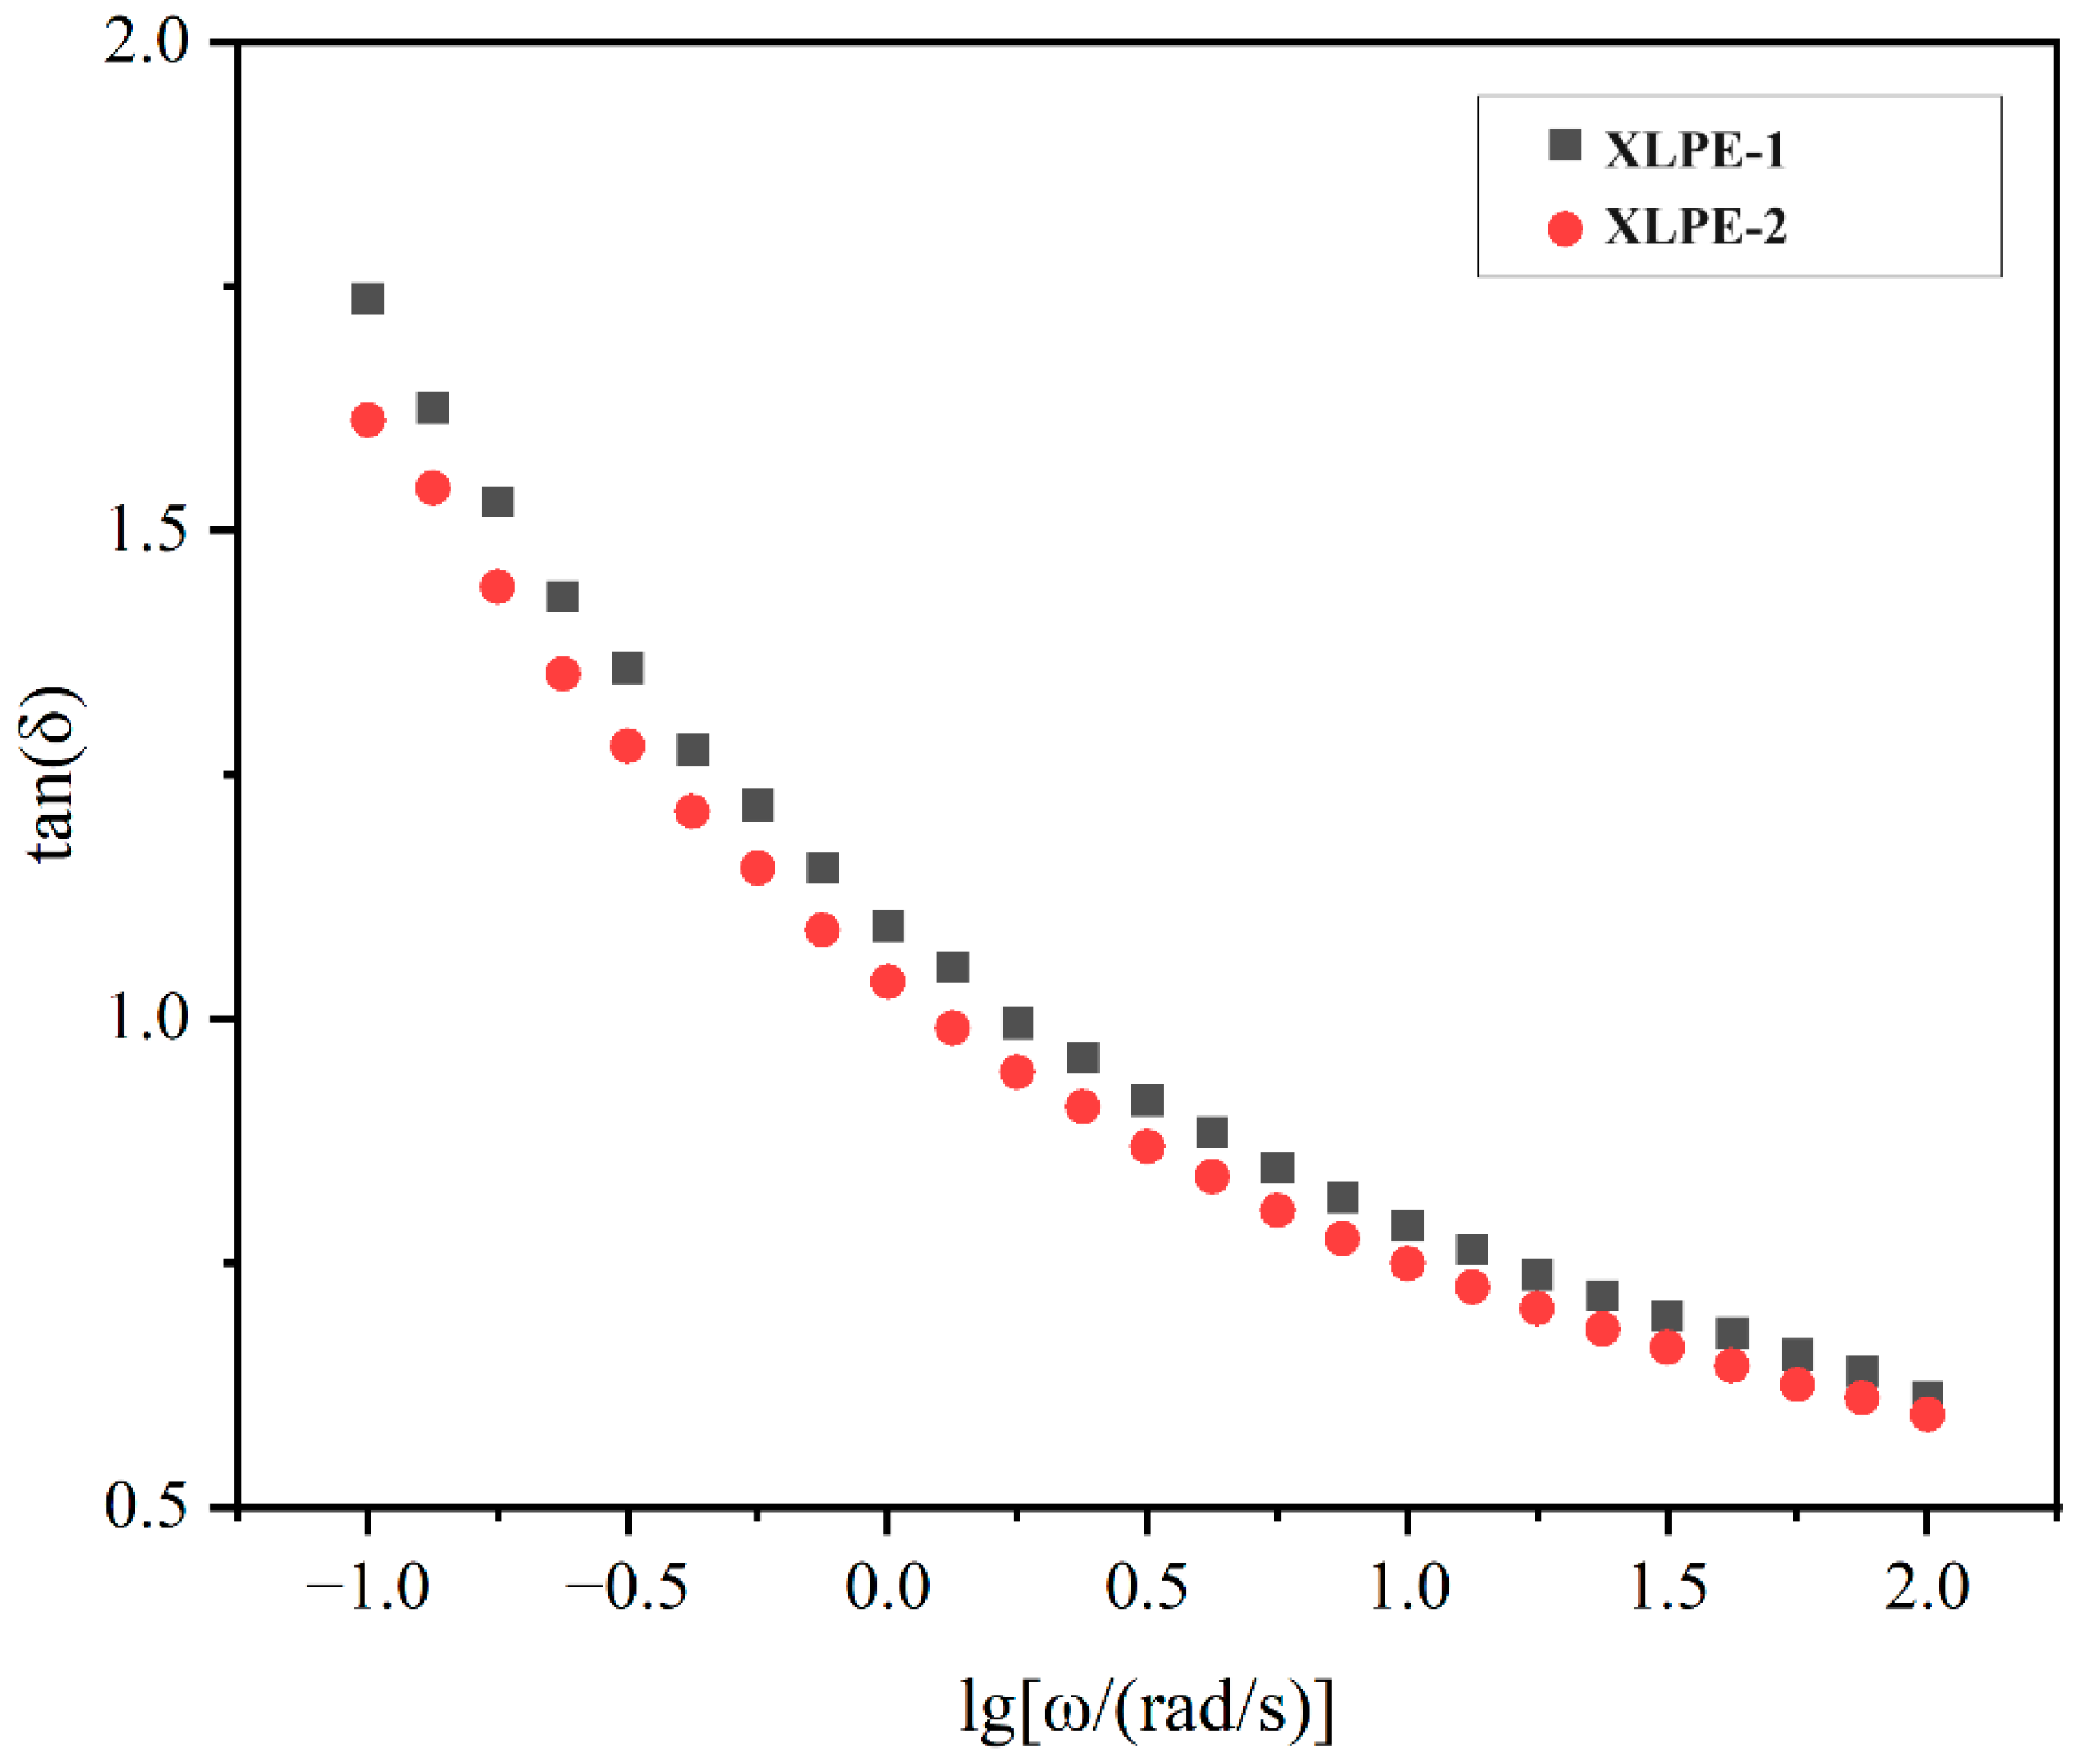
3.6. Rheological Behavior
3.7. Space Charge Analysis
4. Conclusions
Supplementary Materials
Author Contributions
Funding
Data Availability Statement
Conflicts of Interest
References
- Sun, W.J.; Liu, X.J.; Yuan, L.J.; Xiao, H.; Lu, J.M. Regulating the structure of crosslinked polyethylene and its application in ultra-high voltage cables. Polym. Eng. Sci. 2023, 64, 496–505. [Google Scholar] [CrossRef]
- Zhang, T.; Shi, G.; Zhang, N.; Du, A.; Wu, Q. Analysis and aging evaluation method of frequency domain dielectric spectroscopy for high-voltage XLPE submarine cables. Electr. Eng. 2023. [Google Scholar] [CrossRef]
- Wang, Z.; Hu, Y.; Gui, Z.; Zong, R. Halogen-free flame retardation and silane crosslinking of polyethylenes. Polym. Test. 2003, 22, 533–538. [Google Scholar] [CrossRef]
- Hozumi, N.; Takeda, T.; Suzuki, H.; Okamoto, T. Space charge behavior in XLPE cable insulation under 0.2–1.2 MV/cm dc fields. IEEE Trans. Dielectr. Electr. Insul. 1998, 5, 82–90. [Google Scholar] [CrossRef]
- Fothergill, J.C.; Montanari, G.C.; Stevens, G.C.; Teyssedre, G.; Nilsson, U.H. Electrical, microstructural, physical and chemical characterization of HV XLPE cable peelings for an electrical aging diagnostic data base. IEEE Trans. Dielectr. Electr. Insul. 2003, 10, 514–527. [Google Scholar] [CrossRef]
- Wang, W.W.; Li, S.T.; Tananaka, Y.; Takada, T. Interfacial chargedynamics of cross-linked polyethylene/ethylene-propylene-diene dual dielectric polymer as revealed by energy bandstructure. IEEE Trans. Dielectr. Electr. Insul. 2019, 26, 1755–1762. [Google Scholar] [CrossRef]
- Qu, B.; Shi, W.; Bengt, R. Photocrosslinking of LDPE and its application for wires and cables. J. Photopolym. Sci. Tec. 1989, 2, 269–276. [Google Scholar] [CrossRef]
- Hao, Y.; Kadlcak, J.; Xu, J.; Wu, D.; Liu, G. The novelty role of polyamide elastomer in the determination of crosslink density and the formation of crosslink network of EPDM vulcanizates. Polym. Adv. Technol. 2023, 34, 1642–1652. [Google Scholar] [CrossRef]
- Hsu, C.K. Thermal decomposition properties of polymer fibers. Thermochim. Acta. 2002, 392, 163–167. [Google Scholar] [CrossRef]
- Kaiser, J.M.; Anderson, W.C.; Long, B.K. Photochemical regulation of a redox-active olefin polymerization catalyst: Controlling polyethylene microstructure with visible light. Polym. Chem. 2018, 9, 1567–1570. [Google Scholar] [CrossRef]
- Sun, W.J.; Liu, X.J.; Yuan, L.J.; Xiao, H.; Lu, J.M. An efficient strategy triggered crosslinking of polyethylene and its application in degassing-free ultrahigh voltage power cables. J. Appl. Polym. Sci. 2023, 140, e53844. [Google Scholar] [CrossRef]
- Qu, J.; Wang, S.; Li, S.; Liu, H.; Wu, Y.; Du, L.; Wang, Z.; Guo, L. The enhanced physical properties of XLPE insulation for high voltage cable based on LDPE/LLDPE or LDPE/HDPE blends. Polym. Degrad. Stabil. 2023, 218, 110573. [Google Scholar] [CrossRef]
- Li, C.; Chu, Z.; Zhang, L.; Zhang, J.; Tao, J. Insulation aging diagnosis and defect location of crosslinked polyethylene cable in the distribution network based on radio frequency identification. Mater. Express 2023, 13, 1772–1781. [Google Scholar] [CrossRef]
- Meng, X.; Yang, H.; Lu, Z.; Liu, Y. Study on catalytic pyrolysis and combustion characteristics of waste cable sheath with crosslinked polyethylene. Adv. Compos. Hybrid Mater. 2022, 5, 2948–2963. [Google Scholar] [CrossRef]
- JB/T 12927-2016; Test Method for Electro-Acoustic Pulse of Space Charge Distribution in Solid Insulating Materials. Ministry of Industry and Information Technology: Beijing, China, 2016.
- Rucigaj, A.; Stirn, Z.; Sebenik, U.; Krajnc, M. Main-chain benzoxazine oligomers: Effects of molecular weight on the thermal, mechanical, and viscoelastic properties. J. Appl. Polym. Sci. 2018, 135, 46659. [Google Scholar] [CrossRef]
- Saleesung, T.; Reichert, D.; Saalwächter, K.; Sirisinha, C. Correlation of crosslink densities using solid state NMR and conventional techniques in peroxide-crosslinked EPDM rubber. Polymer 2015, 56, 309–317. [Google Scholar] [CrossRef]
- Nuzillard, J.M. Use of carbon-13 NMR to identify known natural products by querying a nuclear magnetic resonance database—An assessment. Magn. Reson. Chem. 2023, 61, 582–588. [Google Scholar] [CrossRef]
- Hu, C.; Sha, M.; Jia, M.; Zhang, B.; Ma, H.; Sun, Y. Optimal content ratio and total content of polymer monomers in polymer stabilized blue phase liquid crystal displays. Liq. Cryst. 2022, 49, 392–398. [Google Scholar] [CrossRef]
- Randall, J.C. A review of high resolution liquid 13 carbon nuclear magnetic resonance characterizations of ethylene-based polymers. J. Macromol. Sci. Part C Polym. Rev. 1989, 29, 201–317. [Google Scholar] [CrossRef]
- Kosinska, J.; Boczkaj, G.; Galezowska, G.; Podwysocka, J.; Przyjazny, A.; Kamiński, M. Determination of modifier contents in polymer-modified bitumens and in samples collected from the roads using high-performance gel permeation/size-exclusion chromatography. Road. Mater. Pavement 2016, 17, 547–562. [Google Scholar] [CrossRef]
- Hida, N.; Nakajima, T.; Hara, M.; Seki, T.; Nagano, S. Induced smectic e phase in a binary blend of side-chain liquid crystalline polymers. Macromol. Rapid. Comm. 2023, 44, 2200761. [Google Scholar] [CrossRef] [PubMed]
- Wan, X.; Zhang, H.; Chen, C.; Wang, R.; Su, L.; Guo, B.H. Synthesis and characterization of phase change materials microcapsules with paraffin core/cross-linked hybrid polymer shell for thermal energy storage. J. Energy Storage 2020, 32, 101897. [Google Scholar] [CrossRef]
- Markey, L.; Stevens, G.C. Microstructural characterization of XLPE electrical insulation in power cables: Determination of void size distributions using TEM. J. Phys. D Appl. Phys. 2003, 36, 2569–2583. [Google Scholar] [CrossRef]
- Song, M.; Hammiche, A.; Pollock, H.M.; Hourston, D.J. Modulated differential scanning calorimetry: 1. A study of the glass-transition behavior of blends of poly(methyl methacrylate) and poly(styrene-co-acrylonitrile). Polymer 1995, 36, 3313–3316. [Google Scholar] [CrossRef]
- Malmberg, A.; Gabriel, C.; Steffl, T.; Münstedt, H.; Löfgren, B. Long-chain branching in metallocene-catalyzed polyethylenes investigated by low oscillatory shear and uniaxial extensional rheometry. Macromolecules 2002, 35, 1038–1048. [Google Scholar] [CrossRef]
- Montanari, G.C.; Laurent, C.; Teyssedre, G.; Campus, A.; Nilsson, U.H. From LDPE to XLPE: Investigating the change of electrical properties. Part I. space charge, conduction and lifetime. IEEE Trans. Dielectr. Electr. Insul. 2005, 12, 438–446. [Google Scholar] [CrossRef]
- Wang, S.; Zhou, Q.; Liao, R.; Xing, L.; Wu, N.C.; Jiang, Q. The Impact of Cross-Linking Effect on the Space Charge Characteristics of Cross-Linked Polyethylene with Different Degrees of Cross-Linking under Strong Direct Current Electric Field. Polymers 2019, 11, 1149. [Google Scholar] [CrossRef]


| LDPE/g | CP/g | Antioxidant 300/g | AMSD/g | |
|---|---|---|---|---|
| XLPE-1 | 100 | 0.5 | 2 | 1 |
| XLPE-2 | 100 | 1.0 | 2 | 1 |
| XLPE-3 | 100 | 1.5 | 2 | 1 |
| XLPE-4 | 100 | 2.0 | 2 | 1 |
| Branching Chain | Main Chain Carbon Atoms (ppm) | Branching Carbon Atoms (ppm) | ||||
|---|---|---|---|---|---|---|
| Branching Point | Position | Position | 1B | 2B | 3B | |
| Methyl | 33.04 | 37.09 | 27.10 | 19.82 | - | - |
| Ethyl | 37.89 | 34.28 | 27.10 | 10.85 | 26.88 | - |
| Butyl | 37.37 | 34.28 | 27.10 | 14.03 | 23.24 | 29.32 |
| Hexyl+ | 37.37 | 34.28 | 27.10 | 14.03 | 22.75 | 32.55 |
| Branching Chain | Branching Degree/1000C | |
|---|---|---|
| XLPE-1 | XLPE-2 | |
| Methyl | 5.2 | 1.4 |
| Ethyl | 8.5 | 7.5 |
| Butyl and Hexyl+ | 9.6 | 3.7 |
| Sample | Crystallinity % |
|---|---|
| XLPE-1 | 24.6 |
| XLPE-2 | 26.5 |
| XLPE-3 | 24.1 |
| XLPE-4 | 25.1 |
| Sample | Melt Parameters | Crystallinity % | |
|---|---|---|---|
| (°C) | () | ||
| XLPE-1 | 110.24 | 98.85 | 34 |
| XLPE-2 | 109.84 | 88.18 | 30 |
| XLPE-3 | 112.13 | 88.62 | 30 |
| XLPE-4 | 110.04 | 98.24 | 34 |
| Sample | Degree of Crosslinking % |
|---|---|
| XLPE-1 | 80.2 ± 1.1 |
| XLPE-2 | 82.2 ± 1.4 |
| XLPE-3 | 79.4 ± 1.1 |
| XLPE-4 | 77.7 ± 1.4 |
Disclaimer/Publisher’s Note: The statements, opinions and data contained in all publications are solely those of the individual author(s) and contributor(s) and not of MDPI and/or the editor(s). MDPI and/or the editor(s) disclaim responsibility for any injury to people or property resulting from any ideas, methods, instructions or products referred to in the content. |
© 2024 by the authors. Licensee MDPI, Basel, Switzerland. This article is an open access article distributed under the terms and conditions of the Creative Commons Attribution (CC BY) license (https://creativecommons.org/licenses/by/4.0/).
Share and Cite
Di, L.; Qin, C.; Wang, W.; Huang, A.; Wei, F.; Xu, H.; Yang, S. Influence of Crosslink Density on Electrical Performance and Rheological Properties of Crosslinked Polyethylene. Polymers 2024, 16, 676. https://doi.org/10.3390/polym16050676
Di L, Qin C, Wang W, Huang A, Wei F, Xu H, Yang S. Influence of Crosslink Density on Electrical Performance and Rheological Properties of Crosslinked Polyethylene. Polymers. 2024; 16(5):676. https://doi.org/10.3390/polym16050676
Chicago/Turabian StyleDi, Linting, Chenyuan Qin, Wenying Wang, Anping Huang, Fuqing Wei, Huifang Xu, and Shiyuan Yang. 2024. "Influence of Crosslink Density on Electrical Performance and Rheological Properties of Crosslinked Polyethylene" Polymers 16, no. 5: 676. https://doi.org/10.3390/polym16050676
APA StyleDi, L., Qin, C., Wang, W., Huang, A., Wei, F., Xu, H., & Yang, S. (2024). Influence of Crosslink Density on Electrical Performance and Rheological Properties of Crosslinked Polyethylene. Polymers, 16(5), 676. https://doi.org/10.3390/polym16050676