

Study of Synthesis of Dual-Curing Thermoplastic Polyurethane Hot-Melt Adhesive and Optimization by Using Gray Relational Analysis to Apply in Fabric Industry to Solve Seamless Bonding Issues


Abstract
1. Introduction
2. Materials and Methods
2.1. Materials
2.2. Methods
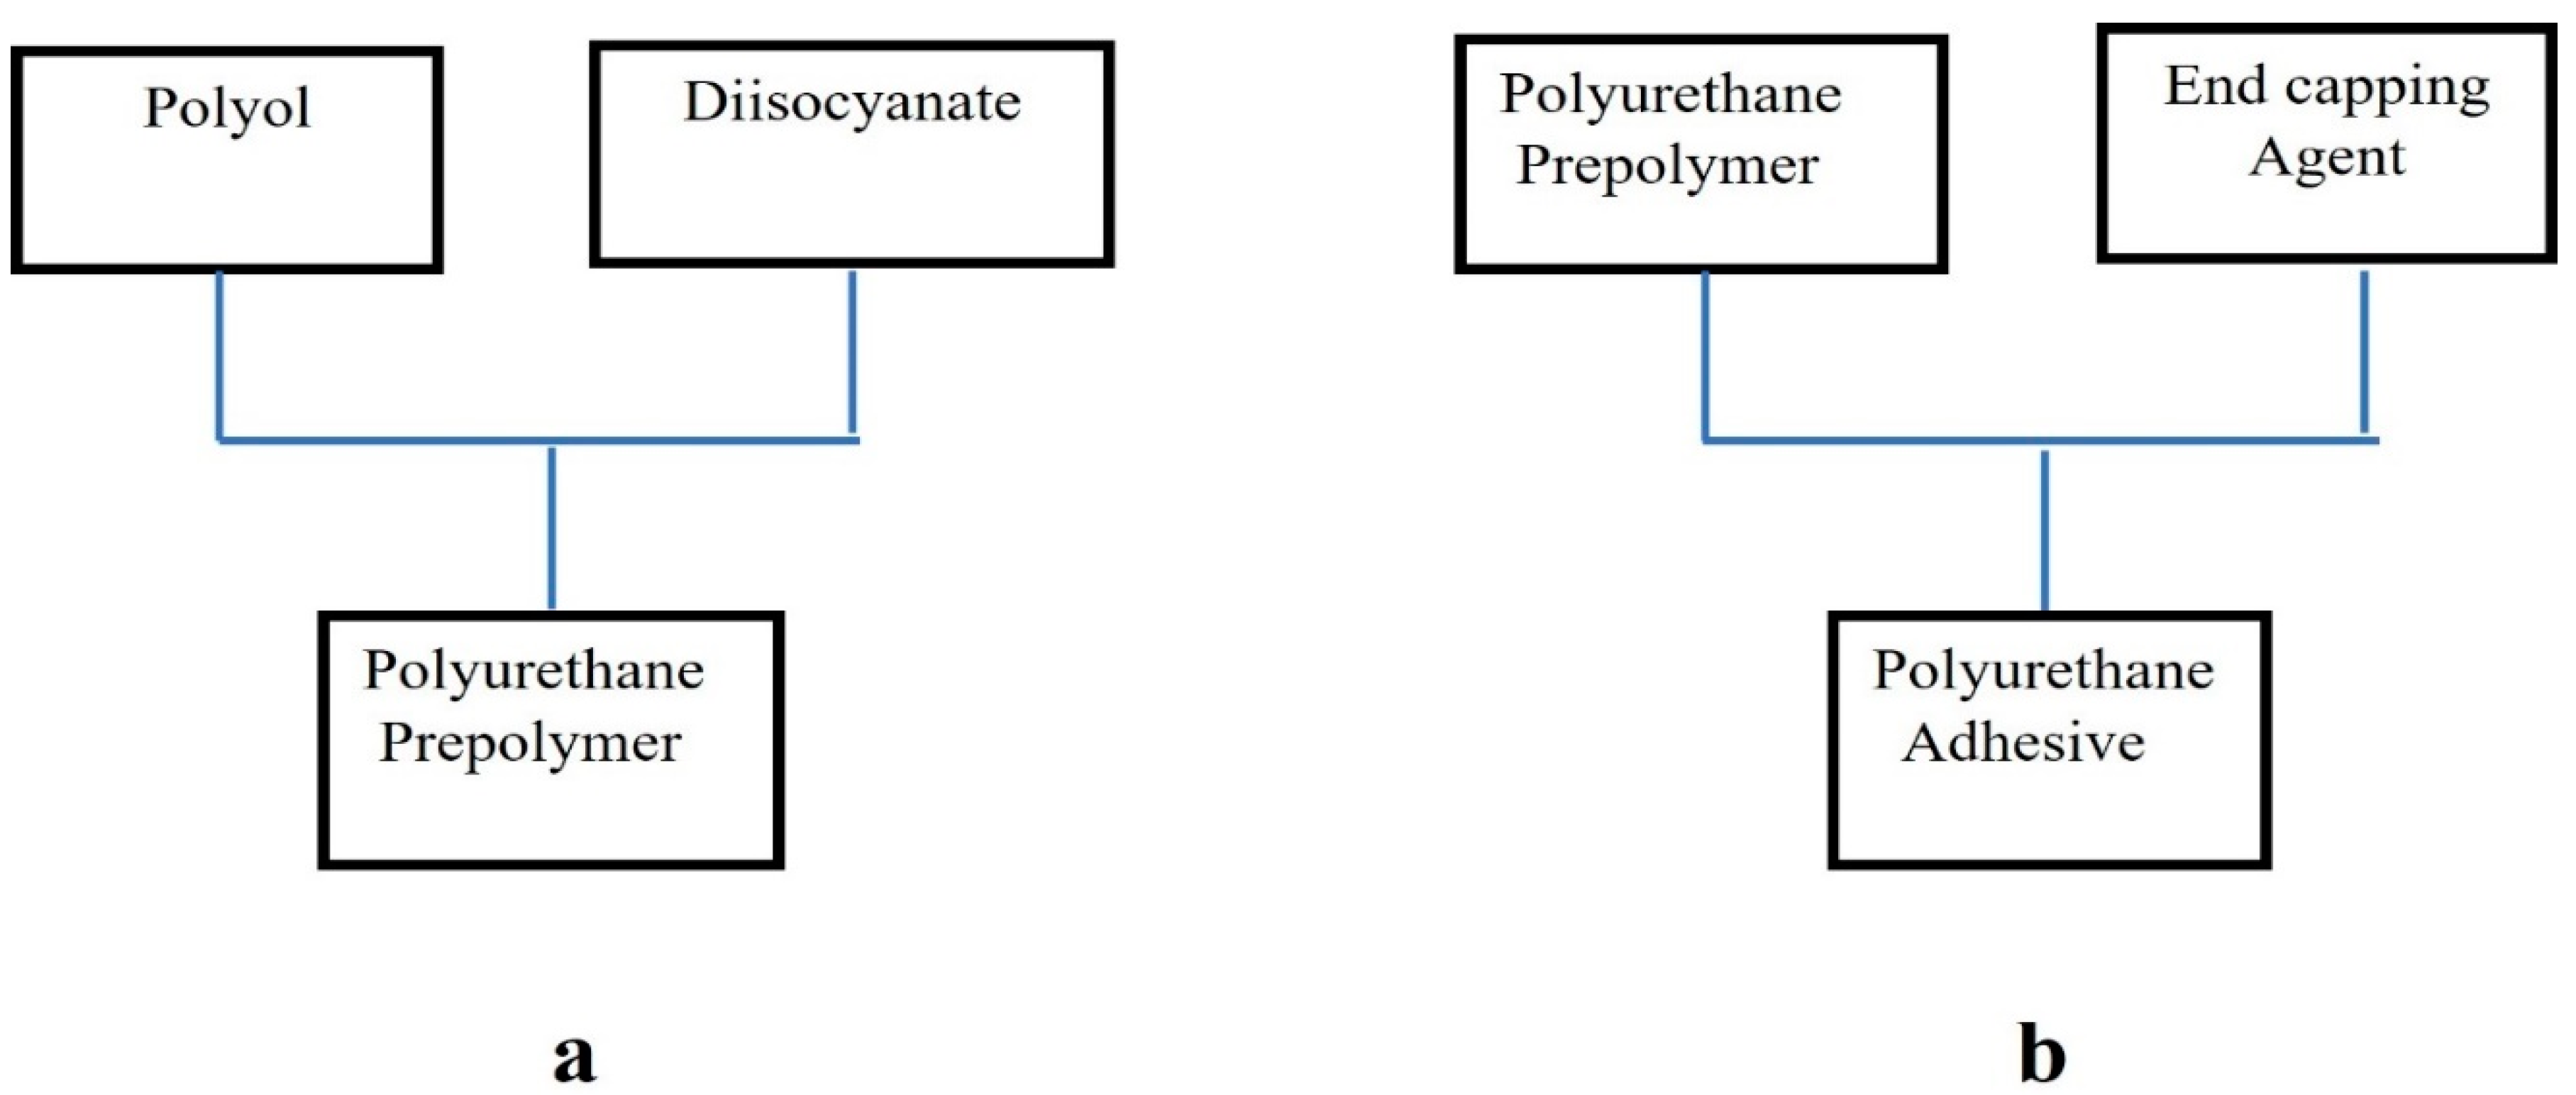
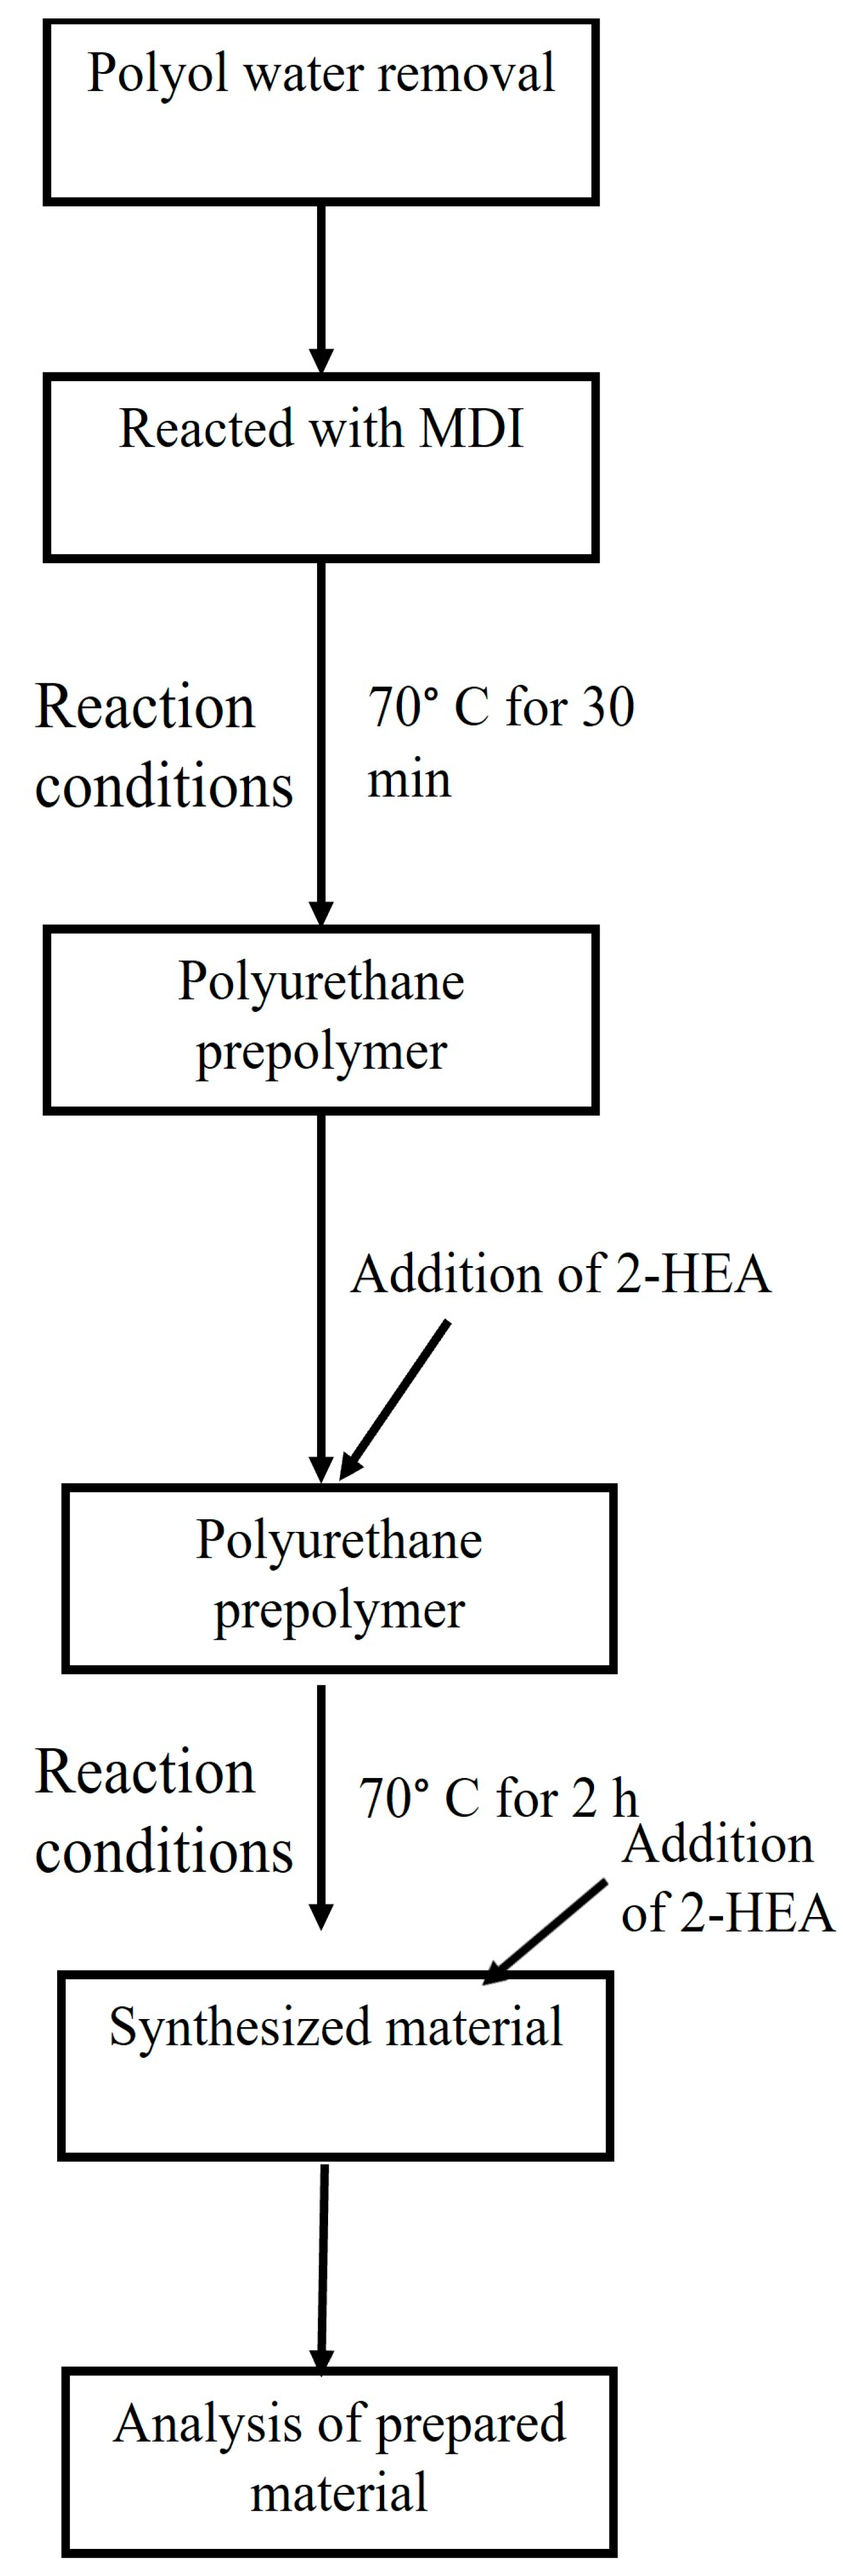
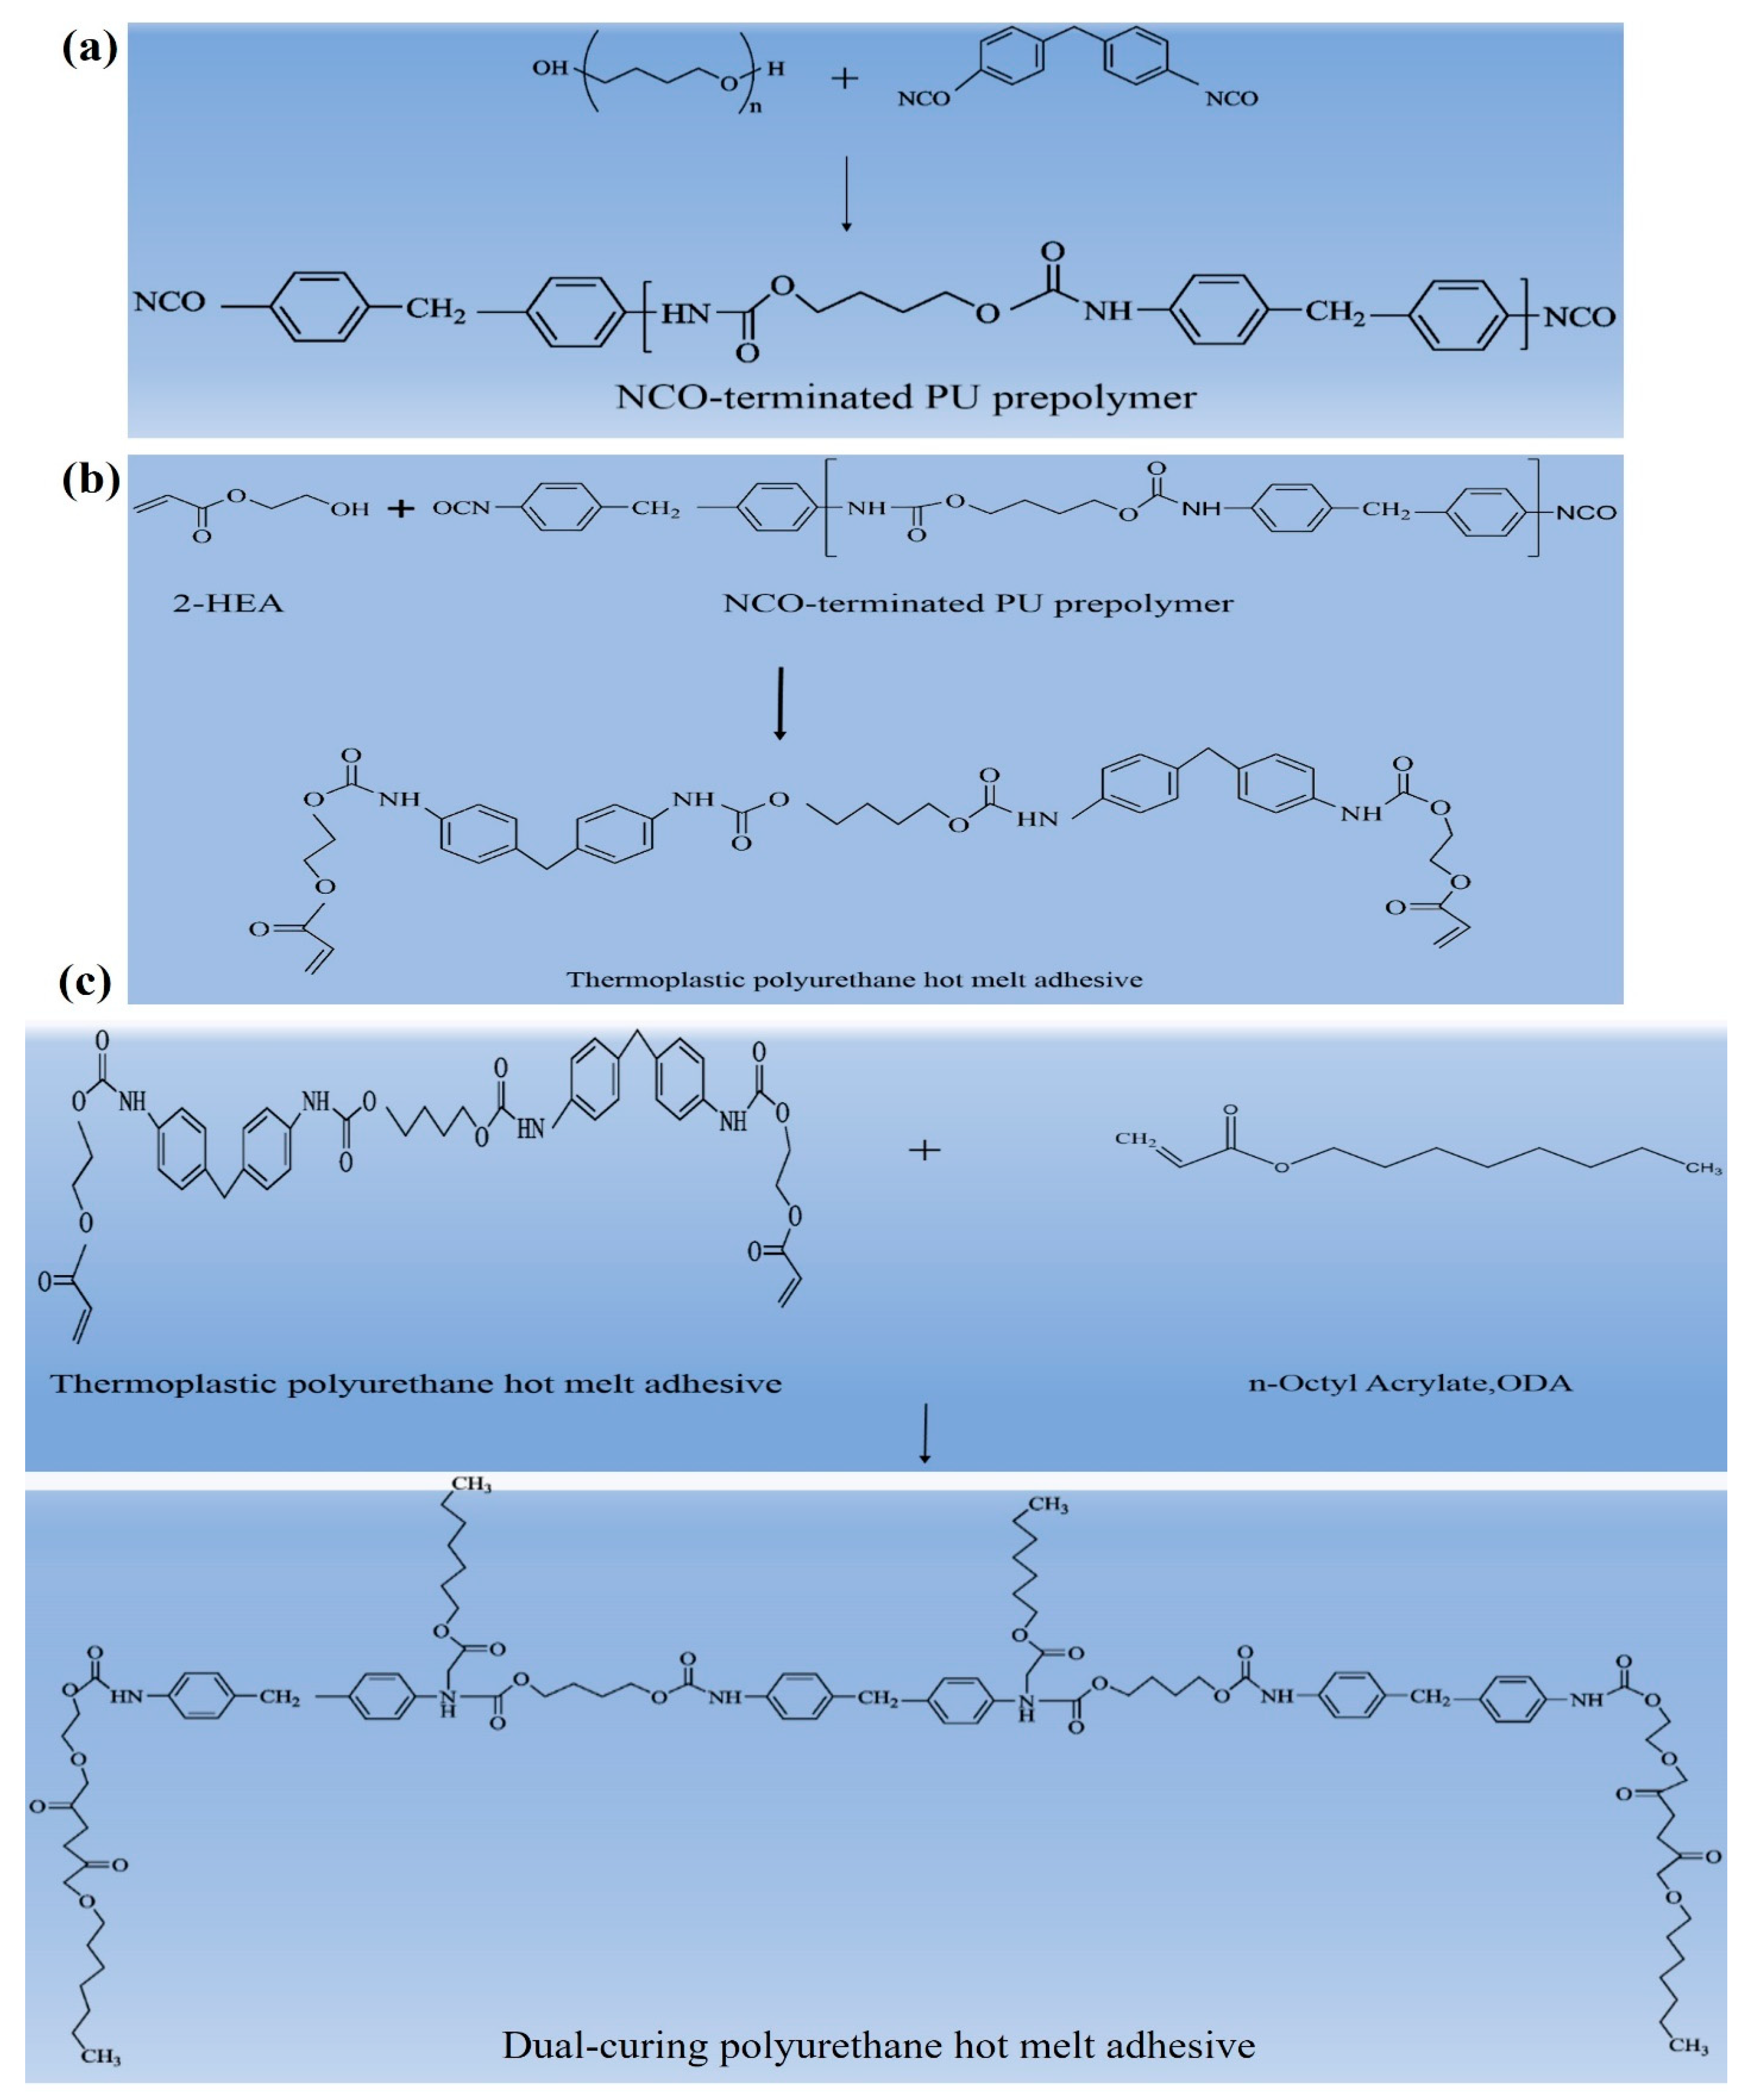
2.2.1. Synthesis Reaction of Polyurethane Hot-Melt Adhesives
2.2.2. Methodology
2.3. Polyhydric Alcohol Dehydration Time
2.4. Taguchi Quality Engineering Method
2.5. Physical Analysis
2.6. Gray Relational Analysis (GRA)
2.6.1. Gray Relational Analysis (GRA) Method
2.6.2. Optimization Quality Analysis Process
3. Results and Discussion
3.1. Chemical and Physical Analysis
3.1.1. Fourier Transform Infrared Spectrometer (FTIR)
3.1.2. Advanced Polymer Chromatography (APC)
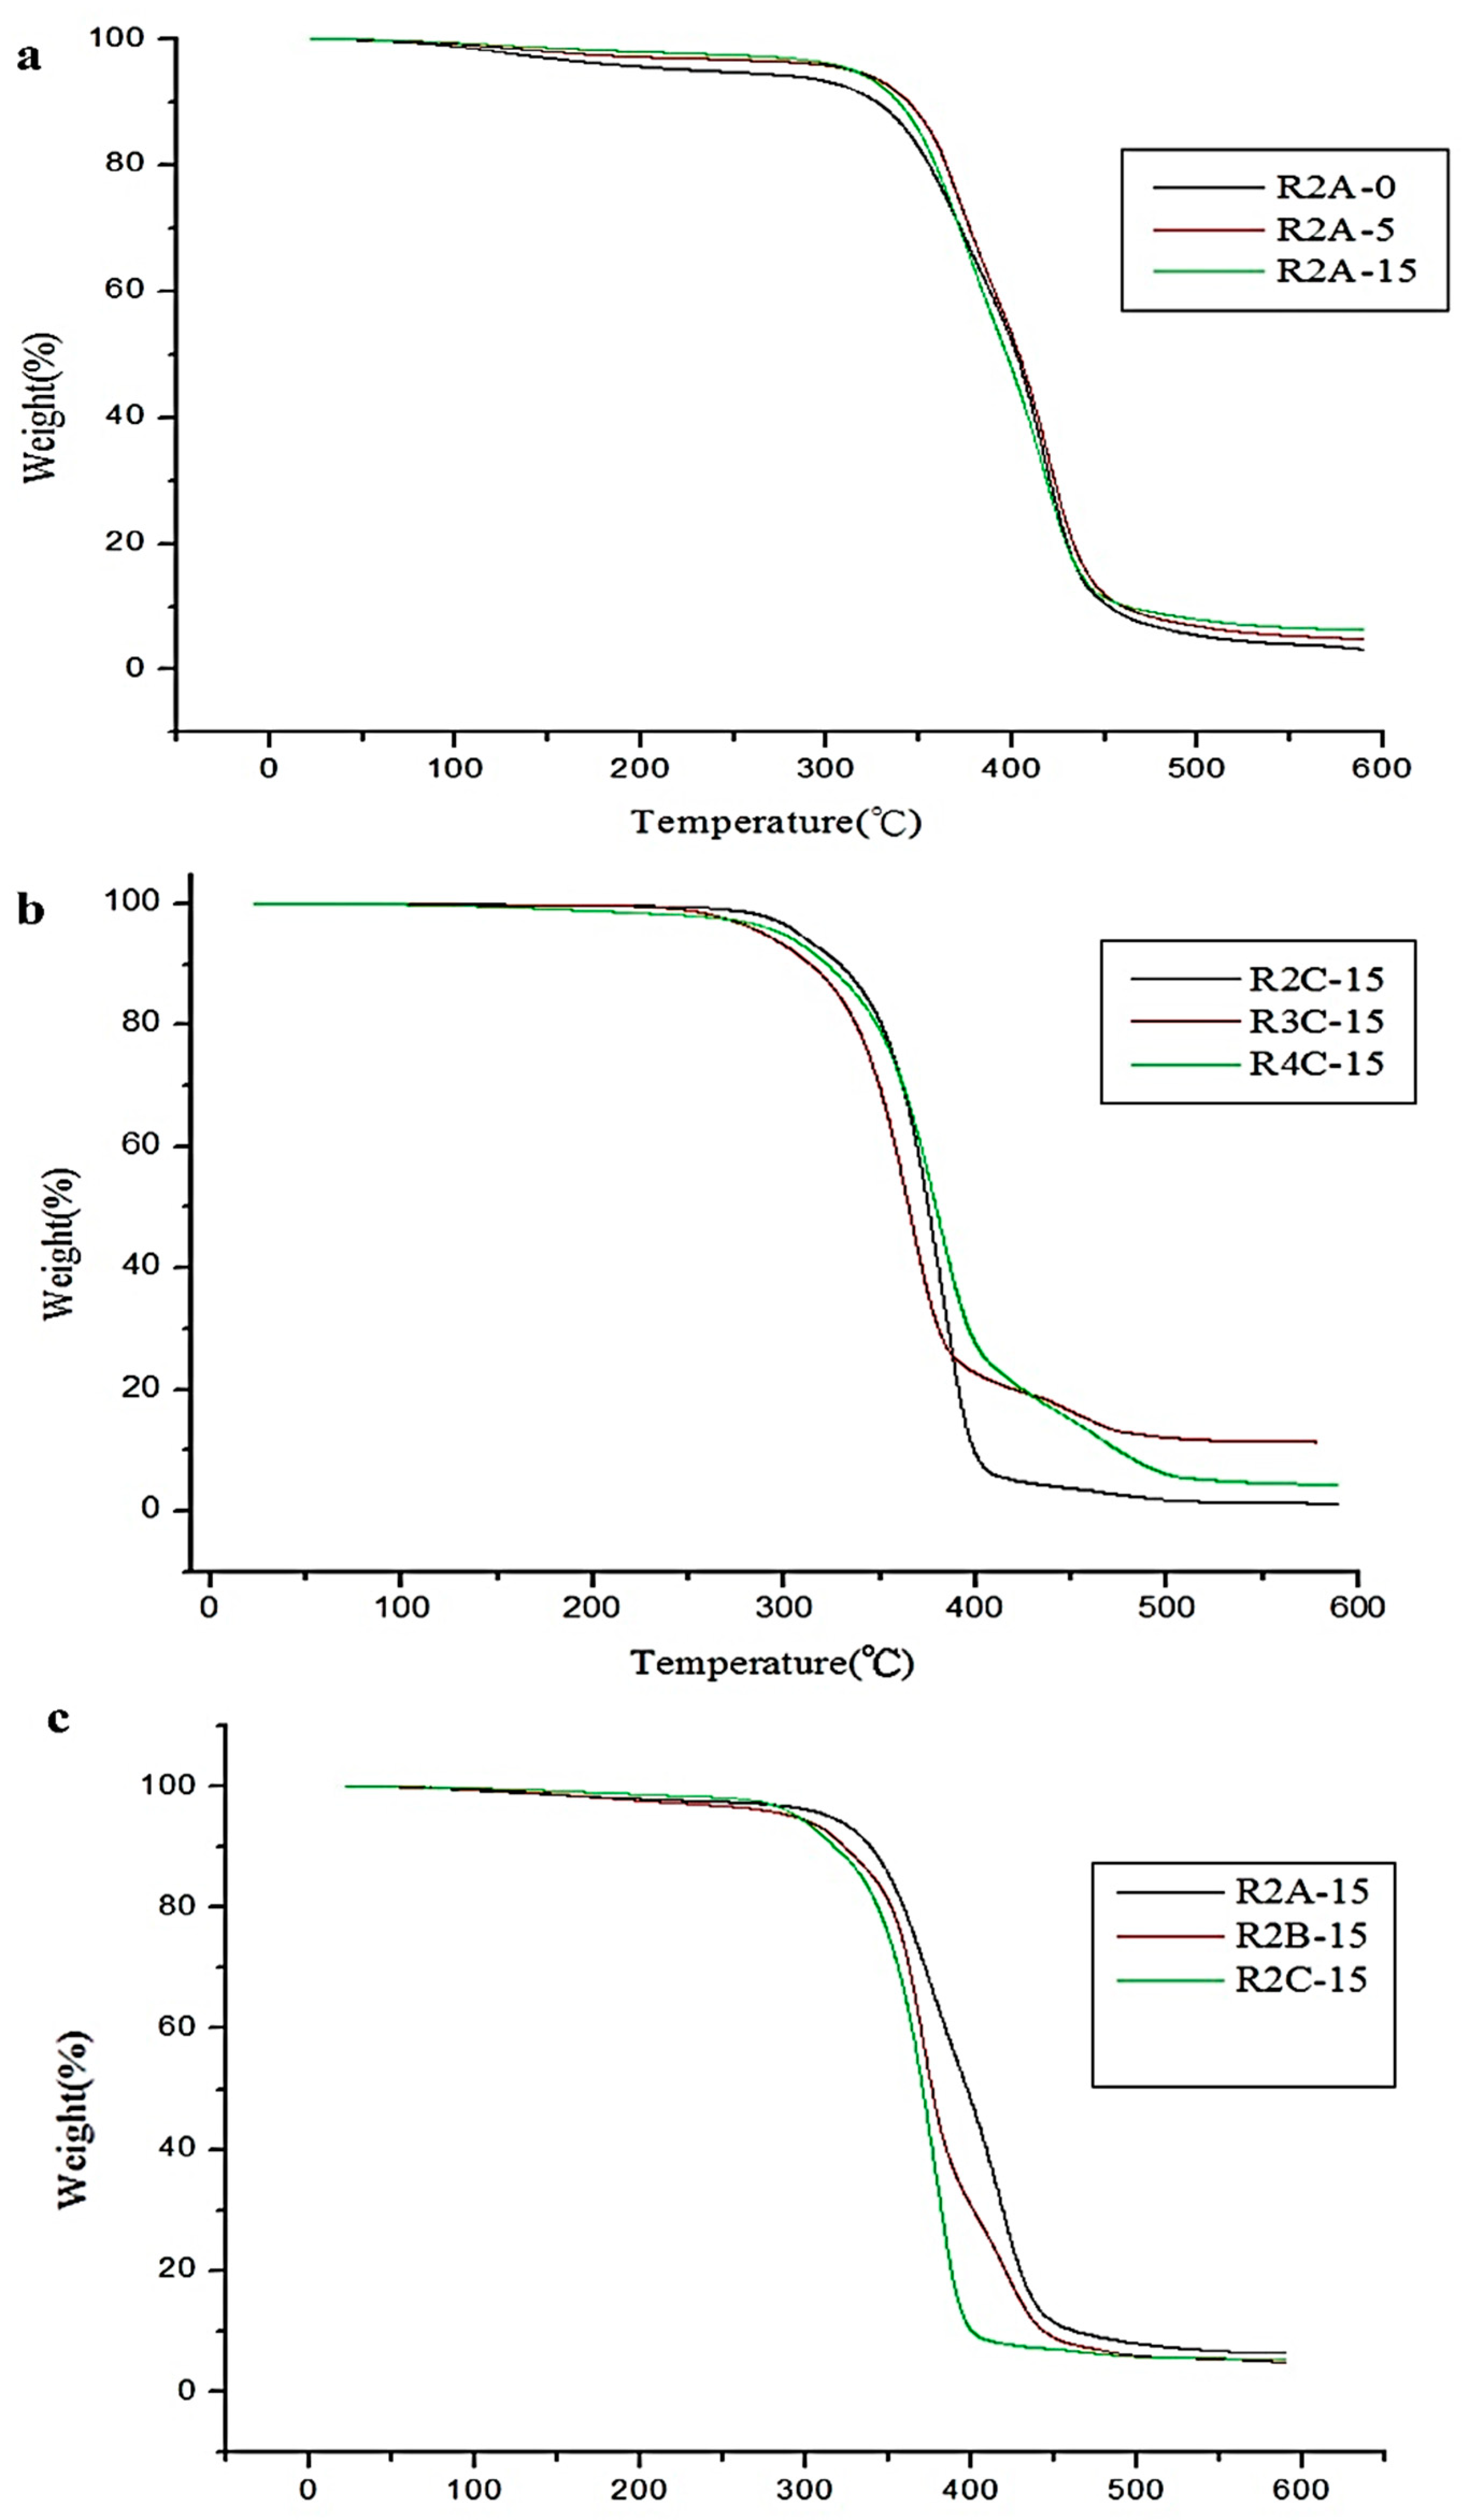
3.1.3. Thermogravimetric Analysis (TGA)
3.2. Mechanical Properties of Hot-Melt Adhesives
3.3. Optimal Analysis of Dual-Cure Polyurethane Hot-Melt Adhesive Single-Quality Design
3.3.1. Single-Quality Optimization Analysis of Shear Strength
3.3.2. Optimization Analysis for Peel Strength Single-Factor Quality
3.4. Multi-Quality Optimization Analysis
3.5. Comparison with Commercial Hot-Melt Adhesives
4. Conclusions
Supplementary Materials
Author Contributions
Funding
Institutional Review Board Statement
Data Availability Statement
Conflicts of Interest
References
- Liu, S.; Huang, L.; Zhao, Y.; Wu, X. Lightweight Single Shot Multi-Box Detector: A fabric defect detection algorithm incorporating parallel dilated convolution and dual channel attention. Text. Res. J. 2024, 94, 209–224. [Google Scholar] [CrossRef]
- Budhe, S.; Banea, M.D.; De Barros, S.; Da Silva, L.F.M. An updated review of adhesively bonded joints in composite materials. Int. J. Adhes. Adhes. 2017, 72, 30–42. [Google Scholar] [CrossRef]
- Akindoyo, J.O.; Beg, M.D.; Ghazali, S.; Islam, M.R.; Jeyaratnam, N.; Yuvaraj, A.R. Polyurethane types, synthesis and applications—A review. Rsc Adv. 2016, 6, 114453–114482. [Google Scholar] [CrossRef]
- Adrian, T.A.; Ma, C.S.; Jose, M.F. A Review of the Sustainable Approaches in the Production of Bio-based Polyurethanes and Their Applications in the Adhesive Field. J. Polym. Environ. 2020, 28, 749–774. [Google Scholar]
- Wongsamut, C.; Suwanpreedee, R.; Manuspiya, H. Thermoplastic polyurethane-based polycarbonate diol hot melt adhesives: The effect of hard-soft segment ratio on adhesion properties. Int. J. Adhes. Adhes. 2020, 102, 102677. [Google Scholar] [CrossRef]
- Liu, Z.; Yuan, G.; Diao, W.; Zhang, Y.; Jiao, E.; Shi, J.; Wu, K. UV-curing polyurethane pressure-sensitive adhesive with high shear strength and good adhesion properties inspired by spider silk. Progress. Org. Coat. 2024, 186, 107963. [Google Scholar] [CrossRef]
- Crescentini, T.M.; May, J.C.; McLean, J.A.; Hercules, D.M. Mass spectrometry of polyurethanes. Polymer 2019, 181, 121624. [Google Scholar] [CrossRef] [PubMed]
- Das, A.; Mahanwar, P. A brief discussion on advances in polyurethane applications. Adv. Ind. Eng. Polym. Res. 2020, 3, 93–101. [Google Scholar] [CrossRef]
- Somarathna, H.M.C.C.; Raman, S.N.; Mohotti, D.; Mutalib, A.A.; Badri, K.H. The use of polyurethane for structural and infrastructural engineering applications: A state-of-the-art review. Constr. Build. Mater. 2018, 190, 995–1014. [Google Scholar] [CrossRef]
- Ren, H.B.; Timothy, E.L. Recent trends in the additive manufacturing of polyurethanes. Polym. Int. 2024, 73, 5–8. [Google Scholar]
- Zhang, P.; Zhang, G.; Pan, J.; Ma, C.; Zhang, G. Non-isocyanate Polyurethane Coating with High Hardness, Superior Flexibility, and Strong Substrate Adhesion. ACS Appl. Mater. Interfaces 2023, 15, 5998–6004. [Google Scholar] [CrossRef]
- Zhang, K.; Shuai, K.; Ni, Z.; Kaneko, T.; Dong, W.; Chen, M.; Shi, D. Synthesis of non-isocyanate polyurethanes withhigh-performance and self-healing properties. J. Appl. Polym. Sci. 2024, 141, e54899. [Google Scholar]
- Engels, H.W.; Pirkl, H.G.; Albers, R.; Albach, R.W.; Krause, J.; Hoffmann, A.; Dormish, J. Polyurethane: Vielseitige Materialien und nachhaltige Problemlöser für aktuelle Anforderungen. Angew. Chem. 2013, 125, 9596–9616. [Google Scholar] [CrossRef]
- Martin, D.J.; Osman, A.F.; Andriani, Y.; Edwards, G.A. Thermoplastic polyurethane (TPU)-based polymer nanocomposites. In Advances in Polymer Nanocomposites; Elsevier: Amsterdam, The Netherlands, 2012; pp. 321–350. [Google Scholar]
- Prisacariu, C. Polyurethane Elastomers: From Morphology to Mechanical Aspects; Springer Science & Business Media: Berlin/Heidelberg, Germany, 2011. [Google Scholar]
- Heath, R. Isocyanate-based polymers: Polyurethanes, polyureas, polyisocyanurates, and their copolymers. In Brydson’s Plastics Materials; Elsevier: Amsterdam, The Netherlands, 2017; pp. 799–835. [Google Scholar]
- Costa, V.; Nohales, A.; Félix, P.; Guillem, C.; Gómez, C.M. Enhanced polyurethanes based on different polycarbonatediols. J. Elastomers Plast. 2013, 45, 217–238. [Google Scholar] [CrossRef]
- Kuo, C.F.J.; Chen, J.B.; Lin, P.H.; Yen, H.T. Hot-melt pressure-sensitive adhesive for seamless bonding of nylon fabric part I: Effect of a functional monomer. Text. Res. J. 2019, 89, 926–935. [Google Scholar] [CrossRef]
- Gogoi, R.; Alam, M.S.; Khandal, R.K. Effect of increasing NCO/OH molar ratio on the physicomechanical and thermal properties of isocyanate terminated polyurethane prepolymer. Int. J. Basic Appl. Sci. 2014, 3, 118. [Google Scholar] [CrossRef]
- Somani, K.P.; Kansara, S.S.; Patel, N.K.; Rakshit, A.K. Castor oil based polyurethane adhesives for wood-to-wood bonding. Int. J. Adhes. Adhes. 2003, 23, 269–275. [Google Scholar] [CrossRef]
- Chen, K.-S.; Chen, D.-F.; Huang, M.-C.; Chang, T.-C. Analyzing processing quality of machine tools via processed product: Example of ball valve processing machine. Proc. Inst. Mech. Eng. E J. Process Mech. Eng. 2020, 234, 331–341. [Google Scholar] [CrossRef]
- ASTM D36-06; Standard Test Method for Softening Point of Bitumen (Ring-and-Ball Apparatus). ASTM: West Conshohocken, PA, USA, 2006.
- ASTM D3330/D3330M-04; Standard Test Method for Peel Adhesion of Pressure-Sensitive Tape. ASTM: West Conshohocken, PA, USA, 2018.
- Asensio, M.; Costa, V.; Nohales, A.; Bianchi, O.; Gómez, C.M. Tunable structure and properties of segmented thermoplastic polyurethanes as a function of flexible segment. Polymers 2019, 11, 1910. [Google Scholar] [CrossRef]
- Naveed, A.; Kuo, C.-F.J.; Mujahid, M. Synthesis of novel CuNb2O6/g-C3N4 binary photocatalyst towards efficient visible light reduction of Cr (VI) and dyes degradation for environmental remediation. Chemosphere 2022, 298, 134153. [Google Scholar]
- Sampath, S.S.; Shiva, K.; Ganesha, A.; Kota, R. Optimization of a multistage liquid desiccant dehumidifier by neural networks & particle swarm techniques. J. Build. Eng. 2023, 77, 107467. [Google Scholar]
- Simon, S.M.; Chandran, A.; George, G.; Sajna, M.S.; Valparambil, P.; Kumi-Barmiah, E.; Jose, G.; Biju, P.R.; Joseph, C.; Unnikrishnan, N.V. Development of thick super-hydrophilic TiO2−ZrO2 transparent coatings realized through the inclusion of poly (methyl methacrylate) and pluronic-F127. ACS Omega 2018, 3, 14924–14932. [Google Scholar] [CrossRef] [PubMed]
- Kuo, C.-F.J.; Naveed, A.; Lin, S.-Y.; Garuda, R.S.D.; Dong, M.-Y. Synthesis and characteristic applications of silicon resins for the modifying agent in heat conduction. Text. Res. J. 2022, 92, 5–6. [Google Scholar]
- Srinath, P.; Venu, G.R.K.; Raj, K.S.; Abdul, A.P. In vitro bioactivity and degradation behaviour of β-wollastonite derived from natural waste. Mater. Sci. Eng. C 2019, 98, 109–117. [Google Scholar]
- Nurazzi, N.M.; Asyraf, M.R.M.; Rayung, M.; Norrrahim, M.N.F.; Shazleen, S.S.; Rani, M.S.A.; Shafi, A.R.; Aisya, H.A.; Radzi, M.H.M.; Sabaruddin, F.A.; et al. Thermogravimetric Analysis Properties of Cellulosic Natural Fiber Polymer Composites: A Review on Influence of Chemical Treatments. Polymers 2021, 13, 2710. [Google Scholar] [CrossRef]
- Naveed, A.; Kuo, C.-F.J.; Mujahid, M.; Mahmoud, K.H.; Kuei, H.C. Improved photocatalytic activity of novel NiAl2O4/g-C3N4 binary composite for photodegradation of 2,4-dinitrophenol and CO2 reduction via gas phase adsorption. Mater. Today Phys. 2023, 31, 100965. [Google Scholar]
- Kriti, K.; Grzegorz, S.; Michael, R.M.; Hironobu, M.; Arman, M.; Jazani, J.; Jeong, S.; Das Krzysztof, M.R. Visible-Light-Mediated Controlled Radical Branching Polymerization in Water. Angew. Chem. Int. Ed. 2023, 62, e2022176. [Google Scholar]
- Warga, C.M.; Huang, C.-C.; Naveed, A.; Garuda, R.S.D.; Kuo, C.-F.J. Hybrid sol-gel-derived method for the synthesis of silicon rubber composites with hBN for characteristic applications in elastomeric thermal pads. Text. Res. J. 2022, 92, 11–12. [Google Scholar]
- Hsiao, C.-H.; Huang, C.-C.; Kuo, C.-F.J.; Naveed, A. Integration of Multivariate Statistical Control Chart and Machine Learning to Identify the Abnormal Process Parameters for Polylactide with Glass Fiber Composites in Injection Molding; Part I: The Processing Parameter Optimization for Multiple Qualities of Polylactide/Glass Fiber Composites in Injection Molding. Polymers 2023, 15, 3018. [Google Scholar]


| Control Factors | Level Value 1 | Level Value 2 | Level Value 3 | |
|---|---|---|---|---|
| A | Polyol | PTMG | PCL | PHCD |
| B | NCO:OH ratio | 2:1 | 3:1 | 4:1 |
| C | ODA molar ratio | 0 | 0.5 | 0.15 |
| Materials Names | MDI (Moles) | PTMG (Moles) | PCL (Moles) | PHCD (Moles) | 2-HEA (Moles) | ODA (Moles) |
|---|---|---|---|---|---|---|
| R2-0ODA | 4 | 2 | 0 | 0 | 4 | 0 |
| R2-5ODA | 4 | 2 | 0 | 0 | 4 | 5 |
| R2-15ODA | 4 | 2 | 0 | 0 | 4 | 15 |
| R3-0ODA | 6 | 0 | 2 | 0 | 8 | 0 |
| R3-5ODA | 6 | 0 | 2 | 0 | 8 | 5 |
| R3-15ODA | 6 | 0 | 2 | 0 | 8 | 15 |
| R4-0ODA | 8 | 0 | 0 | 2 | 12 | 0 |
| R4-5ODA | 8 | 0 | 0 | 2 | 12 | 5 |
| R4-15ODA | 8 | 0 | 0 | 2 | 12 | 15 |
| Factors | A (Polyol Category) | B (NCO:OH Ratio) | C (ODA Molar Ratio) | |
|---|---|---|---|---|
| Experiment | ||||
| 1 | 1 | 1 | 1 | |
| 2 | 1 | 2 | 2 | |
| 3 | 1 | 3 | 3 | |
| 4 | 2 | 1 | 2 | |
| 5 | 2 | 2 | 3 | |
| 6 | 2 | 3 | 1 | |
| 7 | 3 | 1 | 3 | |
| 8 | 3 | 2 | 1 | |
| 9 | 3 | 3 | 2 | |
| Functional Group | Wavenumber (cm−1) | Functional Group | Wavenumber (cm−1) |
|---|---|---|---|
| C-H | 2860–2950 cm−1 | Benzene ring | 1590–1600 cm−1 |
| NCO | 2268 cm−1 | N-H | 1535 cm−1 |
| C=O | 1720–1735 cm−1 | C-O-C | 1100–1245 cm−1 |
| Sample Name | T5 (°C) | T10 (°C) | Sample Name | T5 (°C) | T10 (°C) |
|---|---|---|---|---|---|
| PTMG soft segment | PCL soft segment | ||||
| R2-0 | 233.52 | 327.03 | R3-5 | 295.54 | 322.80 |
| R2-5 | 283.64 | 318.39 | R3-15 | 302.22 | 324.53 |
| R2-15 | 328.20 | 344.78 | R4-0 | 285.29 | 312.87 |
| R3-0 | 299.30 | 320.09 | R4-5 | 295.29 | 321.67 |
| R3-5 | 302.94 | 325.43 | R4-15 | 304.68 | 330.38 |
| R3-15 | 311.96 | 349.89 | PHCD soft segment | ||
| R4-0 | 263.84 | 313.42 | R2-0 | 279.32 | 308.23 |
| R4-5 | 293.07 | 320.89 | R2-5 | 289.97 | 314.43 |
| R4-15 | 295.29 | 321.67 | R2-15 | 306.60 | 324.10 |
| PCL soft segment | R3-0 | 292.82 | 318.23 | ||
| R2-0 | 292.43 | 322.86 | R3-5 | 293.08 | 311.31 |
| R2-5 | 295.54 | 322.80 | R3-15 | 299.66 | 323.98 |
| R2-15 | 312.71 | 334.30 | R4-0 | 291.03 | 318.32 |
| R3-0 | 291.80 | 316.41 | R4-5 | 302.78 | 322.98 |
| R3-5 | 295.54 | 322.80 | R4-15 | 304.46 | 326.62 |
| Sample Name | Softening Point (°C) | Peel Strength (kg/cm) | Shear Strength (kg/cm2) | |
|---|---|---|---|---|
| Target value | >100 | >0.39 | >13 | |
| PTMG | ||||
| R2-0 | 75 | 0.15 | 28.50 | |
| R3-5 | 75 | 0.23 | 31.77 | |
| R4-15 | 80 | 0.52 | 32.46 | |
| PCL | ||||
| R2-5 | 65 | 0.34 | 29.67 | |
| R3-15 | 65 | 0.52 | 30.43 | |
| R4-0 | 55 | 0.81 | 33.11 | |
| PHCD | ||||
| R2-0 | 70 | 1.13 | 27.34 | |
| R3-5 | 80 | 1.33 | 29.68 | |
| R4-15 | 80 | 1.59 | 33.71 | |
| No. | Factors | ||||||||
|---|---|---|---|---|---|---|---|---|---|
| A | B | C | Test 1 (MPa) | Test 2 (MPa) | Test 3 (MPa) | Ave. (MPa) | St. dev. | S/N (dB) | |
| 1 | 1 | 1 | 1 | 28.5 | 27.06 | 27.84 | 27.80 | 0.72 | 28.87 |
| 2 | 1 | 2 | 2 | 31.77 | 31.46 | 31.69 | 31.64 | 0.16 | 30.00 |
| 3 | 1 | 3 | 3 | 32.46 | 32.64 | 32.58 | 32.56 | 0.09 | 30.25 |
| 4 | 2 | 1 | 2 | 29.67 | 29.37 | 29.48 | 29.51 | 0.15 | 29.40 |
| 5 | 2 | 2 | 3 | 30.43 | 30.67 | 30.27 | 30.46 | 0.20 | 29.67 |
| 6 | 2 | 3 | 1 | 33.11 | 33.31 | 33.48 | 33.30 | 0.19 | 30.45 |
| 7 | 3 | 1 | 3 | 27.34 | 27.02 | 27.8 | 27.39 | 0.39 | 28.75 |
| 8 | 3 | 2 | 1 | 29.68 | 29.19 | 29.03 | 29.30 | 0.34 | 29.34 |
| 9 | 3 | 3 | 2 | 33.71 | 33.21 | 33.62 | 33.51 | 0.27 | 30.50 |
| No. | SN (dB) | ||||||||
|---|---|---|---|---|---|---|---|---|---|
| A | B | C | Test 1 | Test 2 | Test 3 | Average | Standard | ||
| 1 | 1 | 1 | 1 | 0.15 | 0.13 | 0.18 | 0.15 | 0.03 | −16.62 |
| 2 | 1 | 2 | 2 | 0.23 | 0.27 | 0.24 | 0.25 | 0.02 | −12.25 |
| 3 | 1 | 3 | 3 | 0.52 | 0.54 | 0.55 | 0.54 | 0.02 | −5.42 |
| 4 | 2 | 1 | 2 | 0.34 | 0.28 | 0.32 | 0.31 | 0.03 | −10.20 |
| 5 | 2 | 2 | 3 | 0.52 | 0.61 | 0.57 | 0.57 | 0.05 | −5.02 |
| 6 | 2 | 3 | 1 | 0.81 | 0.85 | 0.88 | 0.85 | 0.04 | −1.47 |
| 7 | 3 | 1 | 3 | 1.13 | 1.17 | 1.17 | 1.16 | 0.02 | 1.26 |
| 8 | 3 | 2 | 1 | 1.33 | 1.38 | 1.36 | 1.36 | 0.03 | 2.64 |
| 9 | 3 | 3 | 2 | 1.59 | 1.57 | 1.61 | 1.59 | 0.02 | 4.03 |
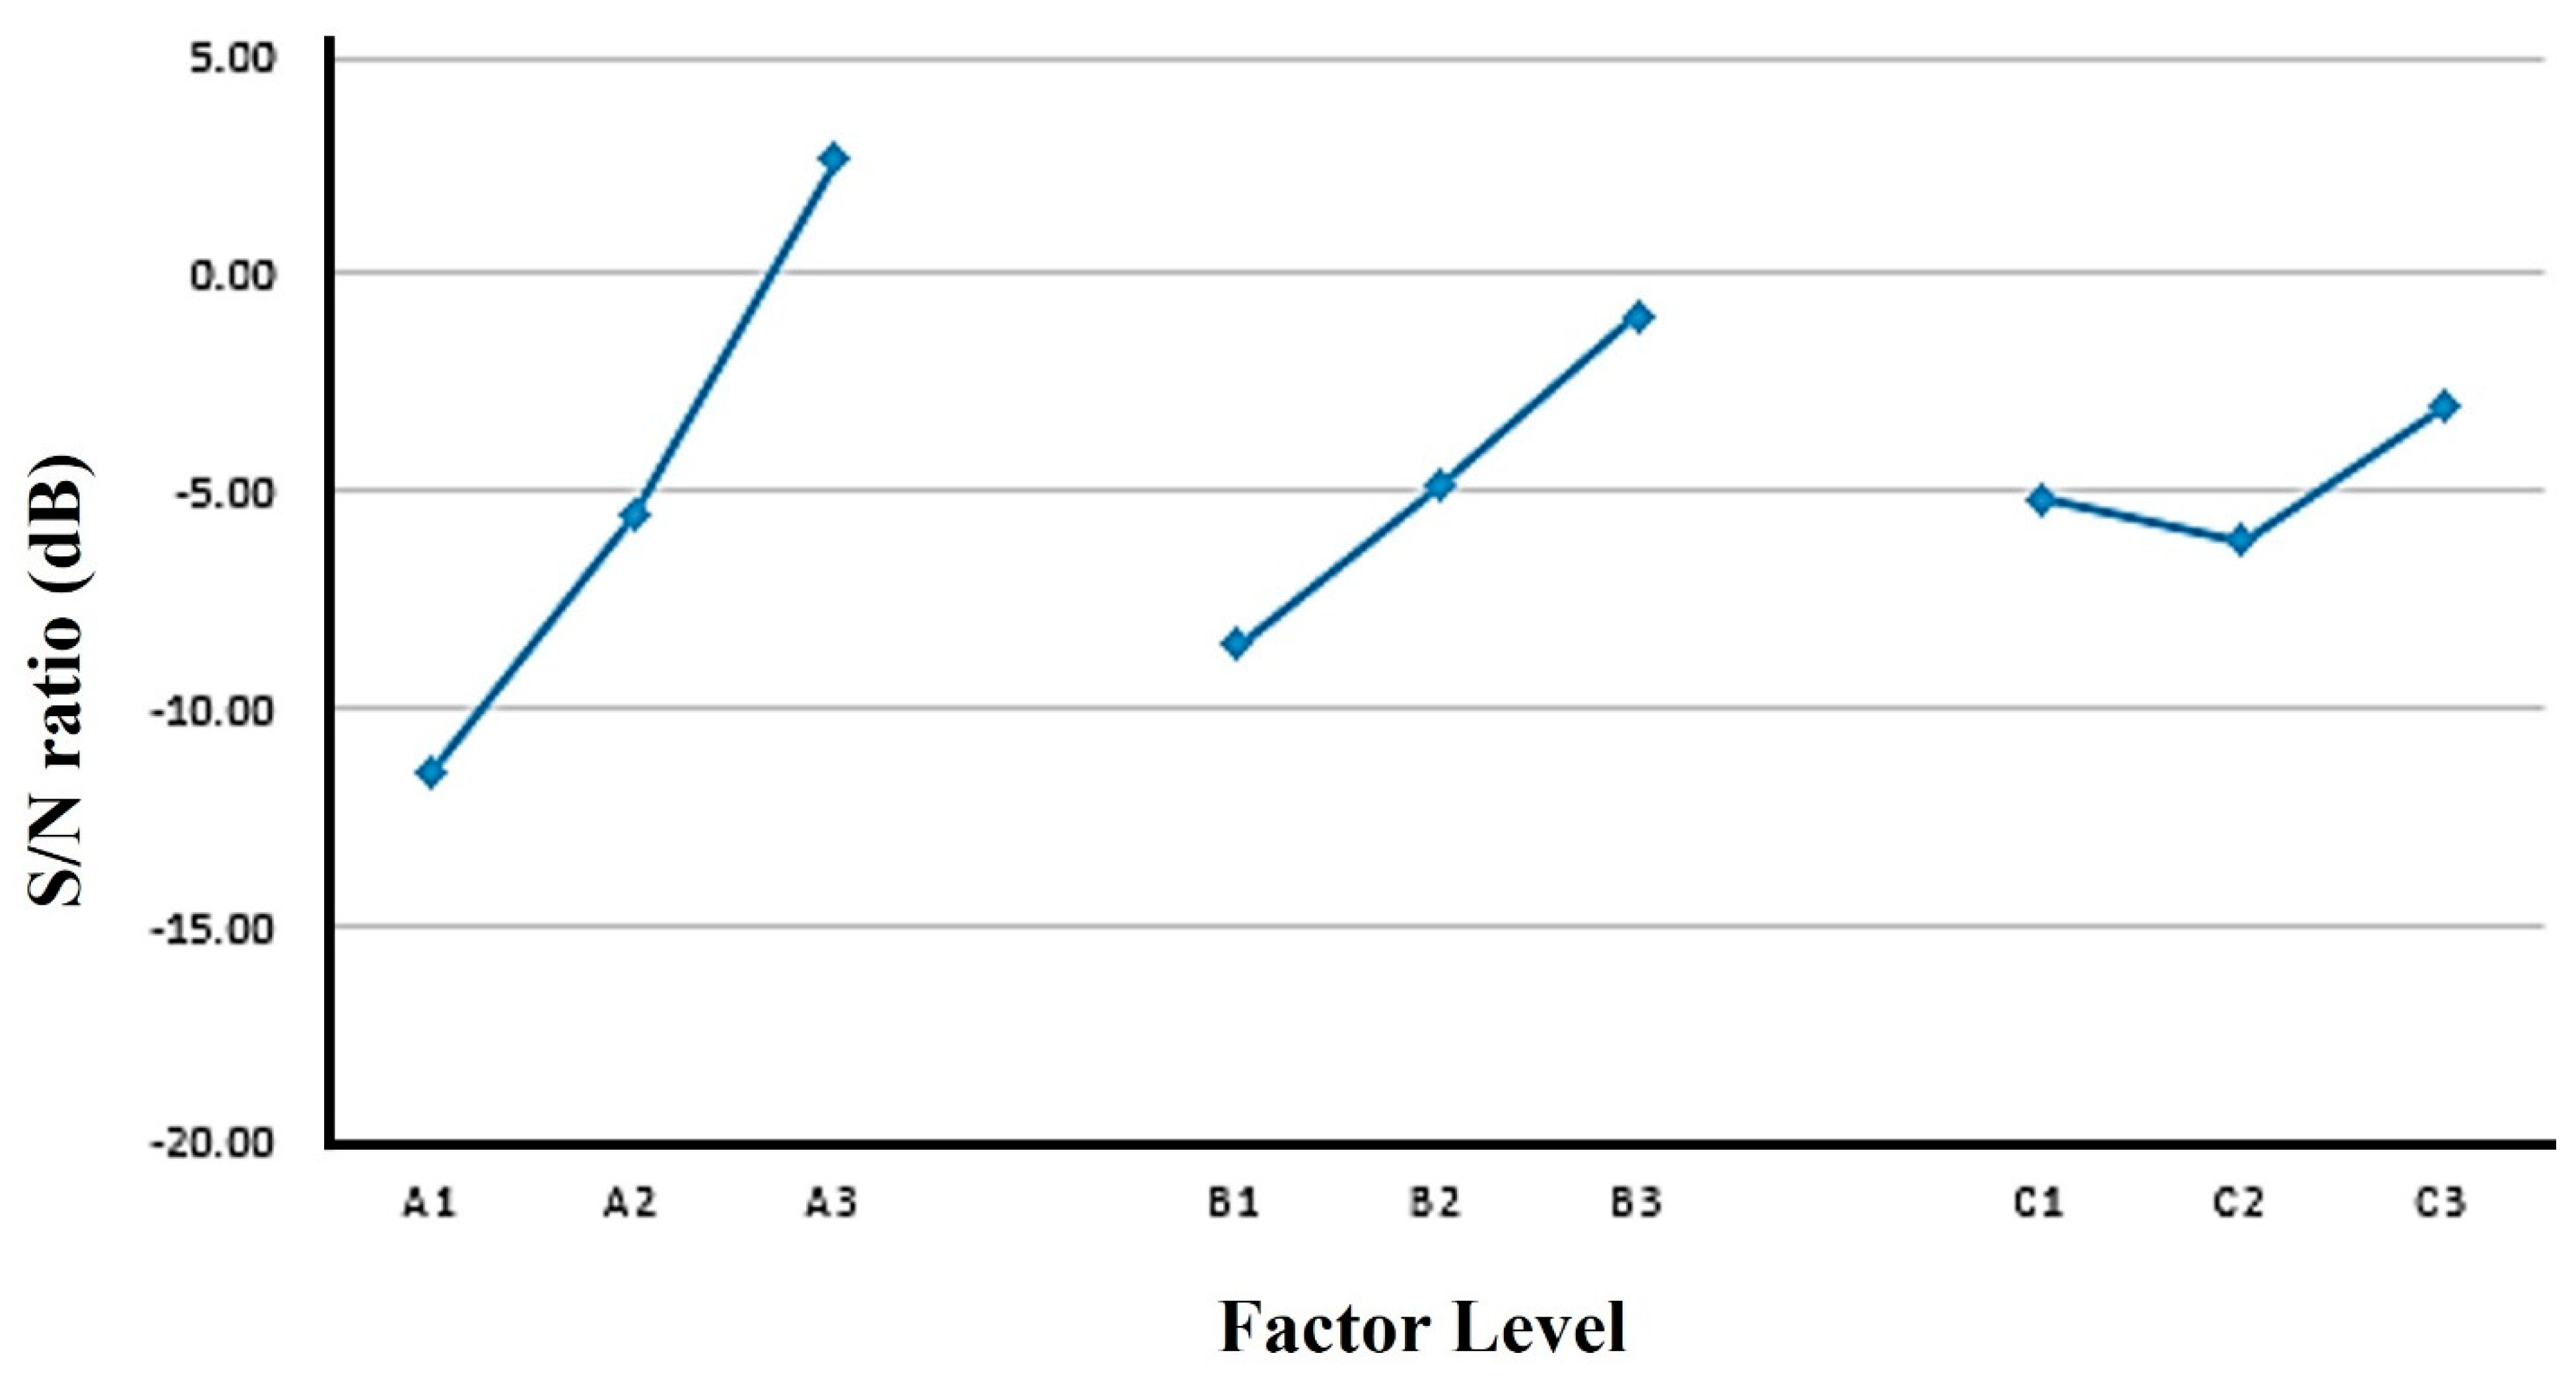
| A (kg/cm) | B (kg/cm) | C (kg/cm) | |
|---|---|---|---|
| Level 1 | −11.43 | −8.52 | −5.15 |
| Level 2 | −5.56 | −4.87 | −6.14 |
| Level 3 | 2.64 | −0.95 | −3.06 |
| Max | 2.64 | −0.95 | −3.06 |
| Min | −11.43 | −8.52 | −6.14 |
| effect | 14.07 | 7.57 | 3.08 |
| Ranking | 1 | 2 | 3 |
| Peel Strength S/N Ratio | Shear Strength S/N Ratio | |
|---|---|---|
| 1 | −16.62 | 28.87 |
| 2 | −12.25 | 30.00 |
| 3 | −5.42 | 30.25 |
| 4 | −10.20 | 29.40 |
| 5 | −5.02 | 29.67 |
| 6 | −1.47 | 30.45 |
| 7 | 1.26 | 28.75 |
| 8 | 2.64 | 29.34 |
| 9 | 4.03 | 30.50 |
| Maximum value | 4.03 | 30.50 |
| Minimum value | −16.62 | 28.75 |
| Difference | 20.65 | 1.76 |
| Peel Strength S/N Ratio | Shear Strength S/N Ratio | |
|---|---|---|
| X0 | 1 | 1 |
| X1 | 0.07 | 0 |
| X2 | 0.72 | 0.22 |
| X3 | 0.86 | 0.54 |
| X4 | 0.37 | 0.31 |
| X5 | 0.53 | 0.56 |
| X6 | 0.97 | 0.73 |
| X7 | 0.00 | 0.87 |
| X8 | 0.34 | 0.93 |
| X9 | 1.00 | 1.00 |
| Maximum value | 1.00 | 1.00 |
| Minimum value | 0.00 | 0.00 |
| Peel Strength S/N Ratio | Shear Strength S/N Ratio | Average | |
|---|---|---|---|
| X0 | 1.00 | 1.00 | 1.00 |
| X1 | 0.33 | 0.35 | 0.34 |
| X2 | 0.39 | 0.64 | 0.51 |
| X3 | 0.52 | 0.78 | 0.65 |
| X4 | 0.42 | 0.44 | 0.43 |
| X5 | 0.53 | 0.51 | 0.52 |
| X6 | 0.65 | 0.94 | 0.80 |
| X7 | 0.79 | 0.33 | 0.56 |
| X8 | 0.88 | 0.43 | 0.66 |
| X9 | 1.00 | 1.00 | 1.00 |
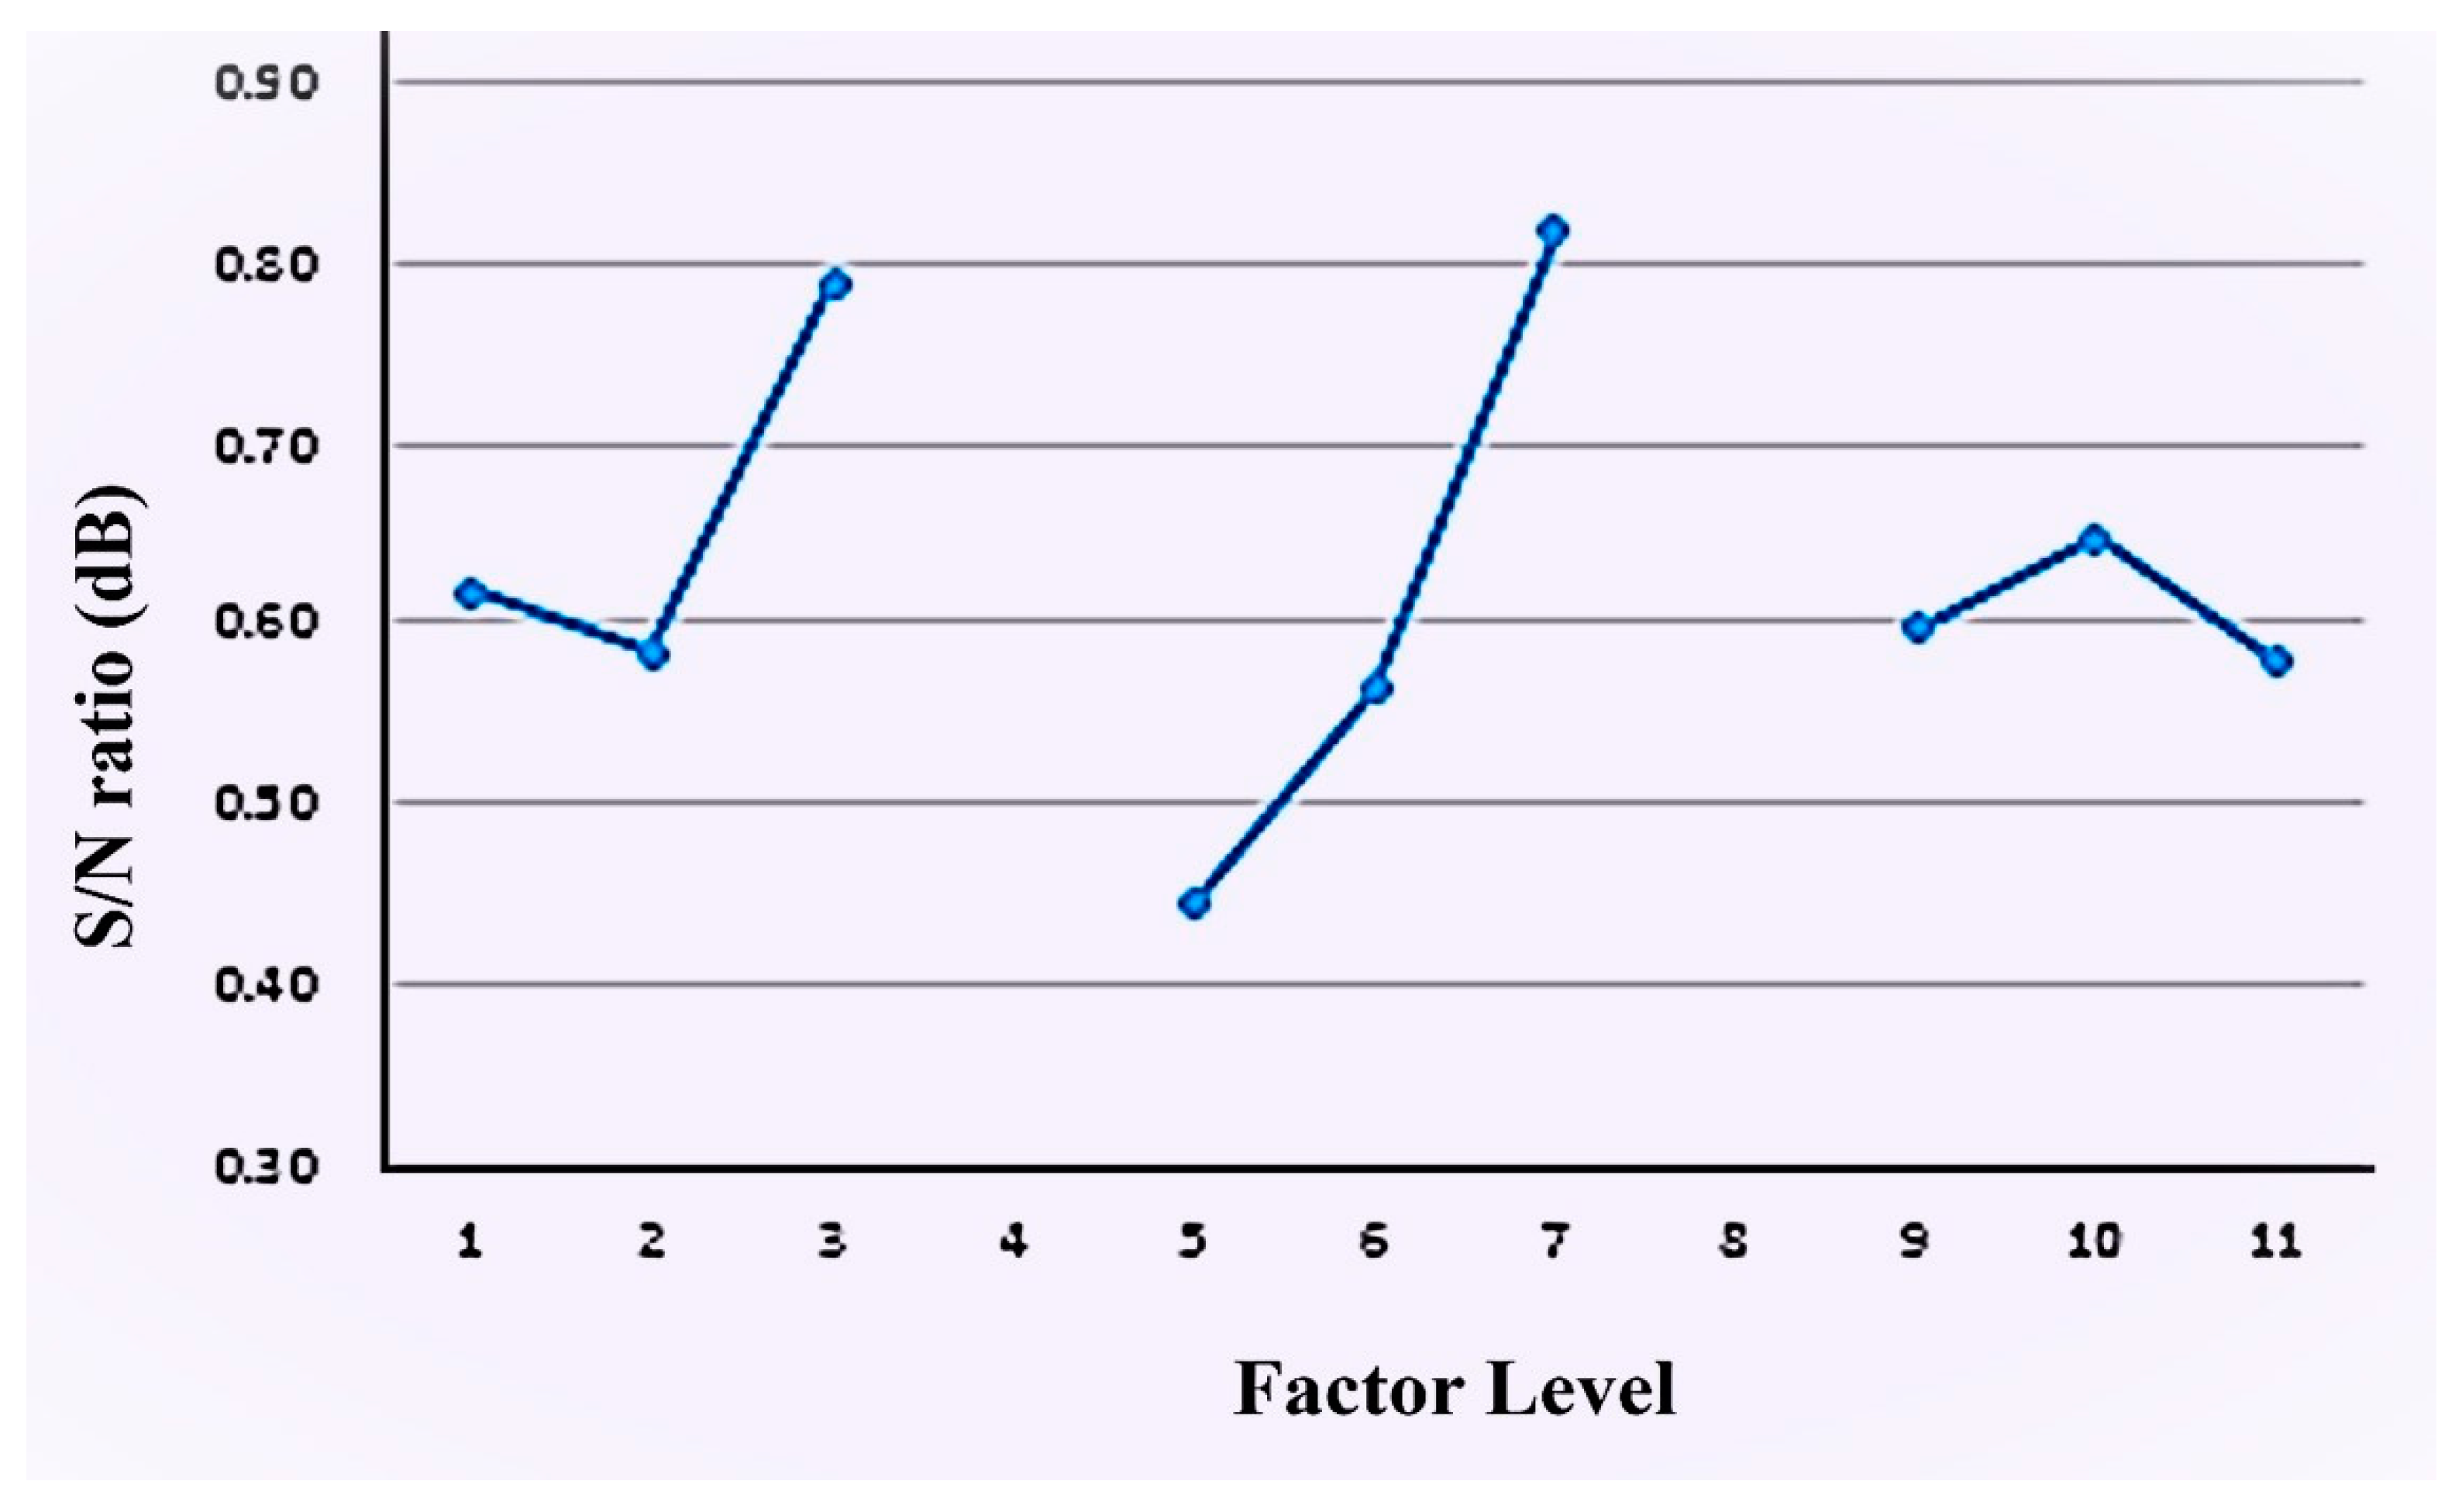
| A | B | C | |
|---|---|---|---|
| Polyol | NCO:OH Ratio | ODA Molar Ratio | |
| Level 1 | 0.62 | 0.44 | 0.60 |
| Level 2 | 0.58 | 0.56 | 0.65 |
| Level 3 | 0.74 | 0.82 | 0.58 |
| Max | 0.74 | 0.82 | 0.65 |
| Min | 0.58 | 0.44 | 0.58 |
| effect | 0.15 | 0.37 | 0.07 |
| ranking | 2.00 | 1.00 | 3.00 |
Disclaimer/Publisher’s Note: The statements, opinions and data contained in all publications are solely those of the individual author(s) and contributor(s) and not of MDPI and/or the editor(s). MDPI and/or the editor(s) disclaim responsibility for any injury to people or property resulting from any ideas, methods, instructions or products referred to in the content. |
© 2024 by the authors. Licensee MDPI, Basel, Switzerland. This article is an open access article distributed under the terms and conditions of the Creative Commons Attribution (CC BY) license (https://creativecommons.org/licenses/by/4.0/).
Share and Cite
Lin, S.-Y.; Ahmad, N.; Jeffrey Kuo, C.-F. Study of Synthesis of Dual-Curing Thermoplastic Polyurethane Hot-Melt Adhesive and Optimization by Using Gray Relational Analysis to Apply in Fabric Industry to Solve Seamless Bonding Issues. Polymers 2024, 16, 467. https://doi.org/10.3390/polym16040467
Lin S-Y, Ahmad N, Jeffrey Kuo C-F. Study of Synthesis of Dual-Curing Thermoplastic Polyurethane Hot-Melt Adhesive and Optimization by Using Gray Relational Analysis to Apply in Fabric Industry to Solve Seamless Bonding Issues. Polymers. 2024; 16(4):467. https://doi.org/10.3390/polym16040467
Chicago/Turabian StyleLin, Sheng-Yu, Naveed Ahmad, and Chung-Feng Jeffrey Kuo. 2024. "Study of Synthesis of Dual-Curing Thermoplastic Polyurethane Hot-Melt Adhesive and Optimization by Using Gray Relational Analysis to Apply in Fabric Industry to Solve Seamless Bonding Issues" Polymers 16, no. 4: 467. https://doi.org/10.3390/polym16040467
APA StyleLin, S.-Y., Ahmad, N., & Jeffrey Kuo, C.-F. (2024). Study of Synthesis of Dual-Curing Thermoplastic Polyurethane Hot-Melt Adhesive and Optimization by Using Gray Relational Analysis to Apply in Fabric Industry to Solve Seamless Bonding Issues. Polymers, 16(4), 467. https://doi.org/10.3390/polym16040467