
Preparation of Protein A Membranes Using Propargyl Methacrylate-Based Copolymers and Copper-Catalyzed Alkyne–Azide Click Chemistry


Abstract
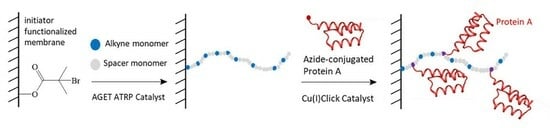
1. Introduction
2. Materials and Methods
2.1. Materials
2.2. Preparation of Azide-Functionalized Protein A
2.2.1. Reaction of Protein A with Azidobutyric Acid NHS Ester
2.2.2. Matrix-Assisted Laser Desorption Ionization-Time of Flight (MALDI-TOF) Mass Spectrometry
2.3. Membrane Preparation
2.3.1. Initiator Functionalization of Regenerated Cellulose Membranes
2.3.2. AGET ATRP of PEGMEMA300 and PgMA
2.3.3. Click Reaction onto PgMA-co-PEGMEMA300 Modified Membranes
2.4. Membrane Characterization
2.4.1. Attenuated Total Reflectance Fourier-Transform Infrared (ATR-FTIR) Spectroscopy
2.4.2. Water Permeability Measurements
2.4.3. Gravimetric Analysis
2.5. Performance of Protein A Membranes
2.5.1. Static Binding Capacity (SBC)
2.5.2. Dynamic Binding Capacity (DBC10)
3. Results and Discussion
3.1. Preparation of Azide-Functionalized Protein A
3.2. Characterization of ATRP Modified Membranes
3.2.1. ATR-FTIR of ATRP Modified Membranes
3.2.2. Gravimetric Analysis of ATRP Modified Membranes
3.2.3. Water-Permeability Analysis of ATRP Modified Membranes
3.3. Characterization of Clicked Membranes
3.4. Performance of Protein A Membranes
3.4.1. Static Binding Capacity (SBC) Results
3.4.2. Dynamic Binding Capacity (DBC10) Results
4. Conclusions
Supplementary Materials
Author Contributions
Funding
Institutional Review Board Statement
Data Availability Statement
Acknowledgments
Conflicts of Interest
References
- Ramos-de-la-Peña, A.; González-Valdez, J.; Aguilar, O. Protein A chromatography: Challenges and progress in the purification of monoclonal antibodies. J. Sep. Sci. 2019, 42, 1816–1827. [Google Scholar] [CrossRef] [PubMed]
- Lacki, K.; Riske, F. Affinity Chromatography: An Enabling Technology for Large-Scale Bioprocessing. Biotechnol. J. 2020, 15, 1800397. [Google Scholar] [CrossRef] [PubMed]
- Knudsen, H.; Fahrner, R.; Xu, Y.; Norling, L.; Blank, G. Membrane ion-exchange chromatography for process-scale antibody purification. J. Chromatogr. A 2001, 907, 145–154. [Google Scholar] [CrossRef] [PubMed]
- Ghosh, R. Protein separation using membrane chromatography: Opportunities and challenges. J. Chromatogr. A 2002, 952, 13–27. [Google Scholar] [CrossRef]
- Roque, A.; Pina, A.; Azevedo, A.; Aires-Barros, R.; Jungbauer, A.; Di Profio, G.; Heng, J.; Haigh, J.; Ottens, M. Anything but Conventional Chromatography Approaches in Bioseparation. Biotechnol. J. 2020, 15, 1900274. [Google Scholar] [CrossRef] [PubMed]
- Nadar, S.; Shooter, G.; Somasundaram, B.; Shave, E.; Baker, K.; Lua, L. Intensified Downstream Processing of Monoclonal Antibodies Using Membrane Technology. Biotechnol. J. 2021, 16, 2000309. [Google Scholar] [CrossRef]
- Ma, Z.W.; Lan, Z.W.; Matsuura, T.; Ramakrishna, S. Electrospun polyethersulfone affinity membrane: Membrane preparation and performance evaluation. J. Chromatogr. B 2009, 877, 3686–3694. [Google Scholar] [CrossRef]
- Akashi, N.; Kuroda, S. Preparation and characterization of Protein A-immobilized PVDF and PES membranes. Express Polym. Lett. 2015, 9, 2–13. [Google Scholar] [CrossRef][Green Version]
- Uzun, L.; Türkmen, D.; Karakoç, V.; Yavuz, H.; Denizli, A. Performance of Protein-A-Based Affinity Membranes for Antibody Purification. J. Biomater. Sci. Polym. Ed. 2011, 22, 2325–2341. [Google Scholar] [CrossRef]
- Zhu, J.; Sun, G. Bio-functionalized nanofibrous membranes as a hybrid platform for selective antibody recognition and capturing. RSC Adv. 2015, 5, 28115–28123. [Google Scholar] [CrossRef]
- Ma, Z.; Ramakrishna, S. Electrospun regenerated cellulose nanofiber affinity membrane functionalized with protein A/G for IgG purification. J. Membr. Sci. 2008, 319, 23–28. [Google Scholar] [CrossRef]
- Yang, L.; Hsiao, W.; Chen, P. Chitosan-cellulose composite membrane for affinity purification of biopolymers and immunoadsorption. J. Membr. Sci. 2002, 197, 185–197. [Google Scholar] [CrossRef]
- Langlotz, P.; Kroner, K. Surface-modified membranes as a matrix for protein-purification. J. Chromatogr. 1992, 591, 107–113. [Google Scholar] [CrossRef]
- Scinto, S.; Bilodeau, D.; Hincapie, R.; Lee, W.; Nguyen, S.; Xu, M.; Ende, C.; Finn, M.; Lang, K.; Lin, Q.; et al. Bioorthogonal chemistry. Nat. Rev. Methods Primers 2021, 1, 30. [Google Scholar] [CrossRef]
- Patterson, D.; Nazarova, L.; Prescher, J. Finding the Right (Bioorthogonal) Chemistry. Acs Chem. Biol. 2014, 9, 592–605. [Google Scholar] [CrossRef]
- Sosa, A.; Bednar, R.; Mehl, R.; Schwartz, D.; Kaar, J. Faster Surface Ligation Reactions Improve Immobilized Enzyme Structure and Activity. J. Am. Chem. Soc. 2021, 143, 7154–7163. [Google Scholar] [CrossRef] [PubMed]
- Neumann, S.; Biewend, M.; Rana, S.; Binder, W. The CuAAC: Principles, Homogeneous and Heterogeneous Catalysts, and Novel Developments and Applications. Macromol. Rapid Commun. 2020, 41, 1900359. [Google Scholar] [CrossRef] [PubMed]
- González-Valdez, J.; Yoshikawa, A.; Weinberg, J.; Benavides, J.; Rito-Palomares, M.; Przybycien, T. Toward Improving Selectivity in Affinity Chromatography with PEGylated Affinity Ligands: The Performance of PEGylated Protein A. Biotechnol. Progress 2014, 30, 1364–1379. [Google Scholar] [CrossRef] [PubMed]
- Hjelm, H.; Sjodahl, J.; Sjoquist, J. Immunologically active and structurally similar fragments of protein-A from staphylococcus-aureus. Eur. J. Biochem. 1975, 57, 395–403. [Google Scholar] [CrossRef]
- Saha, S.; Bruening, M.; Baker, G. Surface-Initiated Polymerization of Azidopropyl Methacrylate and Its Film Elaboration via Click Chemistry. Macromolecules 2012, 45, 9063–9069. [Google Scholar] [CrossRef] [PubMed][Green Version]
- Chiulan, I.; Panaitescu, D.; Serafim, A.; Radu, E.; Ionita, G.; Raditoiu, V.; Gabor, A.; Nicolae, C.; Ghiurea, M.; Baciu, D. Sponges from Plasma Treated Cellulose Nanofibers Grafted with Poly(ethylene glycol)methyl Ether Methacrylate. Polymers 2022, 14, 4720. [Google Scholar] [CrossRef]
- Singh, N.; Chen, Z.; Tomer, N.; Wickramasinghe, S.; Soice, N.; Husson, S. Modification of regenerated cellulose ultrafiltration membranes by surface-initiated atom transfer radical polymerization. J. Membr. Sci. 2008, 311, 225–234. [Google Scholar] [CrossRef]
- Bhut, B.V.; Wickramasinghe, S.R.; Husson, S.M. Preparation of high-capacity, weak anion-exchange membranes for protein separations using surface-initiated atom transfer radical polymerization. J. Membr. Sci. 2008, 325, 176–183. [Google Scholar] [CrossRef]
- Wang, J.; Sproul, R.T.; Anderson, L.S.; Husson, S.M. Development of multimodal membrane adsorbers for antibody purification using atom transfer radical polymerization. Polymer 2014, 55, 1404–1411. [Google Scholar] [CrossRef]
- Bhut, B.V.; Weaver, J.; Carter, A.R.; Wickramasinghe, S.R.; Husson, S.M. The Role of Polymer Nanolayer Architecture on the Separation Performance of Anion-Exchange Membrane Adsorbers: I. Protein Separations. Biotechnol. Bioeng. 2011, 108, 2645–2653. [Google Scholar] [CrossRef] [PubMed]
- Wiarachai, O.; Vilaivan, T.; Iwasaki, Y.; Hoven, V. Clickable and Antifouling Platform of Poly[(propargyl methacrylate)-ran-(2-methacryloyloxyethyl phosphorylcholine)] for Biosensing Applications. Langmuir 2016, 32, 1184–1194. [Google Scholar] [CrossRef]
- Meng, Y.; Wei, J.; Gao, P.; Jiang, Y. Self-assembling amphiphilic poly(propargyl methacrylate) grafted DNA copolymers into multi-strand helices. Soft Matter 2015, 11, 5610–5613. [Google Scholar] [CrossRef]
- Pavan, P.; Lorandi, F.; De Bon, F.; Gennaro, A.; Isse, A. Enhancement of the Rate of Atom Transfer Radical Polymerization in Organic Solvents by Addition of Water: An Electrochemical Study. Chemelectrochem 2021, 8, 2450–2458. [Google Scholar] [CrossRef]
- Braunecker, W.; Tsarevsky, N.; Gennaro, A.; Matyjaszewski, K. Thermodynamic Components of the Atom Transfer Radical Polymerization Equilibrium: Quantifying Solvent Effects. Macromolecules 2009, 42, 6348–6360. [Google Scholar] [CrossRef]
- Huang, W.; Kim, J.; Bruening, M.; Baker, G. Functionalization of surfaces by water-accelerated atom-transfer radical polymerization of hydroxyethyl methacrylate and subsequent derivatization. Macromolecules 2002, 35, 1175–1179. [Google Scholar] [CrossRef]
- Sumerlin, B.; Tsarevsky, N.; Louche, G.; Lee, R.; Matyjaszewski, K. Highly efficient “click” functionalization of poly(3-azidopropyl methacrylate) prepared by ATRP. Macromolecules 2005, 38, 7540–7545. [Google Scholar] [CrossRef]
- Yang, H.; Cai, Z.; Liu, H.; Cao, Z.; Xia, Y.; Ma, W.; Gong, F.; Tao, G.; Liu, C. Tailoring the surface of attapulgite by combining redox-initiated RAFT polymerization with alkynyl-thiol click reaction for polycarbonate nanocomposites:Effect of polymer brush chain length on mechanical, thermal and rheological properties. Mater. Chem. Phys. 2020, 241, 122334. [Google Scholar] [CrossRef]
- Penzol, G.; Armisén, P.; Fernández-Lafuente, R.; Rodés, L.; Guisán, J. Use of dextrans as long and hydrophilic spacer arms to improve the performance of immobilized proteins acting on macromolecules. Biotechnol. Bioeng. 1998, 60, 518–523. [Google Scholar] [CrossRef]


| MW/Charge (g/mol) | Control Protein A (g/mol) | Azide-Conjugated Protein A (g/mol) | Increase in Molecular Weight (g/mol) | Number of Azide Groups Added |
|---|---|---|---|---|
| M/Z | 46,401 ± 48 | 47,836 ± 93 | 1435 ± 45 | 12.9 ± 0.4 |
| M/2Z | 23,099 ± 27 | 23,885 ± 14 | 785 ± 42 | 14.2 ± 0.8 * |
| Langmuir Parameters | 36 mM Bib, 30% PgMA-co-70% PEGMEMA300 | 18 mM Bib, 30% PgMA-co-70% PEGMEMA300 |
|---|---|---|
| qmax (mg/mL) | 19.60 ± 1.88 | 5.98 ± 0.37 |
| Apparent Kd (mg/mL) | 9.9 × 10⁻¹ ± 2.9 × 10⁻¹ | 5.4 × 10⁻² ± 3.5 × 10⁻² |
Disclaimer/Publisher’s Note: The statements, opinions and data contained in all publications are solely those of the individual author(s) and contributor(s) and not of MDPI and/or the editor(s). MDPI and/or the editor(s) disclaim responsibility for any injury to people or property resulting from any ideas, methods, instructions or products referred to in the content. |
© 2024 by the authors. Licensee MDPI, Basel, Switzerland. This article is an open access article distributed under the terms and conditions of the Creative Commons Attribution (CC BY) license (https://creativecommons.org/licenses/by/4.0/).
Share and Cite
Osuofa, J.; Husson, S.M. Preparation of Protein A Membranes Using Propargyl Methacrylate-Based Copolymers and Copper-Catalyzed Alkyne–Azide Click Chemistry. Polymers 2024, 16, 239. https://doi.org/10.3390/polym16020239
Osuofa J, Husson SM. Preparation of Protein A Membranes Using Propargyl Methacrylate-Based Copolymers and Copper-Catalyzed Alkyne–Azide Click Chemistry. Polymers. 2024; 16(2):239. https://doi.org/10.3390/polym16020239
Chicago/Turabian StyleOsuofa, Joshua, and Scott M. Husson. 2024. "Preparation of Protein A Membranes Using Propargyl Methacrylate-Based Copolymers and Copper-Catalyzed Alkyne–Azide Click Chemistry" Polymers 16, no. 2: 239. https://doi.org/10.3390/polym16020239
APA StyleOsuofa, J., & Husson, S. M. (2024). Preparation of Protein A Membranes Using Propargyl Methacrylate-Based Copolymers and Copper-Catalyzed Alkyne–Azide Click Chemistry. Polymers, 16(2), 239. https://doi.org/10.3390/polym16020239