Article

The Preparation and Characterization of Chitosan/Calcium Phosphate Composite Microspheres for Biomedical Applications

1
Department of Materials Science and Engineering, National Chung Hsing University, Taichung 402, Taiwan
2
Department of Orthopedics, National Defense Medical Center, Taipei 114, Taiwan
3
Department of Orthopedics, Taichung Armed Forces General Hospital, Taichung 404, Taiwan
*
Author to whom correspondence should be addressed.
Polymers 2024, 16(2), 167; https://doi.org/10.3390/polym16020167
Submission received: 28 November 2023 / Revised: 27 December 2023 / Accepted: 3 January 2024 / Published: 5 January 2024
(This article belongs to the Special Issue Preparation and Application of Biomass-Based Materials)

Abstract

:
In this study, we successfully prepared porous composite microspheres composed of hydroxyapatite (HAp), di-calcium phosphate di-hydrated (DCPD), and chitosan through the hydrothermal method. The chitosan played a crucial role as a chelating agent to facilitate the growth of related calcium phosphates. The synthesized porous composite microspheres exhibit a specific surface area of 38.16 m2/g and a pore volume of 0.24 cm3/g, with the pore size ranging from 4 to 100 nm. Given the unique properties of chitosan and the exceptional porosity of these composite microspheres, they may serve as carriers for pharmaceuticals. After being annealed, the chitosan transforms into a condensed form and the DCPD transforms into Ca2P2O7 at 300 °C. Then, the Ca2P2O7 initially combines with HAp to transform into β tricalcium phosphate (β-TCP) at 500 °C where the chitosan is also completely combusted. Finally, the microspheres are composed of Ca2P2O7, β-TCP, and HAp, also making them suitable for applications such as injectable bone graft materials.

1. Introduction

Extensive research has been conducted in the field of biomaterials, encompassing various materials like metals, ceramics, polymers, composites, and the associated sciences, including chemistry, physics, polymer chemistry, polymer physics, biochemistry, and biophysics. Biopolymers, which include synthetic polymers like PLA (polylactic acid), PGA (polyglycolic acid), and PLAGA (polylactic acid–glycolic acid), as well as natural polymers including collagen, gelatin, hyaluronic acid, and chitosan, have drawn more attention recently. These materials have piqued interest due to their excellent biocompatibility and biodegradability, leading to their application in various fields, including bone tissue scaffolds [1,2,3], drug delivery systems [4,5,6,7], and artificial organ development [8,9].
Chitosan, as illustrated in Figure 1, is a derivative of chitin and comprises 2-amino-2-deoxy-D-glucose and 2-acetamido-2-deoxy-D-glucose units. It possesses favorable characteristics, being both biocompatible, biodegradable, and bio-adhesive [10,11,12,13]. Its utility extends to the field of bone tissue engineering, where it plays a crucial role. Chitosan can also be harnessed to create microspheres for potential drug delivery systems [14,15], employing various methods, including but not limited to spray drying [16,17,18], emulsification/solvent evaporation [19,20,21], ionotropic gelation [22,23,24], and the coacervation technique, among others [25,26].
Much like chitosan, calcium phosphate (CaP) has garnered significant attention within the realm of bone tissue engineering due to its striking resemblance to the minerals found in natural bone and its exceptional biocompatibility and bioactivity [27,28,29]. CaP encompasses a multitude of variants [30]. Hydroxyapatite (HAp, Ca10(PO4)6(OH)2), the most stable among them, serves as a primary constituent in bones and teeth. Other types of CaP include octa-calcium phosphate (OCP, Ca8(HPO4)2(PO4)4·5H2O), tetra-calcium phosphate (TTCP, Ca4(PO4)2O), tricalcium phosphate (TCP, Ca3(PO4)2), dicalcium phosphate dihydrate (DCPD, CaHPO4·H2O), and dicalcium phosphate anhydrous (DCPA, CaHPO4). Numerous fabrication techniques have been employed to create calcium phosphate, including hydrothermal processes [31,32,33], solid-state reactions [34,35], sol–gel synthesis [36,37], co-precipitation [38,39], and micro-emulsion synthesis [40].
For the building of bone tissue scaffolds, composite materials containing both chitosan and calcium phosphate have also been developed [41,42,43]. These composite materials have been made using a variety of manufacturing processes, such as electron electrospinning [44], ionic diffusion processes [45], freezing and lyophilization [46,47], and stepwise coprecipitation [48].
Osteomyelitis has emerged as a growing health concern, primarily attributed to bone infections, with the predominant microbial pathogen being staphylococci [49]. This condition involves inflammatory remodeling, bone destruction, and the deposition of new bone, driven by the activity of osteoblasts. Consequently, bone necrosis ensues, impacting one or more tissues and locations within the bone structure [50,51]. Osteomyelitis is categorized into three types based on its etiology. One type, resulting from local bacterial colonization, is frequently observed in post-traumatic wounds and following orthopedic surgery, especially those involving implants. The second type of osteomyelitis arises from insufficient blood supply, commonly secondary to soft tissue infection in the feet of individuals with diabetes. Meanwhile, hematogenic osteomyelitis, the third type, is more prevalent in children [52,53]. A study employing HAp as a carrier loaded with ciprofloxacin demonstrated notable antimicrobial activity, effectively enhancing the proliferation and osteogenic differentiation of rat bone marrow mesenchymal stem cells [54]. Commonly utilized antibiotics for bone infection therapy include gentamicin, vancomycin, and zyvox (linezolid) [55].
In this study, we employed the hydrothermal method to synthesize porous microspheres of CaP/chitosan in an aqueous solution containing Ca(NO3)2·4H2O and NH4H2PO4, with chitosan serving as a chelating agent. Comprehensive characterizations of these composite microspheres were conducted using techniques such as SEM, TEM, XRD, FTIR, and specific surface area porosimetry and chemisorption analysis to delve into the formation mechanism. Additionally, we examined the potential application of gentamicin, vancomycin, and zyvox-loaded microspheres in drug delivery systems.

2. Experimental

2.1. Materials

We procured Ca(NO3)2·4H2O (98.5%) and NH4H2PO4 (99.0%) from SHOWA, Tokyo, Japan, while the chitosan particles were sourced from Fluka Chemical, Buchs, Germany. To prepare a 1 wt.% chitosan (from crab shells, Sigma-Aldrich Co., St. Louis, MO, USA) solution, 3 g of chitosan was dissolved in a 297 mL aqueous solution containing 0.33% acetic acid, and the mixture was stirred for one day.

2.2. Synthesis of the Porous Chitosan Calcium Phosphate Microsphere (Chi-CaPM)

A composite solution was created by combining 0.042 M calcium nitrate (Ca(NO3)2·4H2O) and 0.025 M ammonium dihydrogen phosphate (NH4H2PO4), ensuring a Ca/P ratio of 1.67 for the calcium phosphate (CaP) solution. Subsequently, both the CaP solution and the 1 wt.% chitosan solution were heated to 65 °C in a water bath for an hour. They were then mixed and maintained at 65 °C for an additional half hour. During this time, white precipitates gradually settled. These precipitates were collected using a filter and subsequently subjected to 24 h of drying in an oven at 50 °C. Finally, the prepared samples underwent annealing at temperatures of 150, 300, 500, and 700 °C to investigate potential phase transformations. The experimental workflow is visually represented in Figure 2.

2.3. Characterization of the Powder

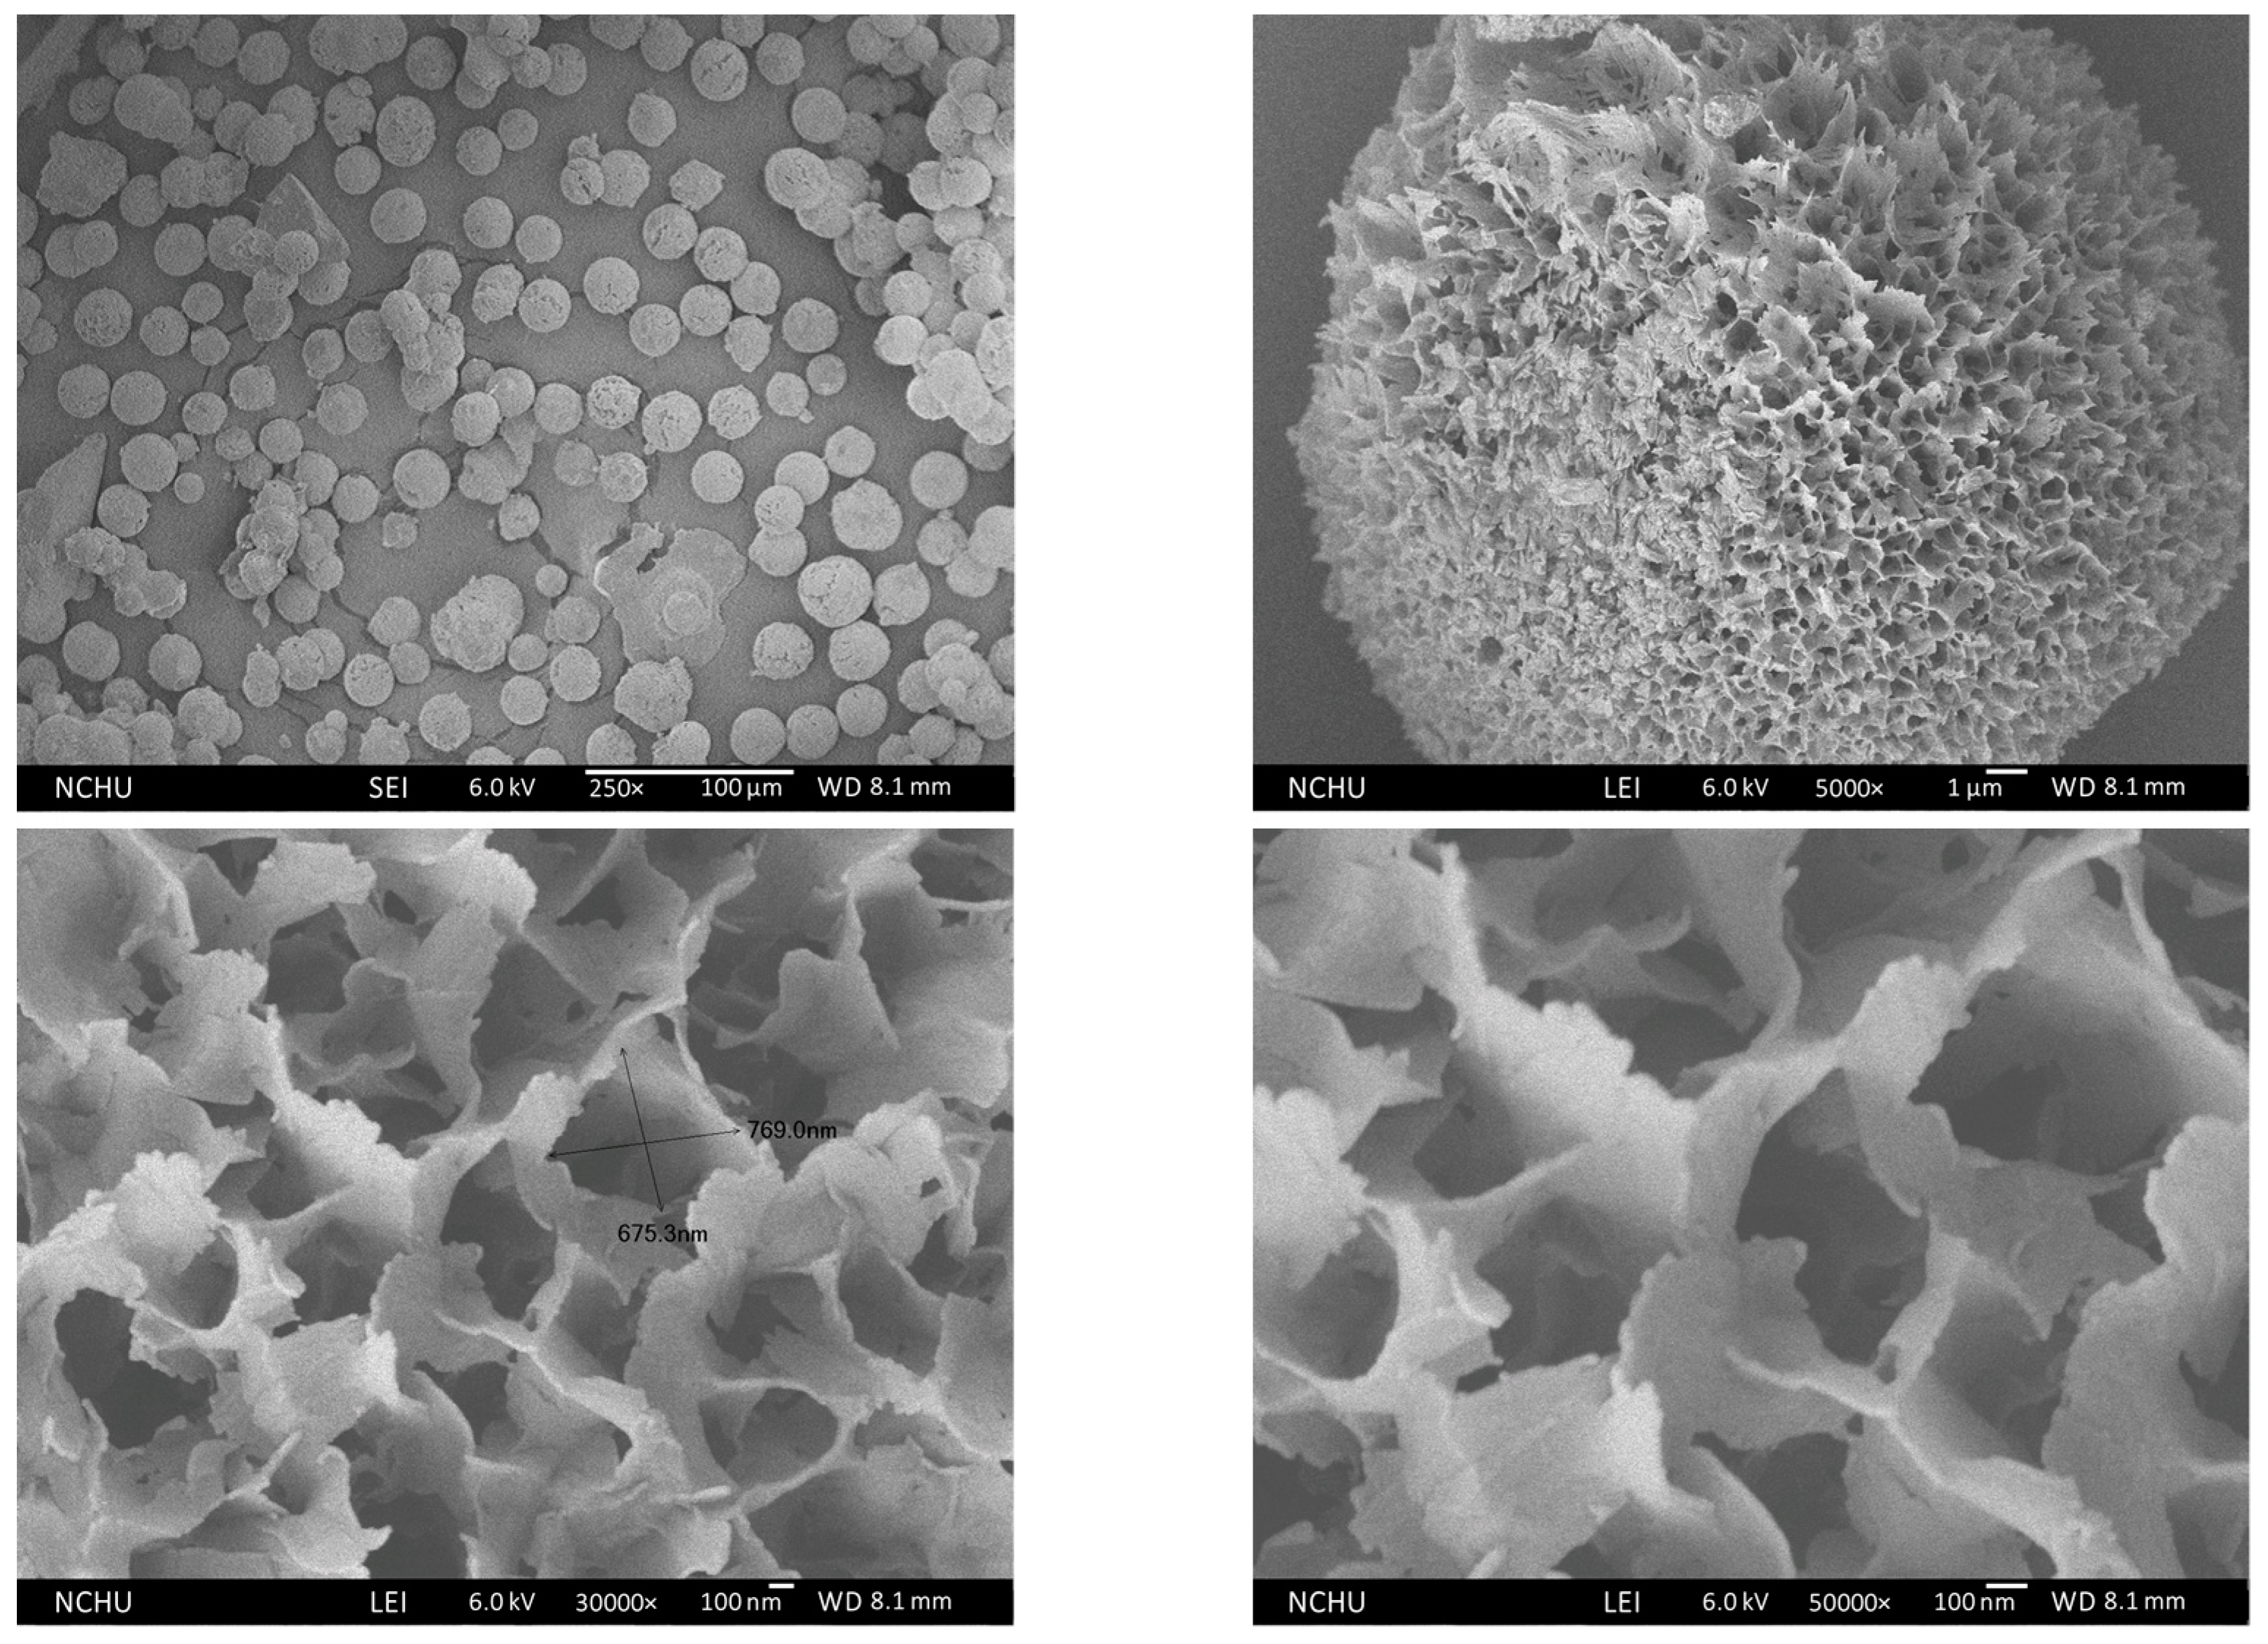
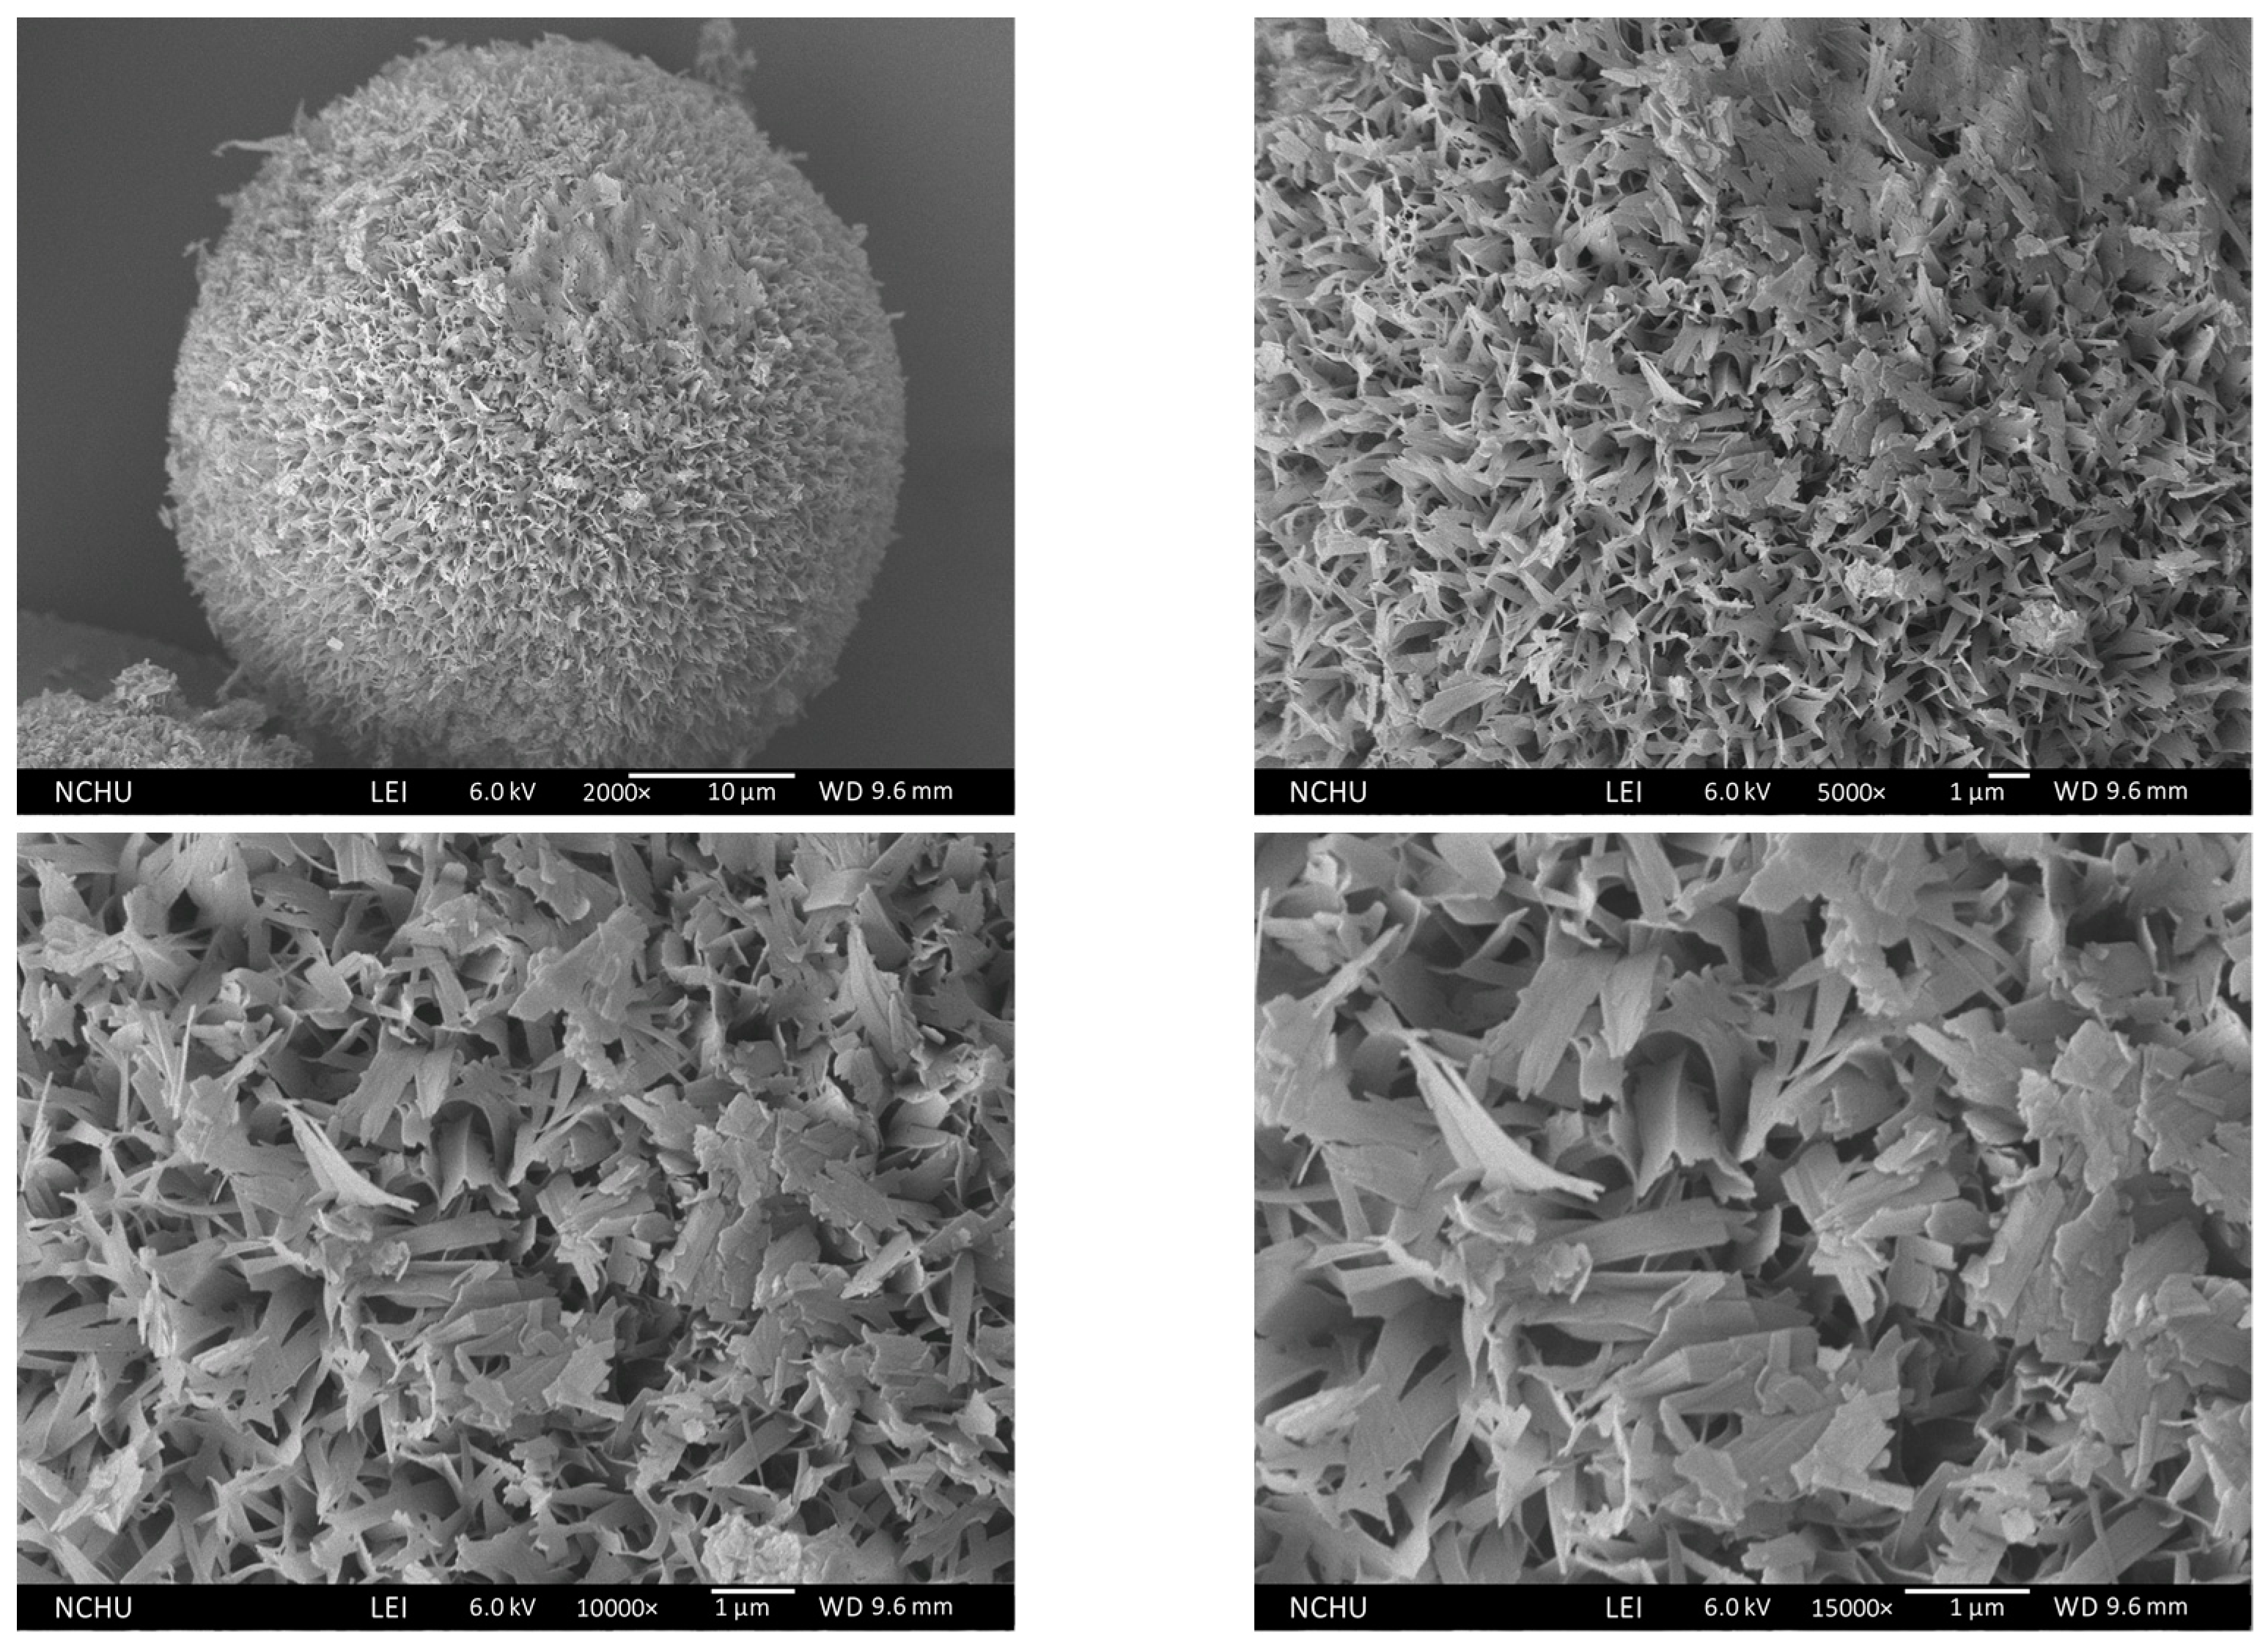
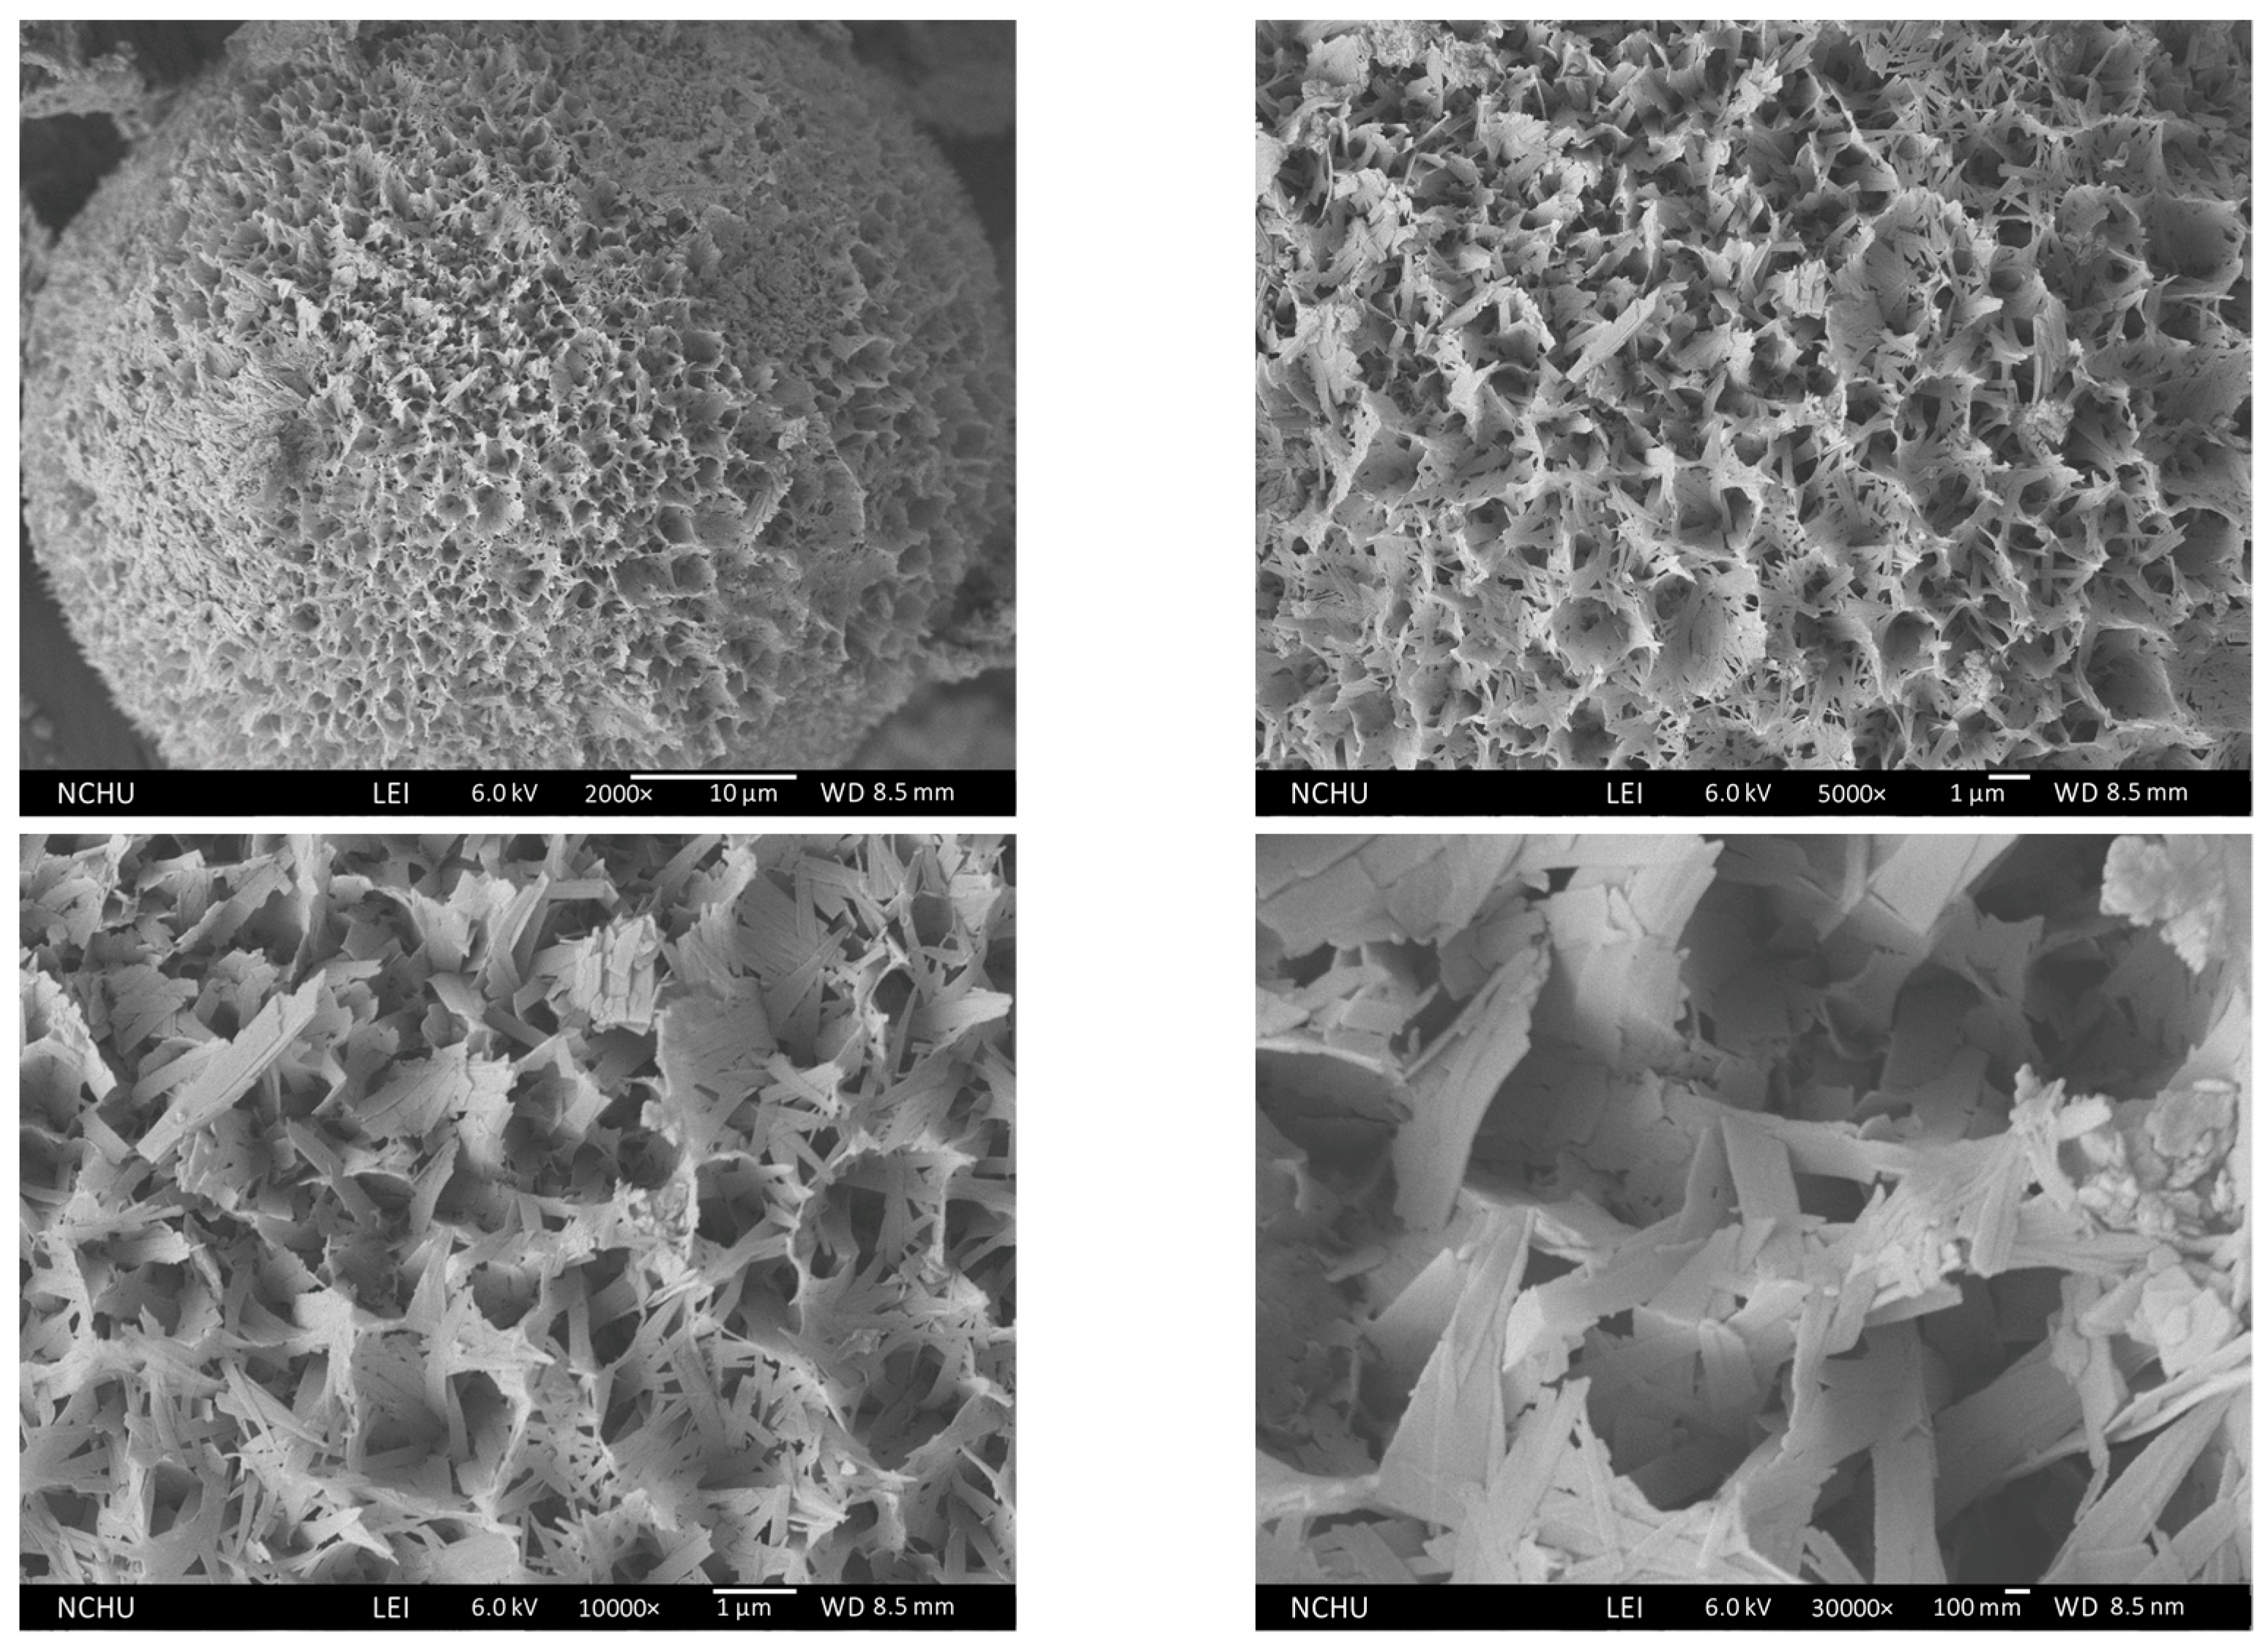
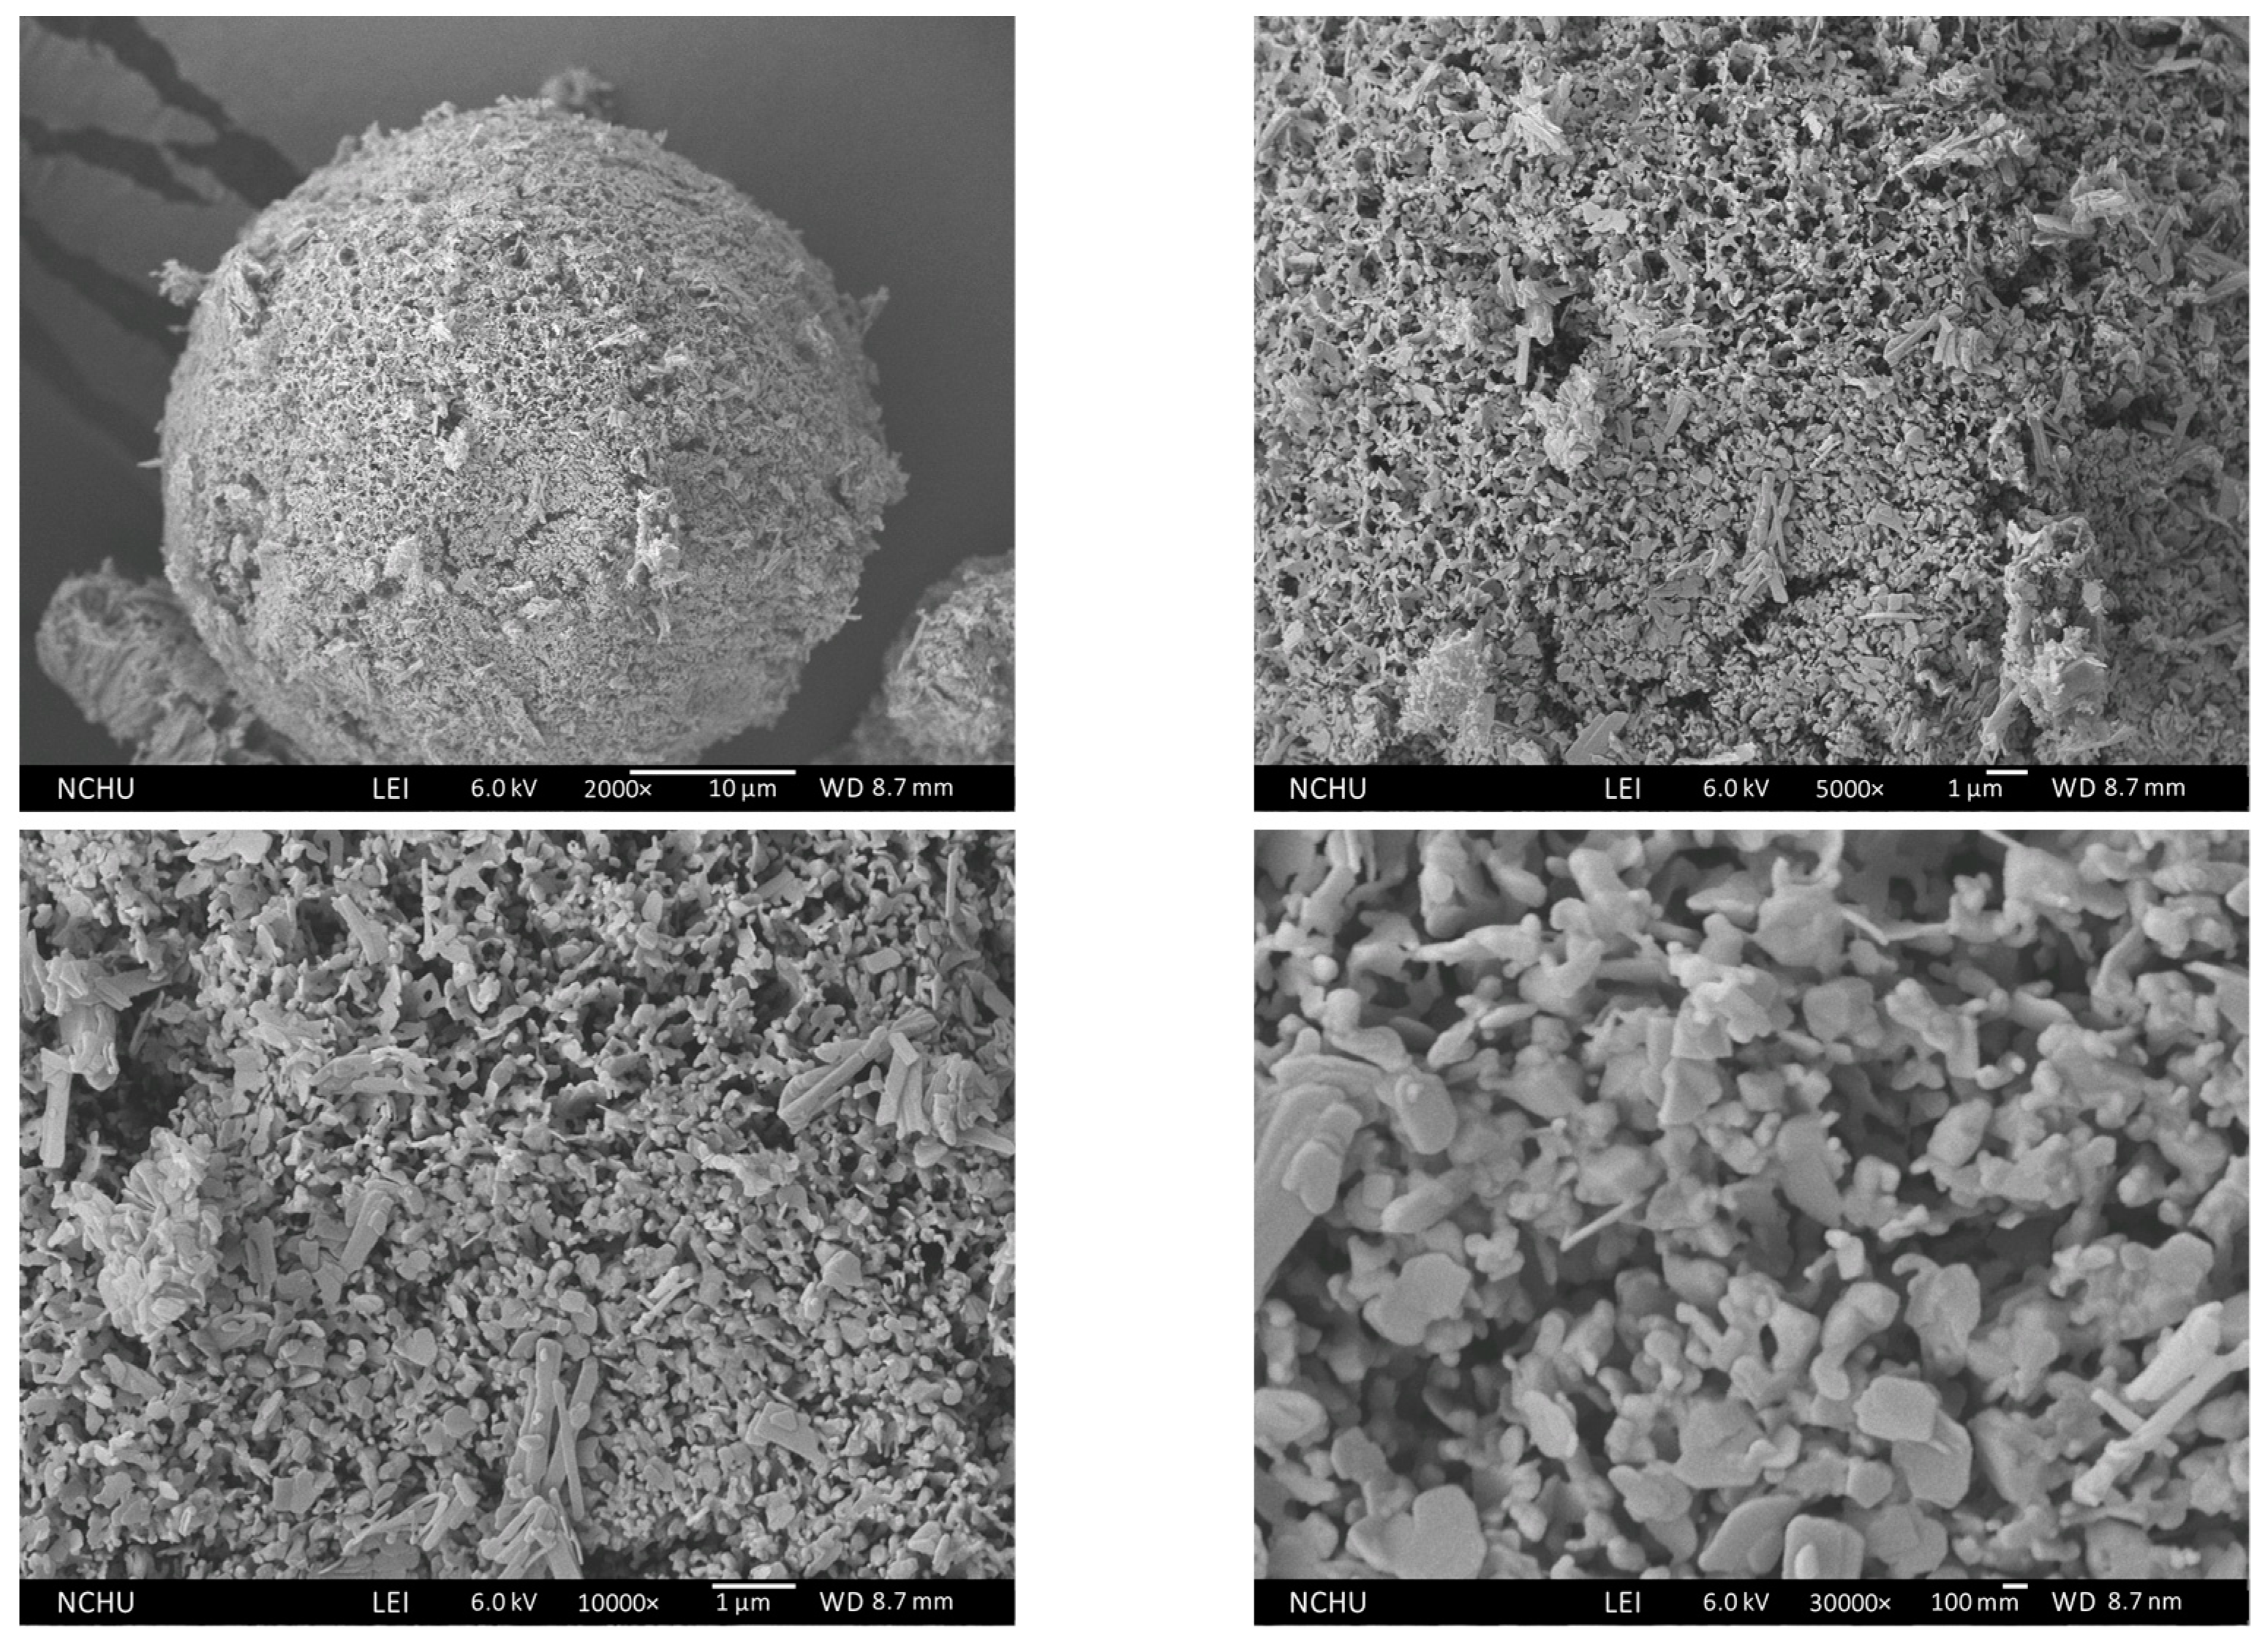
2.3.1. Field Emission Scanning Electron Microscopy (FESEM) Analysis

The dried powders, once collected, underwent a gold coating process to facilitate observation using a FE-SEM (JSM-6700F, JEOL, Tokyo, Japan). Furthermore, the elemental composition of these powders was analyzed through the employment of an energy dispersive spectrometer (EDS, OXFORD INCA ENERGY 400, Oxfordshire, UK).

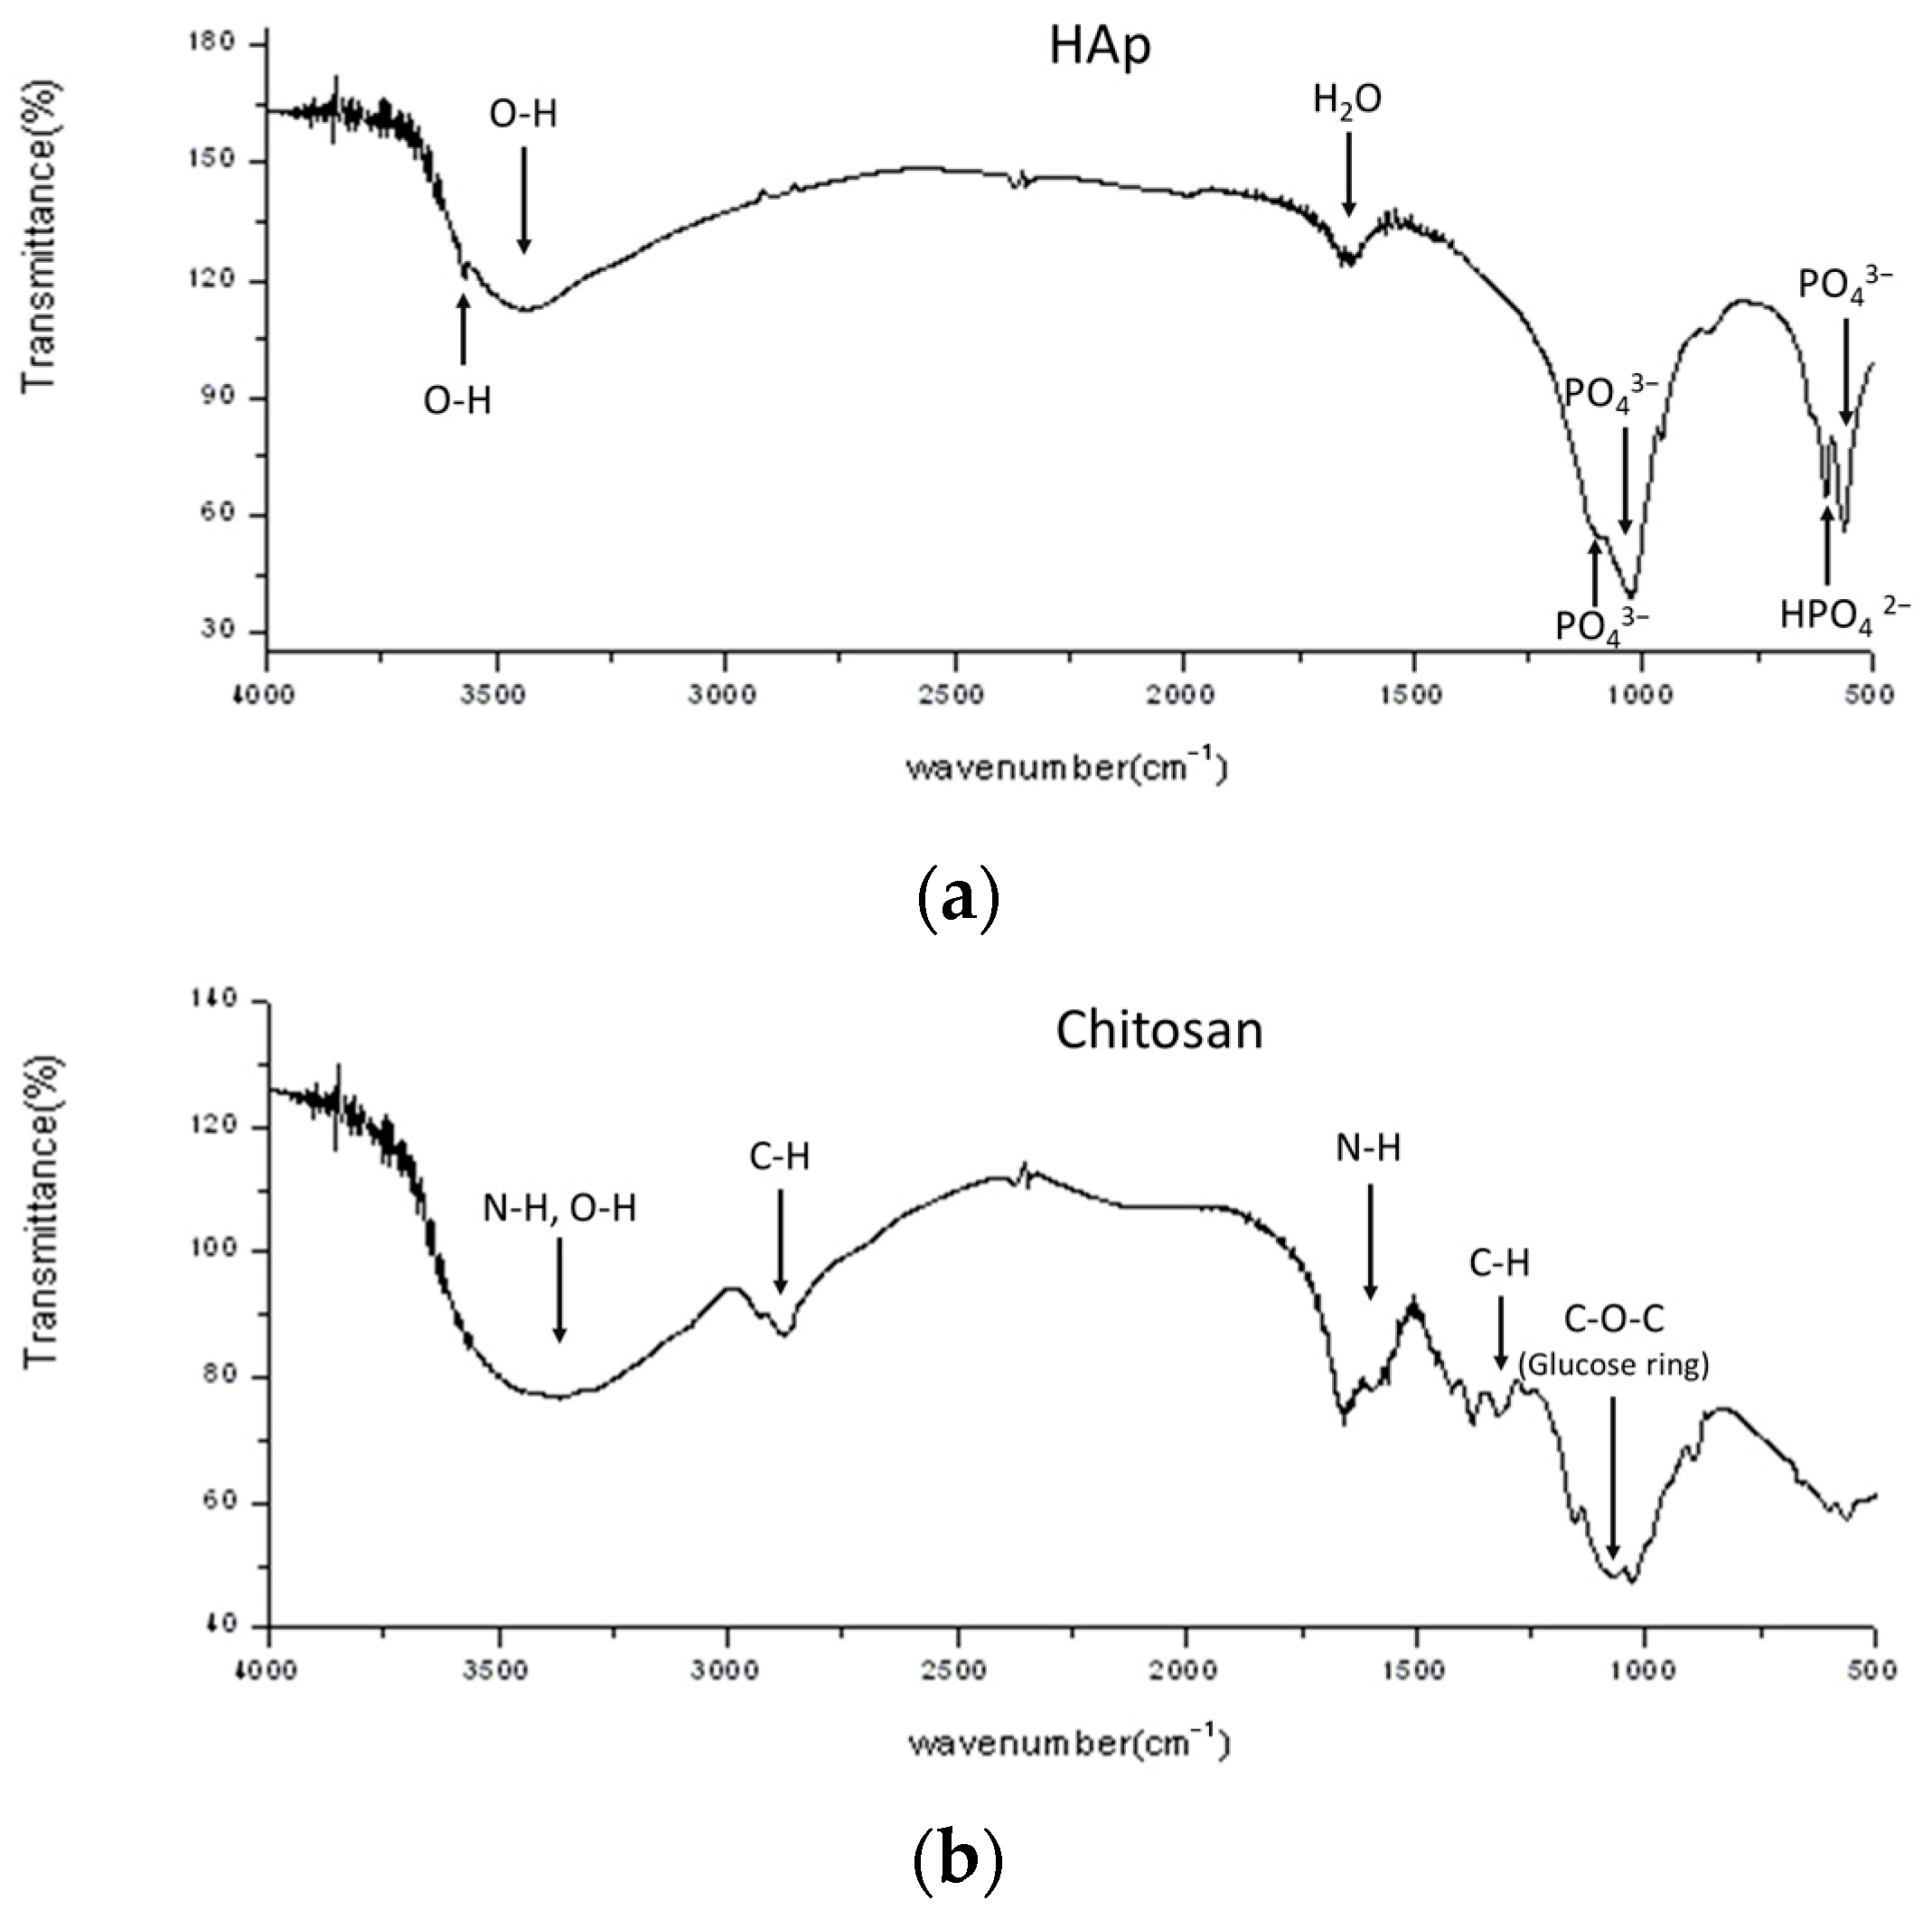
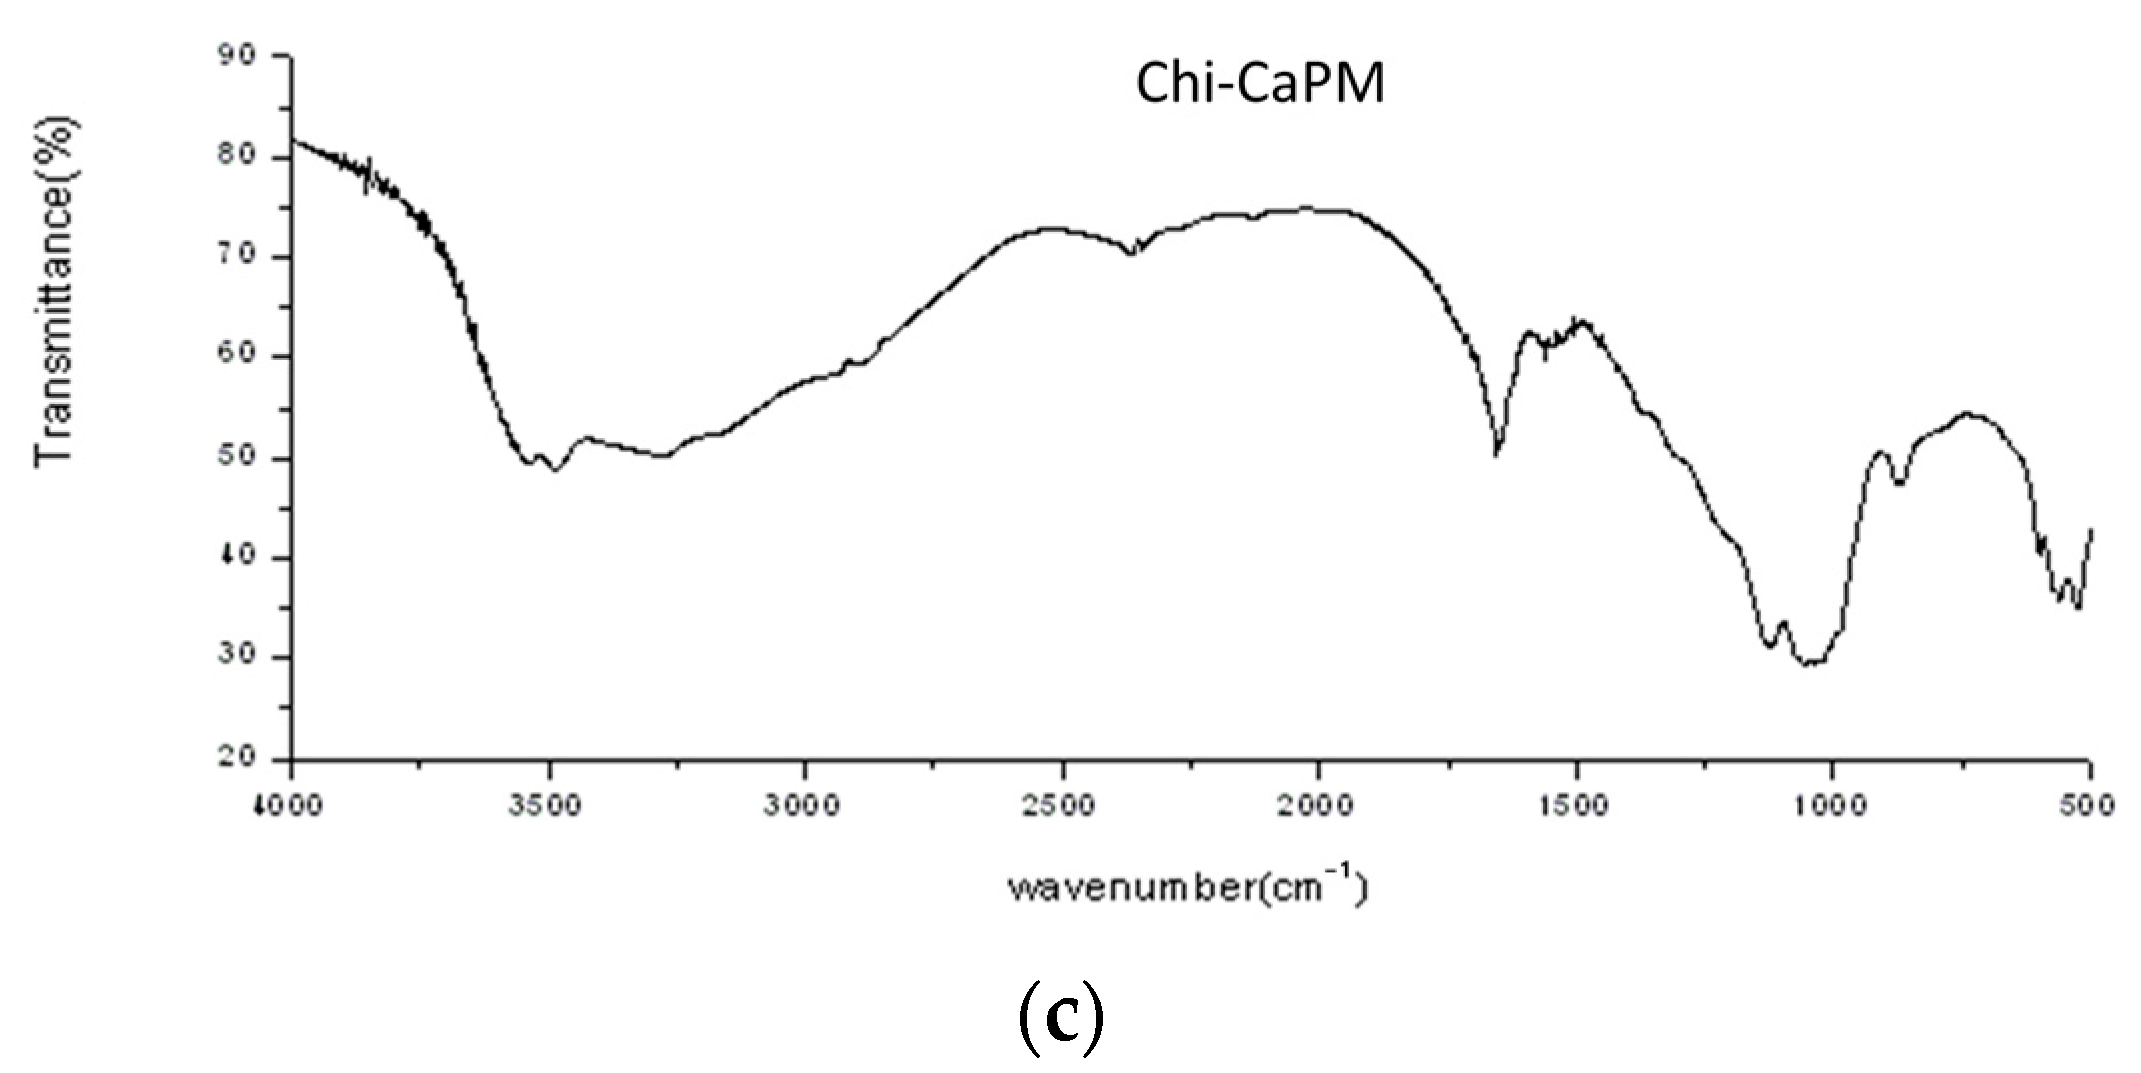
2.3.2. Fourier Transform Infrared Spectroscopy (FTIR) Analysis

For the FTIR analysis, the prepared powders were mixed with KBr in a ratio of 1:100. This analysis involved examining chemical bonds within the samples, with a wave number range from 4000 to 400 cm−1.

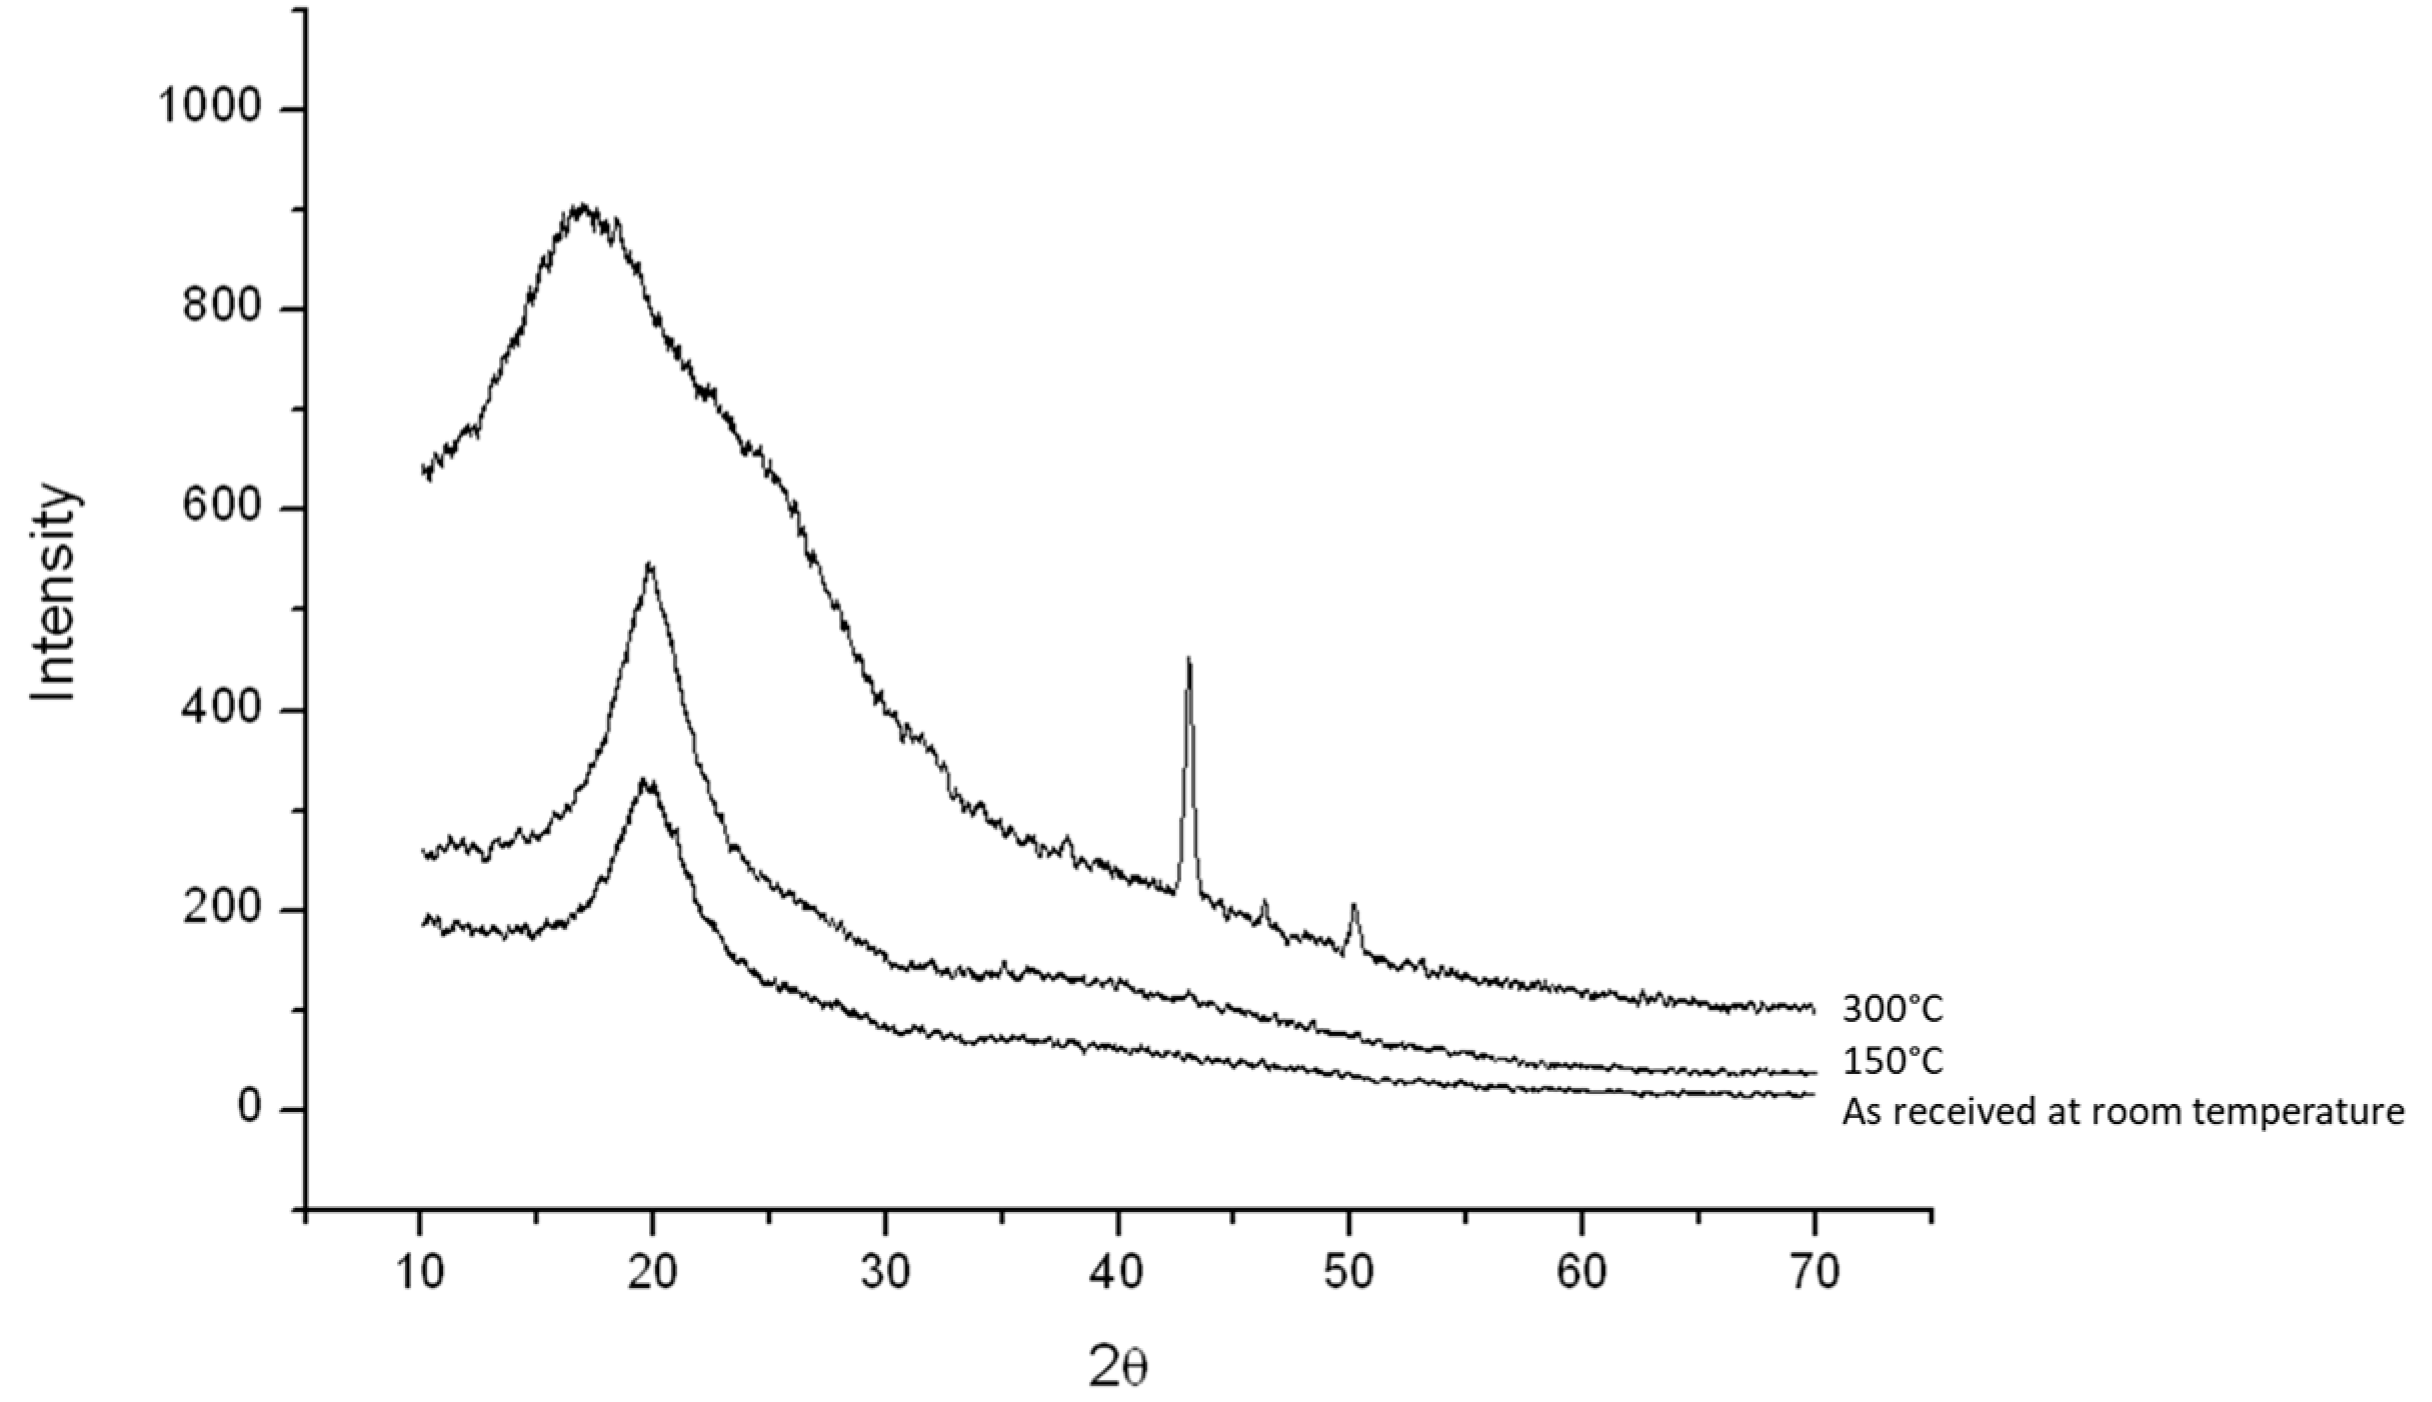
2.3.3. Crystal Structure Analysis

X-ray diffractions (XRD) were conducted with the Mac Science MO3x-HF Diffraction instrument from Yokohama, Japan, using Cu Kα radiation (λ = 1.5418 Å) at a voltage of 40 kV and a current of 30 mA, 2θ from 10° to 70° with a scanning rate of 2° per minute. According to Bragg’s law (2dsinθ = λ), there could be diffraction patterns. Subsequently, these diffraction patterns were analyzed and cross-referenced with the International Centre for Diffraction Data (ICDD) (Newtown Square, PA, USA) to facilitate the identification of the crystal structure.

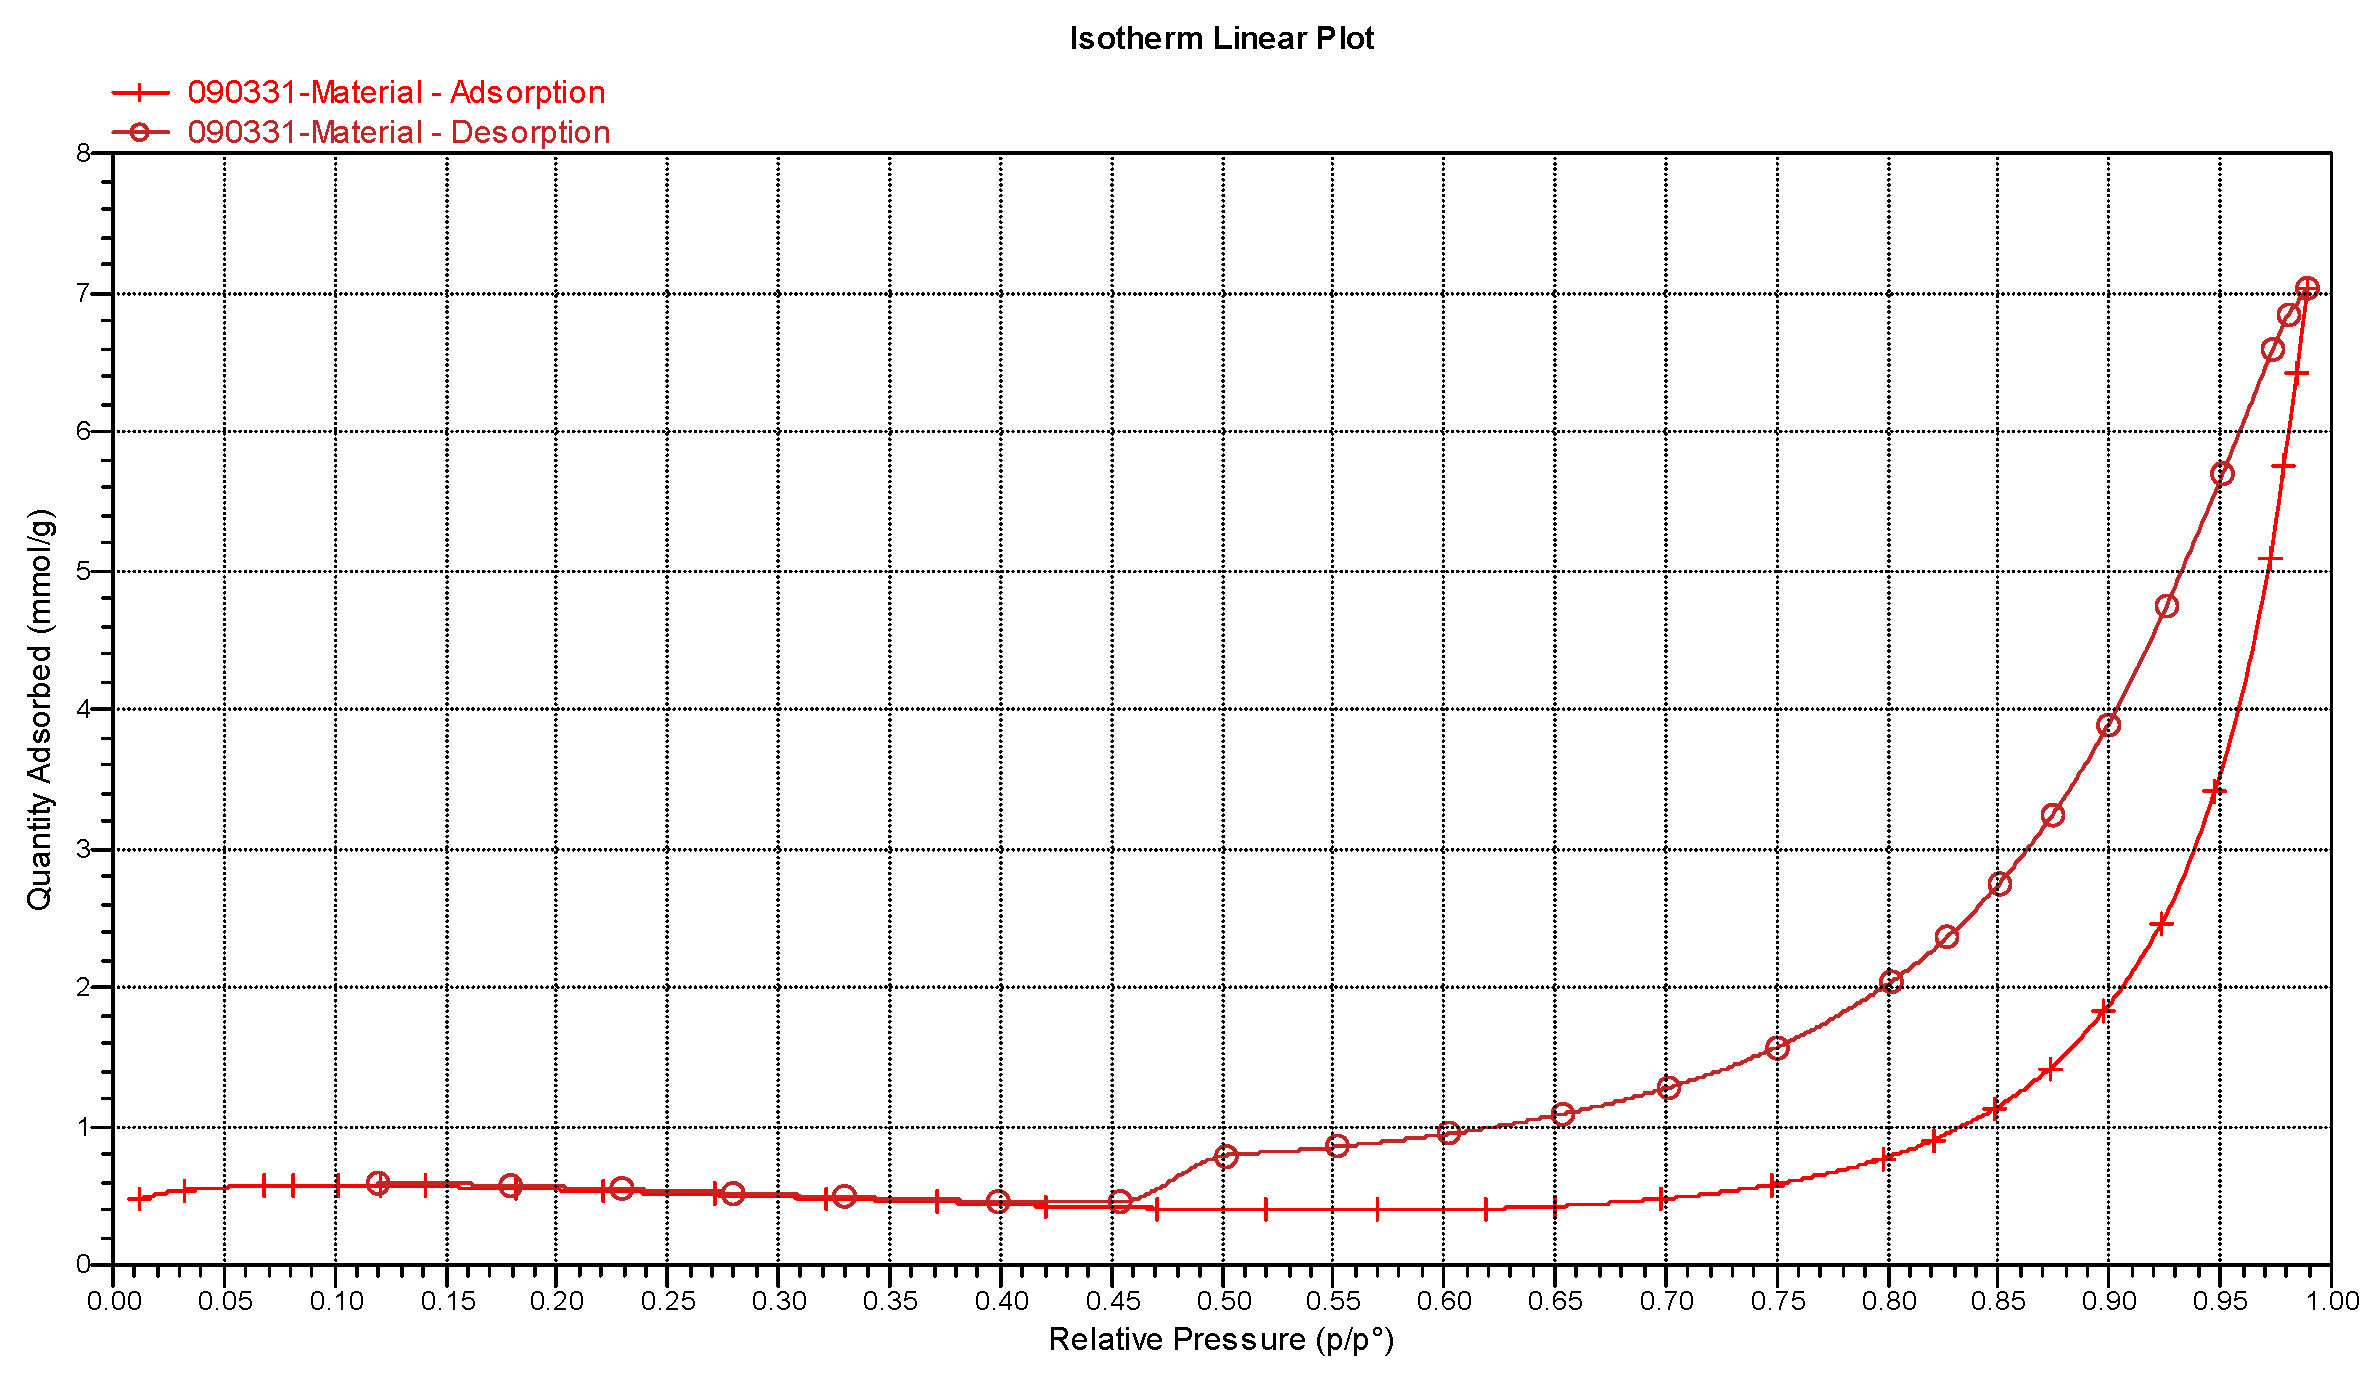
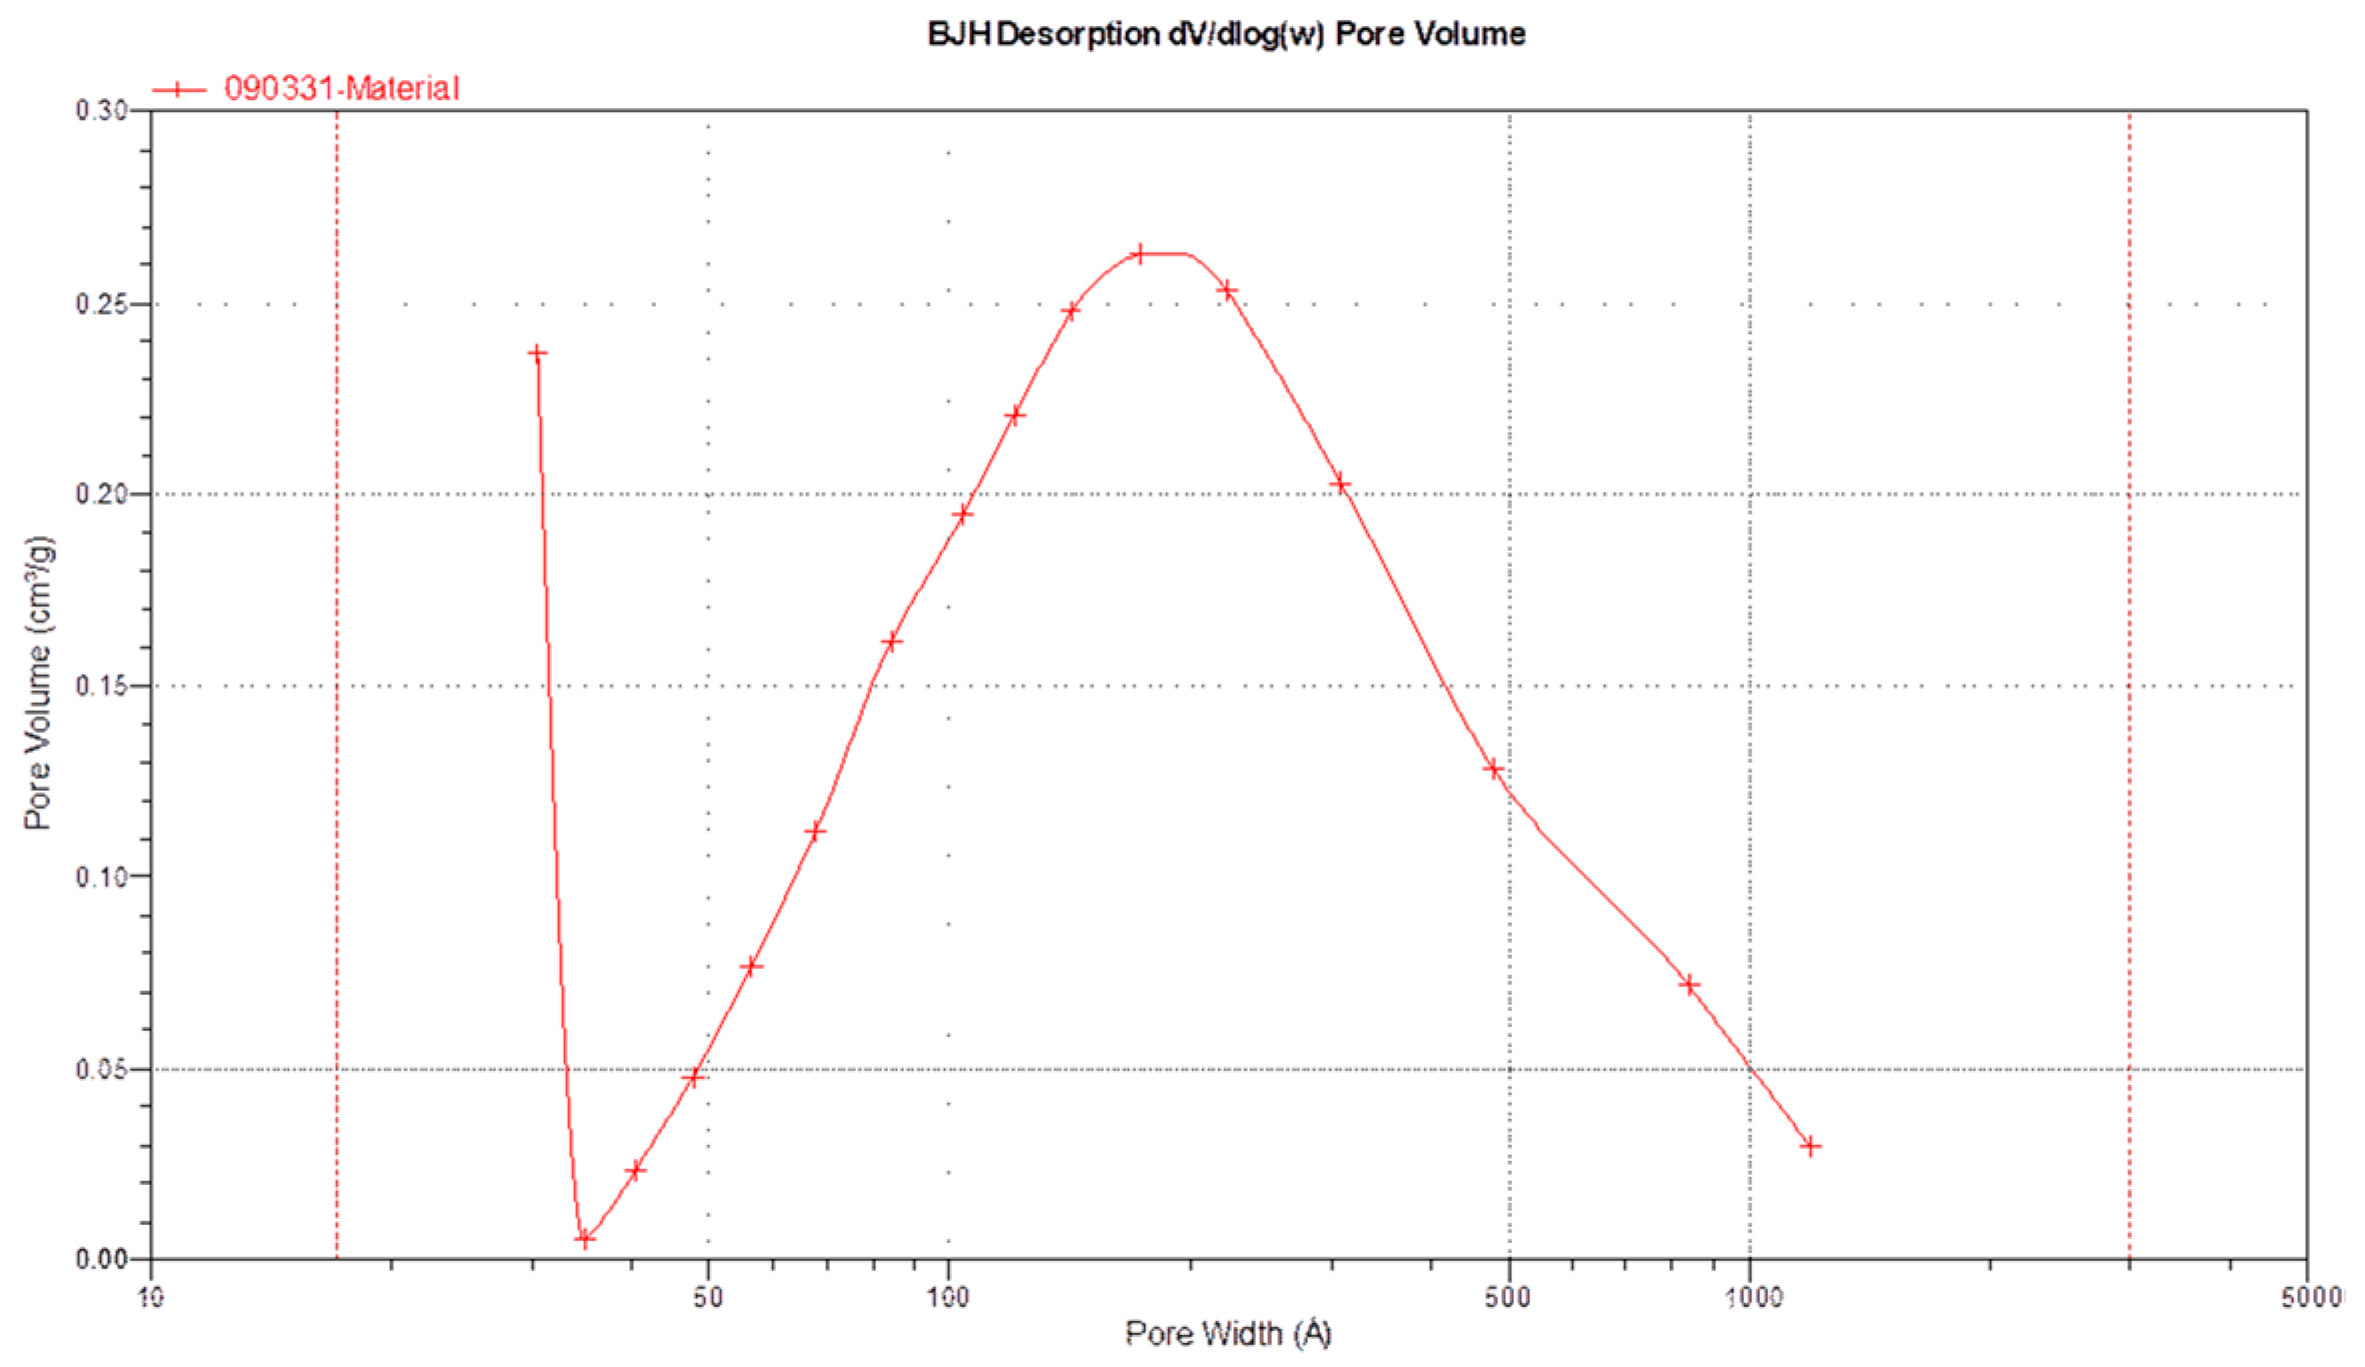
2.3.4. Brunauer–Emmett–Teller (BET) and Barret–Joyner–Halender (BJH) Analysis

The specific surface area of the samples was assessed through nitrogen adsorption using a Micromeritics ASAP 2010 nitrogen adsorption apparatus. Employing the multipoint BET method, the specific surface area was calculated by analyzing adsorption data within the relative pressure (P/P0) range of 0.02 to 0.45. The BJH method was applied to establish the pore size distribution from the desorption isotherm. The average pore size and pore volume were calculated using the nitrogen adsorption volume at a relative pressure (P/P0) of 0.972.

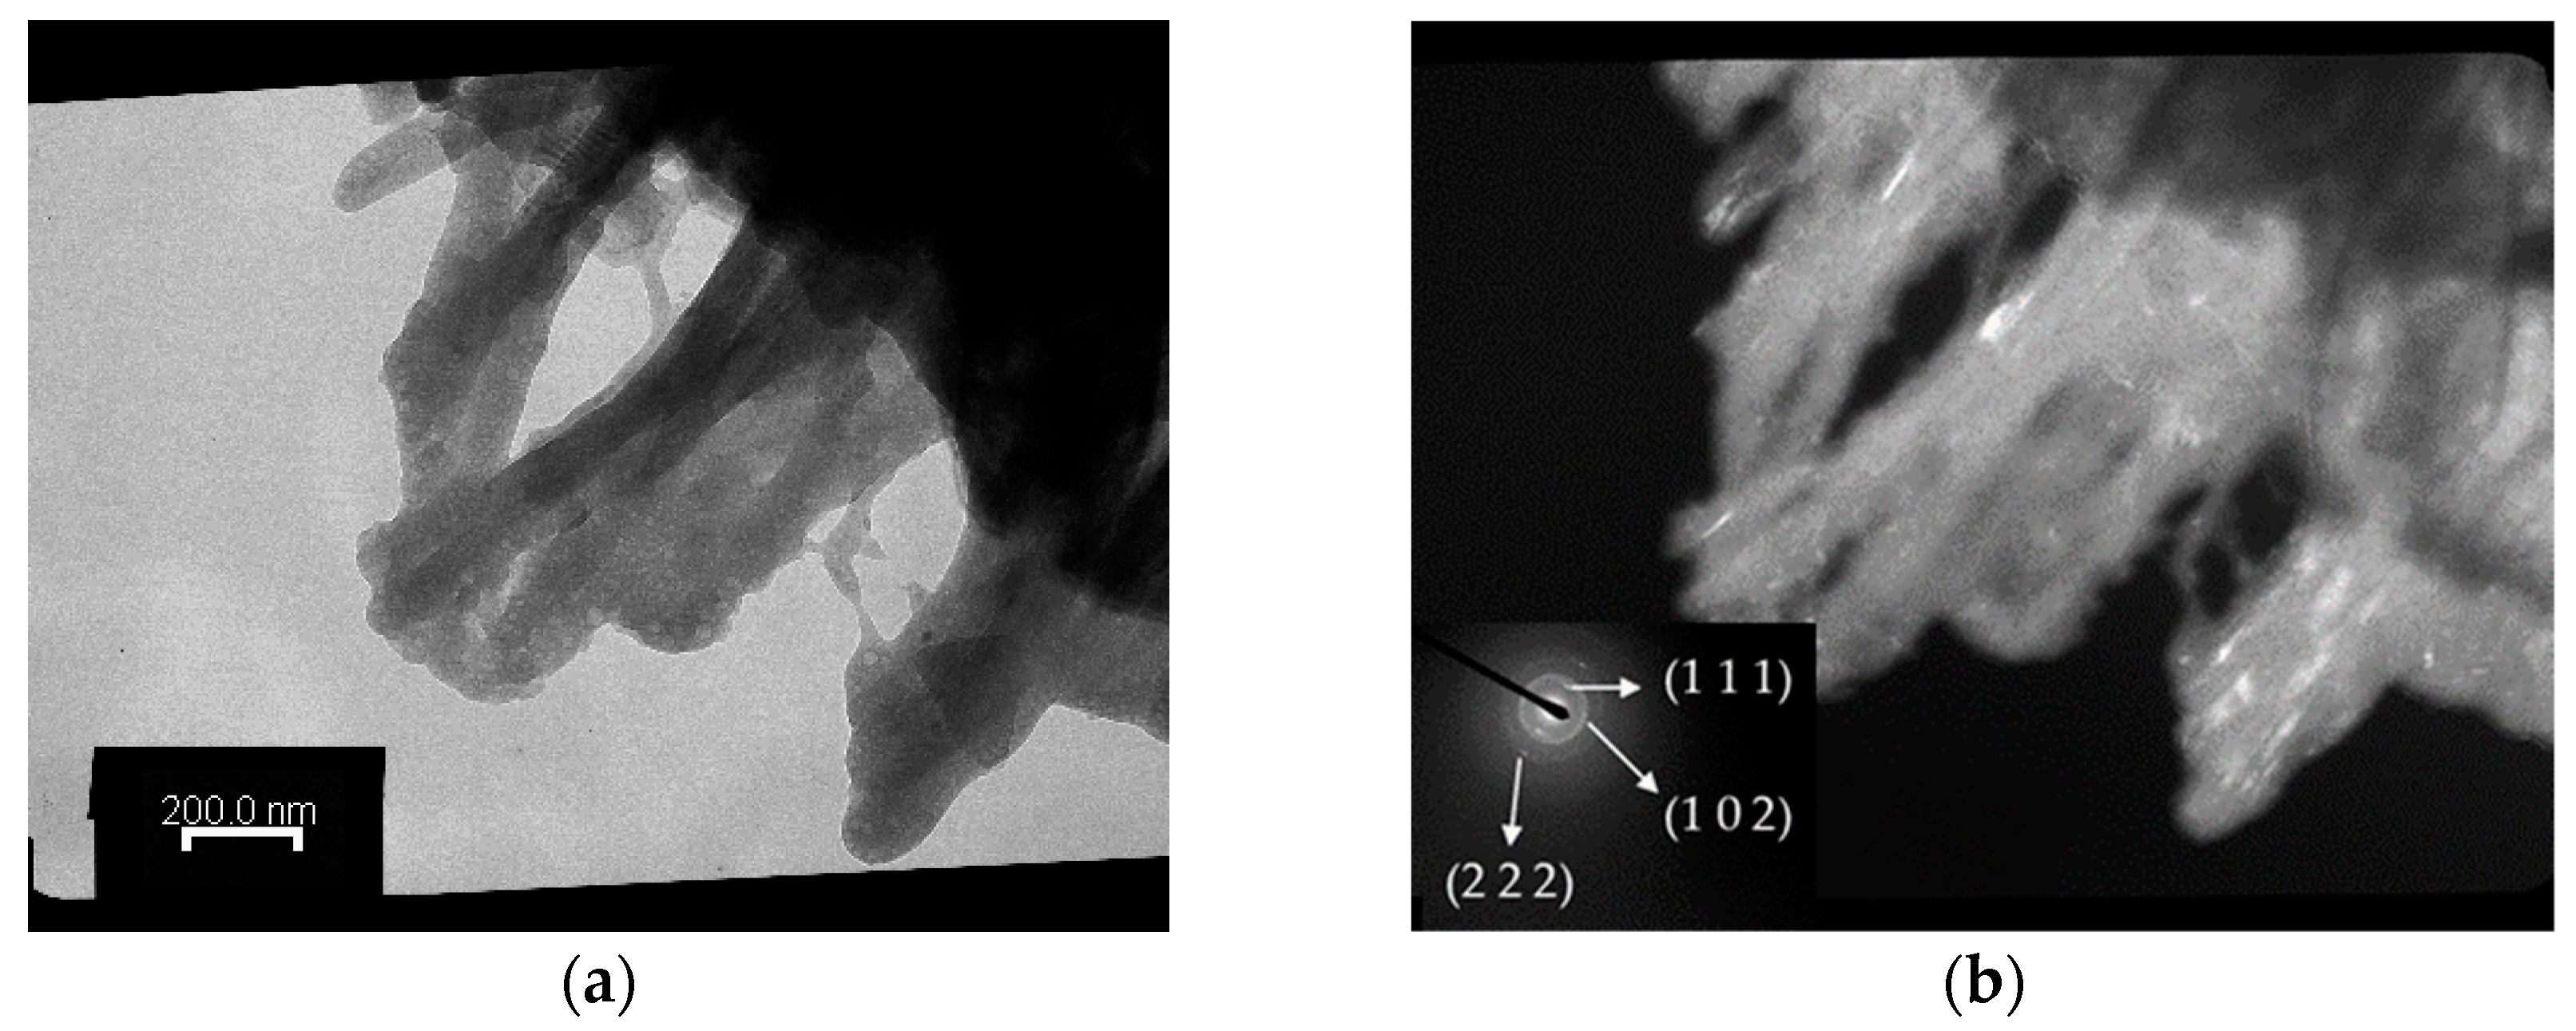
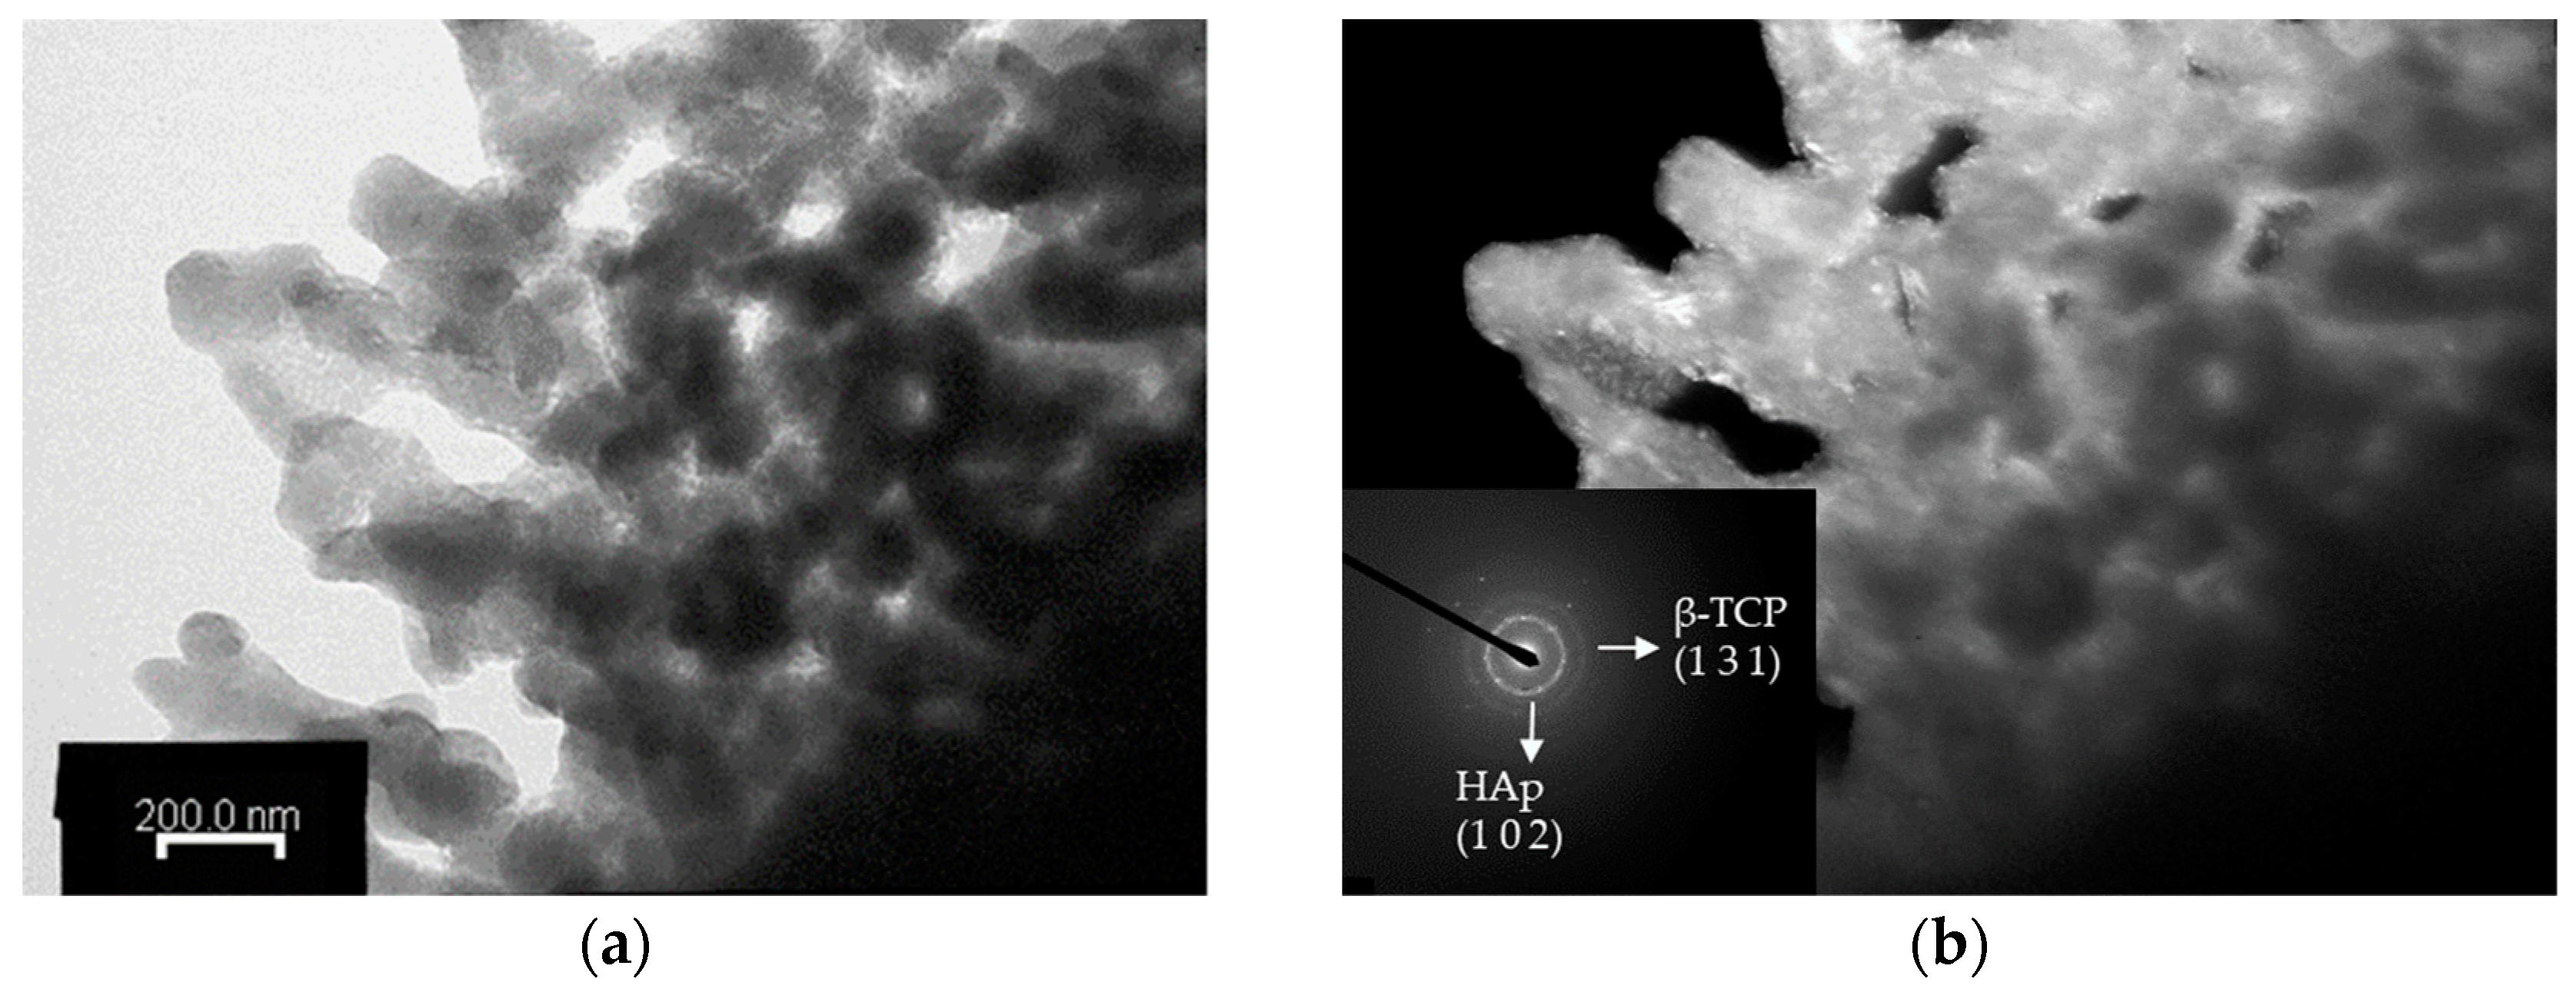
2.3.5. Transmission Electron Microscopy (TEM) Analysis

TEM images and selected area diffraction (SAD) patterns were acquired using a JEOL JEM-200CX TEM (Tokyo, Japan) with an acceleration voltage of 160 kV. To prepare the samples for analysis, the solution precipitates were cast onto copper grids with a carbon coating, left to dry naturally, and subsequently affixed to the microscope’s sample holder.

2.3.6. Inductive Coupled Plasma–Mass Spectrometry (ICP-MS) Analysis

To adhere to American Society for Testing and Materials (ASTM) standard F1185-03 [56], the powder underwent analysis using ICP-MS. Specifically, 0.5 mg of Chi-CaPM was dissolved in 15 mL of 5% HCl solution. This ICP-MS analysis served to determine the Ca/P ratio and assess the concentration of potentially harmful metal ions, including Pb, Cd, Hg, and As, present within the prepared sample.

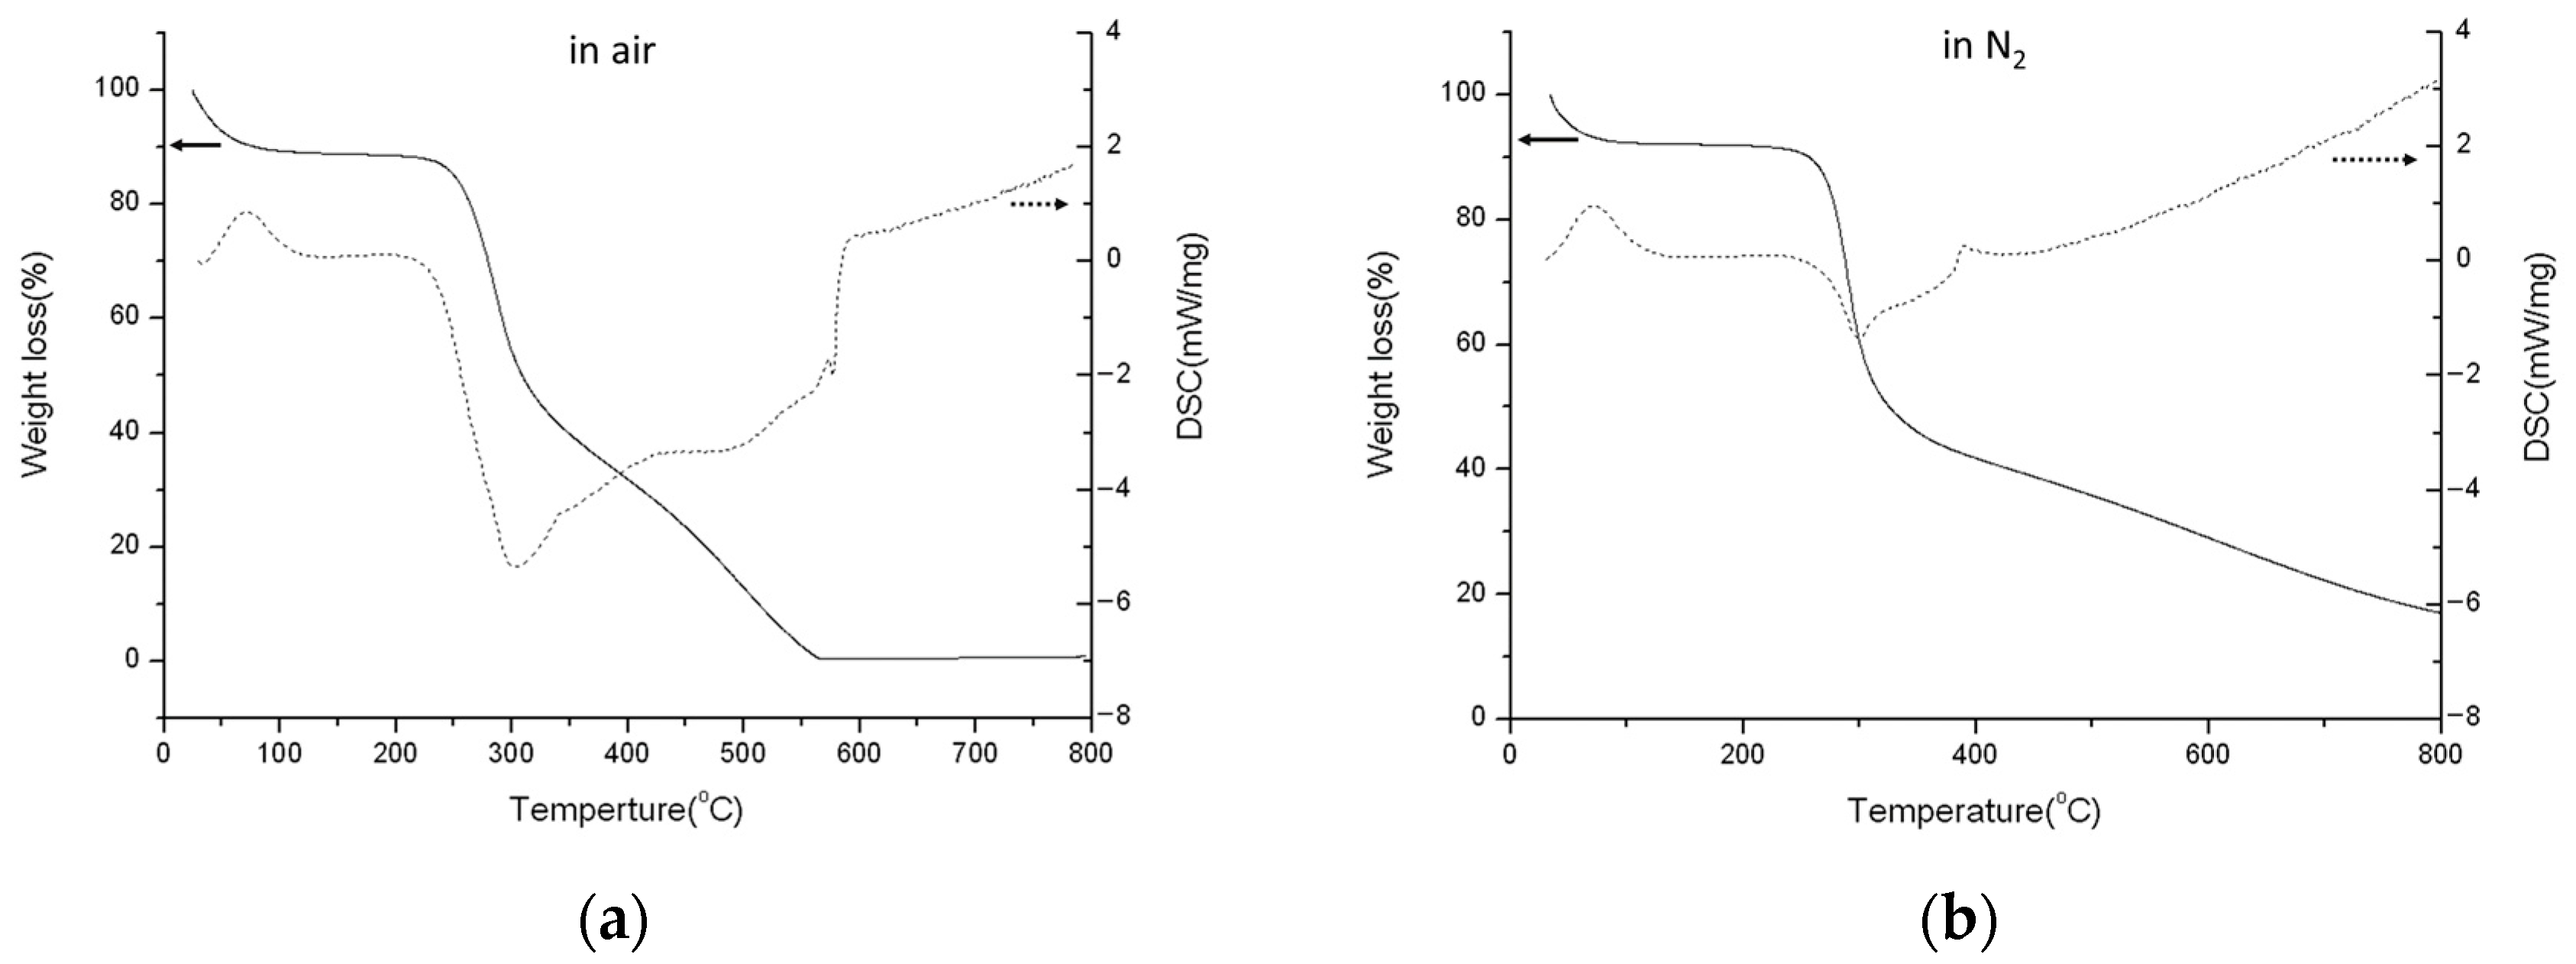
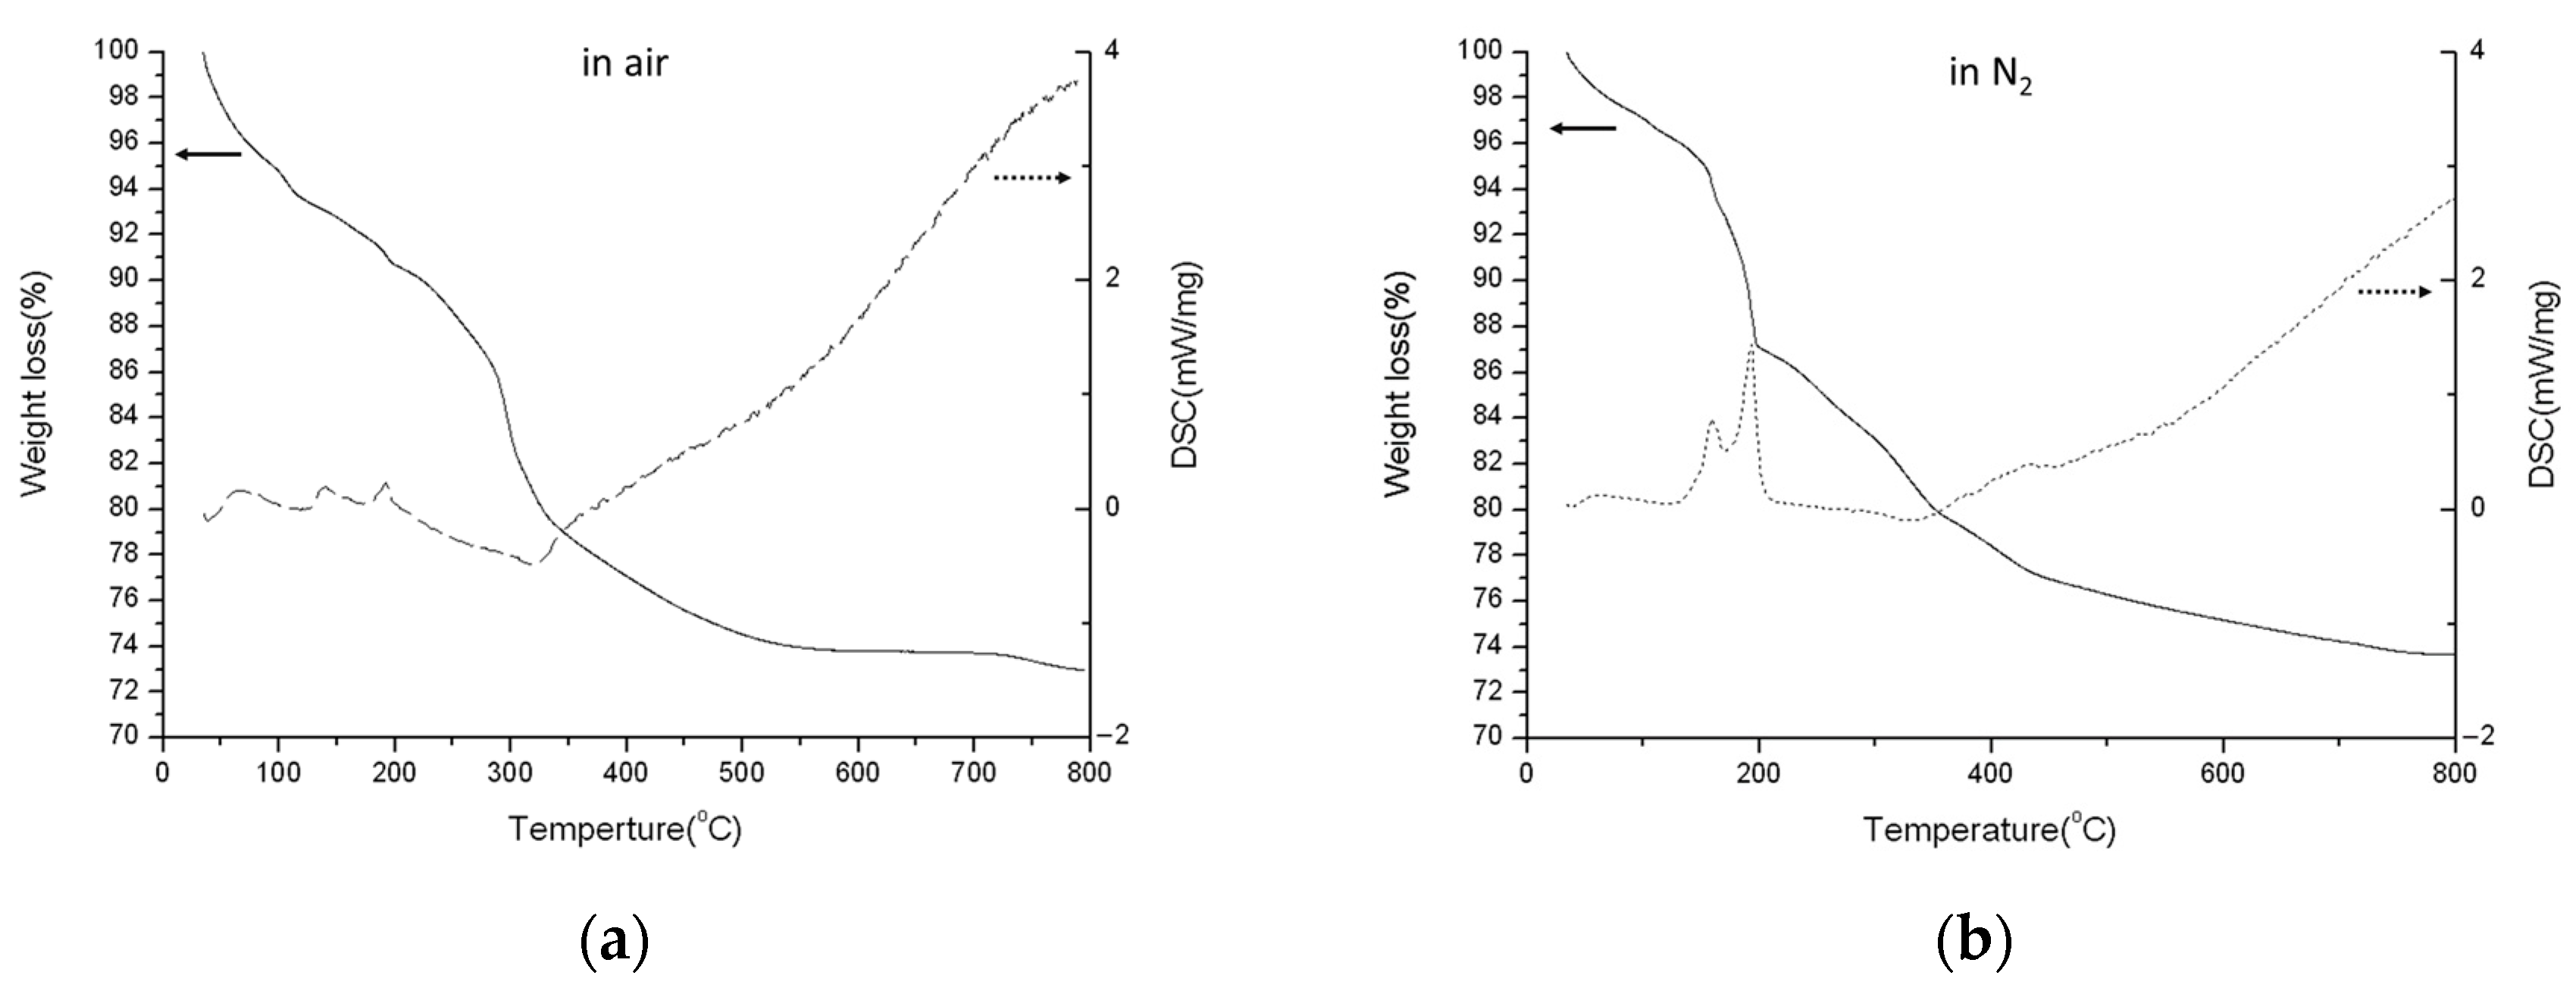
2.4. Thermogravimetric Analysis (TGA)

TGA was executed with a heating rate of 10 °C/min under both air and N2 atmospheres, reaching temperatures up to 800 °C. The weight variation with temperature was recorded, revealing the weight loss during heating. Additionally, we performed differential scanning calorimetry (DSC) under the same heating conditions in air and N2 atmospheres, extending up to 800 °C. This analysis enabled us to reveal endothermic and exothermic reactions and estimate the enthalpy.

3. Results and Discussion

3.1. Crystal Structure and Phase Transformation

The XRD diagram of Chi-CaPM is shown in Figure 3 and was also compared with the ICDD card No. 86-1199 and No. 72-0713 peaks. The diffraction peaks of crystal planes were 10.842° (100), 25.883° (002), 31.792° (211), 32.206° (112), 32.929° (202), 46.726° (222), 49.508° (213), 50.523° (321), and 53.220° (004) of hydroxyapatite. Also, the diffraction peaks at 11.65° (020), 20.948° (121), 29.296° (141), and 30.543° (121) of DCPD were detected. The higher background intensity from 10° to 30° is a result of the amorphous nature of chitosan.
The XRD pattern of specimens annealed at 150, 300, 500, and 700 °C is shown in Figure 4. When heated at 150 °C, there are two weak peaks and one broad peak from 15° to 20°, where the peaks at 16° and 19° represent nano-sized chitosan [57]. When heated at 300 °C, the intensity of the broad peak becomes stronger, due to amorphous structures caused by the condensation of OH and/or NH bonds. Moreover, no post-annealed sample exhibited a broad peak; it was weaker than the heat-treated sample. There is no broad peak from 15° to 20° at 500 °C and 700 °C because of the complete oxidation of the dehydrated and/or condensed chitosan. The DCPD peak vanishes, and Ca2P2O7 (pyrophosphate) appears at 300 °C, signifying the transformation of DCPD into DCPA and initiating the transformation into Ca2P2O7, as depicted in reactions (1) and (2). At 500 °C, reaction (3) initiates to form β-TCP. Finally, the crystallinity of β-TCP is further enhanced at 700 °C:
CaHPO4·2H2O → CaHPO4 + 2H2O(↑)
2CaHPO4 → Ca2P2O7 + H2O(↑)
Ca2P2O7 + Ca10(PO4)6(OH)2 → 4Ca3(PO4)2 + H2O(↑)
The detailed transformation of pure chitosan from room temperature to 300 °C is shown in Figure 5, indicating the type Ⅱ crystal structure of the as-received chitosan which was annealed at 150 °C, while it becomes a completely amorphous structure at 300 °C like that found in Figure 4 (the red one).
The TEM observations of the Chi-CaPM and select area diffraction pattern (SADP) are shown in Figure 6. From the TEM image, it can be seen that the edge of Chi-CaPM looks like grass, and the grass is composed of several nano-sticks. The select area diffraction pattern (SADP) confirms that Chi-CaPM reveals a ring-shaped diffraction pattern from (102) planes of hydroxyapatite. Additionally, there are two pairs of arc-shaped diffraction patterns from (111) and (222). This phenomenon indicates that hydroxyapatite has a high preferential orientation. In other words, hydroxyapatite precipitates on chitosan with a (111) texture parallel to the long axis of chitosan.
The TEM observations of Chi-CaPM after annealing at 500 °C for one hour are shown in Figure 7. The grass-like edge transforms into a rod shape. Like Figure 6d, its SADP exhibits a ring-shaped diffraction pattern from the (102) planes of hydroxyapatite and two pairs of arc-shaped diffraction patterns from the (111) and (222) planes of hydroxyapatite.
The TEM observation of porous Chi-CaPM after annealing at 700 °C for one hour is shown in Figure 8. The cylinders transform into round particles. The ring-shaped diffraction pattern is still observed from the (102) plane of hydroxyapatite, as shown in Figure 6d. However, the arc-shaped diffraction patterns disappear, and a few bright points are found. This indicates the grain growth of hydroxyapatite, and some diffraction rings of β-TCP such as the (131) plane are also observed, clearly revealing the phase transformation from hydroxyapatite and Ca2P2O7 to β-TCP in reaction (3).
The TGA/DSC diagrams of chitosan carried out in air or N2 are shown in Figure 9a,b. From Figure 9a, they reveal three steps of weight loss. The first step, accounting for about 12% of the loss, is the evaporation of H2O, corresponding to the endothermic peak below 100 °C in the DSC diagram. The second step, involving a loss of about 42% at around 300 °C, results from the dehydration and/or condensation of chitosan, and this corresponds to the exothermic peak at around 300 °C. The third step is the further oxidation of the dehydrated and/or condensed chitosan in the air, corresponding to the exothermic region from 350 °C to 600 °C in the DSC diagram. These results are completely consistent with those discussed in the XRD as shown in Figure 3, Figure 4 and Figure 5. It is evident that the weight loss rate above 300 °C in N2 is slower than in air, primarily due to less oxidation in N2 as shown in Figure 9b.
The TGA/DSC diagrams of HAp are shown in Figure 10a,b. The major weight loss is only 6% from ambient temperature to 300 °C, resulting from the evaporation of H2O adsorbed in HAp.
In this temperature range, there are no obvious endothermic or exothermic peaks until the temperature up to 700 °C in the DSC diagram. The exothermic peak around 700 °C corresponds to reaction (4). Additionally, a slight weight loss is observed in the TGA diagram, ascribed to the dehydration in reaction (4). There is no noticeable difference between the diagrams in air and in N2 because there is no oxidation occurring for HAp.
Ca10(PO4)6(OH)2 → 3Ca3(PO4)2 + CaO+ H2O (↑)
The TGA/DSC diagrams of the prepared Chi-CaPM from room temperature to 800 °C in air and N2 are shown in Figure 11a,b. There are three endothermic peaks below 250 °C, attributed to the evaporation of adsorbed water, the dehydration from DCPD into DCPA around 140 °C, and the further transformation of DCPA into Ca2P2O7 around 190 °C, the latter two corresponding to reactions (1) and (2), respectively, which are not found in the TGA/DSC diagrams of HAp. Consistently, the XRD peaks of the DCPD are found in the as-prepared and annealed samples at 150 °C while they gradually disappear at 300 °C, as shown in Figure 4 where Ca2P2O7 is found.

3.2. Chemical Bondings and Compositions

The FTIR spectra of HAp, chitosan, and the prepared Chi-CaPM microsphere are shown in Figure 12a–c. In the spectrum of HAp shown in Figure 12a, OH groups are found at wavenumbers in the range of 3600 to 3150 cm−1 and an explicit peak at 3570 cm−1. The wavenumber at 1650 cm−1 corresponds to H2O bending, which is different from the peak of CO32− (1460–1530 cm−1) [58]. Phosphate absorption bands at 1092, 1033, 964, 606, and 564 cm−1 are characteristics of a typical FTIR spectrum for HAp. The wavenumbers at 3300~3500 cm−1 (N-H and/or O-H), 2800~2900 cm−1 (C-H), 1590 cm−1 (N-H), 1382~1413 cm−1 (C-H), and 1160~1040 cm−1 (C-O-C, glucose ring) corresponding to the characteristics of chitosan are shown in Figure 12b. It was found that the chemical bonding of the prepared Chi-CaPM, as shown in Figure 12c, is a combination of HAp and chitosan, revealing both the absorption peaks of HAp and chitosan.
The EDS spectra indicate that the microsphere is mainly composed of C, O, P, and Ca elements, as shown in Figure 13. Their detailed contents are listed in Table 1. The ratio of Ca to P is 1.43. This means that the calcium phosphate in the composite microsphere is composed of 64.5% HAp and 35.5% DCPD. Combining TGA/DSC in Figure 9 and Figure 11, the composite sphere is entirely composed of 16% chitosan, 29.8% DCPD, and 54.2%.
The ICP-MS of the prepared microspheres is shown in Table 2, indicating the elements contained in (a) original 5% HCl, (b) Chi-CaPM dissolved in 5% HCl, and (c) derived from (b)–(a) for pure Chi-CaPM. According to the ASTM standard [56], the maximum allowable limit for all heavy metals is 50 ppm. The prepared porous Chi-CaPM in this study is well below this limit. Additionally, the Ca/P ratio was determined to be 1.47, which is approximate to that of the EDS analysis.

3.3. Surface Morphology, Specific Surface Area, and Pore Volume

The SEM observation of Chi-CaPM is shown in Figure 14. It was found that Chi-CaPM is full of pores assembled by petal-like flakes. The average granularity of porous Chi-CaPM is about 25 μm, as shown in the upper two, and the pore size on the surface is about 0.7 μm, as shown in the lower two. From the higher magnification TEM image, the petal-like flakes are composed of several nano-sized rods, as shown in Figure 6.
After annealing at 150 °C for one hour, as shown in Figure 15, the submicron-sized pores collapse, and the petal-like flakes transform into dispersive narrow plates.
Similar results were found at 300 °C, as shown in Figure 16. The flower-like flakes collapsed into smaller pieces due to the decomposition of chitosan.
The coalescence of dispersive narrow plates into wider ones was found at 500 °C for one hour, and the collapsed pieces coalesced into larger petal-like flakes again, as shown in Figure 17.
After annealing at 700 °C for one hour, the surface morphology of the microsphere changed significantly. The plates transformed into round particles, as shown in Figure 18. Obviously, the variations in the surface morphology of the composite microsphere were all consistent with the phase transformation of calcium phosphate and the decomposition of chitosan discussed in Section 3.1.
The BET nitrogen adsorption/desorption isotherm is shown in Figure 19. The typical hysteresis loop is usually found in multi-layer adsorption. Four characteristic adsorption curves are illustrated in a prior report [59]. The H1 type results from clustered invariant spheres constituting material with porosity. H2 is not defined clearly now, as various factors could be considered. H3 is the result of porosity assembled by micro flakes, and the H4 hysteresis loop is created by a narrow aperture [59]. The hysteresis loop of the microspheres in this study reveals the BET nitrogen adsorption/desorption isotherm, like H3, as shown in Figure 19.
According to the BET theory analysis, as listed in Table 3, the surface area value is 38.16 m2/g. There are also studies that synthesize spherical HAp using the co-precipitation method, the fast precipitation method, and the hydrothermal method—the same as we used. The HAps they synthesized can achieve surface areas of 126 m2/g [60], 164.73 m2/g [61], and 105.21 m2/g [62], with corresponding average particle sizes of 1.7 μm, 1.5 μm, and 3 μm, respectively. In comparison, the average size of Chi-CaPM is 30 μm. The surface areas of their synthesized HAp are all higher than that of Chi-CaPM, with the particle size of 30 μm in this study. As the particle size decreases, the surface area increases. From Figure 20, the pore size analysis by BJH desorption varies from 3 to 100 nm. Two peaks of volume distribution are found at 3 and 20 nm, indicating significant porosity and a high surface area, which makes it a strong potential drug carrier. When using the BJH method to measure the surface area of pores ranging from 1.7 to 300 nm in width, the specific surface area values are 33.32 m2/g and 76.29 m2/g for adsorption and desorption, respectively. The pore volume is 0.24 cm3/g for adsorption and 0.24 cm3/g for desorption.

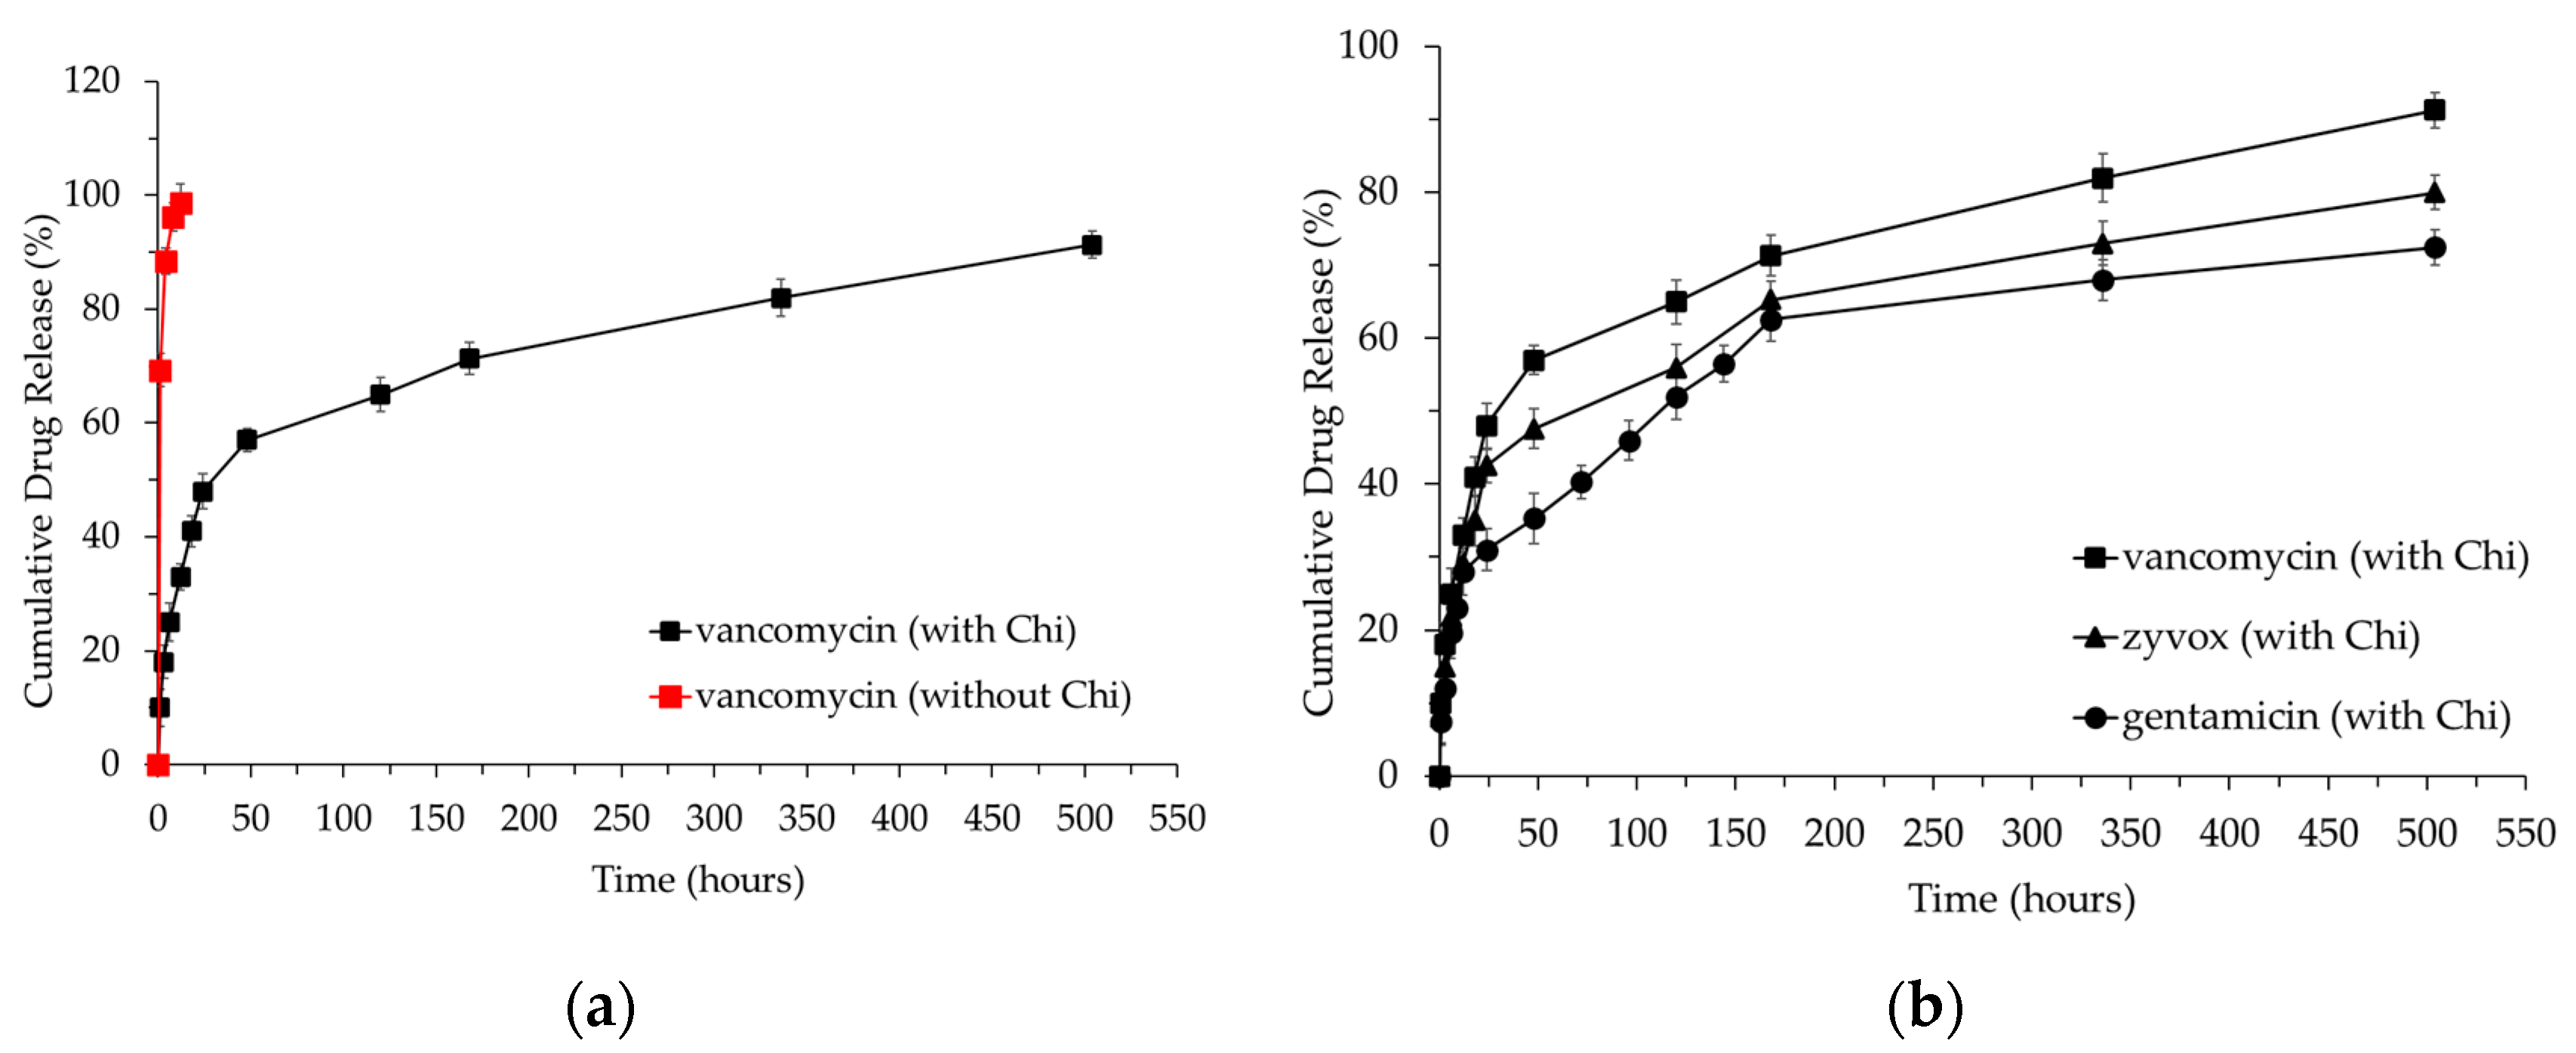
3.4. Antibiotic Loading and Release

To investigate whether the addition of chitosan affects drug release, we first immersed Chi-CaPM in a drug solution without additional chitosan and mixed it at 37 °C for one day. The drug-to-Chi-CaPM weight ratio is 1/3, and the resulting mixture was then dried in a 37 °C oven. The second experiment group involved adding an additional 20 mg of chitosan to the vancomycin-Chi-CaPM (V-Chi-CaPM) after 12 h of mixing. The blend was further mixed for an additional 12 h before being dried. Afterwards, the loading method with the better release profile was chosen for the encapsulation of zyvox (Z-Chi-CaPM) and gentamicin (G-Chi-CaPM). The drug-loaded powders were placed in a 100 mL phosphate-buffered saline (PBS) solution at 37 °C with an 80 rpm shaking rate. At predefined time intervals, 1 ml of the medium was removed and an equal volume of fresh PBS buffer was put in. The collected medium concentration was measured using a UV/VIS spectrometer (U-3010, HITACHI, Tokyo, Japan). The in vitro cumulative drug release curves are shown in Figure 21. The detailed cumulative calculation is described in a previous report [63].
The results in Figure 21a indicate that in the absence of chitosan, the drug is completely released within 12 h. However, with the addition of chitosan, the release period of the drug extends to up to 21 days. This prolonged release time is attributed to the hydrogen bonding interactions between chitosan and vancomycin, as well as those between chitosan and HAp. These hydrogen bonding interactions enhance the connection between the drug and the carrier, forming a more stable composite structure that consequently extends the drug release time [64,65,66,67]. This outcome demonstrates the significant impact of adding chitosan on regulating drug release, leading to the incorporation of chitosan into the subsequent release experiments for the three drugs.
After 21 days of experimentation, the accumulative release amounts of vancomycin, zyvox, and gentamicin reached 91%, 80%, and 72% as shown in Figure 21b. In general, in vitro drug release exhibits a three-phase profile, including the first phase occurring within 24 h, which represents the initial drug burst and the fastest release rate, the second phase lasting from days two to seven involving the steady release rate, and the third phase occurring after week one and then displaying the slowest release rate. The disparities in release quantities can be attributed to the zeta potential of chitosan and each drug. Both chitosan and vancomycin have positive zeta potentials, while zyvox and gentamicin have negative zeta potentials [68,69,70,71]. The repulsion between the positive zeta potentials of chitosan and vancomycin leads to the fastest release of vancomycin. Additionally, gentamicin has a slightly more negative zeta potential than zyvox, resulting in stronger attraction via Coulombic force between gentamicin and chitosan compared to zyvox and chitosan. Consequently, the release of gentamicin is relatively slower. Basically, these Chi-CaPMs have revealed their potential as drug carriers since the characteristics of Chi-CaPMs include a great pore volume and a high specific surface area.

4. Conclusions

The porous Chi-CaPM was successfully prepared using the hydrothermal method. Characterization through XRD, FTIR, ICP-MS, and TGA/DSC identified that the porous calcium phosphate/chitosan composite microsphere consists of 54.2 wt.% HAp, 29.8 wt.% DCPD, and 16 wt.% chitosan. The chitosan transforms into the dehydrated and/or condensed one and the DCPD transforms into Ca2P2O7 at 300 °C. Then, Ca2P2O7 initially combines with HAp to transform into β-TCP at 500 °C where the chitosan is also completely combusted. Finally, the microspheres are composed of Ca2P2O7, β-TCP, and HAp, making them suitable for applications such as injectable bone graft materials.
TEM observations and SADP analyses illustrate that the grass-like edge of the porous calcium phosphate/chitosan composite microsphere consists of HAp, which precipitated along chitosan with a (111) texture. The FTIR results of the prepared microsphere reveal both chitosan and CaP chemical bonds. The porous calcium phosphate/chitosan composite microsphere exhibits a high specific surface area of 38.16 m2/g and a significant pore volume of 0.244 cm3/g.
All of the in vitro drug releases of gentamicin, vancomycin, and zyvox follow three-phase profiles, including the initial drug burst within 24 h, the second phase with a steady drug release rate from days two to seven, and the third phase consisting of a lower steady release rate from week two to week three. With their great pore volume and high specific surface area, the prepared microspheres demonstrate strong potential for use as drug carriers.

Author Contributions

Conceptualization, M.-Y.W. and S.-K.Y.; methodology, M.-Y.W., S.-W.H., I.-F.K. and S.-K.Y.; software, M.-Y.W., S.-W.H. and I.-F.K.; formal analysis, M.-Y.W., S.-W.H. and I.-F.K.; investigation, M.-Y.W., S.-W.H., I.-F.K. and S.-K.Y.; resources, M.-Y.W. and S.-K.Y.; writing—original draft preparation, M.-Y.W. and S.-K.Y.; writing—review and editing, M.-Y.W. and S.-K.Y.; visualization, S.-K.Y.; supervision, M.-Y.W. and S.-K.Y.; project administration, M.-Y.W. and S.-K.Y. All authors have read and agreed to the published version of the manuscript.

Funding

This research received funds from the National Science and Technology Council (NSTC), Taiwan, under contract no. NSTC 108-2221-E-005-029, 109-2221-E-005-039, 110-2221-E-005-021, 111-2221-E-005-065, and 112-2622-E-005-008.

Institutional Review Board Statement

Not applicable.

Data Availability Statement

Data are contained within the article.

Acknowledgments

We are grateful for the support of the Instrument Center of National Chung Hsing University, Taiwan for the analyses of ICP-MS and micrographs observed by FE-SEM.

Conflicts of Interest

The authors declare no conflict of interest.

References

  1. Köse, G.T.; Korkusuz, F.; Özkul, A.; Soysal, Y.; Özdemir, T.; Yildiz, C.; Hasirci, V. Tissue engineered cartilage on collagen and PHBV matrices. Biomaterials 2005, 26, 5187–5197. [Google Scholar] [CrossRef] [PubMed]
  2. Mohammadi-Zerankeshi, M.; Alizadeh, R. 3D-printed PLA-Gr-Mg composite scaffolds for bone tissue engineering applications. J. Mater. Res. Technol. 2023, 22, 2440–2446. [Google Scholar] [CrossRef]
  3. Feng, P.; Shen, S.; Shuai, Y.; Peng, S.; Shuai, C.; Chen, S. PLLA grafting draws GO from PGA phase to the interface in PLLA/PGA bone scaffold owing enhanced interfacial interaction. Sustain. Mater. Technol. 2023, 35, e00566. [Google Scholar] [CrossRef]
  4. Hamidi, M.; Azadi, A.; Rafiei, P. Hydrogel nanoparticles in drug delivery. Adv. Drug Deliv. Rev. 2008, 60, 1638–1649. [Google Scholar] [CrossRef] [PubMed]
  5. Morillo-Bargues, M.J.; Osorno, A.O.; Guerri, C.; Pradas, M.M.; Martínez-Ramos, C. Characterization of Electrospun BDMC-Loaded PLA Nanofibers with Drug Delivery Function and Anti-Inflammatory Activity. Int. J. Mol. Sci. 2023, 24, 10340. [Google Scholar] [CrossRef]
  6. Singh, B.; Singh, S.; Gautam, A.; Sutherland, A.; Pal, K. Preparation and characterization of PLA microspheres as drug delivery system for controlled release of Cetirizine with carbon dots as drug carrier. Polym. Bull. 2023, 80, 5741–5757. [Google Scholar] [CrossRef]
  7. Zhang, Y.; Song, W.; Lu, Y.; Xu, Y.; Wang, C.; Yu, D.-G.; Kim, I. Recent Advances in Poly(α-L-glutamic acid)-Based Nanomaterials for Drug Delivery. Biomolecules 2022, 12, 636. [Google Scholar] [CrossRef] [PubMed]
  8. Stamatialis, D.F.; Papenburg, B.J.; Gironés, M.; Saiful, S.; Bettahalli, S.N.M.; Schmitmeier, S.; Wessling, M. Medical applications of membranes: Drug delivery, artificial organs and tissue engineering. J. Membr. Sci. 2008, 308, 1–34. [Google Scholar] [CrossRef]
  9. Murata, Y.; Yutaka, Y.; Hirata, R.; Hidaka, Y.; Hamaji, M.; Yoshizawa, A.; Kishimoto, Y.; Omori, K.; Date, H. Development of novel layered polyglycolic acid sheet for regeneration of critical-size defect in rat trachea. Eur. J. Cardio-Thorac. Surg. 2023, 63. [Google Scholar] [CrossRef]
  10. Masuko, T.; Iwasaki, N.; Yamane, S.; Funakoshi, T.; Majima, T.; Minami, A.; Ohsuga, N.; Ohta, T.; Nishimura, S.-I. Chitosan–RGDSGGC conjugate as a scaffold material for musculoskeletal tissue engineering. Biomaterials 2005, 26, 5339–5347. [Google Scholar] [CrossRef]
  11. Hoemann, C.D.; Sun, J.; Légaré, A.; McKee, M.D.; Buschmann, M.D. Tissue engineering of cartilage using an injectable and adhesive chitosan-based cell-delivery vehicle. Osteoarthr. Cartil. 2005, 13, 318–329. [Google Scholar] [CrossRef] [PubMed]
  12. Riseh, R.S.; Vazvani, M.G.; Kennedy, J.F. The application of chitosan as a carrier for fertilizer: A review. Int. J. Biol. Macromol. 2023, 252, 126483. [Google Scholar] [CrossRef] [PubMed]
  13. Meng, Q.; Zhong, S.; Wang, J.; Gao, Y.; Cui, X. Advances in chitosan-based microcapsules and their applications. Carbohydr. Polym. 2023, 300, 120265. [Google Scholar] [CrossRef] [PubMed]
  14. Zhang, H.; Alsarra, I.A.; Neau, S.H. An in vitro evaluation of a chitosan-containing multiparticulate system for macromolecule delivery to the colon. Int. J. Pharm. 2002, 239, 197–205. [Google Scholar] [CrossRef] [PubMed]
  15. Ji, X.; Shao, H.; Li, X.; Ullah, M.W.; Luo, G.; Xu, Z.; Ma, L.; He, X.; Lei, Z.; Li, Q.; et al. Injectable immunomodulation-based porous chitosan microspheres/HPCH hydrogel composites as a controlled drug delivery system for osteochondral regeneration. Biomaterials 2022, 285, 121530. [Google Scholar] [CrossRef] [PubMed]
  16. Nsereko, S.; Amiji, M. Localized delivery of paclitaxel in solid tumors from biodegradable chitin microparticle formulations. Biomaterials 2002, 23, 2723–2731. [Google Scholar] [CrossRef] [PubMed]
  17. Pandey, N.; Bohra, B.S.; Tiwari, H.; Pal, M.; Negi, P.B.; Dandapat, A.; Mehta, S.P.S.; Sahoo, N.G. Development of biodegradable chitosan/graphene oxide nanocomposite via spray drying method for drug loading and delivery application. J. Drug Deliv. Sci. Technol. 2022, 74, 103555. [Google Scholar] [CrossRef]
  18. Ogunjimi, A.T.; Fiegel, J.; Brogden, N.K. Design and Characterization of Spray-Dried Chitosan-Naltrexone Microspheres for Microneedle-Assisted Transdermal Delivery. Pharmaceutics 2020, 12, 496. [Google Scholar] [CrossRef]
  19. Shi, X.-Y.; Tan, T.-W. Preparation of chitosan/ethylcellulose complex microcapsule and its application in controlled release of Vitamin D2. Biomaterials 2002, 23, 4469–4473. [Google Scholar] [CrossRef]
  20. Zhang, S.; Kang, L.; Hu, S.; Hu, J.; Fu, Y.; Hu, Y.; Yang, X. Carboxymethyl chitosan microspheres loaded hyaluronic acid/gelatin hydrogels for controlled drug delivery and the treatment of inflammatory bowel disease. Int. J. Biol. Macromol. 2021, 167, 1598–1612. [Google Scholar] [CrossRef]
  21. Li, H.; Huo, J.; Zhang, H.; Liu, Y.; Shi, X.; Zhao, Z.; Zhou, J.; Wang, X.; Zhang, C. Eudragit S100-coated halloysite nanotube/chitosan microspheres for colon-targeted release of paeoniflorin. J. Drug Deliv. Sci. Technol. 2021, 61, 102258. [Google Scholar] [CrossRef]
  22. Tsai, M.L.; Bai, S.W.; Chen, R.H. Cavitation effects versus stretch effects resulted in different size and polydispersity of ionotropic gelation chitosan–sodium tripolyphosphate nanoparticle. Carbohydr. Polym. 2008, 71, 448–457. [Google Scholar] [CrossRef]
  23. Algharib, S.A.; Dawood, A.; Zhou, K.; Chen, D.; Li, C.; Meng, K.; Zhang, A.; Luo, W.; Ahmed, S.; Huang, L.; et al. Preparation of chitosan nanoparticles by ionotropic gelation technique: Effects of formulation parameters and in vitro characterization. J. Mol. Struct. 2022, 1252, 132129. [Google Scholar] [CrossRef]
  24. Abbas, A.; Alhamdany, A. Floating Microspheres of Enalapril Maleate as a Developed Controlled Release Dosage Form: Investigation of the Effect of an Ionotropic Gelation Technique. Turk. J. Pharm. Sci. 2020, 17, 159–171. [Google Scholar] [CrossRef]
  25. Bayomi, M.A.; Al-Suwayeh, S.A.; El-Helw, A.M.; Mesnad, A.F. Preparation of casein–chitosan microspheres containing diltiazem hydrochloride by an aqueous coacervation technique. Pharm. Acta Helv. 1998, 73, 187–192. [Google Scholar] [CrossRef] [PubMed]
  26. Çelik, Ö.; Akbuğa, J. Preparation of superoxide dismutase loaded chitosan microspheres: Characterization and release studies. Eur. J. Pharm. Biopharm. 2007, 66, 42–47. [Google Scholar] [CrossRef]
  27. Wei, W.; Wang, L.-Y.; Yuan, L.; Yang, X.-D.; Su, Z.-G.; Ma, G.-H. Bioprocess of uniform-sized crosslinked chitosan microspheres in rats following oral administration. Eur. J. Pharm. Biopharm. 2008, 69, 878–886. [Google Scholar] [CrossRef]
  28. Teterina, A.Y.; Minaychev, V.V.; Smirnova, P.V.; Kobiakova, M.I.; Smirnov, I.V.; Fadeev, R.S.; Egorov, A.A.; Ashmarin, A.A.; Pyatina, K.V.; Senotov, A.S.; et al. Injectable Hydrated Calcium Phosphate Bone-like Paste: Synthesis, In Vitro, and In Vivo Biocompatibility Assessment. Technologies 2023, 11, 77. [Google Scholar] [CrossRef]
  29. Liu, Z.; Wang, T.; Xu, Y.; Liang, C.; Li, G.; Guo, Y.; Zhang, Z.; Lian, J.; Ren, L. Double-layer calcium phosphate sandwiched siloxane composite coating to enhance corrosion resistance and biocompatibility of magnesium alloys for bone tissue engineering. Prog. Org. Coat. 2023, 177, 107417. [Google Scholar] [CrossRef]
  30. Habraken, W.J.E.M.; Wolke, J.G.C.; Jansen, J.A. Ceramic composites as matrices and scaffolds for drug delivery in tissue engineering. Adv. Drug Deliv. Rev. 2007, 59, 234–248. [Google Scholar] [CrossRef]
  31. Dorozhkin, S.V.; Epple, M. Biological and Medical Significance of Calcium Phosphates. Angew. Chem. Int. Ed. 2002, 41, 3130–3146. [Google Scholar] [CrossRef]
  32. Raymond, Y.; Bonany, M.; Lehmann, C.; Thorel, E.; Benítez, R.; Franch, J.; Espanol, M.; Solé-Martí, X.; Manzanares, M.-C.; Canal, C.; et al. Hydrothermal processing of 3D-printed calcium phosphate scaffolds enhances bone formation in vivo: A comparison with biomimetic treatment. Acta Biomater. 2021, 135, 671–688. [Google Scholar] [CrossRef] [PubMed]
  33. Syukkalova, E.A.; Sadetskaya, A.V.; Demidova, N.D.; Bobrysheva, N.P.; Osmolowsky, M.G.; Voznesenskiy, M.A.; Osmolovskaya, O.M. The effect of reaction medium and hydrothermal synthesis conditions on morphological parameters and thermal behavior of calcium phosphate nanoparticles. Ceram. Int. 2021, 47, 2809–2821. [Google Scholar] [CrossRef]
  34. Hattori, T.; Lwadate, Y. Hydrothermal preparation of calcium hydroxyapatite powders. J. Am. Ceram. Soc. 1990, 73, 1803–1805. [Google Scholar] [CrossRef]
  35. Laonapakul, T.; Sutthi, R.; Chaikool, P.; Talangkun, S.; Boonma, A.; Chindaprasirt, P. Calcium phosphate powders synthesized from CaCO3 and CaO of natural origin using mechanical activation in different media combined with solid-state interaction. Mater. Sci. Eng. C 2021, 118, 111333. [Google Scholar] [CrossRef] [PubMed]
  36. Pramanik, S.; Agarwal, A.K.; Rai, K.N.; Garg, A. Development of high strength hydroxyapatite by solid-state-sintering process. Ceram. Int. 2007, 33, 419–426. [Google Scholar] [CrossRef]
  37. Fonseca, R.L.M.; de Souza Gonçalves, B.; Balarini, J.C.; Nunes, E.H.M.; Houmard, M. Deliquescent behavior of calcium phosphate materials synthesized by sol–gel technique. J. Sol-Gel Sci. Technol. 2021, 97, 404–413. [Google Scholar] [CrossRef]
  38. Wang, F.; Liu, M.; Lu, Y.; Qi, Y. A simple sol–gel technique for preparing hydroxyapatite nanopowders. Mater. Lett. 2005, 59, 916–919. [Google Scholar]
  39. Gutiérrez-Arenas, D.A.; Cuca-García, M.; Méndez-Rojas, M.A.; Pro-Martínez, A.; Becerril-Pérez, C.M.; Mendoza-Álvarez, M.E.; Ávila-Ramos, F.; Ramírez-Bribiesca, J.E. Designing Calcium Phosphate Nanoparticles with the Co-Precipitation Technique to Improve Phosphorous Availability in Broiler Chicks. Animals 2021, 11, 2773. [Google Scholar] [CrossRef]
  40. Bernard, L.; Freche, M.; Lacout, J.L.; Biscans, B. Preparation of hydroxyapatite by neutralization at low temperature—Influence of purity of the raw material. Powder Technol. 1999, 103, 19–25. [Google Scholar] [CrossRef]
  41. Nagata, F.; Miyajima, T.; Yokogawa, Y. A method to fabricate hydroxyapatite/poly(lactic acid) microspheres intended for biomedical application. J. Eur. Ceram. Soc. 2006, 26, 533–535. [Google Scholar] [CrossRef]
  42. Radwan, N.H.; Nasr, M.; Ishak, R.A.H.; Abdeltawab, N.F.; Awad, G.A.S. Chitosan-calcium phosphate composite scaffolds for control of post-operative osteomyelitis: Fabrication, characterization, and in vitro–in vivo evaluation. Carbohydr. Polym. 2020, 244, 116482. [Google Scholar] [CrossRef] [PubMed]
  43. Ressler, A.; Ohlsbom, R.; Žužić, A.; Gebraad, A.; Frankberg, E.J.; Pakarinen, T.-K.; Ivanković, H.; Miettinen, S.; Ivanković, M. Chitosan/collagen/Mg, Se, Sr, Zn-substituted calcium phosphate scaffolds for bone tissue engineering applications: A growth factor free approach. Eur. Polym. J. 2023, 194, 112129. [Google Scholar] [CrossRef]
  44. Sinha, A.; Mishra, T.; Ravishankar, N. Polymer assisted hydroxyapatite microspheres suitable for biomedical application. J. Mater. Sci. Mater. Med. 2008, 19, 2009–2013. [Google Scholar] [CrossRef] [PubMed]
  45. Feng, Z.-Q.; Chu, X.; Huang, N.-P.; Wang, T.; Wang, Y.; Shi, X.; Ding, Y.; Gu, Z.-Z. The effect of nanofibrous galactosylated chitosan scaffolds on the formation of rat primary hepatocyte aggregates and the maintenance of liver function. Biomaterials 2009, 30, 2753–2763. [Google Scholar] [CrossRef] [PubMed]
  46. Hu, Q.; Li, B.; Wang, M.; Shen, J. Preparation and characterization of biodegradable chitosan/hydroxyapatite nanocomposite rods via in situ hybridization: A potential material as internal fixation of bone fracture. Biomaterials 2004, 25, 779–785. [Google Scholar] [CrossRef]
  47. Iqbal, N.; Braxton, T.M.; Anastasiou, A.; Raif, E.M.; Chung, C.K.; Kumar, S.; Giannoudis, P.V.; Jha, A. Dicalcium Phosphate Dihydrate Mineral Loaded Freeze-Dried Scaffolds for Potential Synthetic Bone Applications. Materials 2022, 15, 6245. [Google Scholar] [CrossRef]
  48. Kong, L.; Gao, Y.; Cao, W.; Gong, Y.; Zhao, N.; Zhang, X. Preparation and characterization of nano-hydroxyapatite/chitosan composite scaffolds. J. Biomed. Mater. Res. Part A 2005, 75A, 275–282. [Google Scholar] [CrossRef]
  49. Feng, X.; Ma, L.; Lei, J.; Ouyang, Q.; Zeng, Y.; Luo, Y.; Zhang, X.; Song, Y.; Li, G.; Tan, L.; et al. Piezo-Augmented Sonosensitizer with Strong Ultrasound-Propelling Ability for Efficient Treatment of Osteomyelitis. ACS Nano 2022, 16, 2546–2557. [Google Scholar] [CrossRef]
  50. Meroni, G.; Tsikopoulos, A.; Tsikopoulos, K.; Allemanno, F.; Martino, P.A.; Soares Filipe, J.F. A Journey into Animal Models of Human Osteomyelitis: A Review. Microorganisms 2022, 10, 1135. [Google Scholar] [CrossRef]
  51. Cheng, Y.; Zhang, Y.; Zhao, Z.; Li, G.; Li, J.; Li, A.; Xue, Y.; Zhu, B.; Wu, Z.; Zhang, X. Guanidinium-Decorated Nanostructure for Precision Sonodynamic-Catalytic Therapy of MRSA-Infected Osteomyelitis. Adv. Mater. 2022, 34, 2206646. [Google Scholar] [CrossRef] [PubMed]
  52. Zelmer, A.R.; Nelson, R.; Richter, K.; Atkins, G.J. Can intracellular Staphylococcus aureus in osteomyelitis be treated using current antibiotics? A systematic review and narrative synthesis. Bone Res. 2022, 10, 53. [Google Scholar] [CrossRef] [PubMed]
  53. Jia, B.; Zhang, Z.; Zhuang, Y.; Yang, H.; Han, Y.; Wu, Q.; Jia, X.; Yin, Y.; Qu, X.; Zheng, Y.; et al. High-strength biodegradable zinc alloy implants with antibacterial and osteogenic properties for the treatment of MRSA-induced rat osteomyelitis. Biomaterials 2022, 287, 121663. [Google Scholar] [CrossRef] [PubMed]
  54. Lin, L.; Shao, J.; Ma, J.; Zou, Q.; Li, J.; Zuo, Y.; Yang, F.; Li, Y. Development of ciprofloxacin and nano-hydroxyapatite dual-loaded polyurethane scaffolds for simultaneous treatment of bone defects and osteomyelitis. Mater. Lett. 2019, 253, 86–89. [Google Scholar] [CrossRef]
  55. Zhong, C.; Wu, Y.; Lin, H.; Liu, R. Advances in the antimicrobial treatment of osteomyelitis. Compos. Part B Eng. 2023, 249, 110428. [Google Scholar] [CrossRef]
  56. ASTM F1185-03; Standard Specification for Composition of Hydroxylapatite for Surgical Implants. Available online: https://webstore.ansi.org/standards/astm/astmf118503 (accessed on 4 January 2024).
  57. Morsy, M.; Mostafa, K.; Amyn, H.; El-Ebissy, A.A.-h.; Salah, A.M.; Youssef, M.A. Synthesis and characterization of freeze dryer chitosan nano particles as multi functional eco-friendly finish for fabricating easy care and antibacterial cotton textiles. Egypt. J. Chem. 2019, 62, 1277–1293. [Google Scholar] [CrossRef]
  58. Gheisari, H.; Karamian, E.; Abdellahi, M. A novel hydroxyapatite–Hardystonite nanocomposite ceramic. Ceram. Int. 2015, 41, 5967–5975. [Google Scholar] [CrossRef]
  59. Sing, K.S. Reporting physisorption data for gas/solid systems with special reference to the determination of surface area and porosity (Recommendations 1984). Pure Appl. Chem. 1985, 57, 603–619. [Google Scholar] [CrossRef]
  60. Wang, Y.; Moo, Y.X.; Chen, C.; Gunawan, P.; Xu, R. Fast precipitation of uniform CaCO3 nanospheres and their transformation to hollow hydroxyapatite nanospheres. J. Colloid Interface Sci. 2010, 352, 393–400. [Google Scholar] [CrossRef]
  61. Jiang, S.-D.; Yao, Q.-Z.; Zhou, G.-T.; Fu, S.-Q. Fabrication of Hydroxyapatite Hierarchical Hollow Microspheres and Potential Application in Water Treatment. J. Phys. Chem. C 2012, 116, 4484–4492. [Google Scholar] [CrossRef]
  62. Daryan, S.H.; Khavandi, A.; Javadpour, J. Surface engineered hollow hydroxyapatite microspheres: Hydrothermal synthesis and growth mechanisms. Solid State Sci. 2020, 106, 106301. [Google Scholar] [CrossRef]
  63. Wu, M.-Y.; Liang, Y.-H.; Yen, S.-K. Effects of Chitosan on Loading and Releasing for Doxorubicin Loaded Porous Hydroxyapatite–Gelatin Composite Microspheres. Polymers 2022, 14, 4276. [Google Scholar] [PubMed]
  64. Ordikhani, F.; Tamjid, E.; Simchi, A. Characterization and antibacterial performance of electrodeposited chitosan–vancomycin composite coatings for prevention of implant-associated infections. Mater. Sci. Eng. C 2014, 41, 240–248. [Google Scholar] [CrossRef] [PubMed]
  65. Yang, C.-C.; Lin, C.-C.; Liao, J.-W.; Yen, S.-K. Vancomycin–chitosan composite deposited on post porous hydroxyapatite coated Ti6Al4V implant for drug controlled release. Mater. Sci. Eng. C 2013, 33, 2203–2212. [Google Scholar] [CrossRef] [PubMed]
  66. López-Iglesias, C.; Barros, J.; Ardao, I.; Monteiro, F.J.; Alvarez-Lorenzo, C.; Gómez-Amoza, J.L.; García-González, C.A. Vancomycin-loaded chitosan aerogel particles for chronic wound applications. Carbohydr. Polym. 2019, 204, 223–231. [Google Scholar] [CrossRef]
  67. Zhang, J.; Wang, C.; Wang, J.; Qu, Y.; Liu, G. In vivo drug release and antibacterial properties of vancomycin loaded hydroxyapatite/chitosan composite. Drug Deliv. 2012, 19, 264–269. [Google Scholar] [CrossRef]
  68. Chang, S.-H.; Lin, H.-T.V.; Wu, G.-J.; Tsai, G.J. pH Effects on solubility, zeta potential, and correlation between antibacterial activity and molecular weight of chitosan. Carbohydr. Polym. 2015, 134, 74–81. [Google Scholar] [CrossRef]
  69. Maleki Dizaj, S.; Lotfipour, F.; Barzegar-Jalali, M.; Zarrintan, M.-H.; Adibkia, K. Physicochemical characterization and antimicrobial evaluation of gentamicin-loaded CaCO3 nanoparticles prepared via microemulsion method. J. Drug Deliv. Sci. Technol. 2016, 35, 16–23. [Google Scholar] [CrossRef]
  70. Yang, X.; Shi, G.; Guo, J.; Wang, C.; He, Y. Exosome-encapsulated antibiotic against intracellular infections of methicillin-resistant Staphylococcus aureus. Int. J. Nanomed. 2018, 13, 8095–8104. [Google Scholar] [CrossRef]
  71. Babaei, M.; Ghaee, A.; Nourmohammadi, J. Poly (sodium 4-styrene sulfonate)-modified hydroxyapatite nanoparticles in zein-based scaffold as a drug carrier for vancomycin. Mater. Sci. Eng. C 2019, 100, 874–885. [Google Scholar] [CrossRef]
Figure 1. Chitosan structure.
Polymers 16 00167 g001
Figure 2. Experimental flow chart.
Polymers 16 00167 g002
Figure 3. X-ray diffraction patterns of the as-prepared Chi-CaPM.
Polymers 16 00167 g003
Figure 4. XRD diagrams of the heat-treated Chi-CaPM.
Polymers 16 00167 g004
Figure 5. XRD diagrams of the heat-treated chitosan.
Polymers 16 00167 g005
Figure 6. TEM image of the Chi-CaPM at (a) 20,000× magnification (b) 50,000× magnification, and (c) 100,000× magnification and (d) the SADP of the Chi-CaPM.
Polymers 16 00167 g006
Figure 7. TEM images of the Chi-CaPM treated at 500 °C at 50,000× magnification (a) in bright field and (b) dark field conditions including the SADP.
Polymers 16 00167 g007
Figure 8. TEM images of the Chi-CaPM treated at 700 °C at 50,000× magnification (a) in bright field and (b) dark field conditions including the SADP.
Polymers 16 00167 g008
Figure 9. TGA (solid line)/DSC (dotted line) profiles of chitosan in (a) air and (b) N2.
Polymers 16 00167 g009
Figure 10. TGA (solid line)/DSC (dotted line) profiles of HAp in (a) air and (b) N2.
Polymers 16 00167 g010
Figure 11. TGA (solid line)/DSC (dotted line) profiles of Chi-CaPM in (a) air and (b) N2.
Polymers 16 00167 g011
Figure 12. The FTIR spectra of (a) HAp, (b) chitosan, and (c) Chi-CaPM.
Polymers 16 00167 g012aPolymers 16 00167 g012b
Figure 13. EDS spectra of Chi-CaPM.
Polymers 16 00167 g013
Figure 14. Morphology of Chi-CaPM.
Polymers 16 00167 g014
Figure 15. Morphology of 150 °C Chi-CaPM.
Polymers 16 00167 g015
Figure 16. Morphology of 300 °C Chi-CaPM.
Polymers 16 00167 g016
Figure 17. Morphology of 500 °C CaPM.
Polymers 16 00167 g017
Figure 18. Morphology of 700 °C CaPM.
Polymers 16 00167 g018
Figure 19. BET nitrogen adsorption/desorption isotherm.
Polymers 16 00167 g019
Figure 20. BJH desorption pore.
Polymers 16 00167 g020
Figure 21. The cumulative drug release of (a) V-Chi-CaPM with (black one) and without (red one) additional chitosan and (b) V-Chi-CaPM, Z-Chi-CaPM, and G-Chi-CaPM with additional chitosan.
Polymers 16 00167 g021
Table 1. The compositions of Chi-CaPM derived from the EDS analysis.
Elementwt.%at.%
C15.2825.17
O41.5251.33
P15.119.64
Ca28.0913.86
Totals100.00100.00
Table 2. ICP-MS of the element analysis.
(a) 5% HCl(b) Chi-CaPM Dissolved in 5% HCl(c) Pure Chi-CaPM
P0.0295109108.97
Ca0.015160159.99
As0.07730.15530.0780
Cd0.000930.012330.0114
Hg0.001260.023080.0218
Pb0.02570.14510.1194
Unit: ppm (part per million).
Table 3. BET analysis of surface area, pore volume, and pore size.
BET Adsorption TheoryBJH
AdsorptionDesorption
Surface area38.16 m2/g33.32 m2/g76.29 m2/g
Pore volume 0.244 cm3/g0.244 cm3/g
Pore size18.49 nm29.29 nm12.80 nm
Disclaimer/Publisher’s Note: The statements, opinions and data contained in all publications are solely those of the individual author(s) and contributor(s) and not of MDPI and/or the editor(s). MDPI and/or the editor(s) disclaim responsibility for any injury to people or property resulting from any ideas, methods, instructions or products referred to in the content.

