

Influence of Extrusion Parameters on the Mechanical Properties of Slow Crystallizing Carbon Fiber-Reinforced PAEK in Large Format Additive Manufacturing


Abstract
1. Introduction
2. Materials and Methods
2.1. Materials
2.2. Sample Preparation
2.2.1. Large Format Additive Manufacturing
2.2.2. Sample Geometry and Parameter Settings
2.2.3. Machining of Coupons and Polishing of Cross-Sections
2.3. Material Characterization
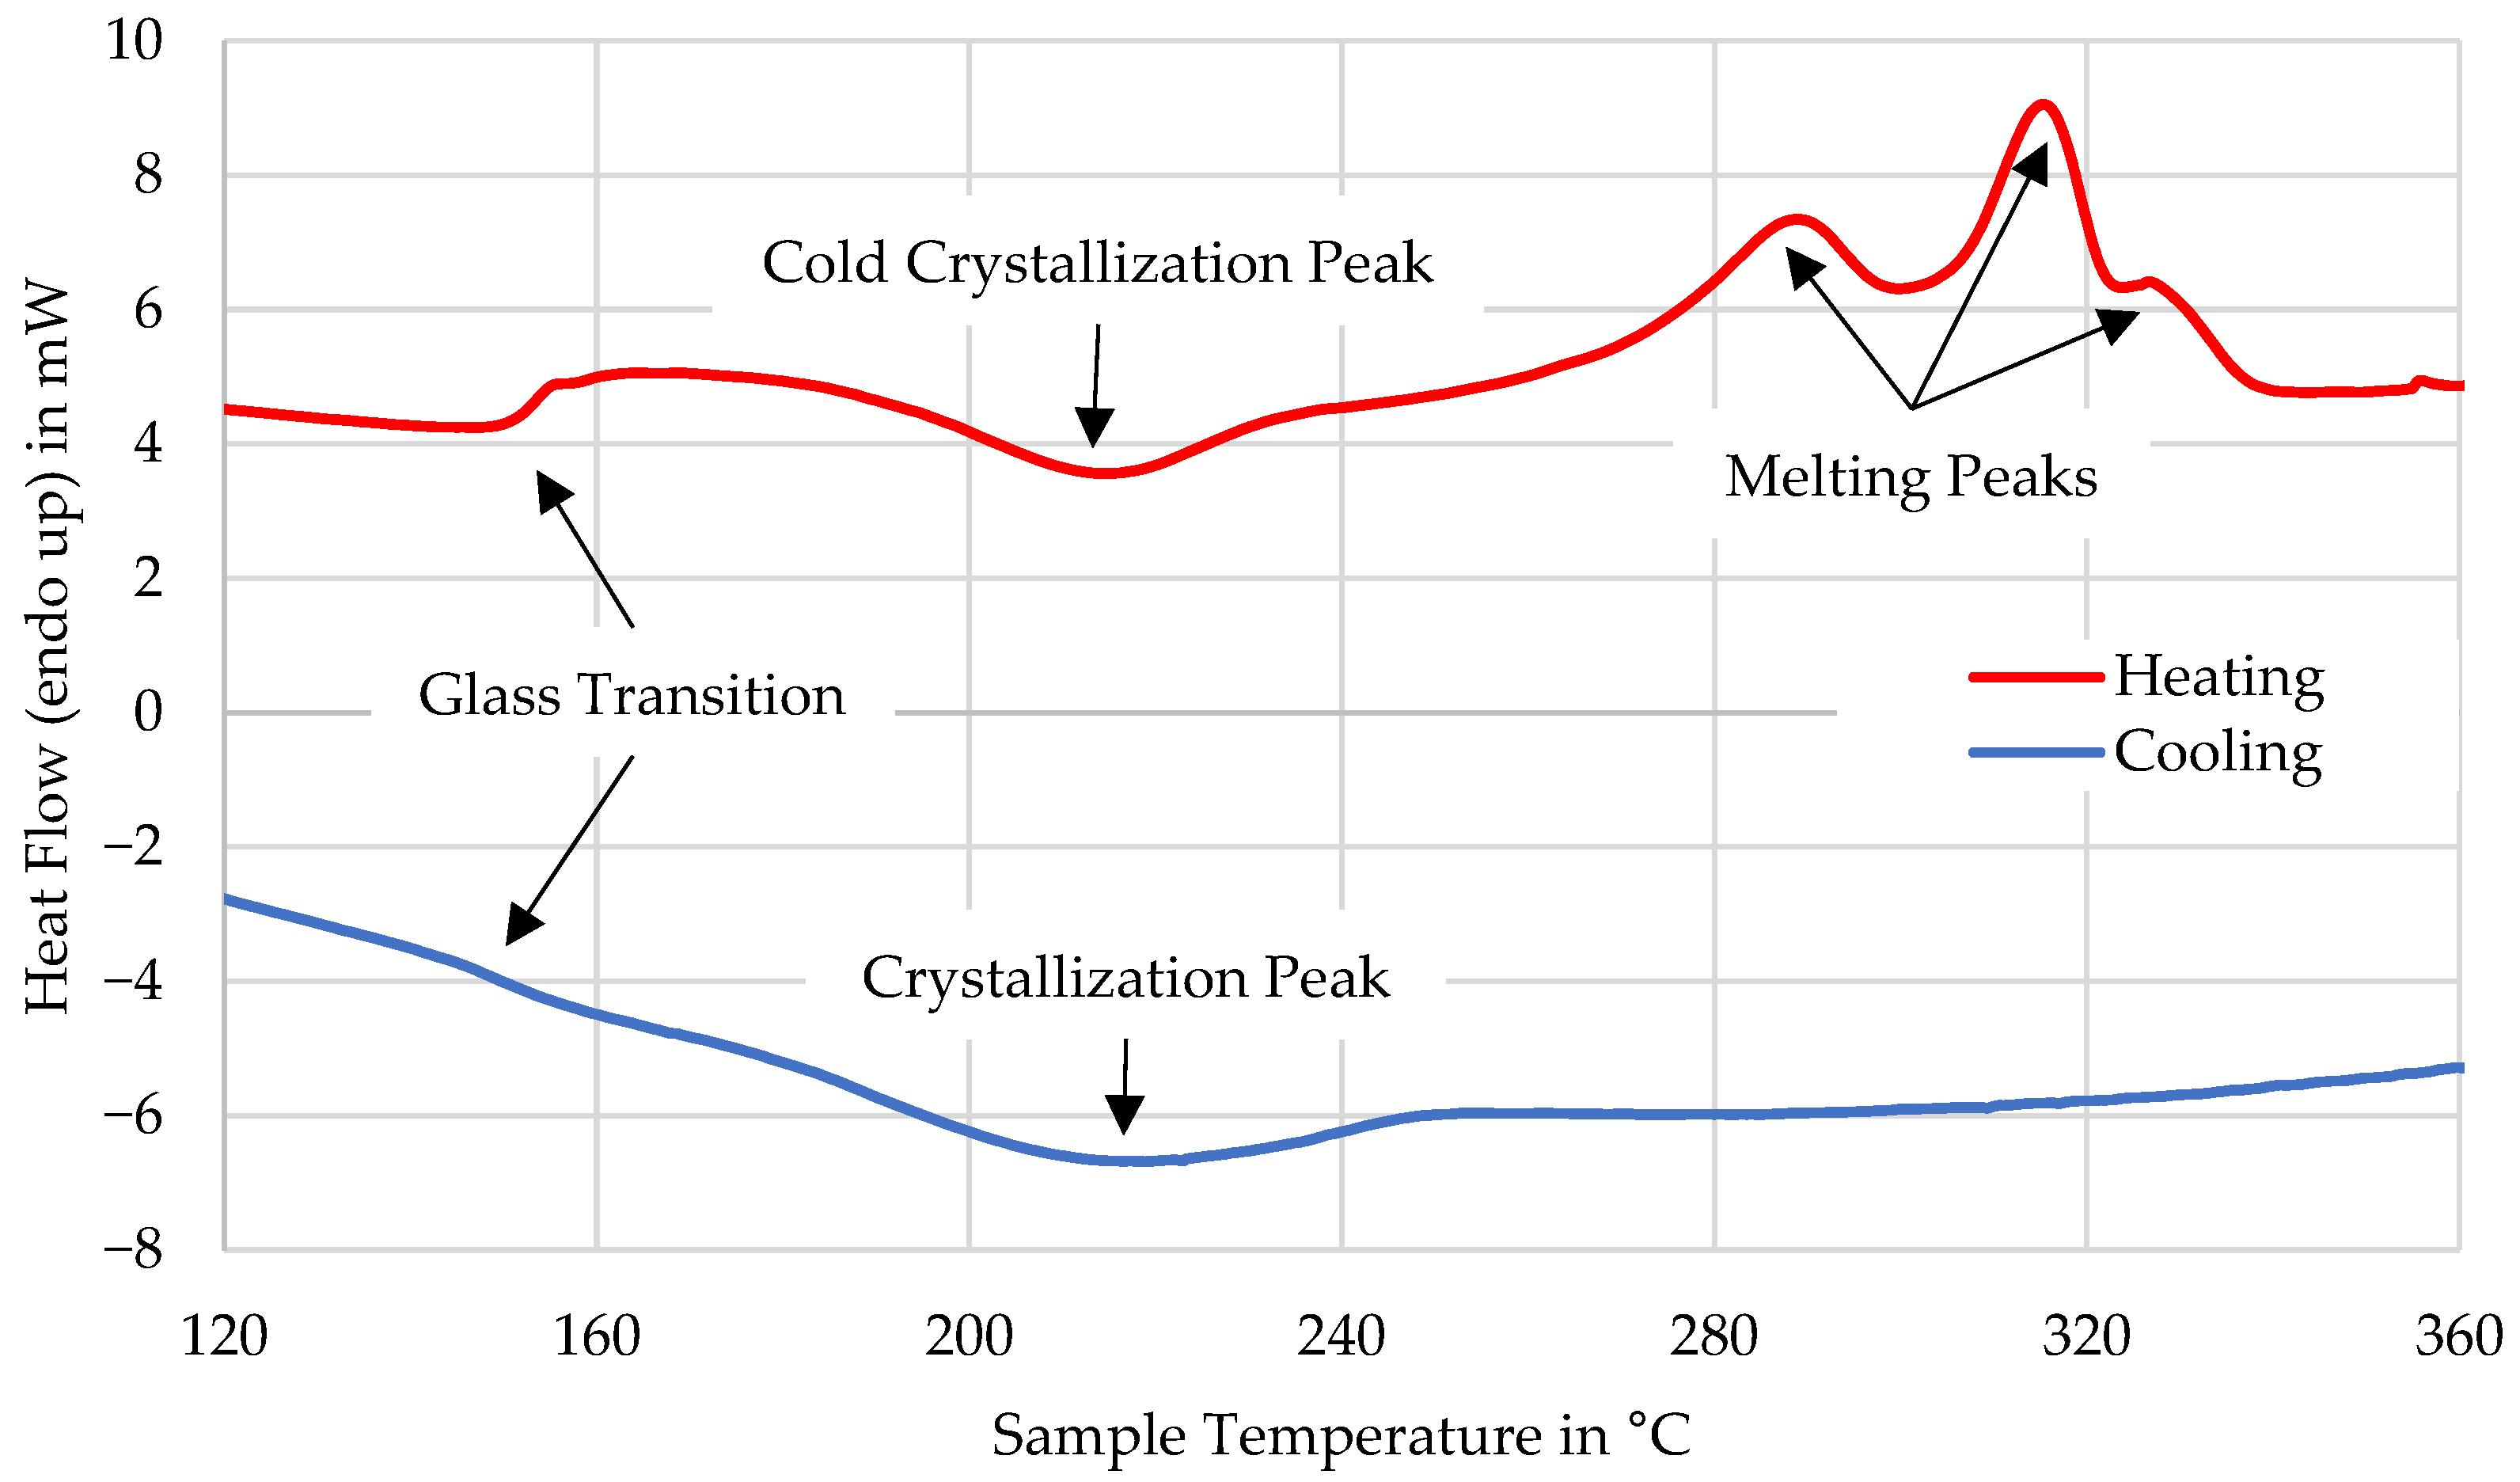
2.3.1. DSC Measurement for Recreating Thermal History
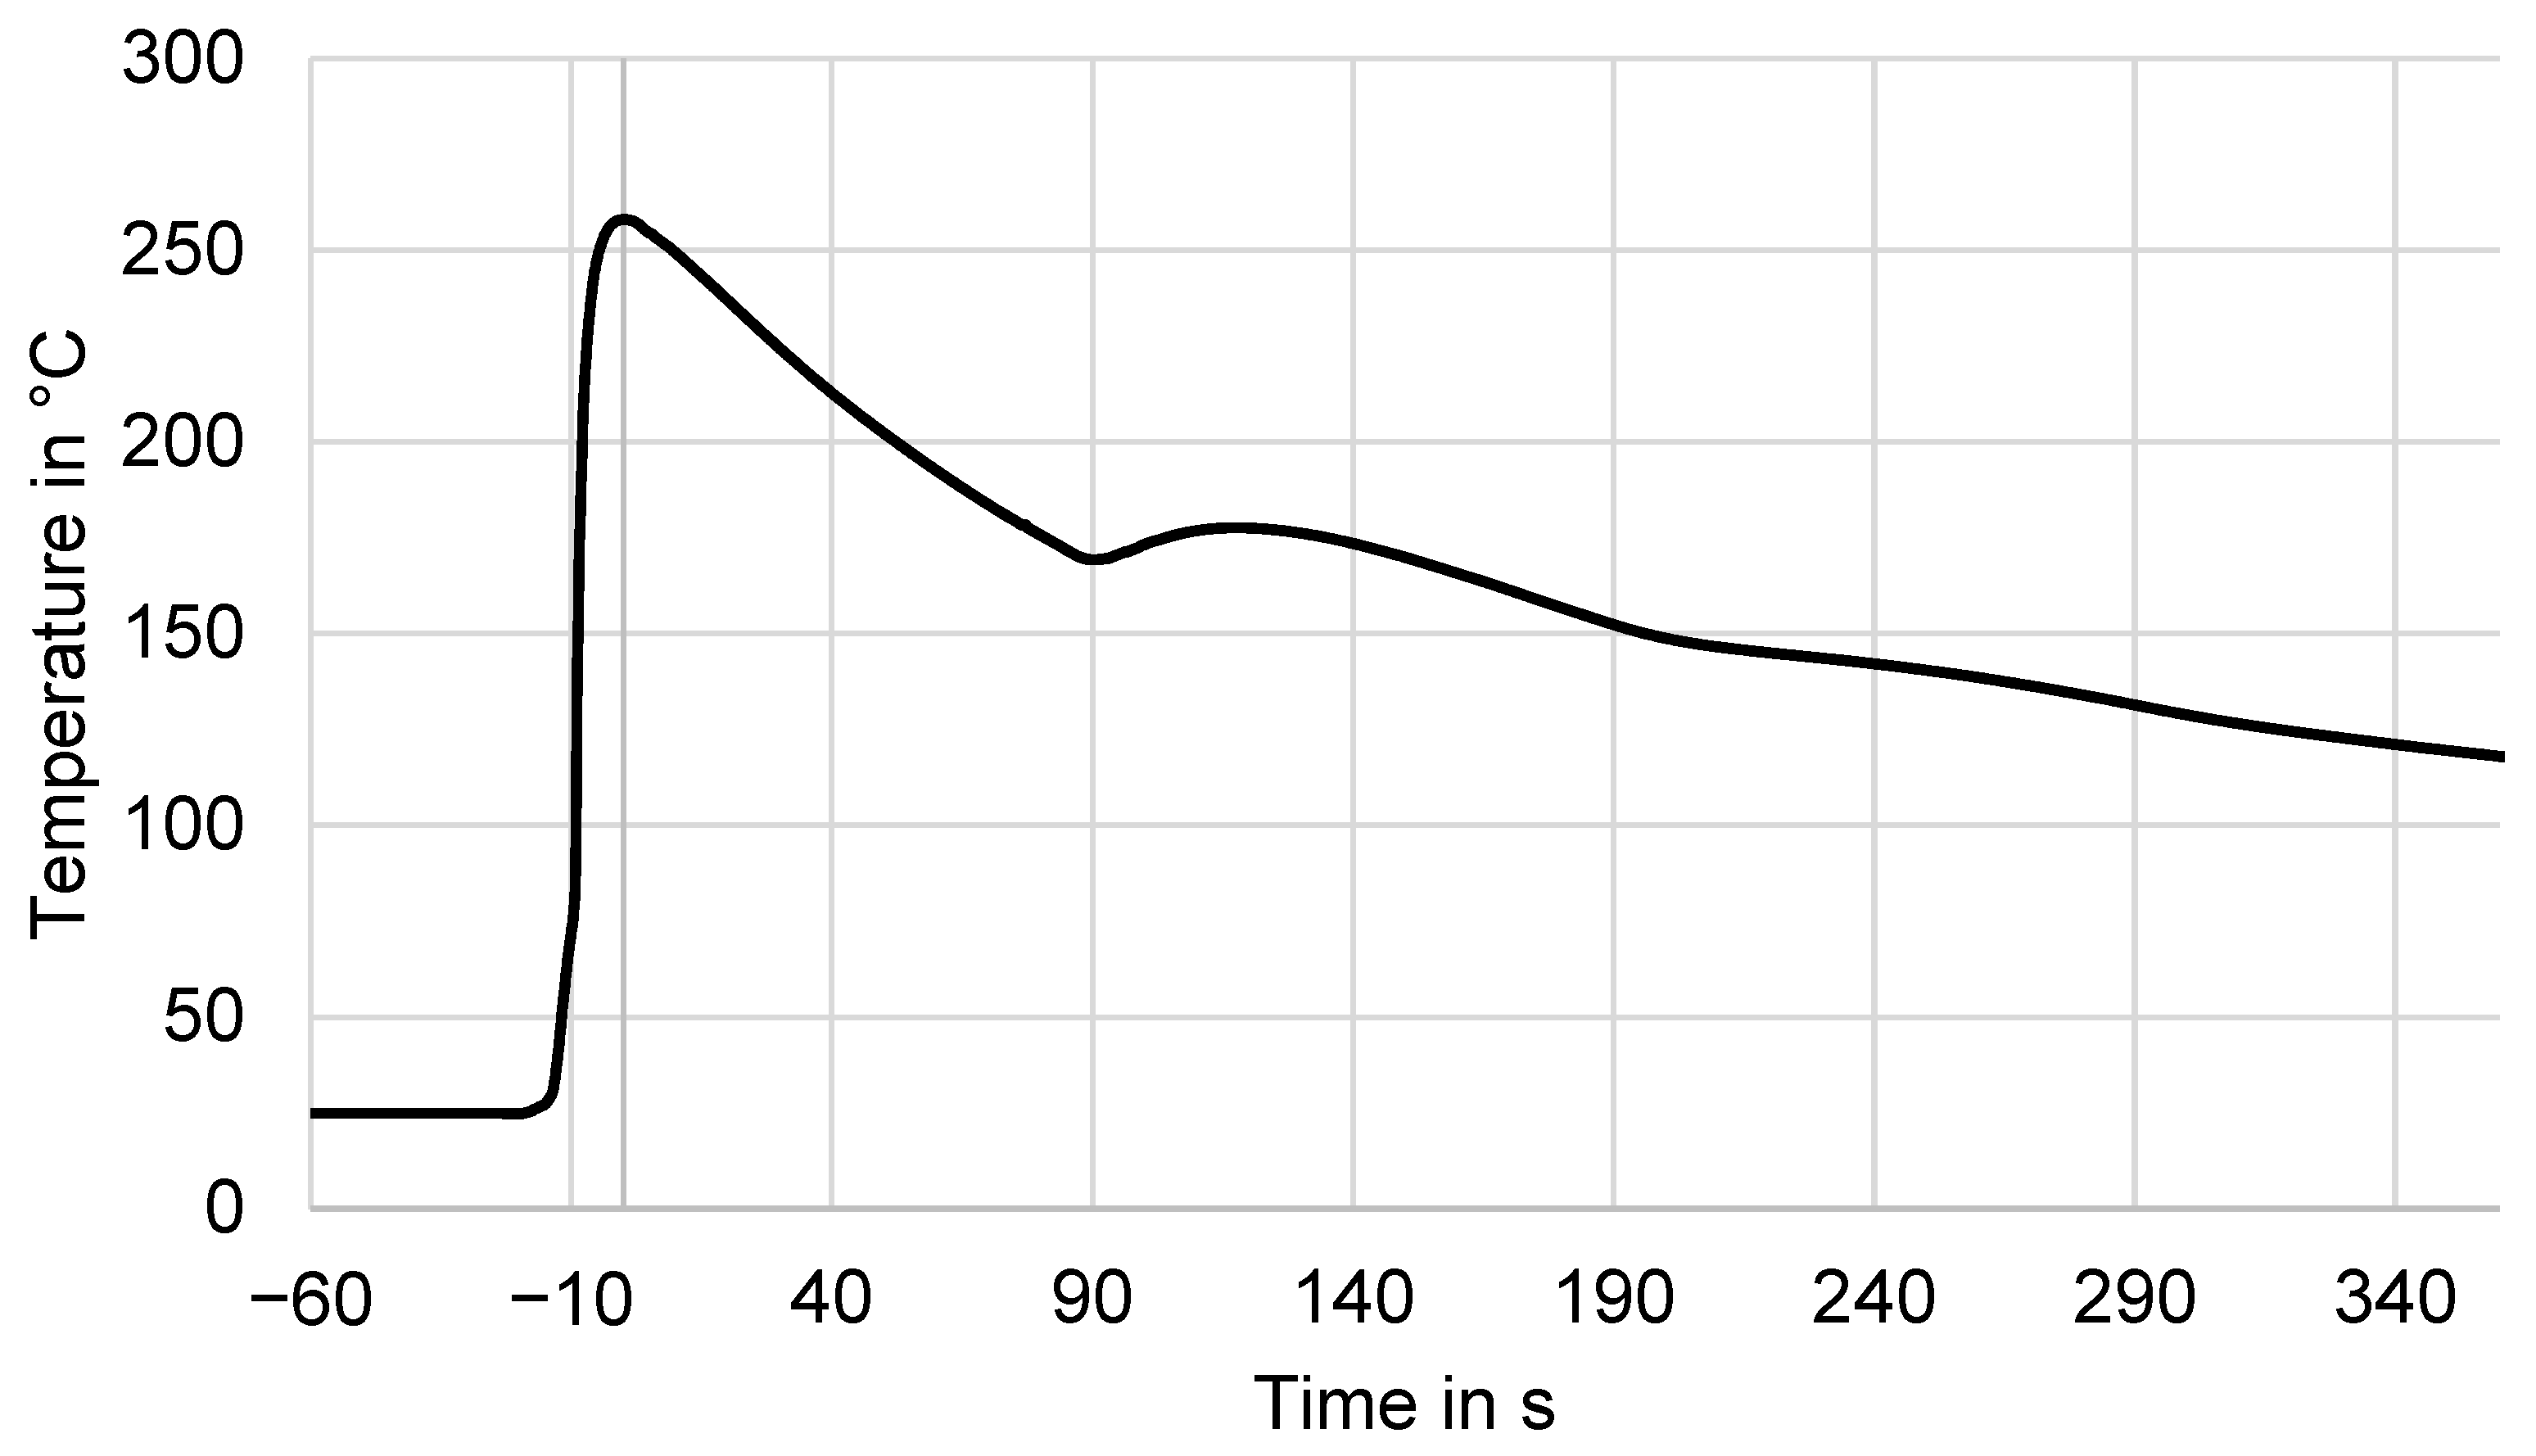
- Quench-Cooling: After extrusion, the fresh molten material immediately comes into contact with the print surface, leading to rapid quench-cooling. During this phase, the material was rapidly cooled to an elevated temperature slightly below the extrusion temperature. In Figure 2, this corresponds to the drop in the extrusion temperature of 350 °C to the maximum recorded temperature of 260 °C. This occurs within the 15 s from the first onset temperature increase at −15s and corresponds to a cooling rate of 360 K/min in this example.
- Fast Cooling: Once the layer was deposited and free on three sides, fast cooling occurred to a second, lower temperature at time 0 to 90 s in Figure 2 to 170 °C. Cooling rates during this phase were between 60 and 120 K/min, in the example shown, at a relatively low rate of 60 K/min compared to the other experiments.
- Slow Cooling: After the next layer was deposited, after a short increase in temperature, the cooling rate of the material, now only free on its sides, was reduced. This slower cooling phase could provide sufficient time for the material to achieve crystallization, if transition to the slow phase occurred at a high enough temperature level. Cooling rates in this phase were lower than 25 K/min, in the example, from 120 s onwards at on average 15 K/min until 360 s.
2.3.2. Fiber Alignment
2.3.3. Mechanical Testing
2.3.4. Data Analysis
3. Results and Discussion
3.1. Thermal History and Crystallization
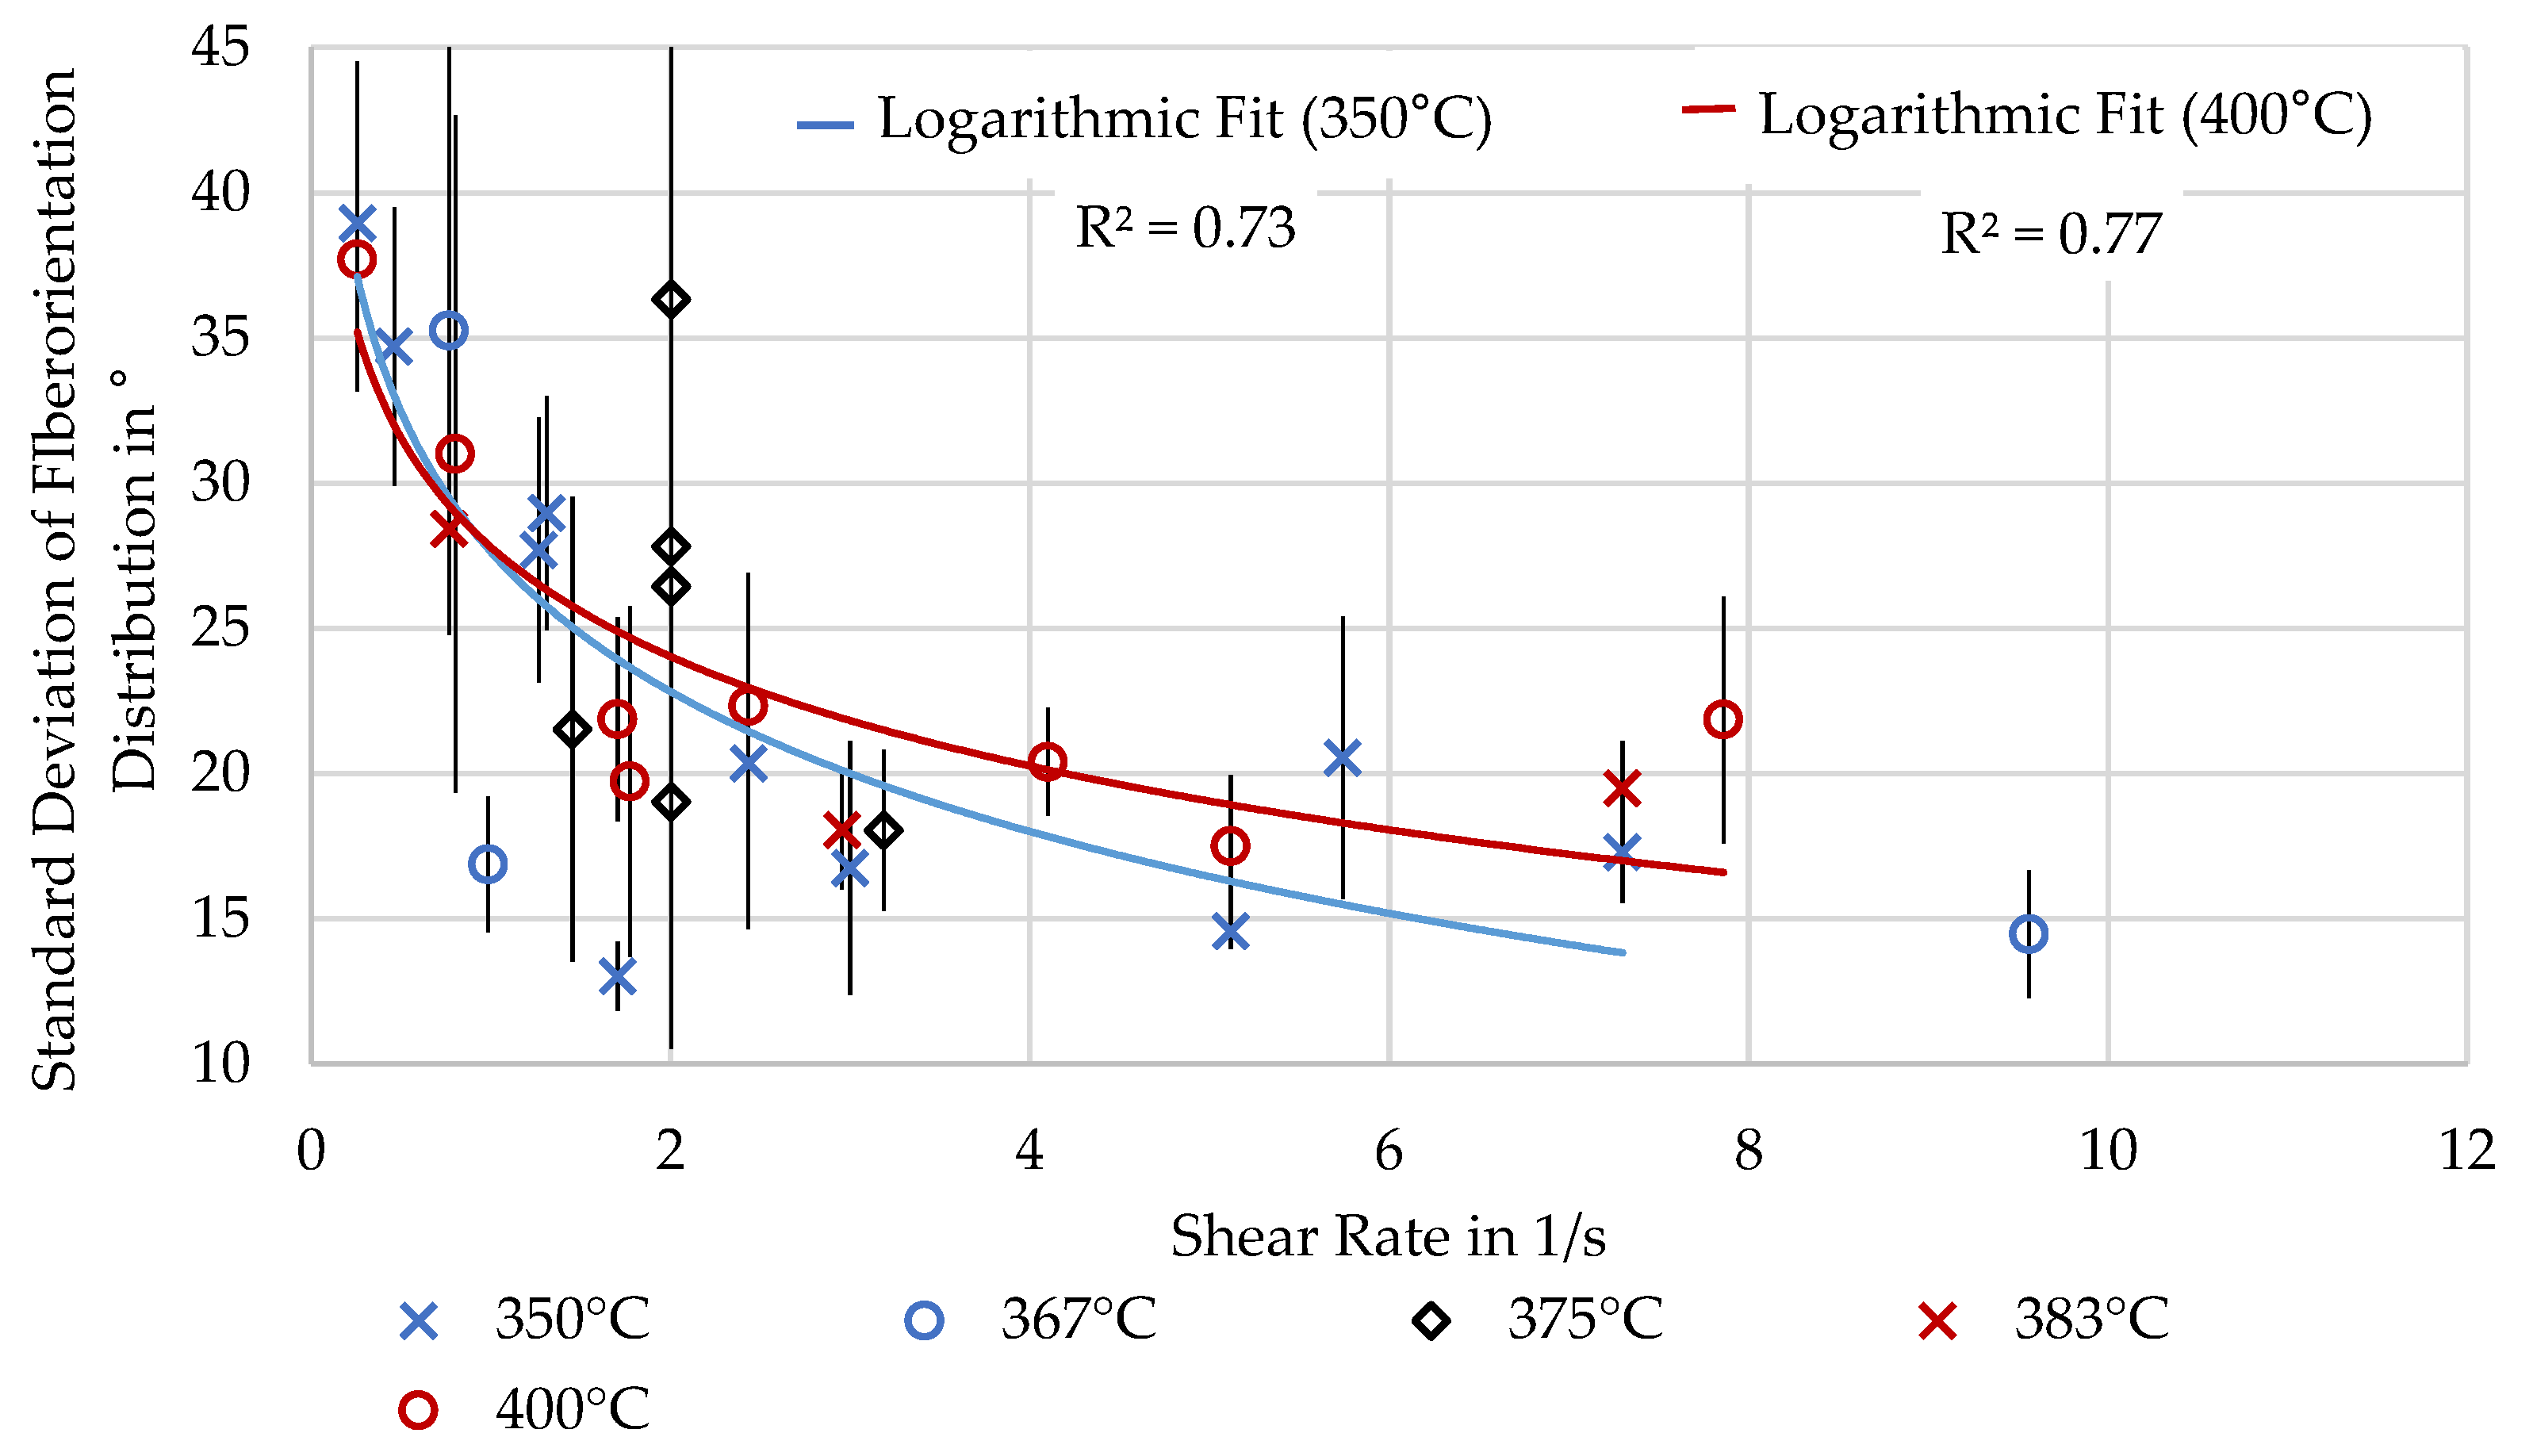
3.2. Fiber Misalignment
3.3. Mechanical Properties
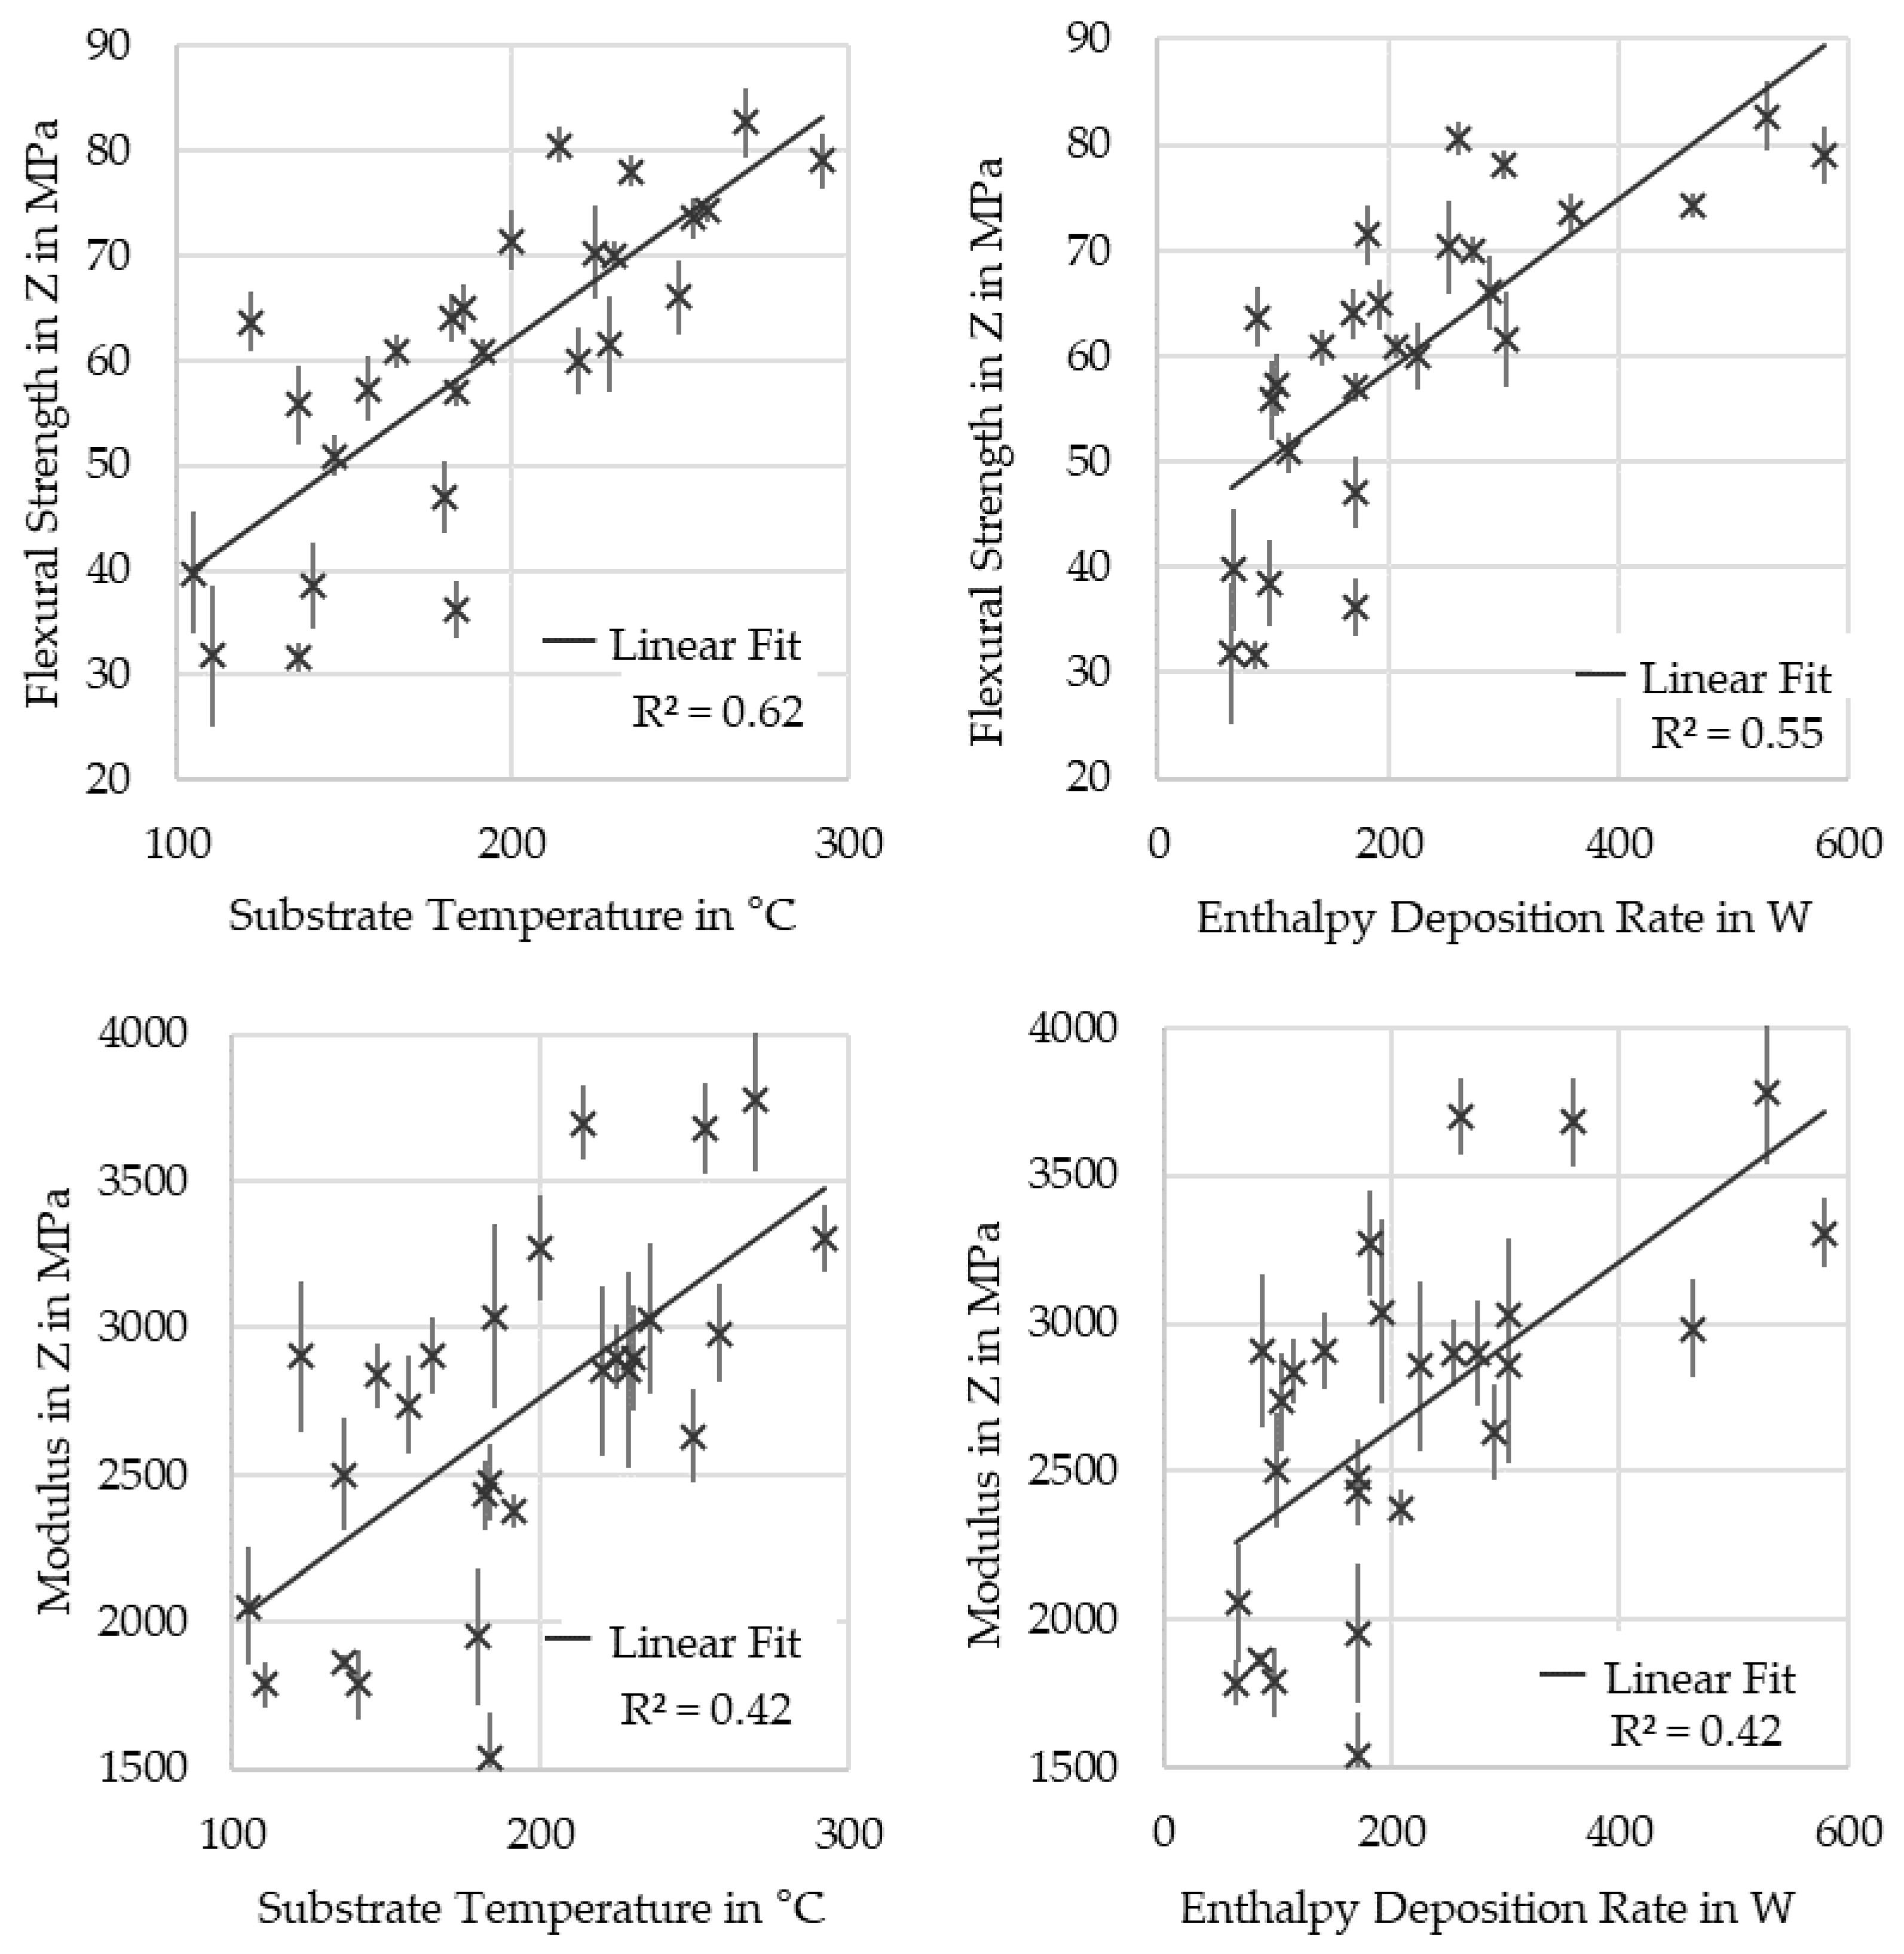
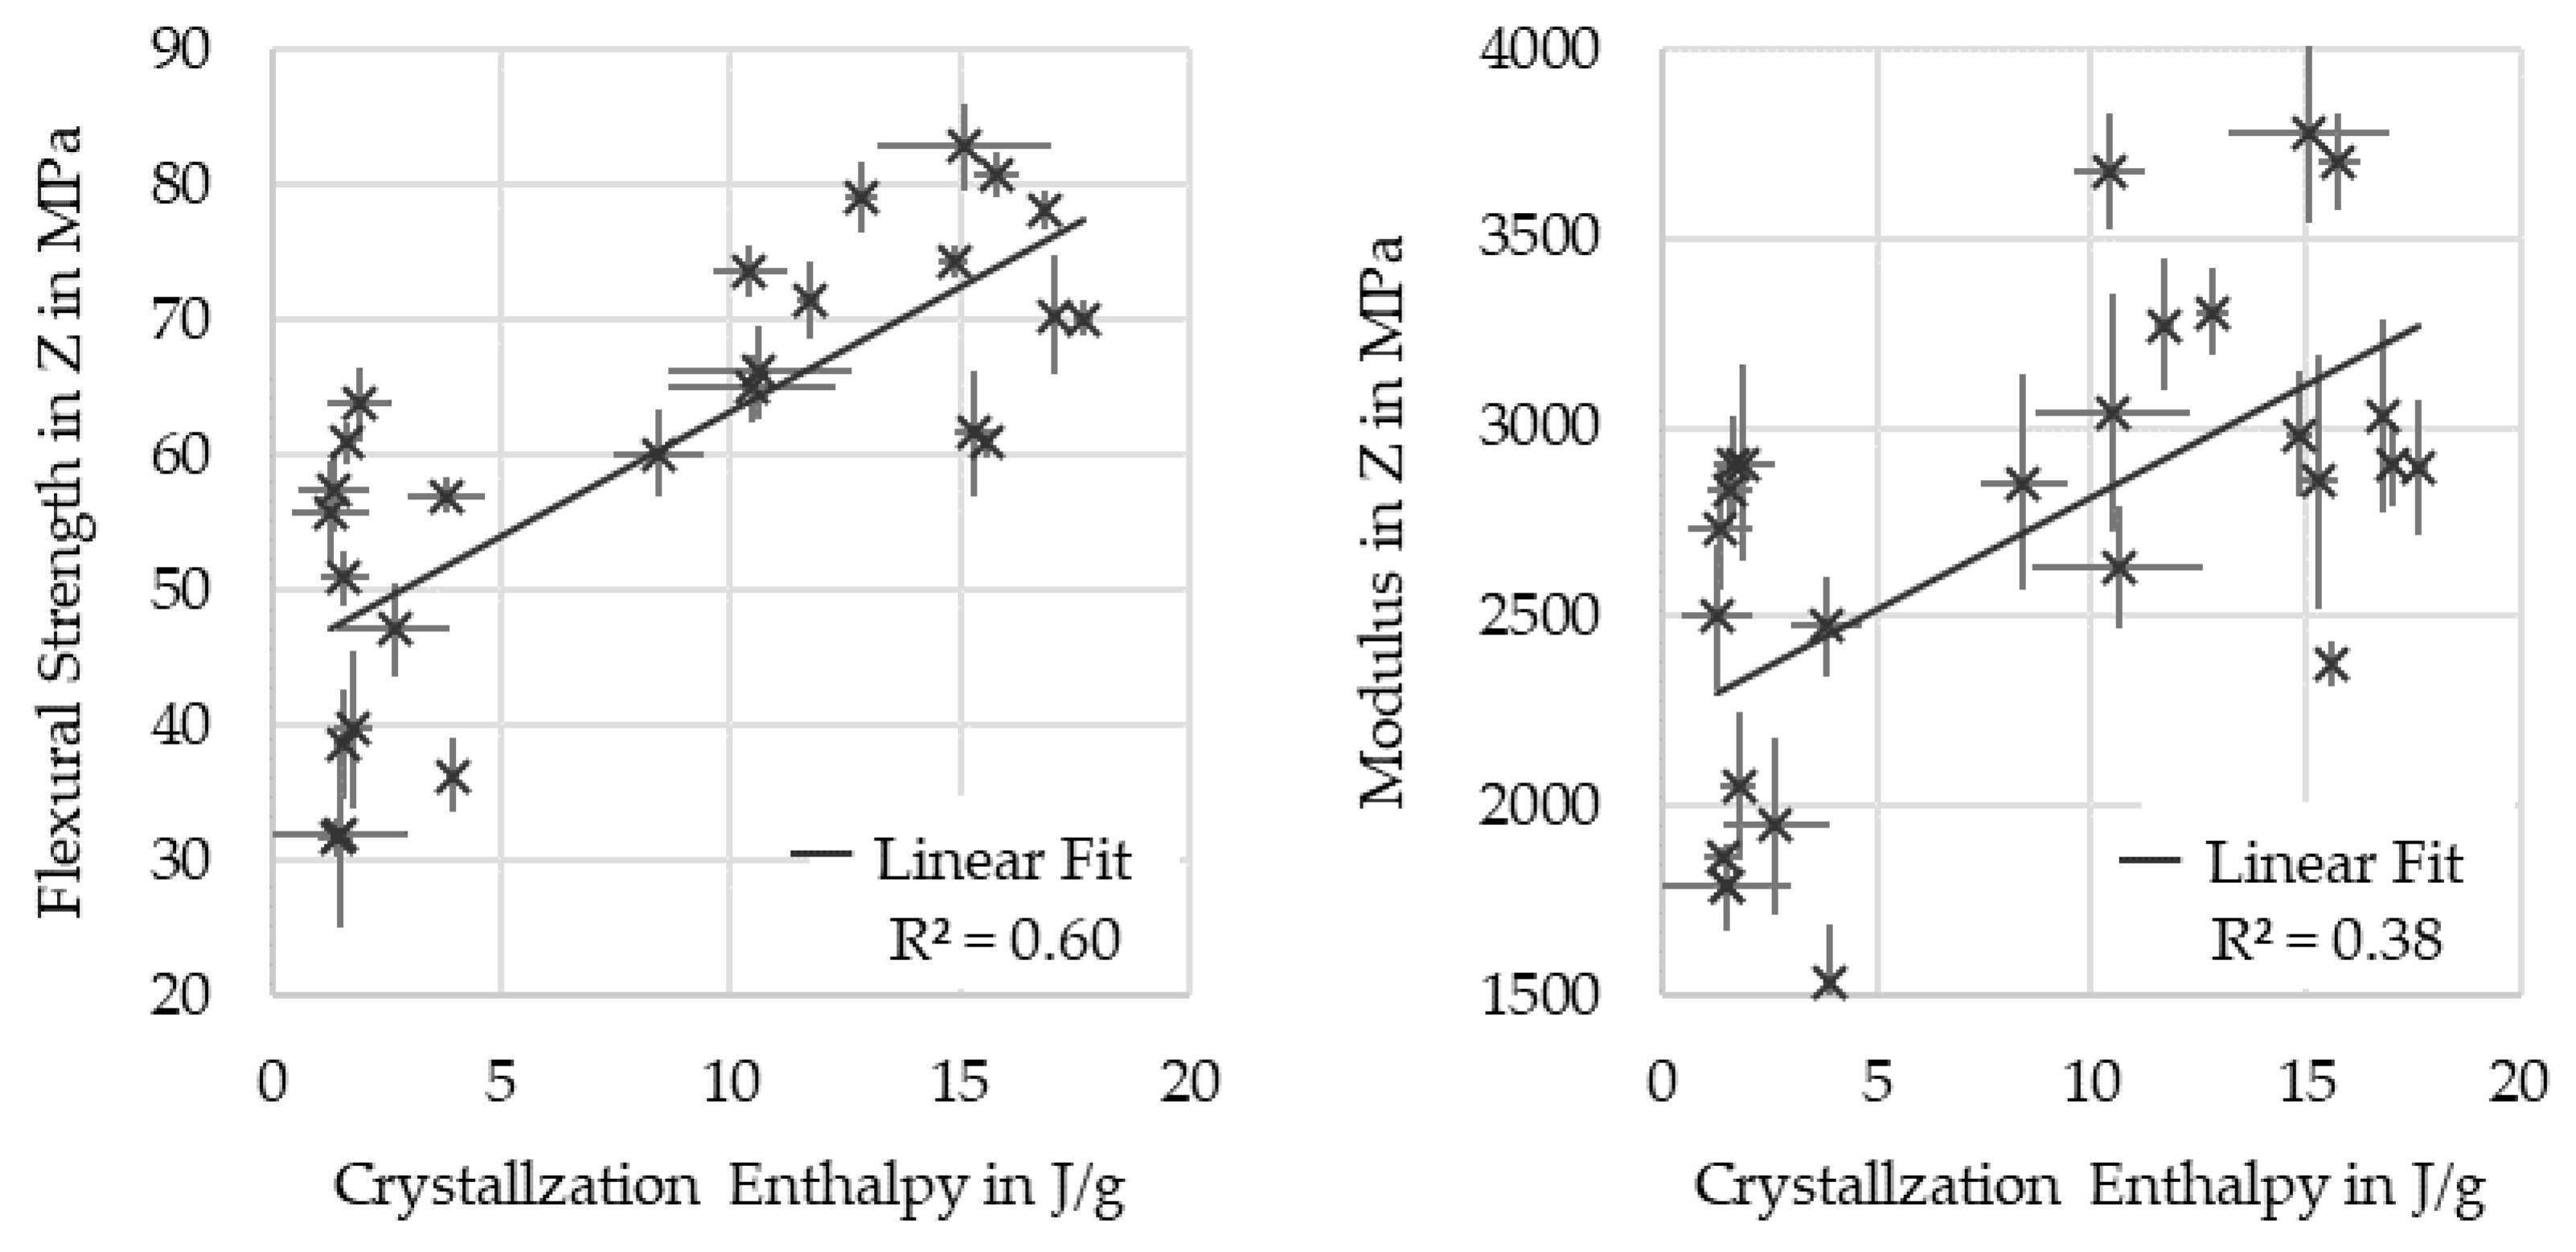
3.3.1. Matrix and Thermal History Dominated in Z
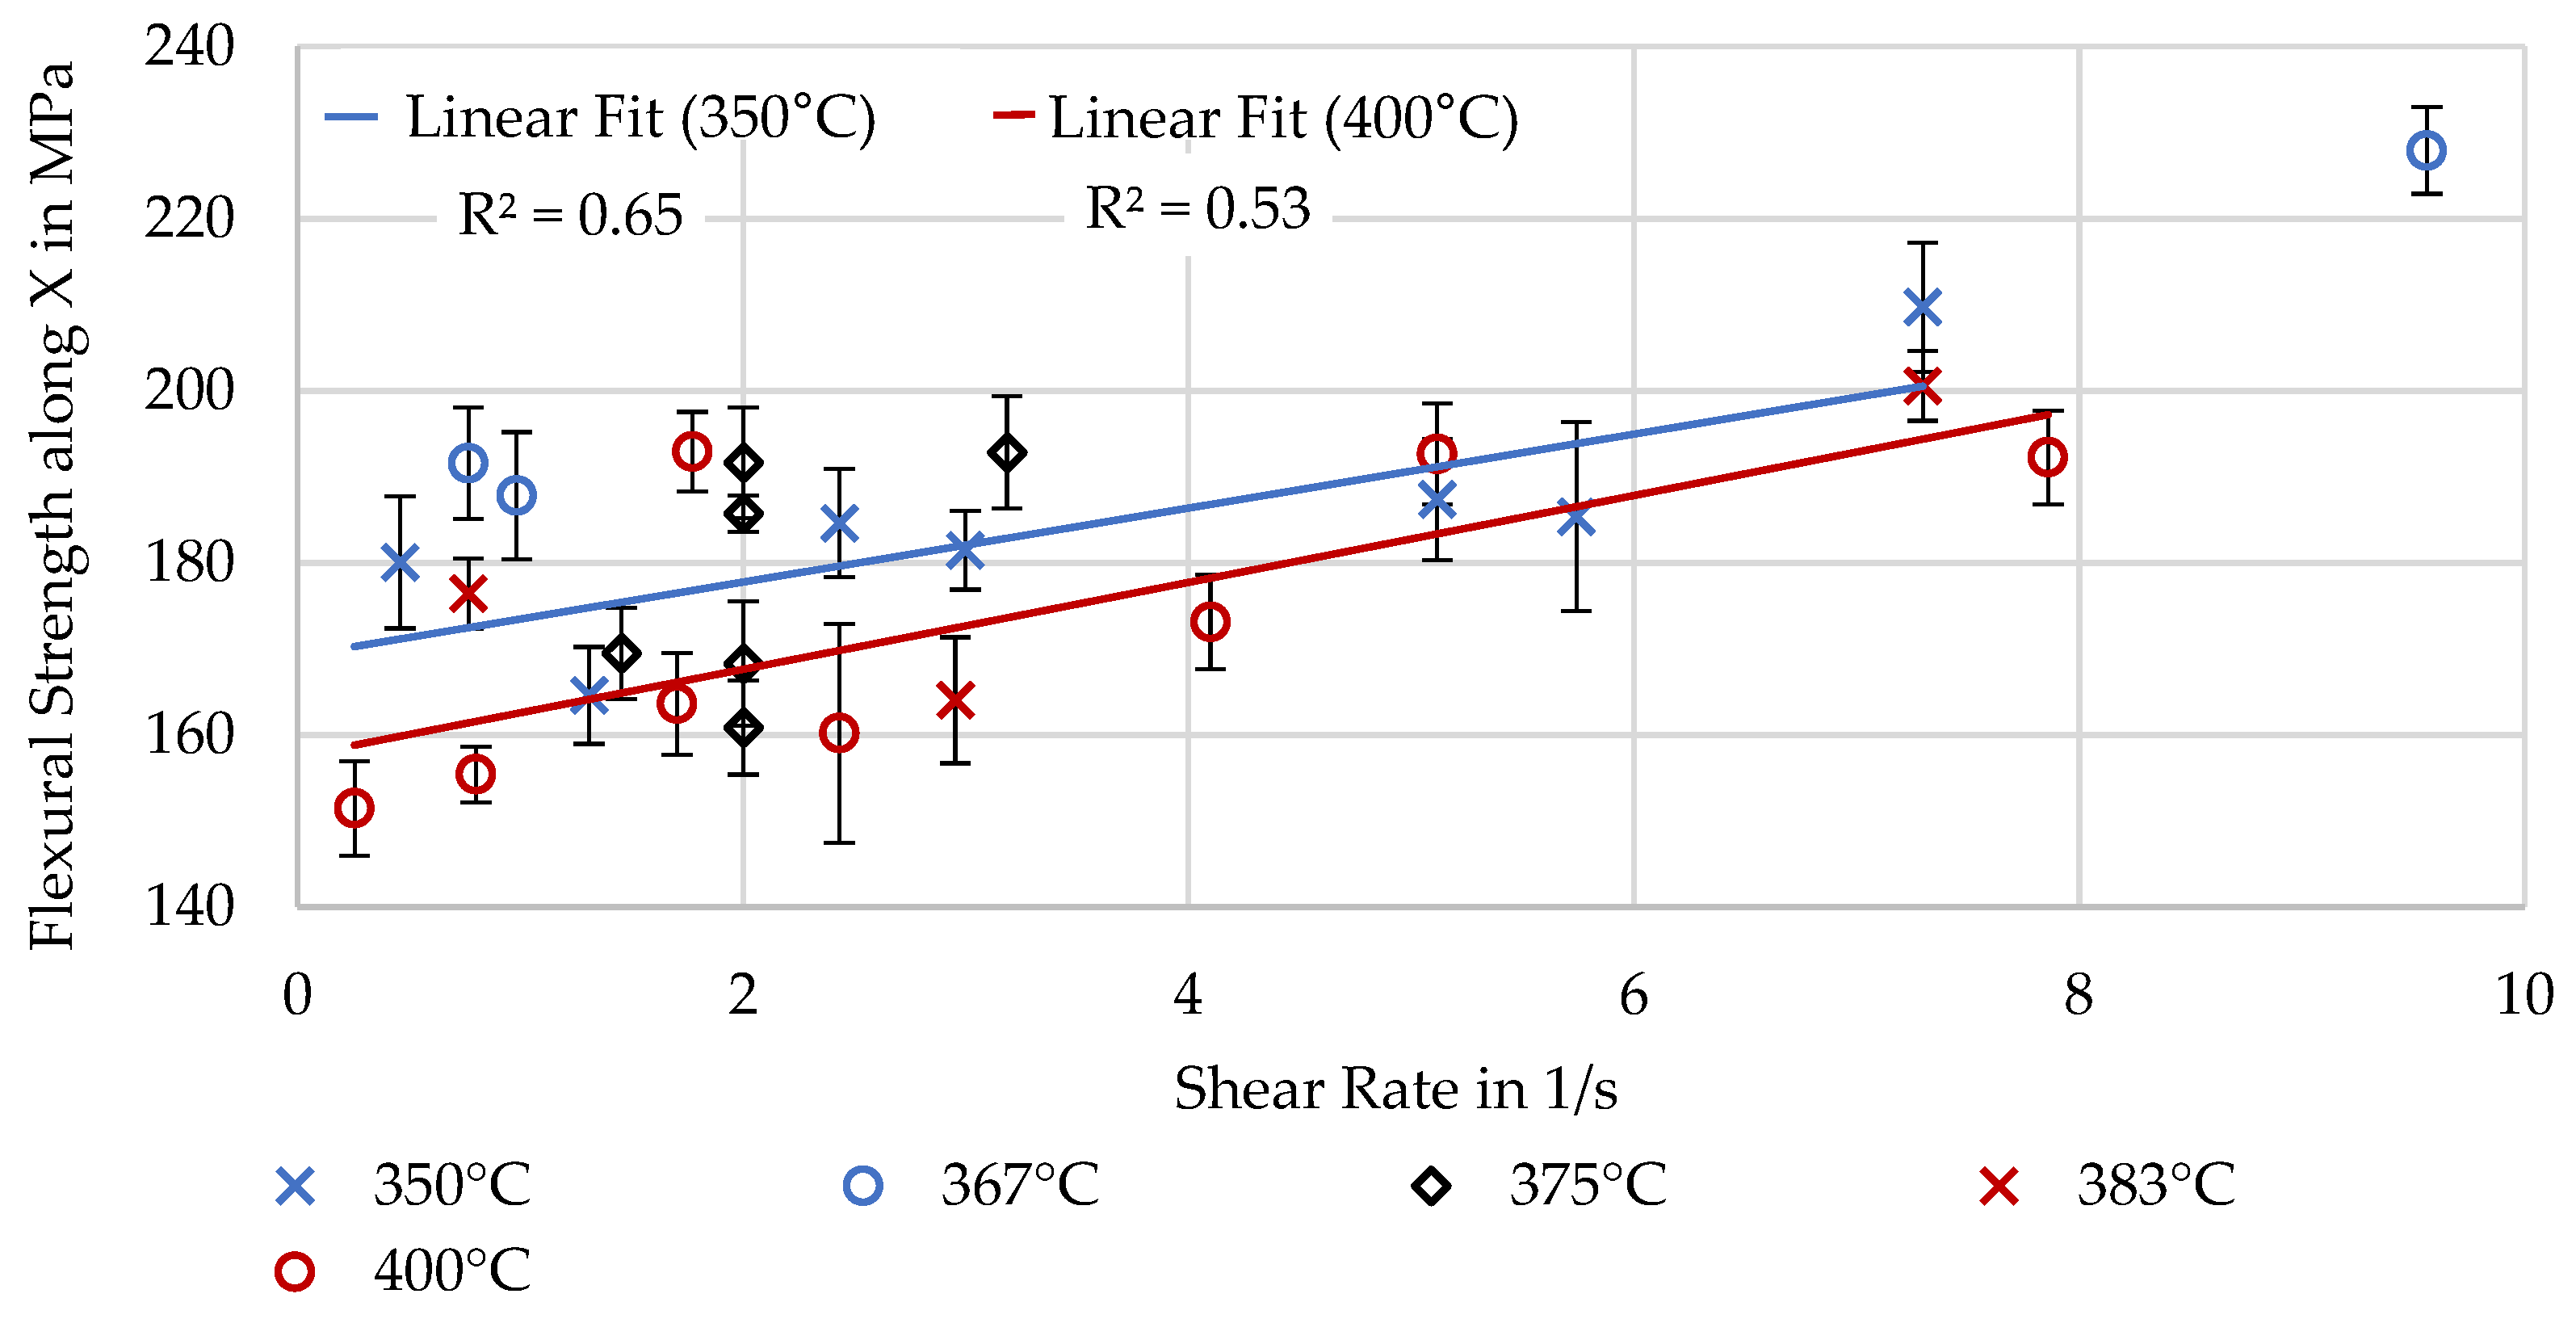
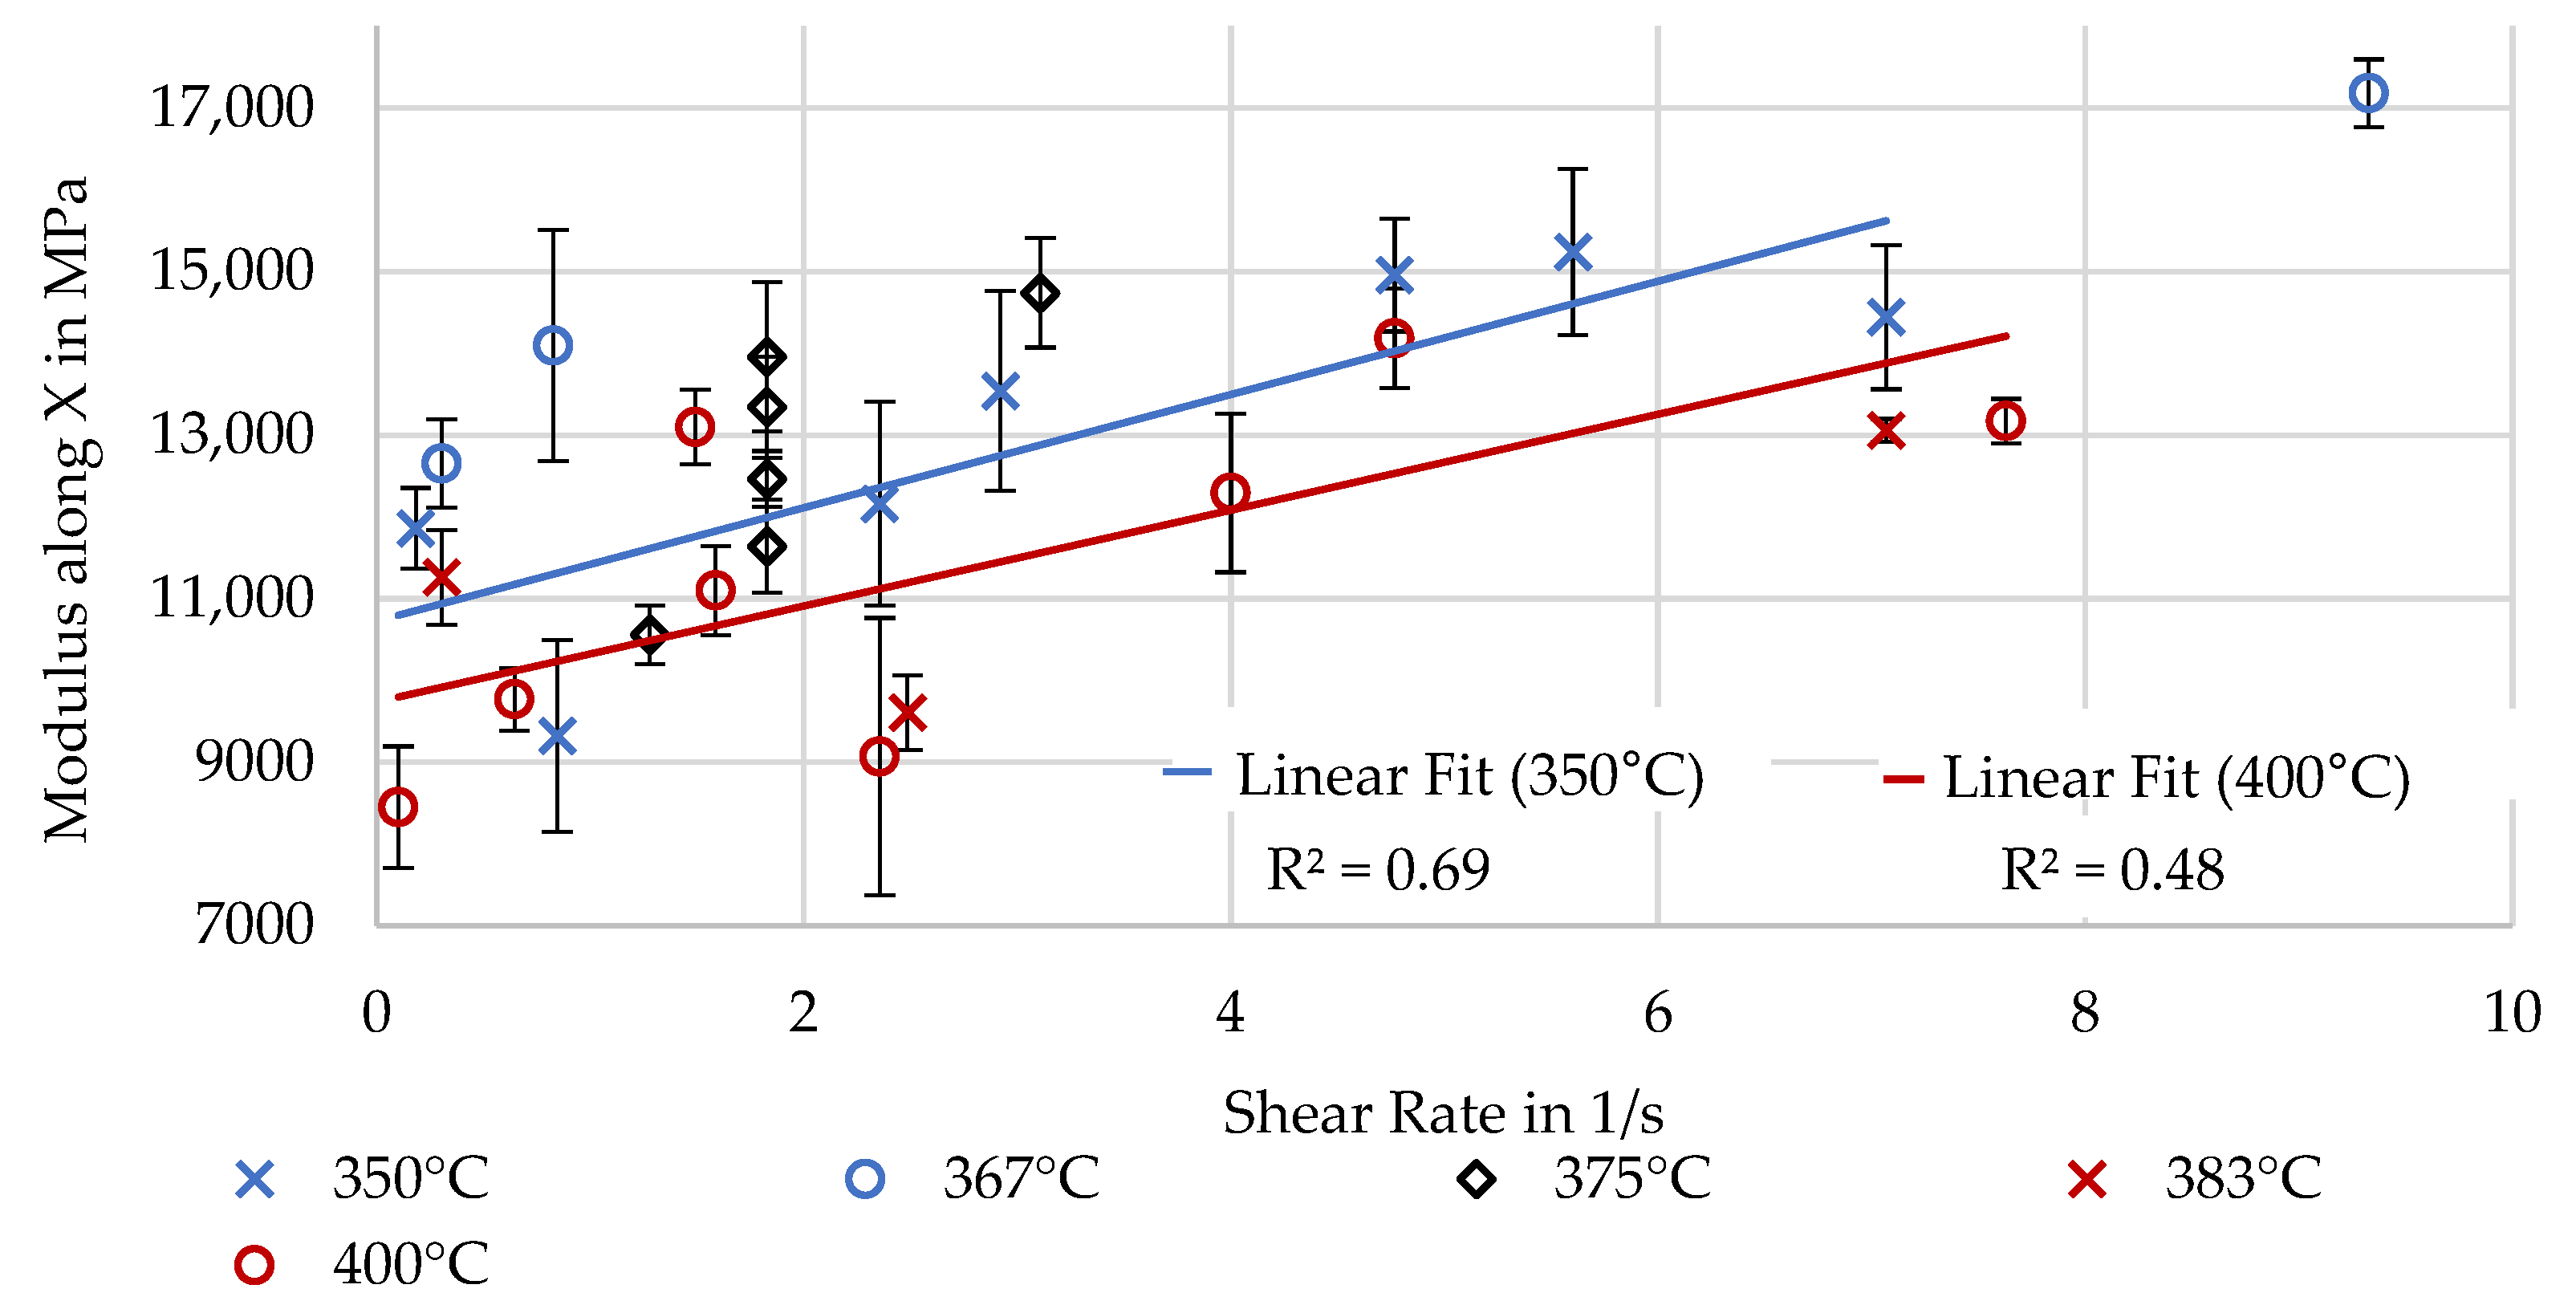
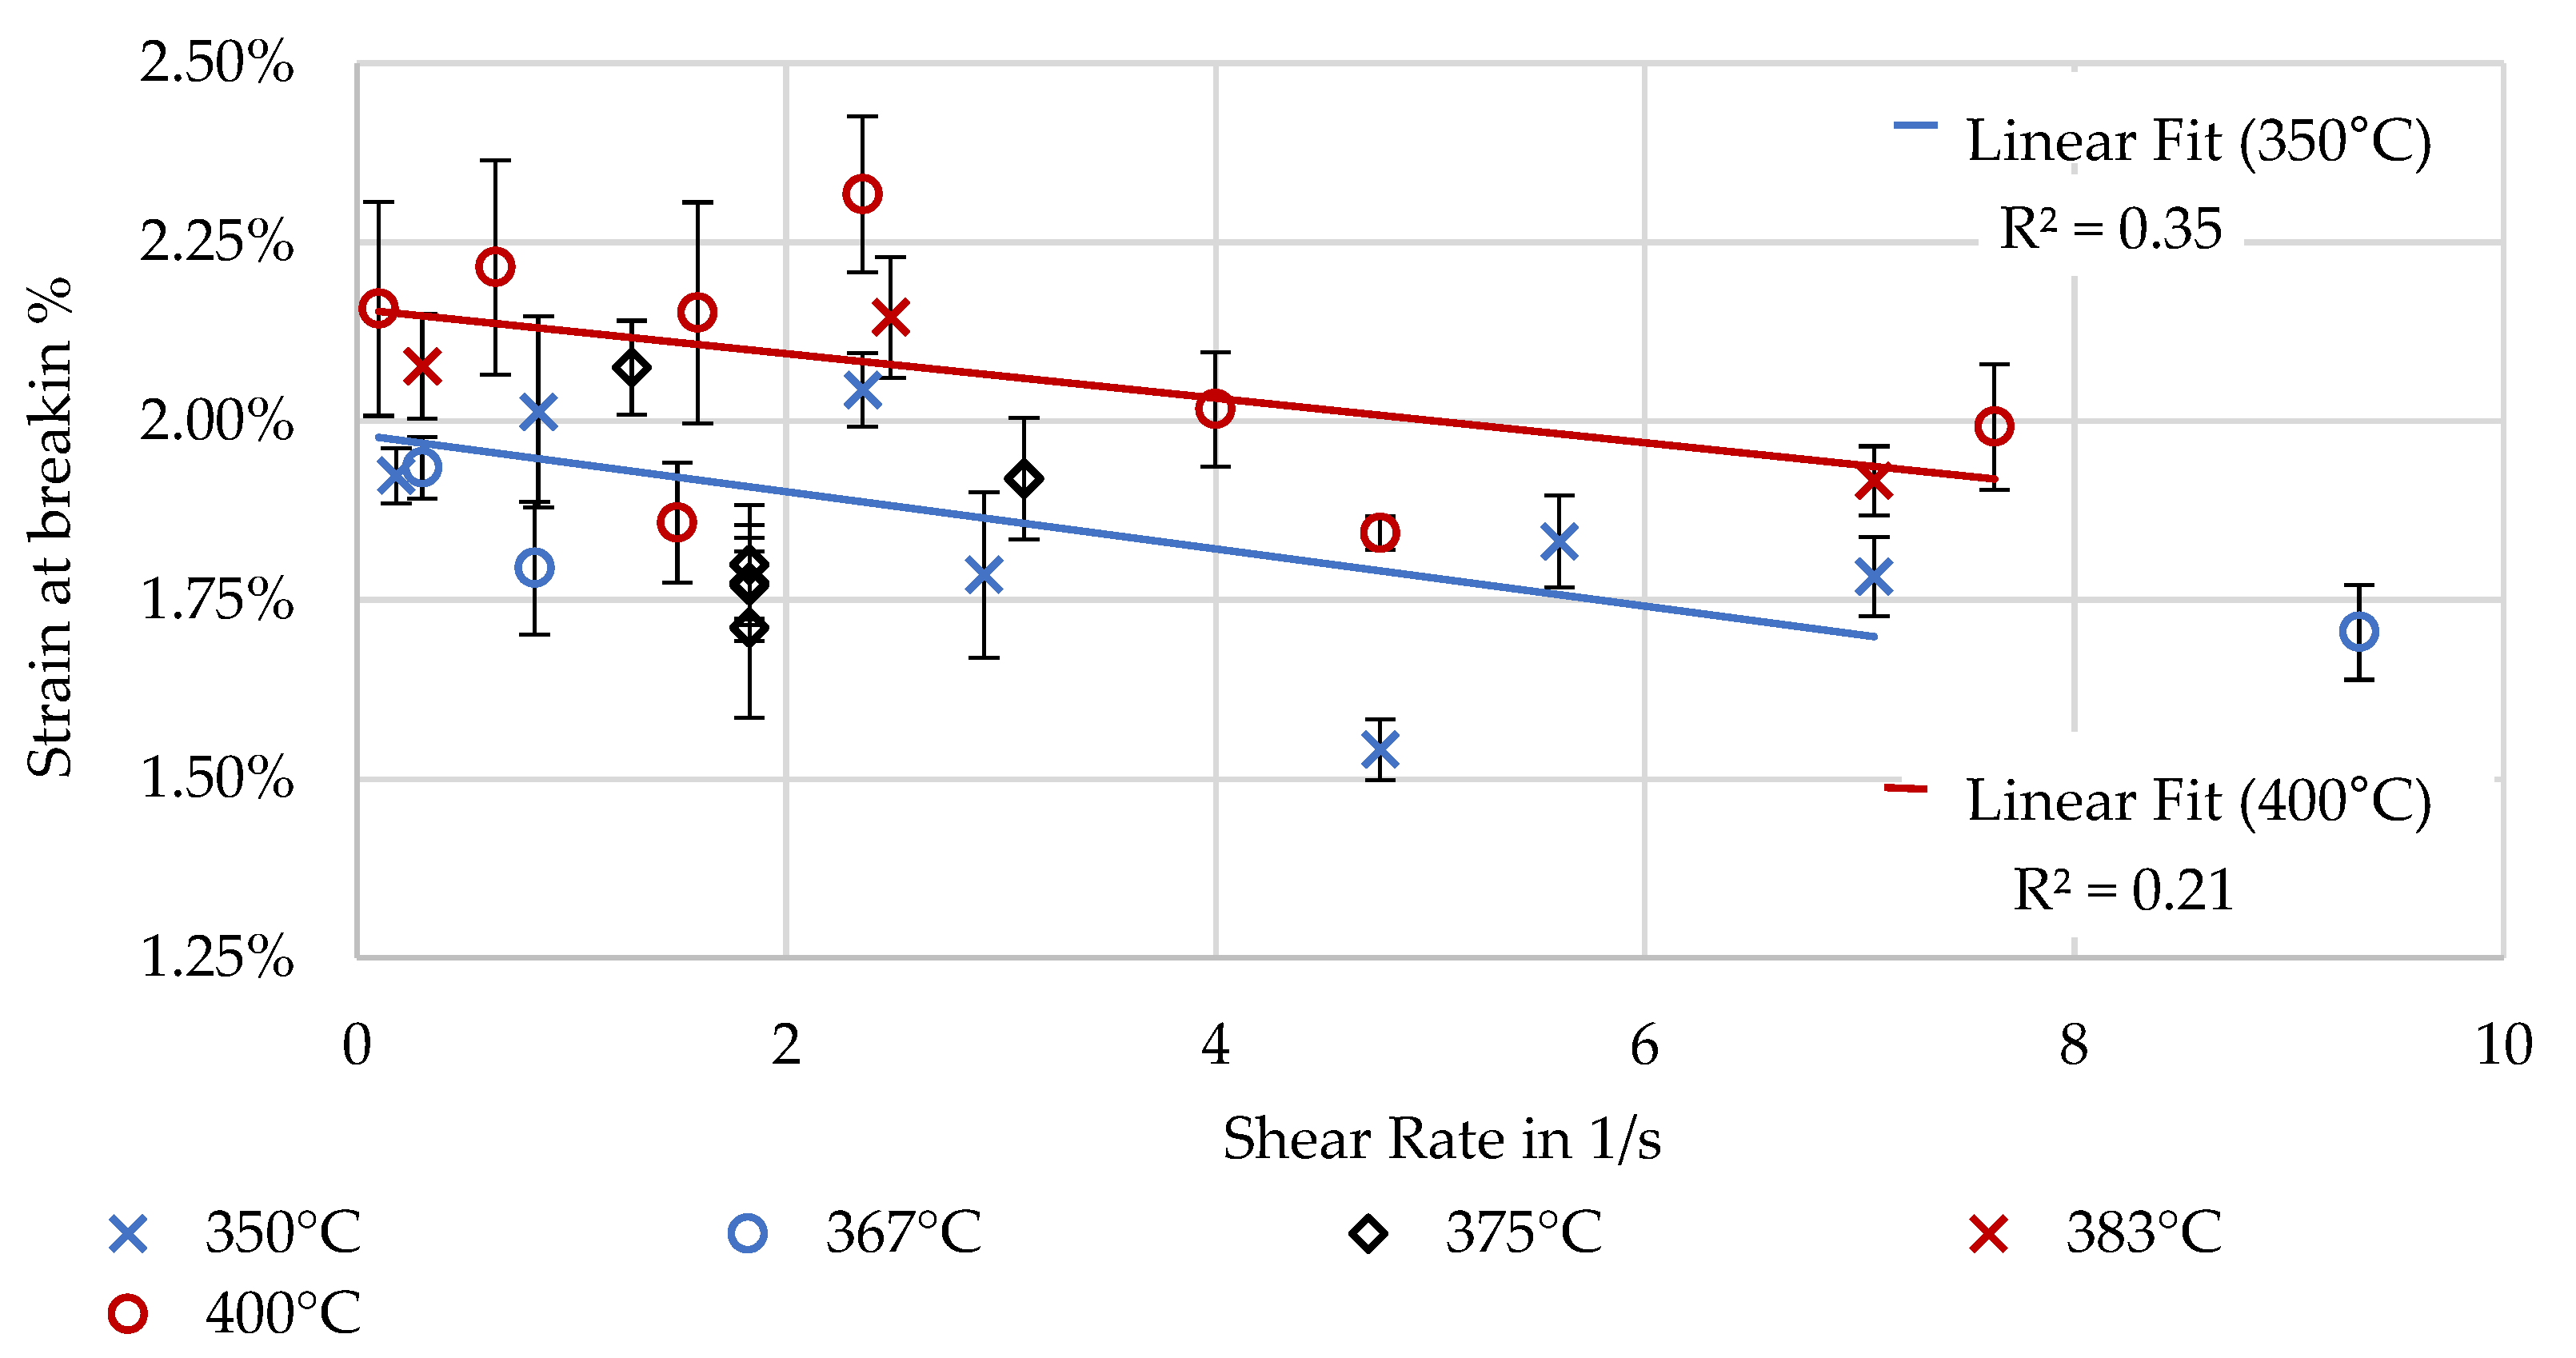
3.3.2. Fiber Alignment and Material Flow Dominated in X
3.4. Effects of Extrusion Parameters
4. Conclusions
Author Contributions
Funding
Institutional Review Board Statement
Data Availability Statement
Acknowledgments
Conflicts of Interest
Appendix A

| Set Factors | Calculated Metrics | ||||||
|---|---|---|---|---|---|---|---|
| Number | Temperature in °C | Extrusion Width in mm | Extrusion Height in mm | Layer Time in s | TCP Speed in mm/s | Shear Rate in 1/s | Enthalpy Deposition Rate in W |
| 1 | 350 | 12 | 2 | 40 | 27.05 | 7.298 | 260.30 |
| 2 | 400 | 12 | 2 | 40 | 27.05 | 7.298 | 301.58 |
| 3 | 400 | 12 | 4 | 40 | 27.05 | 0.767 | 578.87 |
| 4 | 350 | 12 | 2 | 120 | 9.02 | 2.433 | 86.67 |
| 5 | 400 | 12 | 2 | 120 | 9.02 | 2.433 | 99.79 |
| 6 | 350 | 12 | 4 | 120 | 9.02 | 0.256 | 166.59 |
| 7 | 400 | 12 | 4 | 120 | 9.02 | 0.256 | 192.17 |
| 8 | 350 | 8 | 2 | 67 | 16.43 | 5.742 | 103.87 |
| 9 | 350 | 8 | 4 | 93 | 11.73 | 1.266 | 142.12 |
| 10 | 350 | 8 | 3 | 40 | 27.37 | 5.117 | 253.65 |
| 11 | 350 | 8 | 3 | 120 | 9.12 | 1.705 | 83.87 |
| 12 | 350 | 12 | 4 | 67 | 16.25 | 0.461 | 301.84 |
| 13 | 350 | 9 | 2 | 120 | 9.10 | 2.998 | 65.25 |
| 14 | 350 | 11 | 4 | 40 | 27.13 | 1.309 | 464.80 |
| 15 | 400 | 8 | 2 | 93 | 11.73 | 4.099 | 85.49 |
| 16 | 400 | 8 | 4 | 67 | 16.43 | 1.774 | 225.31 |
| 17 | 400 | 8 | 3 | 40 | 27.37 | 5.117 | 289.09 |
| 18 | 400 | 8 | 3 | 120 | 9.12 | 1.705 | 96.91 |
| 19 | 400 | 11 | 2 | 40 | 27.13 | 7.861 | 274.31 |
| 20 | 400 | 9 | 4 | 120 | 9.10 | 0.801 | 141.90 |
| 21 | 366.7 | 8 | 2 | 40 | 27.37 | 9.561 | 181.54 |
| 22 | 383.3 | 8 | 2 | 120 | 9.12 | 3.185 | 63.45 |
| 23 | 383.3 | 8 | 4 | 40 | 27.37 | 2.953 | 360.03 |
| 24 | 366.7 | 8 | 4 | 120 | 9.12 | 0.984 | 114.01 |
| 25 | 366.7 | 12 | 4 | 40 | 27.05 | 0.767 | 528.51 |
| 26 | 375 | 12 | 3 | 80 | 13.53 | 1.454 | 207.82 |
| 27 | 375 | 10 | 3 | 80 | 13.60 | 2.002 | 171.48 |
| 28 | 375 | 10 | 3 | 80 | 13.60 | 2.002 | 171.30 |
| 29 | 375 | 10 | 3 | 80 | 13.60 | 2.002 | 170.91 |
| 30 | 375 | 10 | 3 | 80 | 13.60 | 2.002 | 170.58 |
| Responses Part 1 | ||||||||
|---|---|---|---|---|---|---|---|---|
| Number | Material Core Temperature at Deposition in °C | Material Core Temperature at Second Layer in °C | Cooling Rate (High): Topmost Layer in °C/min | Cooling Rate (Low): After Coverage with Additional Layers in °C/min | Layer Contact Temperature: Surface Just before Nozzle in °C | Fiber Misalignment in ° with Standard Dev. | Bending Strength along Extrusion Lines (Fiber-Dominated) in MPa with Standard Dev. | Bending Strength across Layers (Matrix-Dominated) in MPa with Standard Dev. |
| 1 | 275.60 | 240.00 | 60 | 13 | 214.20 | 17.30 ± 1.75 | 209.71 ± 7.52 | 80.60 ± 1.66 |
| 2 | 315.86 | 270.12 | 92 | 13 | 235.60 | 19.50 ± 1.61 | 200.57 ± 4.07 | 78.08± 1.41 |
| 3 | 357.32 | 311.10 | 67 | 18 | 292.50 | 28.43 ± 3.63 | 176.42 ± 4.06 | 79.03 ± 2.70 |
| 4 | 264.95 | 129.56 | 69 | −1 | 122.40 | 20.35 ± 5.71 | 184.63 ± 6.31 | 63.68 ± 2.84 |
| 5 | 289.64 | 142.84 | 77 | −2 | 136.50 | 22.33 ± 4.57 | 160.17 ± 12.70 | 55.82 ± 3.74 |
| 6 | 292.78 | 179.00 | 56 | 6 | 172.00 | 38.95 ± 5.57 | NA | NA |
| 7 | 349.14 | 198.38 | 73 | 6 | 185.50 | 37.70 ± 4.53 | 151.44 ± 5.53 | 64.88 ± 2.45 |
| 8 | 248.70 | 156.60 | 90 | 7 | 156.80 | 20.55 ± 4.86 | 185.38 ± 11.00 | 57.29 ± 3.03 |
| 9 | 260.38 | 171.33 | 61 | 11 | 158.60 | 27.70 ± 4.55 | NA | NA |
| 10 | 277.50 | 219.25 | 104 | 16 | 224.60 | 14.58 ± 0.62 | 187.37 ± 7.06 | 70.31 ± 4.41 |
| 11 | 266.70 | 128.48 | 70 | 3 | 125.20 | 13.03 ± 1.19 | NA | NA |
| 12 | 282.10 | 237.85 | 46 | 13 | 228.80 | 34.7 ± 4.79 | 180.03 ± 7.66 | 61.54 ± 4.57 |
| 13 | 252.99 | 111.97 | 73 | −2 | 105.10 | 16.75 ± 4.37 | 181.46 ± 4.58 | 39.74 ± 5.79 |
| 14 | 308.83 | 268.01 | 48 | 17 | 258.20 | 28.98 ± 4.03 | 164.59 ± 5.63 | 74.27 ± 1.14 |
| 15 | 325.98 | 139.81 | 123 | 2 | 136.50 | 20.40 ± 1.86 | 173.13 ± 5.52 | 31.68 ± 1.36 |
| 16 | 292.26 | 222.46 | 65 | 17 | 219.80 | 19.73 ± 6.03 | 192.92 ± 4.62 | 60.03 ± 3.22 |
| 17 | 343.44 | 272.37 | 105 | 22 | 249.30 | 17.50 ± 2.44 | 192.66 ± 5.89 | 66.06 ± 3.55 |
| 18 | 328.86 | 142.65 | 99 | 1 | 140.70 | 21.88 ± 3.51 | 163.62 ± 5.90 | 38.50 ± 4.03 |
| 19 | 314.73 | 262.62 | 95 | 14 | 230.10 | 21.85 ± 4.25 | 192.25 ± 5.45 | 70.06 ± 1.29 |
| 20 | 344.27 | 174.25 | 84 | 5 | 165.30 | 31.00 ± 11.67 | 155.40 ± 3.24 | 60.83 ± 1.63 |
| 21 | 276.93 | 220.79 | 94 | 16 | 199.70 | 14.48 ± 2.19 | 227.92 ± 5.04 | 71.45 ± 2.87 |
| 22 | 265.19 | 111.23 | 80 | −2 | 110.50 | 18.05 ± 2.78 | 192.85 ± 6.55 | 31.85 ± 6.74 |
| 23 | 307.53 | 270.98 | 82 | 21 | 253.80 | 18.07 ± 2.06 | 164.03 ± 7.32 | 73.54 ± 1.96 |
| 24 | 297.00 | 153.83 | 80 | 3 | 146.70 | 16.88 ± 2.33 | 187.80 ± 7.39 | 50.85 ± 1.94 |
| 25 | 302.90 | 280.78 | 44 | 18 | 269.70 | 35.25 ± 9.88 | 191.57 ± 6.48 | 82.75 ± 3.28 |
| 26 | 305.55 | 210.99 | 76 | 8 | 191.20 | 21.53 ± 8.01 | 169.49 ± 5.31 | 60.82 ± 1.13 |
| 27 | 277.01 | 196.72 | 67 | 10 | 183.30 | 36.33 ± 8.77 | 160.87 ± 5.48 | 36.25 ± 2.73 |
| 28 | 289.63 | 192.61 | 76 | 9 | 179.80 | 27.83 ± 6.94 | 168.29 ± 7.26 | 47.06 ± 3.43 |
| 29 | 292.92 | 198.71 | 74 | 10 | 183.20 | 26.45 ± 8.59 | 185.73 ± 2.10 | 57.01 ± 1.29 |
| 30 | 296.36 | 199.83 | 79 | 10 | 182.00 | 19.03 ± 8.49 | 191.63 ± 6.43 | 64.00 ± 2.31 |
| Responses Part 2 | ||||||||
|---|---|---|---|---|---|---|---|---|
| Number | Elastic Modulus along Extrusion Lines (Fiber-Dominated) in MPa with Standard Dev. | Elastic Modulus across Layers (Matrix-Dominated) in MPa with Standard Dev. | Strain at Break along Extrusion Lines (Fiber-Dominated) in % with Standard Dev. | Strain at Break across Layers (Matrix-Dominated) in % with Standard Dev. | Crystallization Onset (Temperature and Time) | Crystallization Peak (Temperature and Time) | Crystallization Enthalpy in J/g | Relative Crystallinity |
| 1 | 14,442.09 ± 882.07 | 3699.49 ± 128.40 | 1.78 ± 0.06 | 2.27 ± 0.06 | 232.36 °C/89.7 s | 219.82 °C/146.72 s | 15.79 | 89% |
| 2 | 13,056.70 ± 139.78 | 3030.32 ± 258.25 | 1.92 ± 0.05 | 2.90 ± 0.11 | 240.13 °C/137.26 s | 214.87 °C/246.4 s | 16.80 | 95% |
| 3 | 11,260.26 ± 580.24 | 3304.45 ± 116.92 | 2.08 ± 0.07 | 2.62 ± 0.08 | 242.03 °C/305.84 s | 220 °C/391.5 s | 12.84 | 73% |
| 4 | 12,162.61 ± 1246.39 | 2905.32 ± 257.26 | 2.04 ± 0.05 | 2.40 ± 0.08 | NA | NA | 1.92 | 11% |
| 5 | 9066.43 ± 1696.87 | 2502.00 ± 191.26 | 2.32 ± 0.11 | 2.62 ± 0.18 | NA | NA | 1.28 | 7% |
| 6 | NA | NA | NA | NA | NA | NA | 4.81 | 27% |
| 7 | 8449.26 ± 742.96 | 3039.19 ± 311.83 | 2.16 ± 0.15 | 2.24 ± 0.13 | 195.01 °C/128.846 s | 185.15 °C/199.04 s | 10.48 | 59% |
| 8 | 15,237.24 ± 1015.82 | 2735.67 ± 166.47 | 1.83 ± 0.06 | 2.47 ± 0.17 | NA | NA | 1.37 | 8% |
| 9 | NA | NA | NA | NA | 163.31 °C/216.3 s | 50.29 °C/284.04 s | 2.04 | 12% |
| 10 | 14,957.735 ± 690.65 | 2898.58 ± 110.57 | 1.54 ± 0.04 | 2.71 ± 0.20 | 231.95 °C/78.54 s | 217.92 °C/131.22 s | 17.07 | 97% |
| 11 | NA | NA | NA | NA | 219 °C/82.17 s | 124.09 °C/100.17 s | 2.41 | 14% |
| 12 | 11,860.29 ± 493.62 | 2858.21 ± 334.94 | 1.92 ± 0.04 | 1.82 ± 0.11 | 228.43 °C/111.04 s | 214.28 °C/174.98 s | 15.31 | 87% |
| 13 | 13,539.99 ± 1219.94 | 2054.35 ± 195.74 | 1.79 ± 0.12 | 2.06 ± 0.36 | NA | NA | 1.80 | 10% |
| 14 | 9321.80 ± 1171.16 | 2982.68 ± 167.64 | 2.01 ± 0.13 | 2.55 ± 0.11 | 243.21 °C/131.36 s | 225.57 °C/189.6 s | 14.86 | 84% |
| 15 | 12,292.56 ± 969.49 | 1864.83 ± 24.20 | 2.02 ± 0.08 | 2.34 ± 0.20 | NA | NA | 1.40 | 8% |
| 16 | 13,099.85 ± 458.59 | 2854.93 ± 287.18 | 1.86 ± 0.08 | 2.29 ± 0.14 | 214.05 °C/161.52 s | 198.14 °C/213 s | 8.44 | 48% |
| 17 | 14,182.86 ± 607.97 | 2632.01 ± 159.46 | 1.84 ± 0.02 | 2.73 ± 0.14 | 226.98 °C/160.54 s | 221.62 °C/217.26 s | 10.63 | 60% |
| 18 | 11,098.65 ± 543.68 | 1787.53 ± 116.11 | 2.15 ± 0.15 | 2.71 ± 0.32 | NA | NA | 1.53 | 9% |
| 19 | 13,170.27 ± 271.35 | 2896.77 ± 177.64 | 1.99 ± 0.09 | 2.46 ± 0.14 | 229.28 °C/137.44 s | 204.3 °C/233.7 s | 17.66 | 100% |
| 20 | 9767.92 ± 381.98 | 2904.11 ± 129.96 | 2.21 ± 0.15 | 2.40 ± 0.11 | NA | NA | 1.66 | 9% |
| 21 | 17,182.23 ± 412.13 | 3271.46 ± 176.69 | 1.70 ± 0.07 | 2.34 ± 0.18 | 208.51 °C/97.08 s | 194.57 °C/147.66 s | 11.71 | 66% |
| 22 | 14,738.96 ± 668.09 | 1786.57 ± 78.67 | 1.92 ± 0.09 | 2.33 ± 0.77 | NA | NA | 1.49 | 8% |
| 23 | 9605.70 ± 456.95 | 3679.72 ± 152.73 | 2.14 ± 0.08 | 2.31 ± 0.09 | 227 °C/126.87 s | 199.80 °C/206.04 s | 10.42 | 59% |
| 24 | 14,095.51 ± 1410.61 | 2838.41 ± 110.80 | 1.79 ± 0.09 | 2.21 ± 0.12 | NA | NA | 1.59 | 9% |
| 25 | 12,653.63 ± 537.95 | 3781.61 ± 245.08 | 1.93 ± 0.04 | 2.46 ± 0.09 | 241.25 °C/305.34 s | 209.94 °C/399.58 s | 15.08 | 85% |
| 26 | 10,558.26 ± 359.14 | 2376.69 ± 60.07 | 2.07 ± 0.07 | 2.08 ± 0.08 | 201.84 °C/129.6 s | 189.60 °C/208.77 s | 15.58 | 88% |
| 27 | 11,640.79 ± 566.11 | 1537.75 ± 151.19 | 1.80 ± 0.08 | 2.33 ± 0.31 | 180.61 °C/192.3 s | 90.19 °C/233.04 s | 3.92 | 22% |
| 28 | 12,463.96 ± 340.84 | 1950.33 ± 234.21 | 1.71 ± 0.13 | 2.10 ± 0.14 | NA | NA | 2.66 | 15% |
| 29 | 13,342.17 ± 619.77 | 2475.26 ± 130.41 | 1.77 ± 0.08 | 1.98 ± 0.10 | 192.54 °C/189.87 s | 183.09 °C/235.02 s | 3.82 | 22% |
| 30 | 13,958.45 ± 915.31 | 2430.76 ± 117.29 | 1.77 ± 0.05 | 2.23 ± 0.08 | NA | NA | 0.00 | 0% |
References
- Saleh Alghamdi, S.; John, S.; Roy Choudhury, N.; Dutta, N.K. Additive Manufacturing of Polymer Materials: Progress, Promise and Challenges. Polymers 2021, 13, 753. [Google Scholar] [CrossRef] [PubMed]
- Sarabia-Vallejos, M.A.; Rodríguez-Umanzor, F.E.; González-Henríquez, C.M.; Rodríguez-Hernández, J. Innovation in Additive Manufacturing Using Polymers: A Survey on the Technological and Material Developments. Polymers 2022, 14, 1351. [Google Scholar] [CrossRef]
- Justino Netto, J.M.; Idogava, H.T.; Frezzatto Santos, L.E.; Silveira, Z.d.C.; Romio, P.; Alves, J.L. Screw-assisted 3D printing with granulated materials: A systematic review. Int. J. Adv. Manuf. Technol. 2021, 115, 2711–2727. [Google Scholar] [CrossRef]
- Barocio, E.; Brenken, B.; Favaloro, A.; Bogdanor, M.; Pipes, R.B. Extrusion deposition additive manufacturing with fiber-reinforced thermoplastic polymers. In Structure and Properties of Additive Manufactured Polymer Components; Elsevier: Amsterdam, The Netherlands, 2020; pp. 191–219. ISBN 9780128195352. [Google Scholar]
- Bouzaglou, O.; Golan, O.; Lachman, N. Process Design and Parameters Interaction in Material Extrusion 3D Printing: A Review. Polymers 2023, 15, 2280. [Google Scholar] [CrossRef] [PubMed]
- Nowka, M.; Hilbig, K.; Schulze, L.; Jung, E.; Vietor, T. Influence of Process Parameters in Material Extrusion on Product Properties Using the Example of the Electrical Resistivity of Conductive Polymer Composites. Polymers 2023, 15, 4452. [Google Scholar] [CrossRef] [PubMed]
- Sharafi, S.; Santare, M.H.; Gerdes, J.; Advani, S.G. Extrusion-Based Additively Manufactured PAEK and PAEK/CF Polymer Composites Performance: Role of Process Parameters on Strength, Toughness and Deflection at Failure. J. Compos. Sci. 2023, 7, 157. [Google Scholar] [CrossRef]
- Feuchtgruber, M.; Holmes, J.; Sommacal, S.; Strobel, M.; Gehringer, F.; Consul, P.; Bublitz, D.; Weghorst, J.; Thomson, R.; Strachauer, F.; et al. Using carbon fiber tape to tailor the coefficient of thermal expansion in 3D-Printed composite tooling. J. Thermoplast. Compos. Mater. 2024. [Google Scholar] [CrossRef]
- Yi, N.; Davies, R.; Chaplin, A.; McCutchion, P.; Ghita, O. Slow and fast crystallising poly aryl ether ketones (PAEKs) in 3D printing: Crystallisation kinetics, morphology, and mechanical properties. Addit. Manuf. 2021, 39, 101843. [Google Scholar] [CrossRef]
- Shang, Y.; Xu, Q.; Jiang, B.; Yang, Y.; Liu, X.; Jiang, Z.; Yu, C.; Li, X.; Zhang, H. Slowing crystallization to enhance interlayer strength of 3D printed poly (ether ether ketone) parts by molecular design. Addit. Manuf. 2022, 59, 103104. [Google Scholar] [CrossRef]
- Santiago, C.C.; Yelamanchi, B.; La Diosdado De Peña, J.A.; Lamb, J.; Roguski, K.; Turzyński, F.; Faruqui, R.; Choo, K.; Du Plessis, A.; Sillani, F.; et al. Thermoplastic Extrusion Additive Manufacturing of High-Performance Carbon Fiber PEEK Lattices. Crystals 2021, 11, 1453. [Google Scholar] [CrossRef]
- Liaw, C.-Y.; Tolbert, J.W.; Chow, L.W.; Guvendiren, M. Interlayer bonding strength of 3D printed PEEK specimens. Soft Matter 2021, 17, 4775–4789. [Google Scholar] [CrossRef]
- Yi, N.; Davies, R.; McBean, M.; Chaplin, A.; Ghita, O. Mobile amorphous fraction in polyaryletherketones and its influence on interlayer bonding in material extrusion. In Proceedings of the 38th International Conference of the Polymer Processing Society (PPS-38), St. Gallen, Switzerland, 22–26 May 2023; AIP Publishing: Melville, NY, USA, 2024; p. 150002. [Google Scholar]
- Dou, H.; Cheng, Y.; Ye, W.; Zhang, D.; Li, J.; Miao, Z.; Rudykh, S. Effect of Process Parameters on Tensile Mechanical Properties of 3D Printing Continuous Carbon Fiber-Reinforced PLA Composites. Materials 2020, 13, 3850. [Google Scholar] [CrossRef] [PubMed]
- Consul, P.; Chaplin, A.; Tagscherer, N.; Zaremba, S.; Drechsler, K. Interlaminar strength in large-scale additive manufacturing of slow crystallizing polyaryletherketone carbon composites. Polym. Int. 2020, 70, 1099–1108. [Google Scholar] [CrossRef]
- Davies, R.; Yi, N.; McCutchion, P.; Ghita, O. Mechanical property variance amongst vertical fused filament fabricated specimens via four different printing methods. Polym. Int. 2021, 70, 1073–1079. [Google Scholar] [CrossRef]
- Consul, P.; Beuerlein, K.-U.; Luzha, G.; Drechsler, K. Effect of Extrusion Parameters on Short Fiber Alignment in Fused Filament Fabrication. Polymers 2021, 13, 2443. [Google Scholar] [CrossRef]
- Androsch, R.; Schick, C.; Di Lorenzo, M.L. Kinetics of Nucleation and Growth of Crystals of Poly(l-lactic acid). In Synthesis, Structure and Properties of Poly(lactic acid); Advances in Polymer Science; Springer: Cham, Switzerland, 2017. [Google Scholar] [CrossRef]
- Pibulchinda, P.; Barocio, E.; Favaloro, A.J.; Pipes, R.B. Influence of printing conditions on the extrudate shape and fiber orientation in extrusion deposition additive manufacturing. Compos. Part B Eng. 2023, 261, 110793. [Google Scholar] [CrossRef]
- Matschinski, A.; Ziegler, P.; Abstreiter, T.; Wolf, T.; Drechsler, K. Fiber Formation of Printed Carbon Fiber/Poly (Ether Ether Ketone) with Different Nozzle Shapes. Polym. Int. 2021, 70, 1109–1117. [Google Scholar] [CrossRef]
- Huang, C.-T.; Chen, X.-W.; Fu, W.-W. Investigation on the Fiber Orientation Distributions and Their Influence on the Mechanical Property of the Co-Injection Molding Products. Polymers 2019, 12, 24. [Google Scholar] [CrossRef] [PubMed]
- Jeffery, G.B. The motion of ellipsoidal particles immersed in a viscous fluid. Proc. R. Soc. Lond. A 1922, 102, 161–179. [Google Scholar] [CrossRef]
- Heller, B.P.; Smith, D.E.; Jack, D.A. Planar deposition flow modeling of fiber filled composites in large area additive manufacturing. Addit. Manuf. 2019, 25, 227–238. [Google Scholar] [CrossRef]
- Heller, B.P.; Smith, D.E.; Jack, D.A. Effects of extrudate swell and nozzle geometry on fiber orientation in Fused Filament Fabrication nozzle flow. Addit. Manuf. 2016, 12, 252–264. [Google Scholar] [CrossRef]
- Wang, Z.; Smith, D.E. Finite element modelling of fully-coupled flow/fiber-orientation effects in polymer composite deposition additive manufacturing nozzle-extrudate flow. Compos. Part B Eng. 2021, 219, 108811. [Google Scholar] [CrossRef]
- Wang, Z.; Smith, D.E. Numerical analysis of screw swirling effects on fiber orientation in large area additive manufacturing polymer composite deposition. Compos. Part B Eng. 2019, 177, 107284. [Google Scholar] [CrossRef]
- Wang, Z.; Smith, D.E. A Fully Coupled Simulation of Planar Deposition Flow and Fiber Orientation in Polymer Composites Additive Manufacturing. Materials 2021, 14, 2596. [Google Scholar] [CrossRef] [PubMed]
- Wang, Z. A numerical study on the predicted fiber orientation of large area extrusion deposition additive manufactured composites. Polym. Compos. 2022, 43, 6862–6876. [Google Scholar] [CrossRef]
- Behdani, B.; Senter, M.; Mason, L.; Leu, M.; Park, J. Numerical Study on the Temperature-Dependent Viscosity Effect on the Strand Shape in Extrusion-Based Additive Manufacturing. J. Manuf. Mater. Process. 2020, 4, 46. [Google Scholar] [CrossRef]
- Wang, Y.; Beard, J.D.; Evans, K.E.; Ghita, O. Unusual crystalline morphology of Poly Aryl Ether Ketones (PAEKs). RSC Adv. 2016, 6, 3198–3209. [Google Scholar] [CrossRef]
- Wang, Y.; Chen, B.; Evans, K.E.; Ghita, O. Novel fibre-like crystals in thin films of Poly Ether Ether Ketone (PEEK). Mater. Lett. 2016, 184, 112–118. [Google Scholar] [CrossRef]
- Comelli, C.A.; Yi, N.; Davies, R.; van der Pol, H.; Ghita, O. Material extrusion thermal model mapped across polyetheretherketone isothermal and continuous cooling transformation charts. Addit. Manuf. 2022, 59, 103129. [Google Scholar] [CrossRef]
- Ma, X.; Wen, L.; Wang, S.; Xiao, J.; Li, W.; Hou, X. Inherent relationship between process parameters, crystallization and mechanical properties of continuous carbon fiber reinforced PEEK composites. Def. Technol. 2023, 24, 269–284. [Google Scholar] [CrossRef]
- Spoerk, M.; Savandaiah, C.; Arbeiter, F.; Traxler, G.; Cardon, L.; Holzer, C.; Sapkota, J. Anisotropic properties of oriented short carbon fibre filled polypropylene parts fabricated by extrusion-based additive manufacturing. Compos. Part A Appl. Sci. Manuf. 2018, 113, 95–104. [Google Scholar] [CrossRef]
- Yang, D.; Zhang, H.; Wu, J.; McCarthy, E.D. Fibre flow and void formation in 3D printing of short-fibre reinforced thermoplastic composites: An experimental benchmark exercise. Addit. Manuf. 2021, 37, 101686. [Google Scholar] [CrossRef]
- Kim, E.G.; Park, J.K.; Jo, S.H. A study on fiber orientation during the injection molding of fiber-reinforced polymeric composites. J. Mater. Process. Technol. 2001, 111, 225–232. [Google Scholar] [CrossRef]
- Tseng, H.-C.; Chang, R.-Y.; Hsu, C.-H. Improved fiber orientation predictions for injection molded fiber composites. Compos. Part A Appl. Sci. Manuf. 2017, 99, 65–75. [Google Scholar] [CrossRef]
- Coogan, T.J.; Kazmer, D.O. Prediction of interlayer strength in material extrusion additive manufacturing. Addit. Manuf. 2020, 35, 101368. [Google Scholar] [CrossRef]
- Tagscherer, N.; Osswald, T.A.; Drechsler, K. Targeted Temperature Manipulation and Analysis of the Influence on Mechanical Properties in Large-Scale Extrusion Additive Manufacturing. Appl. Sci. 2022, 12, 2998. [Google Scholar] [CrossRef]
- Wu, W.; Geng, P.; Li, G.; Zhao, D.; Zhang, H.; Zhao, J. Influence of Layer Thickness and Raster Angle on the Mechanical Properties of 3D-Printed PEEK and a Comparative Mechanical Study between PEEK and ABS. Materials 2015, 8, 5834–5846. [Google Scholar] [CrossRef]
- Pastorek, M.; Kovalcik, A. Effects of thermal annealing as polymer processing step on poly(lactic acid). Mater. Manuf. Process. 2018, 33, 1674–1680. [Google Scholar] [CrossRef]
- Yeh, G.; Hosemann, R.; Loboda-Čačković, J.; Čačković, H. Annealing effects of polymers and their underlying molecular mechanisms. Polymer 1976, 17, 309–318. [Google Scholar] [CrossRef]
- Gao, G.; Xu, F.; Xu, J.; Tang, G.; Liu, Z. A Survey of the Influence of Process Parameters on Mechanical Properties of Fused Deposition Modeling Parts. Micromachines 2022, 13, 553. [Google Scholar] [CrossRef]

| Response | Measurement Method | Unit |
|---|---|---|
| Material core temperature at deposition (Temperature the material is quench-cooled to) | Thermocouple overprinted | °C |
| Material core temperature at second layer (Target temperature for fast cooling in DSC cycles) | Thermocouple overprinted | °C |
| Cooling rate (high): Topmost layer | Thermocouple overprinted | K/min |
| Cooling rate (low): After coverage with additional layers | Thermocouple overprinted | K/min |
| Layer contact temperature: surface just before nozzle | IR Camera | °C |
| Fiber misalignment | Image analysis on cross-section micrographs in XY plane | Standard deviation of orientation distribution in ° |
| Bending strength along extrusion lines (fiber-dominated) | 3-point bending | MPa |
| Bending strength across layers (matrix-dominated) | 3-point bending | MPa |
| Elastic modulus along extrusion lines (fiber-dominated) | 3-point bending | MPa |
| Elastic modulus across layers (matrix-dominated) | 3-point bending | MPa |
| Strain at break along extrusion lines (fiber-dominated) | 3-point bending | % |
| Strain at break across layers (matrix-dominated) | 3-point bending | % |
| Crystallization onset (temperature and time) | DSC of feedstock | °C/s |
| Crystallization peak (temperature and time) | DSC of feedstock | °C/s |
| Crystallization enthalpy | DSC of feedstock | J/g |
| Relative crystallinity | DSC of feedstock | % |
| Parameter | Lower Limit | Upper Limit |
|---|---|---|
| Line width | 8 mm (100% of nozzle diameter) | 12 mm (150% of nozzle diameter) |
| Layer height | 2 mm | 4 mm |
| Extrusion temperature | 350 °C | 400 °C |
| Layer time | 40 s | 120 s |
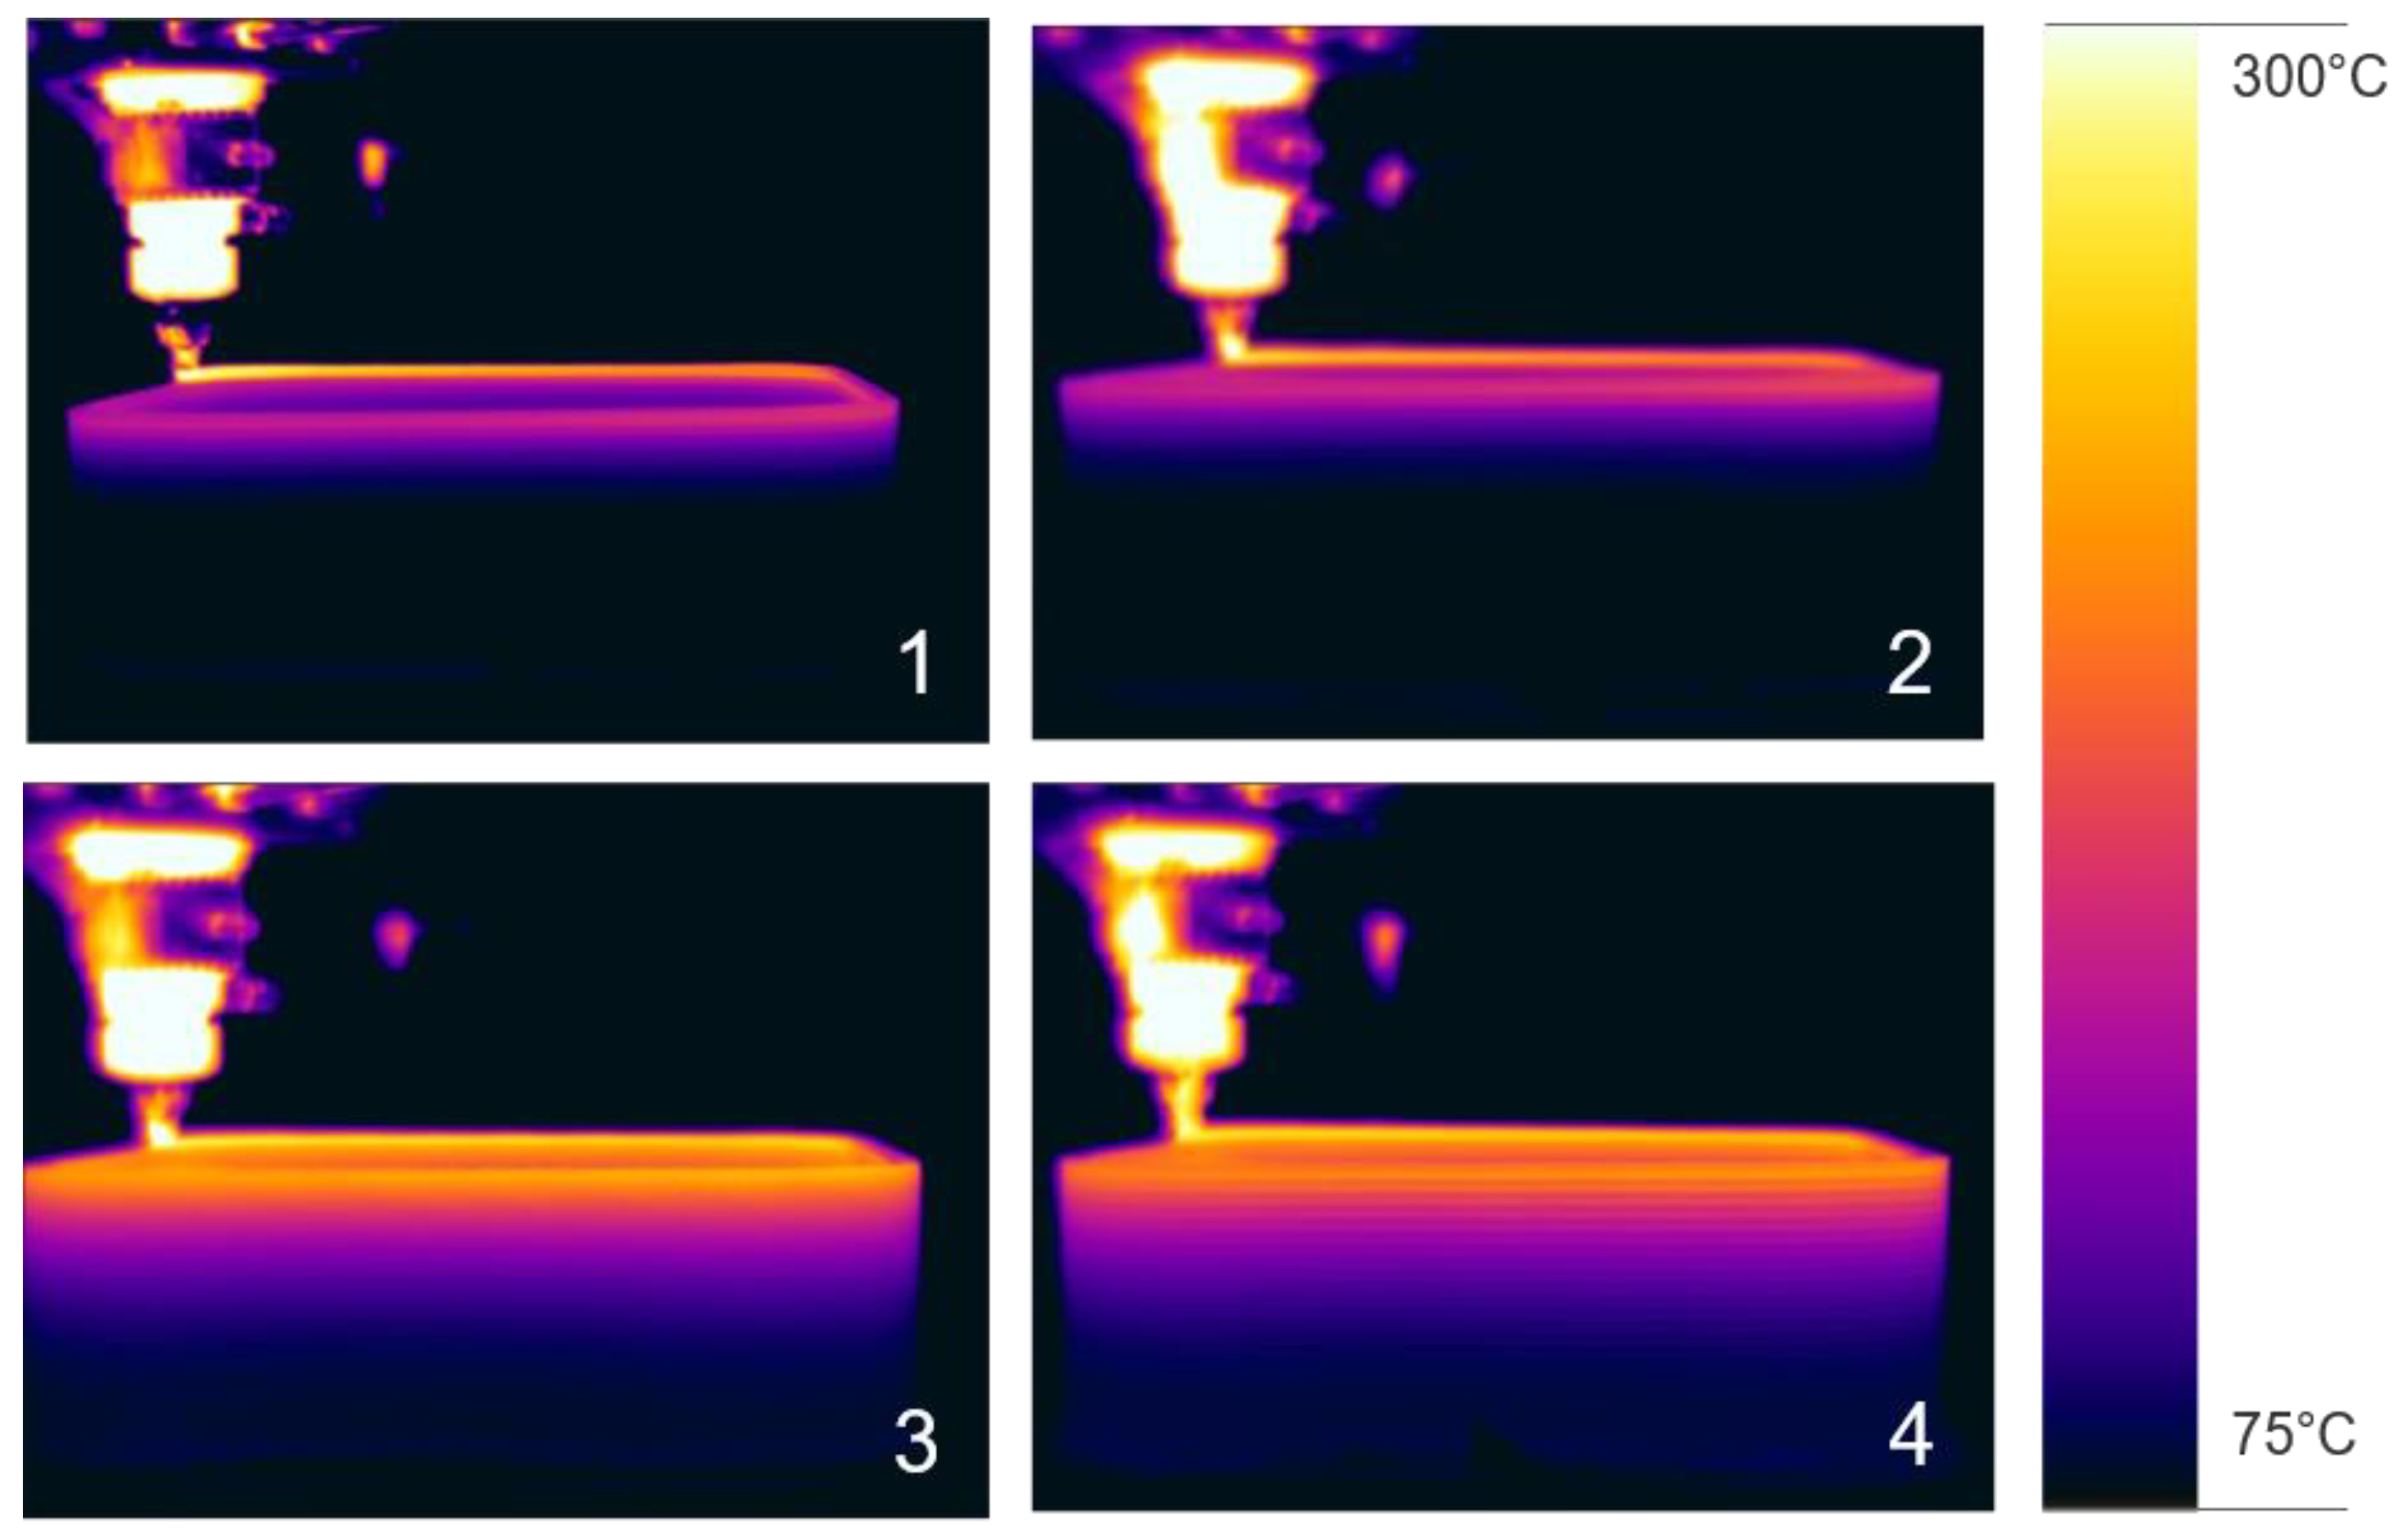
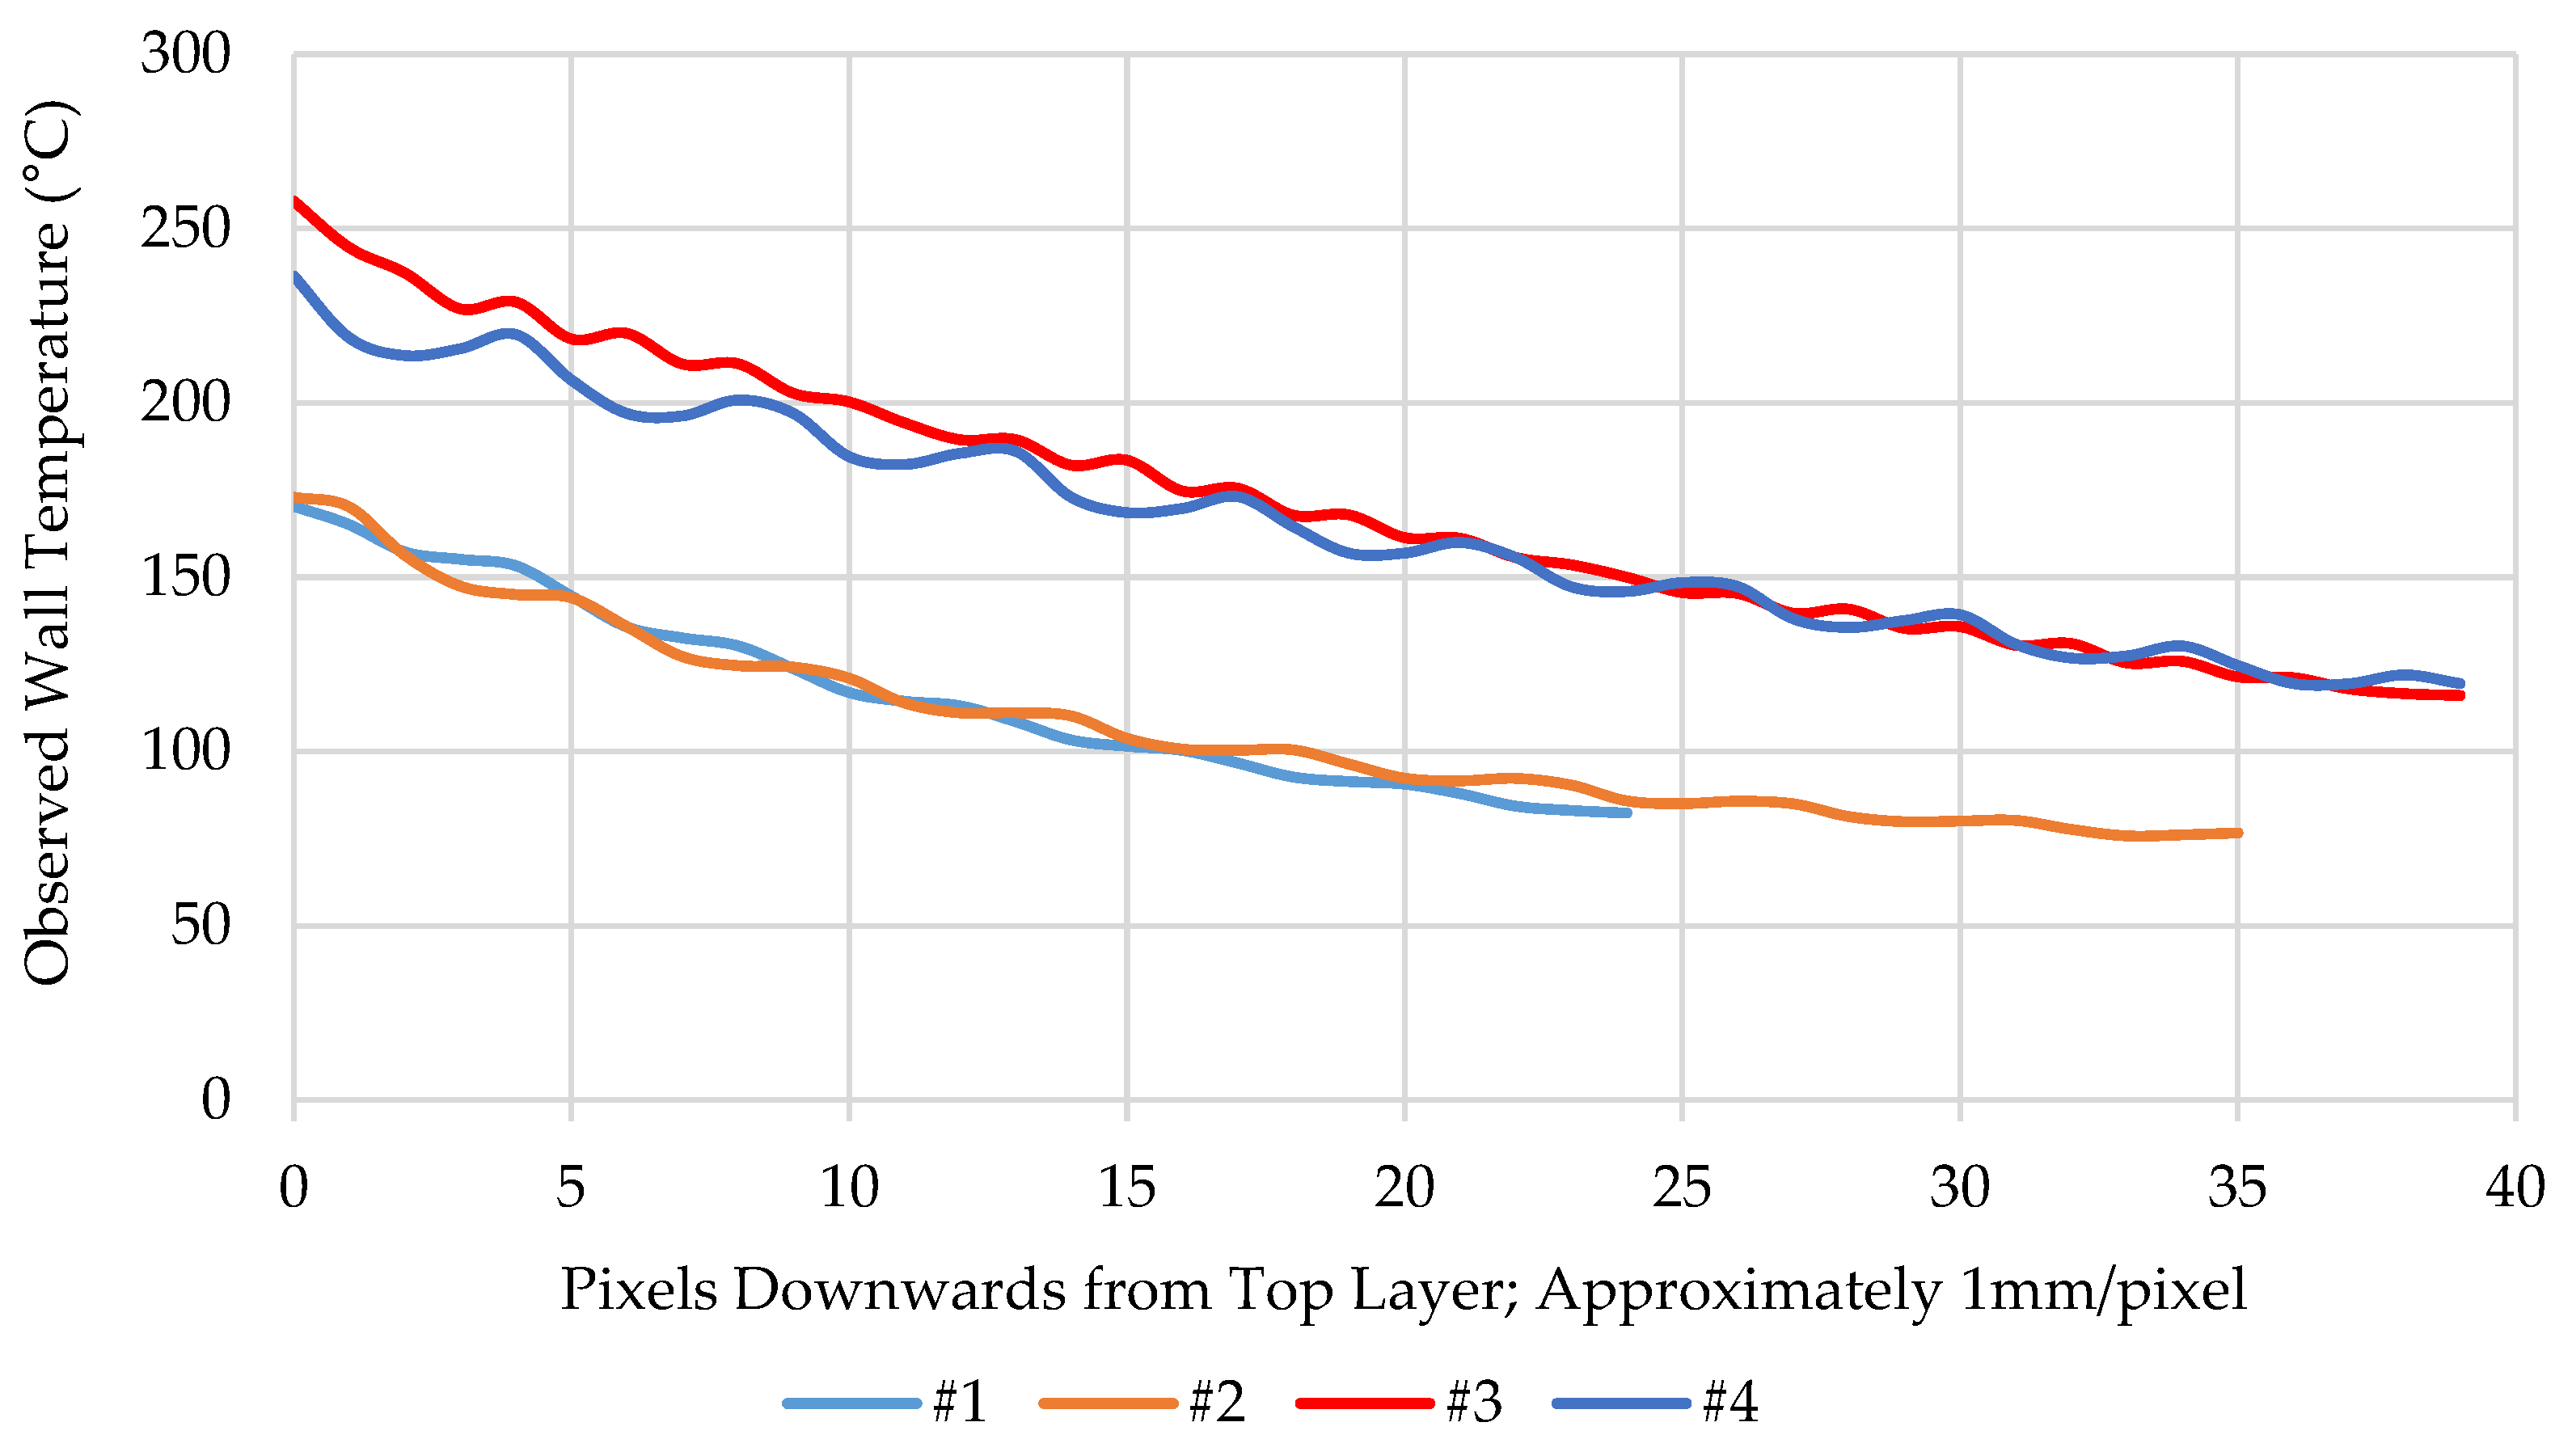
| Number in Figure 6 | Extrusion Temperature in °C | Extrusion Width in mm | Layer Height in mm | Layer Time in s | Enthalpy Deposition Rate in W | Surface Temperature in °C |
|---|---|---|---|---|---|---|
| 1 | 350 | 8 | 4 | 93 | 142.1 | 170.3 |
| 2 | 400 | 9 | 4 | 120 | 141.9 | 172 |
| 3 | 400 | 12 | 2 | 40 | 301.6 | 257.7 |
| 4 | 350 | 12 | 4 | 67 | 301.8 | 236.9 |
Disclaimer/Publisher’s Note: The statements, opinions and data contained in all publications are solely those of the individual author(s) and contributor(s) and not of MDPI and/or the editor(s). MDPI and/or the editor(s) disclaim responsibility for any injury to people or property resulting from any ideas, methods, instructions or products referred to in the content. |
© 2024 by the authors. Licensee MDPI, Basel, Switzerland. This article is an open access article distributed under the terms and conditions of the Creative Commons Attribution (CC BY) license (https://creativecommons.org/licenses/by/4.0/).
Share and Cite
Consul, P.; Feuchtgruber, M.; Bauer, B.; Drechsler, K. Influence of Extrusion Parameters on the Mechanical Properties of Slow Crystallizing Carbon Fiber-Reinforced PAEK in Large Format Additive Manufacturing. Polymers 2024, 16, 2364. https://doi.org/10.3390/polym16162364
Consul P, Feuchtgruber M, Bauer B, Drechsler K. Influence of Extrusion Parameters on the Mechanical Properties of Slow Crystallizing Carbon Fiber-Reinforced PAEK in Large Format Additive Manufacturing. Polymers. 2024; 16(16):2364. https://doi.org/10.3390/polym16162364
Chicago/Turabian StyleConsul, Patrick, Matthias Feuchtgruber, Bernhard Bauer, and Klaus Drechsler. 2024. "Influence of Extrusion Parameters on the Mechanical Properties of Slow Crystallizing Carbon Fiber-Reinforced PAEK in Large Format Additive Manufacturing" Polymers 16, no. 16: 2364. https://doi.org/10.3390/polym16162364
APA StyleConsul, P., Feuchtgruber, M., Bauer, B., & Drechsler, K. (2024). Influence of Extrusion Parameters on the Mechanical Properties of Slow Crystallizing Carbon Fiber-Reinforced PAEK in Large Format Additive Manufacturing. Polymers, 16(16), 2364. https://doi.org/10.3390/polym16162364