Article

Response Surface Modelling Nafion-117 Sorption of Tetraammineplatinum(II) Chloride in the Electroless Plating of IPMCs

1
PRISM Research Institute, Technological University of the Shannon, N37 HD68 Athlone, Ireland
2
Faculty of Science & Health, Technological University of the Shannon, N37 HD68 Athlone, Ireland
3
Faculty of Engineering & Informatics, Technological University of the Shannon, N37 HD68 Athlone, Ireland
*
Author to whom correspondence should be addressed.
Polymers 2024, 16(16), 2338; https://doi.org/10.3390/polym16162338
Submission received: 15 July 2024 / Revised: 12 August 2024 / Accepted: 14 August 2024 / Published: 18 August 2024
(This article belongs to the Special Issue Advanced Polymeric Films II)

Abstract

:
This work looks at the effects of a varying concentration, soak time, pH and temperature on the sorption of tetraammineplatinum(II) chloride (Pt-Ammine) in Nafion-117 films in the context of the electroless plating of ionic polymer–metal composites (IPMCs). Sorption is characterised by atomic absorption spectroscopy. A definitive screening design carried out determined all four factors to be significant for further analysis using response surface modelling. A duplicated central composite design (CCD) was utilised to characterise how the four factors affect the sorption amount and efficiency. Regression models for both responses were of poor fit. Nevertheless, key insights were obtained on the effects of the process parameters on sorption behaviour. The results indicate that above 0.5 g/L Pt-Ammine sorption, the platinisation of 10 × 50 mm IPMC samples through sodium borohydride reduction becomes redundant by the surface resistance metric. IPMCs with surface resistance values of approximately 2.5 Ω/square were obtained through only one round of chemical reduction. Varying surface morphologies and electrode thicknesses were analysed under a scanning electron microscope. The CCD parameter settings were validated. Recommended settings for optimised Pt-Ammine sorption in 10 × 50 mm Nafion-117 films were identified as follows: 1.0 g/L Pt-Ammine concentration, 24 h soak time, pH of 3 and temperature of 20 °C.

1. Introduction

Ionic polymer–metal composites (IPMCs) are polymer–metal composites known for their ion-exchange capabilities [1,2]. They are a subset of electroactive polymers whereby they deform in the presence of an electric field [1]. They have a wide variety of applications as IPMCs can act as both sensor and/or actuator (e.g., micro-robots, artificial muscles, viscometer) [3]. The general structure of IPMCs consists of a polymer membrane, commonly Nafion (a perfluorinated sulfonic-acid ionomer developed and trademarked by DuPont), sandwiched between electrode layers (noble metals such as platinum are commonly used). There exists a variety of methods in producing IPMCs. Conventionally, the preferred chemical method of manufacturing IPMCs is through electroless plating due to the good adhesion produced between the electrodes and the polymer membrane [4]. No standardised method has been established for the electroless plating of IPMCs due to a lack of fundamental understanding of how its myriad process parameters affect IPMC performance. The effects of process parameters such as the concentrations of reagents used, stirring time, soaking time, temperature and pH on how they impact the quality and performance of IPMCs have not been fully explored, particularly with reference to their interconnectivity. Generally, the electroless plating of IPMCs in the literature follows four main stages: pre-treatment, ion-exchange, reduction and post-treatment. This article will explore and characterise the effects of the concentration, soak time, pH and temperature on the Nafion-117 sorption of tetraammineplatinum(II) chloride, the ion-exchange stage in the electroless plating of IPMCs.

Electroless Plating of Ionic Polymer–Metal Composites (IPMCs)

The conventional and preferred chemical method of manufacturing IPMCs is through electroless plating due to good bonding between the electrodes and the Nafion membrane [4]. Electroless plating is a controlled autocatalytic deposition of a continuous layer on a catalytic surface in the presence of a complex compound and reducing agent [5]. The chemical deposition of platinum onto Nafion was first described in a 1980 patent by H. Takenaka and E. Torikai [6]. Known as the Takenaka–Torikai method, the plating utilised tetraammineplatinum(II) chloride (Pt-Ammine) as the metal complex and sodium borohydride as the primary reducing agent. The platinisation was performed by suspending the Nafion membrane between two chambers, one side filled with the metal complex, the other with the reducing agent. This method was surpassed by Fedkiw et al. in 1989 after the introduction of an impregnation–reduction method, which involved soaking the Nafion in the metal complex to exchange ions, and using sodium borohydride to reduce the impregnated Pt atoms [7]. Despite non-standardisation, with reported methods varying in terms of process parameters such as the concentrations of reagents used, stirring time, soaking time and many more, the electroless plating of IPMCs generally follows four main stages: pre-treatment, ion-exchange, reduction and post-treatment (as given in Figure 1).
The ion-exchange process involves exposing the membrane to the metal complex solution, Pt-Ammine [Pt(NH3)4Cl2] or hexaammineplatinum(IV) chloride [Pt(NH3)6Cl4], typically through soaking the membrane in the solution. This is to allow the platinum ions to diffuse into the Nafion membrane [8,9]. The platinum particles are adsorbed onto the Nafion and platinised in the next stage of reduction. Reported soaking times range from 30 min to 24 h, with most of the literature not specifying why those durations were chosen. Similarly, varied concentrations of the metal complex solution can be found in the literature. K. Oguro recommends more than 3 mg/cm2 area of the Nafion membrane [10]. Others such as Yang et al. and Kim et al. use 0.5 g/L and 0.02 M, respectively [8,9]. In addition to that, many have stated the inclusion of ammonia solution in the soaking process for pH adjustment, but no pH value was specified. Several works have looked at optimising the different stages of the electroless plating of IPMCs. One prominent work is the study performed by Kim et al. examining the effect of 13 factors on the performance of IPMCs (characterised by the maximum force produced) through a Taguchi design [8]. The 13 factors encompass various factors from all of the stages in the electroless plating of IPMCs (as in Figure 1). However, in the ion-exchange stage studied, only the platinum salt concentration and stirring time and how those factors affected the force produced were considered. The sorption kinetics of platinum salt uptake into the membrane and the effects of the temperature and pH were not assessed. By contrast, a study by Nasef et al. did address the sorption kinetics of metals in Nafion-117 membranes—not of platinum but of heavy metals [11]. The effects of the concentration, contact time, pH and temperature, known drivers of sorption kinetics, were explored with regard to the amount of heavy metals adsorbed per mg of the membrane. However, a one-factor-at-a-time (OFAT) approach was utilised instead of design of experiments (DOE). This means that the interactions of the four factors cannot be accurately and fully estimated with regard to the sorption kinetics. The different configurations of the ion-exchange stage in the electroless plating of IPMCs found in the literature are summarised in Table 1.

2. Materials and Methods

2.1. Atomic Absorption Spectroscopy (AAS)

AAS is used to quantify Nafion-117 uptake of Pt-Ammine. After soaking the Nafion films in the known concentrations of Pt-Ammine solutions, concentrations of the remaining solutions were measured using a Varian AA240FS atomic absorption spectrometer (Varian, Palo Alto, CA, USA). A Photron platinum hollow cathode lamp (Photron, Tokyo, Japan), Agilent-coded (P840C), was used as the radiation source. Little literature exists on the AAS of the Pt-Ammine compound. Several preliminary test runs were carried out to determine the optimal testing parameters for the spectrometer. The settings specified in Table 2 were used for all testing involving AAS.
Both standard and sample solutions were adjusted to pH 3 for AAS analysis, and the sample solutions were diluted down to be between 10 and 100 mg/L. This is because the limit of detection was found to be below 10 mg/L and going above 100 mg/L was found to exhibit deviations in absorbance signals between the pH-adjusted sample and standard solutions.

Gage Repeatability and Reproducibility Analysis

The reliability of the measuring system utilised is important in ensuring good and consistent results. Measurement system analysis is typically used in determining measurement accuracy and in identifying sources of error. In this case, the absorption values generated from the atomic absorption spectrometer can be sensitive to a multitude of factors, and day-to-day measurement variation needs to be determined to ensure accurate results.
A triplicate Gage Repeatability and Reproducibility (Gage R&R) study was carried out measuring the absorbance values of 6 different concentrations of Pt-Ammine solution: 25 mg/L, 50 mg/L, 100 mg/L, 200 mg/L, 400 mg/L and 800 mg/L. Each day over 3 days, the average of 3 absorbance readings for each concentration was recorded. The ‘operator’ factor was left out since the absorption measurement using the AA spectrometer is a fairly automated process with all the parameter inputs being handled by the SpectrAA software, SpectrAA 5.1 PRO. The Gage R&R analysis was carried out in Minitab 20.2.

2.2. Design of Experiments (DOE)

DOE is a branch of statistical analysis involved in the systematic design, analysis and optimisation of experiments [21]. In the case of studying how multiple parameters affect a yield response, DOE is advantageous in providing the fewest number of experimental runs for the most amount of data, grounded on statistical principles [21].
Nafion-117 uptake of a platinum complex is not yet fully understood. These 4 factors were analysed as to how they affect the Nafion-117 membrane uptake of Pt-Ammine: concentration of platinum complex, soak time, pH and temperature.

Definitive Screening Design (DSD)

A screening design was first carried out to identify the most significant factors. Common screening designs include 2-level fractional factorials, Placket–Burman designs and DSDs [22]. According to the sparsity-of-effects principle, most processes are mainly dominated by main effects and low-order interactions (i.e., 2-way interactions), as opposed to higher-order interactions (i.e., 3-way interactions and beyond) [23]. DSD was chosen due to it being a resolution IV design where main terms are not confounded [24]. The analysed factors and their respective levels are given in Table 3. The upper and lower limits of the factor levels were chosen based on the range of configurations presented in the previous literature (refer Table 1).
The uncoded DSD design matrix is given in Table A1. All the DOE and statistical analysis were carried out using Minitab 20.2. Nafion-117 strips were soaked in the solutions configured according to Table A1. They were then removed and kept in sample bags. The remaining solutions from the DSD were diluted down and Pt-Ammine concentrations were determined from AAS.

2.3. Sample Preparation

2.3.1. IPMC Preparation

Nafion-117 films (177.8 µm thickness), consisting of a fluorocarbon backbone, polytetrafluoroethylene (PTFE), copolymerised with a pendant ionic group, polysulfonyl fluoride vinyl ether (SO3), were commercially obtained from Ion Power Gmbh (Munich, Germany). They were cut into strips of 10 × 50 mm. The strips were roughened using a 400-grit sandpaper on a specially built hand-sander (Figure 2), 150 cycles on each side of the membrane (forward and backwards counts as one cycle), employing the grid method [15,25]. The membranes were then ultrasonicated using a Clifton MU−14 ultrasonic bath for 30 min with deionised water as the medium. They were then boiled in 2 M hydrochloric acid (HCl) and deionised water for 30 min, respectively.

2.3.2. Solution Preparation

The different solutions were made up to the specified concentrations in the DSD with pH adjustment accounted for. The Pt-Ammine solutions (tetraammineplatinum(II) chloride powder obtained from Sigma-Aldrich, St. Louis, MO, USA) were made from diluting an 8.5 g/L Pt-Ammine solution down to the respective concentrations of 0.5 g/L, 4.25 g/L and 8 g/L.
pH Adjustment:
The pH of the solutions was adjusted using 0.1 M and 0.01 M HCl and sodium hydroxide (NaOH). A Hach SensION 1 with 2-point calibration was used to monitor pH changes. The solutions were only initially adjusted to the desired pH using a 1 mL bulb pipette and were not kept constant. HCl and NaOH were chosen as the acid–base due to them fully dissociating in water: HCl into H+ and Cl ions, and NaOH into Na+ and OH ions. It was decided against pH buffers due to the multitude of compounds present in those, and not knowing specifically the effects of those compounds on the adsorption process. They can be used, but thorough analysis must be performed for different buffers to identify the effects of the multiple compounds present on the sorption process.
Temperature Adjustment:
The temperatures of the solutions were adjusted using BINDER BD 115 incubators. The incubators were set to 30, 40, 50 and 60 °C, respectively, and were allowed to reach the set temperatures. The Pt-Ammine solutions, covered with parafilm, were then placed in the incubators and allowed to equilibrate for 150 min, before placing the Nafion-117 strips in them. For solutions set to the temperature of 20 °C, they were placed on a benchtop at room temperature with the test tubes covered with parafilm.
Dilution for AAS Testing:
After soaking the Nafion-117 strips in the DSD-configured solutions, the strips were removed, and the solutions were diluted down for further testing using AAS. As shown earlier, matrix interference on the absorbance signal of the Pt-Ammine solutions due to pH adjustments is minimal within the 0 to 100 mg/L linear range. Thus, DSD solutions were diluted down to within the range of up to no less than 10 mg/L to 100 mg/L since detecting concentrations below 10 mg/L proved to be unreliable and inconsistent at the specified settings in Table 2. A summarised methodology of the sample preparation is shown in Figure 3. For solutions made up to the 8 g/L and 4.25 g/L concentrations, a dilution factor of 100 was chosen, whilst for the 0.5 g/L solutions, a dilution factor of 10 was chosen to ensure the concentration in the remaining solution did not fall below the 10 mg/L concentration, which was the limit of detection calculated during spectrophotometry method development.

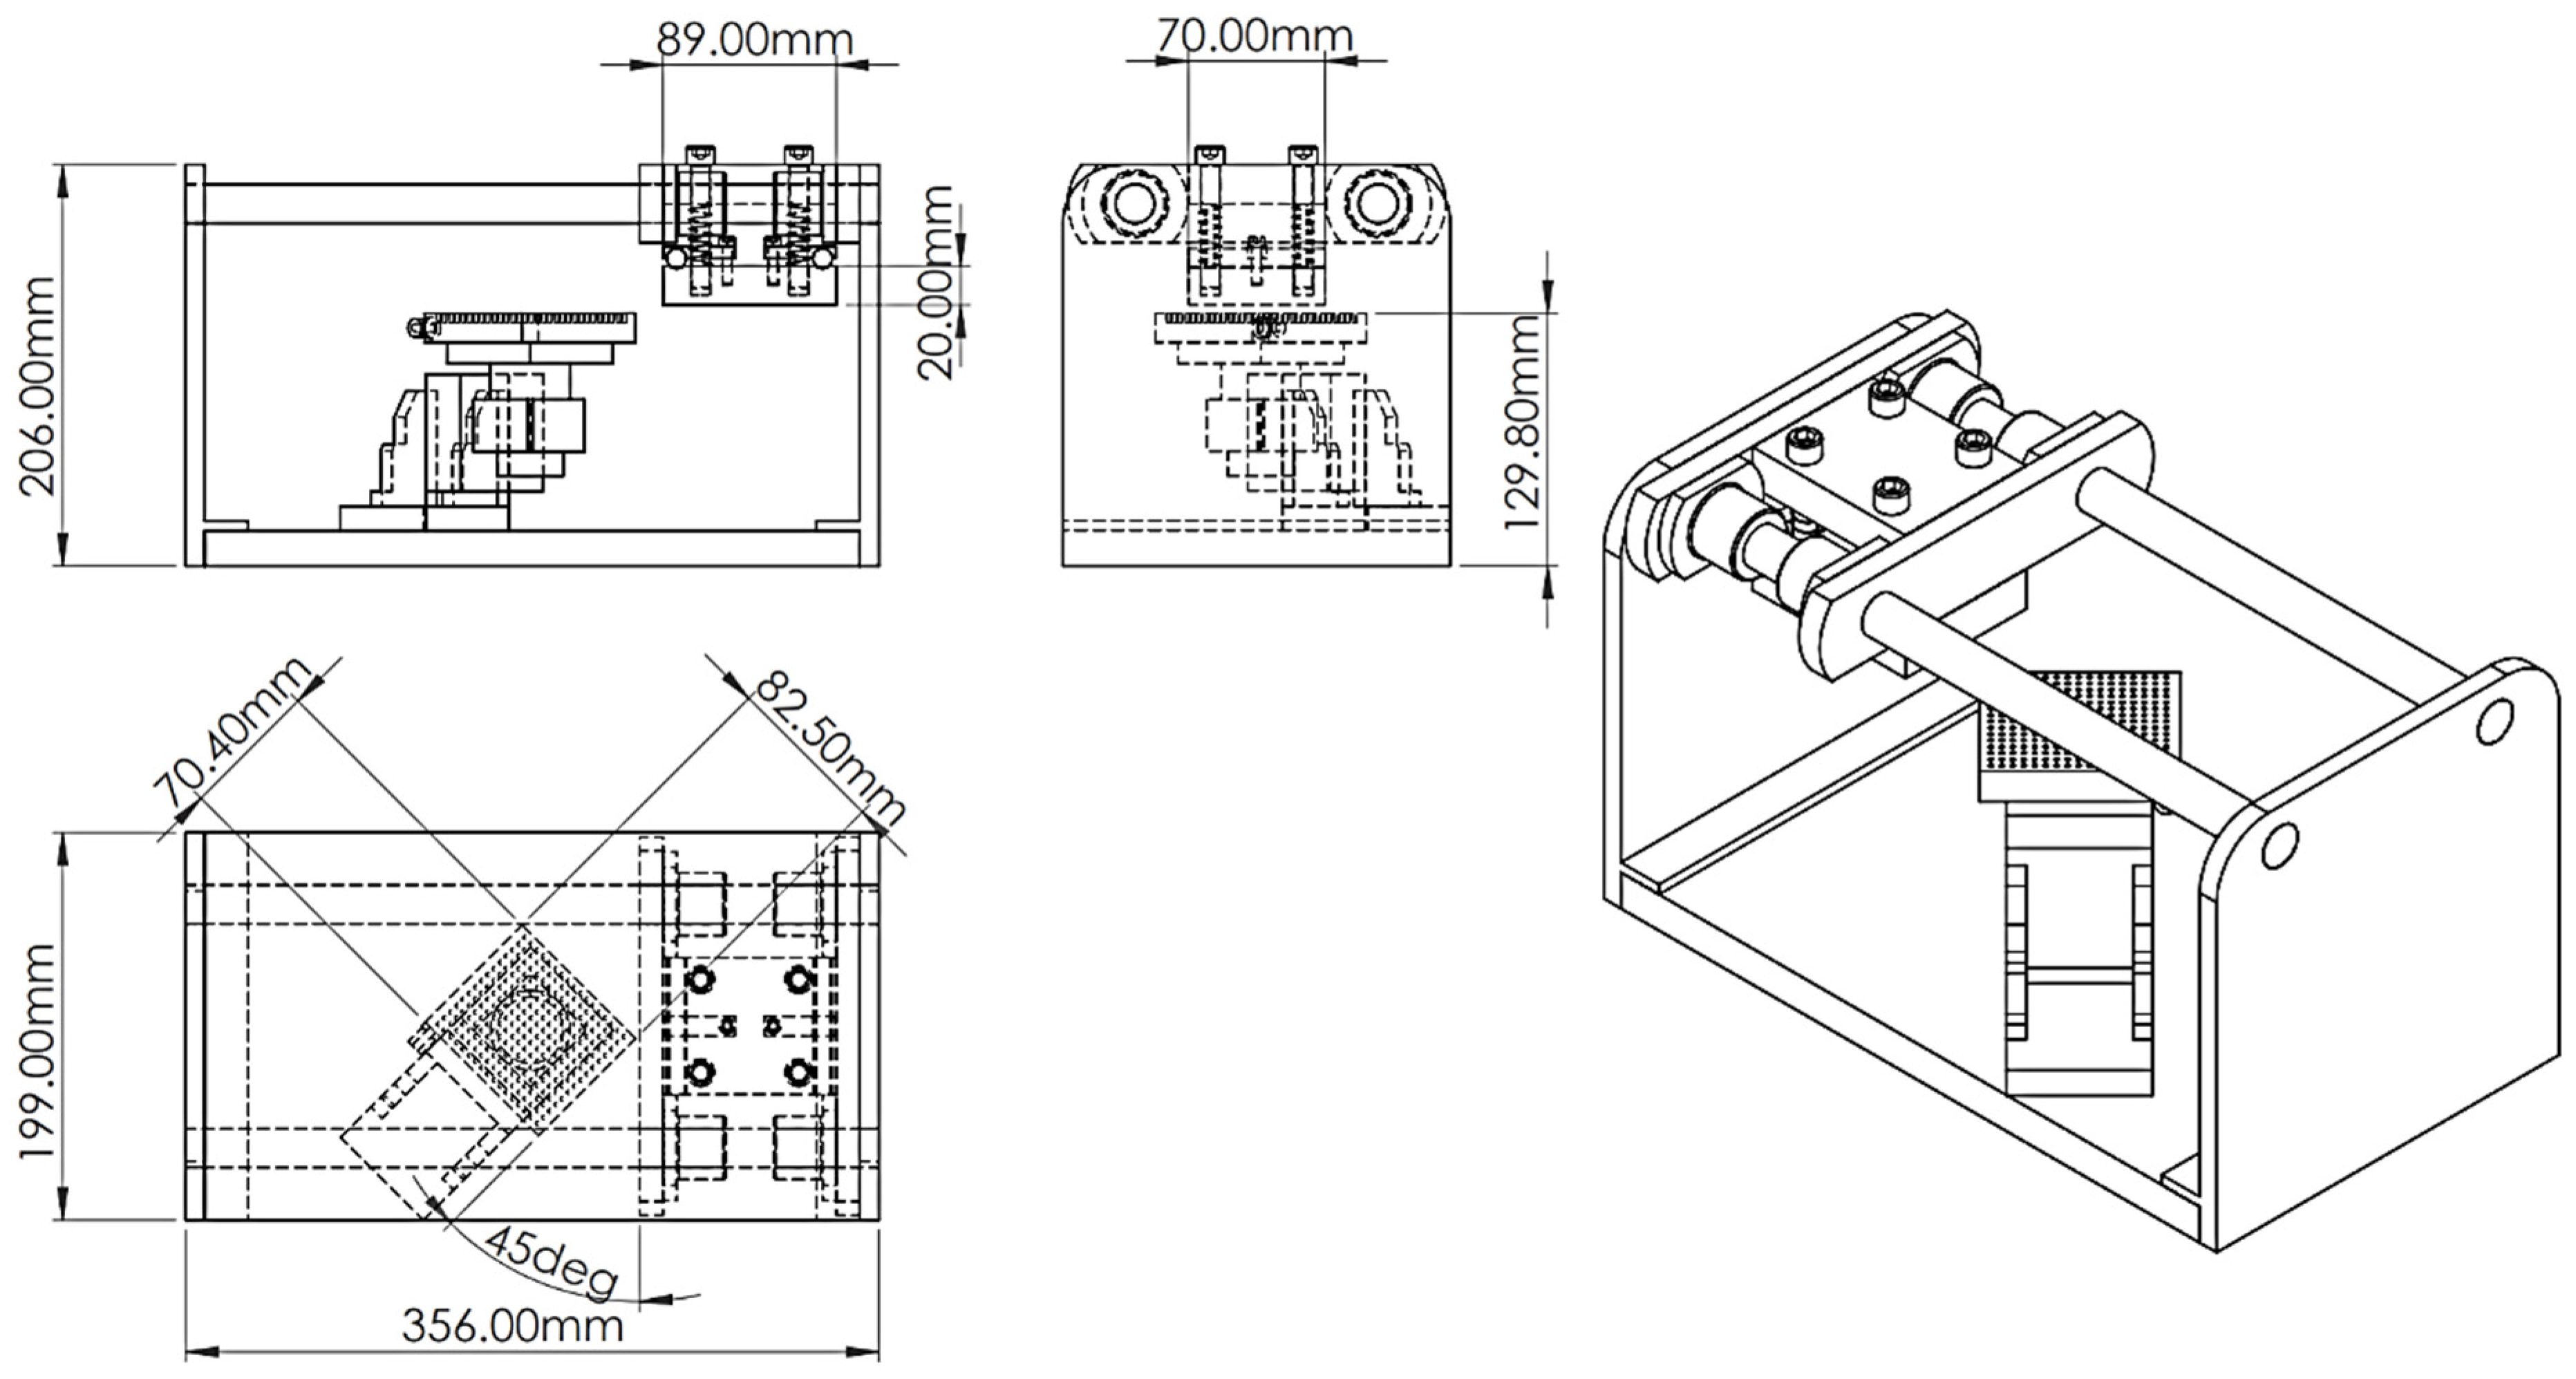
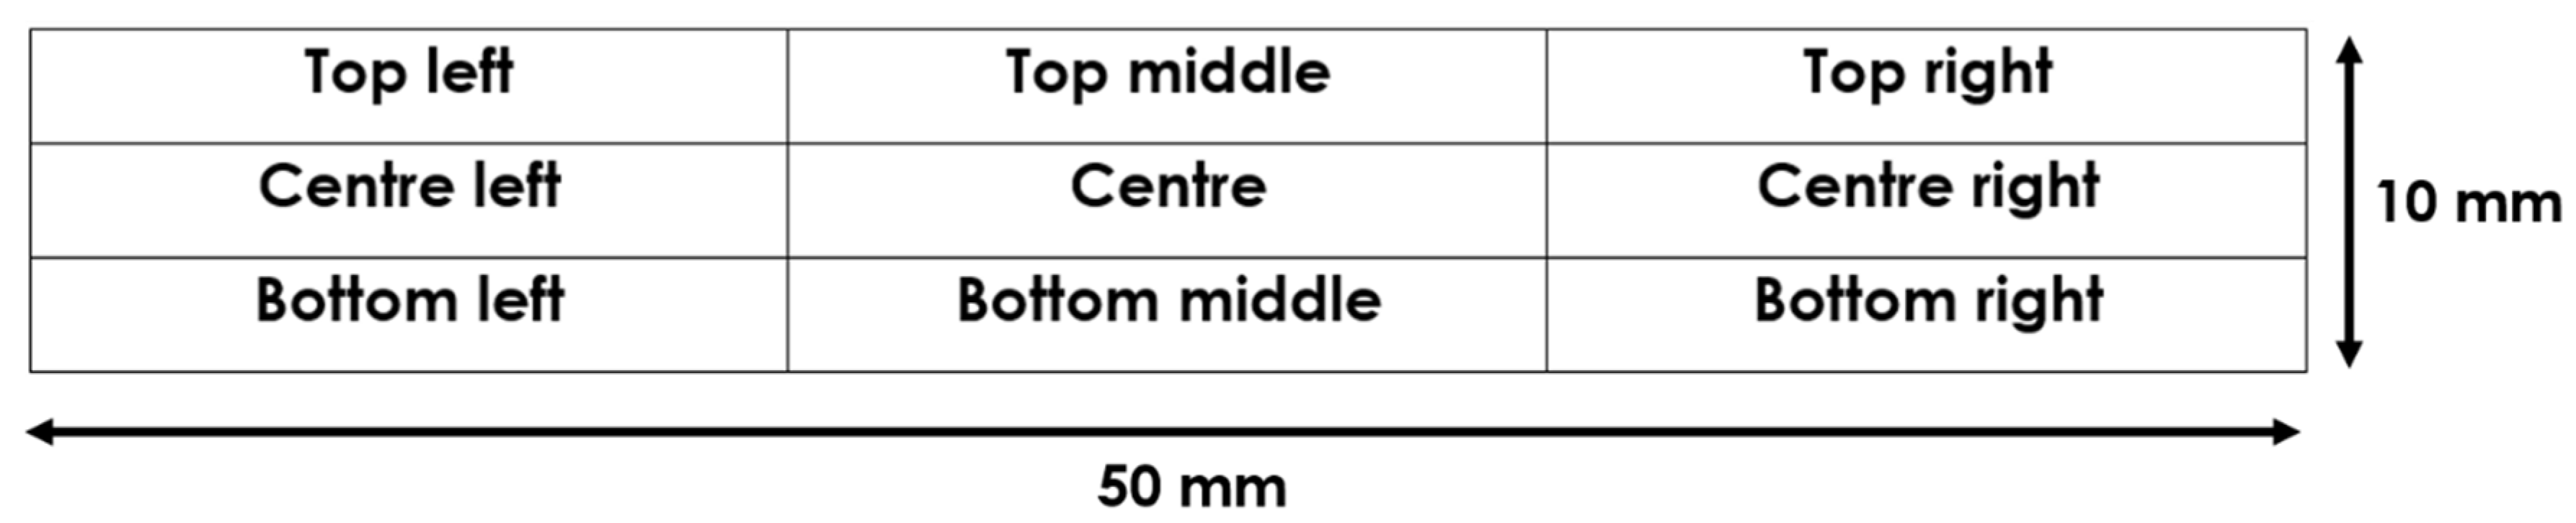
2.4. Surface Resistance Measurement

Surface resistance was measured using an Ossila Four Point Probe. The IPMC samples were divided into 9 regions, as shown in Figure 4, and an average of 100 surface resistance measurements were taken for each region.

2.5. Scanning Electron Microscopy (SEM)

Surface and cross-sectional morphologies were examined through a TESCAN MIRA XMU (Tescan, Brno, Czech Republic) with 20 kv voltage. InBeam detector was used for cross-section morphology analysis whilst back-scattered electron (BSE) detection was used for surface morphology. For cross-section analysis, the samples were hand-cut using microtome blades. They were then sputter-coated with gold using an Agar Sputter Coater, at a current of 30 mA and sputter time of 55 s per run. Cross-sectional samples were double-coated (total sputter time of 110 s) whilst surface samples were coated once. Samples were adhered to sample holders by carbon tape. After exposing prepared samples to electron beam radiation in vacuum condition, images were captured at various magnifications. Energy Dispersive X-ray (EDAX) analysis was employed alongside SEM imaging for elemental mapping of the IPMCs.

3. Results and Discussion

3.1. Gage R&R Analysis

Results for the Gage R&R analysis are given in Table 4 and Table 5. As mentioned in the methodology section, since the ‘operator’ factor was excluded, only repeatability is accounted for in the analysis. From Table 4, the variation contribution of repeatability accounts for only 0.03% of the total variation, with the remaining variation coming from part-to-part. This is relatively low and within the acceptable range of being less than 10%.
Similarly, looking at Table 5, total variation due to the measurement system, i.e., Total Gage R&R is 1.63%, is acceptable since it is less than 10%. From these results, we can conclude that the absorption values measured using the AA spectrometer are good and consistent, and the measured parts contribute to most of the variation in the study instead of the measurement system, making this measurement system reliable.

3.2. Definitive Screening Design (DSD) Results

The design matrix and results from the DSD, for both the sorption amount and sorption efficiency, are given in Table A1.

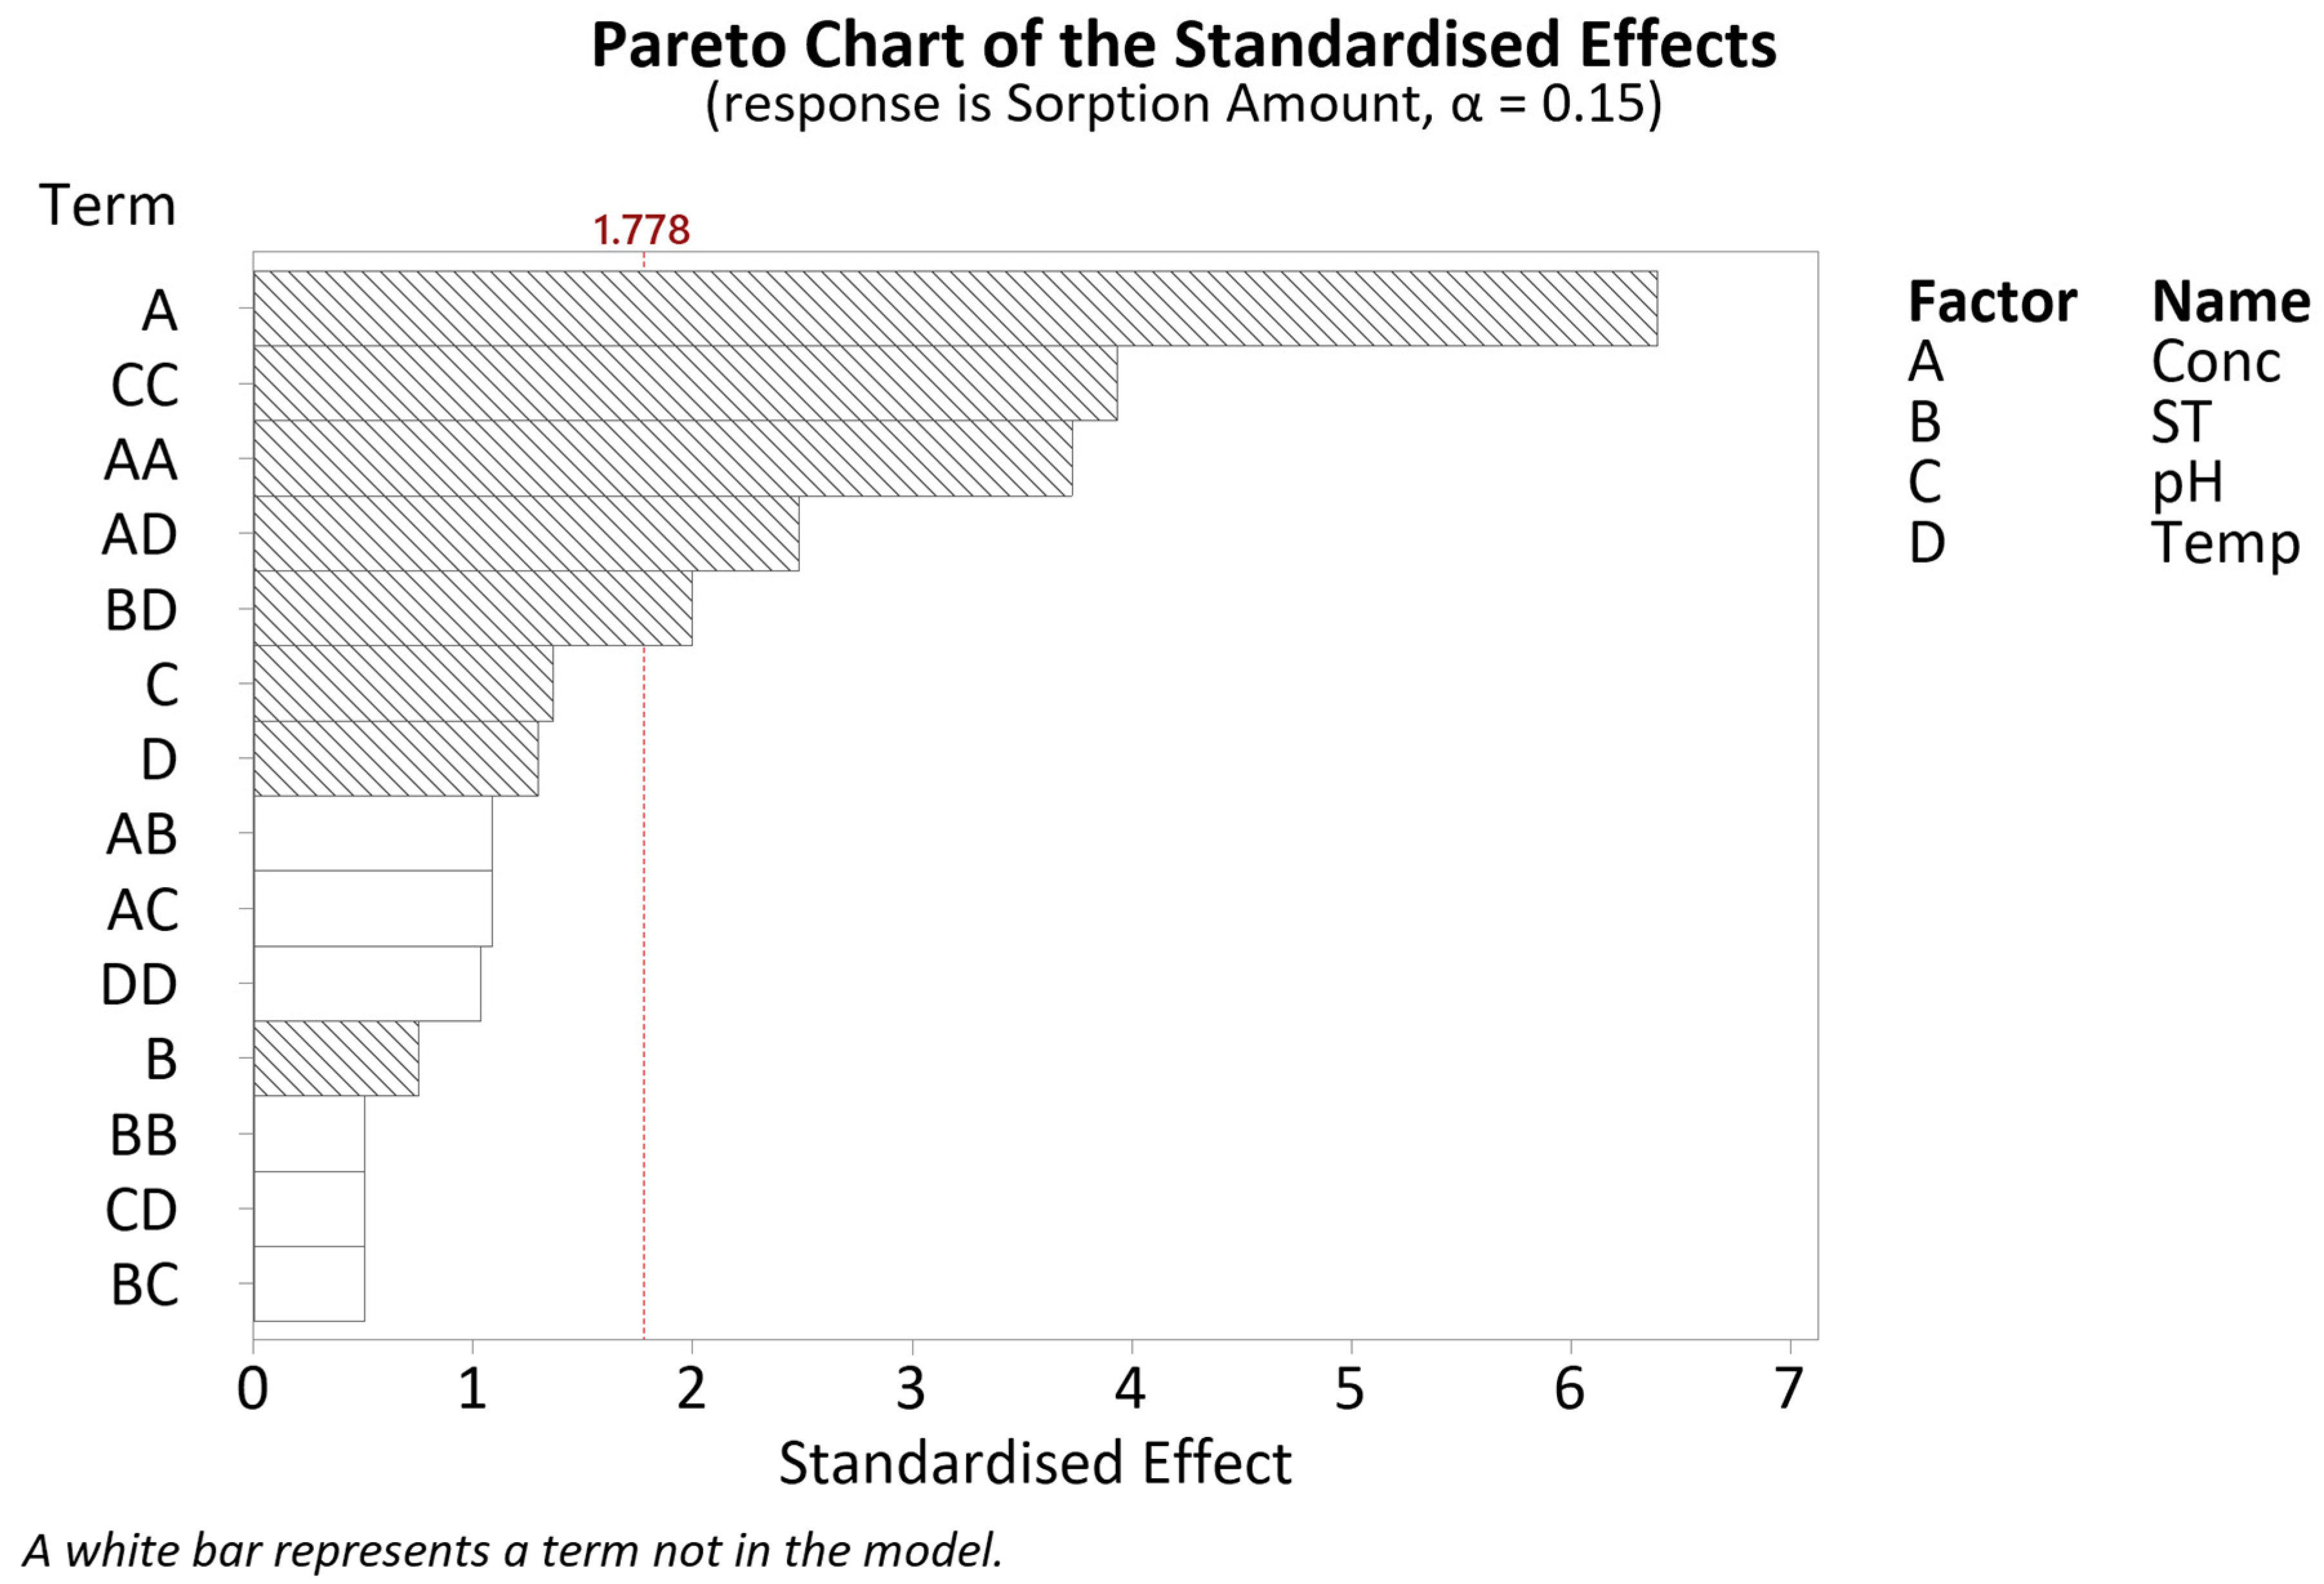
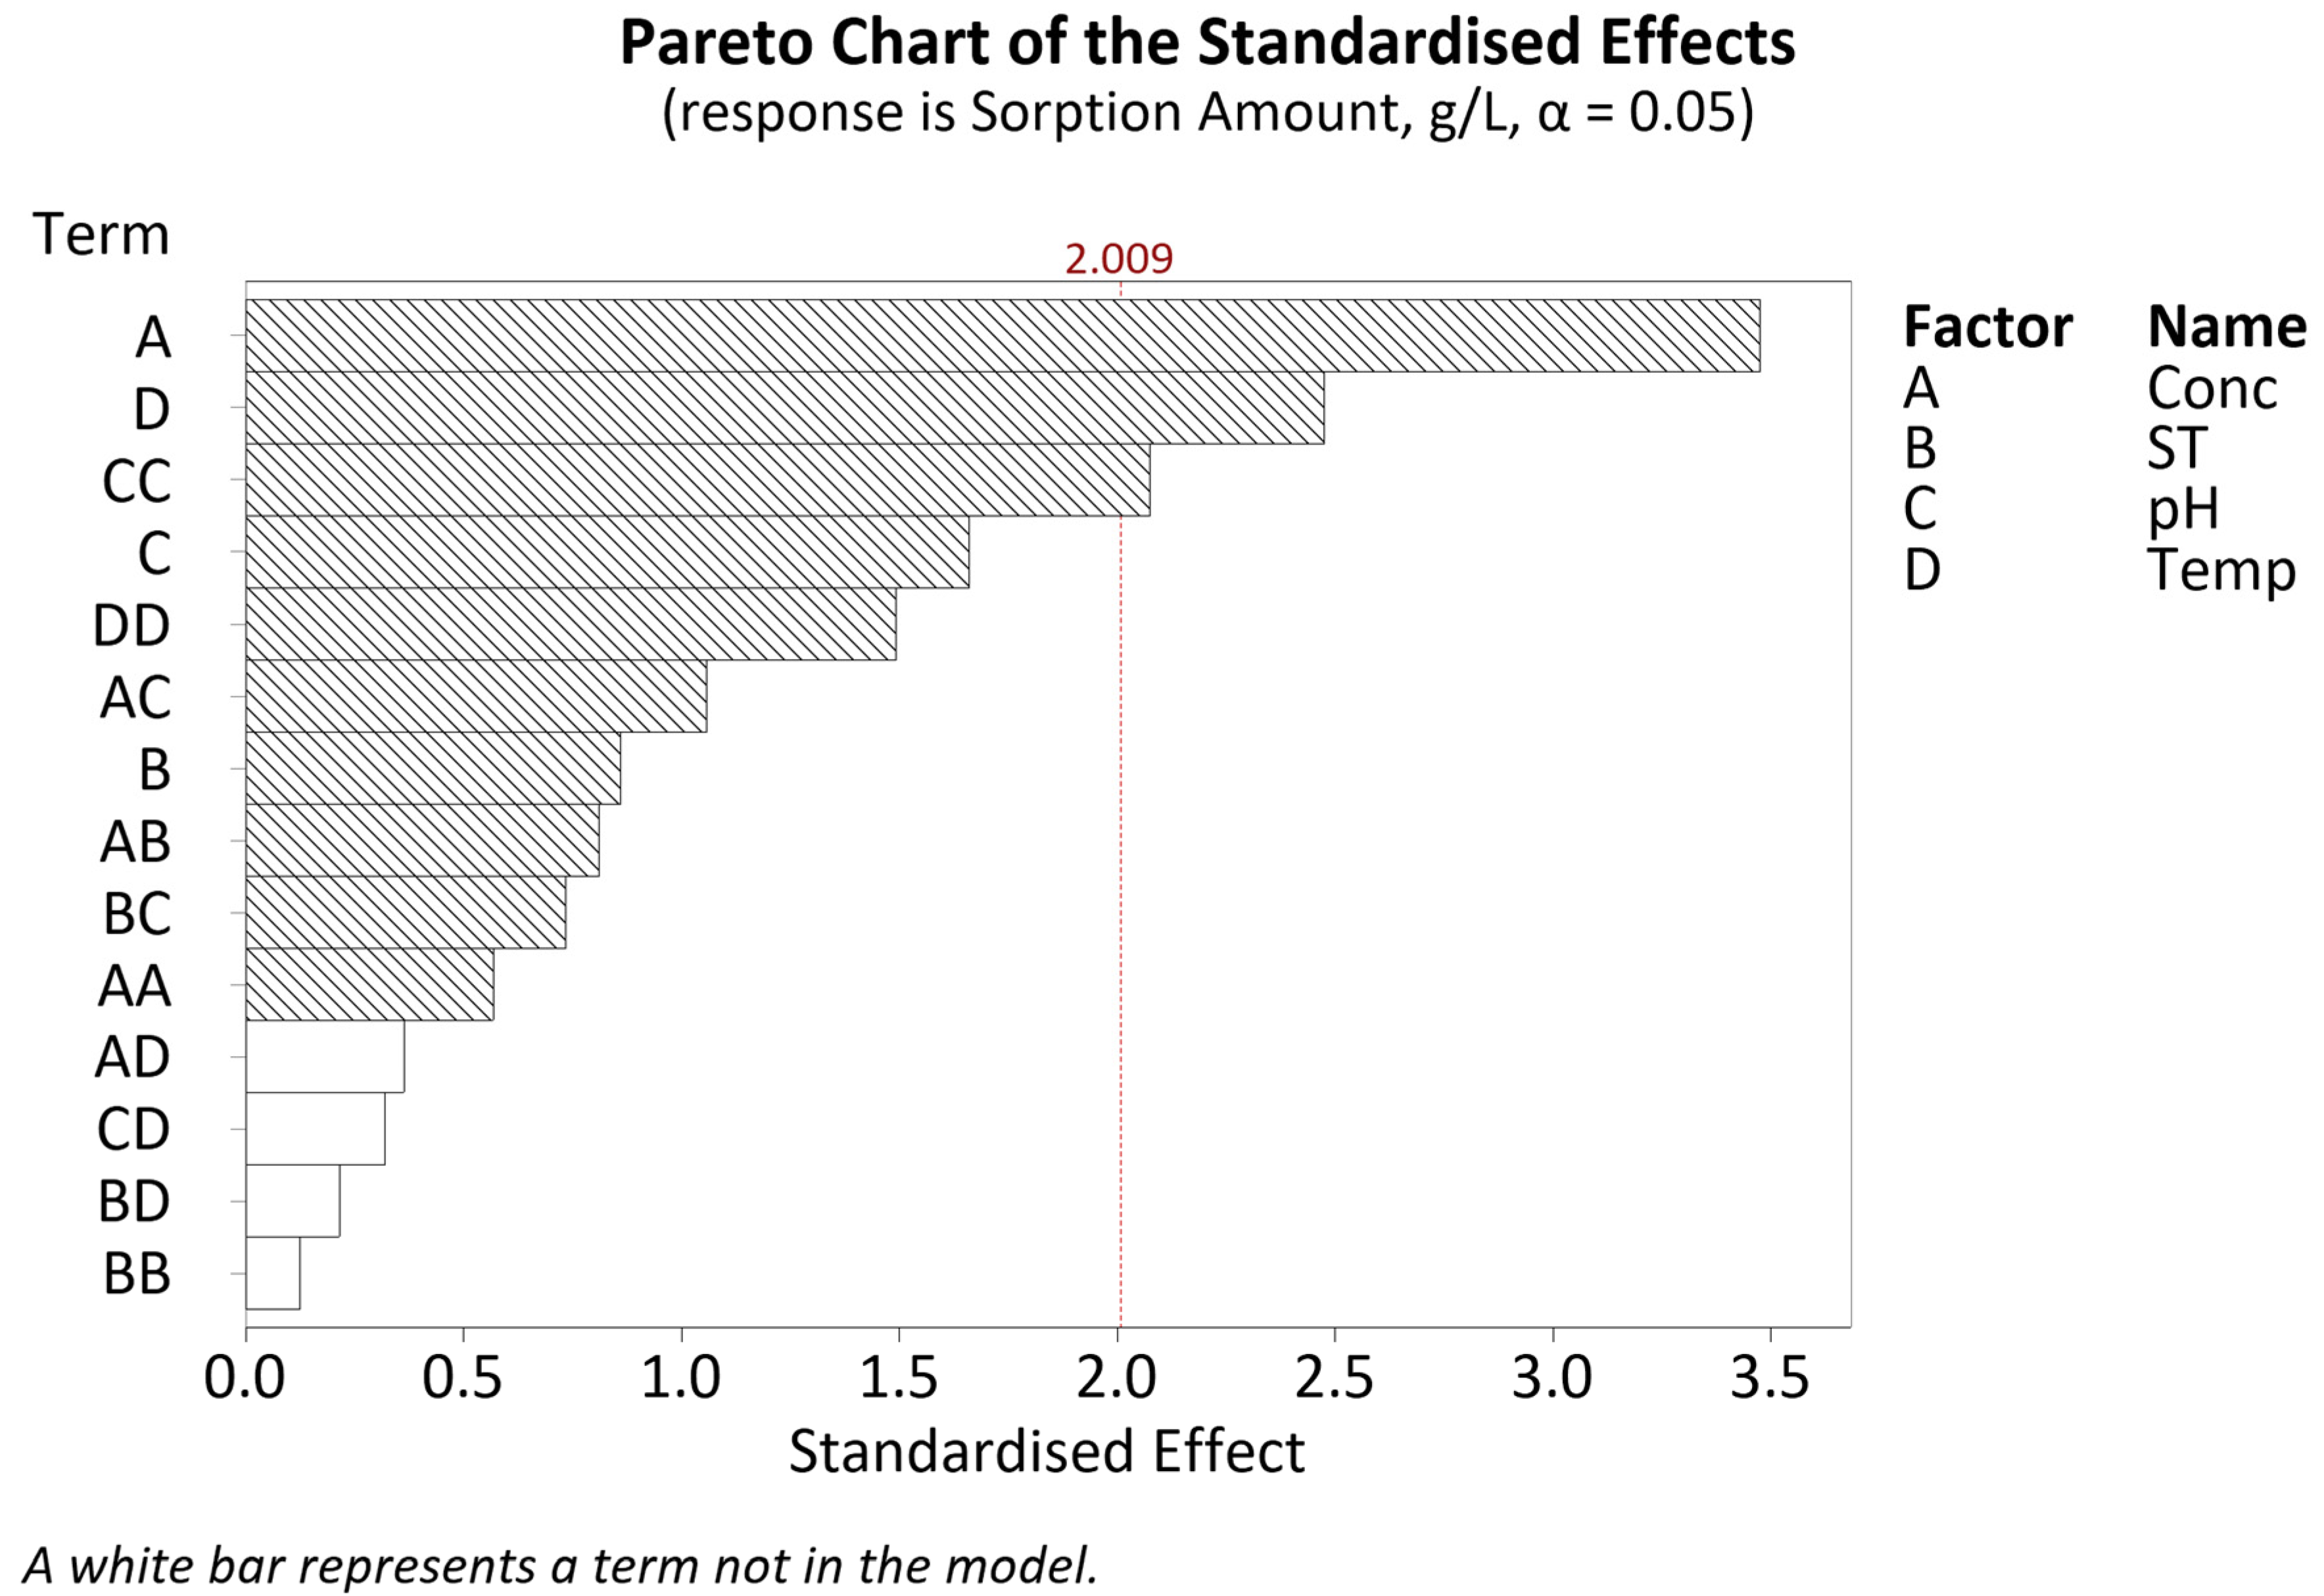
3.2.1. Sorption Amount-DSD

After a series of model reductions through a stepwise approach, a regression model with an R2 value of 95.51% was obtained. The ANOVA results are given in Table A2. Examining the Pareto chart given in Figure 5, the significant factors include the linear term for concentration (A), the square terms for concentration (AA) and pH (CC), and the interactions as follows: concentration*temperature (AD) and soak time*temperature (BD). The (*) symbol indicates an interaction between terms.
Despite the other linear terms, soak time (B), pH (C) and temperature (D), not being statistically significant, they are included as to adhere to a hierarchical model. This implies that all the four factors screened are significant to be further examined through surface response modelling.

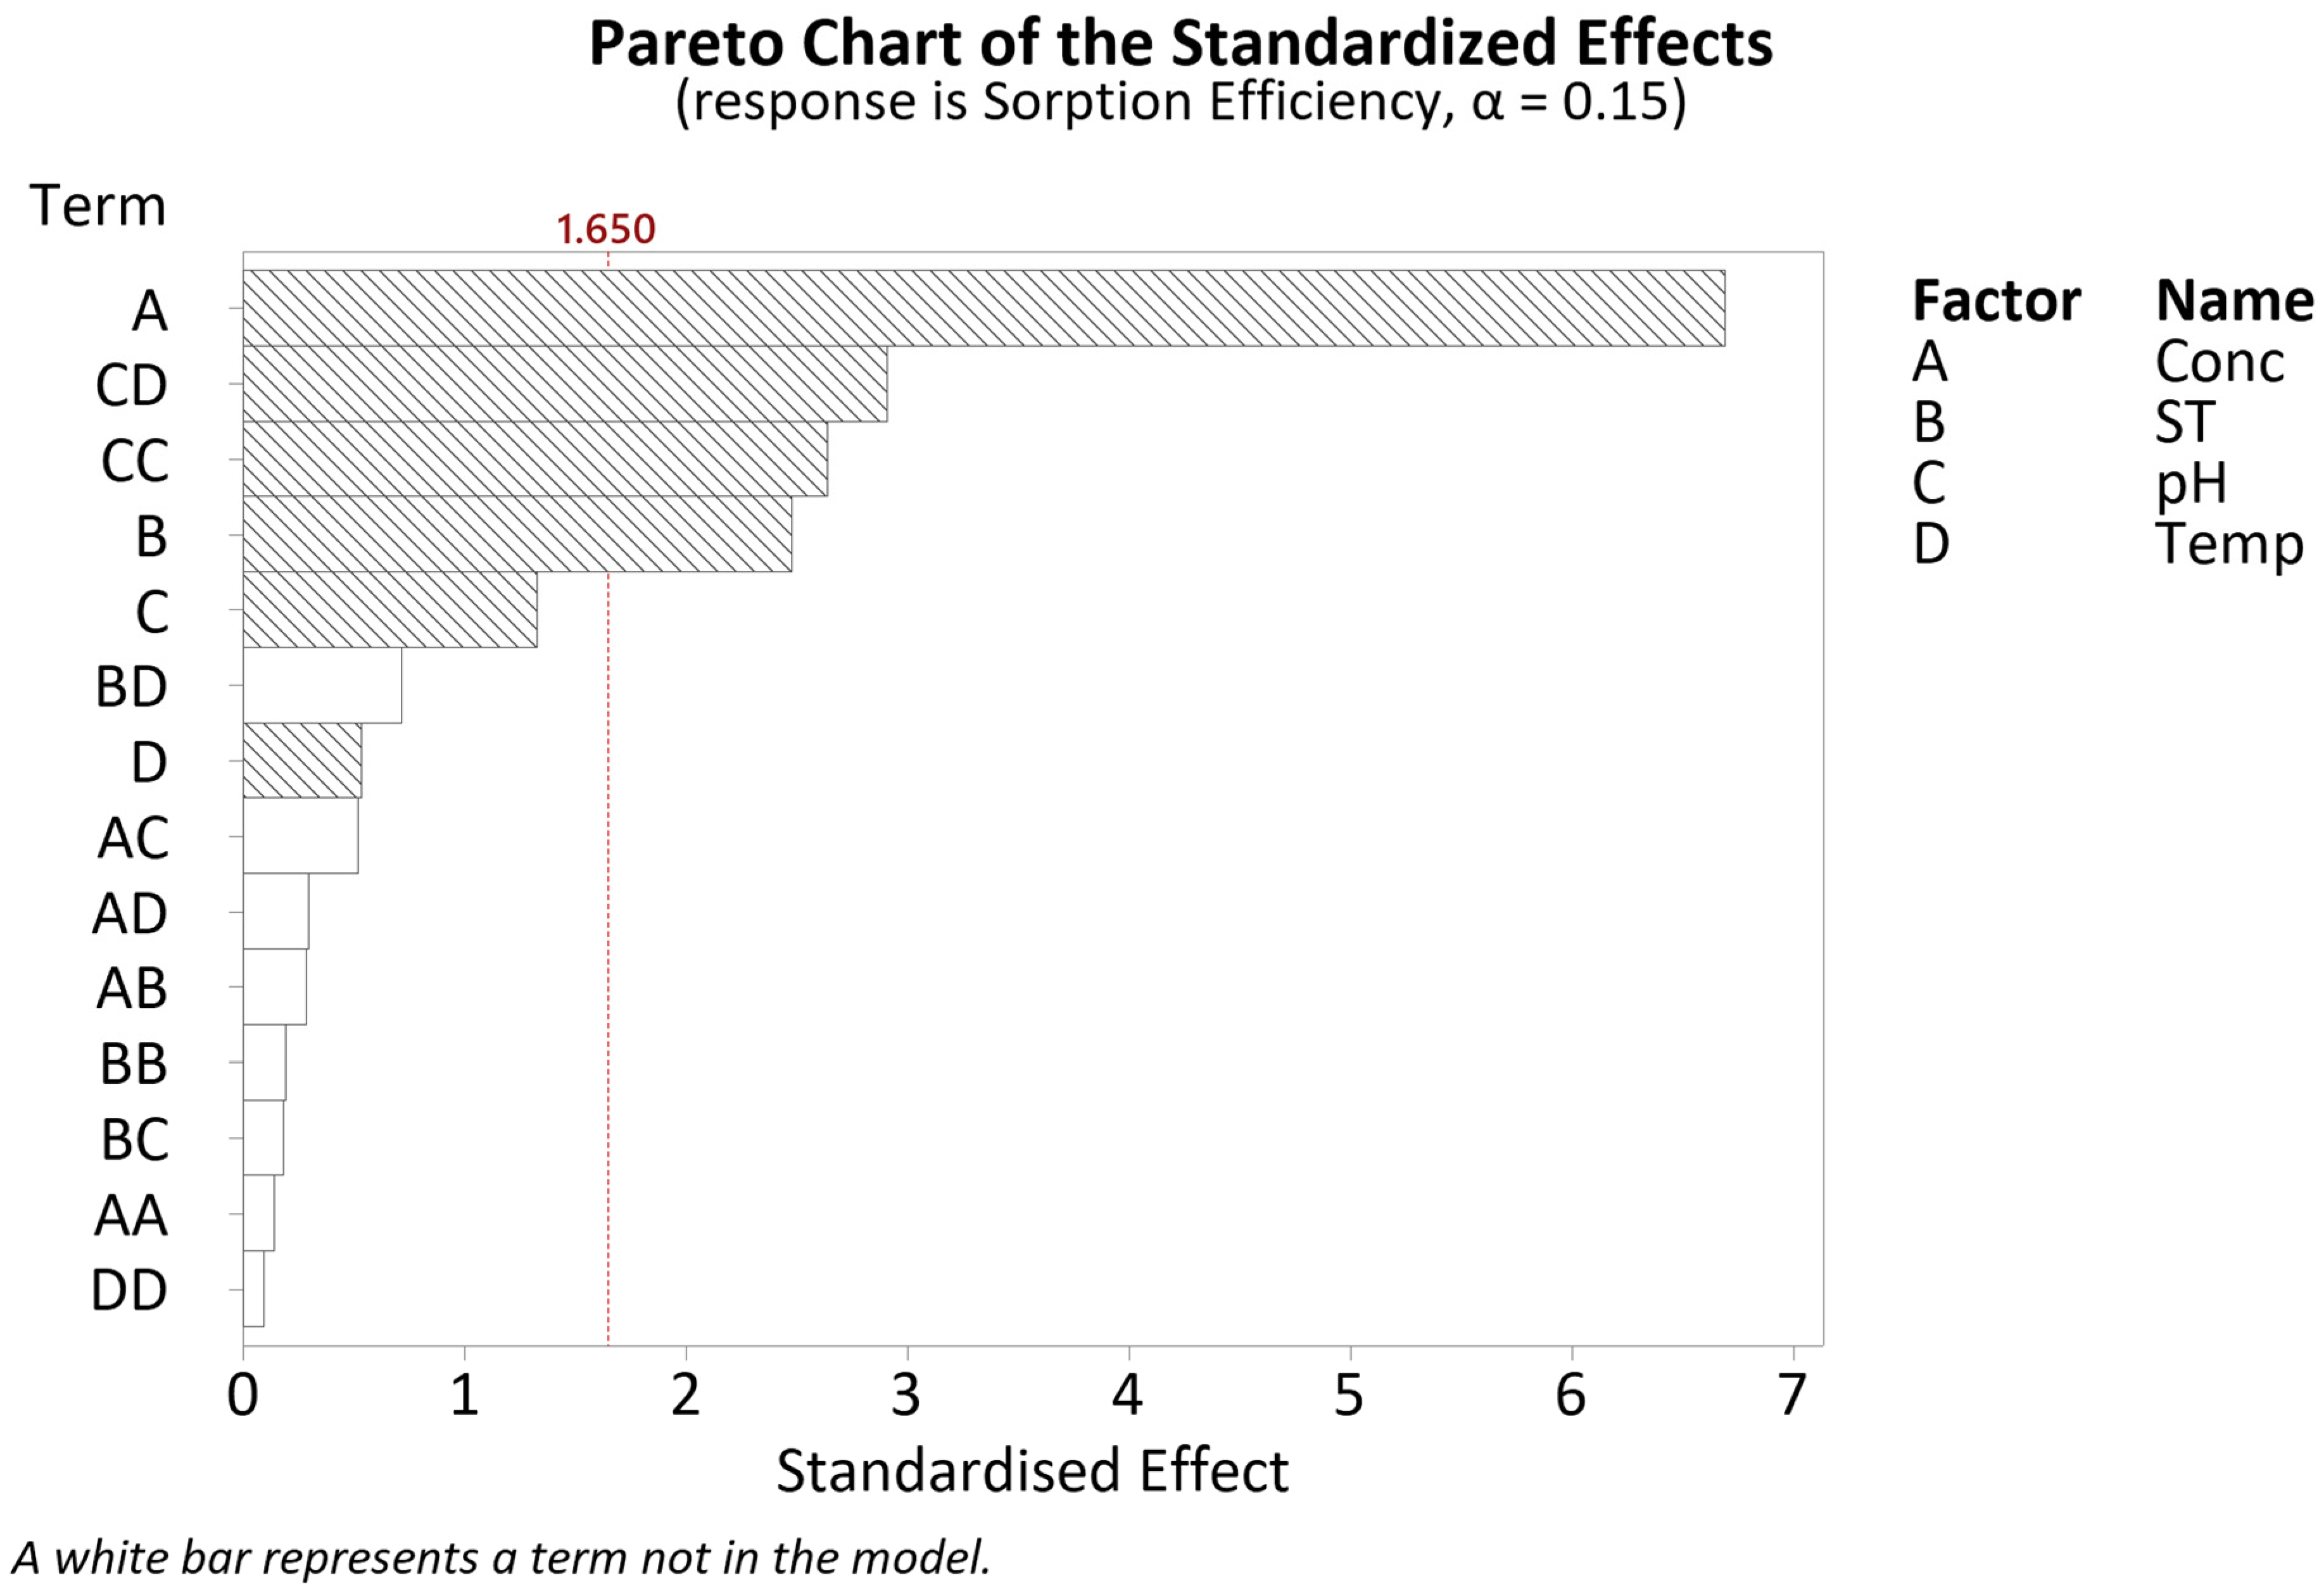
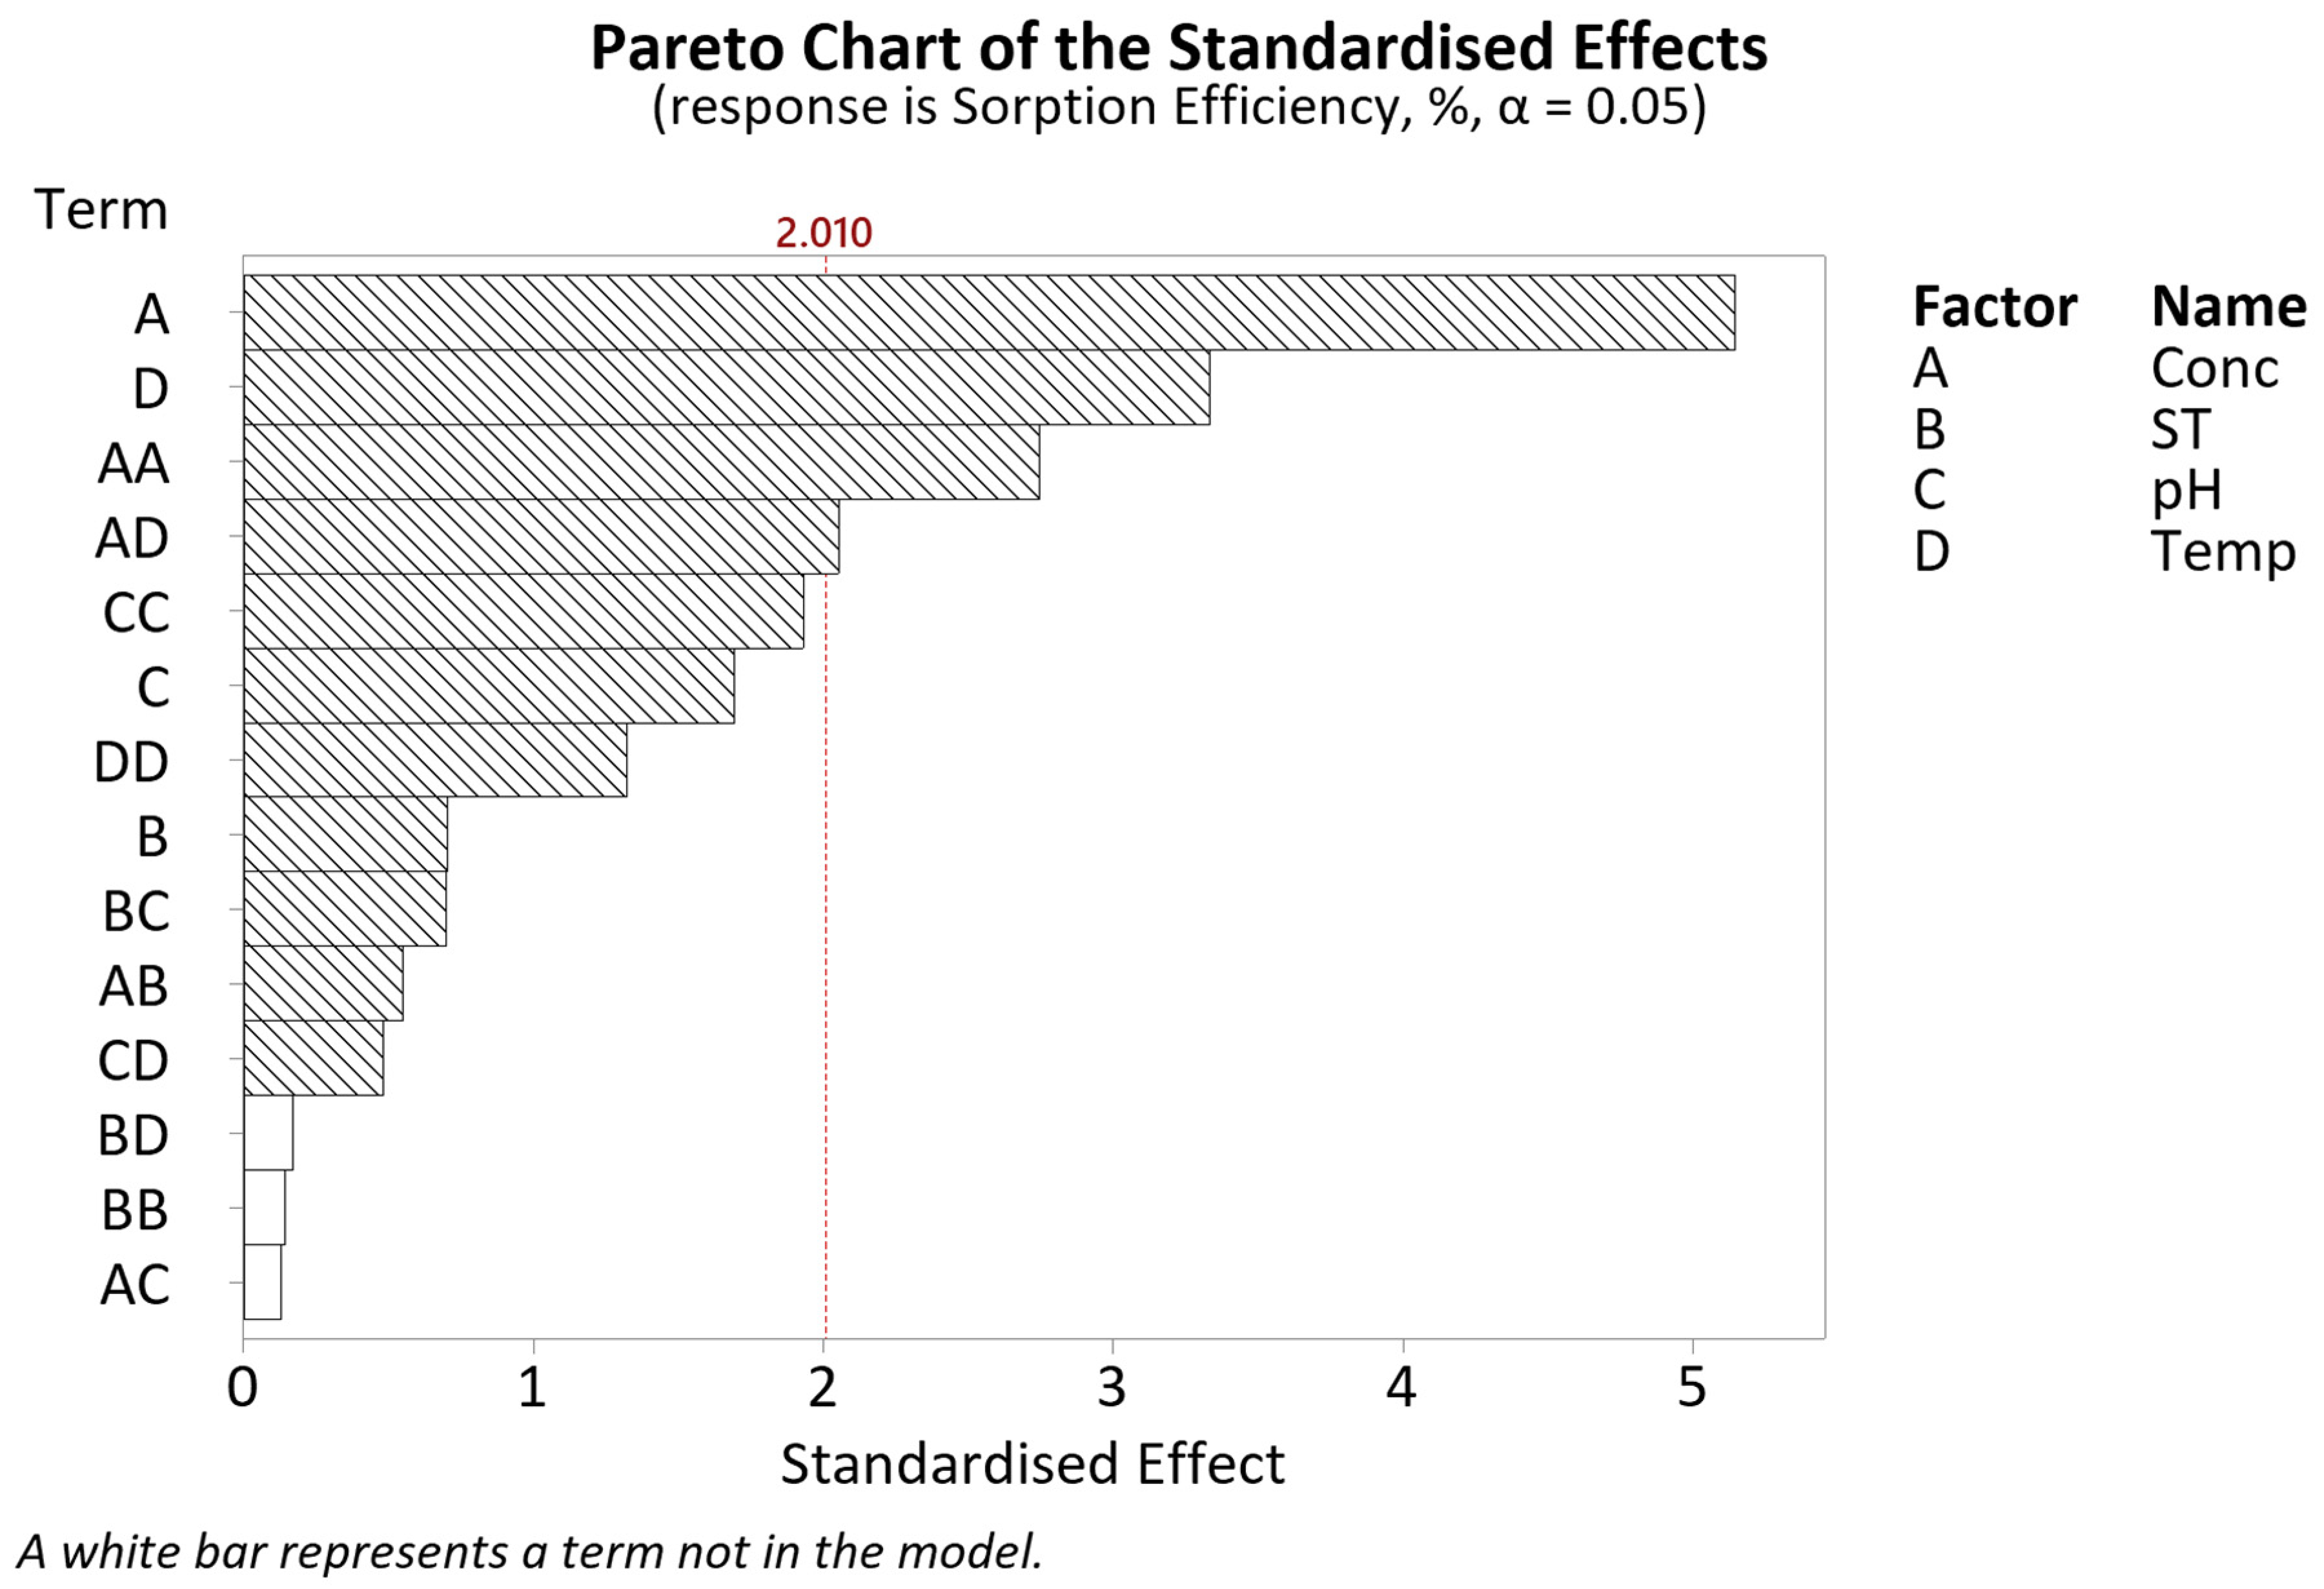
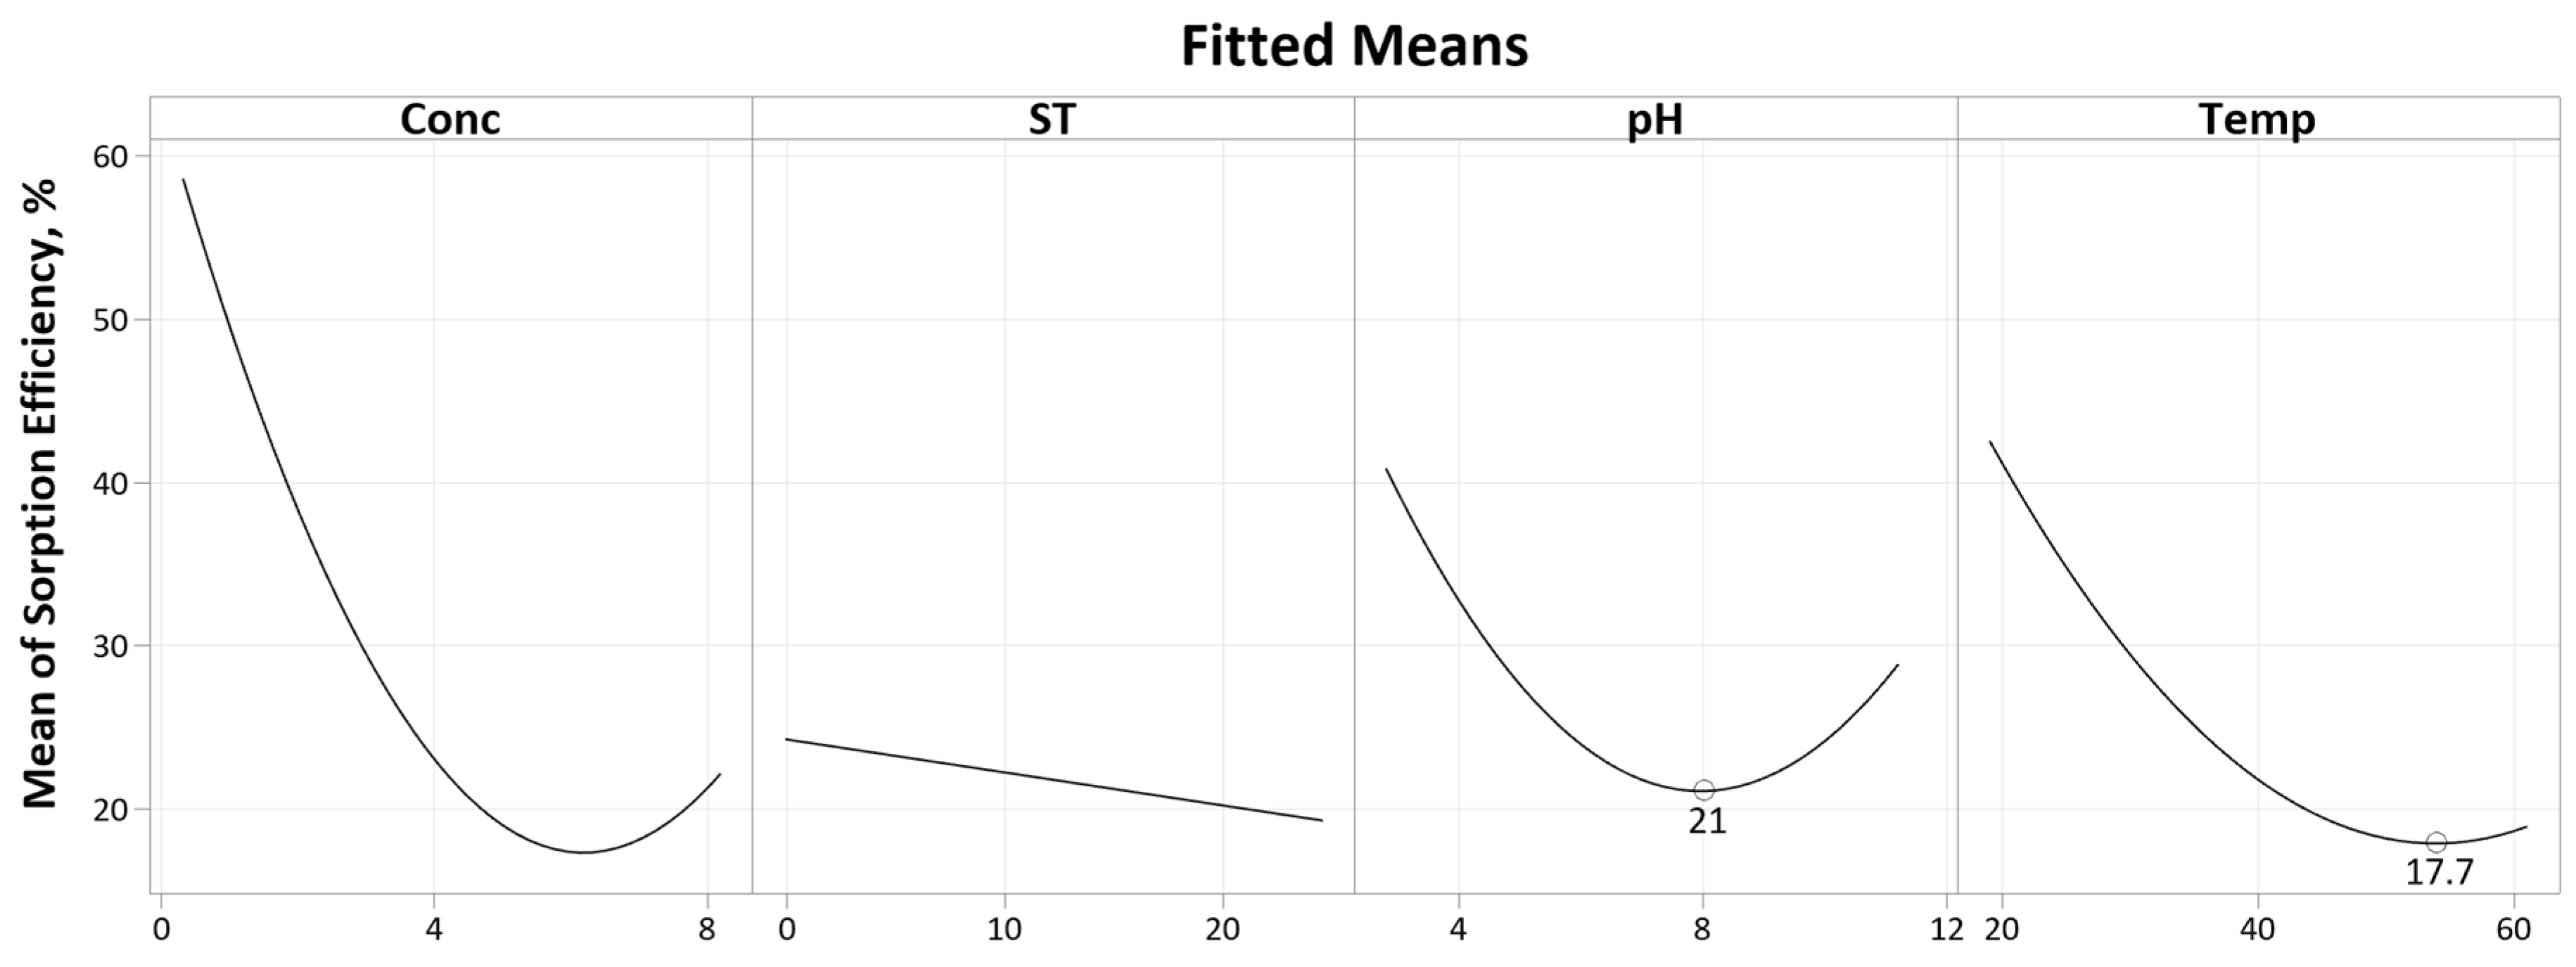
3.2.2. Sorption Efficiency-DSD

Similarly, with regard to the sorption efficiency, after a series of model reductions through a stepwise selection, a regression model with an R2 value of 91.95% was obtained. The ANOVA results are given in Table A3. Looking at the Pareto chart in Figure 6, statistically significant factors include the linear terms for concentration (A) and soak time (B), the interaction term for pH*temperature (CD) as well as the square term for pH (CC).
Adhering to model hierarchy, this indicates that all the four terms screened with regard to the sorption efficiency are relevant for further evaluation using response surface modelling.

4. Parameter Optimisation and Characterisation

4.1. Response Surface Methodology (RSM)

After subsequent screening of the factors through DSD, all the four factors, concentration, soak time, pH and temperature, were deemed to be important factors for further analysis using RSM. A central composite design (CCD) was employed to further study the four factors. The CCD with 31 runs was duplicated, and the design matrix and results are given in Table A4. The low and high levels from Table 3 were inserted into the CCD as axial points. Blocking was applied on replication. The duplicated CCD resulted in 62 samples.
The CCD results were input into Minitab 20.2 to generate response surface regression models for two responses: sorption amount and sorption efficiency. The regression equations for both responses and their respective R2 values after model reduction are given in Table 6. The terms included in both models can be inferred from the Pareto charts given (Figure 7 and Figure 10).

4.1.1. Sorption Amount-CCD

The regression model for the sorption amount only produced an R2 value of 49.09%. This implies a not-so-well-fitted model, supported by a significant lack-of-fit p-value of 0.008, as shown in Table A5. This signifies that only approximately 49% of the variation in the sorption amount can be explained by the varying concentration, soak time, pH and temperature. This testifies the complex nature of Nafion sorption kinetics and isotherms. As discussed by Kusoglu et al. [2], ion transport in Nafion is governed by the properties of water and how they interact with the sulfonate acid sites in the membrane, as well as the properties of the polymer chains in structuring mesoscale transport networks. Despite the poor fit, the results from the regression model could give further insights into the complex interactions.
Referring to the Pareto chart given in Figure 7, only three factors are significant: concentration, temperature and the square term for pH (CC). The pH square term signifies a quadratic response, as evident in the main effects plot given in Figure 8.
Concentration
Concentration is a significant factor affecting the sorption amount of the Pt-Ammine with a p-value of 0.001 (as shown in Table A5). A linear relationship is observed between the initial concentration of the Pt-Ammine and the adsorbed amount. The SO3H sites have a higher affinity for higher valency ions as well as a preference for metal cations as compared to protons [2,11,26]. As the Pt-Ammine solution has a higher initial concentration of the [Pt(NH3)4]2+ ion compared to the membranes, increasing the initial concentration from 0.5 g/L to 8 g/L increases the concentration gradient, resulting in increased sorption.
Soak time
Referring to the Pareto chart in Figure 7 and Table A5, the soak time bears no significance with regard to the Pt-Ammine sorption amount (p-value of 0.394). Similarly, any of its interactions are also of no significance. Going from a soak time of 30 min to 24 h, the mean sorption amount trends downwards, i.e., sorption decreases with the soak time. The expected response was that sorption would increase with the soak time and level off after some time as it reaches maximum sorption such as reported by Nasef et al. in the Nafion adsorption of heavy metals [11]. However, in that particular case, the investigated concentrations only lie within the range of several mg/L as compared to the much higher concentrations investigated in this study. A possible explanation for this behaviour would be maximum adsorption consecutively followed by desorption.
pH
Solution pH plays an important role in the sorption since it controls the surface charge density of both the sorbent and analyte, affecting their electrostatic interactions [27]. The square term for pH (CC) is significant with a p-value of 0.043. This implies a curved mean sorption yield, as evident from the main effects plot in Figure 8. At a pH of 3, the mean sorption is at a maximum. This could be attributed to SO3H sites in Nafion having higher affinity for higher valency ions as well as a preference for metal cations as compared to protons [2,11,26]. As the pH increases, the mean sorption amount decreases until slightly above the pH of 7 after which the response starts trending upwards until pH 11. In the previous literature, researchers added varying concentrations of ammonia solution in the impregnation process for pH adjustment purposes [12,13]. Experimentally, the Pt-Ammine solution was found to be approximately around a pH of 5. The addition of the ammonia solution would push this value closer to 7 or even slightly beyond that into alkaline territory. Rashid et al. adjusted the solution pH to 12 using 0.1 M NaOH. At a more basic pH where the OH ion concentration is higher, there is less competition between the Pt-Ammine and hydronium ions (H3O+) at adsorption sites, leading to more sorption of Pt-Ammine [11]. A point-zero-charge (PZC) experiment was carried out to further explain the curved response in pH. A pH drift method was utilised whereby solutions of Pt-Ammine were made to be between the pH of 3 and 11 at a 0.5 g/L concentration. Samples of Nafion-117 (10 × 50 mm) that were ultrasonicated, preboiled in 2M HCl and deionised water were soaked in 15 mL, 0.5 g/L Pt-Ammine solutions for 24 h. The Nafion-117 strips were then removed, and the final pH was measured. The results for the PZC are graphed in Figure 9. A tie line was drawn (dashed line) where initial pH equals final pH, and the intersection between the tie line and experimental data line is the PZC.
Evident from Figure 9, the Pt-Ammine solutions at varying pH levels dropped to a constant pH value of approximately 2.5, indicating the H+ ions in the protonated Nafion-117 films have been displaced into the solution. However, this does not help explain the quadratic pH response indicated by the regression model. A possibility might be the inapt testing methodology for PZC, or a different metric might be better suited to explain the response such as isoelectric point [28].
Temperature
Referring to the main effects plot in Figure 8, it is evident that the temperature has a significant effect on the sorption amount (supported by a p-value of 0.017 as given in Table A5). Going from a temperature of 20 °C to approximately 50 °C, an increase in the temperature results in a steep decrease in the mean sorption amount. However, as the temperature is further increased up to 60 °C, the sorption trends slightly upwards. Ion and water transport in Nafion membranes are highly interrelated since ion transport is dependent on solvent [2]. The literature is divided on the exact effects of the temperature on the sorption properties of Nafion. As concluded by Sánchez [29], the temperature effects on the Nafion sorption capacity are still not clear—whether it be an increasing or decreasing function of the temperature. This lack of clarity is partly due to the effects of varying thermal histories of Nafion membranes, such as pre-drying, preboiling and annealing, on the sorption kinetics and thermodynamics [2,30,31,32]. A study by Kusoglu et al. inferred that the liquid water uptake of preboiled Nafion membranes is relatively independent of the temperature [30]. Similarly, Nasef et al. found that the sorption of heavy metals in preboiled Nafion-117 membranes does not change with the temperature [11]. The steep decline in the sorption amount with the temperature indicates a physisorption mechanism between the Pt-Ammine ions and the sulfonate acid sites in the Nafion membrane since physisorption is an exothermic process [33]. This implies that weak electrostatic forces (Van der Waals) are involved in the sorption process. As the temperature increases, more energy is supplied, allowing for easier breakage of these intermolecular forces. This is also supported by the fact that sorbed species in Nafion membranes can be desorbed through washing with solvents, as demonstrated by Nasef et al. whereby Nafion membranes were regenerated by 0.1 M HNO3 treatment for 16 h at 25 °C [11]. Chemisorbed species cannot readily desorb under ambient temperature conditions [34]. However, another aspect that requires consideration is that an increase in the temperature would also increase the rate of ion diffusion into the membrane. This might explain the increase in mean sorption after approximately 50 °C.

4.1.2. Sorption Efficiency-CCD

The sorption efficiency was obtained by dividing the measured sorption amount by the initial concentration of Pt-Ammine solution. Referring to Table 6, the regression model for sorption efficiency has a higher R2 value as opposed to the sorption amount, implying better model fitting as compared to the latter response. However, the significant lack-of-fit p-value of 0.012 from Table A6 indicates this model to be a poor fit. Approximately 58% of the variation in sorption efficiency can be described by the terms included in the model. Analysing the Pareto chart for sorption efficiency given in Figure 10, it is evident that four terms are significant: the linear terms of concentration (A) and temperature (D), the square term of concentration (AA) and the interaction between the concentration and temperature (AD).
Concentration
Referring to the Pareto chart in Figure 10, both the linear and square terms of concentration are significant. Based on the main effects plot in Figure 11, the sorption efficiency decreases, going from a concentration of 0 to 6 g/L. After that point, the efficiency starts increasing again. It should be noted that the regression model points to a significant interaction between the concentration and temperature (AD), meaning they are dependent on each other. A possible explanation for the decreased sorption efficiency with the increasing concentration is the reduced availability of SO3 sorption sites. At high concentrations, the Pt-Ammine aggregates reduce the contact surface area between the adsorbent and adsorbate, resulting in less sorption and a drop in the sorption efficiency. At higher concentrations, the concentration gradient would overcome this, resulting in more sorption and an increase in the sorption efficiency.
Soak time
Similar to the sorption amount, the soak time is also not a significant factor in modelling the mean sorption efficiency. From Figure 11, the soak time exhibits a slight decline in the mean sorption efficiency, going from a soak time of 30 min to 24 h. This can be attributed to the decrease in the sorption amount with the increasing soak time, attributed to a possible adsorption process followed by a desorption process.
pH
The model suggests that the pH linear term is not a significant factor (p-value of 0.097) in describing the sorption efficiency of Pt-Ammine in Nafion-117. Similarly, all interactions involving pH are also of no significance, as can be seen in Table A6.
It is evident from the R2 values and the lack-of-fit significance that the models do not adequately describe the data. Despite exhaustive attempts of factor and response transformations, the model showed no significant improvements. This implies that a second-degree polynomial CCD model cannot fit the response [24]. It is important to note that a CCD is only an approximation at best. A higher-order model is needed to better fit the data set, possibly a cubic or quartic model. Absence of higher-order interactions in the regression model could be the explanatory variable that would help better explain the variance in response with regard to the four studied factors producing better R2 values.
Temperature
Temperature is a significant factor in the sorption efficiency yield, with the mean sorption efficiency decreasing as the temperature increases from 20 °C to 60 °C. This is in line with the exothermic physisorption process—less sorbed amount with increasing temperature results in less efficient sorption, i.e., decreasing sorption efficiency.

4.2. Surface Resistance Measurement Results

A common metric used to quantify the quality of electrodes produced on IPMCs is through surface resistance measurements [15,35,36,37]. Several studies have shown a negative correlation between the blocking force and surface resistance, i.e., a lower surface resistance results in a higher blocking force [8,13,17,38]. To see if the sorption amount produces a significant difference in platinisation from the reduction of IPMCs using NaBH4, six samples were chosen, three from each replicated run, classified into a low, medium and high sorption amount, as specified in Table 7.
The samples were reduced in 100 mL of 5% NaBH4 for 1 h at 60 °C. The samples were then blotted with tissue paper and kept in silica gel overnight to remove moisture. The measured surface resistance values, given in Ω/square, are given in Table 8.
Comparing the surface resistance values for the three levels of sorption specified, the low sorption runs (Runs 17 and 48) showed significant differences as compared to the other two levels. The surface measurement values for Runs 17 and 48 are also very inconsistent across sample regions, ranging from values of approximately 12 Ω/square up to 2000 Ω/square.
The differences between the medium sorption levels (Runs 18 and 49) and high sorption levels (Runs 3 and 34) are minor. Furthermore, it can be observed that the surface resistance values are approximately consistent throughout all the sample regions for Runs 3, 18, 34 and 49.
A visual difference is observed between samples with low and high surface resistance values. Figure 12 compares appearances between Run 34 and Run 48. A distinct colour difference is evident, with Run 34 exhibiting a silver electrode colour whereas Run 48 shows a darker shade of grey. Run 34 has a consistent surface measure reading averaging approximately 2.5, as evident from Table 8, whereas Run 48 has a surface resistance measurement ranging from 11 Ω/square to 9000 Ω/square.
This seems to indicate that above a sorption value of approximately 0.5 g/L for the 10 × 50 mm film, the platinisation of the Nafion-117 film through NaBH4 reduction becomes redundant by the metric of surface resistance. This has been discussed by Rashid et al. in which they found that after a certain point, the surface resistance reached a limiting value of 1.8 Ω/square [20]. The limiting factor here could be the availability of the borohydride ions in the reduction process, as given in Equation (1) [9].
NaBH 4 + 4 Pt NH 3 4 2 + + 8 OH 4 Pt 0 + 16 NH 3 + NaBO 2 + 6 H 2 O
Stoichiometrically, nine moles of borohydride ions are needed to reduce four moles of the Pt-Ammine [39]. Limited availability of borohydride ions, which would prevent effective platinum reduction, could be due to NaBH4 hydrolysing to produce hydrogen gas [40]. To test this hypothesis, two runs with approximately consistent high sorption (above 0.5 g/L) measured across the two replicates, Run 5 and Run 36, were chosen to be further reduced in 100 mL of 10% NaBH4 for 1 h at 60 °C. The measured surface resistances by region are given in Table 9.
Despite doubling the NaBH4 concentration, the surface resistance values of Runs 5 and 36 indicate no significant differences as compared to the previous samples, potentially ruling out borohydride being the limiting factor in the platinisation.
It is worth noting the low surface resistance values obtained in Runs 3, 18, 34 and 49 are similar to the values measured by Yip et al. and Kim et al. [8,13]. However, their electroless plating processes involved several rounds of coating through the use of several reducing agents: sodium borohydride, hydrazine monohydrate and hydroxylamine hydrochloride. This study demonstrates the same surface resistance values can be obtained from only one round of coating through sodium borohydride reduction (5% concentration, 1 h stir time at 60 °C) by having the Nafion-117 films (10 × 50 mm in size) adsorb approximately 0.5 g/L of Pt-Ammine.
As evident from the SEMs given in Figure 13, discernible surface morphologies can be seen at different surface resistance values. Comparing the different surfaces, the surface SEM of Run 48 in Figure 13a shows a somewhat smooth surface, with no noticeable structures, suggesting no presence of platinum growth. This absence is most likely what is causing high surface resistance values in some regions of Run 48. Moving to Run 17 in Figure 13b, platinum growth is visible, but not as aggregated as the surface of Run 5 seen in Figure 13c. Interestingly, the surface morphology for Run 3 in Figure 13d exhibits a dense and homogenous platinum layer distribution, with crack formations. Several studies in the literature attributed high surface resistance to crack formations, which leaves gaps in the electrode layer, disrupting the interconnectedness of the platinum particles [13,20,37].
However, despite the crack formations in Run 3, further magnification of the cracks, seen in Figure 14, reveals that they are still connected, giving rise to low surface resistance values.
EDAX analysis was carried out on the surface of the samples. The weight percentages of fluorine and platinum for the different runs are given in Table 10. Comparing the weight percentages of fluorine, Run 48 has the highest value at approximately 23.42%. This signifies a larger percentage of exposed Nafion membrane area where there is little to no deposition of platinum. This is further supported by the platinum weight percentage of Run 48 being the lowest at approximately 27.73%. This is in line with the morphology seen in Figure 13a.
The platinum weight percentage for Run 5 is relatively high as compared to Runs 3 and 17. This could be an overestimation in the EDAX analysis since surface topography (e.g., ridges, valleys) can affect signal attenuation [41,42]. The cross-sections of the samples were also investigated under SEM, as shown in Figure 15. Clear distinction between the polymer and metal layer can be seen (as indicated in Figure 15), with the large darker region being the Nafion layer, and the lighter layer being the platinum layer.
The thicknesses of the platinum electrodes for Runs 48, 17, 5 and 3 were determined to be approximately 2.1 µm, 2.6 µm, 3.3 µm and 3.8 µm, respectively. It could be inferred that a thicker electrode layer equates to denser platinum deposition, resulting in lower surface resistance values, as metal clusters on the ionomer surface transform from isolated agglomerates to a uniform, fully covered film [3,15,20,43,44].

4.3. Response Surface Modelling Validation

Referring to the main effects plots for both the sorption amount and sorption efficiency, despite the not-so-well-fitted response surface model, the response seems to indicate a high sorption amount and high sorption efficiency at higher concentrations of Pt-Ammine, lower pH and lower temperature with the soak time not indicating significant effects on both of the responses. To verify this, three samples were made according to the following settings: concentration of 1.0 g/L, soak time of 24 h, pH of 3 and temperature of approximately 20 °C. The sorption results are given in Table 11.
All the samples recorded more than 0.5 g/L sorption, with the lowest sorption efficiency being 64.28% and the highest being 93.37%. The huge discrepancy in the sorption amount and efficiency between the samples could be attributed to either dilution inaccuracies or non-uniform membrane properties between samples. As demonstrated earlier, above a 0.5 g/L sorption, the platinisation of the IPMCs becomes redundant by the surface resistance metric and excellent values were obtained. Thus, it could be concluded that for the platinisation of the 10 × 50 mm IPMC samples, the recommended configurations for the optimised Nafion-117 sorption of Pt-Ammine are as follows: 1.0 g/L Pt-Ammine concentration, 24 h soak time, pH of 3 and temperature of approximately 20 °C.

4.4. Limitations and Recommendations

This study mainly looked at the effects of external parameters (concentration, pH, soak time, temperature) on the membrane sorption amount and efficiency of Pt-Ammine. However, membrane properties such as their ion-exchange capacity and degree of saturation could also influence the responses. This necessitates further investigation considering the membrane properties.
A potential challenge faced was the evaporation of the Pt-Ammine solution, more specifically the evaporation of water, leaving behind a more concentrated Pt-Ammine solution. Especially for the mass production of IPMCs where big batches of the Pt-Ammine solution are involved, an evaporation study is vital to ensure no significant inaccuracies with the concentrations of the Pt-Ammine.
Another issue with the process is the possible contamination of the Pt-Ammine solution with more Pt-Ammine when using the same pipettor for the whole process. It is recommended to use single-use pipette tips to avoid cross-contamination. If using a single pipette tip for the whole process, ensure to rinse the pipette with deionised water between each sample. Since the process deals with high concentrations of Pt-Ammine, even small amounts of contamination could cause the final reading to be inaccurate, especially in the dilution process. This would lead to AA readings detecting higher concentrations of Pt-Ammine than the initial concentration.
The pre-treatment process involving the surface roughening of the Nafion membranes could further be improved. The built apparatus only provides a uniform platform to roughen the Nafion surface using sandpaper without considering the pressure applied. An ideal roughening apparatus would have a tuneable pressure mechanism to allow for uniform pressure distribution throughout the sanding process. This is vital since the amount of material removed from the thin membranes impacts adsorption sites, varying the sorption and plating amount.
The RSM applied is aimed at optimising the electroless plating of IPMCs. However, as evident from the R2 values of the regression models, the four factors studied do not fully describe the variation in the sorption yield. The authors conclude from these findings that a more exploratory design of experiments be used to further explore the relations between the four factors in modelling the sorption response yield, such as the use of a full factorial design. However, this will cost more runs, with a three-level four-factor full factorial resulting in 81 runs for a single replicate design.

5. Conclusions

The effects of the concentration, soak time, pH and temperature on the Nafion-117 sorption of tetraammineplatinum(II) chloride in the electroless plating of IPMCs were explored through response surface modelling (RSM). Despite the poor-fit models for both responses, sorption amount and sorption efficiency, the RSM provided key insights into the sorption behaviour with regard to the four factors studied. With regard to the mean sorption amount, an increase in the Pt-Ammine concentration results in a sorption amount increase. The soak time going from 30 min to 24 h shows no significant changes. Both the pH and temperature responses exhibited quadratic responses with regard to the sorption amount. Possible explanations for their behaviour were discussed. Looking at the sorption efficiency, an increase in the concentration shows a drop in the sorption efficiency, whereas not much change can be seen with an increase in the soak time. Both the pH and temperature responses for the sorption efficiency show a similar quadratic behaviour to their sorption amount counterparts. Possible reasonings for this were discussed. This study found that above a 0.5 g/L sorption, the platinisation of the 10 × 50 mm IPMCs by sodium borohydride reduction becomes redundant by the surface resistance metric and excellent values were obtained, comparable to measurements reported in the literature. However, the excellent surface resistance values reported in this study were obtained through only one round of coating, as compared to the literature having to utilise multiple rounds of coating and multiple reducing agents to yield similar results. Varying surface resistance values were attributed to discernible surface morphologies and differing electrode layer thicknesses. The recommended configurations for the optimised Nafion-117 sorption of Pt-Ammine in the platinisation of IPMCs are as follows: 1.0 g/L Pt-Ammine concentration, 24 h soak time, pH of 3 and temperature of approximately 20 °C.

Author Contributions

Conceptualisation, E.M. and J.G.L.; methodology, E.M.; formal analysis, E.M.; investigation, E.M.; resources, J.G.L. and C.L.H.; writing—original draft preparation, E.M.; writing—review and editing, E.M, G.A., S.R., C.L.H. and J.G.L.; visualisation, E.M.; supervision, J.G.L. and C.L.H.; project administration, E.M. and J.G.L.; funding acquisition, J.G.L. and C.L.H. All authors have read and agreed to the published version of the manuscript.

Funding

This publication has emanated from research conducted with the financial support of the Presidents Doctoral Scholarship scheme from the Technological University of the Shannon.

Data Availability Statement

The original contributions presented in the study are included in the article; further inquiries can be directed to the corresponding author.

Acknowledgments

Thank you to Golnoosh Abdeali for SEM and EDAX analysis, Sean Reidy for AAS training and support and Daniel Fitzpatrick for SEM samples preparations. Special thanks to Ciara Stynes, Aaron Maloney and Caolan Jameson for fruitful discussions on DOE and perplexing results.

Conflicts of Interest

The authors declare no conflicts of interest.

Appendix A

Table A1. Uncoded DSD matrix and results.
RunConc. (g/L)Soak Time (Hour)pHTemp. (°C)Sorption Amount (g/L)Sorption Efficiency (%)
14.252411601.08625.559
24.250.53201.13526.708
3812.2511200.5677.085
40.512.253600.42885.559
58247600.87410.922
60.50.57200.11823.610
780.511400.80410.050
80.5243400.32264.351
980.53600.90911.358
100.52411200.39178.164
118243200.7349.178
120.50.511600.15030.028
134.2512.257400.52812.427
Table A2. Sorption amount—DSD model ANOVA.
SourceDFAdj SSAdj MSF-Valuep-Value
Model81.279550.15994410.640.018
Linear40.676070.16901811.250.019
Conc10.614410.61441240.880.003
ST10.008460.0084630.560.495
pH10.028040.0280371.870.244
Temp10.025160.0251601.670.265
Square20.467840.23391815.560.013
Conc*Conc10.208730.20873413.890.020
pH*pH10.232730.23273315.490.017
2-Way Interactions20.166380.0831905.540.070
Conc*Temp10.092540.0925436.160.068
ST*Temp10.060010.0600063.990.116
Error40.060120.015029
Total121.33967
Table A3. Sorption efficiency—DSD model ANOVA.
SourceDFAdj SSAdj MSF-Valuep-Value
Model68304.901384.1511.400.005
Linear46430.371607.5913.250.004
Conc15434.545434.5444.780.001
ST1746.85746.856.150.048
pH1214.07214.071.760.232
Temp134.9034.900.290.611
Square1846.38846.386.970.039
pH*pH1846.38846.386.970.039
2-Way Interactions11028.161028.168.470.027
pH*Temp11028.161028.168.470.027
Error6728.22121.37
Total129033.12
Table A4. Uncoded CCD matrix and results.
RunConc. (g/L)Soak Time (Hour)pHTemp. (°C)Sorption Amount (g/L)Sorption Eff. (%)
12.3756.3755301.42660.061
26.1256.3755303.22952.712
32.37518.1255301.34056.430
46.12518.1255303.01649.234
52.3756.3759301.23451.945
66.1256.3759302.44239.876
72.37518.1259301.14248.101
86.12518.1259301.89530.932
92.3756.3755500.57924.394
106.1256.3755502.60042.443
112.37518.1255500.78733.150
126.12518.1255502.40739.296
132.3756.3759500.32613.715
146.1256.3759502.15335.155
152.37518.1259500.0773.249
166.12518.1259500.80913.209
170.512.257400.28557.087
18812.257400.5386.730
194.250.57400.73517.289
204.25247400.70916.692
214.2512.253401.55036.471
224.2512.2511401.74040.947
234.2512.257201.49635.208
244.2512.257601.27730.043
254.2512.257401.24829.354
264.2512.257401.39932.912
274.2512.257401.18427.862
284.2512.257401.12126.370
294.2512.257401.15527.174
304.2512.257401.45334.178
314.2512.257401.39632.851
322.3756.3755301.26453.208
336.1256.3755301.31221.421
342.37518.1255301.29554.541
356.12518.1255301.25720.517
362.3756.3759301.16949.212
376.1256.3759301.19319.483
382.37518.1259301.28053.875
396.12518.1259301.05917.288
402.3756.3755500.99541.885
416.1256.3755501.05917.288
422.37518.1255500.99541.885
436.12518.1255501.14618.709
442.3756.3759500.92438.888
456.1256.3759500.90914.835
462.37518.1259500.89237.556
476.12518.1259500.81413.285
480.512.257400.27855.627
49812.257400.4986.222
504.250.57400.56013.180
514.25247400.3397.969
524.2512.253400.59213.925
534.2512.2511400.60814.297
544.2512.257200.63915.042
554.2512.257600.44210.389
564.2512.257400.43410.203
574.2512.257400.3317.783
584.2512.257400.2756.481
594.2512.257400.1172.758
604.2512.257401.02424.090
614.2512.257400.97122.844
624.2512.257400.99423.378
Table A5. Sorption amount—CCD model ANOVA (after model reduction).
SourceDFAdj SSAdj MSF-Valuep-Value
Model1113.03681.185164.380.000
Blocks14.70924.7092417.410.000
Linear45.86651.466625.420.001
Conc13.26613.2660612.080.001
ST10.19990.199940.740.394
pH10.74450.744502.750.103
Temp11.65601.655976.120.017
Square31.83400.611332.260.093
Conc*Conc10.08720.087210.320.573
pH*pH11.16361.163634.300.043
Temp*Temp10.60300.603052.230.142
2-Way Interactions30.62700.209010.770.515
Conc*ST10.17800.177980.660.421
Conc*pH10.30310.303061.120.295
ST*pH10.14600.146010.540.466
Error5013.52180.27044
Lack-of-Fit3812.50290.329023.880.008
Pure Error121.01890.08491
Total6126.5586
Table A6. Sorption efficiency—CCD model ANOVA (after model reduction).
SourceDFAdj SSAdj MSF-Valuep-Value
Model129234.0769.505.650.000
Blocks11422.81422.8010.450.002
Linear45575.41393.8510.240.000
Conc13604.23604.2426.470.000
ST167.467.400.500.485
pH1390.3390.302.870.097
Temp11513.41513.4511.120.002
Square31524.3508.093.730.017
Conc*Conc11027.41027.387.550.008
pH*pH1507.7507.743.730.059
Temp*Temp1237.9237.861.750.192
2-Way Interaction4711.5177.871.310.281
Conc*ST141.041.000.300.586
Conc*Temp1573.0572.984.210.046
ST*pH166.066.020.480.490
pH*Temp131.531.490.230.633
Error496671.6136.16
Lack-of-Fit376107.6165.073.510.012
Pure Error12564.147.01
Total6115,905.6

References

  1. Bar-Cohen, Y.; Cardoso, V.F.; Ribeiro, C.; Lanceros-Méndez, S. Chapter 8—Electroactive Polymers as Actuators. In Advanced Piezoelectric Materials, 2nd ed.; Uchino, K., Ed.; Woodhead Publishing in Materials; Woodhead Publishing: Sawston, UK, 2017; pp. 319–352. ISBN 978-0-08-102135-4. [Google Scholar]
  2. Kusoglu, A.; Weber, A.Z. New Insights into Perfluorinated Sulfonic-Acid Ionomers. Chem. Rev. 2017, 117, 987–1104. [Google Scholar] [CrossRef]
  3. De Luca, V.; Digiamberardino, P.; Di Pasquale, G.; Graziani, S.; Pollicino, A.; Umana, E.; Xibilia, M.G. Ionic Electroactive Polymer Metal Composites: Fabricating, Modeling, and Applications of Postsilicon Smart Devices. J. Polym. Sci. Part B Polym. Phys. 2013, 51, 699–734. [Google Scholar] [CrossRef]
  4. Yang, L.; Wang, H.; Zhang, X. Recent Progress in Preparation Process of Ionic Polymer-Metal Composites. Results Phys. 2021, 29, 104800. [Google Scholar] [CrossRef]
  5. Tarditi, A.M.; Bosko, M.L.; Cornaglia, L.M. 3.1 Electroless Plating of Pd Binary and Ternary Alloys and Surface Characteristics for Application in Hydrogen Separation. In Comprehensive Materials Finishing; Hashmi, M., Ed.; Elsevier: Oxford, UK, 2017; pp. 1–24. ISBN 978-0-12-803249-7. [Google Scholar]
  6. Takenaka, H.; Torikai, E. Production of an Ion-Exchange Membrane-Catalytic Electrode Bonded Material for Electrolytic Cells; NASA: Washington, DC, USA, 1980; pp. 147–150. [Google Scholar]
  7. Fedkiw, P.S.; Her, W.-H. An Impregnation-Reduction Method to Prepare Electrodes on Nafion SPE. J. Electrochem. Soc. 1989, 136, 899. [Google Scholar] [CrossRef]
  8. Kim, K.J.; Shahinpoor, M. Ionic Polymer Metal Composites: II. Manufacturing Techniques. Smart Mater. Struct. 2003, 12, 65–79. [Google Scholar] [CrossRef]
  9. Yang, L.; Zhang, D.; Zhang, X.; Tian, A.; Wang, X. Models of Displacement and Blocking Force of Ionic-Polymer Metal Composites Based on Actuation Mechanism. Appl. Phys. Mater. Sci. Process. 2020, 126, 365. [Google Scholar] [CrossRef]
  10. Oguro, K. Preparation Procedure Ion-Exchange Polymer Metal Composites (IPMC) Membranes. Available online: https://ndeaa.jpl.nasa.gov/nasa-nde/lommas/eap/IPMC_PrepProcedure.htm (accessed on 29 September 2021).
  11. Nasef, M.M.; Yahaya, A.H. Adsorption of Some Heavy Metal Ions from Aqueous Solutions on Nafion 117 Membrane. Desalination 2009, 249, 677–681. [Google Scholar] [CrossRef]
  12. Shahinpoor, M. Chapter 2: Ionic Polymer Metal Composites (IPMCs) Optimal Manufacturing. In Ionic Polymer Metal Composites (IPMCs); The Royal Society of Chemistry: London, UK, 2015; pp. 61–147. [Google Scholar]
  13. Yip, J.; Feng, L.S.; Hang, C.W.; Marcus, Y.C.W.; Wai, K.C. Experimentally Validated Improvement of IPMC Performance through Alternation of Pretreatment and Electroless Plating Processes. Smart Mater. Struct. 2010, 20, 015009. [Google Scholar] [CrossRef]
  14. Liu, R.; Her, W.-H.; Fedkiw, P.S. In Situ Electrode Formation on a Nafion Membrane by Chemical Platinization. J. Electrochem. Soc. 1992, 139, 15. [Google Scholar] [CrossRef]
  15. Tian, A.; Sun, Y.; Wang, X.; Li, J.; Zhang, X.; Wang, H. Effects of Surface Roughening Method on the Performance of Ionic Polymer Metal Composition. In Proceedings of the 2021 IEEE International Symposium on Applications of Ferroelectrics (ISAF), Sydney, Australia, 16–21 May 2021; pp. 1–4. [Google Scholar]
  16. Palmre, V.; Pugal, D.; Kim, K.J.; Leang, K.K.; Asaka, K.; Aabloo, A. Nanothorn Electrodes for Ionic Polymer-Metal Composite Artificial Muscles. Sci. Rep. 2014, 4, 6176. [Google Scholar] [CrossRef]
  17. Kim, K.J.; Lee, D.C.; Nam, J.; Hwang, T.S. Fabricating Ionic/Polyimide Membranes. U.S. Patent 11,312,851, 26 April 2022. [Google Scholar]
  18. Xu, B.; Wang, S.; Zhang, Z.; Ling, J.; Wu, X. Improving the Torsion Performance of IPMC by Changing the Electrode Separation. Sci. Rep. 2021, 11, 7639. [Google Scholar] [CrossRef]
  19. Ma, S.; Zhang, Y.; Liang, Y.; Ren, L.; Tian, W.; Ren, L. High-Performance Ionic-Polymer–Metal Composite: Toward Large-Deformation Fast-Response Artificial Muscles. Adv. Funct. Mater. 2020, 30, 1908508. [Google Scholar] [CrossRef]
  20. Rashid, M.; Jun, T.-S.; Kim, Y.S. Material Properties of the Pt Electrode Deposited on Nafion Membrane by the Impregnation–Reduction Method. J. Nanosci. Nanotechnol. 2013, 13, 3627–3633. [Google Scholar] [CrossRef] [PubMed]
  21. Allen, T.T. Introduction to Engineering Statistics and Lean Six Sigma: Statistical Quality Control and Design of Experiments and Systems; Springer: London, UK, 2018; ISBN 978-1-4471-7419-6. [Google Scholar]
  22. Scibilia, B. Besides Traditional Designs, Definitive Screening Designs Can Help Process & Product Optimization. 2008. Available online: https://blog.minitab.com/en/bruno-scibilia/definitive-screening-designs-for-products-and-processes-optimization (accessed on 29 September 2021).
  23. Surhone, L.M.; Tennoe, M.T.; Henssonow, S.F. Sparsity-of-Effects Principle; Betascript Publishing: Beau Bassin, Mauritius, 2011; ISBN 978-613-6-33178-2. [Google Scholar]
  24. Heckert, A.; Filliben, J.J.; Croarkin, C.; Hembree, B.; Guthrie, W.; Tobias, P.; Prins, J.; Trutna, L.; Spagon, P.; del Castillo, E.; et al. NIST/SEMATECH e-Handbook of Statistical Methods; National Institute of Standards and Technology: Gaithersburg, MD, USA, 2002.
  25. Yang, L.; Zhang, D.; Zhang, X.; Tian, A.; Ding, Y. Surface Roughening of Nafion Membranes Using Different Route Planning for IPMCs. Int. J. Smart Nano Mater. 2020, 11, 117–128. [Google Scholar] [CrossRef]
  26. Cho, H.-S.; Ohashi, M.; Van Zee, J.W. Absorption Behavior of Vanadium in Nafion®. J. Power Sources 2014, 267, 547–552. [Google Scholar] [CrossRef]
  27. Ghaedi, M. Adsorption: Fundamental Processes and Applications; Academic Press: Cambridge, MA, USA, 2021; ISBN 978-0-12-818808-8. [Google Scholar]
  28. Hutin, A. Difference between Isoelectric Point (IEP), Point of Zero Charge (PZC), and Isoionic Point (IIP); Zenodo: Geneve, Switzerland, 2022. [Google Scholar]
  29. Sánchez, L. Experimental Characterization of Water Sorption and Transport Properties of Polymer Electrolyte Membranes for Fuel Cells. Ph.D. Thesis, Université de Lorraine, Lorraine, France, 2012. [Google Scholar]
  30. Kusoglu, A.; Savagatrup, S.; Clark, K.T.; Weber, A.Z. Role of Mechanical Factors in Controlling the Structure–Function Relationship of PFSA Ionomers. Macromolecules 2012, 45, 7467–7476. [Google Scholar] [CrossRef]
  31. Hinatsu, J.T.; Mizuhata, M.; Takenaka, H. Water Uptake of Perfluorosulfonic Acid Membranes from Liquid Water and Water Vapor. J. Electrochem. Soc. 1994, 141, 1493. [Google Scholar] [CrossRef]
  32. Maldonado, L.; Perrin, J.-C.; Dillet, J.; Lottin, O. Characterization of Polymer Electrolyte Nafion Membranes: Influence of Temperature, Heat Treatment and Drying Protocol on Sorption and Transport Properties. J. Membr. Sci. 2012, 389, 43–56. [Google Scholar] [CrossRef]
  33. Albright, L. Albright’s Chemical Engineering Handbook; CRC Press: Boca Raton, FL, USA, 2008; ISBN 978-0-8247-5362-7. [Google Scholar]
  34. Ballantine, D.S.; Martin, S.J.; Ricco, A.J.; Frye, G.C.; Wohltjen, H.; White, R.M.; Zellers, E.T. Chapter 4—Materials Characterization. In Acoustic Wave Sensors; Ballantine, D.S., Martin, S.J., Ricco, A.J., Frye, G.C., Wohltjen, H., White, R.M., Zellers, E.T., Eds.; Applications of Modern Acoustics; Academic Press: Burlington, MA, USA, 1997; pp. 150–221. ISBN 978-0-12-077460-9. [Google Scholar]
  35. Bar-Cohen, Y.; Sherrit, S. Characterization of the Electromechanical Properties of EAP Materials. Proc. SPIE Int. Soc. Opt. Eng. 2001, 4329. [Google Scholar] [CrossRef]
  36. Bar-Cohen, Y.; Bao, X.; Sherrit, S.; Lih, S.-S. Characterization of the Electromechanical Properties of Ionomeric Polymer-Metal Composite (IPMC). Proc. SPIE Int. Soc. Opt. Eng. 2002, 4695, 286–293. [Google Scholar] [CrossRef]
  37. Ragot, P.M.; Hunt, A.; Sacco, L.N.; Sarro, P.M.; Mastrangeli, M. Manufacturing Thin Ionic Polymer Metal Composite for Sensing at the Microscale. Smart Mater. Struct. 2023, 32, 035006. [Google Scholar] [CrossRef]
  38. Shahinpoor, M.; Kim, K.J. The Effect of Surface-Electrode Resistance on the Performance of Ionic Polymer-Metal Composite (IPMC) Artificial Muscles. Smart Mater. Struct. 2000, 9, 543–551. [Google Scholar] [CrossRef]
  39. Rao, C.R.K.; Trivedi, D.C. Chemical and Electrochemical Depositions of Platinum Group Metals and Their Applications. Coord. Chem. Rev. 2005, 249, 613–631. [Google Scholar] [CrossRef]
  40. Luty-Błocho, M.; Wojnicki, M.; Csapo, E.; Fitzner, K. On the Rate of Interaction of Sodium Borohydride with Platinum (IV) Chloride Complexes in Alkaline Media. Materials 2021, 14, 3137. [Google Scholar] [CrossRef] [PubMed]
  41. Lancon, T. The Role of Neutron Activation Analysis in the Pathological Evaluation of Silver-Eluting Biomedical Devices in Biological Matrices. Master’s Thesis, Texas A&M University, College Station, TX, USA, 2014. [Google Scholar]
  42. Newbury, D.E.; Ritchie, N.W.M. Is Scanning Electron Microscopy/Energy Dispersive X-ray Spectrometry (SEM/EDS) Quantitative? Scanning 2013, 35, 141–168. [Google Scholar] [CrossRef]
  43. Cho, W.-H.; Kei, C.-C.; Liu, B.-H.; Yu, Y.-S.; Chen, F.-Z. Platinum Growth Analysis in Atomic Layer Deposition Using In-Situ Resistance Measurement. In Proceedings of the 2016 IEEE International Instrumentation and Measurement Technology Conference Proceedings, Taipei, Taiwan, 23–26 May 2016; pp. 1–4. [Google Scholar]
  44. Schlupp, M.V.F.; Wehrle, M.M.; Kunze, K.; Remhof, A.; Vogt, U.F. Platinum Thin-Film Electrodes Prepared by a Cost-Effective Chemical Vapor Deposition Technique. Adv. Eng. Mater. 2016, 18, 1200–1207. [Google Scholar] [CrossRef]
Figure 1. Steps in the electroless plating of IPMCs.
Polymers 16 02338 g001
Figure 2. Nafion membrane sanding apparatus schematic.
Polymers 16 02338 g002
Figure 3. Summarised sample preparation steps for DOE.
Polymers 16 02338 g003
Figure 4. Regions for surface resistance measurements.
Polymers 16 02338 g004
Figure 5. DSD Pareto chart of the standardised effects for sorption amount.
Polymers 16 02338 g005
Figure 6. DSD Pareto chart of the standardised effects for sorption efficiency.
Polymers 16 02338 g006
Figure 7. CCD Pareto chart of the standardised effects for sorption amount.
Polymers 16 02338 g007
Figure 8. Main effects plot for sorption amount.
Polymers 16 02338 g008
Figure 9. PZC determination through pH drift at 0.5 g/L.
Polymers 16 02338 g009
Figure 10. CCD Pareto chart of the standardised effects for sorption efficiency.
Polymers 16 02338 g010
Figure 11. Main effects plot for sorption efficiency.
Polymers 16 02338 g011
Figure 12. Visual difference between Run 34 (left) and Run 48 (right).
Polymers 16 02338 g012
Figure 13. Surface SEMs of IPMCs at 5 k magnification, descendingly sorted by surface resistance—(a) Run 48, (b) Run 17, (c) Run 5 and (d) Run 3.
Polymers 16 02338 g013
Figure 14. SEM of Run 3 crack formation at 30 k magnification.
Polymers 16 02338 g014
Figure 15. Cross-sectional SEMs of (a) Run 48, (b) Run 17, (c) Run 5 and (d) Run 3 at 700 magnification.
Polymers 16 02338 g015
Table 1. Ion-exchange configurations found in the literature.
Platinum Complex Solution Impregnation
Author(s)Membrane SizeConcentrationSoak TimepH
Adjustment
Temp. °C
Kim et al., 2003 [8]5 × 5 cmNS 1>1 h5% NH4OH 2NS
Shahinpoor, 2015 [12]5 × 5 cmNS2–4 h30% NH4OH40–60
Yip et al., 2011 [13]50 × 60 mm0.5 g/LOvernight5% NH4OHNS
Liu et al., 1992 [14]1 in sides hexagon0.5–1.6 mM
(0.17–0.54 g/L)
24 hNS50
Tian et al.,
2021 [15]
30 × 10 mm0.01 M (3.34 g/L)12 hNSNS
Palmre et al., 2014 [16]50 × 10 mm15–25 mM
(5.01–8.35 g/L)
3–4 hNSNS
Kim et al., 2022 [17]0.5 × 2.5 cm0.02 M (6.68 g/L)3.5 hNSNS
Yang et al., 2020 [9]10 × 50 mm2 g/L24 hNSNS
Oguro et al., 2000 [10]30 cm22 g/L>3 h
(usually overnight)
5% NH4OHNS
Xu et al., 2021 [18]30 × 29 mm3 mg/mm214 hNSNS
Ma et al., 2020 [19]30 × 30 mm0.5 wt%24 hNSNS
Rashid et al., 2013 [20]15 mm dia. circle5–40 mM3 hpH 12
(0.1M NaOH)
5, 25, 50
1 NS denotes not specified, 2 NH4OH is ammonium hydroxide.
Table 2. AAS configurations.
VariableSettings
Wavelength265.9 nm
Instrument ModeAbsorbance
Measurement ModeIntegrate
Slit Width0.2 nm
Lamp Current5 mA
Background CorrectionBC Off
Measurement Time5.0 s
Pre-Read Delay5.0 s
Flame TypeAir/Acetylene
Air Flow13.50 L/min
Acetylene Flow2.0 L/min
Burner Height13.5 mm
Table 3. Process variables and their levels for the screening design.
Screening Design Factor Configurations
FactorsUnitsNotationFactor Levels
LowHigh
Concentration of Platinum Complexg/LConc.0.58
Soak TimehoursST0.524
pH-pH311
Temperature°CTemp.2060
Table 4. Variance components for Gage R&R.
SourceVariance Components (VarComp)% Contribution (of VarComp)
Total Gage R&R0.00000200.03
Repeatability0.00000200.03
Part-To-Part0.007314699.97
Total Variation0.0073165100.00
Table 5. Gage evaluation.
SourceStandard Deviation (SD)Study Var. (6 × SD)% Study Variation
Total Gage R&R0.00139810.0083881.63
Repeatability0.00139810.0083881.63
Part-To-Part0.08552540.51315299.99
Total Variation0.08553680.513221100.00
Table 6. Regression equations and R2 values for sorption amount and efficiency.
ResponseUncoded Regression EquationR2 (%)
Sorption Amount3.22 + 0.498 Conc + 0.0580 ST − 0.378 pH − 0.1003 Temp
− 0.0110 Conc*Conc + 0.0355 pH*pH + 0.001021 Temp*Temp − 0.00677 Conc*ST − 0.0260 Conc*pH − 0.00575 ST*pH
49.09
Sorption Efficiency175.4 − 22.58 Conc + 1.09 ST − 8.31 pH − 2.80 Temp + 1.199 Conc*Conc + 0.741 pH*pH + 0.0203 Temp*Temp − 0.103 Conc*ST + 0.226 Conc*Temp − 0.122 ST*pH − 0.050 pH*Temp58.05
Table 7. Chosen runs for further reduction using NaBH4.
RunConc. (g/L)Soak Time (Hour)pHTemp. (°C)Sorption Amount (g/L)Sorption Level
170.512.257400.285Low
480.512.257400.278Low
18812.257400.538Medium
49812.257400.498Medium
32.37518.1255301.340High
342.37518.1255301.295High
Table 8. Surface resistance values for Runs 3, 17, 18, 34, 48 and 49.
Low Sorption (Ω/Square)
Run 17 Run 48
15.47439.17160.93111.0118395.46519995.370
14.04929.49940.76415.327639.0666645.429
12.14827.45253.15016.1202768.1559217.344
Medium Sorption (Ω/Square)
Run 18 Run 49
3.0712.6983.3122.3662.4412.613
3.1382.8933.1162.4001.8543.187
2.8762.5032.3812.4402.3942.842
High Sorption (Ω/Square)
Run 3 Run 34
2.5592.5922.3952.6762.7022.426
2.3602.4202.3062.8912.0762.157
2.2272.4182.3472.6932.8682.594
Table 9. Surface resistance values for Runs 5 and 36.
Run 5 (Ω/square)Run 36 (Ω/square)
4.7024.2543.4873.0933.2383.331
5.7063.5383.4032.7752.7932.932
4.2894.0973.5772.8802.8533.113
Table 10. Surface EDAX analysis of Runs 3, 5, 17 and 48.
Element Weight (%)Run 3Run 5Run 17Run 48
Fluorine0.773.316.0523.42
Platinum47.6274.2450.9827.73
Table 11. Sorption amount and efficiency of validation samples.
SampleSorption Amount (g/L)Sorption Efficiency (%)
10.64364.281
20.93493.371
30.91791.722
Disclaimer/Publisher’s Note: The statements, opinions and data contained in all publications are solely those of the individual author(s) and contributor(s) and not of MDPI and/or the editor(s). MDPI and/or the editor(s) disclaim responsibility for any injury to people or property resulting from any ideas, methods, instructions or products referred to in the content.

