

Improving the Tribological Performance of POM through the Incorporation of Bio-Based Materials


Abstract
1. Introduction
2. Materials and Methods
2.1. Chemicals
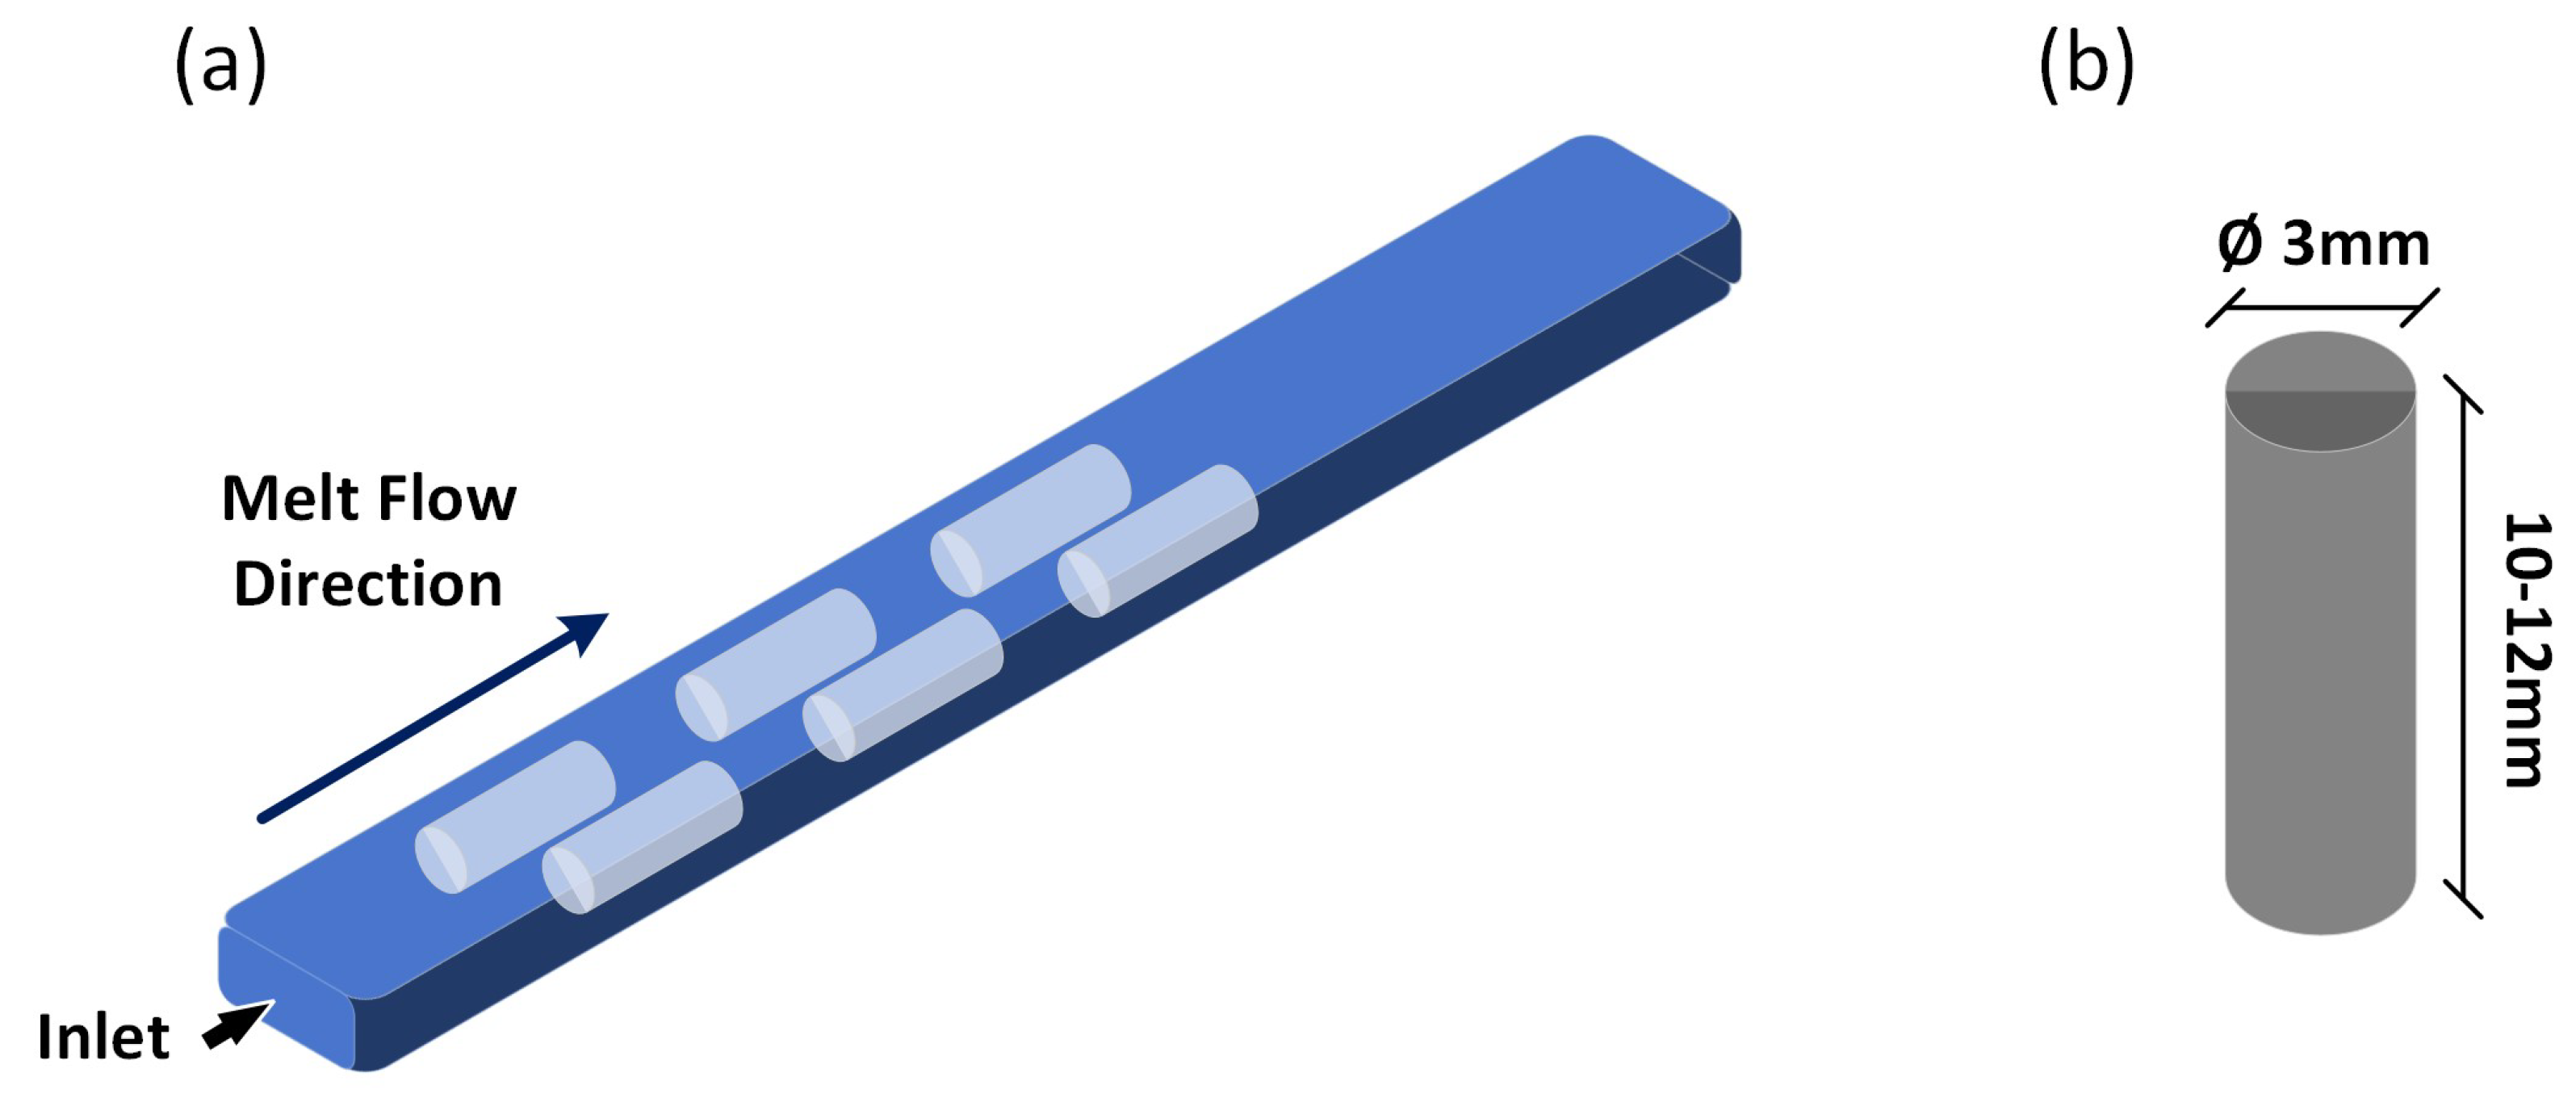
2.2. Processing
2.3. Characterizations
2.3.1. Tribological Investigations
2.3.2. Scanning Electron Microscopy
2.3.3. White Light Interferometry
2.3.4. Fourier-Transform Infrared Spectroscopy
3. Results
3.1. Tribological Performance
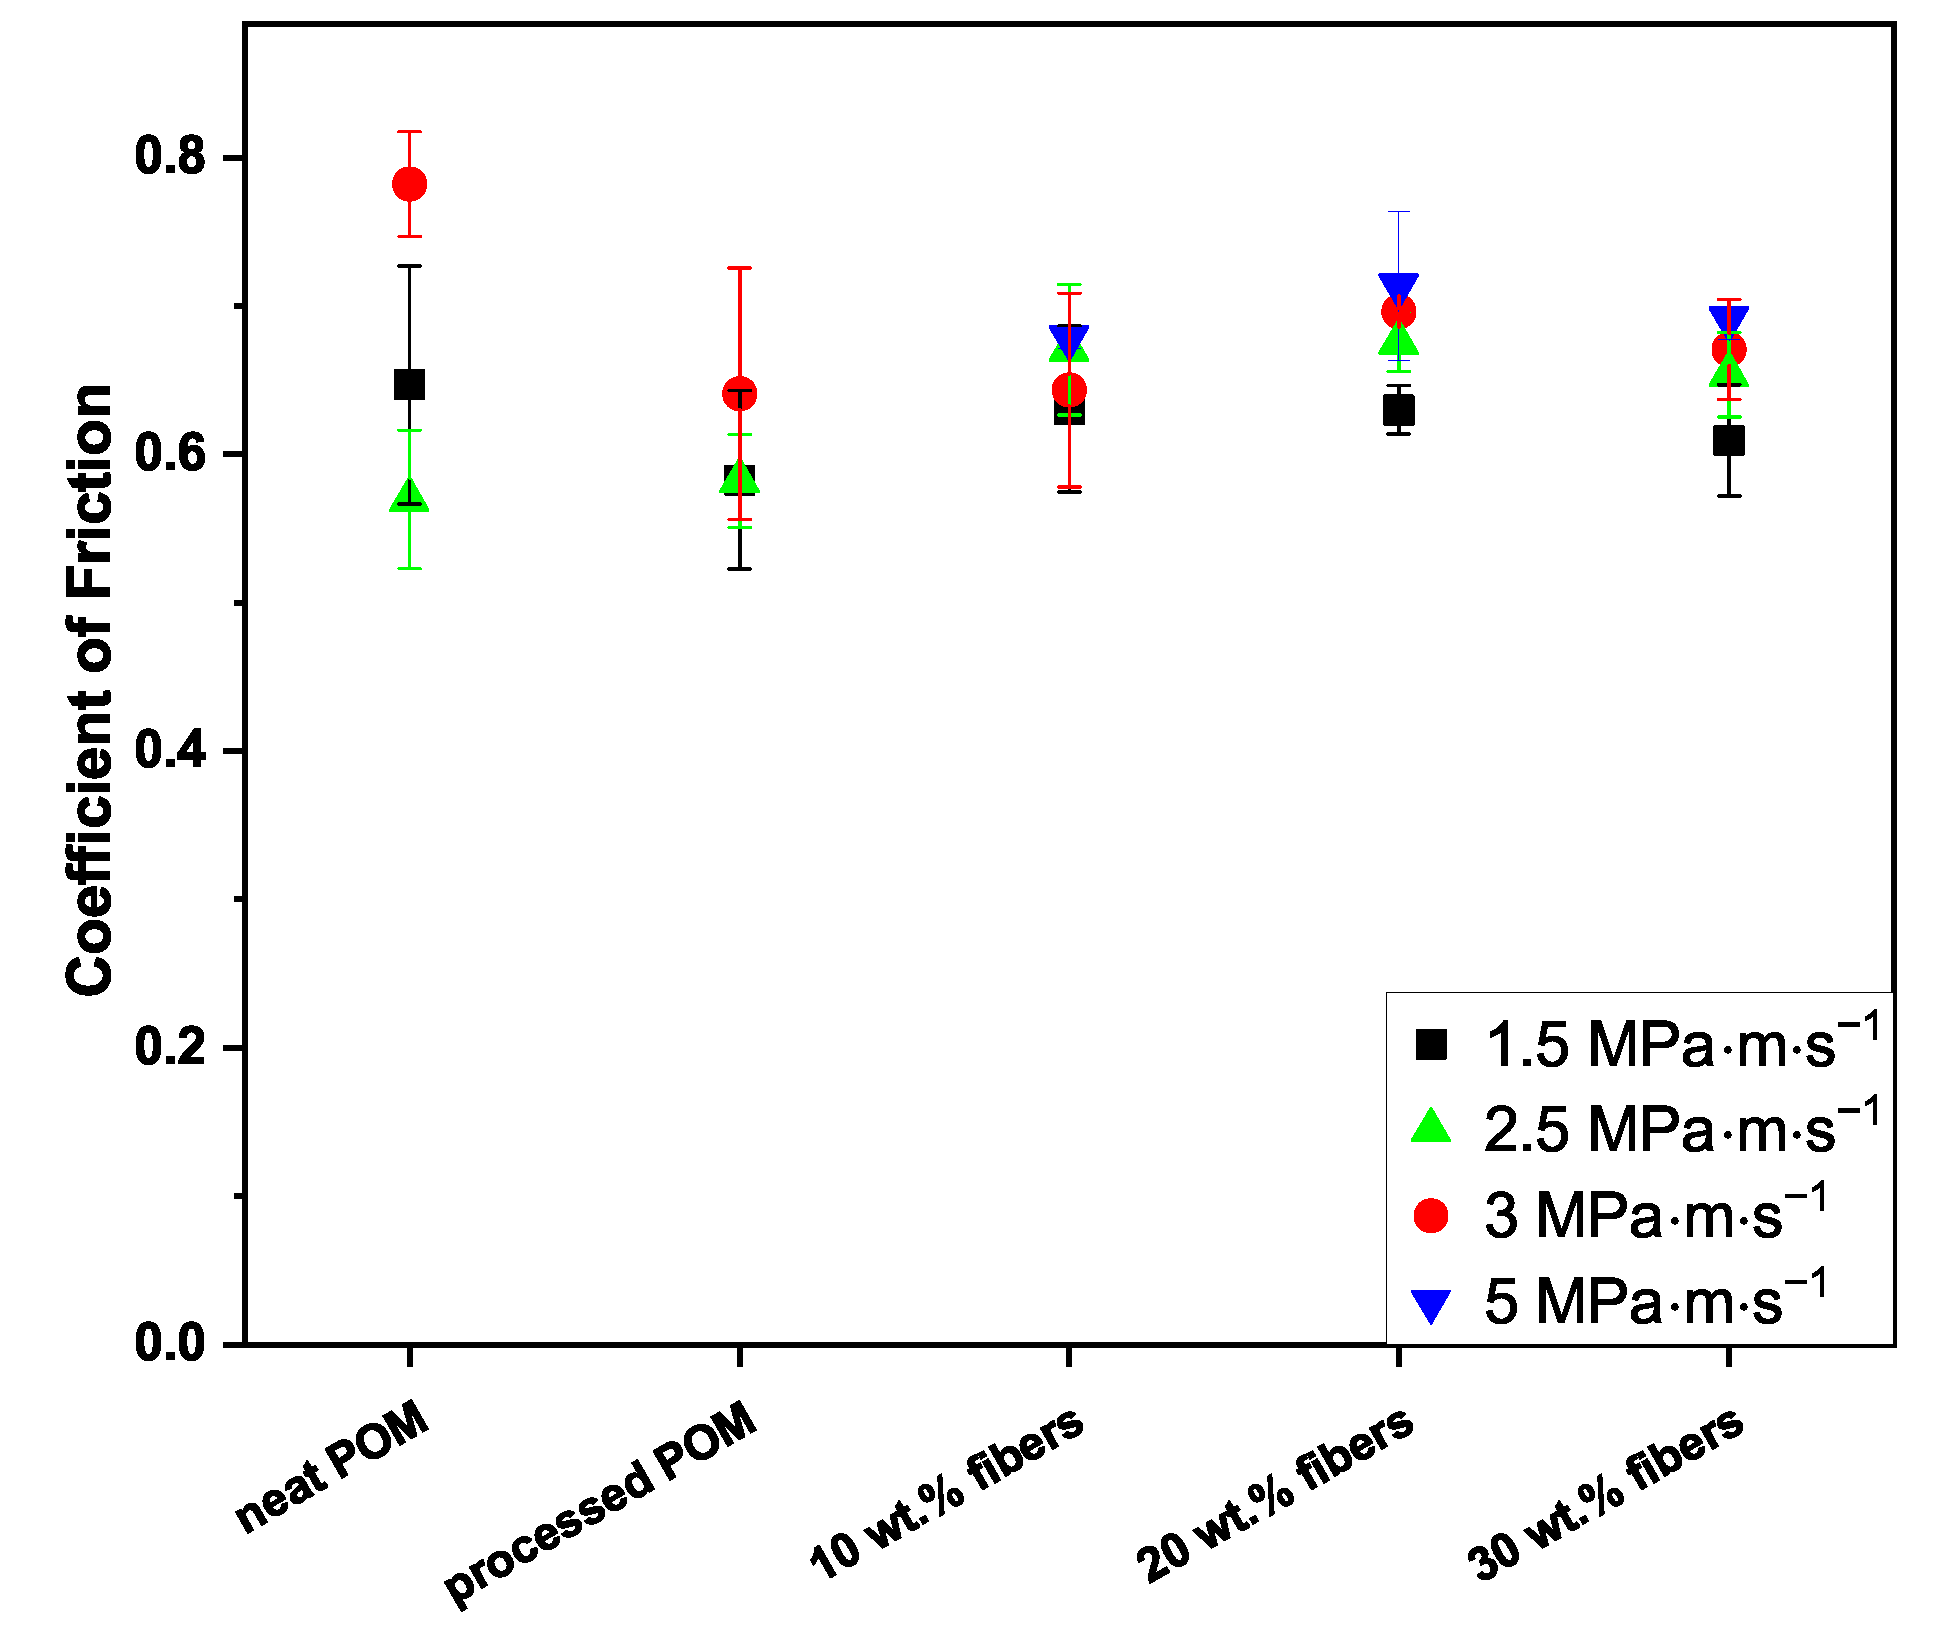
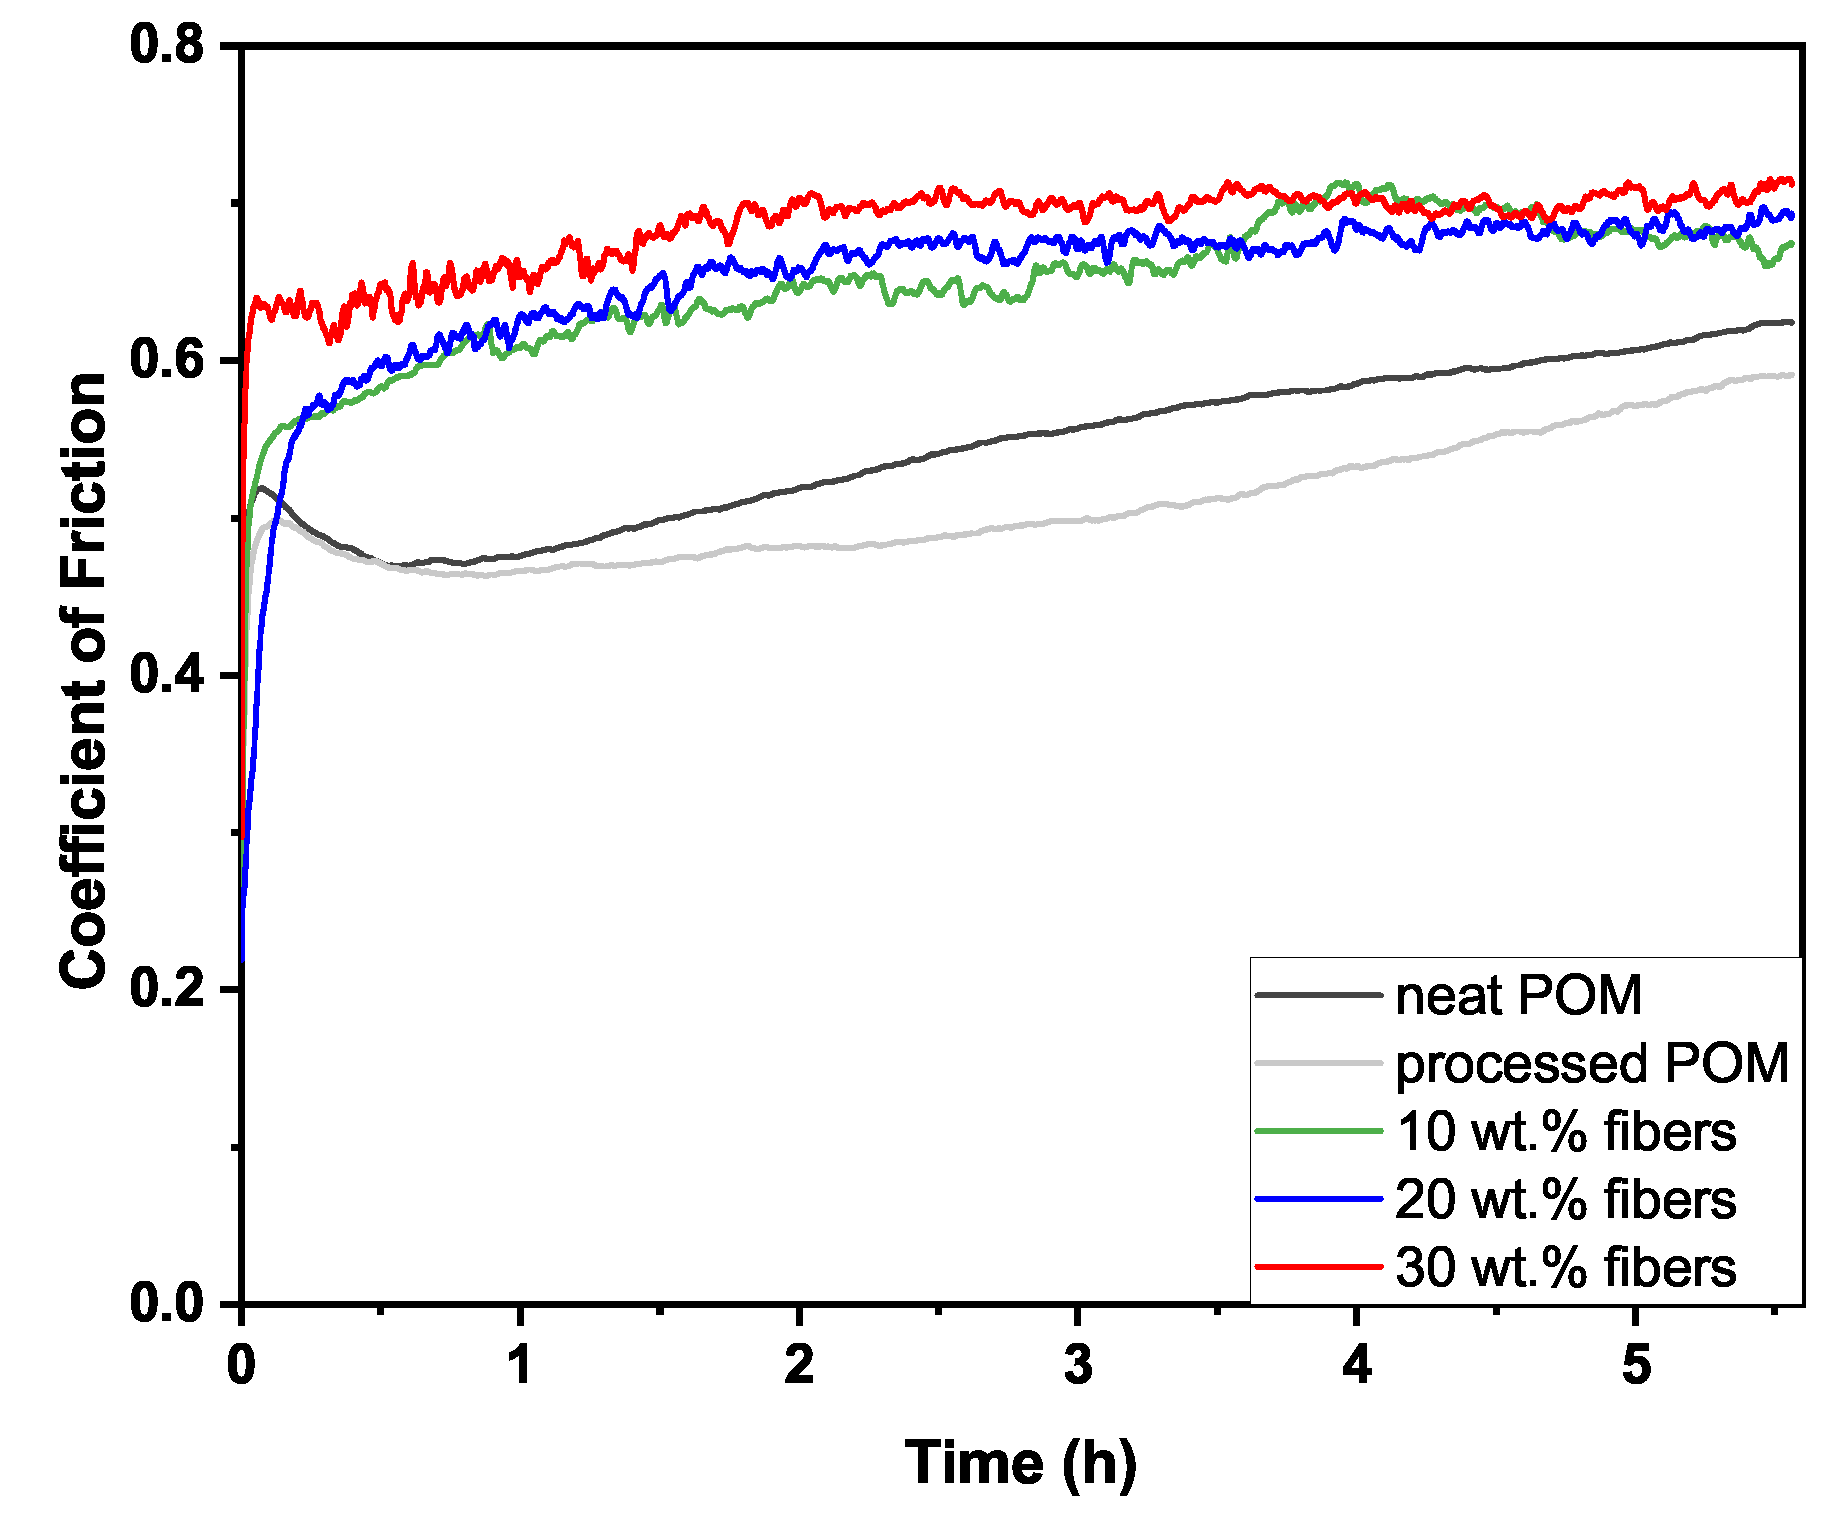
3.1.1. Friction
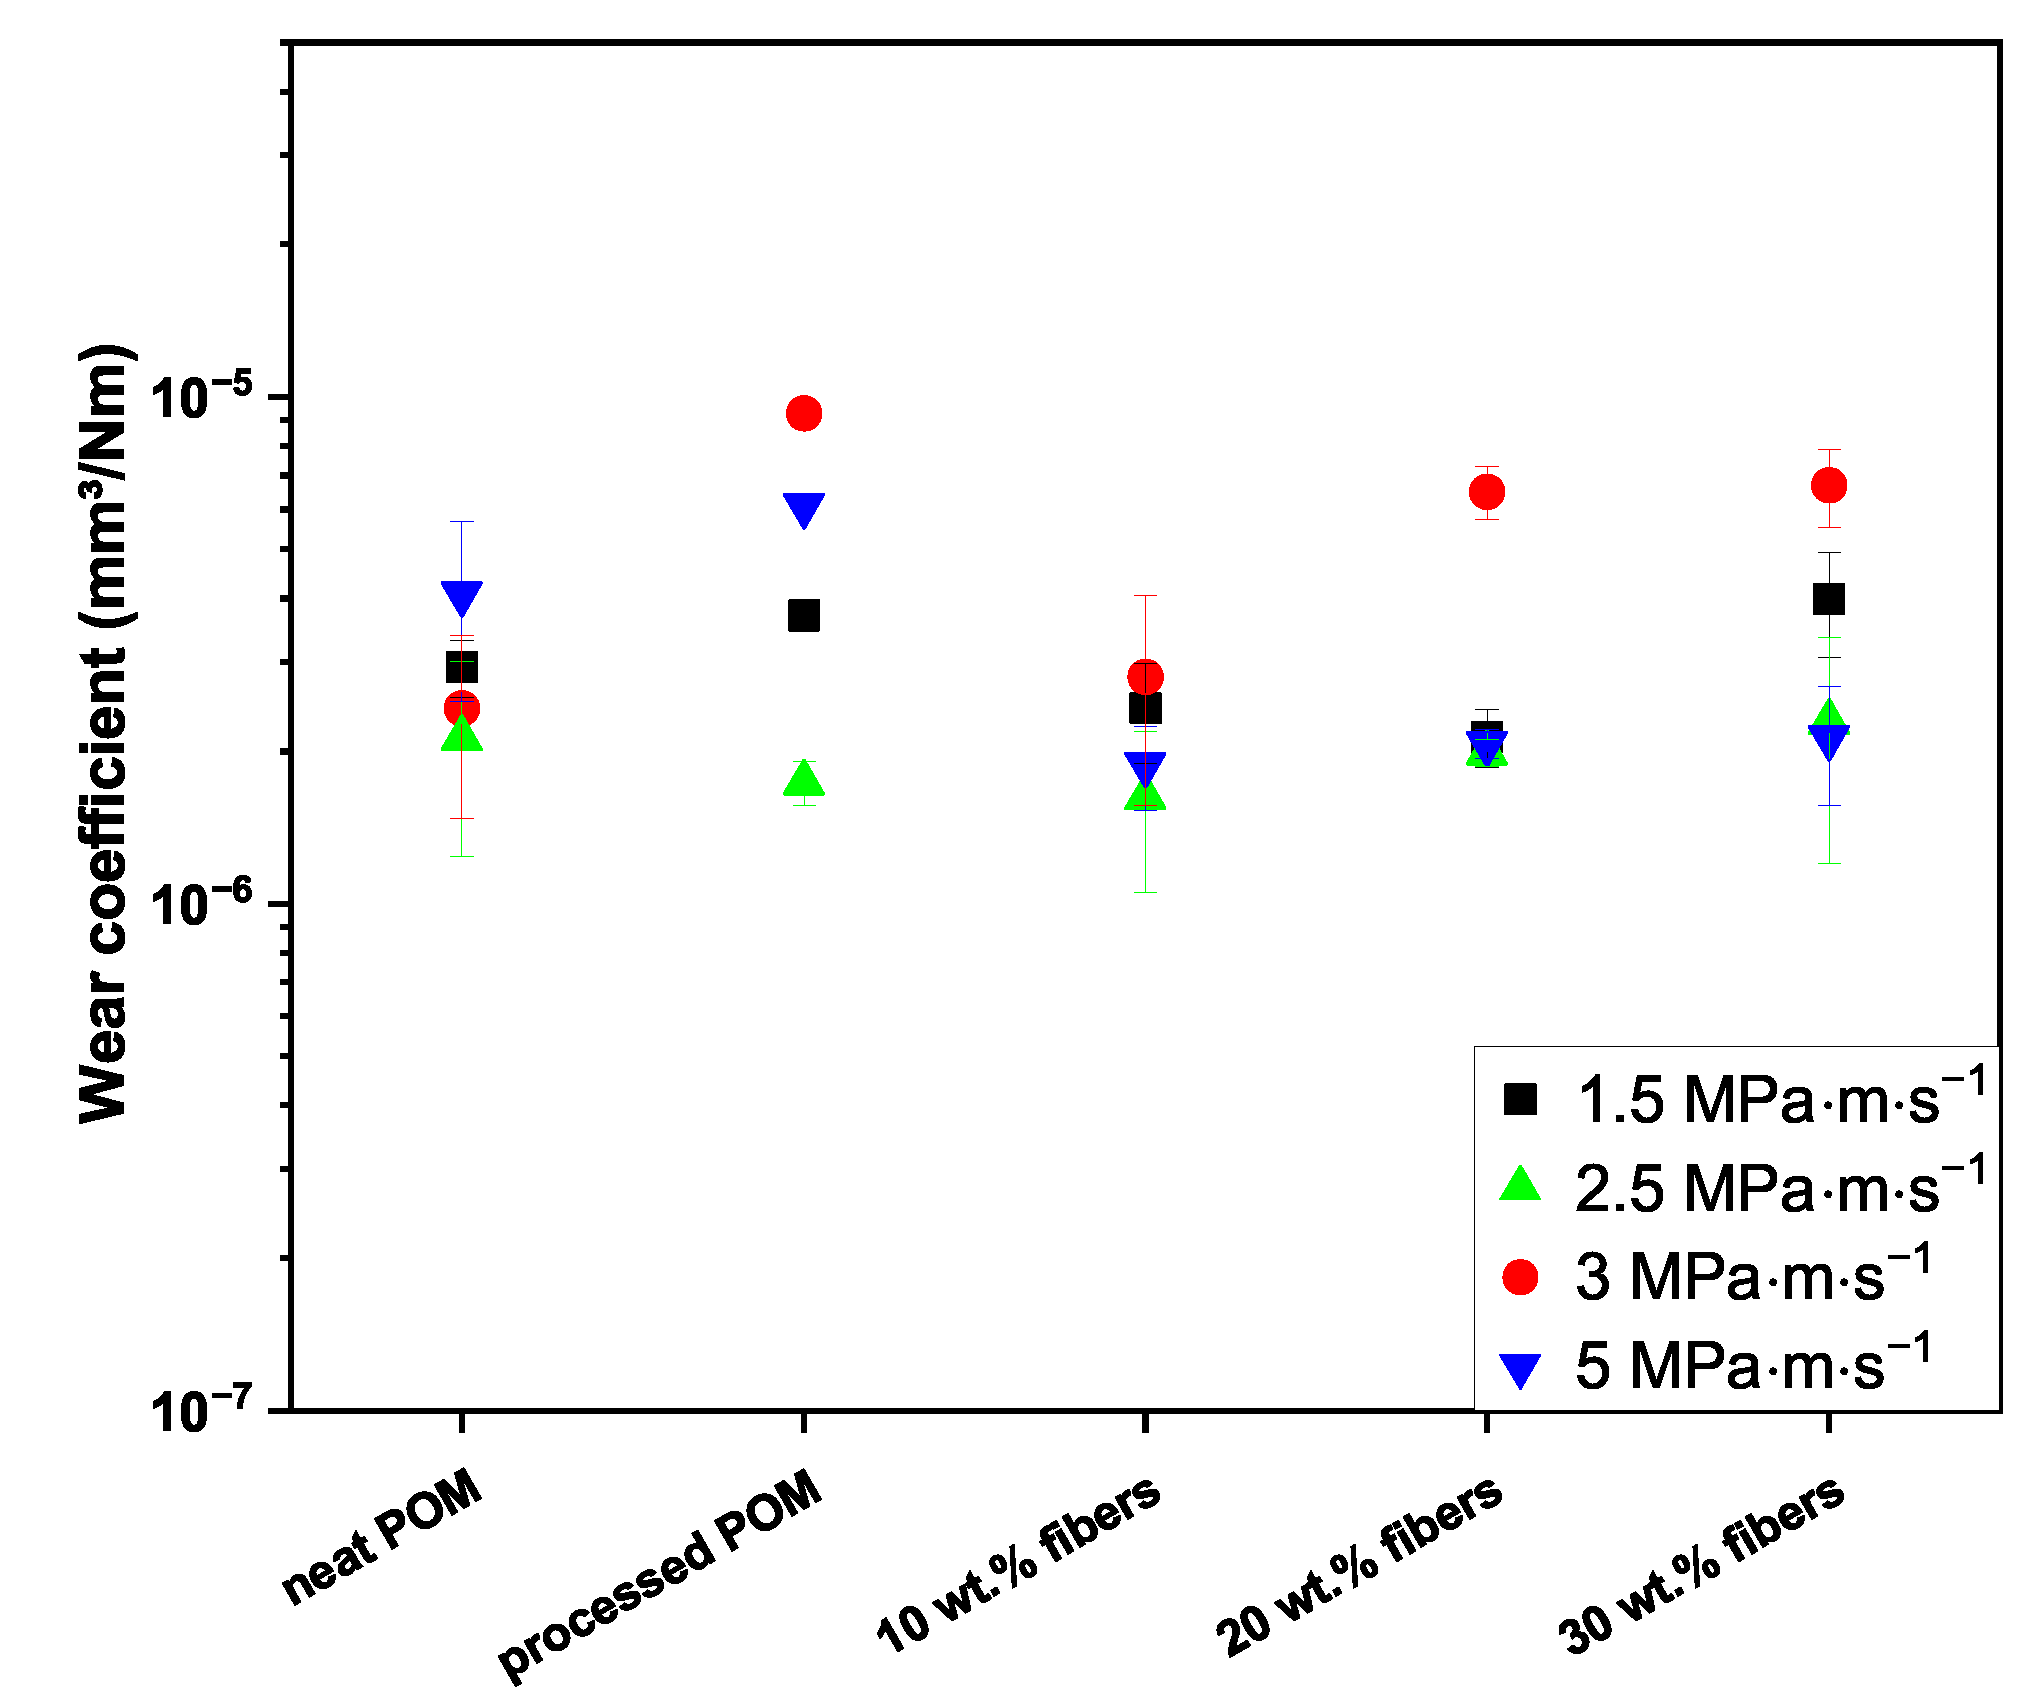
3.1.2. Wear
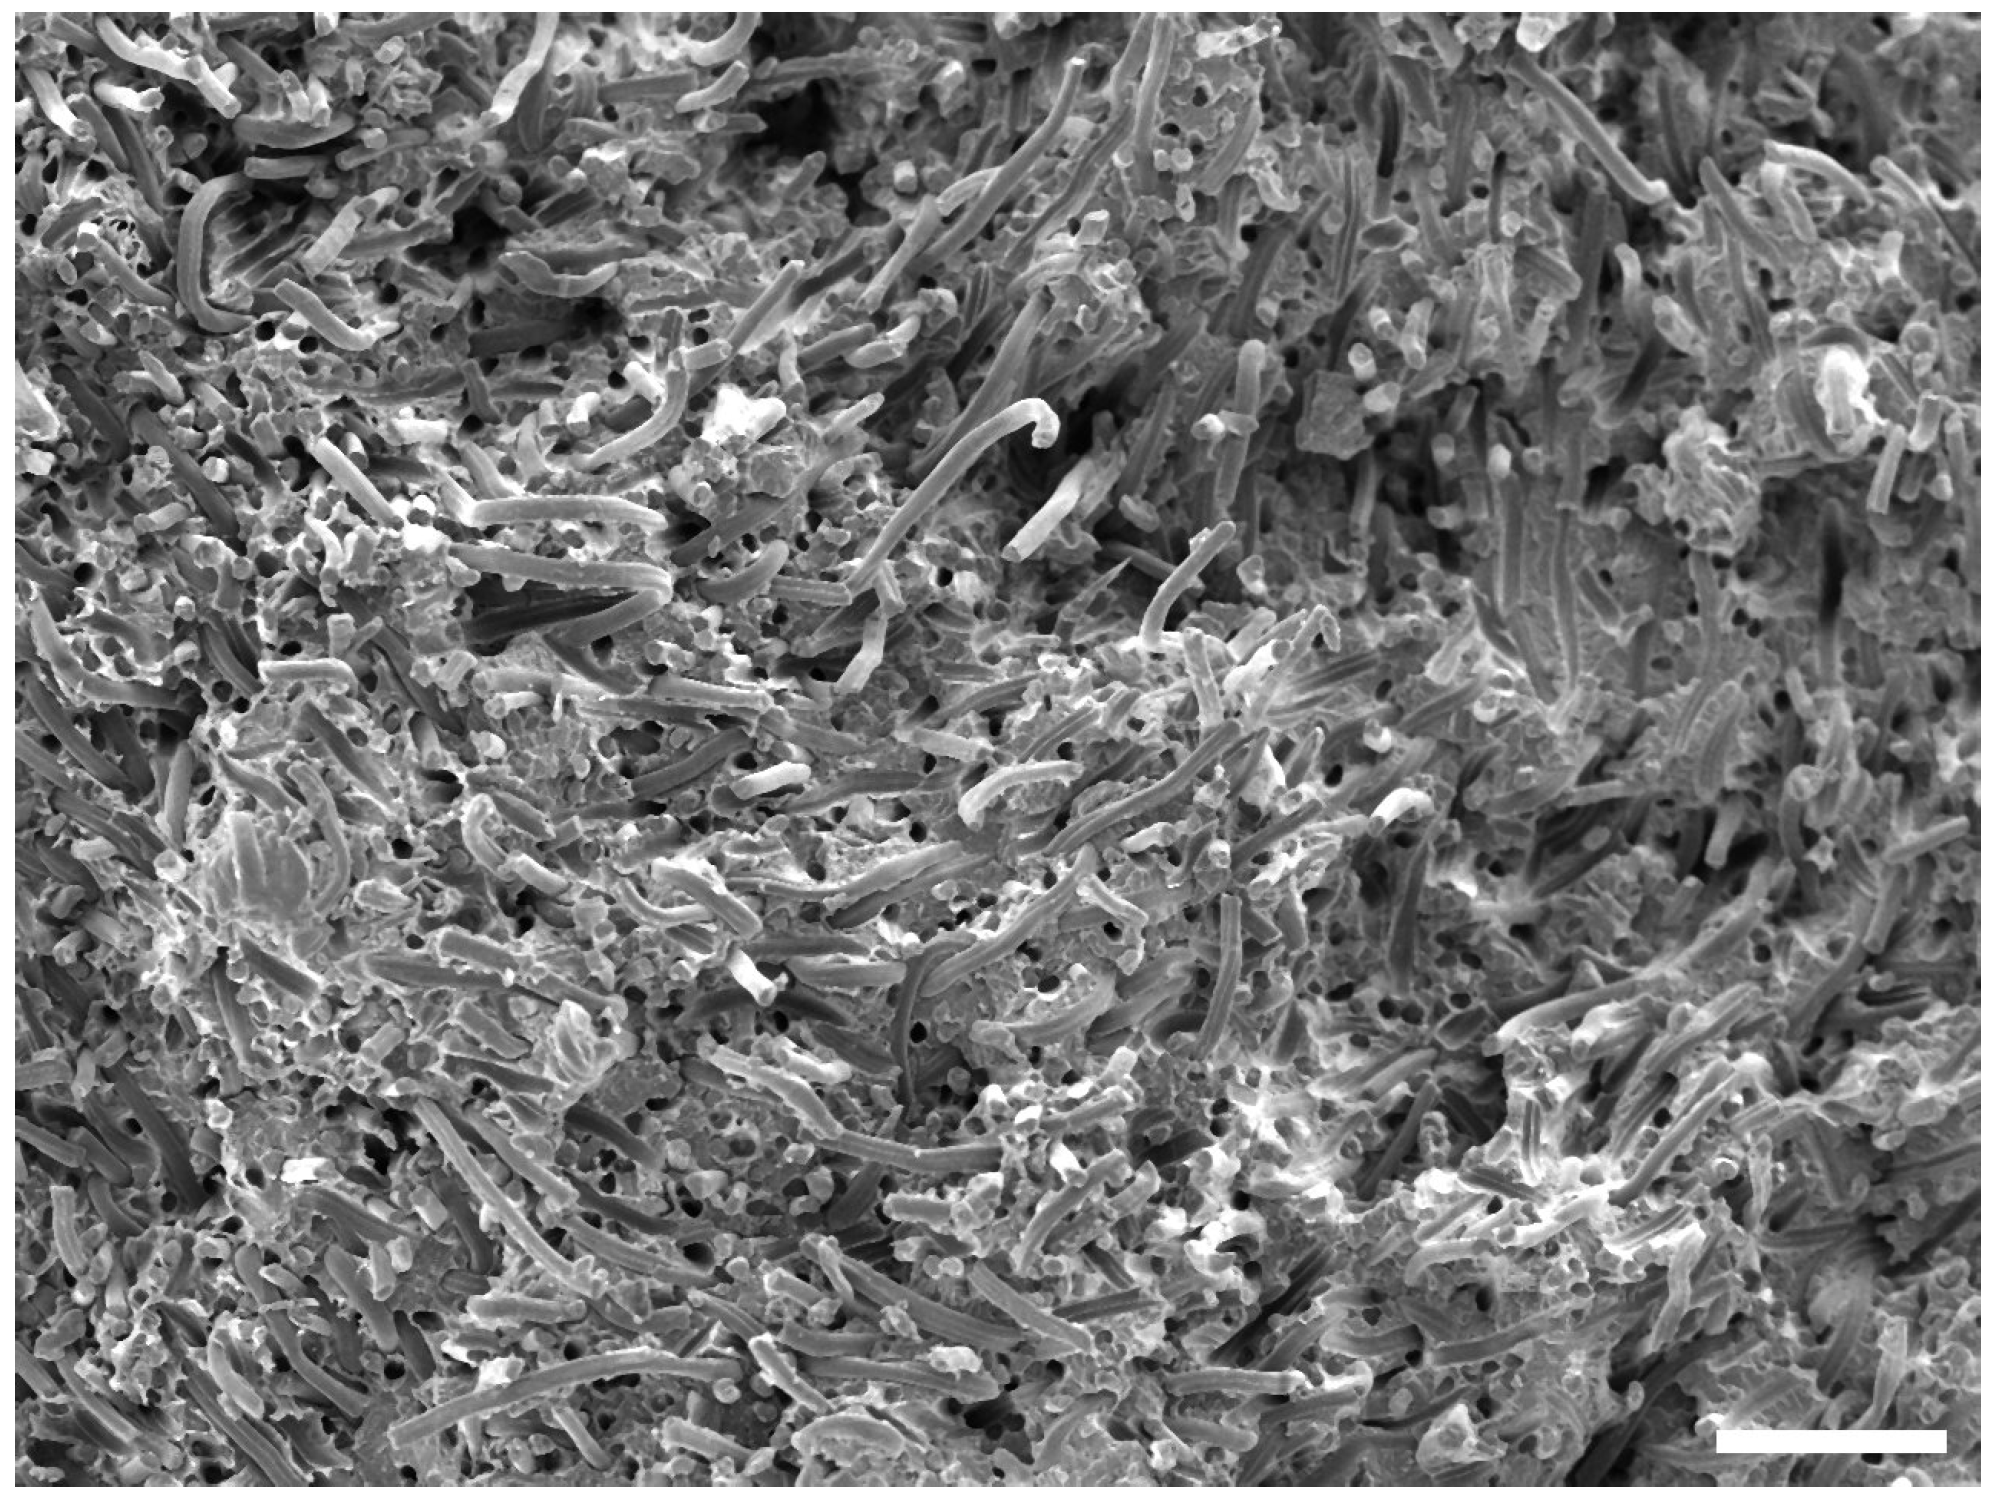
3.2. Scanning Electron Microscopy
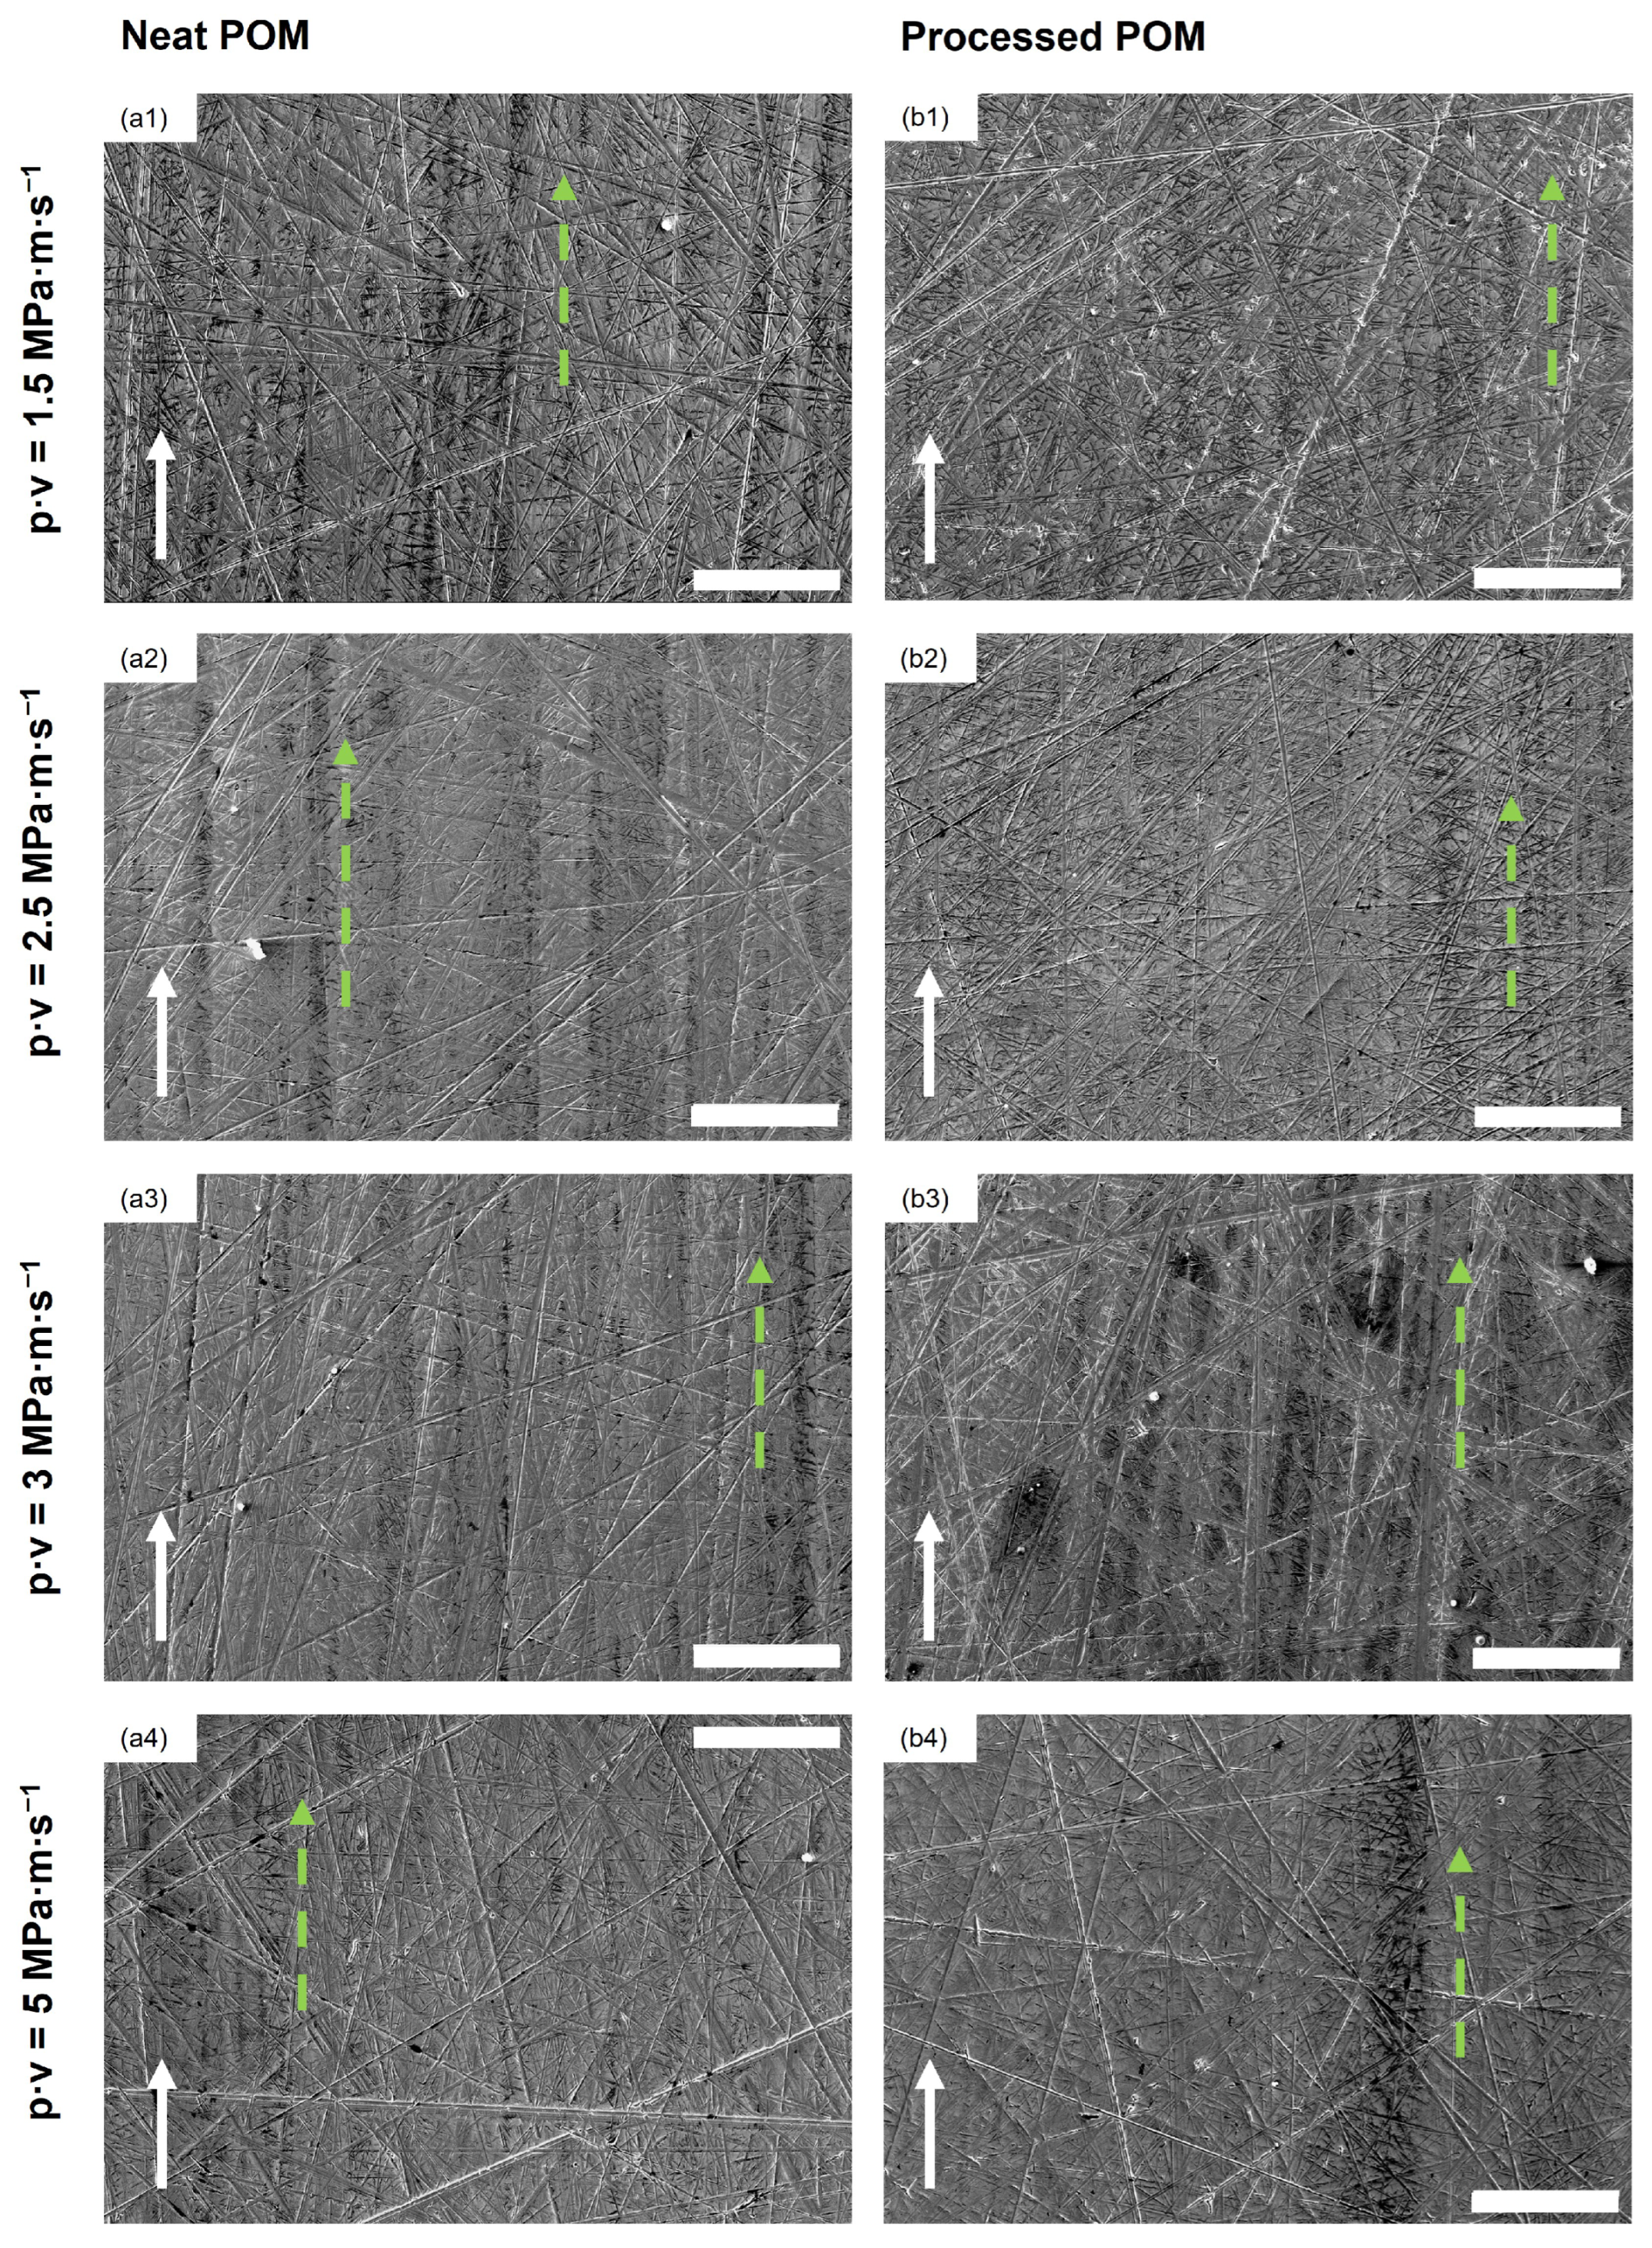
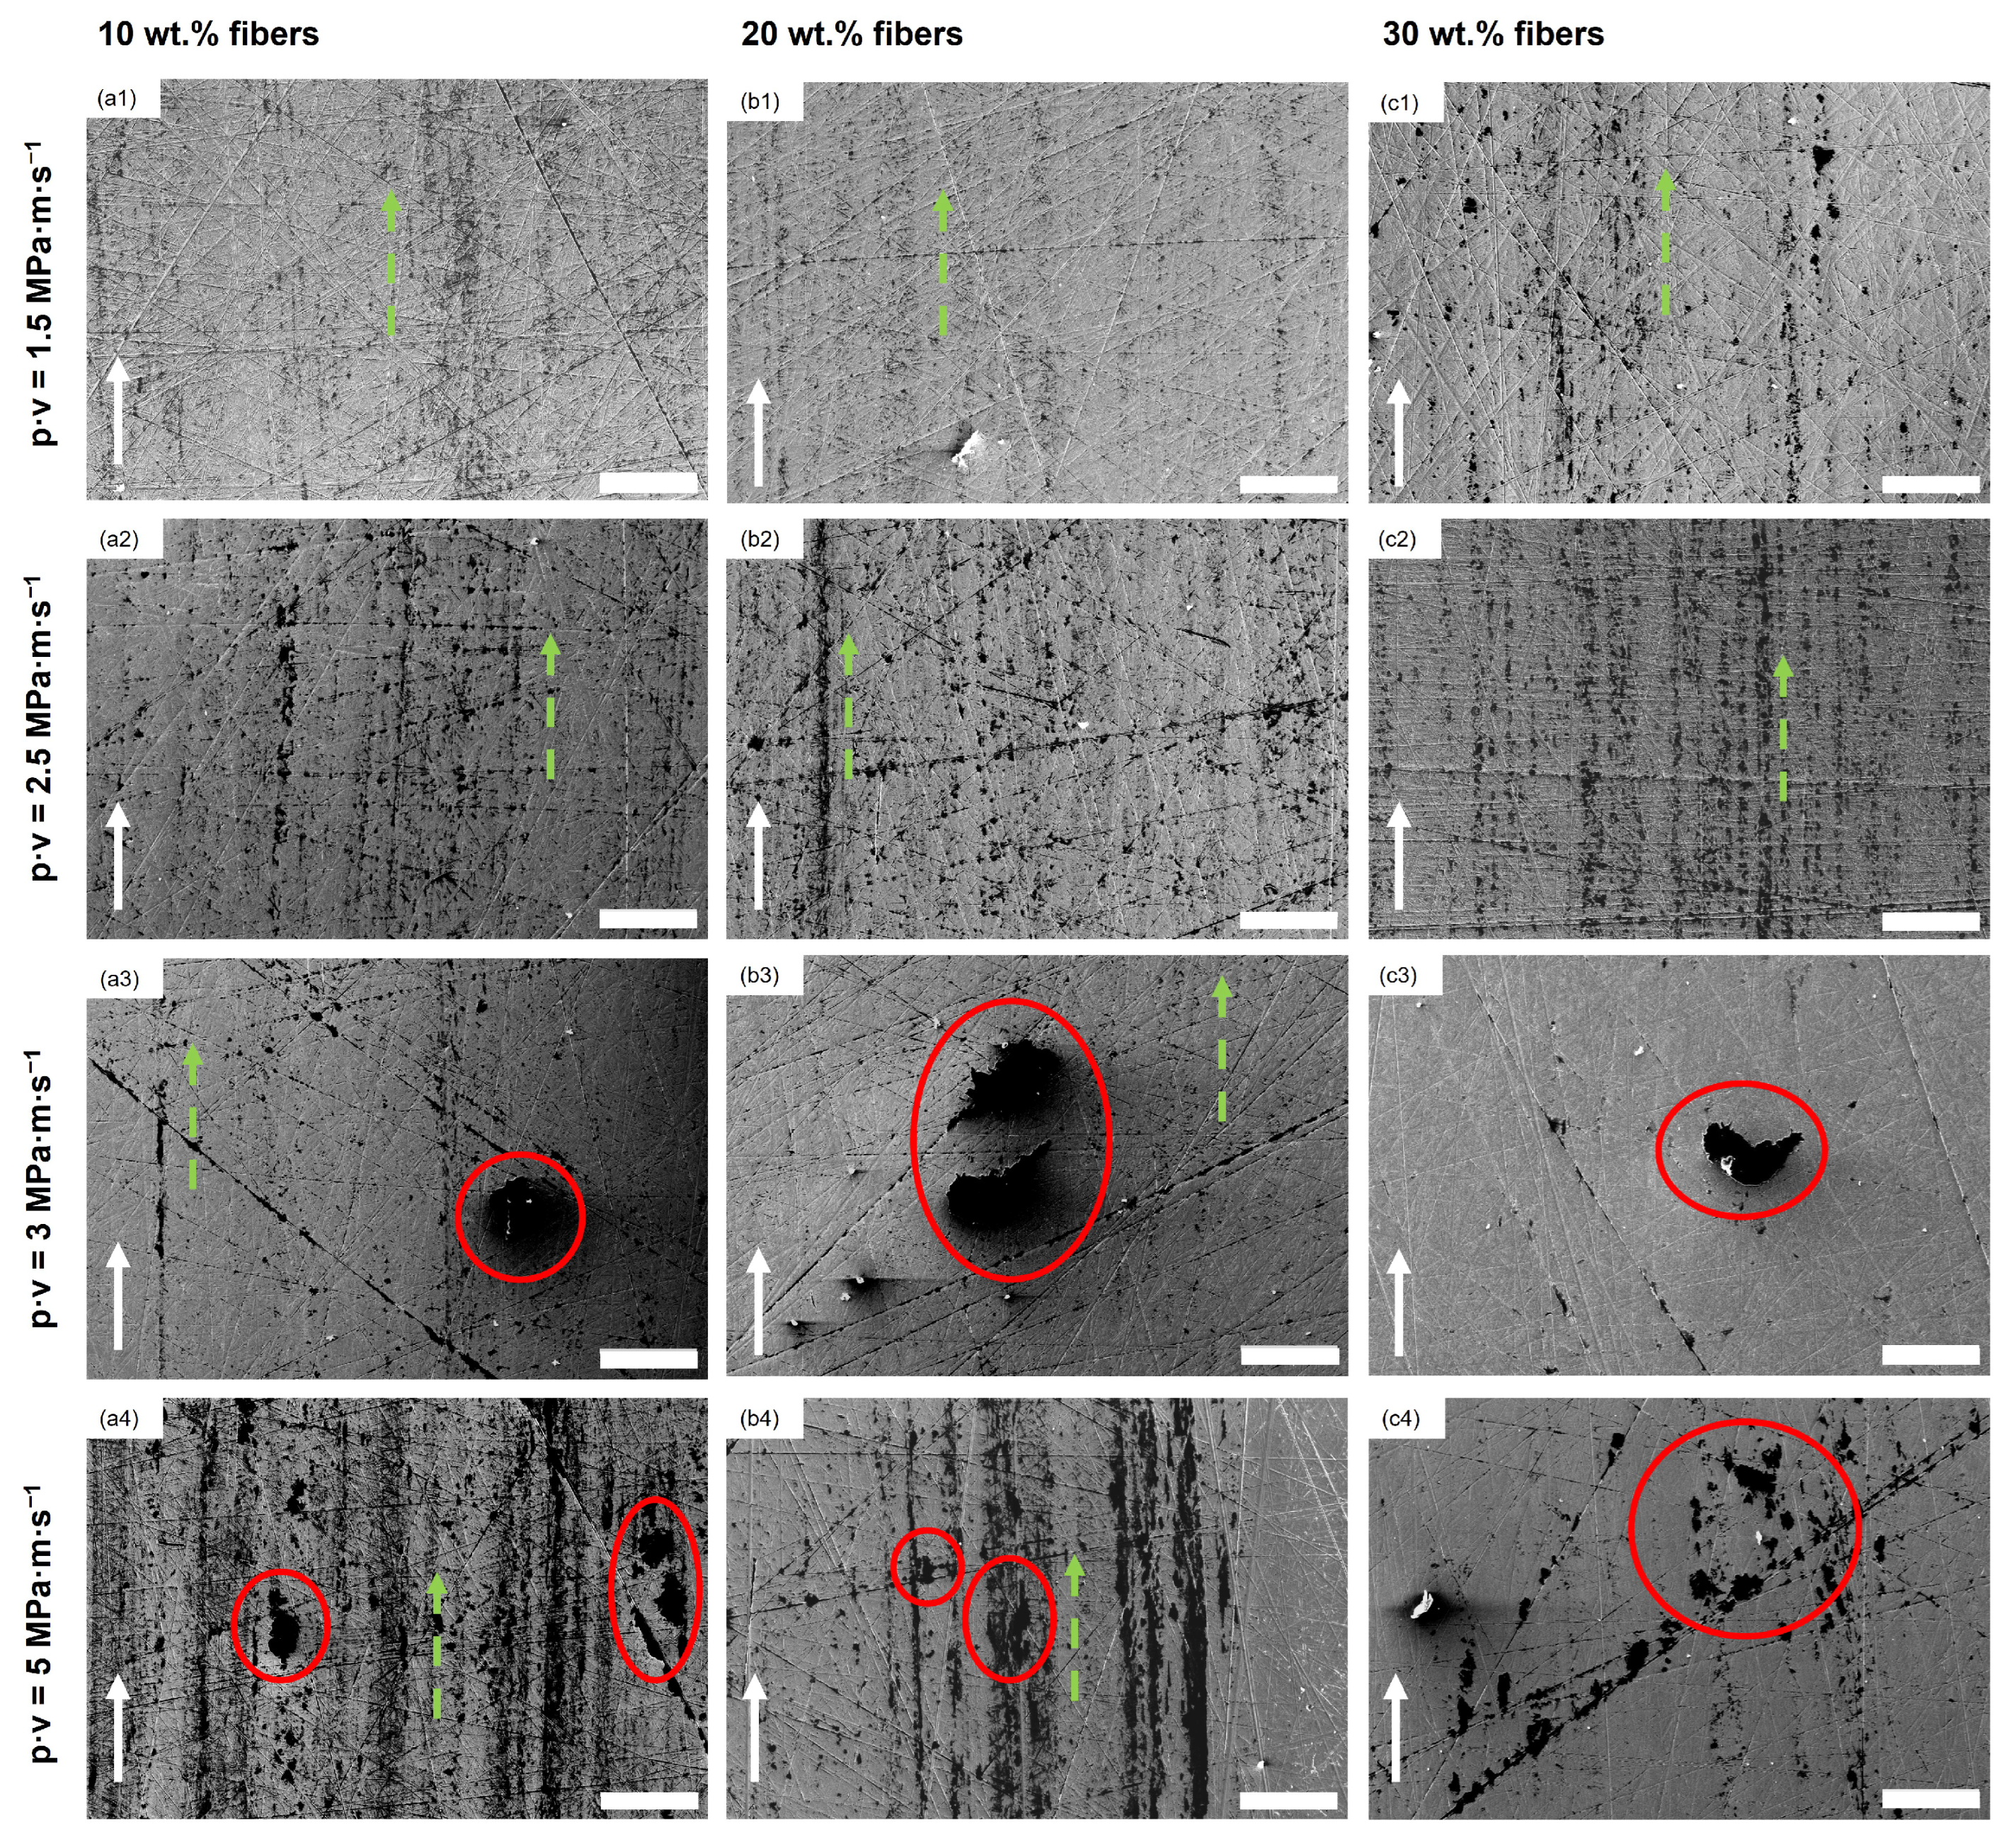
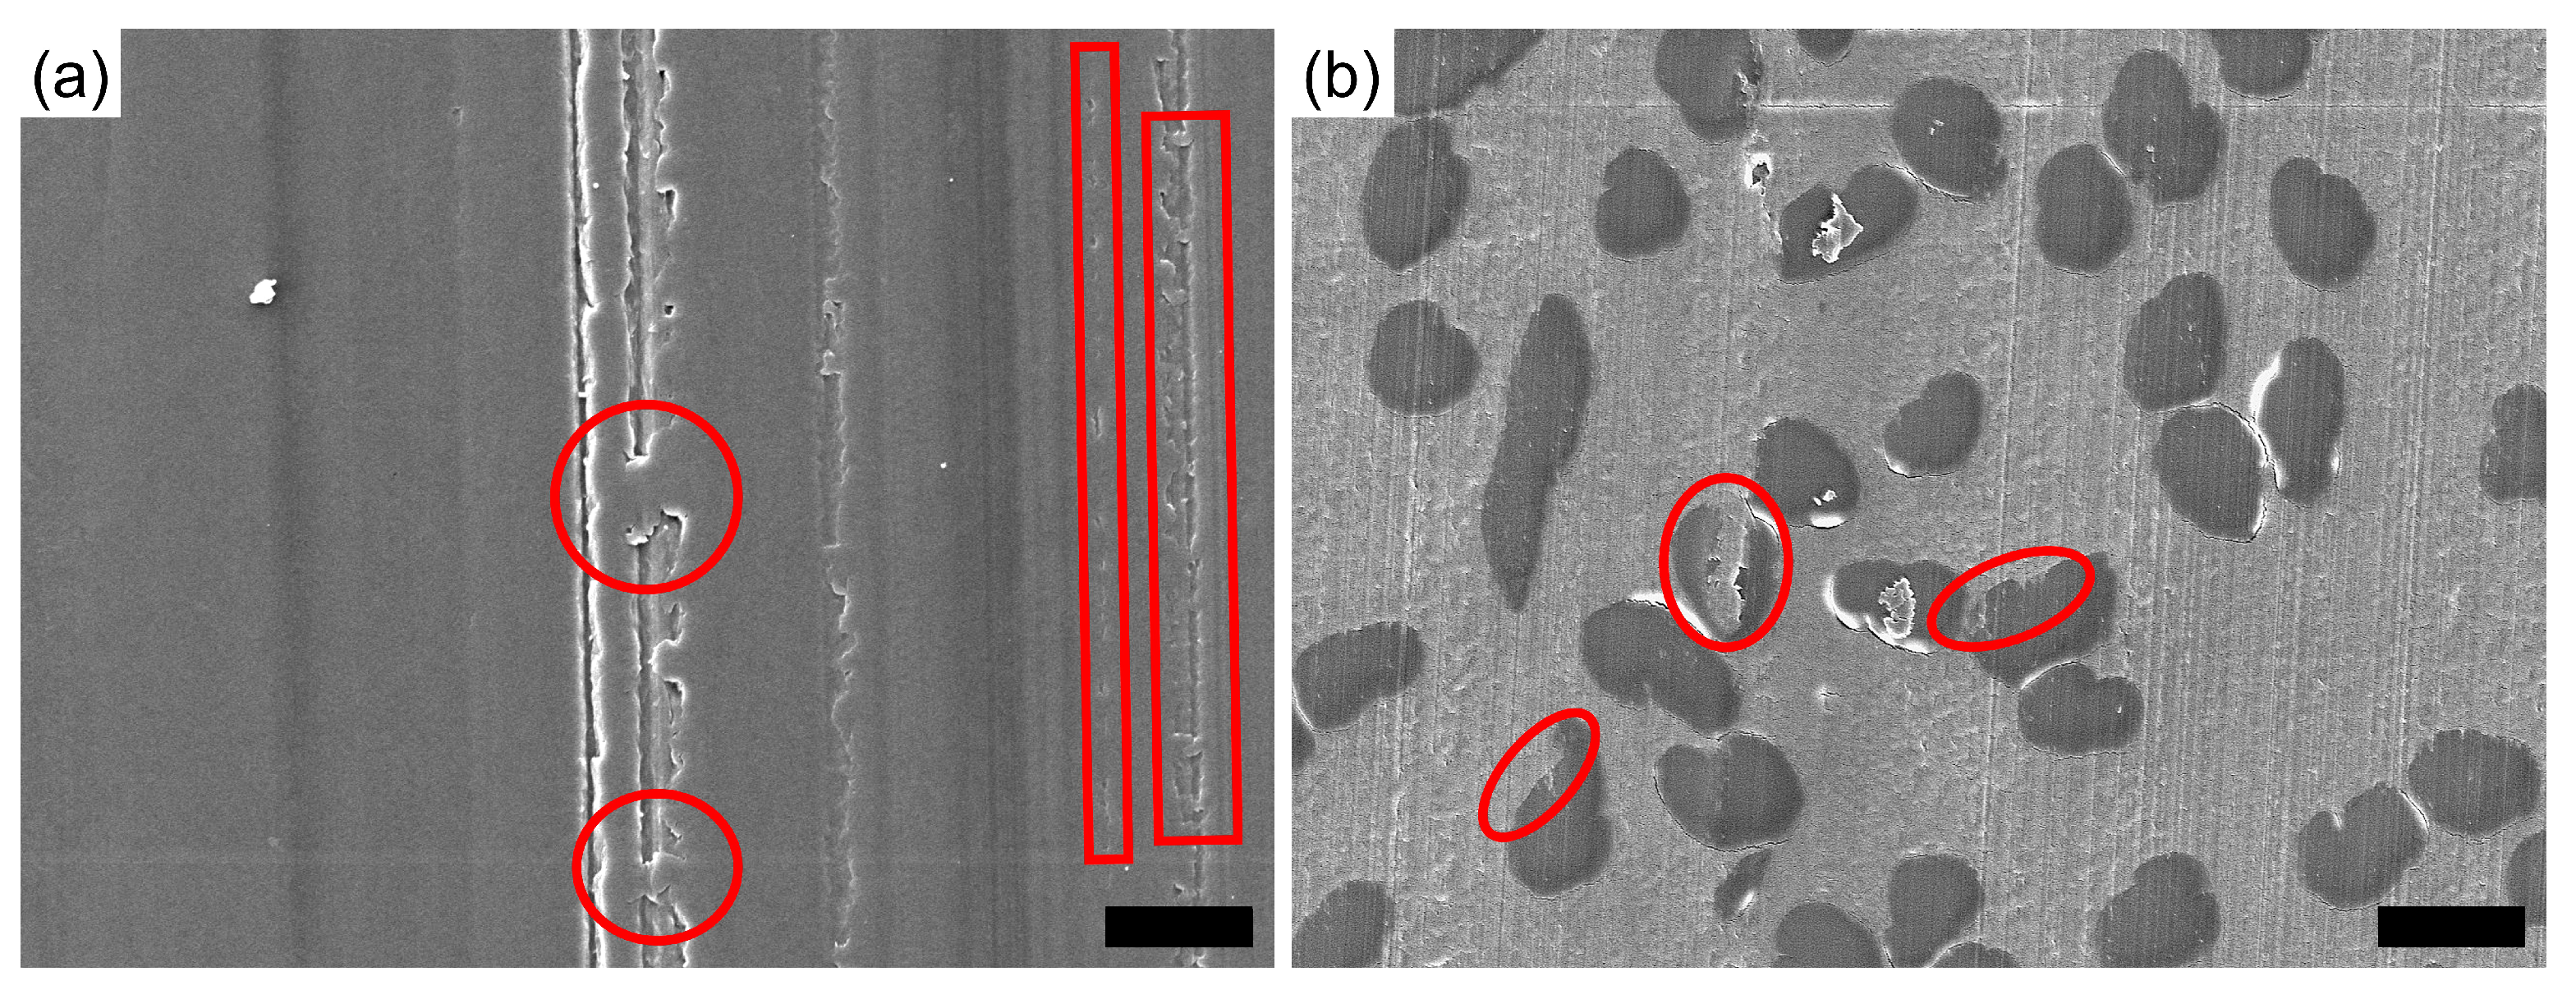
3.2.1. Stainless Steel Disc Countersurfaces
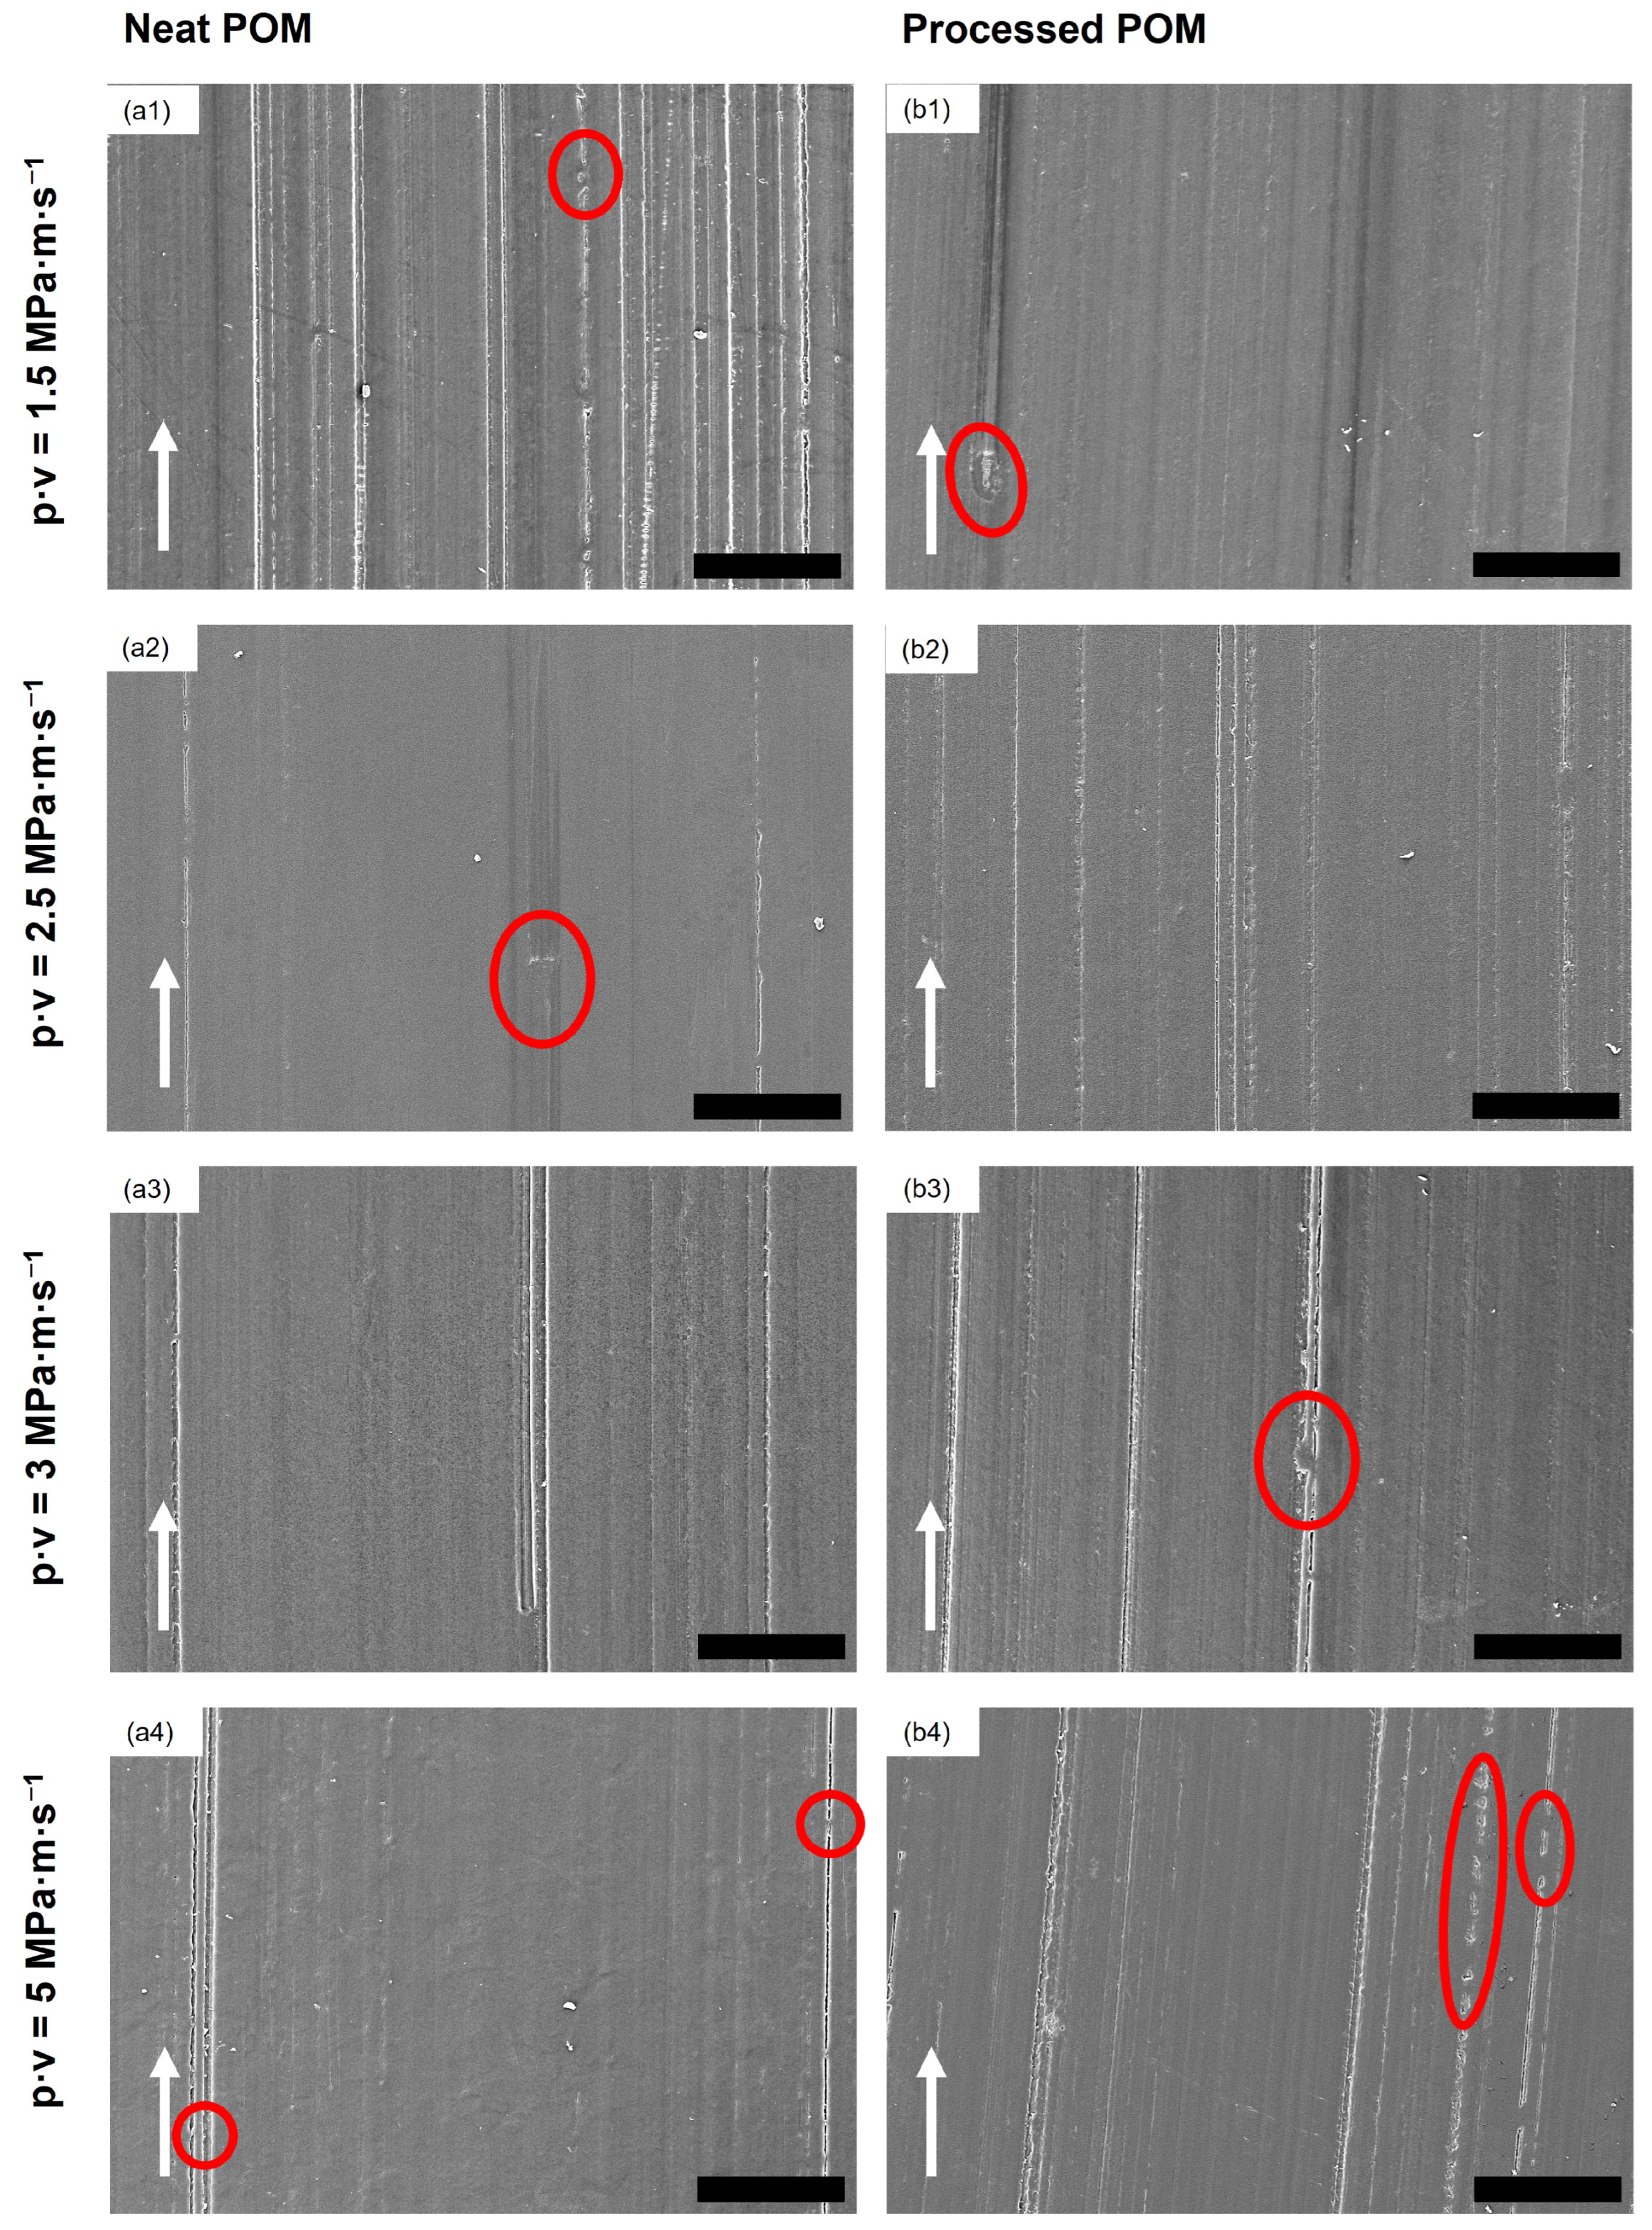
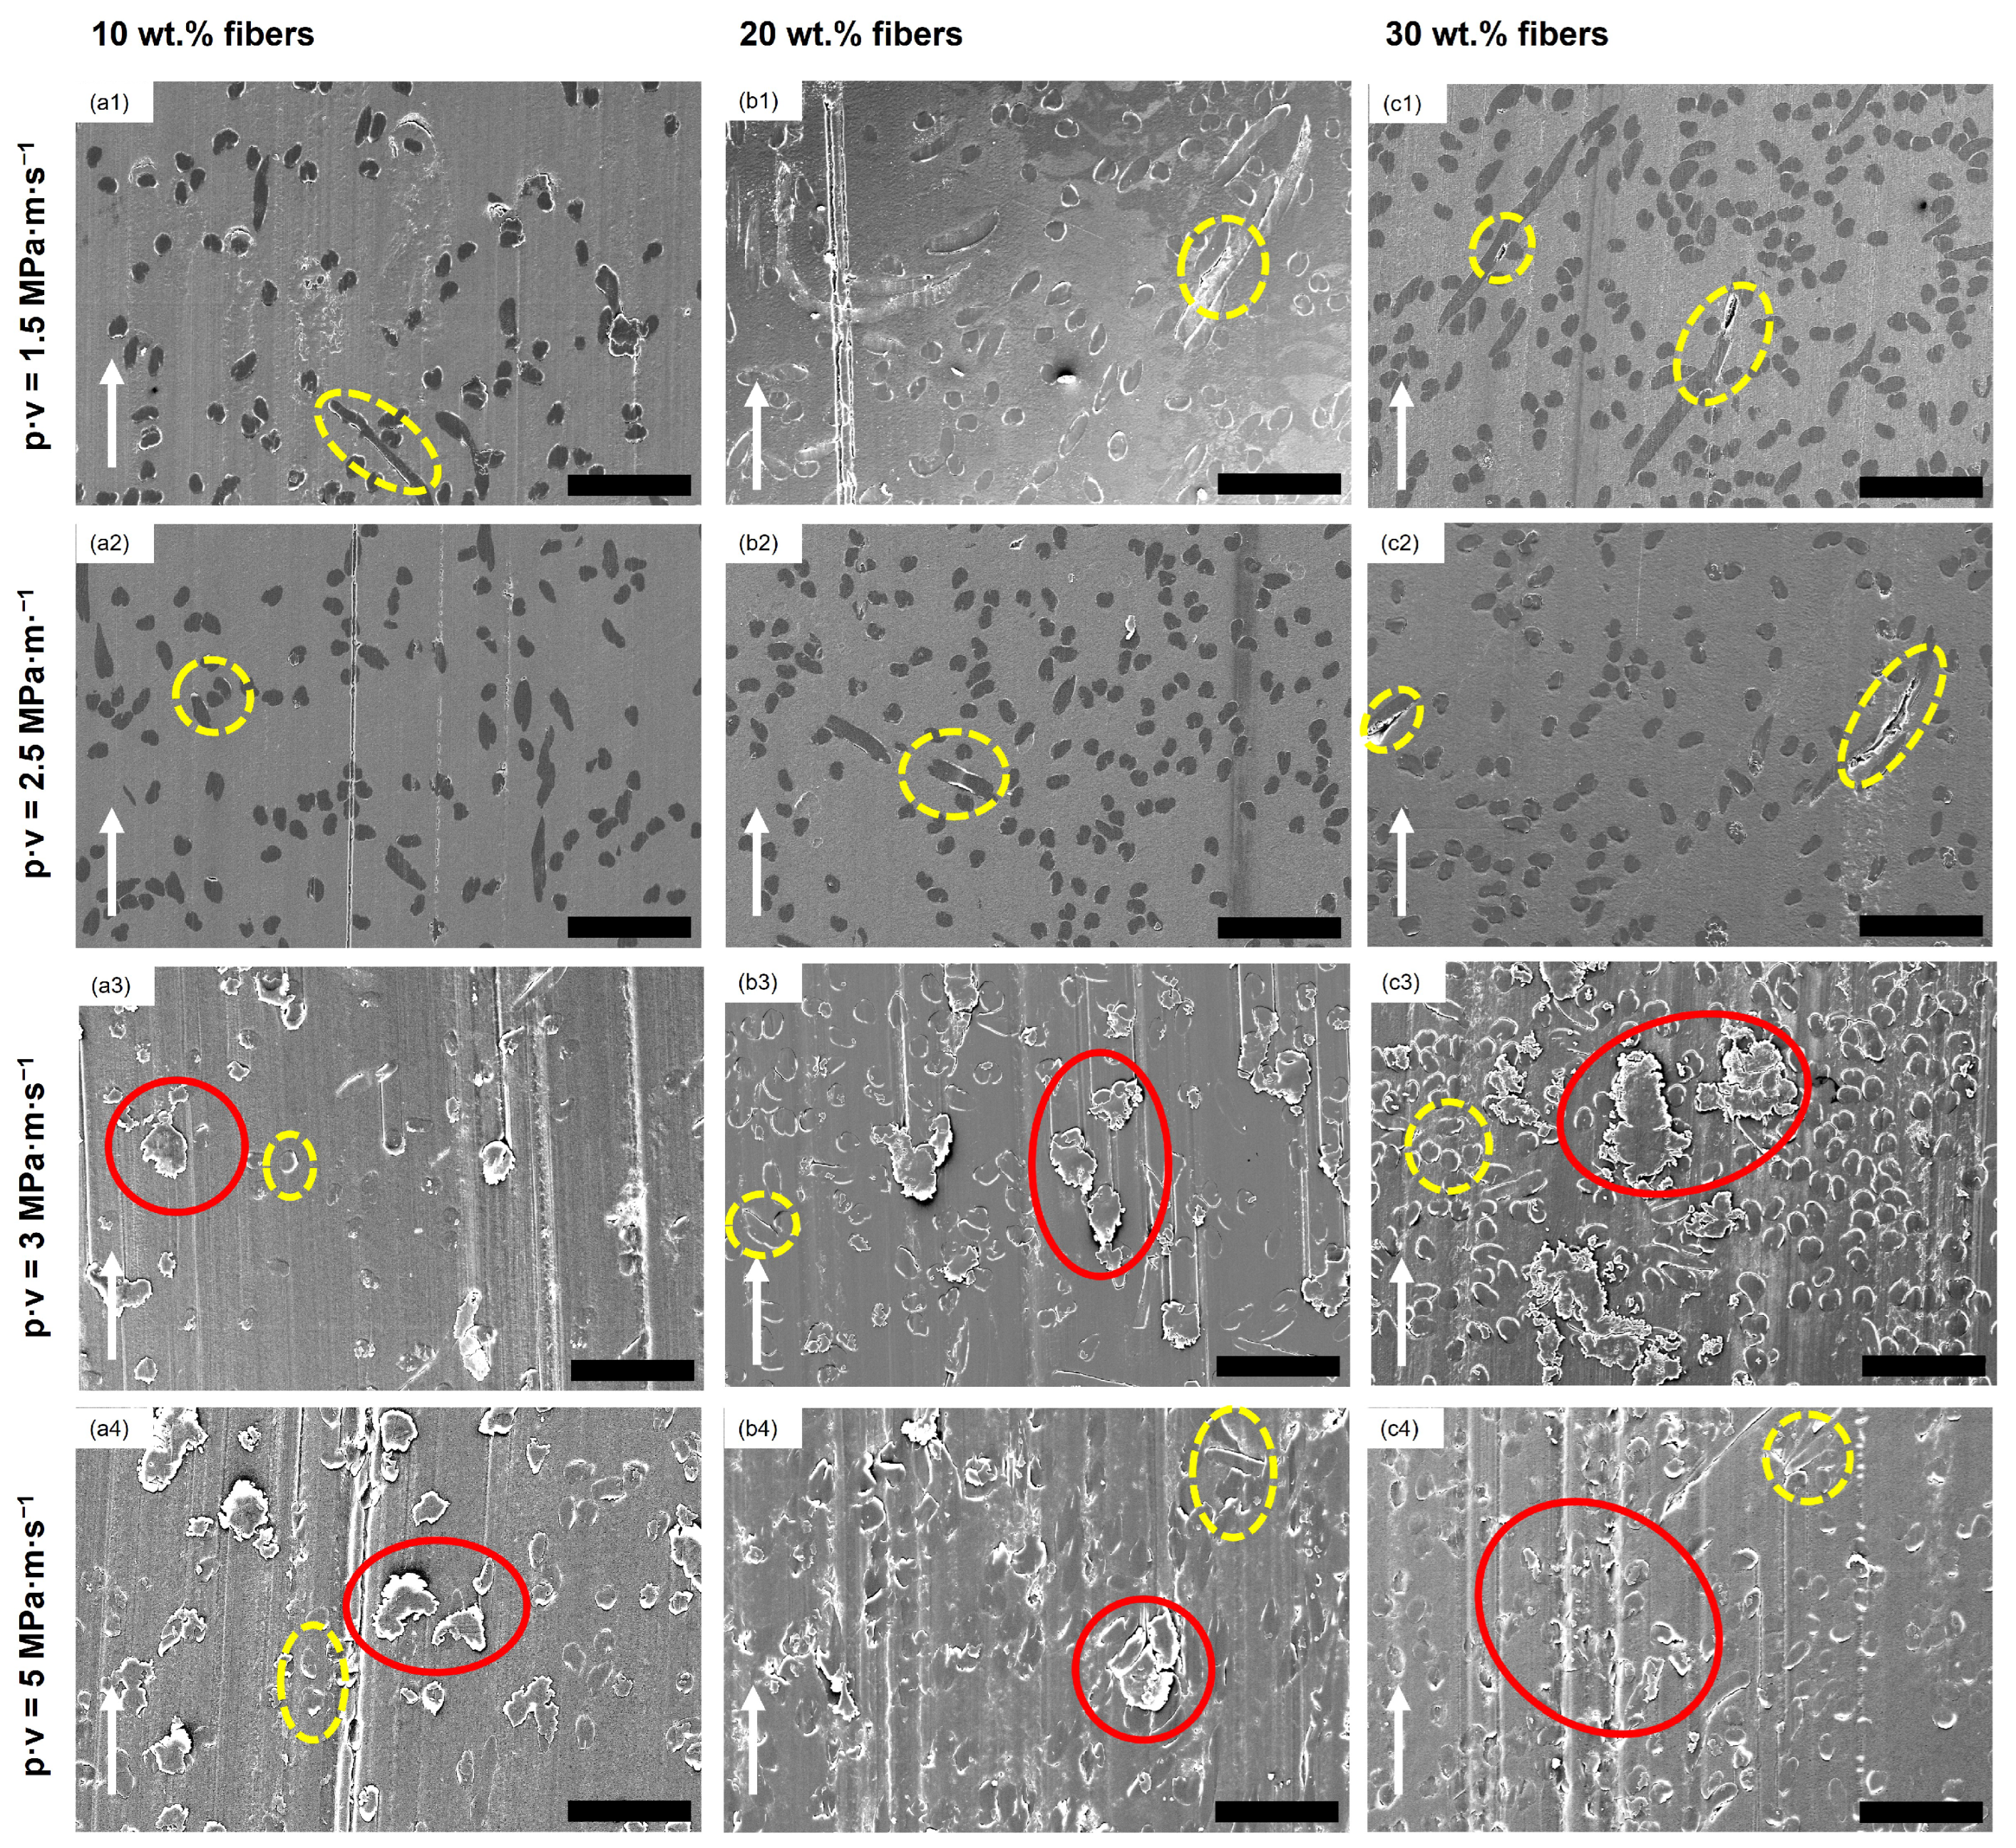
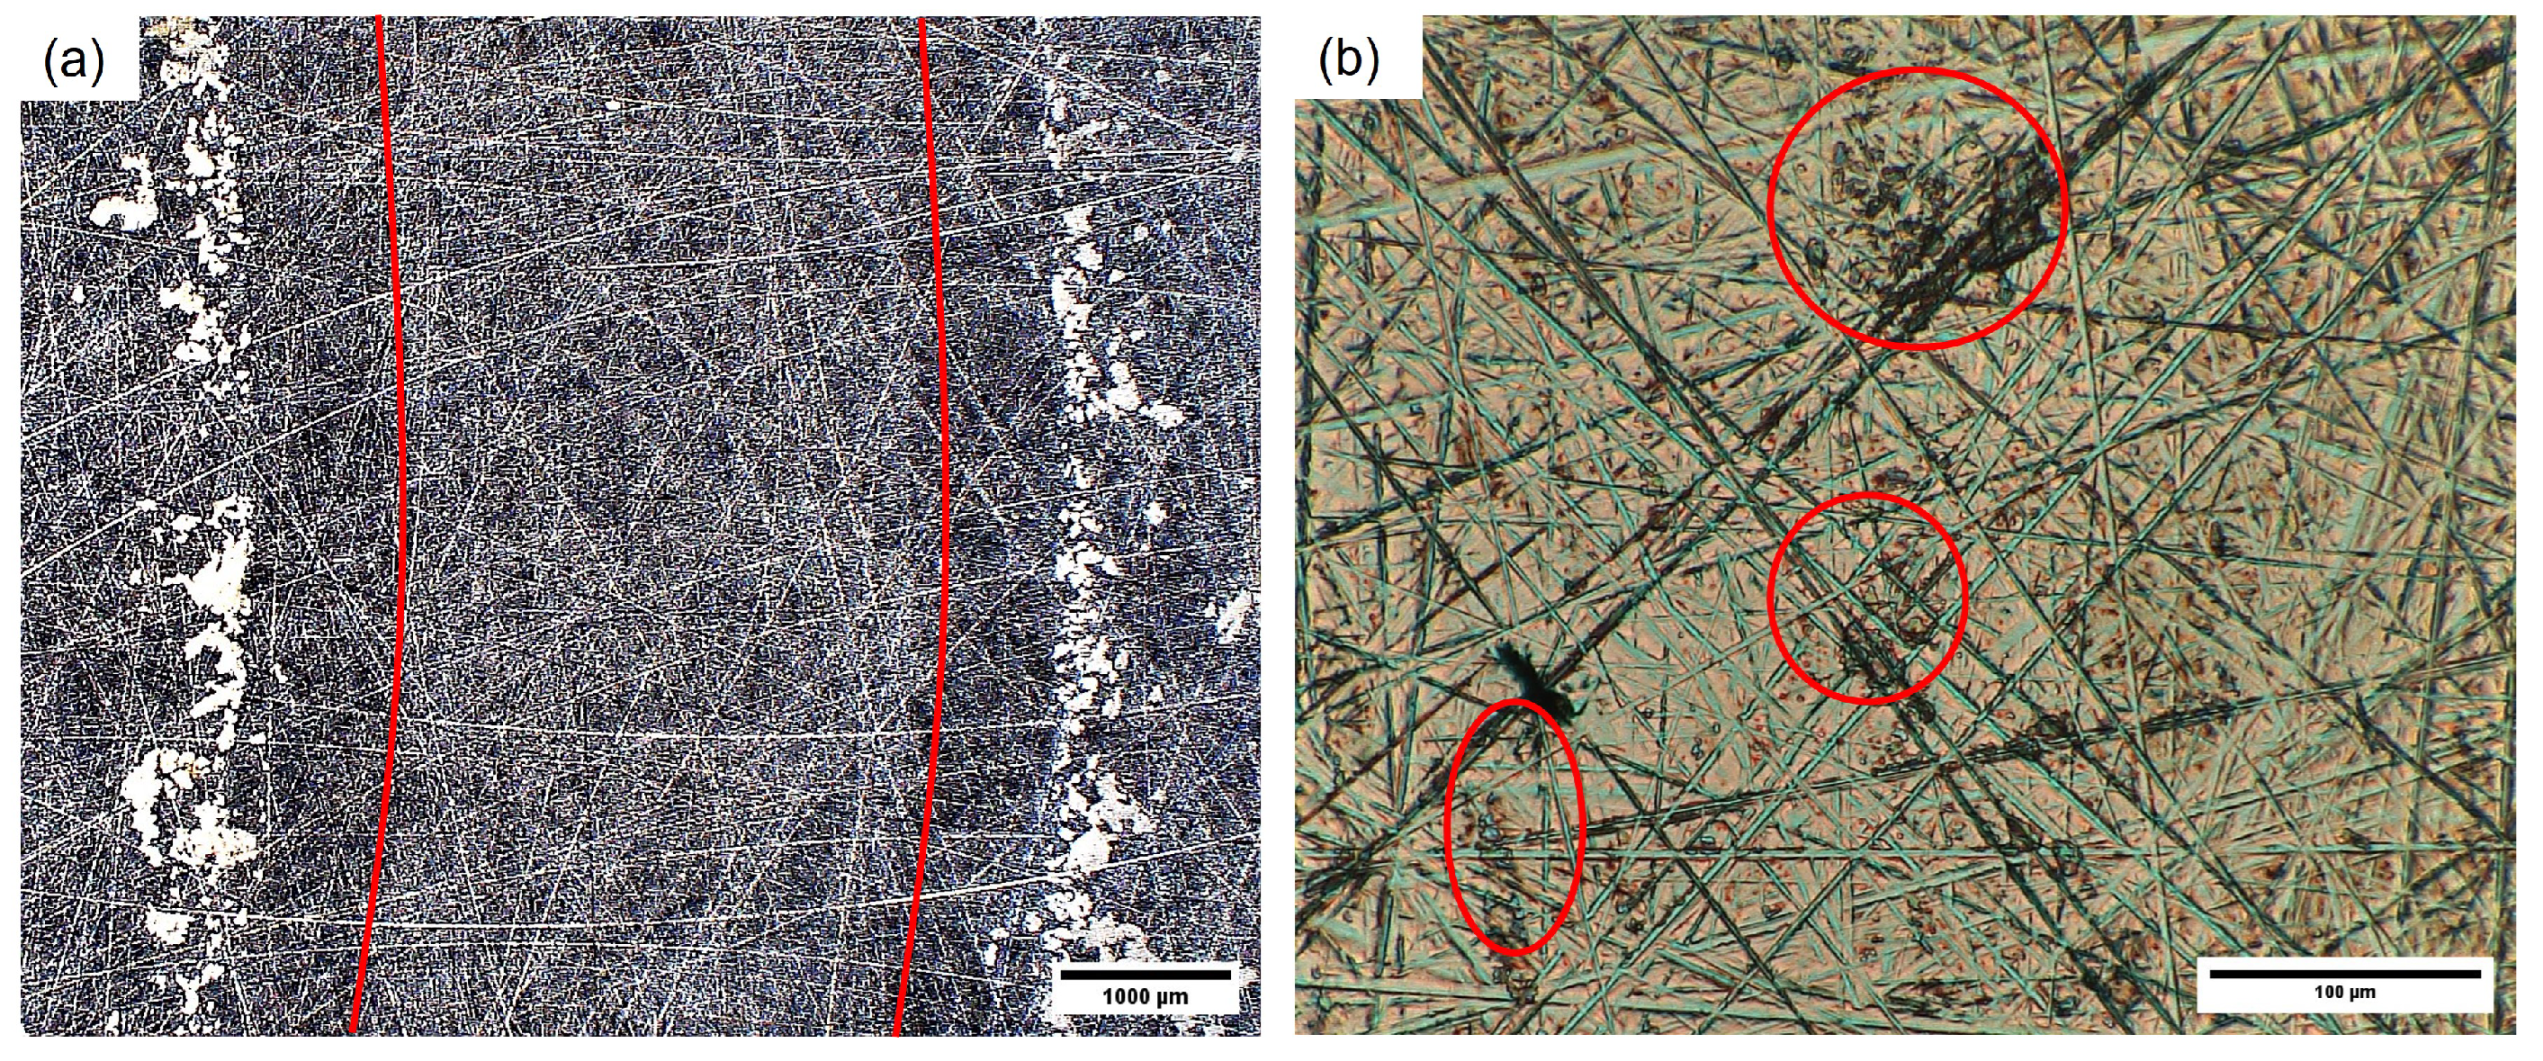
3.2.2. Polymer Pins
3.3. White Light Interferometry
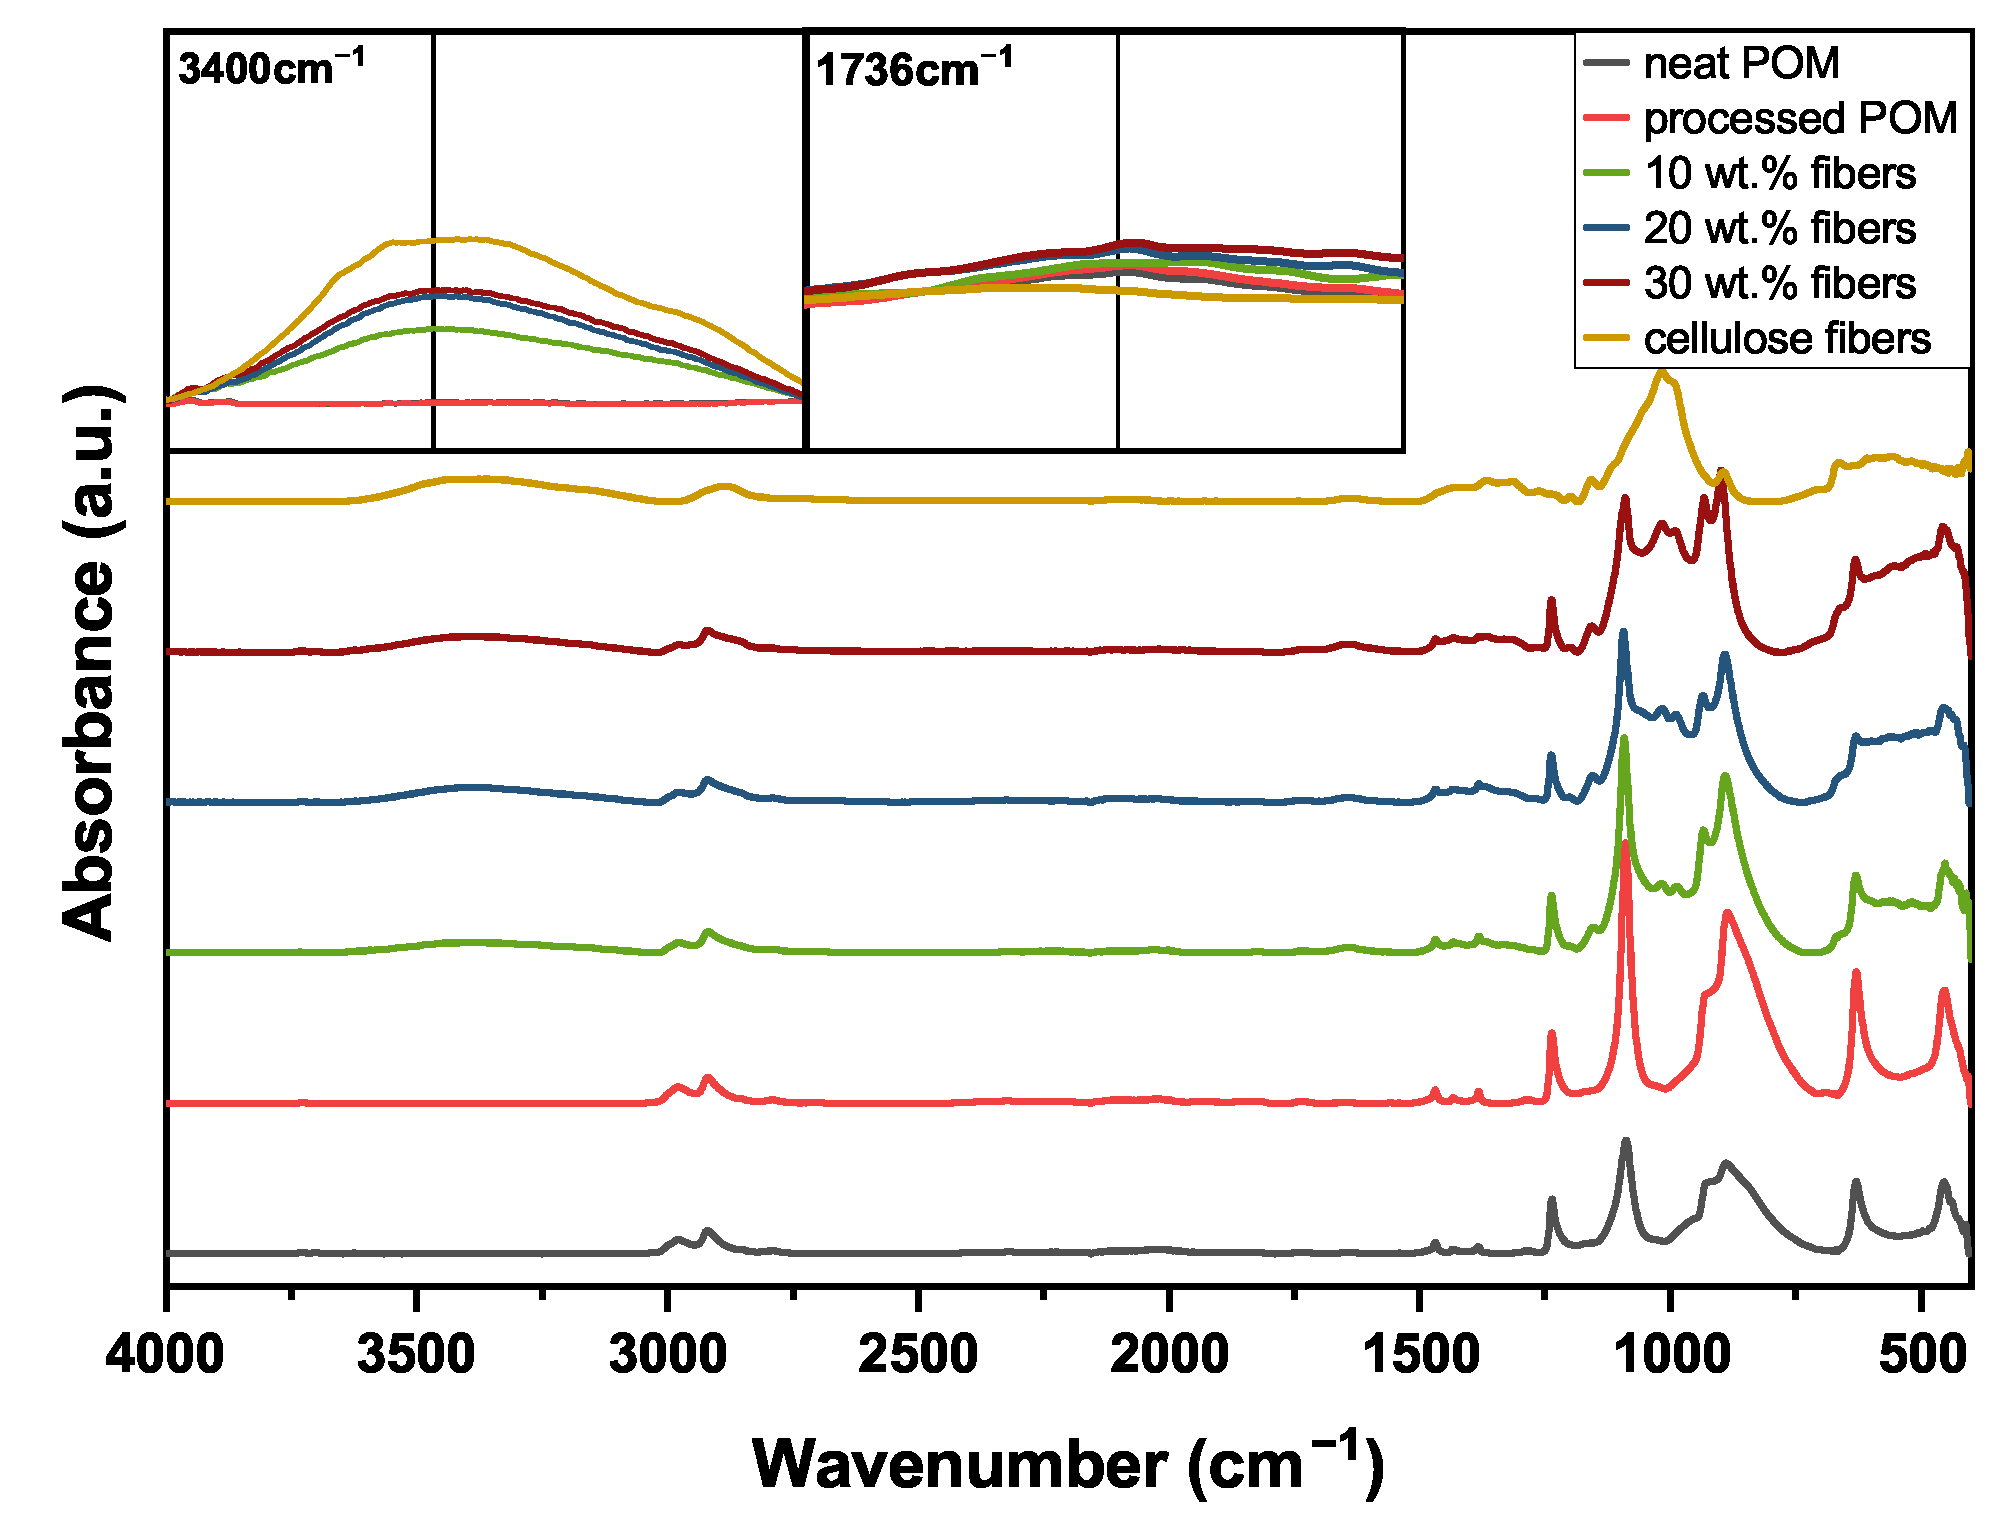
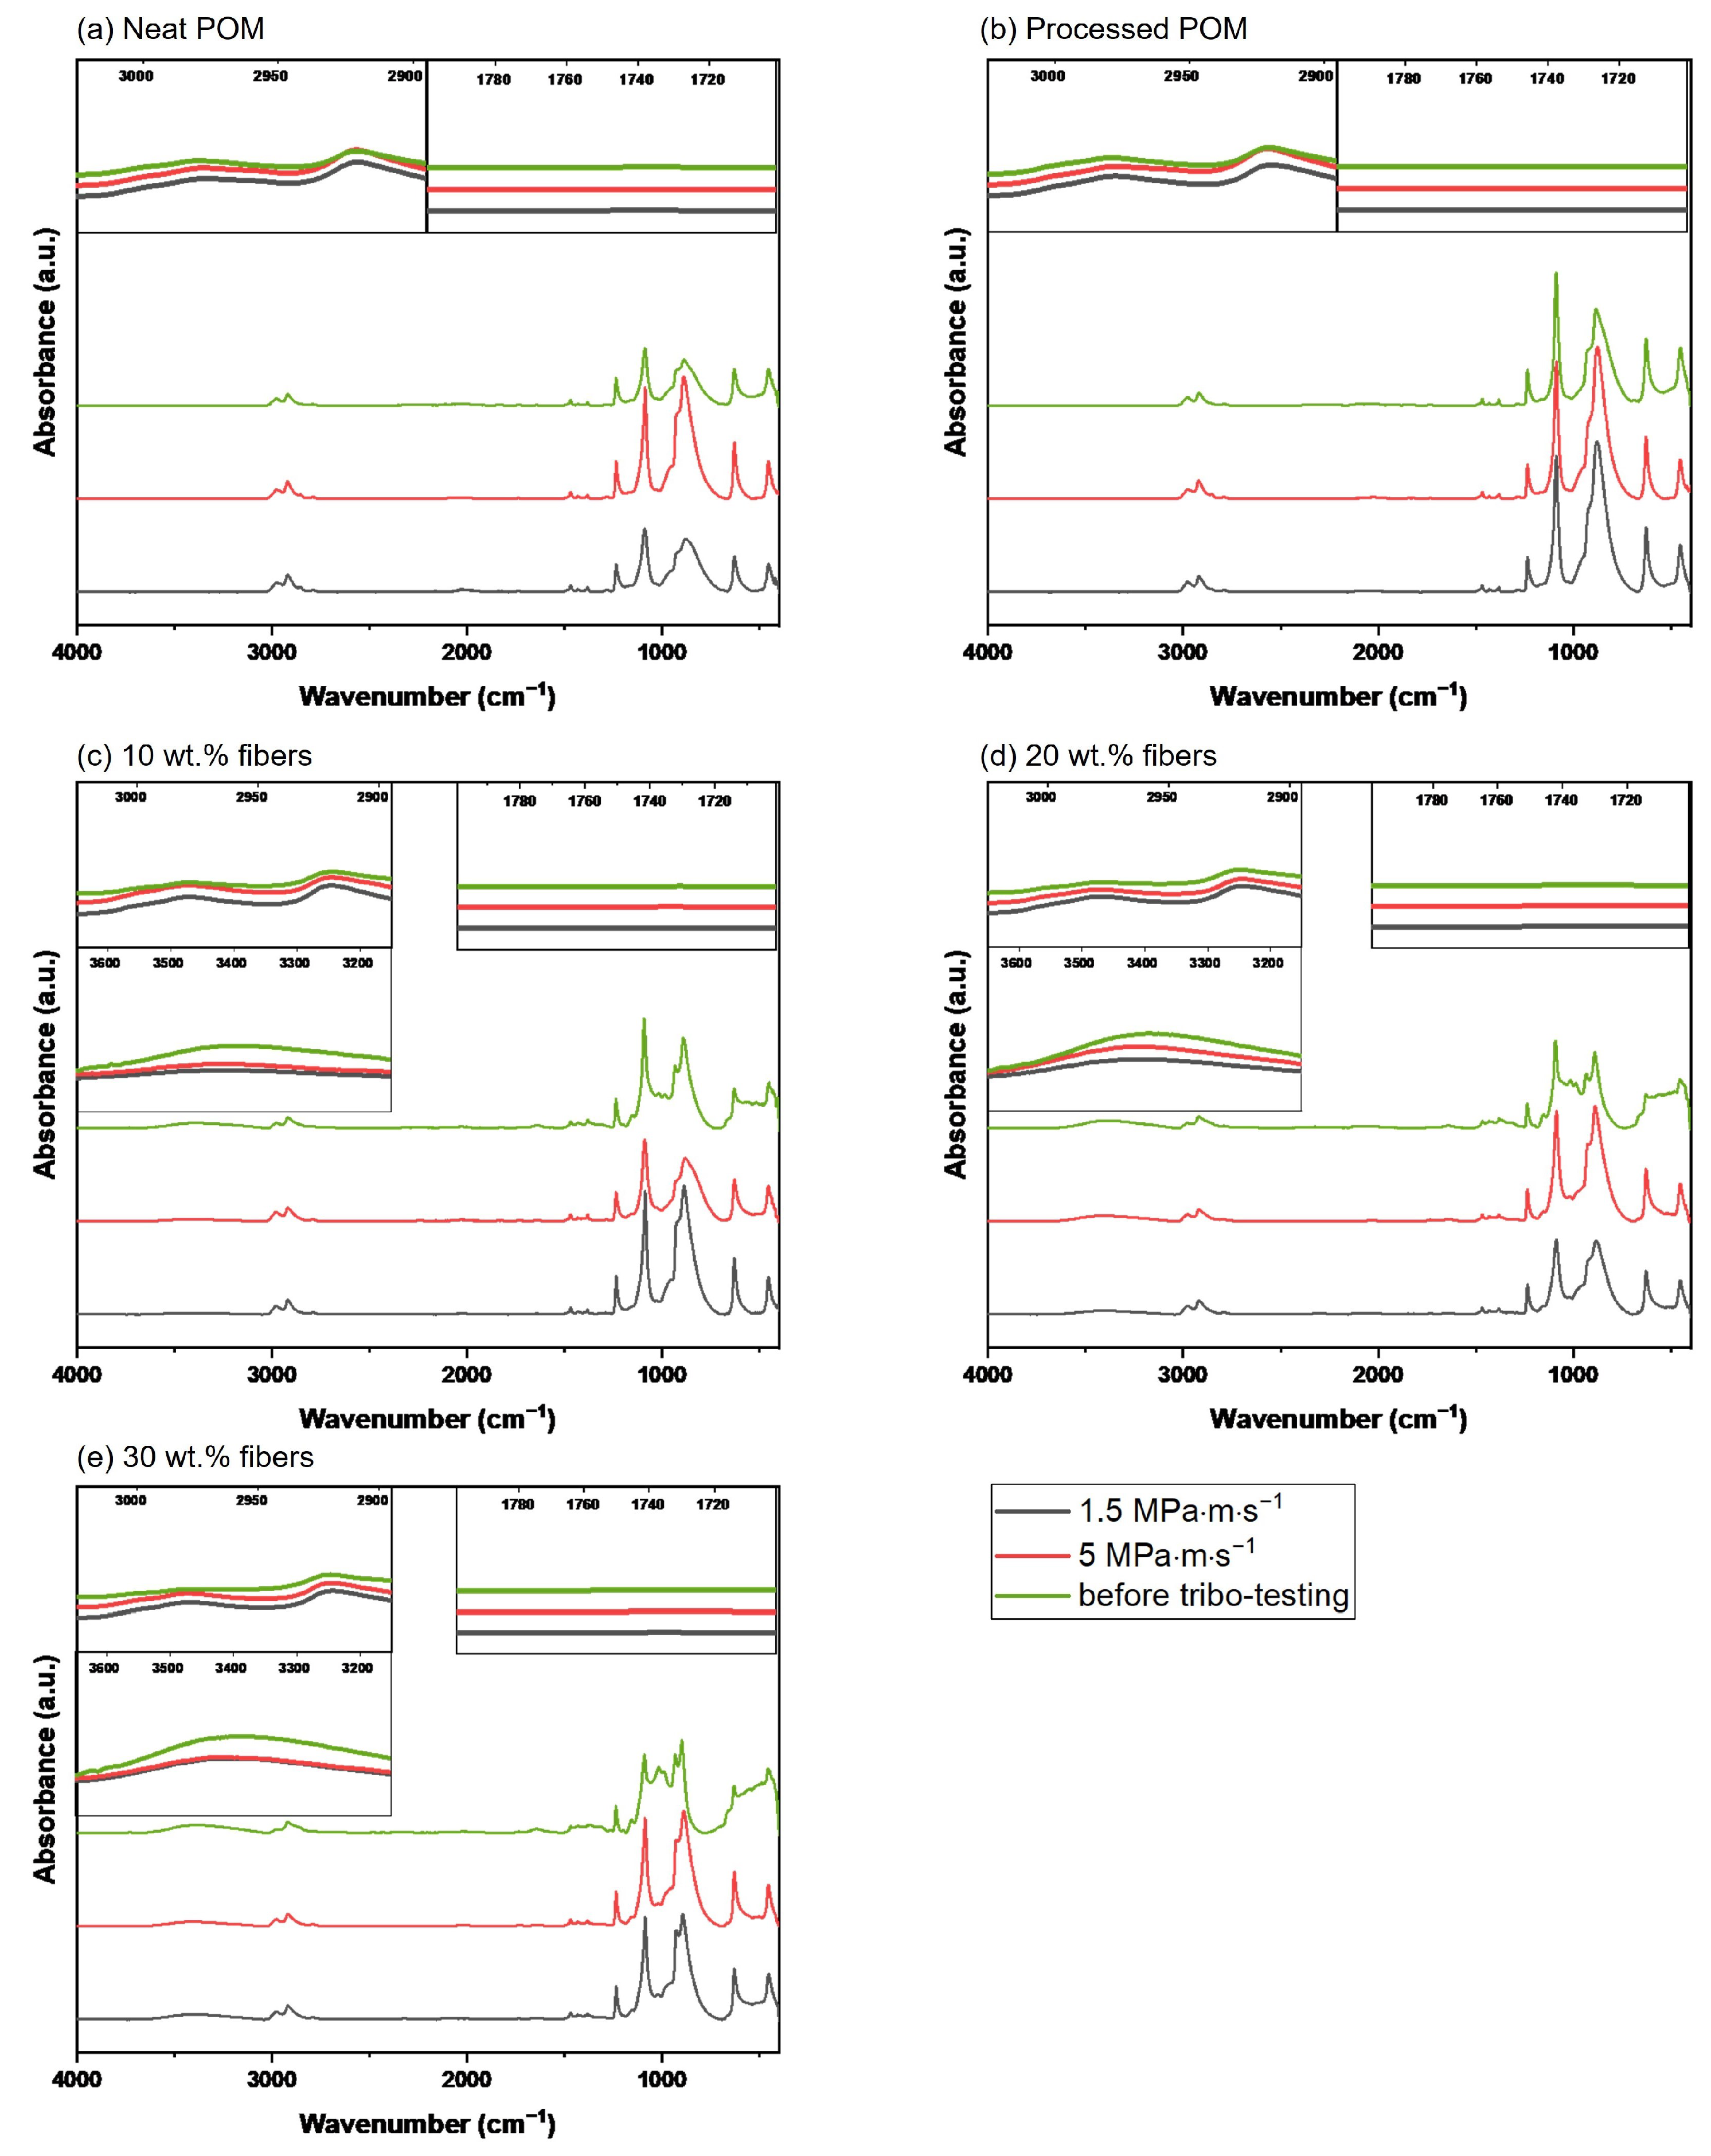
3.4. Fourier-Transform Infrared Spectroscopy
4. Discussion
4.1. Tribological Investigations
4.1.1. Friction
4.1.2. Wear
4.2. White Light Interferometry
4.3. Fourier-Transform Infrared Spectroscopy
5. Conclusions
Author Contributions
Funding
Data Availability Statement
Acknowledgments
Conflicts of Interest
References
- Hedlund, M.; Lundin, J.; de Santiago, J.; Abrahamsson, J.; Bernhoff, H. Flywheel Energy Storage for Automotive Applications. Energies 2015, 8, 10636–10663. [Google Scholar] [CrossRef]
- Reitschuster, S.; Illenberger, C.M.; Tobie, T.; Stahl, K. Application of high performance polymer gears in light urban electric vehicle powertrains. Forsch. Ingenieurwesen 2022, 86, 683–691. [Google Scholar] [CrossRef]
- Ashori, A. Wood–plastic composites as promising green-composites for automotive industries! Bioresour. Technol. 2008, 99, 4661–4667. [Google Scholar] [CrossRef] [PubMed]
- Amasawa, E.; Hasegawa, M.; Yokokawa, N.; Sugiyama, H.; Hirao, M. Environmental performance of an electric vehicle composed of 47% polymers and polymer composites. Sustain. Mater. Technol. 2020, 25, e00189. [Google Scholar] [CrossRef]
- Katiyar, J.K.; Bhattacharya, S.; Patel, V.K.; Kumar, V. (Eds.) Automotive Tribology; Energy, Environment, and Sustainability; Springer: Singapore, 2019. [Google Scholar] [CrossRef]
- Lüftl, S.; P.M., V.; Sarathchandran, C. (Eds.) Polyoxymethylene Handbook: Structure, Properties, Applications and Their Nanocomposites; John Wiley & Sons: Hoboken, NJ, USA; Scrivener Publishing: Salem, MA, USA, 2014. [Google Scholar]
- Zhang, L.; Qi, H.; Li, G.; Zhang, G.; Wang, T.; Wang, Q. Impact of reinforcing fillers’ properties on transfer film structure and tribological performance of POM-based materials. Tribol. Int. 2017, 109, 58–68. [Google Scholar] [CrossRef]
- Jarvis, D.L. Polyacetals. In Brydson’s Plastics Materials; Elsevier: Amsterdam, The Netherlands, 2017; pp. 513–526. [Google Scholar] [CrossRef]
- Milosevic, M.; Dzunic, D.; Valasek, P.; Mitrovic, S.; Ruggiero, A. Effect of Fiber Orientation on the Tribological Performance of Abaca-Reinforced Epoxy Composite under Dry Contact Conditions. J. Compos. Sci. 2022, 6, 204. [Google Scholar] [CrossRef]
- Chandgude, S.; Salunkhe, S. Biofiber-reinforced polymeric hybrid composites: An overview on mechanical and tribological performance. Polym. Compos. 2020, 41, 3908–3939. [Google Scholar] [CrossRef]
- Ahmad, F.; Choi, H.S.; Park, M.K. A Review: Natural Fiber Composites Selection in View of Mechanical, Light Weight, and Economic Properties. Macromol. Mater. Eng. 2015, 300, 10–24. [Google Scholar] [CrossRef]
- Milosevic, M.; Valášek, P.; Ruggiero, A. Tribology of Natural Fibers Composite Materials: An Overview. Lubricants 2020, 8, 42. [Google Scholar] [CrossRef]
- Mohanty, J.R.; Das, S.N.; Das, H.C. Effect of Fiber Content on Abrasive Wear Behavior of Date Palm Leaf Reinforced Polyvinyl Pyrrolidone Composite. ISRN Tribol. 2014, 2014, 453924. [Google Scholar] [CrossRef]
- Nishitani, Y.; Kajiyama, T.; Yamanaka, T. Effect of Silane Coupling Agent on Tribological Properties of Hemp Fiber-Reinforced Plant-Derived Polyamide 1010 Biomass Composites. Materials 2017, 10, 1040. [Google Scholar] [CrossRef] [PubMed]
- Hashmi, S.; Dwivedi, U.; Chand, N. Graphite modified cotton fibre reinforced polyester composites under sliding wear conditions. Wear 2007, 262, 1426–1432. [Google Scholar] [CrossRef]
- Deepanraj, B.; Thirumalvalavan, S.; Selvarasu, S.; Senthilkumar, N.; Shaik, F. Investigation and optimization of wear properties of flax fiber reinforced Delrin polymer composite. Mater. Today Proc. 2023, in press. [Google Scholar] [CrossRef]
- Tang, G.; Hu, X.; Sun, D.; Li, X.; Chen, Q.; Wang, W. The research on the friction and wear properties of ionic liquid-treated cellulose fibre-filled polyoxymethylene composites. J. Thermoplast. Compos. Mater. 2016, 29, 270–280. [Google Scholar] [CrossRef]
- Xiong, X.; Shen, S.Z.; Alam, N.; Hua, L.; Li, X.; Wan, X.; Miao, M. Mechanical and abrasive wear performance of woven flax fabric/polyoxymethylene composites. Wear 2018, 414–415, 9–20. [Google Scholar] [CrossRef]
- Kawaguchi, K.; Mizuguchi, K.; Suzuki, K.; Sakamoto, H.; Oguni, T. Mechanical and physical characteristics of cellulose-fiber-filled polyacetal composites. J. Appl. Polym. Sci. 2010, 118, 1910–1920. [Google Scholar] [CrossRef]
- Siddiqui, M.S.N.; Pogacnik, A.; Kalin, M. Influence of load, sliding speed and heat-sink volume on the tribological behaviour of polyoxymethylene (POM) sliding against steel. Tribol. Int. 2023, 178, 108029. [Google Scholar] [CrossRef]
- Gehlen, G.; Neis, P.; Poletto, J.; Barros, L.; Buneder, D.; Ferreira, N. Pressure-velocity limit evaluation on POM-C + carbon black at different temperatures. Wear 2021, 464–465, 203530. [Google Scholar] [CrossRef]
- Zhang, Y.; Zhu, S.; Liu, Y.; Yang, B.; Wang, X. The mechanical and tribological properties of nitric acid-treated carbon fiber-reinforced polyoxymethylene composites. J. Appl. Polym. Sci. 2015, 132, 41812. [Google Scholar] [CrossRef]
- Zhaohong, X.; Zhenhua, L.; Jian, L.; Fei, F.Y. The effect of CF and nano-SiO2 modification on the flexural and tribological properties of POM composites. J. Thermoplast. Compos. Mater. 2014, 27, 287–296. [Google Scholar] [CrossRef]
- Xiang, X.H.; Xiang, D.H.; Fang, W.; Ma, J.L. Friction and Wear Behavior of POM Composites Filled with LDPE and Wood Fibers. Adv. Mater. Res. 2011, 415–417, 293–296. [Google Scholar] [CrossRef]
- Cordenka GmbH & Co. KG. Technical Data Sheet: Rayon Chopped Fibers; Cordenka GmbH & Co. KG: Obernburg a. Main, Germany, 2021. [Google Scholar]
- Kneissl, L.M.; Gonçalves, G.; Joffe, R.; Kalin, M.; Emami, N. Mechanical properties and tribological performance of polyoxymethylene/short cellulose fiber composites. Polym. Test. 2023, 128, 108234. [Google Scholar] [CrossRef]
- Vilà Ramirez, N.; Sanchez-Soto, M.; Illescas, S.; Gordillo, A. Thermal Degradation of Polyoxymethylene Evaluated with FTIR and Spectrophotometry. Polym.-Plast. Technol. Eng. 2009, 48, 470–477. [Google Scholar] [CrossRef]
- Chang, B.P.; Md Akil, H.; Zamri, M.H. Tribological Characteristics of Green Biocomposites. In Green Biocomposites; Jawaid, M., Sapuan, S.M., Alothman, O.Y., Eds.; Green Energy and Technology; Springer International Publishing: Cham, Swizerland, 2017; pp. 149–179. [Google Scholar] [CrossRef]
- Hsu, C.I.; Ting, P.H.; Hwang, J.R. The Effect of Process Conditions on the Fiber Orientation and Tribological Characteristics of Polyoxymethylene Composites. Polym.-Plast. Technol. Eng. 2010, 49, 1231–1240. [Google Scholar] [CrossRef]
- Omrani, E.; Menezes, P.L.; Rohatgi, P.K. State of the art on tribological behavior of polymer matrix composites reinforced with natural fibers in the green materials world. Eng. Sci. Technol. Int. J. 2016, 19, 717–736. [Google Scholar] [CrossRef]
- Chin, C.W.; Yousif, B.F. Potential of kenaf fibres as reinforcement for tribological applications. Wear 2009, 267, 1550–1557. [Google Scholar] [CrossRef]
- Samyn, P.; De Baets, P. Friction of polyoxymethylene homopolymer in highly loaded applications extrapolated from small-scale testing. Tribol. Lett. 2005, 19, 177–189. [Google Scholar] [CrossRef]
- Bajpai, P.K.; Singh, I.; Madaan, J. Tribological behavior of natural fiber reinforced PLA composites. Wear 2013, 297, 829–840. [Google Scholar] [CrossRef]
- Yamaguchi, Y.; Kashiwagi, K. The limiting pressure-velocity (PV) of plastics under unlubricated sliding. Polym. Eng. Sci. 1982, 22, 248–253. [Google Scholar] [CrossRef]
- Zsidai, L.; De Baets, P.; Samyn, P.; Kalacska, G.; Van Peteghem, A.P.; Van Parys, F. The tribological behaviour of engineering plastics during sliding friction investigated with small-scale specimens. Wear 2002, 253, 673–688. [Google Scholar] [CrossRef]
- Yousif, B.F.; El-Tayeb, N.S.M. The Effect of Oil Palm Fibers as Reinforcement on Tribological Performance of Polyester Composite. Surf. Rev. Lett. 2007, 14, 1095–1102. [Google Scholar] [CrossRef]
- Unal, H.; Sen, U.; Mimaroglu, A. Dry sliding wear characteristics of some industrial polymers against steel counterface. Tribol. Int. 2004, 37, 727–732. [Google Scholar] [CrossRef]
- Mergler, Y.J.; Schaake, R.P.; Huis in’t Veld, A.J. Material transfer of POM in sliding contact. Wear 2004, 256, 294–301. [Google Scholar] [CrossRef]
- Odi-Owei, S.; Schipper, D.J. Tribological behaviour of unfilled and composite polyoxymethylene. Wear 1991, 148, 363–376. [Google Scholar] [CrossRef]
- Padhan, M.; Marathe, U.; Bijwe, J. Surface topography modification, Film transfer and Wear mechanism for fibre reinforced polymer composites---An Overview. Surf. Topogr. Metrol. Prop. 2020, 8, 043002. [Google Scholar] [CrossRef]
- Thirumalvalavan, S.; Senthilkumar, N.; Deepanraj, B.; Syam Sundar, L. Assessment of mechanical properties of flax fiber reinforced with Delrin polymer composite. Mater. Today Proc. 2023, in press. [Google Scholar] [CrossRef]
- Tewari, U.S.; Bijwe, J. Tribological investigations of polyetherimide composite. J. Mater. Sci. 1992, 27, 328–334. [Google Scholar] [CrossRef]
- Carrillo, F.; Colom, X.; Suñol, J.J.; Saurina, J. Structural FTIR analysis and thermal characterisation of lyocell and viscose-type fibres. Eur. Polym. J. 2004, 40, 2229–2234. [Google Scholar] [CrossRef]
- Marchessault, R.H.; Liang, C.Y. Infrared spectra of crystalline polysaccharides. III. Mercerized cellulose. J. Polym. Sci. 1960, 43, 71–84. [Google Scholar] [CrossRef]
- Pang, Y.J.; Xu, W.S.; Yang, B.T.; Ni, H.Y.; Chen, J. Influence of early thermal-oxidative ageing on the structure and properties of polyoxymethylene copolymer. R. Soc. Open Sci. 2021, 8, 210034. [Google Scholar] [CrossRef] [PubMed]
- Liang, C.Y.; Marchessault, R.H. Infrared spectra of crystalline polysaccharides. I. Hydrogen bonds in native celluloses. J. Polym. Sci. 1959, 37, 385–395. [Google Scholar] [CrossRef]
- Koch, T.A.; Lindvig, P.E. Molecular structure of high molecular weight acetal resins. J. Appl. Polym. Sci. 1959, 1, 164–168. [Google Scholar] [CrossRef]
- Rahman, M.S.; Shaislamov, U.; Yang, J.K.; Kim, J.K.; Yu, Y.H.; Choi, S.; Lee, H.J. Effects of electron beam irradiation on tribological and physico-chemical properties of Polyoxymethylene copolymer (POM-C). Nucl. Instrum. Methods Phys. Res. Sect. B Beam Interact. Mater. Atoms 2016, 387, 54–62. [Google Scholar] [CrossRef]
- BASF. Ultraform (POM)—Product Brochure; BASF SE: Ludwigshafen, Germany, 2016. [Google Scholar]


| Sliding Speed m·s−1 | Contact Pressure MPa | p · v MPa·m·s−1 |
|---|---|---|
| 0.5 | 3 | 1.5 |
| 0.5 | 5 | 2.5 |
| 1.0 | 3 | 3 |
| 1.0 | 5 | 5 |
| Element Spot Number | Fe % | O % | C % | Mg % | Al % | Si % | Cr % |
|---|---|---|---|---|---|---|---|
| 1 | 92.6 | 5.8 | 0.2 | 1.4 | |||
| 2 | 81.4 | 7.7 | 6.8 | 0.9 | 1.8 | 1.4 | |
| 3 | 38.6 | 26.0 | 8.8 | 8.7 | 17.2 | 0.7 |
Disclaimer/Publisher’s Note: The statements, opinions and data contained in all publications are solely those of the individual author(s) and contributor(s) and not of MDPI and/or the editor(s). MDPI and/or the editor(s) disclaim responsibility for any injury to people or property resulting from any ideas, methods, instructions or products referred to in the content. |
© 2024 by the authors. Licensee MDPI, Basel, Switzerland. This article is an open access article distributed under the terms and conditions of the Creative Commons Attribution (CC BY) license (https://creativecommons.org/licenses/by/4.0/).
Share and Cite
Kneissl, L.M.; Joffe, R.; Kalin, M.; Emami, N. Improving the Tribological Performance of POM through the Incorporation of Bio-Based Materials. Polymers 2024, 16, 2310. https://doi.org/10.3390/polym16162310
Kneissl LM, Joffe R, Kalin M, Emami N. Improving the Tribological Performance of POM through the Incorporation of Bio-Based Materials. Polymers. 2024; 16(16):2310. https://doi.org/10.3390/polym16162310
Chicago/Turabian StyleKneissl, Lucas M., Roberts Joffe, Mitjan Kalin, and Nazanin Emami. 2024. "Improving the Tribological Performance of POM through the Incorporation of Bio-Based Materials" Polymers 16, no. 16: 2310. https://doi.org/10.3390/polym16162310
APA StyleKneissl, L. M., Joffe, R., Kalin, M., & Emami, N. (2024). Improving the Tribological Performance of POM through the Incorporation of Bio-Based Materials. Polymers, 16(16), 2310. https://doi.org/10.3390/polym16162310