Figure 1.
Methodology of the implemented research.
Figure 1.
Methodology of the implemented research.
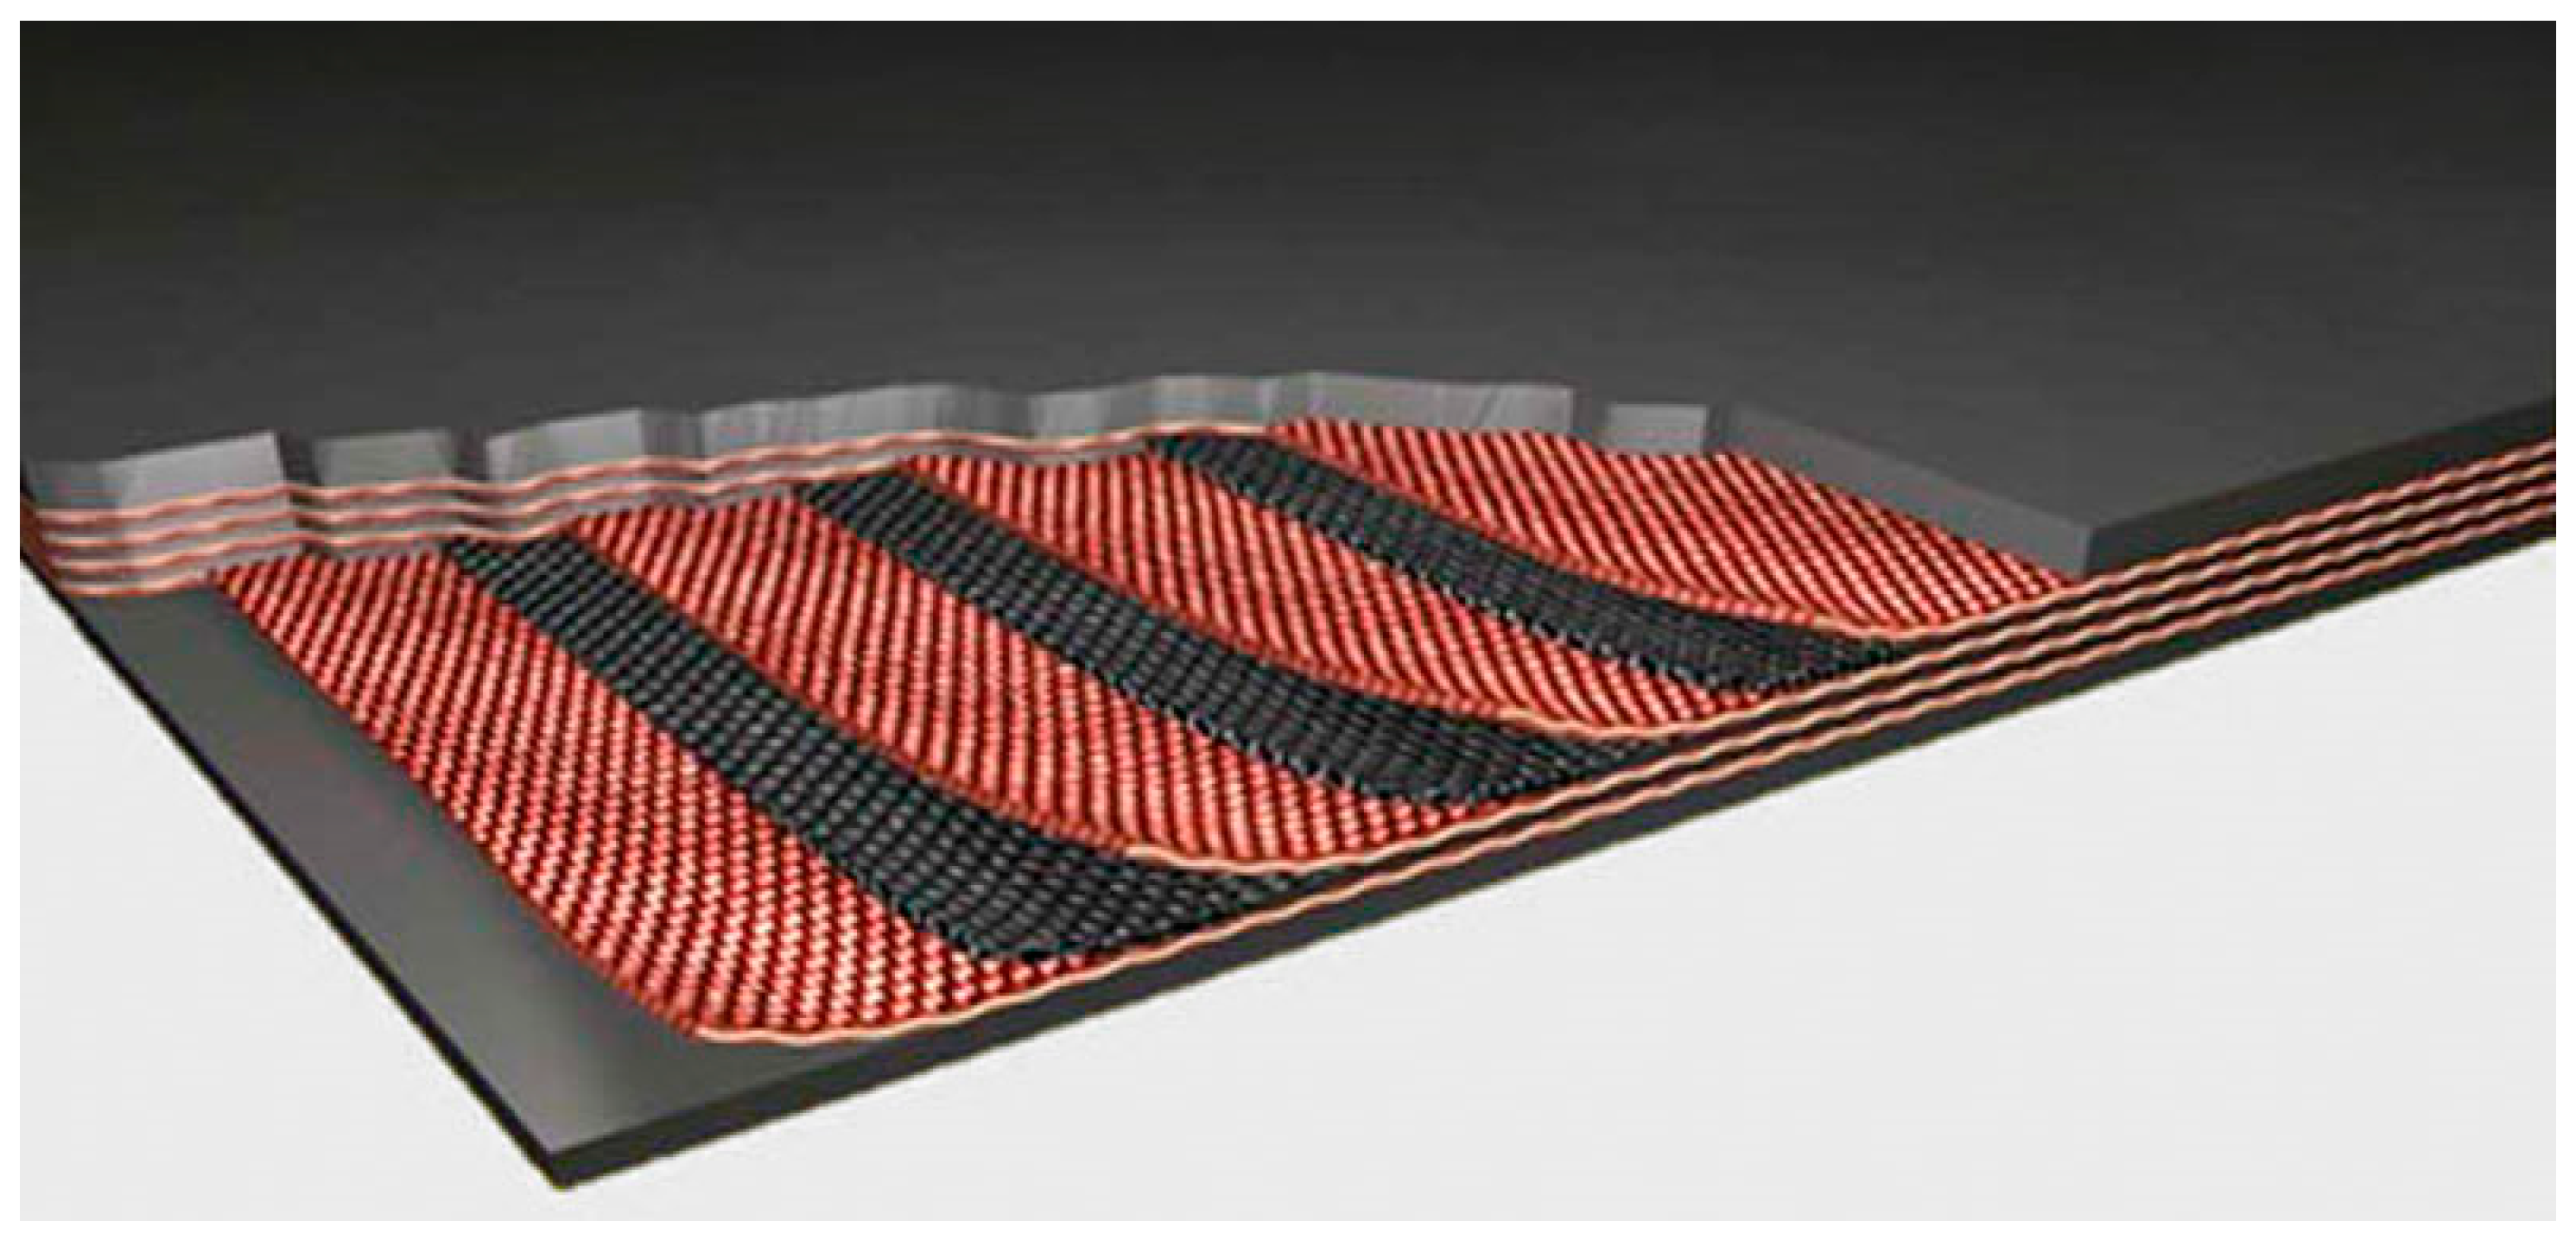
Figure 2.
Construction of a rubber–textile conveyor belt [
21].
Figure 2.
Construction of a rubber–textile conveyor belt [
21].
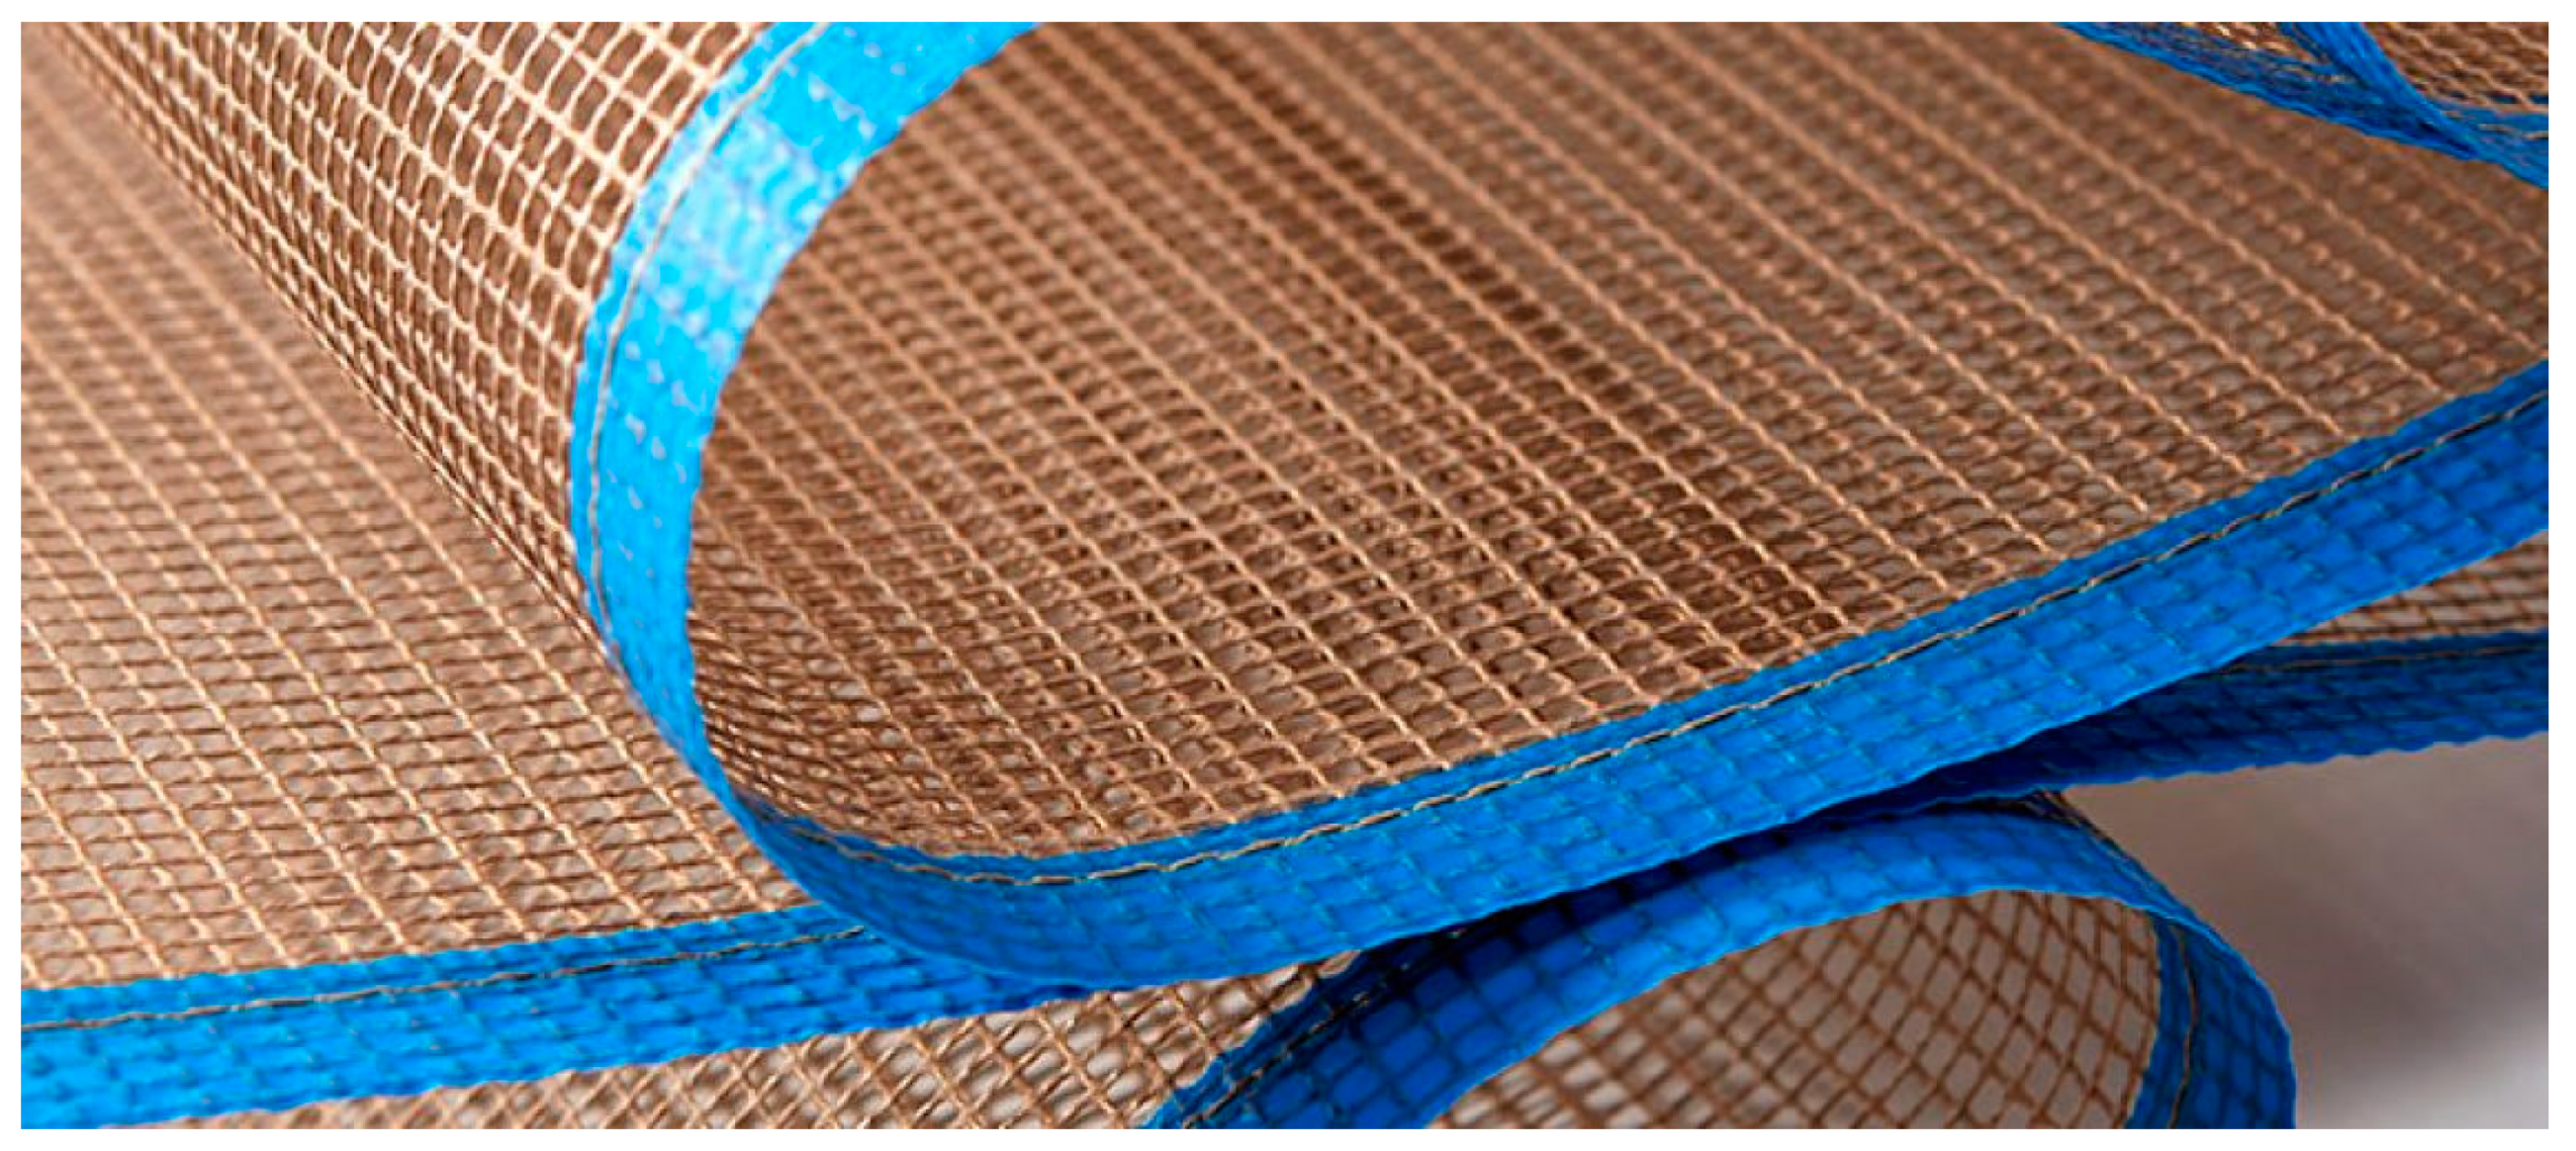
Figure 3.
Example of a textile used to create a carcass of a rubber–textile conveyor belt [
22].
Figure 3.
Example of a textile used to create a carcass of a rubber–textile conveyor belt [
22].
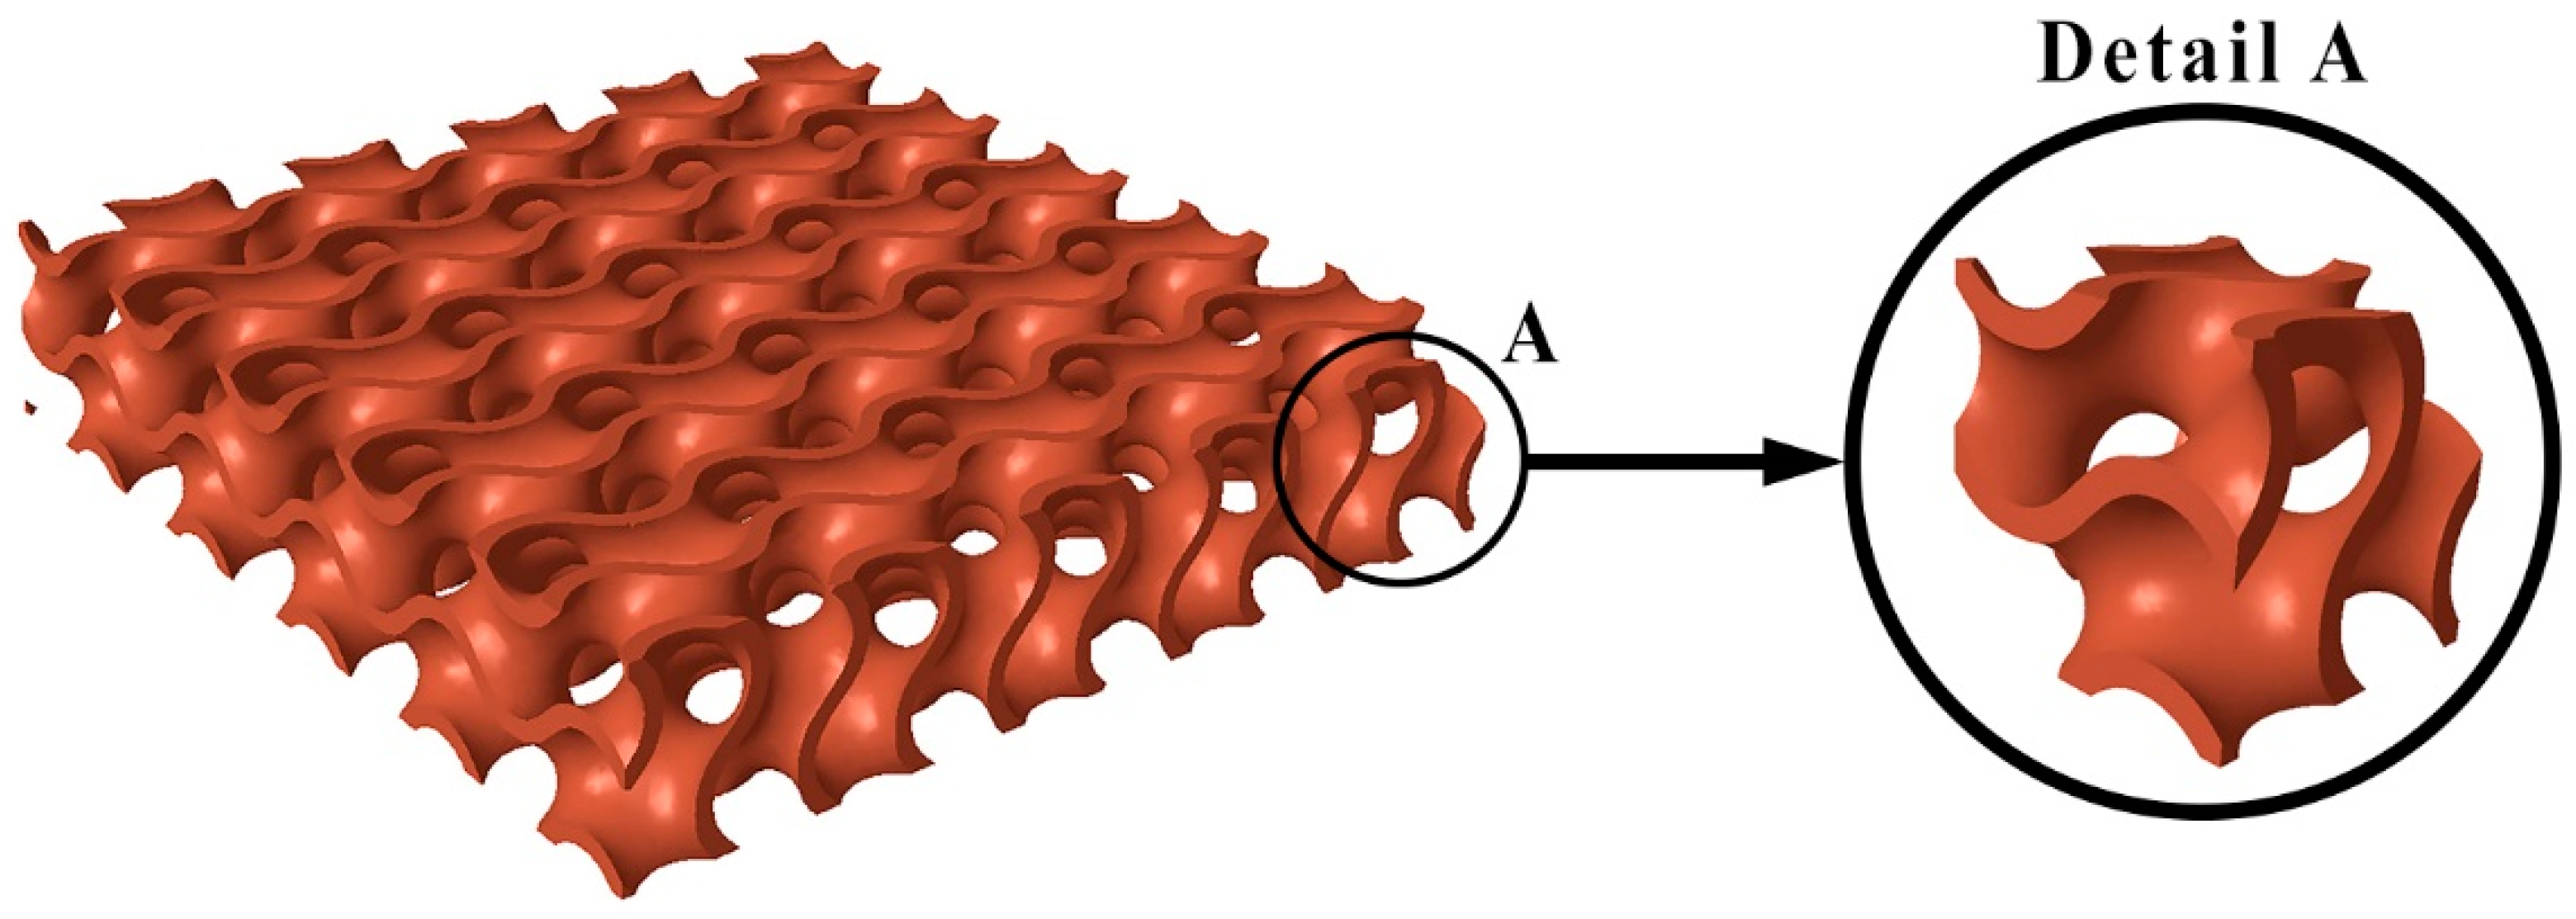
Figure 4.
Three-dimensional (3D) model of the gyroid sample created using PTC Creo Parametric 9.
Figure 4.
Three-dimensional (3D) model of the gyroid sample created using PTC Creo Parametric 9.
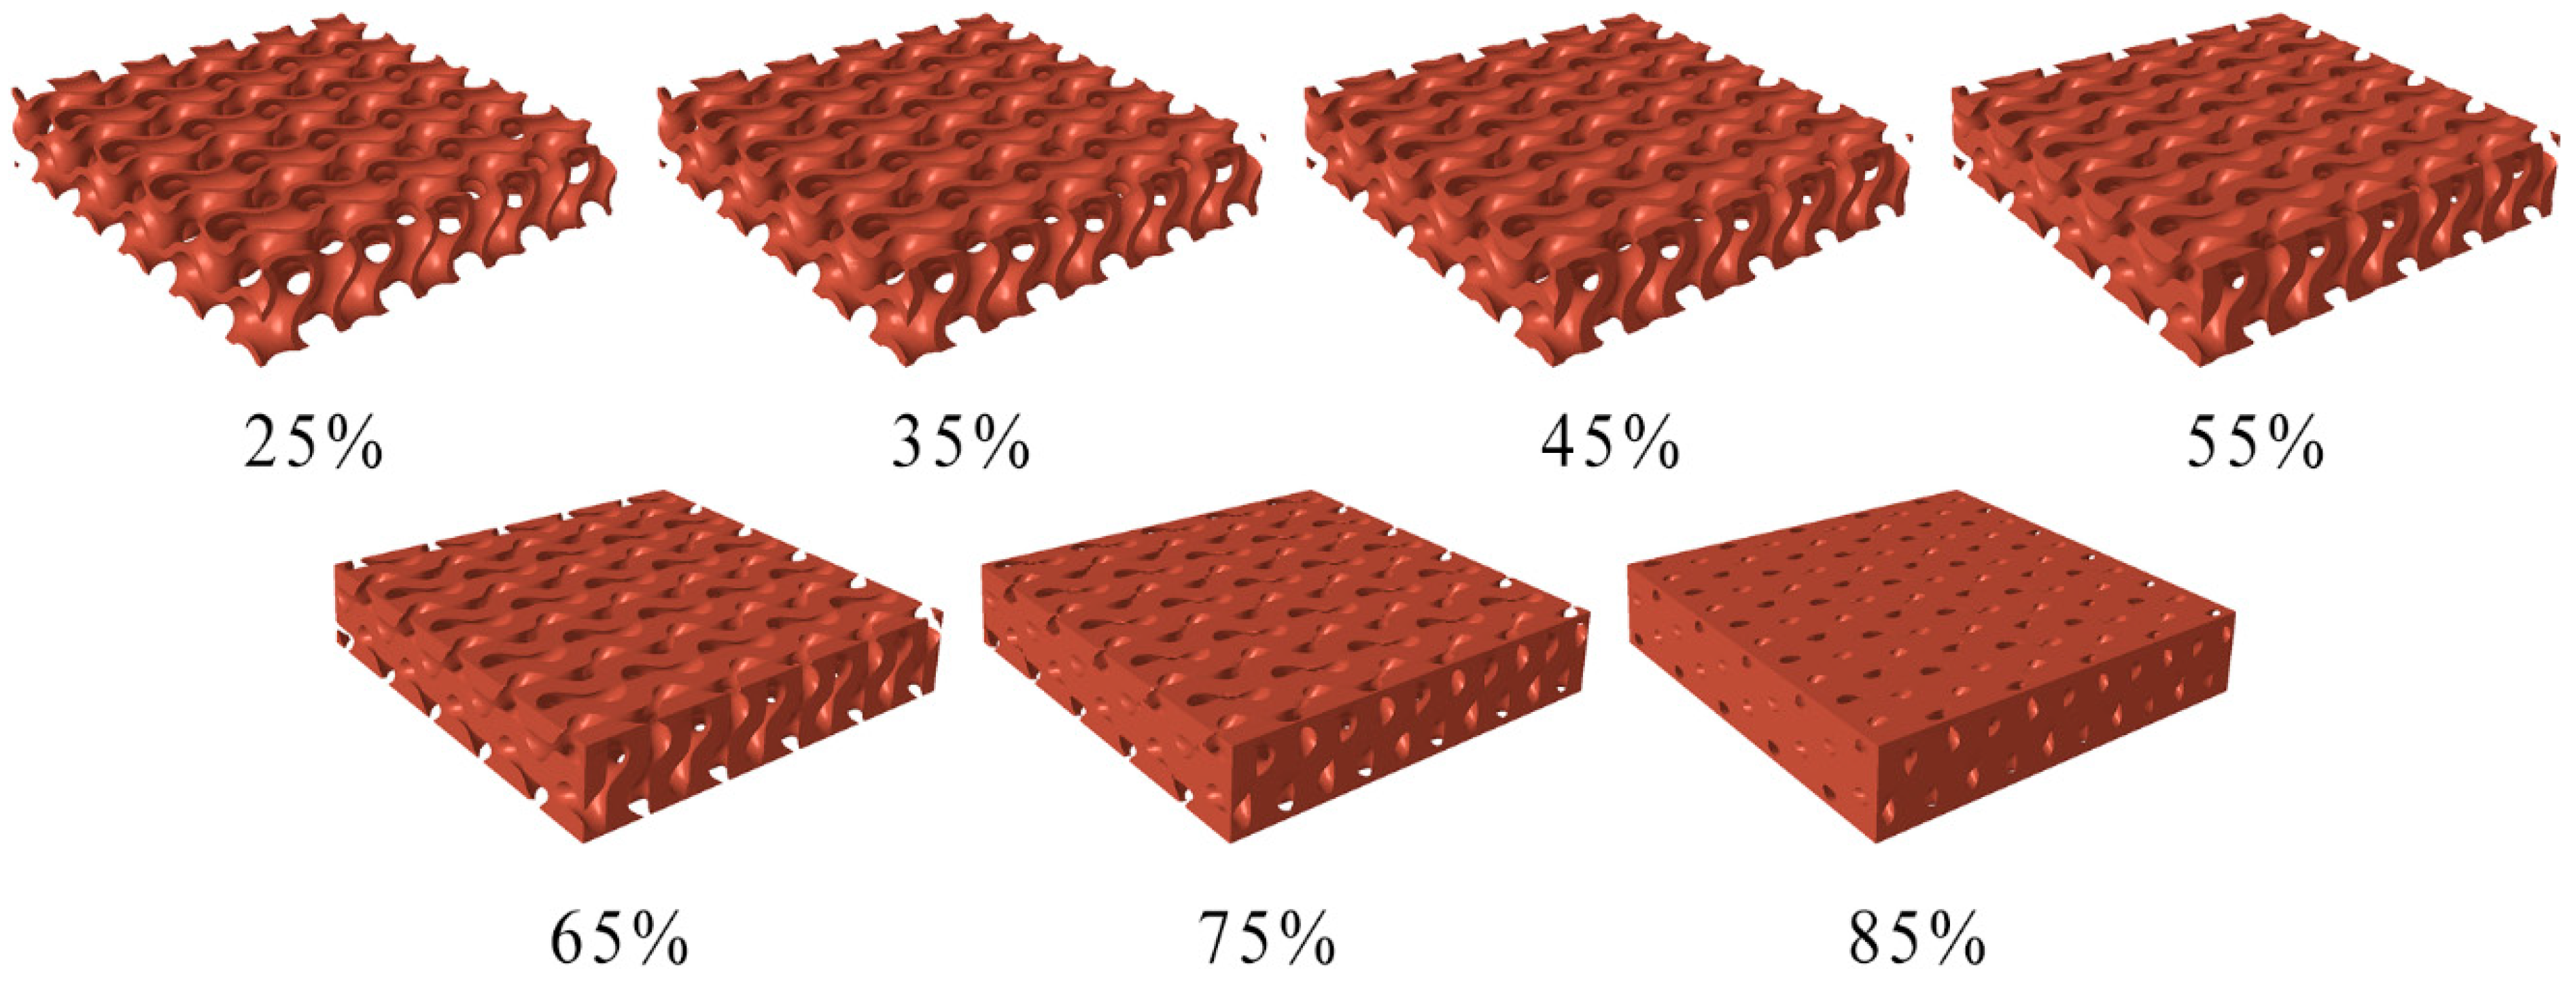
Figure 5.
Three-dimensional (3D) models of gyroid specimens considering seven relative densities.
Figure 5.
Three-dimensional (3D) models of gyroid specimens considering seven relative densities.
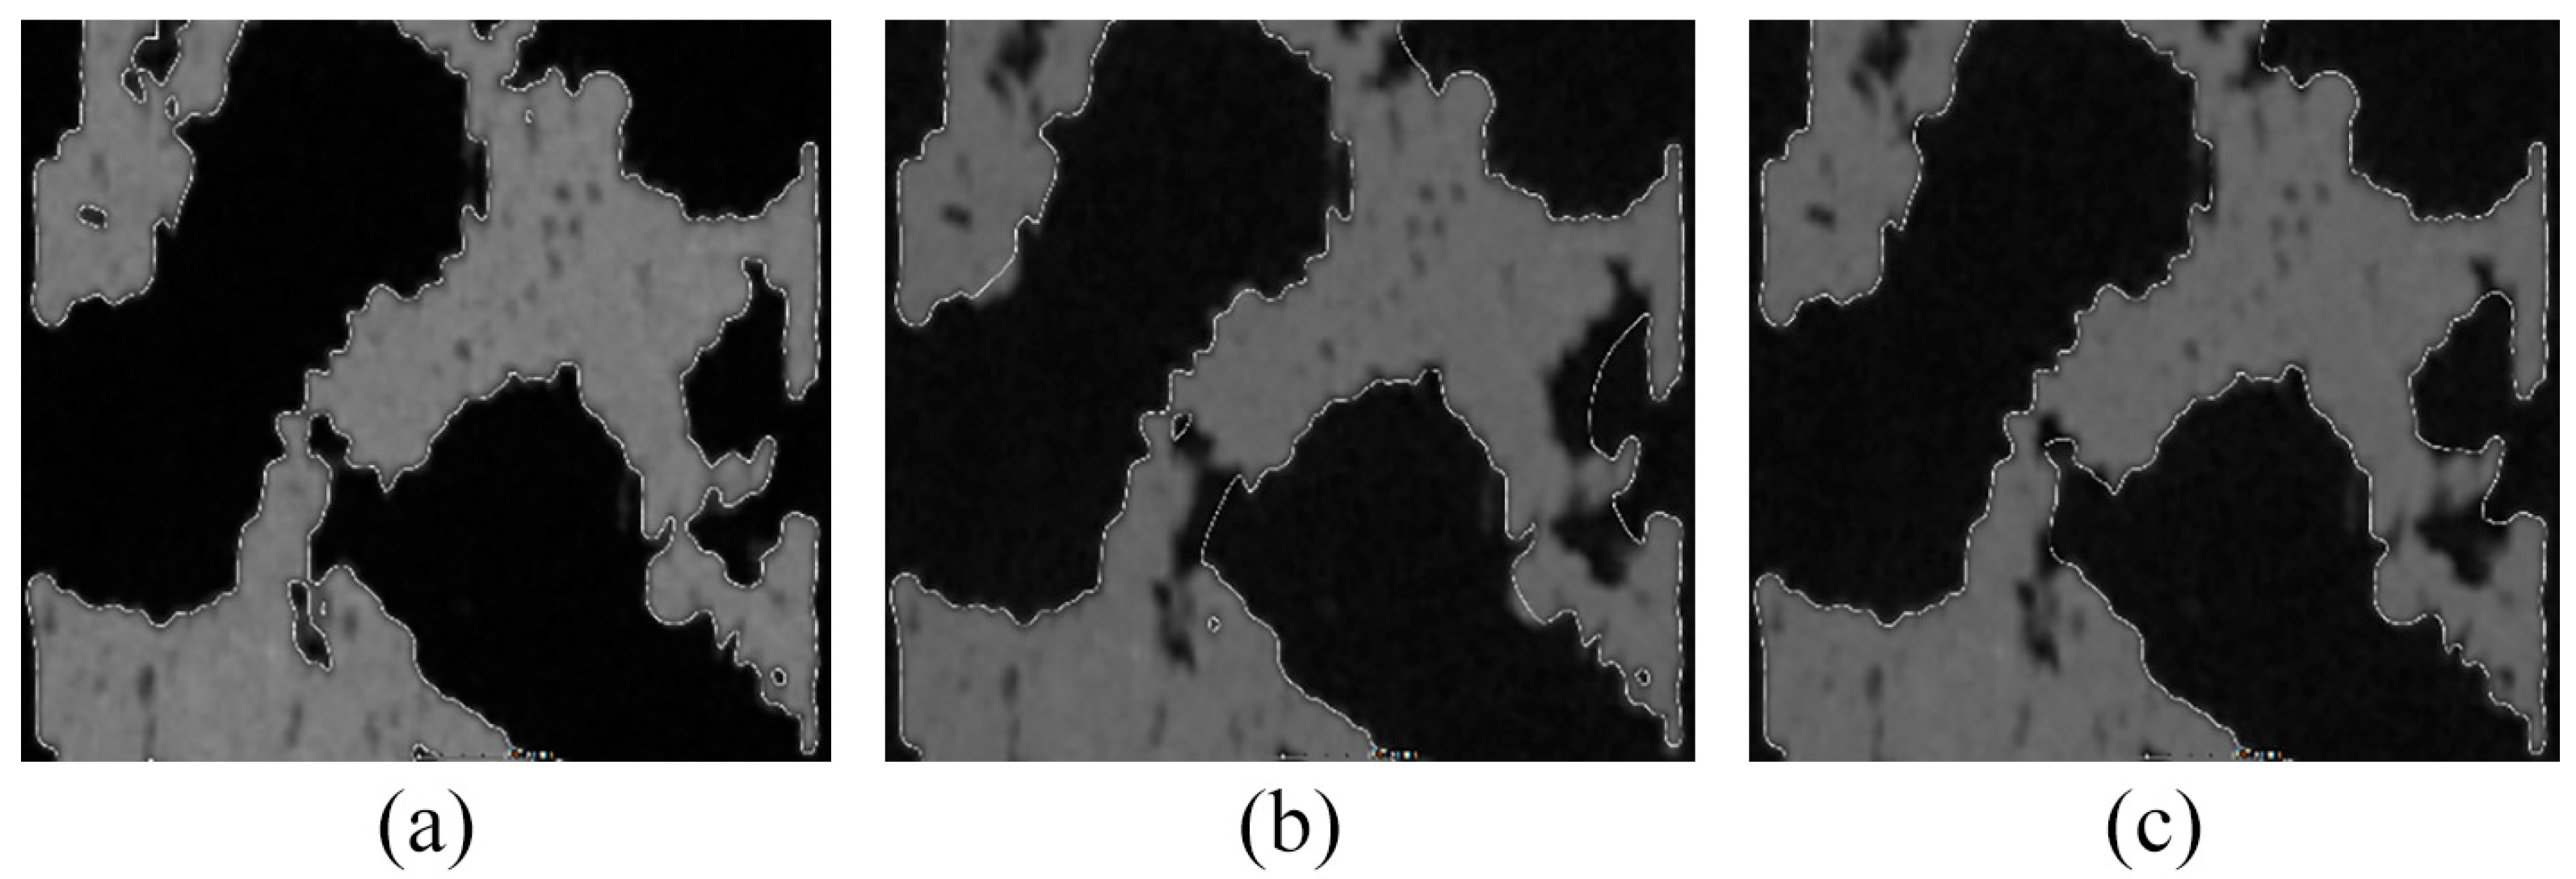
Figure 6.
Details of surface determination: (a) SD_ADV, (b) SD_CAD, and (c) SD_ROI.
Figure 6.
Details of surface determination: (a) SD_ADV, (b) SD_CAD, and (c) SD_ROI.
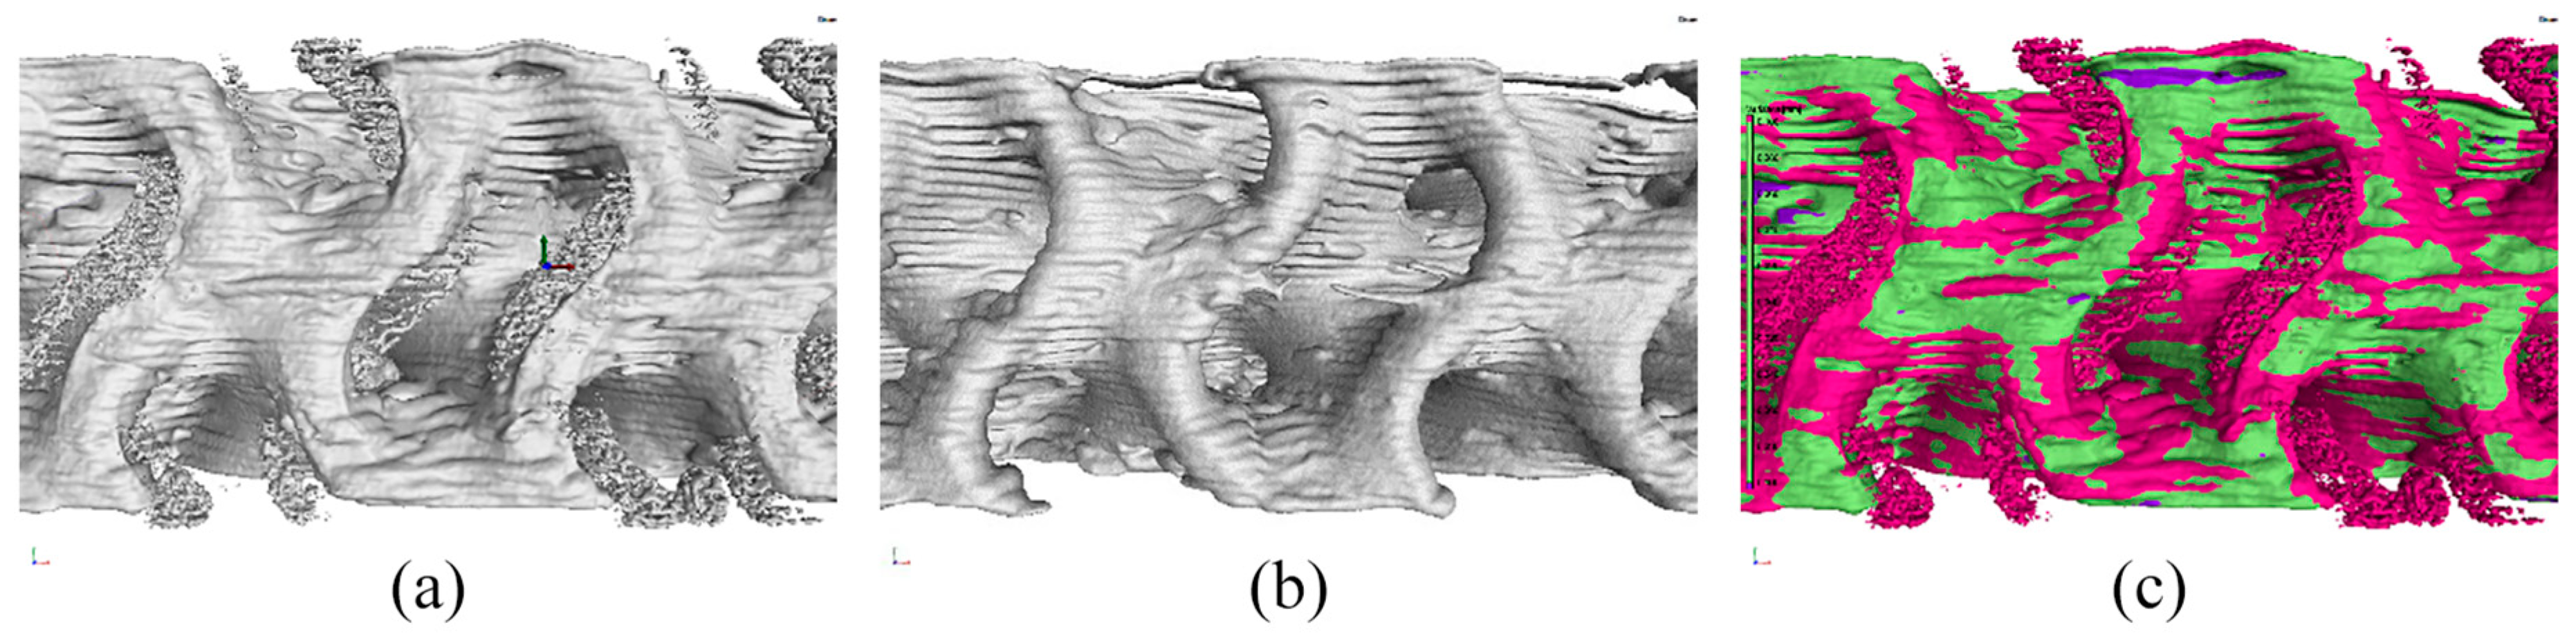
Figure 7.
Comparison and surface determination of specimens: (a) SD_CAD noise, (b) SD_ROI noise, and (c) differences between the noise generated using SD_CAD and SD_ROI indicated in burgundy.
Figure 7.
Comparison and surface determination of specimens: (a) SD_CAD noise, (b) SD_ROI noise, and (c) differences between the noise generated using SD_CAD and SD_ROI indicated in burgundy.
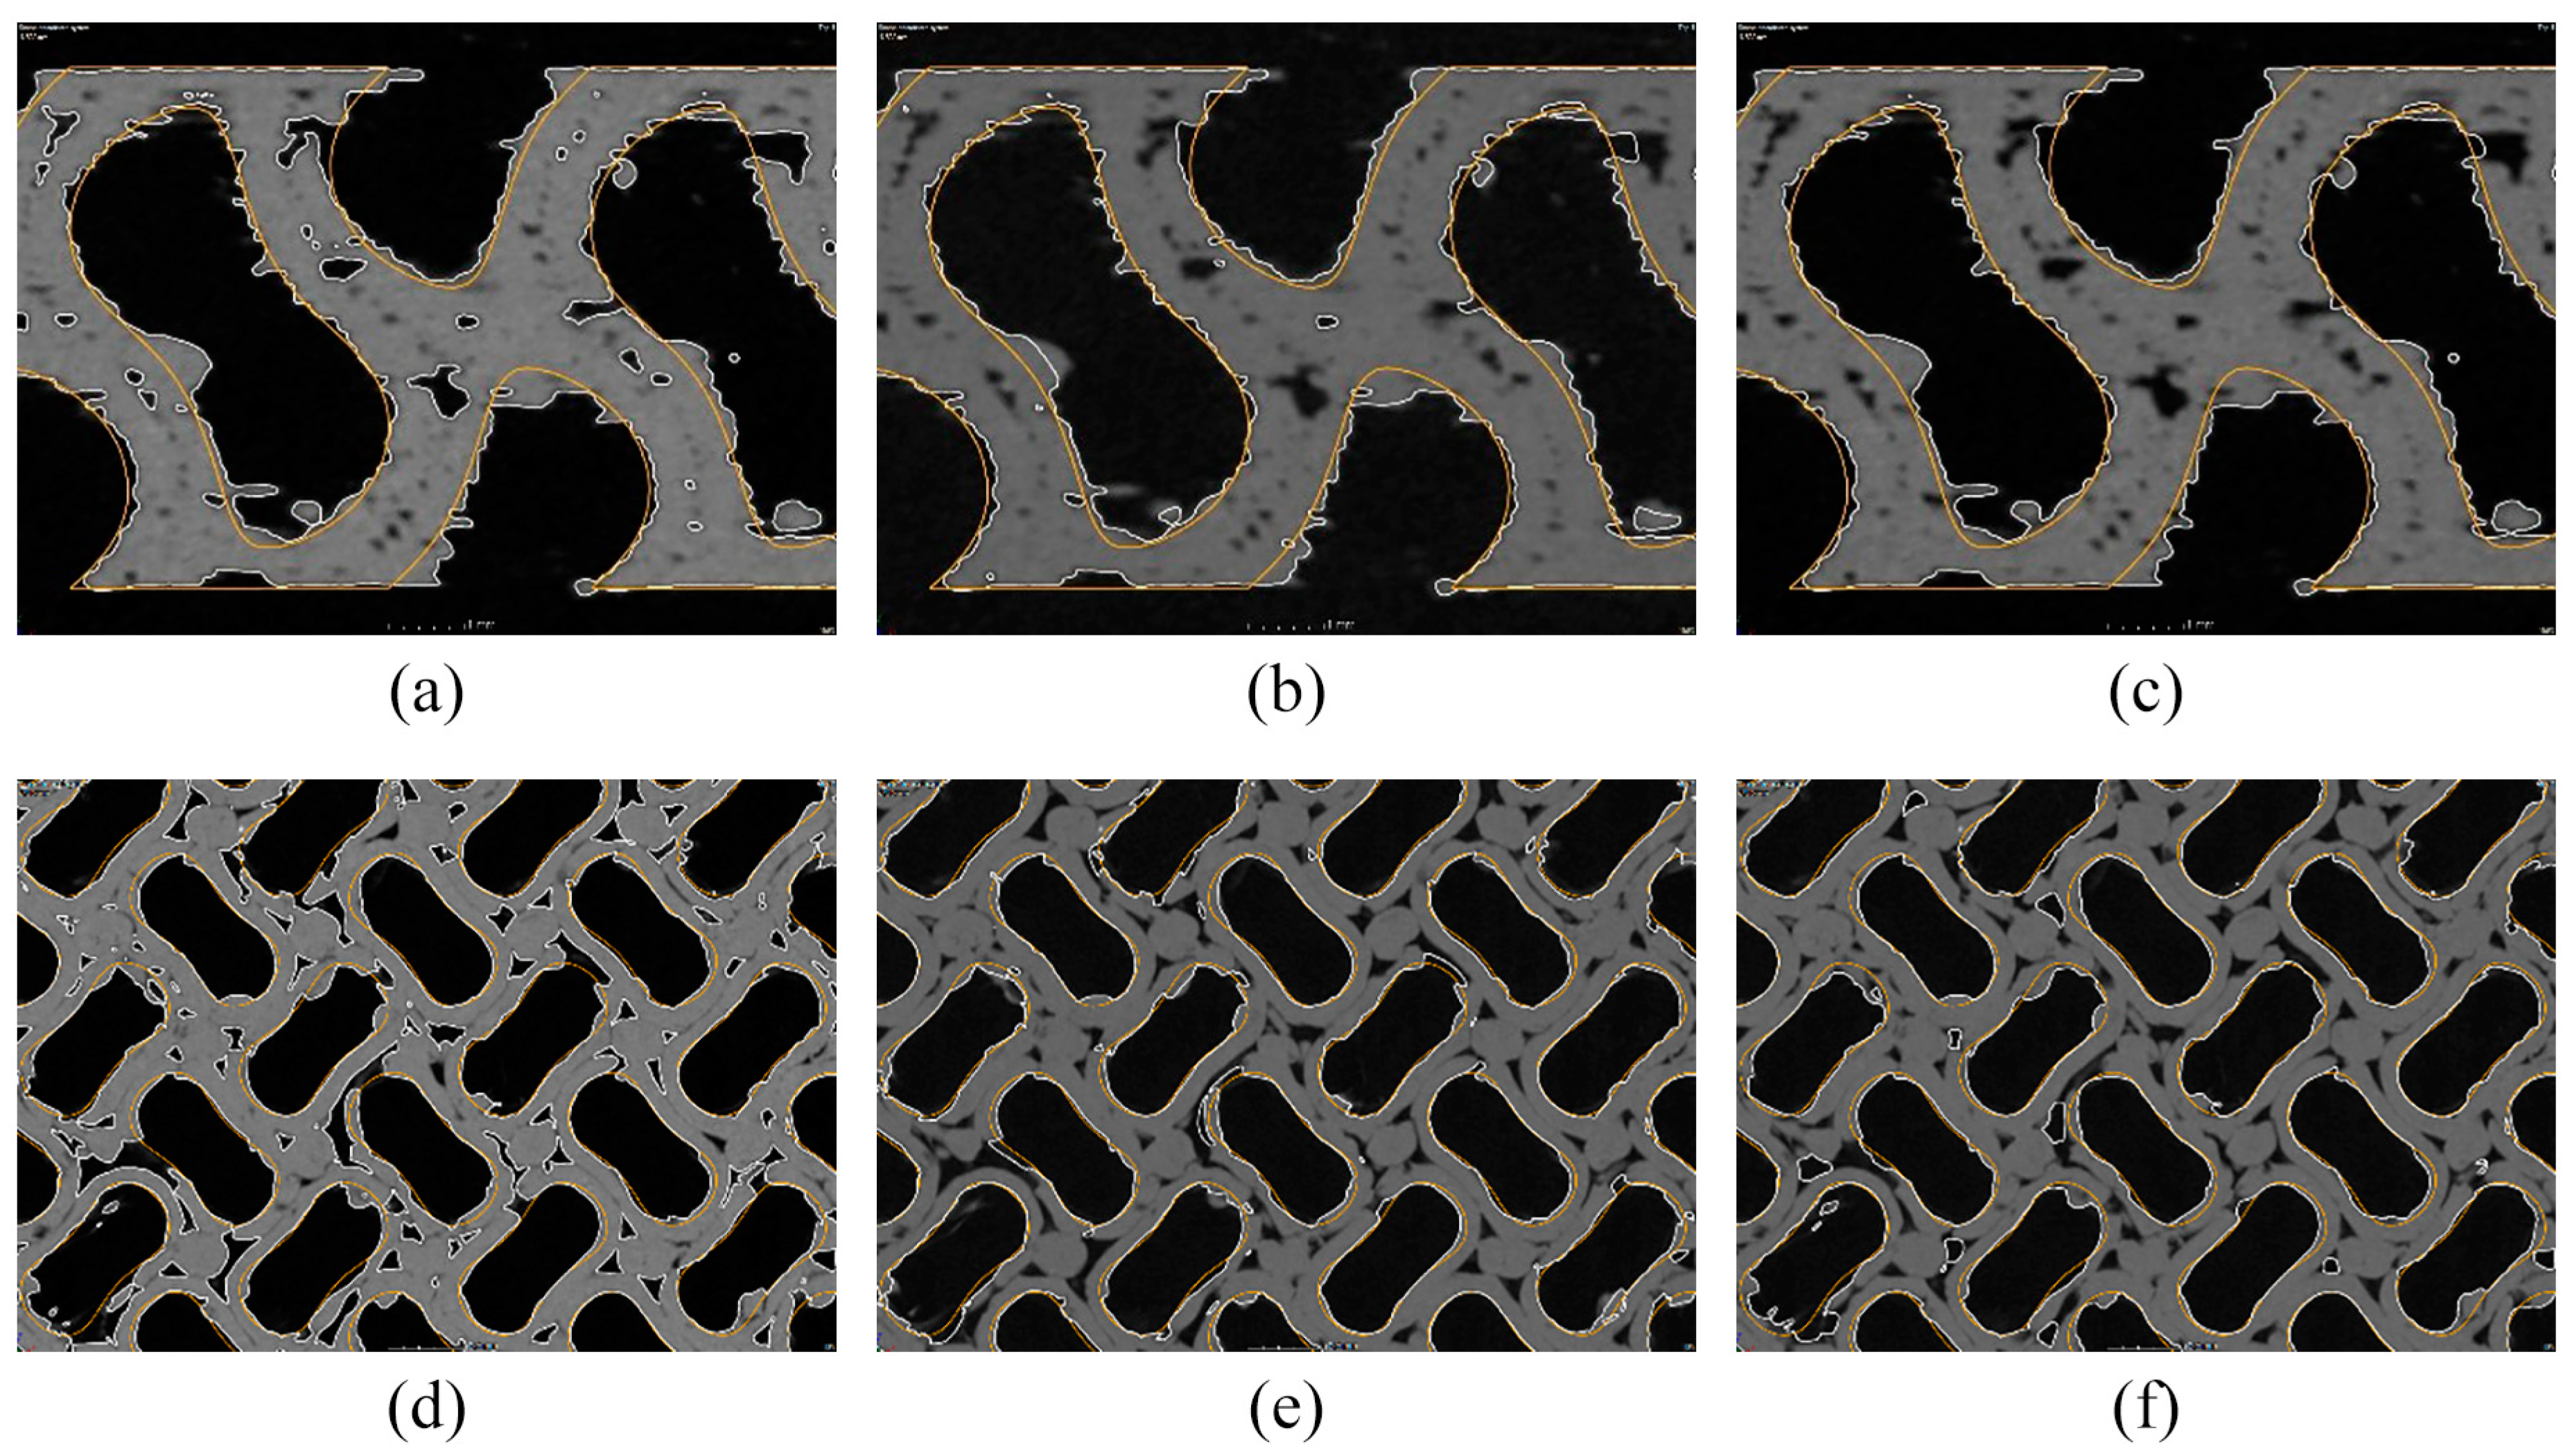
Figure 8.
Sections comparing the surface determination with a computer-aided design (CAD) model: (a) and (d) SD_ADV; (b) and (e) SD_CAD; and (c) and (f) SD_ROI.
Figure 8.
Sections comparing the surface determination with a computer-aided design (CAD) model: (a) and (d) SD_ADV; (b) and (e) SD_CAD; and (c) and (f) SD_ROI.
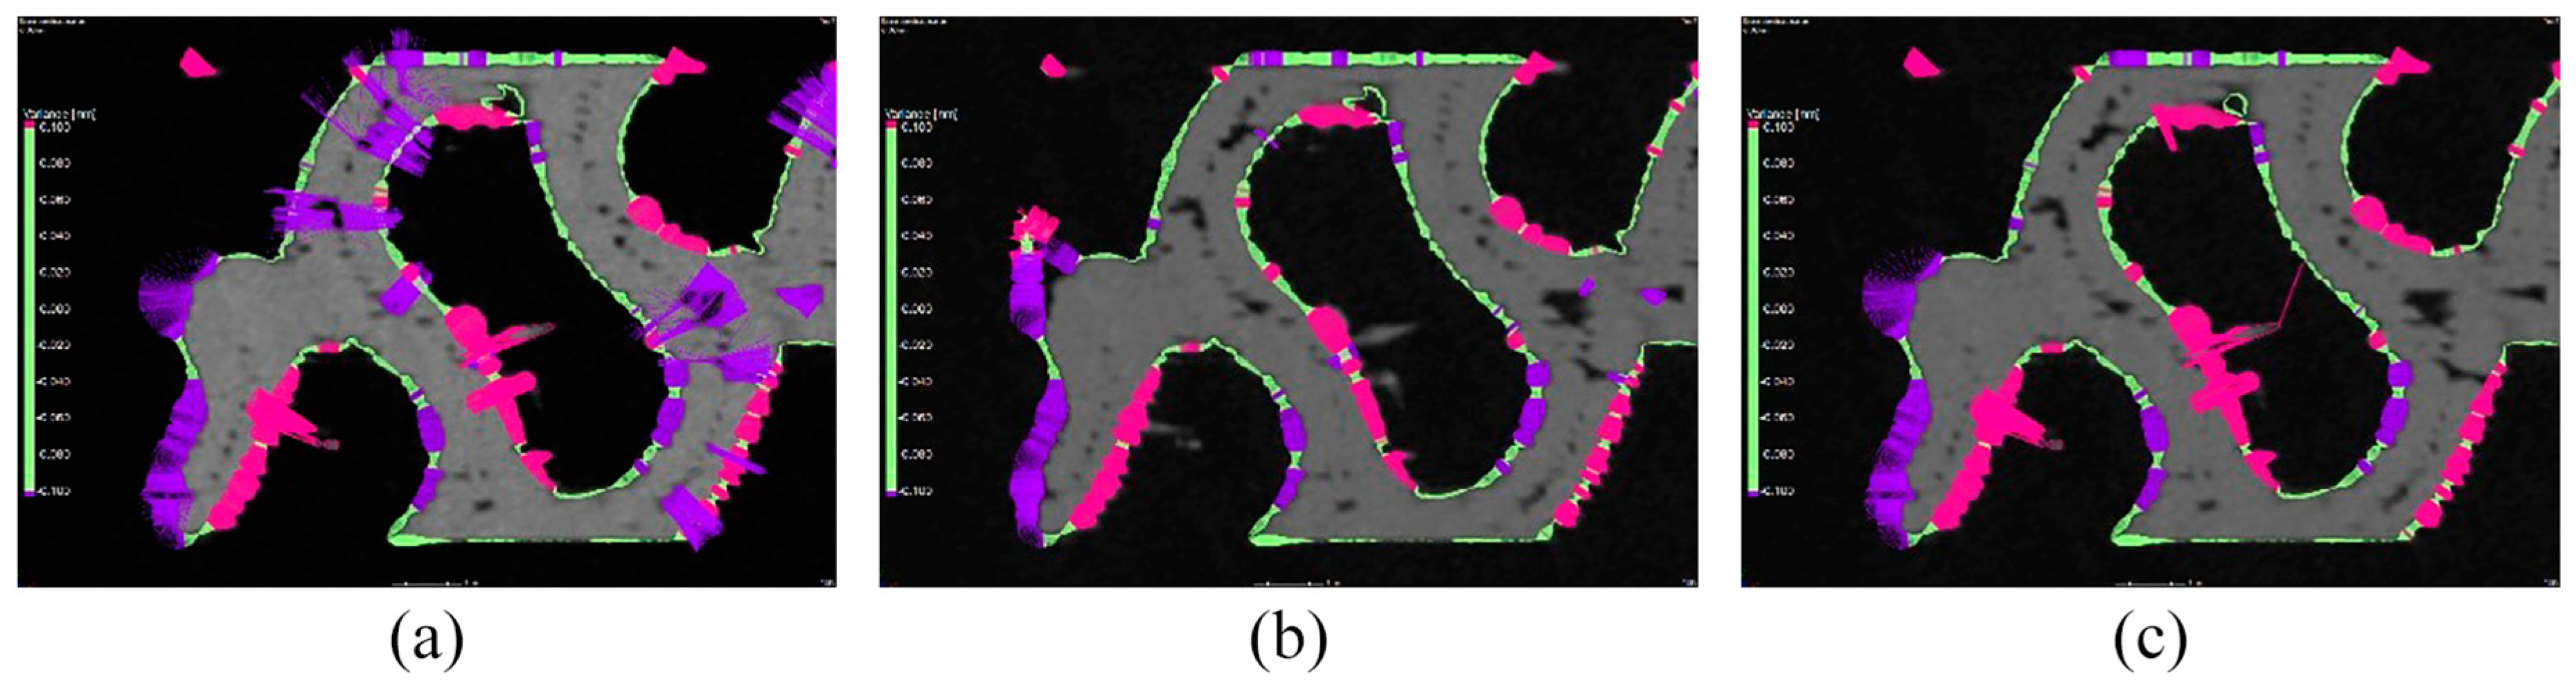
Figure 9.
Nominal–actual comparison of individual surface determinations with the reference computer-aided design (CAD) model: (a) SD_ADV, (b) SD_CAD, and (c) SD_ROI.
Figure 9.
Nominal–actual comparison of individual surface determinations with the reference computer-aided design (CAD) model: (a) SD_ADV, (b) SD_CAD, and (c) SD_ROI.
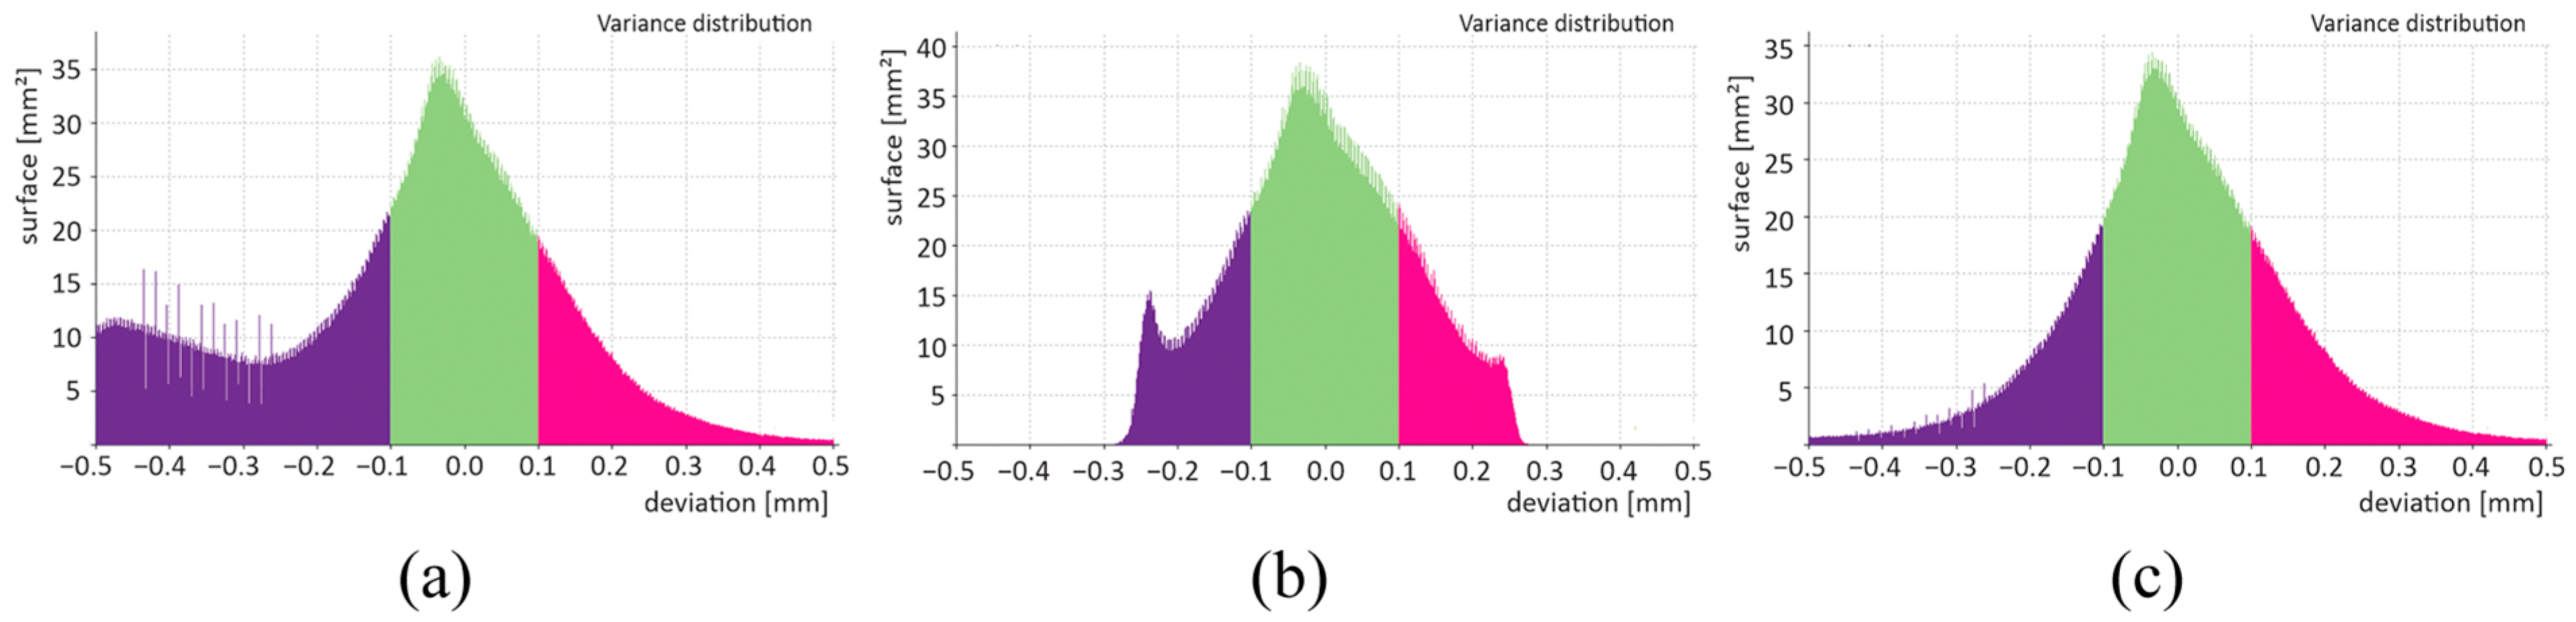
Figure 10.
Histograms of individual nominal–actual comparisons: (a) SD_ADV, (b) SD_CAD, and (c) SD_ROI.
Figure 10.
Histograms of individual nominal–actual comparisons: (a) SD_ADV, (b) SD_CAD, and (c) SD_ROI.
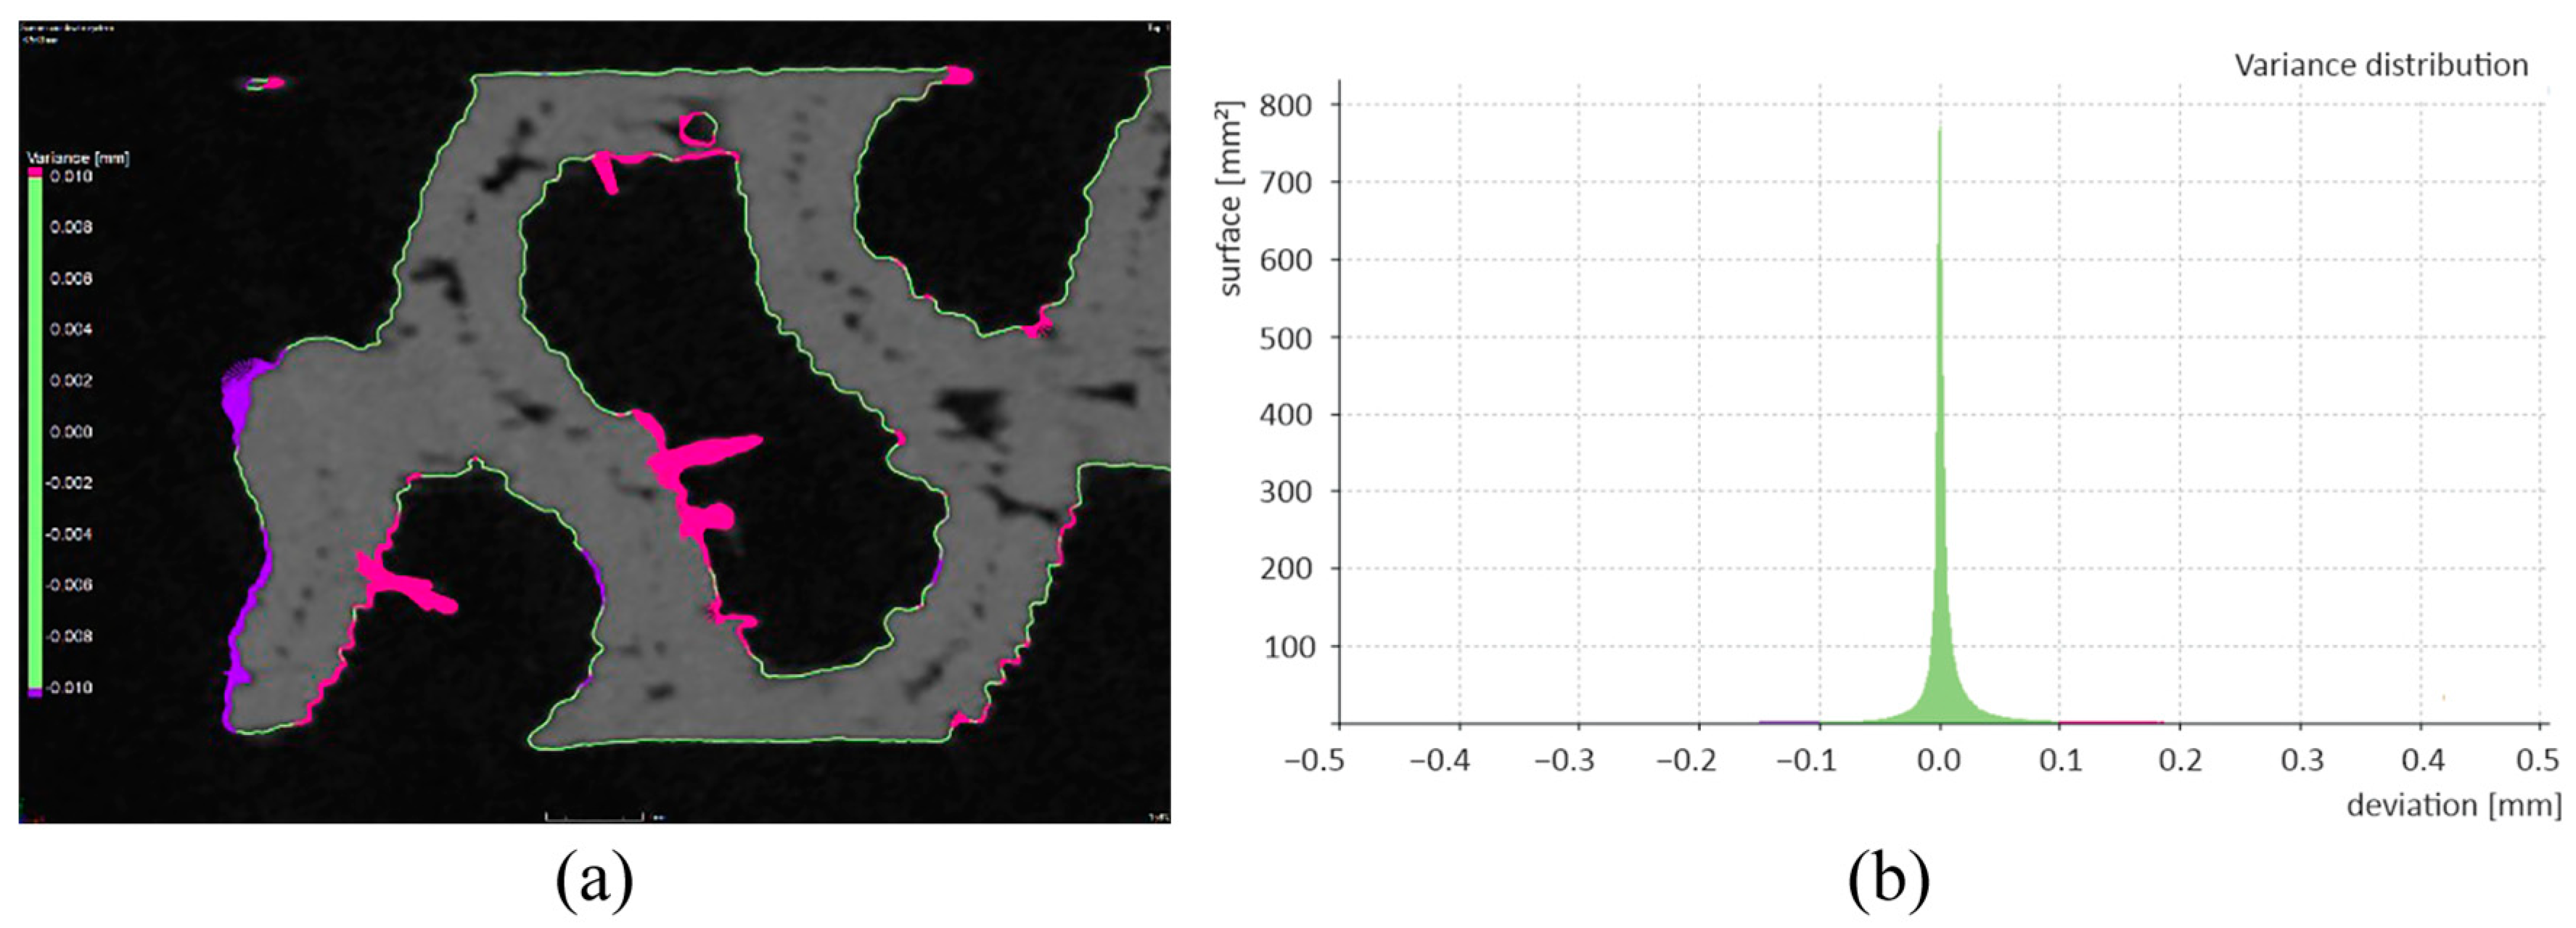
Figure 11.
Nominal–actual comparison of SD_ROI and SD_CAD with (a) the display of deviations and (b) the histogram of deviations.
Figure 11.
Nominal–actual comparison of SD_ROI and SD_CAD with (a) the display of deviations and (b) the histogram of deviations.
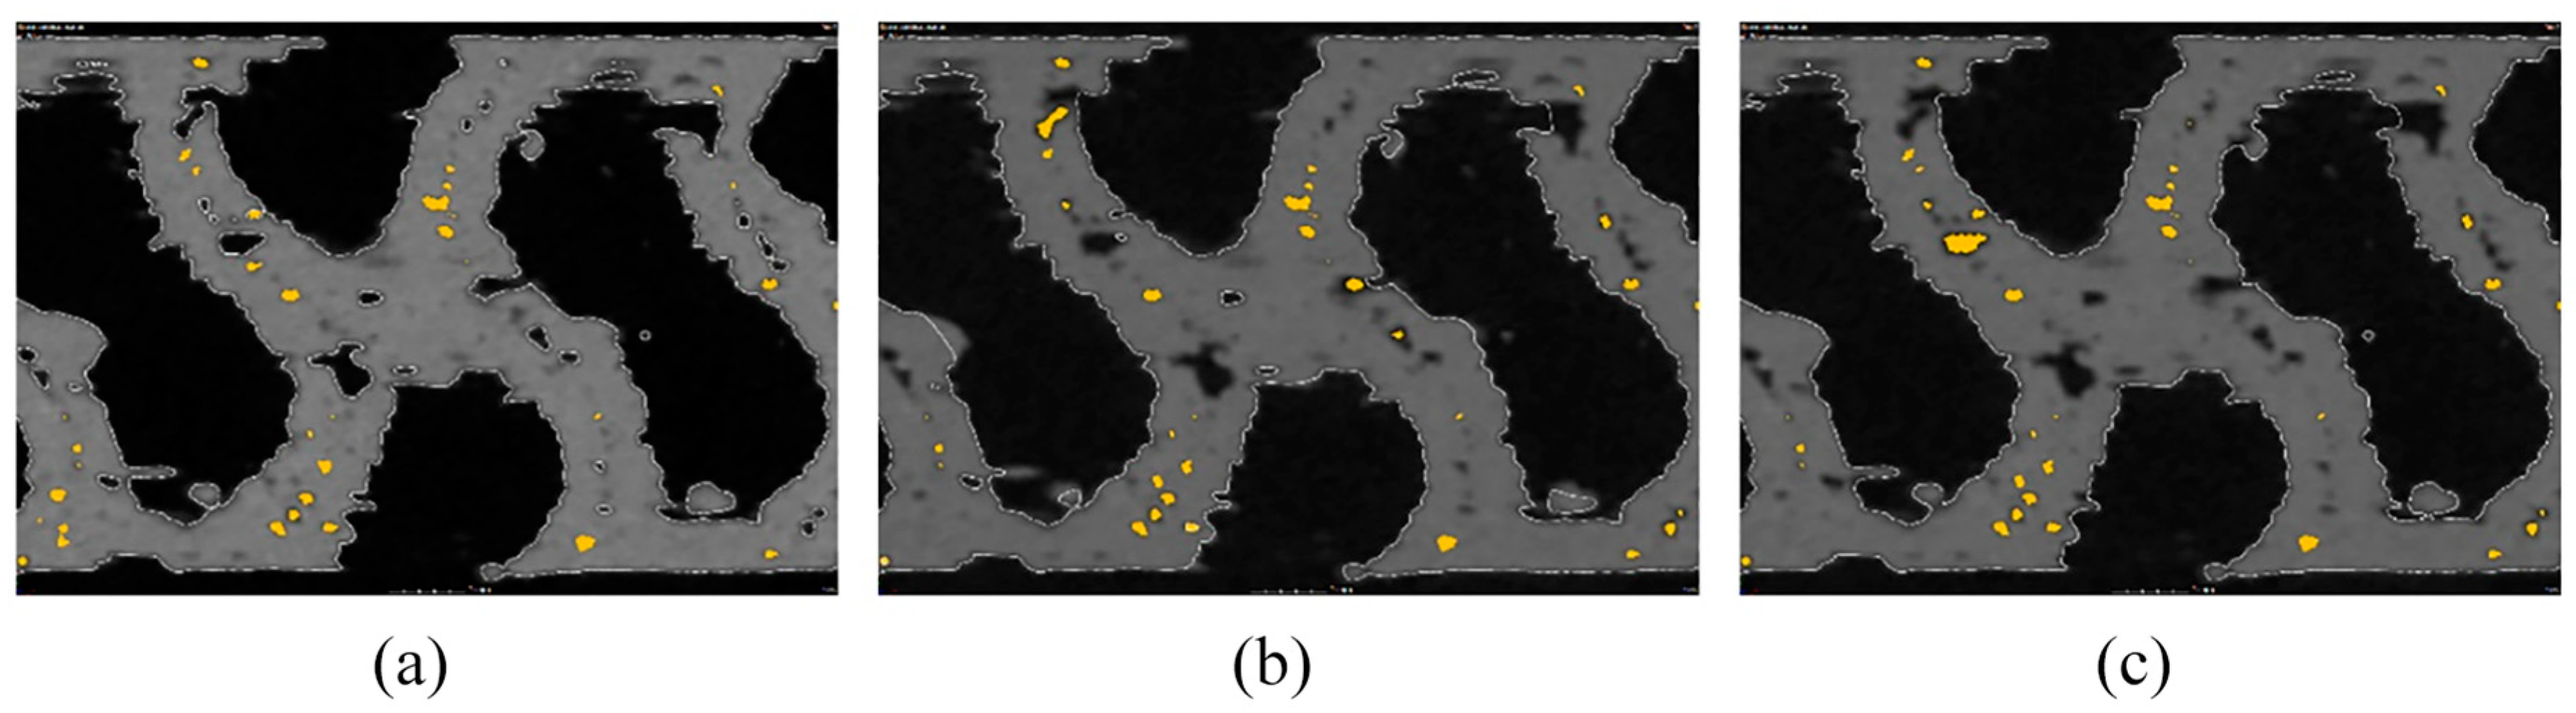
Figure 12.
Differences in porosity assessment with respect to (a) SD_ADV, (b) SD_CAD, and (c) SD_ROI.
Figure 12.
Differences in porosity assessment with respect to (a) SD_ADV, (b) SD_CAD, and (c) SD_ROI.
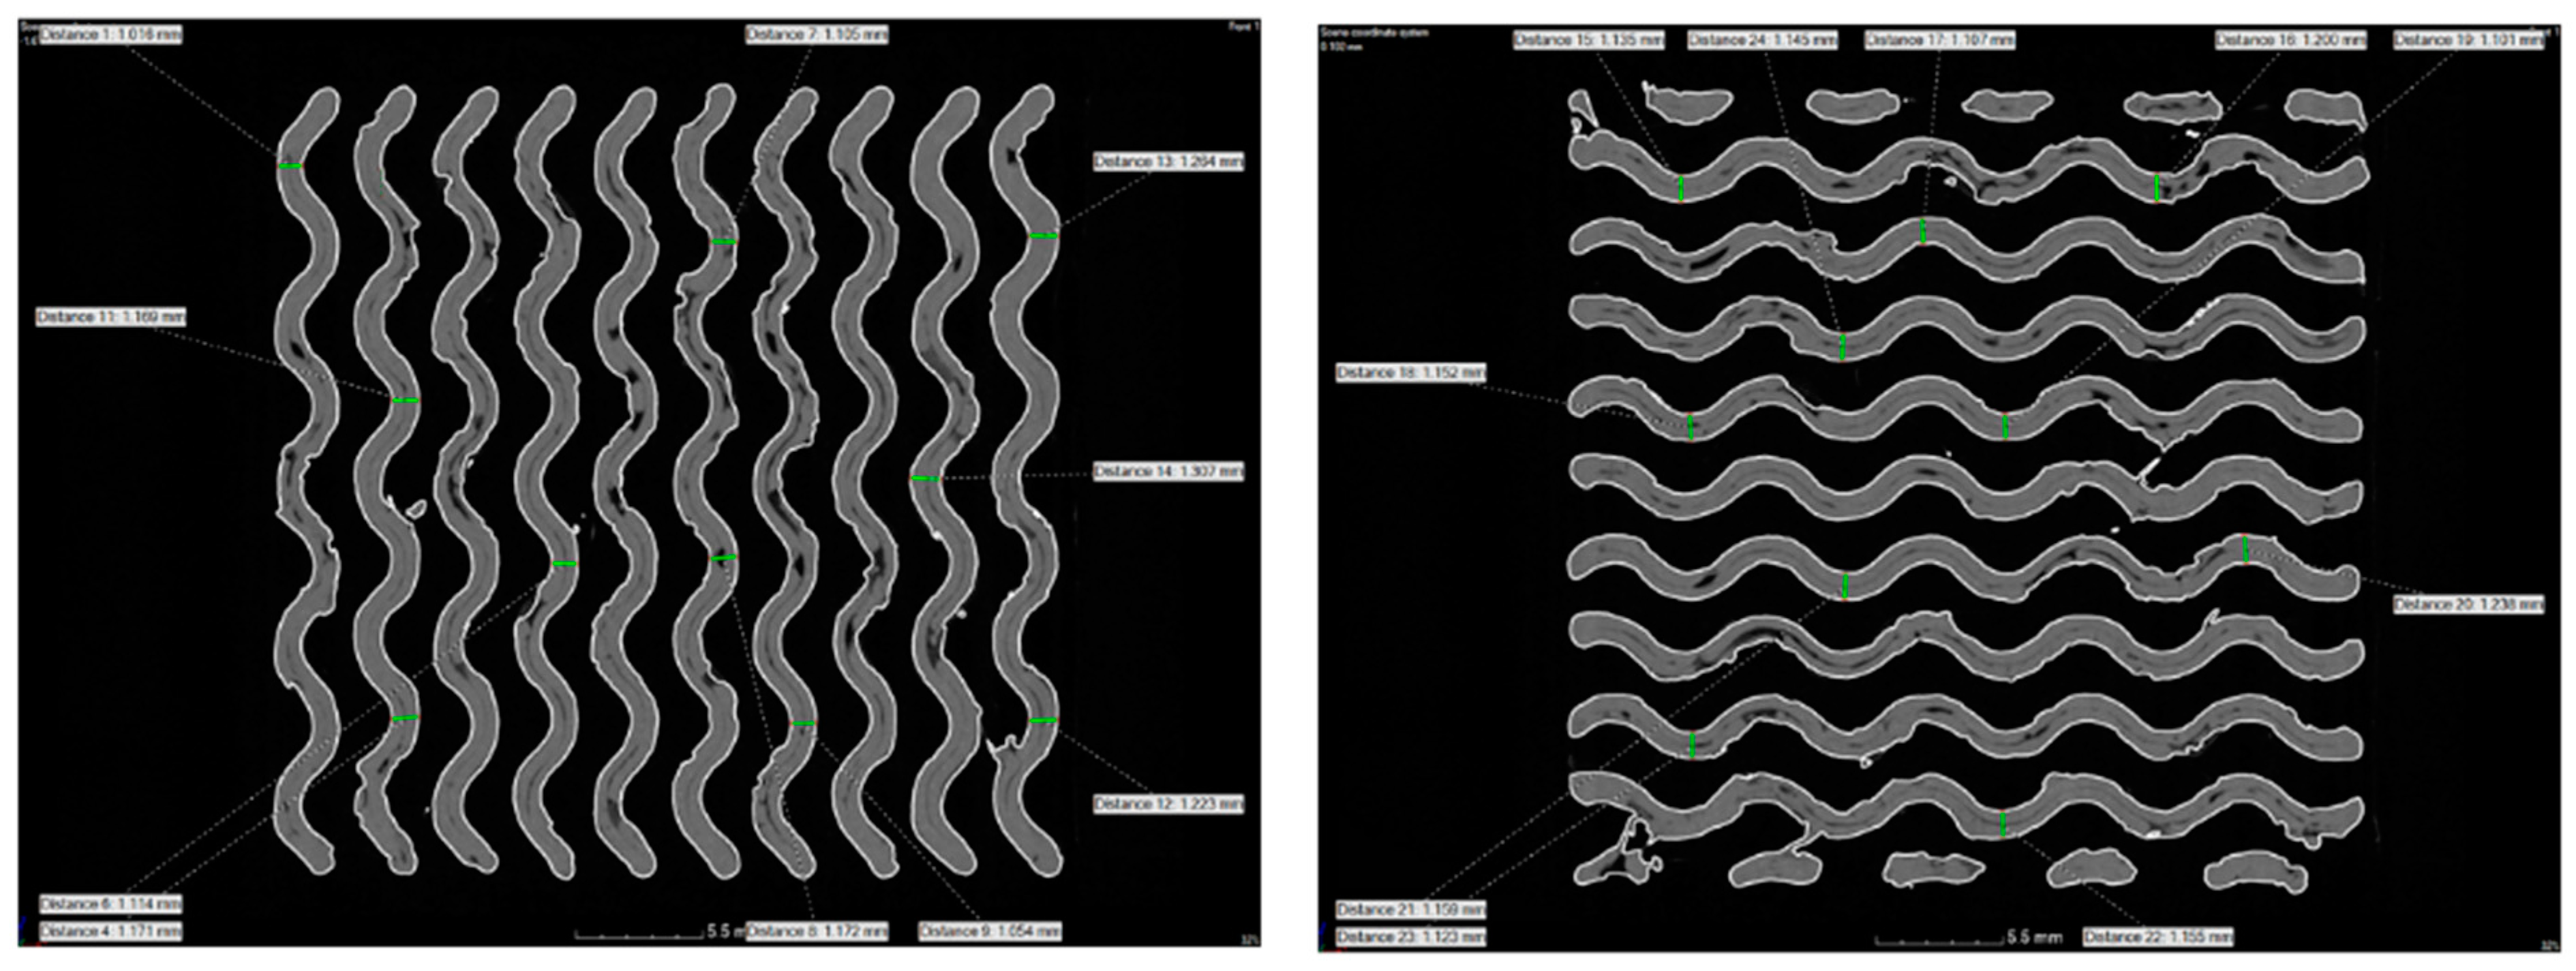
Figure 13.
Measurement locations of the wall thickness in a specimen with 45% material volume in two mutually perpendicular layers.
Figure 13.
Measurement locations of the wall thickness in a specimen with 45% material volume in two mutually perpendicular layers.
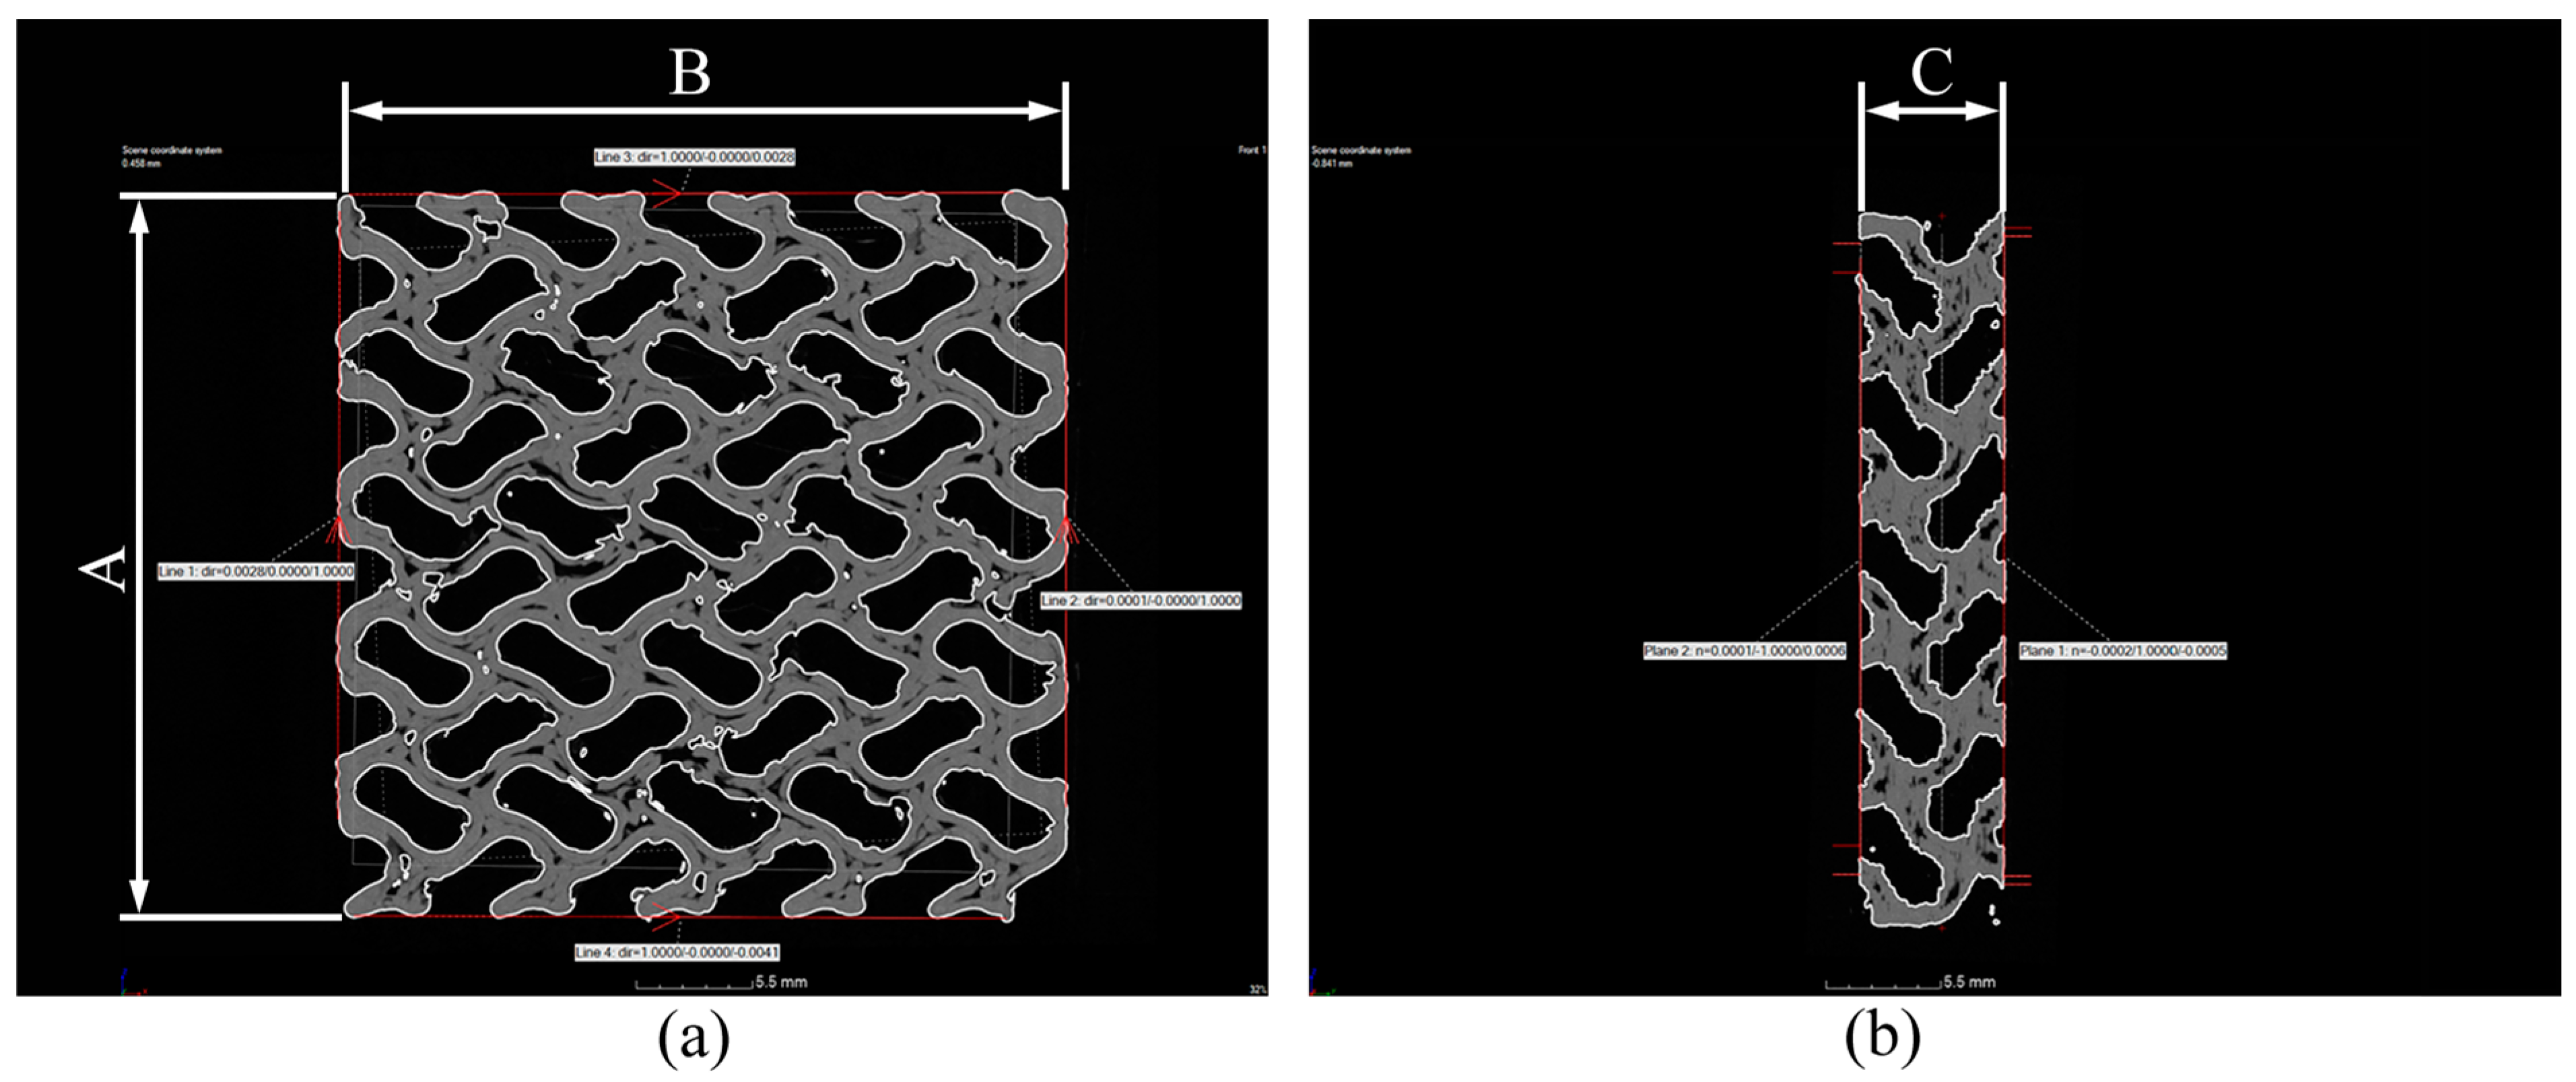
Figure 14.
Features created for measuring the dimensions of specimens. (a) Measuring the base dimensions and (b) the height. A,B,C—sample dimensions.
Figure 14.
Features created for measuring the dimensions of specimens. (a) Measuring the base dimensions and (b) the height. A,B,C—sample dimensions.
Table 1.
Printing parameters for fabricating the experimental specimens.
Table 1.
Printing parameters for fabricating the experimental specimens.
| Nozzle temperature | 240 °C |
| Bed temperature | 50 °C |
| First layer speed | 20 mm.s−1 |
| Infill speed | 70 mm.s−1 |
Table 2.
Properties of the Flexfill 92A material.
Table 2.
Properties of the Flexfill 92A material.
| Material density | 1.20 g.cm−3 |
| Filament diameter | 1.75 mm |
| Tensile strength | 49 MPa |
| Tensile stress | 7.50 MPa |
| Elongation at break | 600% |
| Tear strength | 85 kN.m−1 |
Table 3.
Parameters of the 3D models of the experimental specimens.
Table 3.
Parameters of the 3D models of the experimental specimens.
| Volume of the Entire Sample (mm3) | Sample Name | Cell Size (mm) | Relative Density (%) | Wall Thickness (mm) | Sample Volume (mm3) |
|---|
| 8575.000 | gyroid_25 | 7 | 25.080 | 0.500 | 2150.770 |
| gyroid_35 | 35.230 | 0.700 | 3020.760 |
| gyroid_45 | 45.490 | 0.900 | 3900.990 |
| gyroid_55 | 55.410 | 1.090 | 4751.550 |
| gyroid_65 | 65.510 | 1.280 | 5617.460 |
| gyroid_75 | 75.260 | 1.460 | 6453.900 |
| gyroid_85 | 85.620 | 1.640 | 7341.530 |
Table 4.
Measured and reviewed values of the specimen for 25% relative density.
Table 4.
Measured and reviewed values of the specimen for 25% relative density.
| Gyroid_25 | V (mm3) | S (mm2) | Porosity (%) | Cumulative Deviation at 90% |
|---|
| SD_ADV | 2103.880 | 9723.980 | 0.050 | 0.217 |
| SD_CAD | 2112.140 | 10,005.100 | 0.050 | 0.094 |
| SD_ROI | 2095.560 | 9433.34 | 0.050 | 0.209 |
Table 5.
Measured and reviewed values of the specimen for 35% relative density.
Table 5.
Measured and reviewed values of the specimen for 35% relative density.
| Gyroid_35 | V (mm3) | S (mm2) | Porosity (%) | Cumulative Deviation at 90% |
|---|
| SD_ADV | 3096.830 | 10,294.570 | 0.970 | 0.255 |
| SD_CAD | 3029.520 | 10,527.770 | 0.640 | 0.096 |
| SD_ROI | 3097.000 | 9517.900 | 0.680 | 0.239 |
Table 6.
Measured and reviewed values of the specimen for 45% relative density.
Table 6.
Measured and reviewed values of the specimen for 45% relative density.
| Gyroid_45 | V (mm3) | S (mm2) | Porosity (%) | Cumulative Deviation at 90% |
|---|
| SD_ADV | 3584.250 | 12,679.430 | 1.270 | 0.397 |
| SD_CAD | 3788.900 | 10,637.470 | 1.580 | 0.206 |
| SD_ROI | 3810.630 | 9644.390 | 1.740 | 0.240 |
Table 7.
Measured and reviewed values of the specimen for 55% relative density.
Table 7.
Measured and reviewed values of the specimen for 55% relative density.
| Gyroid_55 | V (mm3) | S (mm2) | Porosity (%) | Cumulative Deviation at 90% |
|---|
| SD_ADV | 4342.750 | 14,166.270 | 1.610 | 0.388 |
| SD_CAD | 4649.900 | 10,841.910 | 2.560 | 0.204 |
| SD_ROI | 4637.780 | 10,243.940 | 2.970 | 0.245 |
Table 8.
Measured and reviewed values of the specimen for 65% relative density.
Table 8.
Measured and reviewed values of the specimen for 65% relative density.
| Gyroid_65 | V (mm3) | S (mm2) | Porosity (%) | Cumulative Deviation at 90% |
|---|
| SD_ADV | 5540.730 | 11,734.600 | 3.600 | 0.602 |
| SD_CAD | 5627.270 | 10,840.770 | 3.950 | 0.096 |
| SD_ROI | 5739.340 | 9055.880 | 4.060 | 0.285 |
Table 9.
Measured and reviewed values of the specimen for 75% relative density.
Table 9.
Measured and reviewed values of the specimen for 75% relative density.
| Gyroid_75 | V (mm3) | S (mm2) | Porosity (%) | Cumulative Deviation at 90% |
|---|
| SD_ADV | 6762.960 | 9615.530 | 3.660 | 0.454 |
| SD_CAD | 6282.400 | 11,692.600 | 3.650 | 0.240 |
| SD_ROI | 6879.870 | 8147.640 | 3.560 | 0.460 |
Table 10.
Measured and reviewed values of the specimen for 85% relative density.
Table 10.
Measured and reviewed values of the specimen for 85% relative density.
| Gyroid_85 | V (mm3) | S (mm2) | Porosity (%) | Cumulative Deviation at 90% |
|---|
| SD_ADV | 7291.850 | 11,776.700 | 5.000 | 0.346 |
| SD_CAD | 7336.000 | 5999.370 | 5.300 | 0.094 |
| SD_ROI | 7553.260 | 7743.650 | 6.080 | 0.290 |
Table 11.
Measurement of wall thicknesses in all specimens.
Table 11.
Measurement of wall thicknesses in all specimens.
| Sample Name | Nominal Value + SD (mm) | Diameter + SD
(mm) | Percentage Change in Average Values (%) |
|---|
| gyroid_25 | 0.630 ± 0.010 | 0.570 ± 0.052 | −9.524 |
| gyroid_35 | 0.845 ± 0.073 | 0.875 ± 0.017 | 3.550 |
| gyroid_45 | 1.159 ± 0.006 | 1.155 ± 0.069 | −0.345 |
| gyroid_55 | 1.409 ± 0.042 | 1.417 ± 0.081 | 0.568 |
| gyroid_65 | 1.674 ± 0.010 | 1.805 ± 0.125 | 7.826 |
| gyroid_75 | 2.019 ± 0.032 | 2.261 ± 0.117 | 11.986 |
| gyroid_85 | 2.400 ± 0.008 | 2.628 ± 0.174 | 9.500 |
Table 12.
Comparison of the theoretical volume of the specimens obtained from the CAD model (VT) and the actual volume obtained from the CT data (VR) for surface determination in SD_ROI.
Table 12.
Comparison of the theoretical volume of the specimens obtained from the CAD model (VT) and the actual volume obtained from the CT data (VR) for surface determination in SD_ROI.
| Sample Name | Relative Density (%) | Theoretical
Specimen Volume VT (mm3) | Actual Specimen Volume VR (mm3) | Percentage Change in Volume (%) |
|---|
| gyroid_25 | 25.080 | 2150.770 | 2103.880 | −2.180 |
| gyroid_35 | 35.230 | 3020.760 | 3096.830 | 2.520 |
| gyroid_45 | 45.490 | 3900.990 | 3584.250 | −8.120 |
| gyroid_55 | 55.410 | 4751.550 | 4342.750 | −8.600 |
| gyroid_65 | 65.510 | 5617.460 | 5540.730 | −1.370 |
| gyroid_75 | 75.260 | 6453.900 | 6762.960 | 4.790 |
| gyroid_85 | 85.620 | 7341.530 | 7291.85 | −0.680 |
Table 13.
Comparison of the theoretical surface area of the specimen obtained from the CAD model (AT) and the actual surface area obtained from CT data (AR) during the surface determination based on SD_ROI settings.
Table 13.
Comparison of the theoretical surface area of the specimen obtained from the CAD model (AT) and the actual surface area obtained from CT data (AR) during the surface determination based on SD_ROI settings.
| Sample Name | Theoretical Surface Area of the Specimen AT (mm2) | Actual Surface Area of the Specimen AR (mm2) | Percentage Change in Surface Area
(%) |
|---|
| gyroid_25 | 8090.080 | 9433.340 | 16.600 |
| gyroid_35 | 8183.700 | 9517.900 | 16.300 |
| gyroid_45 | 8202.420 | 9644.390 | 17.580 |
| gyroid_55 | 8173.850 | 10,243.940 | 25.330 |
| gyroid_65 | 8064.180 | 9055.880 | 12.300 |
| gyroid_75 | 7852.280 | 8147.640 | 3.760 |
| gyroid_85 | 7285.030 | 7743.650 | 6.300 |
Table 14.
Measurement of specimen dimensions.
Table 14.
Measurement of specimen dimensions.
| Sample Name | A
(mm) | B
(mm) | C
(mm) | Area A × B (mm2) | Percentage Change in Area A × B (%) |
|---|
| gyroid_25 | 34.642 | 34.074 | 6.932 | 1180.392 | −3.641 |
| gyroid_35 | 34.548 | 34.263 | 6.893 | 1183.718 | −3.370 |
| gyroid_45 | 34.535 | 34.581 | 6.925 | 1194.255 | −2.510 |
| gyroid_55 | 34.682 | 34.557 | 6.946 | 1198.506 | −2.163 |
| gyroid_65 | 34.627 | 34.635 | 6.946 | 1199.306 | −2.097 |
| gyroid_75 | 34.706 | 34.646 | 6.909 | 1202.424 | −1.843 |
| gyroid_85 | 34.681 | 34.649 | 6.937 | 1201.662 | −1.905 |


 ,
, 


