Author Contributions
Conceptualization, S.R. and M.G.; methodology, S.R. and M.G.; formal analysis, S.R., M.G., M.Ž. and J.J.; investigation, S.R., M.G., M.Ž. and J.J.; resources, S.R., M.G. and M.Ž.; data curation, S.R., M.G., M.Ž., J.J. and B.K.; writing—original draft preparation, M.G.; writing—review and editing, S.R., M.G. and B.K.; supervision, S.R.; funding acquisition, S.R. All authors have read and agreed to the published version of the manuscript.
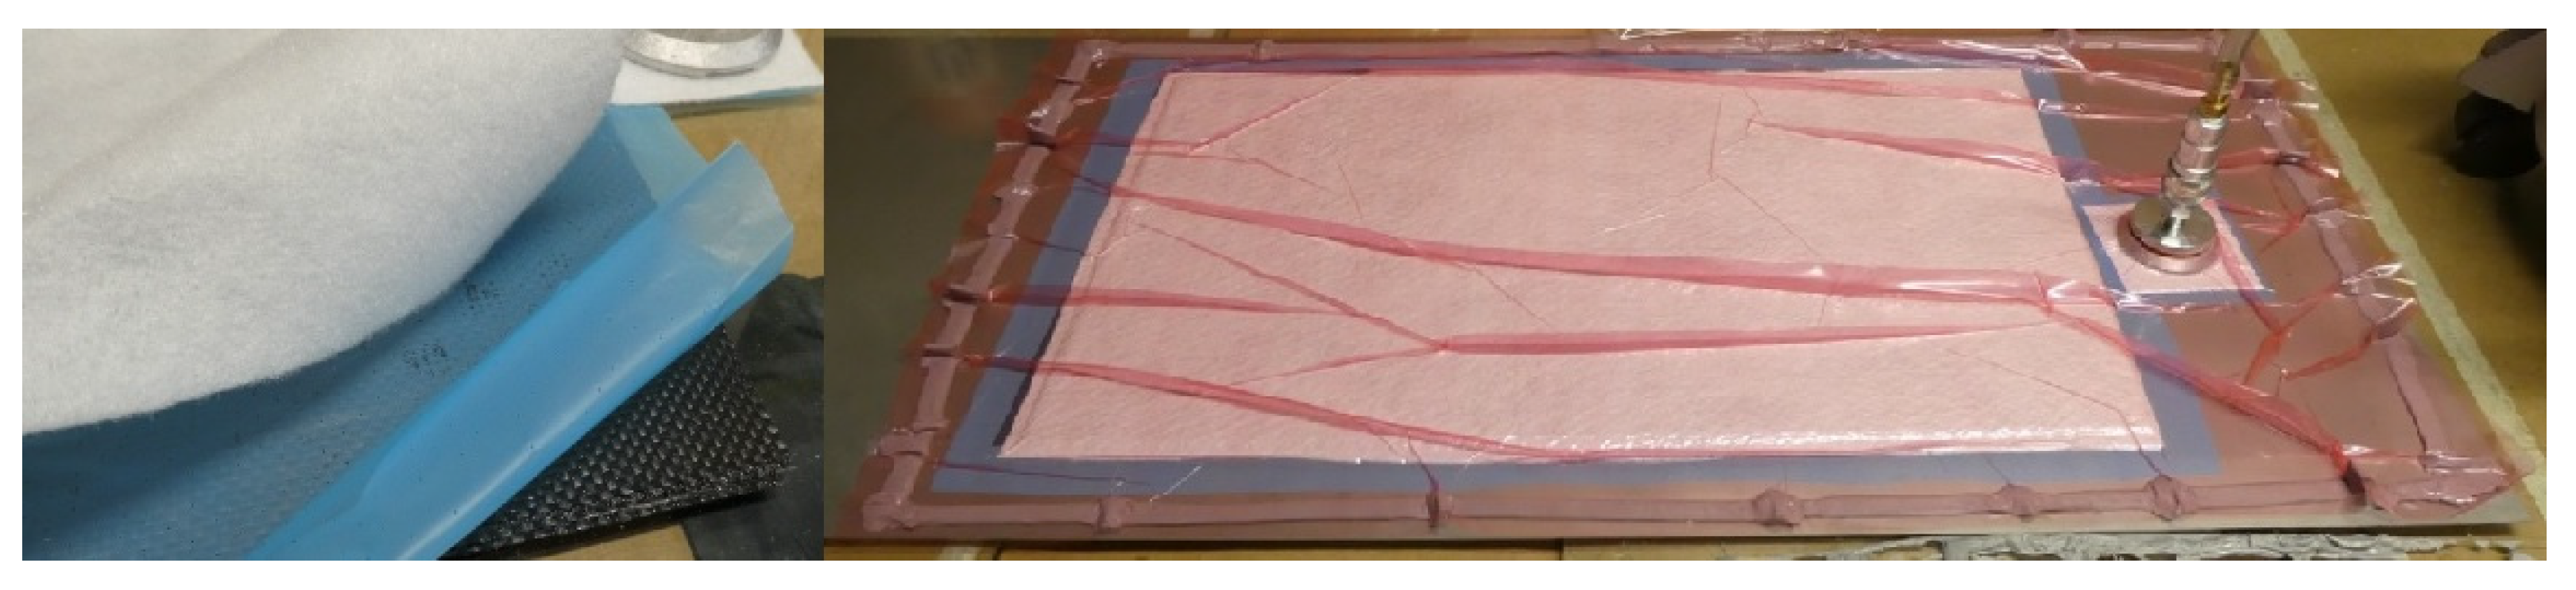
Figure 1.
Lamination process (left: the stack of the prepreg covered with perforated release film and breather cloth; right: debulking of the laminate prior to curing).
Figure 1.
Lamination process (left: the stack of the prepreg covered with perforated release film and breather cloth; right: debulking of the laminate prior to curing).
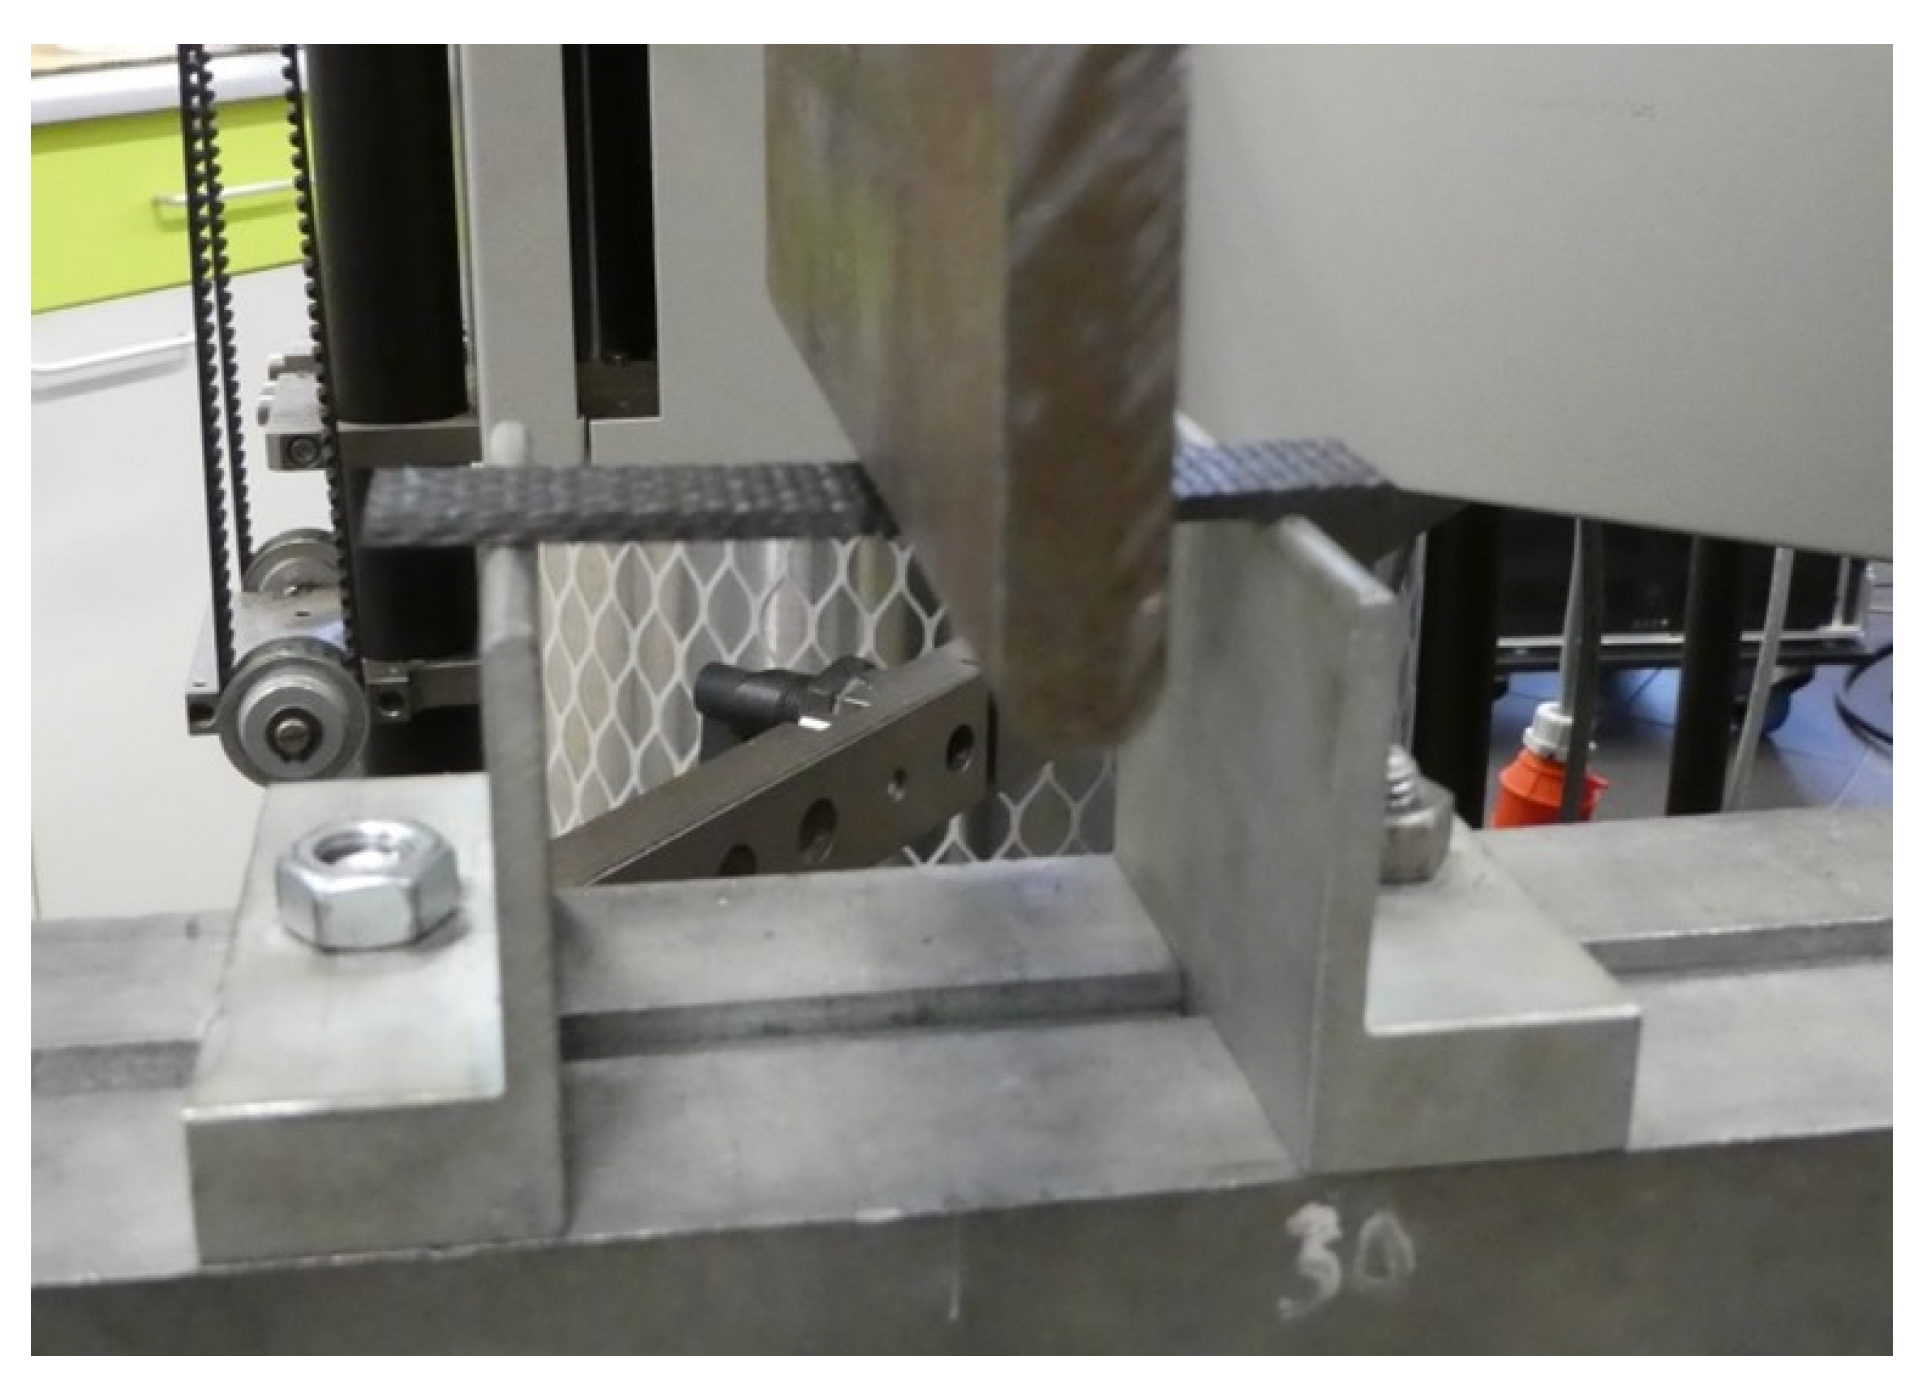
Figure 2.
Demonstration of the indentation test of prepreg viscosity.
Figure 2.
Demonstration of the indentation test of prepreg viscosity.
Figure 3.
Three-point bending test setup.
Figure 3.
Three-point bending test setup.
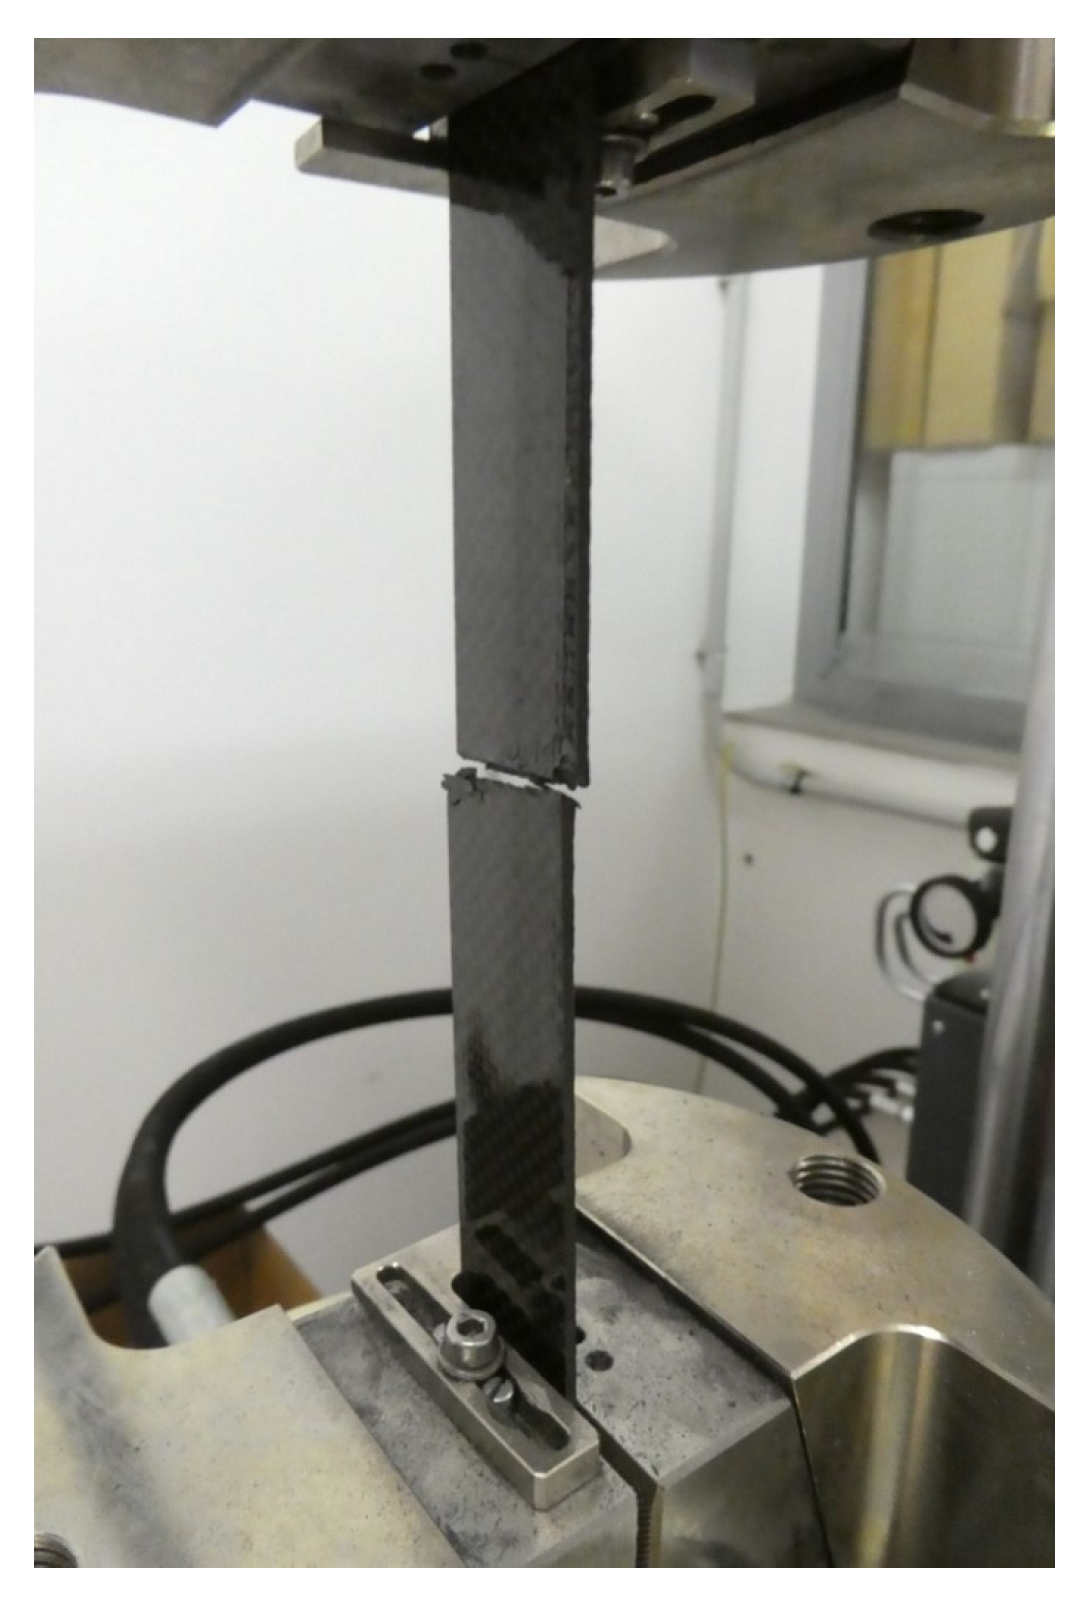
Figure 4.
Specimen after the tensile test.
Figure 4.
Specimen after the tensile test.
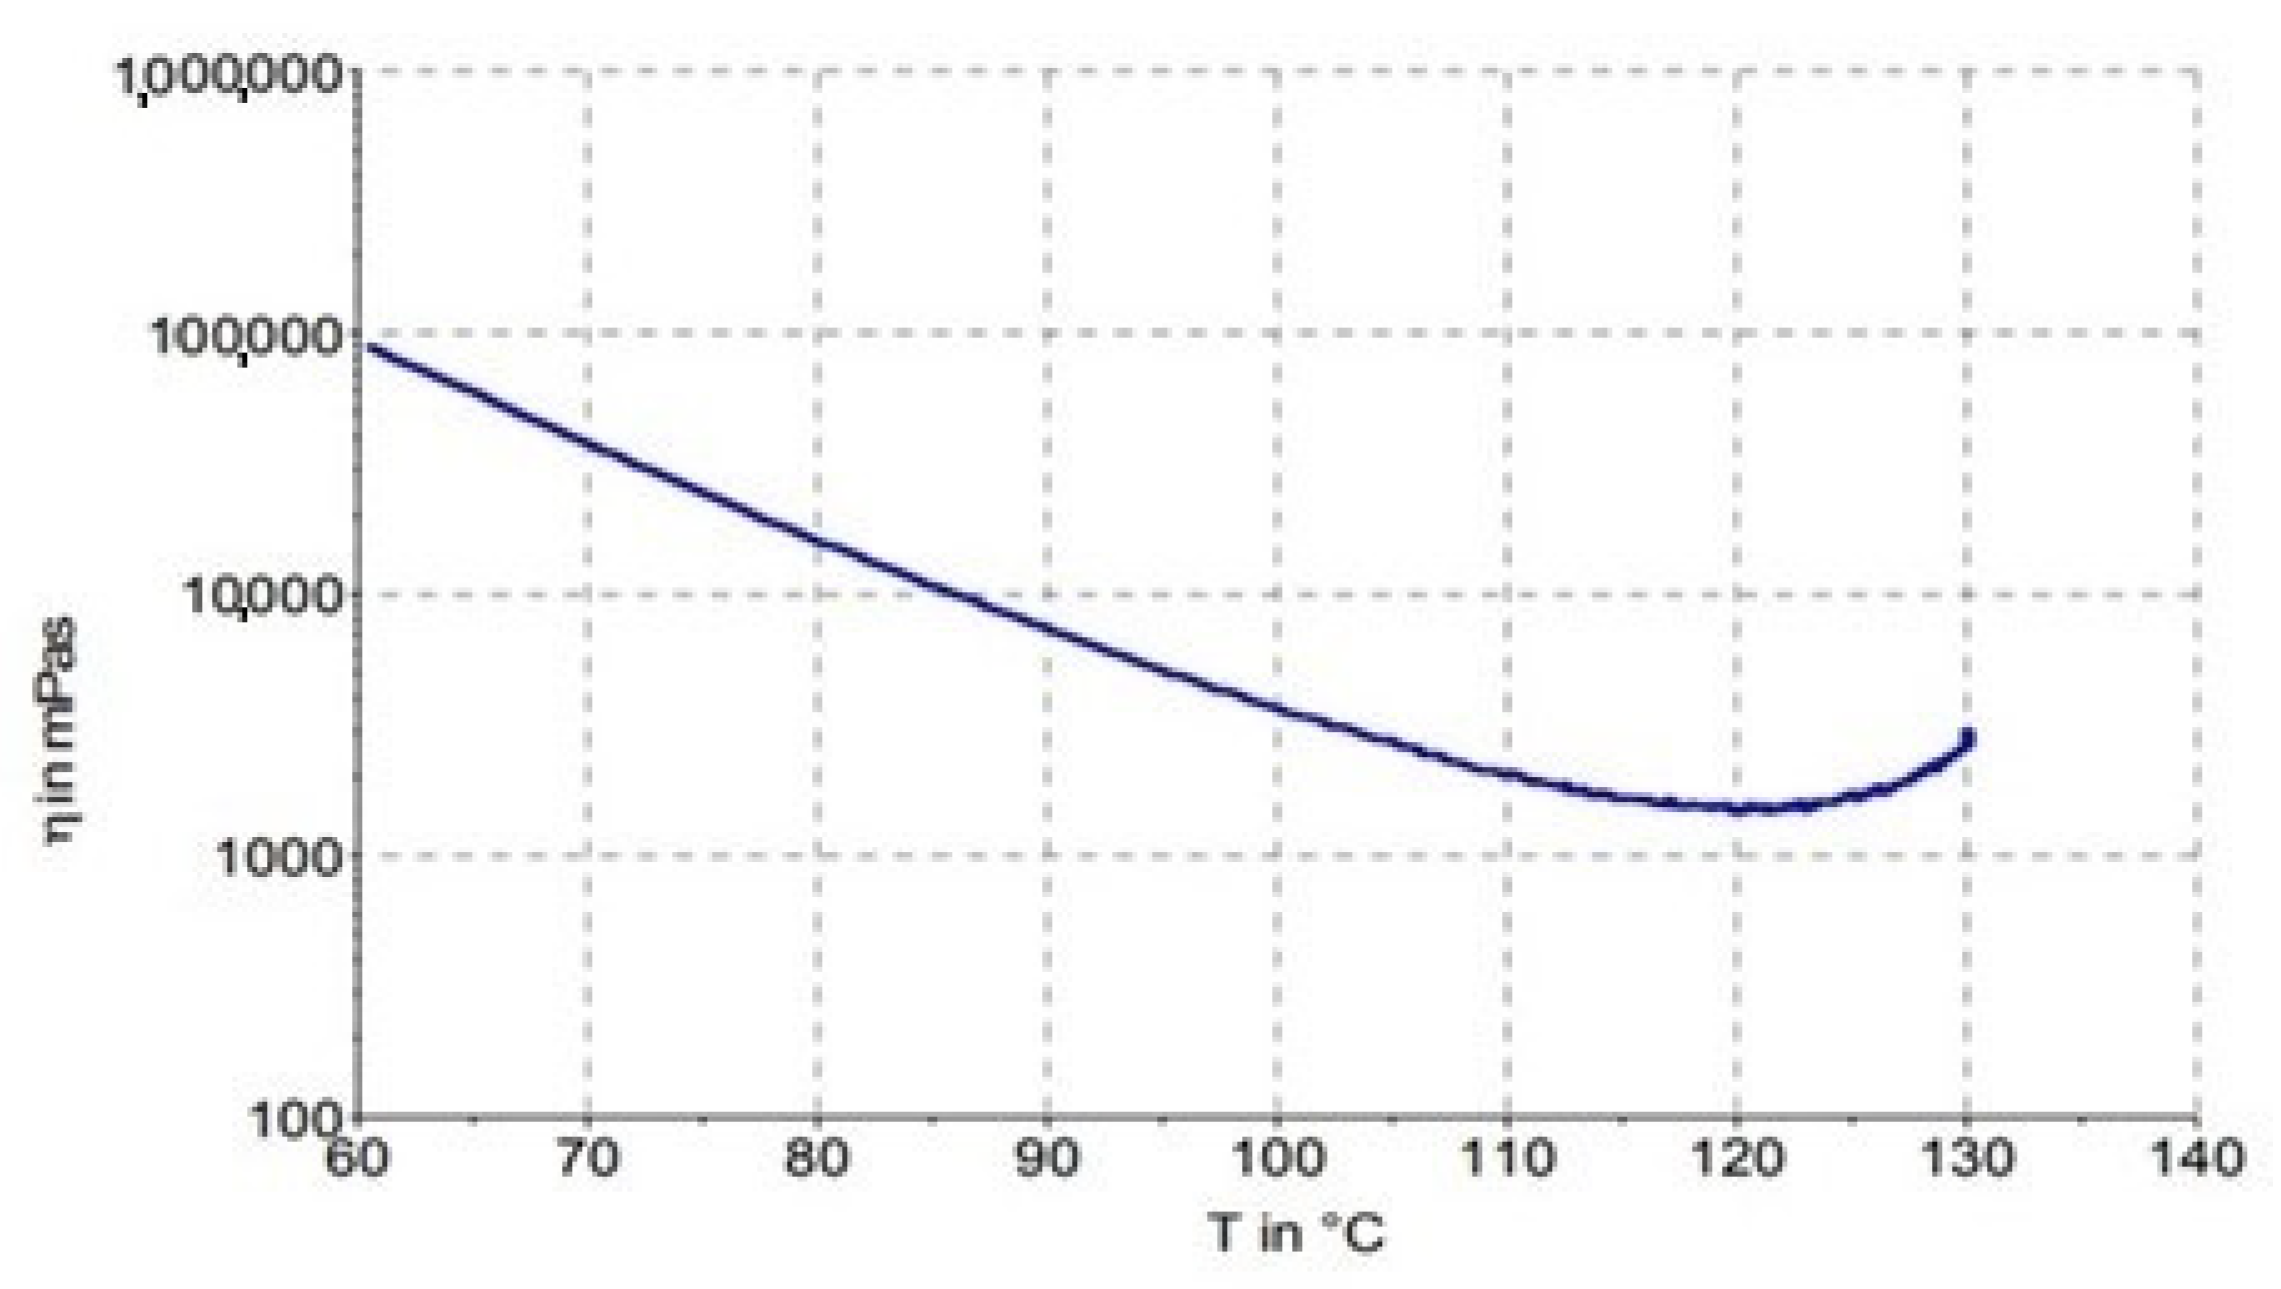
Figure 5.
Viscosity vs. temperature behavior of IMP503Z resin measured by the manufacturer of the prepreg.
Figure 5.
Viscosity vs. temperature behavior of IMP503Z resin measured by the manufacturer of the prepreg.
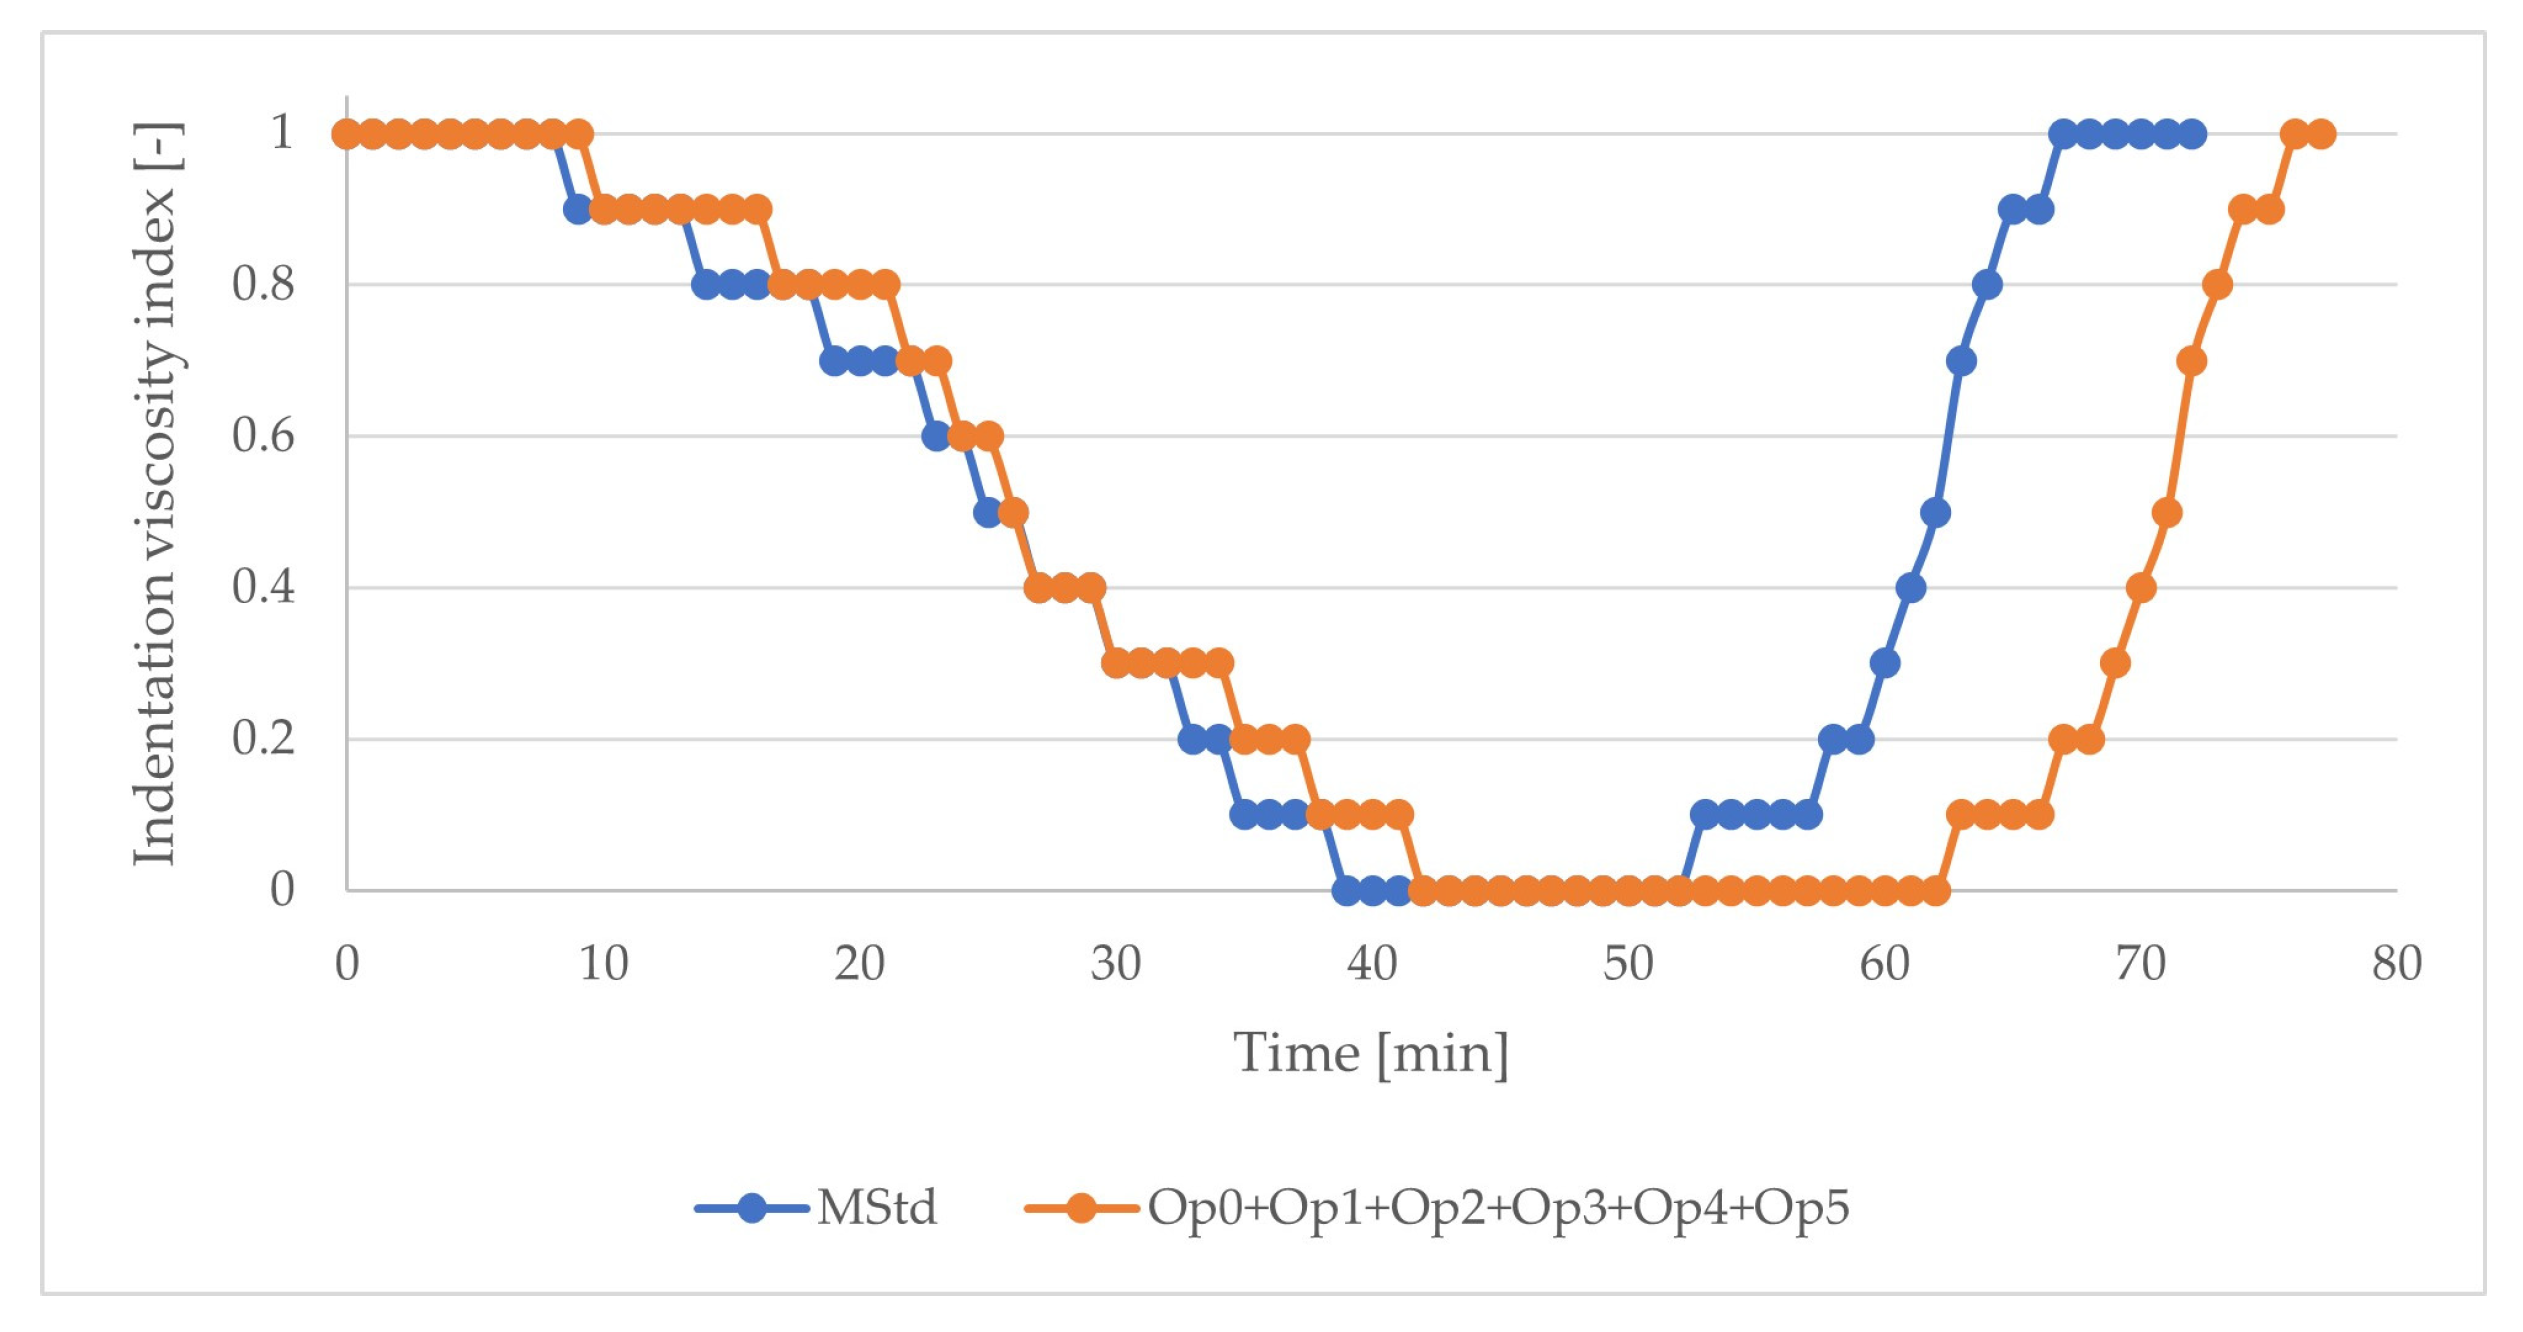
Figure 6.
The course of the index of indentation viscosity of the prepreg (blue: MStd; orange: Op0, Op1, Op2, Op3, Op4, Op5).
Figure 6.
The course of the index of indentation viscosity of the prepreg (blue: MStd; orange: Op0, Op1, Op2, Op3, Op4, Op5).
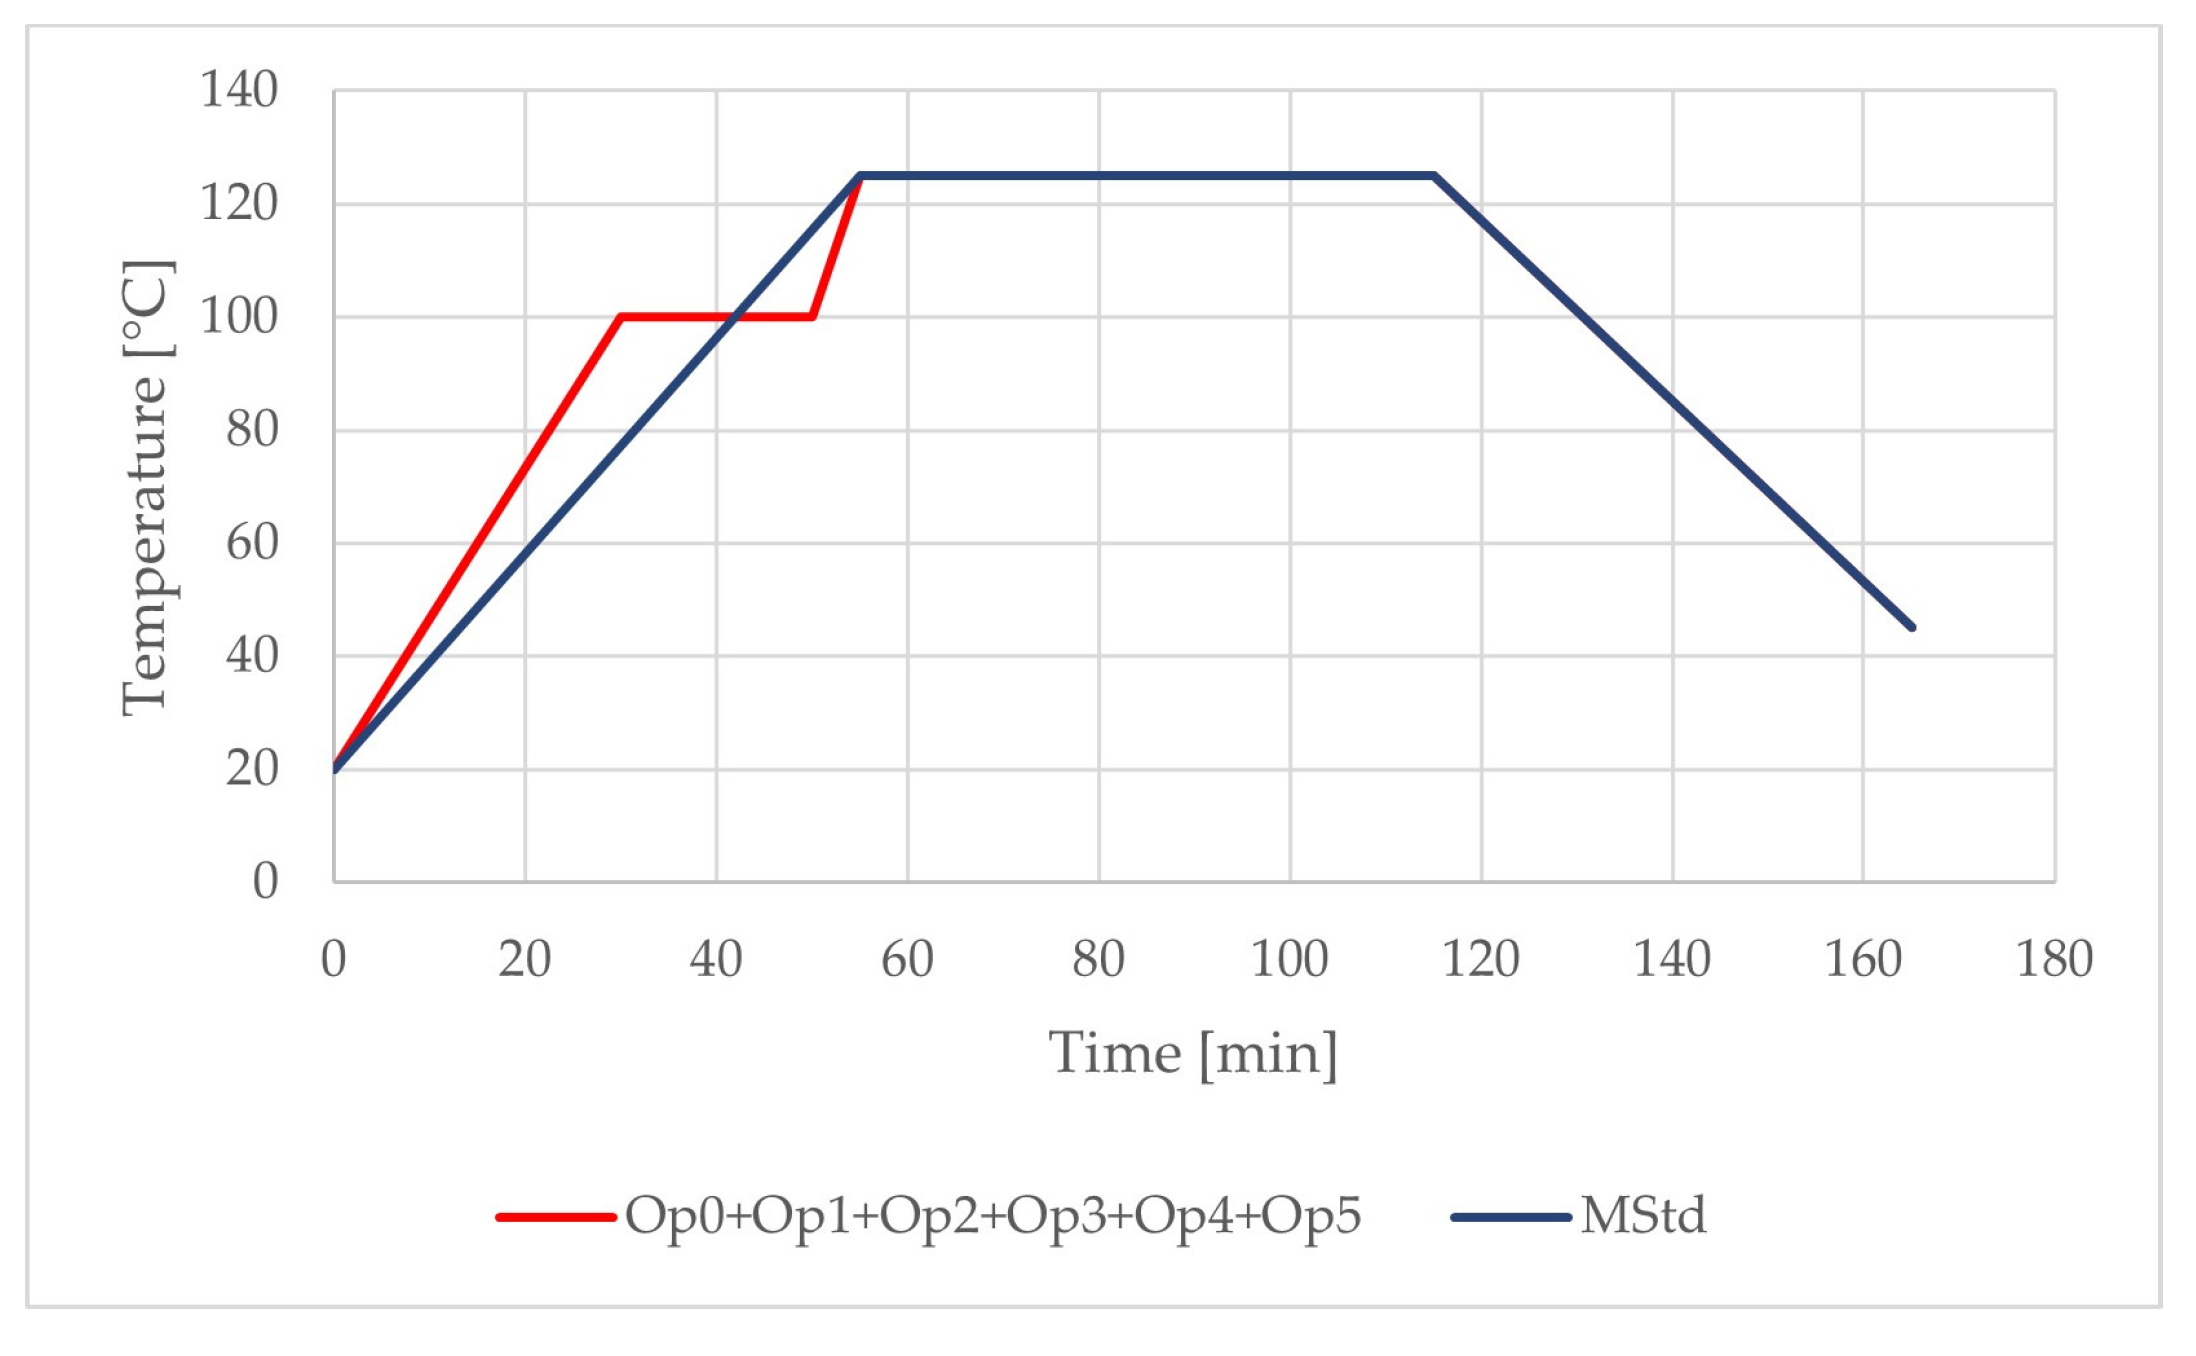
Figure 7.
Comparison of the temperature profiles of the curing cycles (blue: MStd; red: Op0, Op1, Op2, Op3, Op4, and Op5).
Figure 7.
Comparison of the temperature profiles of the curing cycles (blue: MStd; red: Op0, Op1, Op2, Op3, Op4, and Op5).
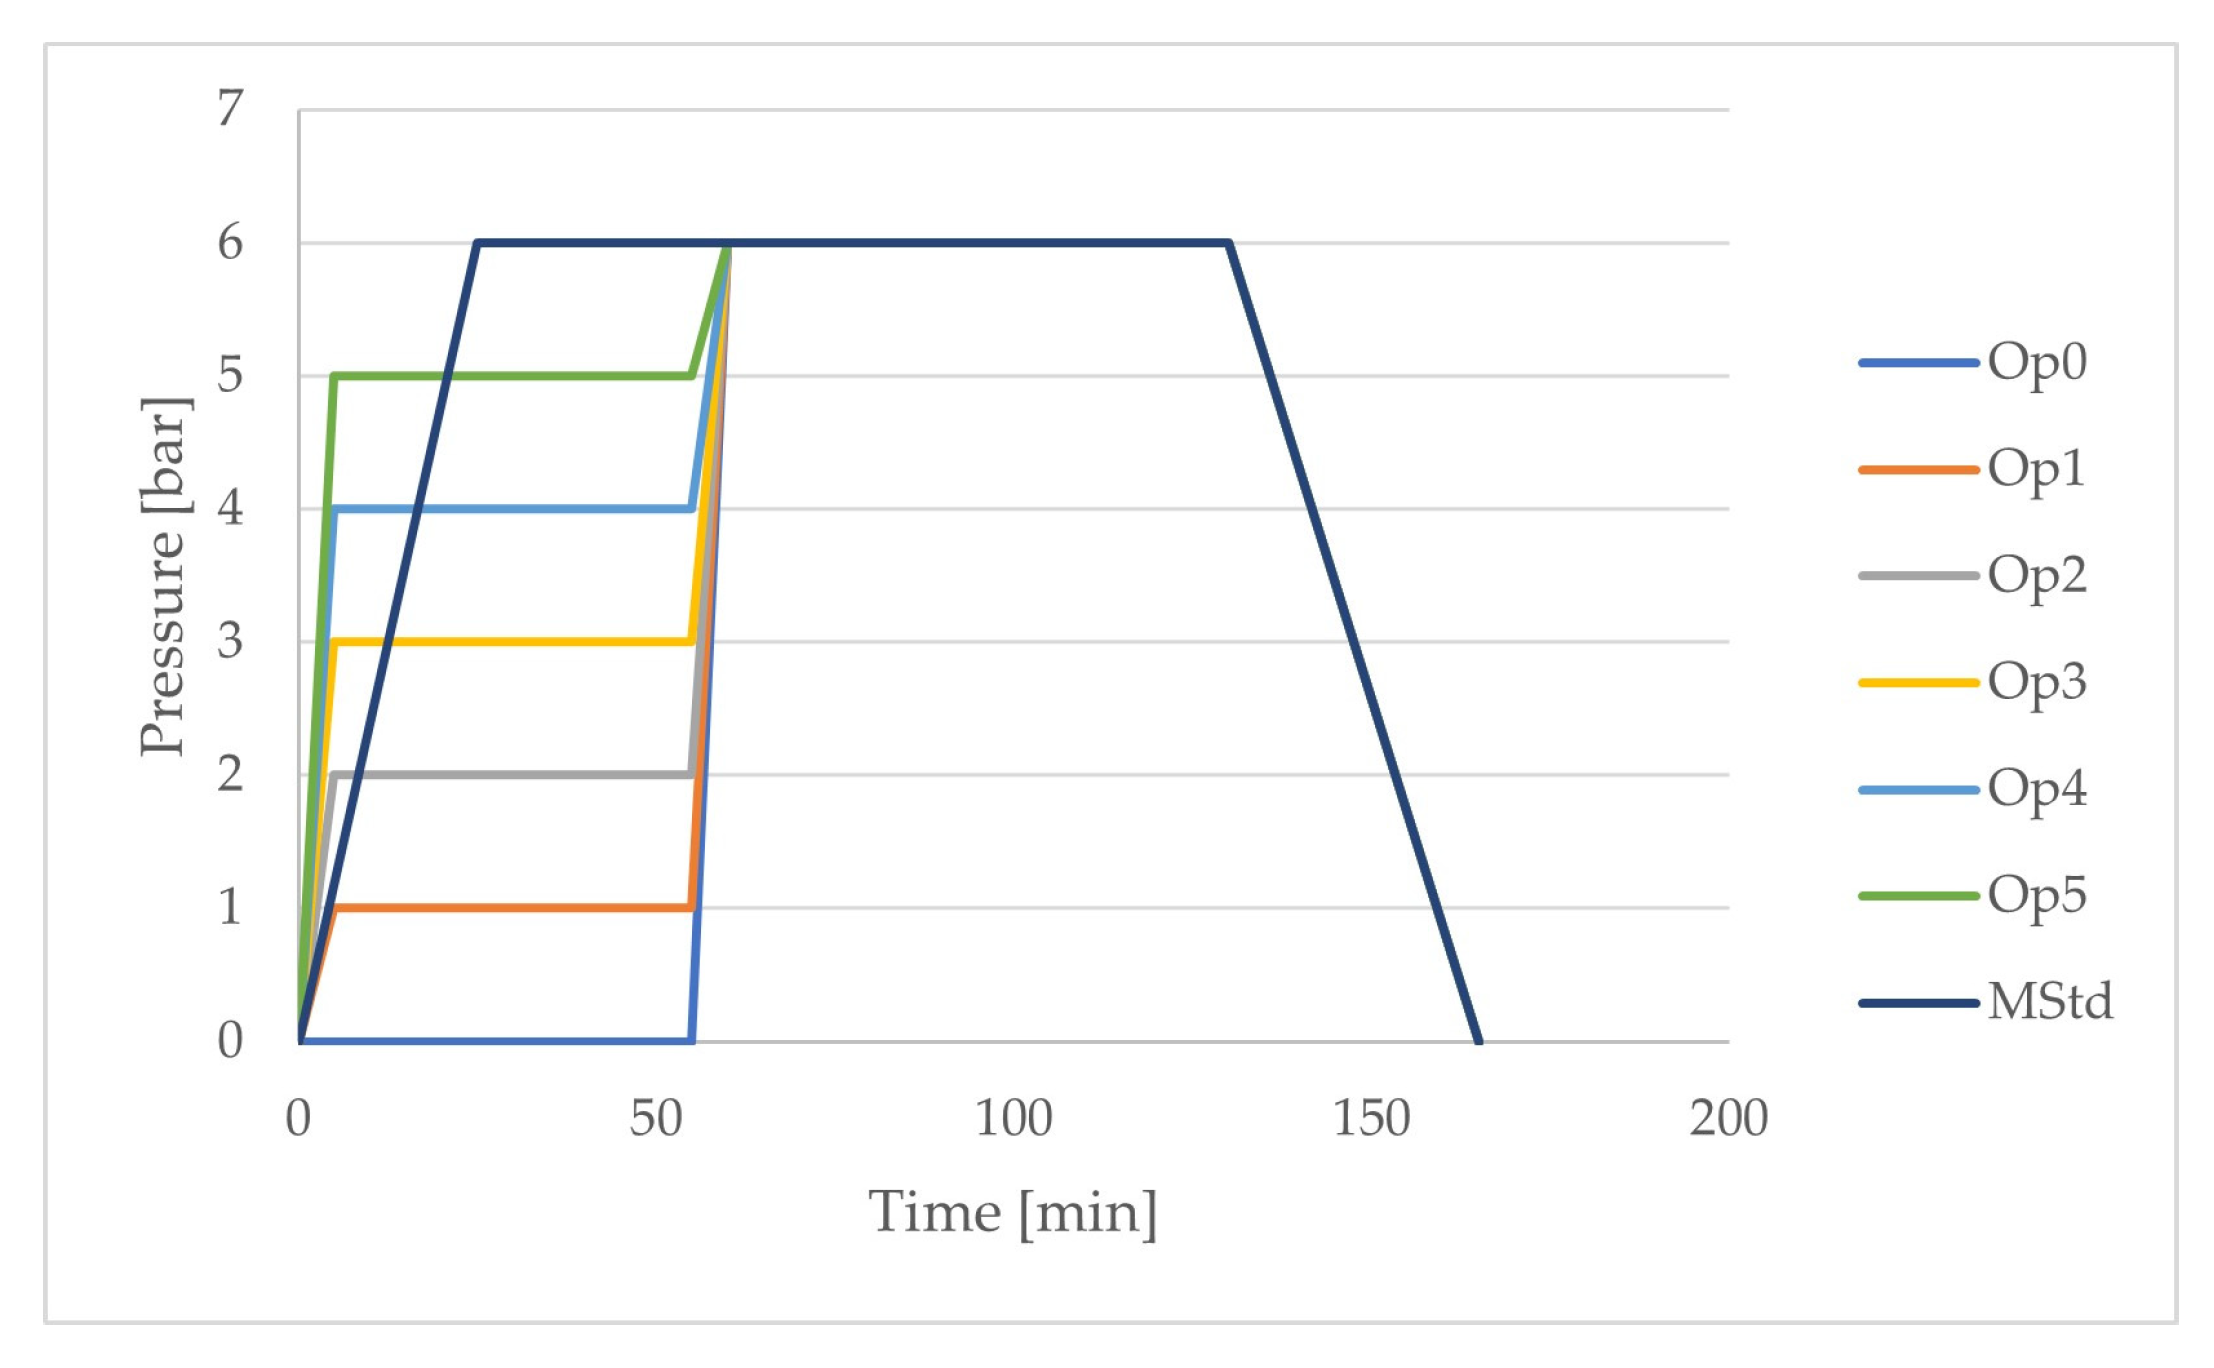
Figure 8.
Comparison of the pressure profiles of the curing cycles (dark blue: MStd, light blue: Op0, orange: Op1, grey: Op2, yellow: Op3, blue: Op4, green: Op5).
Figure 8.
Comparison of the pressure profiles of the curing cycles (dark blue: MStd, light blue: Op0, orange: Op1, grey: Op2, yellow: Op3, blue: Op4, green: Op5).
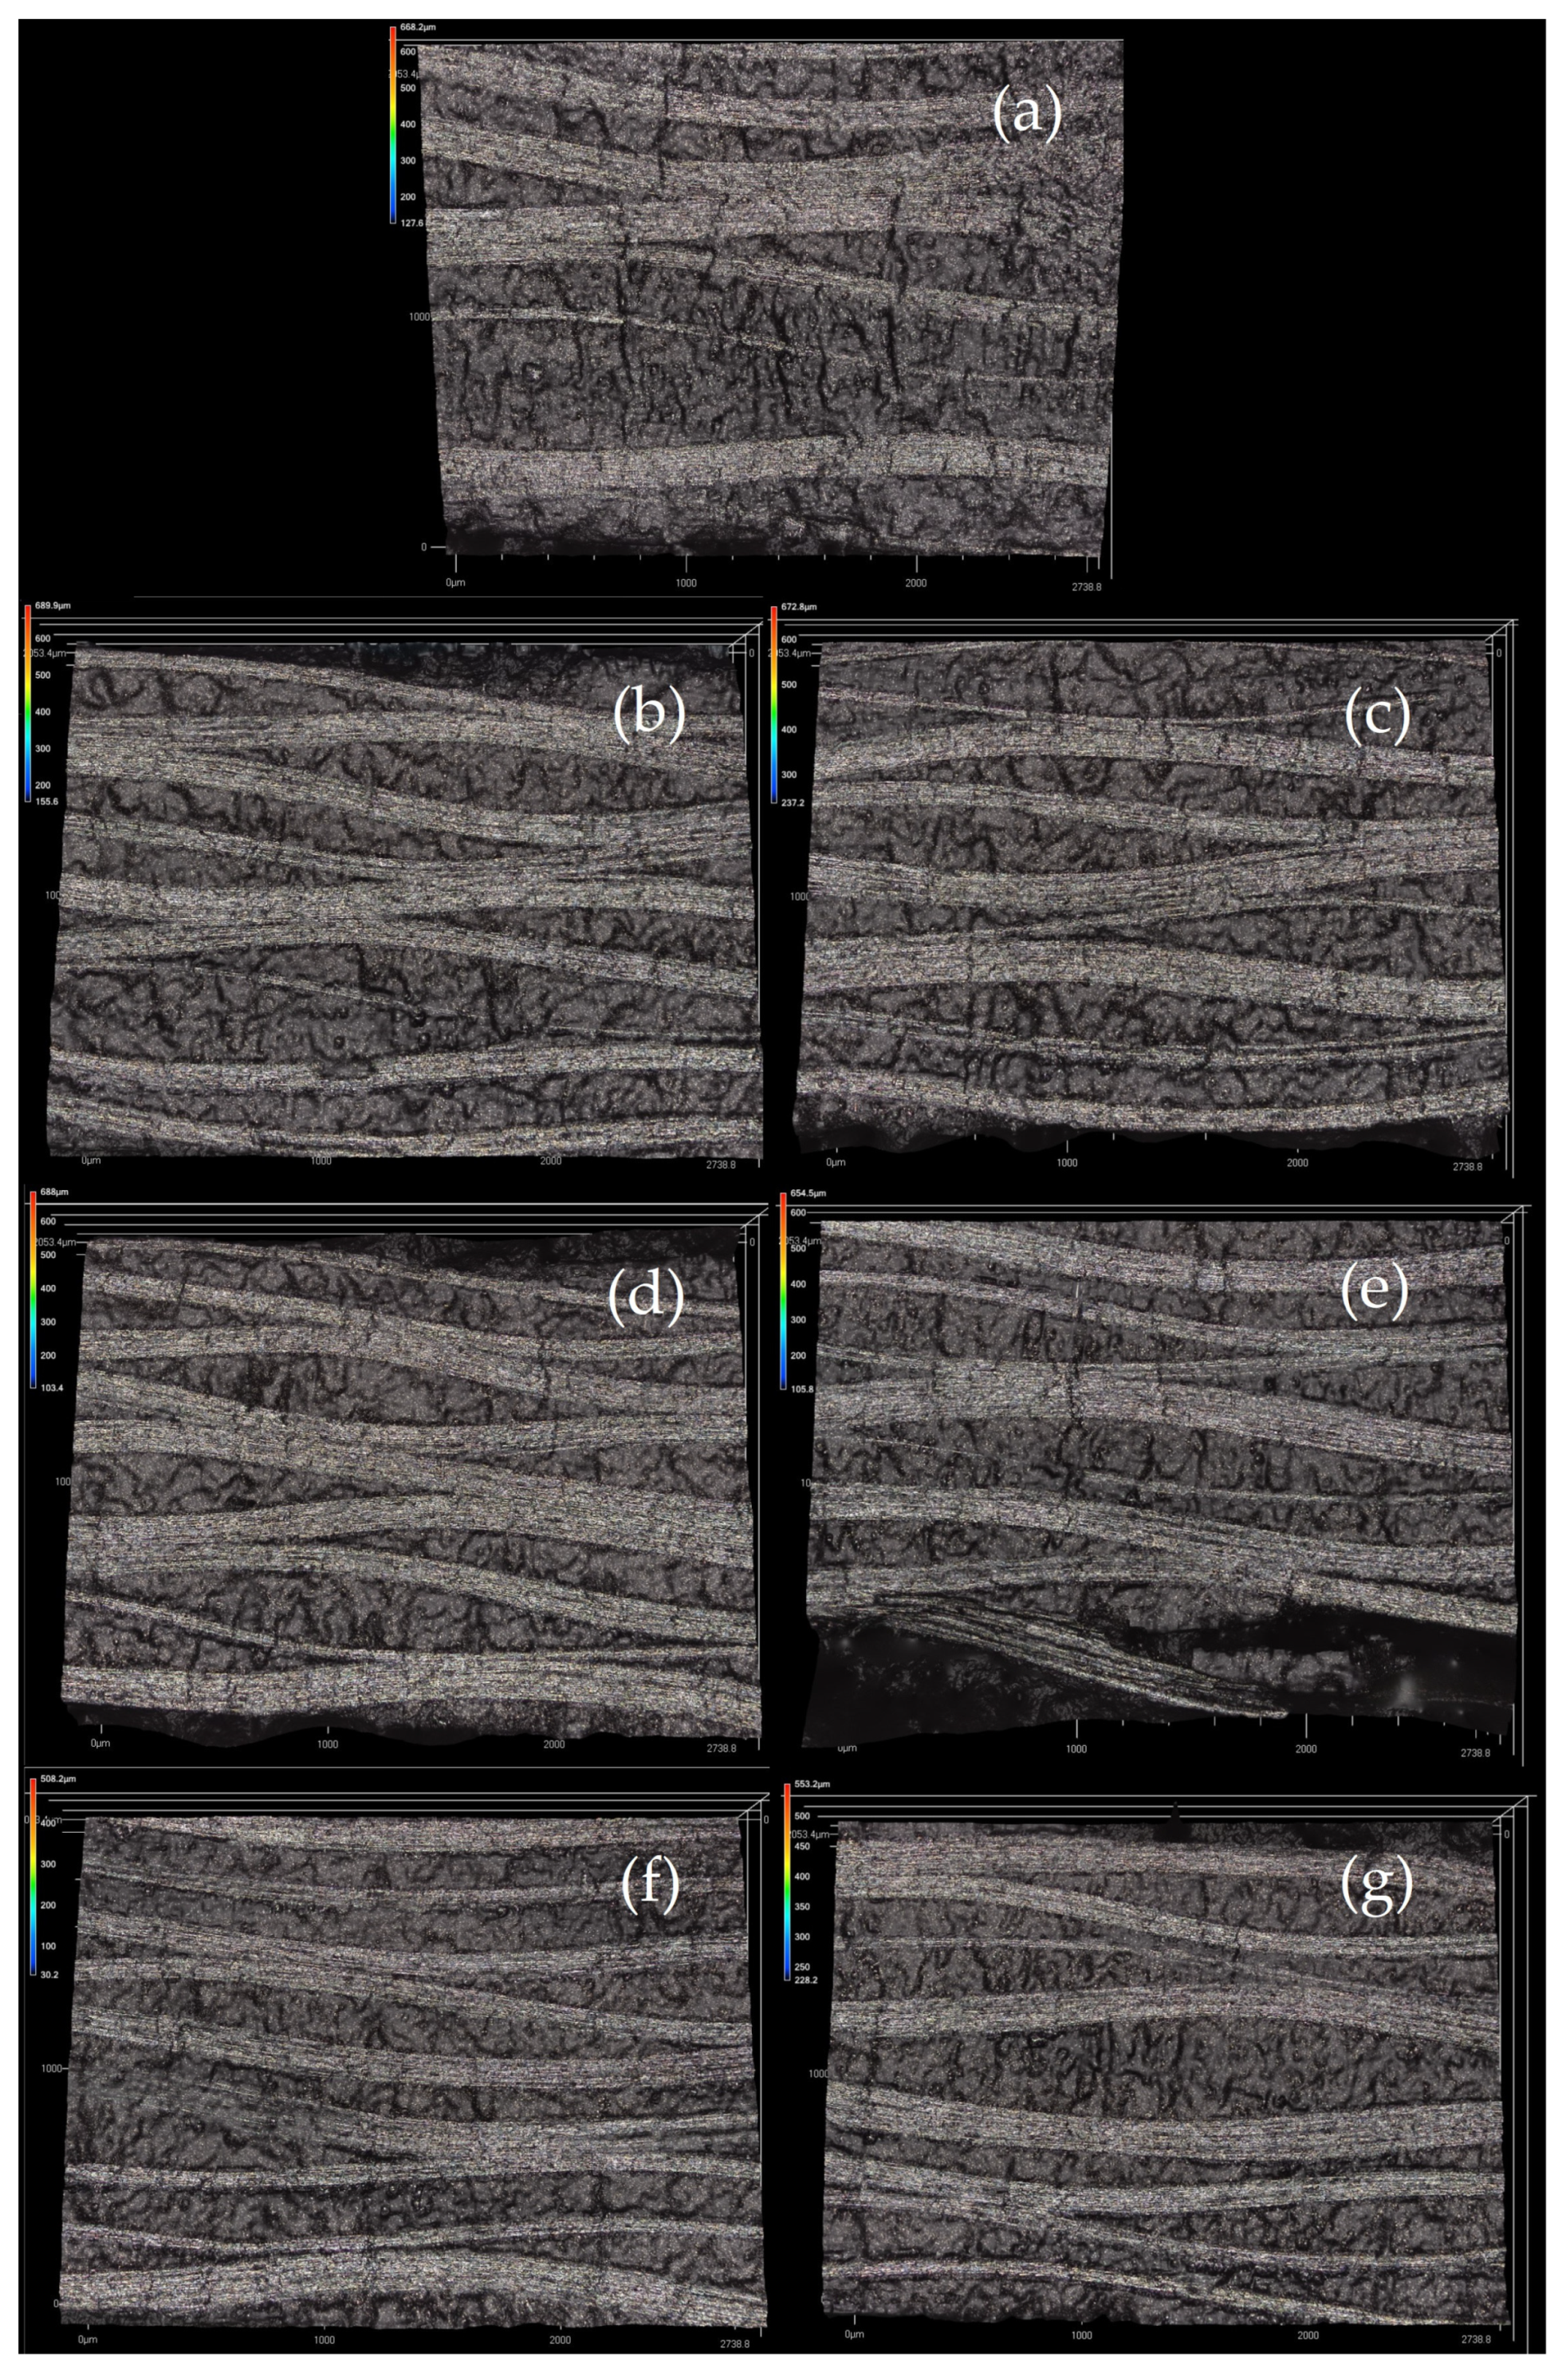
Figure 9.
Confocal microscopy scans of the cured laminates at 5× magnitude ((a) MStd, (b) Op0, (c) Op1, (d) Op2, (e) Op3, (f) Op4, (g) Op5).
Figure 9.
Confocal microscopy scans of the cured laminates at 5× magnitude ((a) MStd, (b) Op0, (c) Op1, (d) Op2, (e) Op3, (f) Op4, (g) Op5).
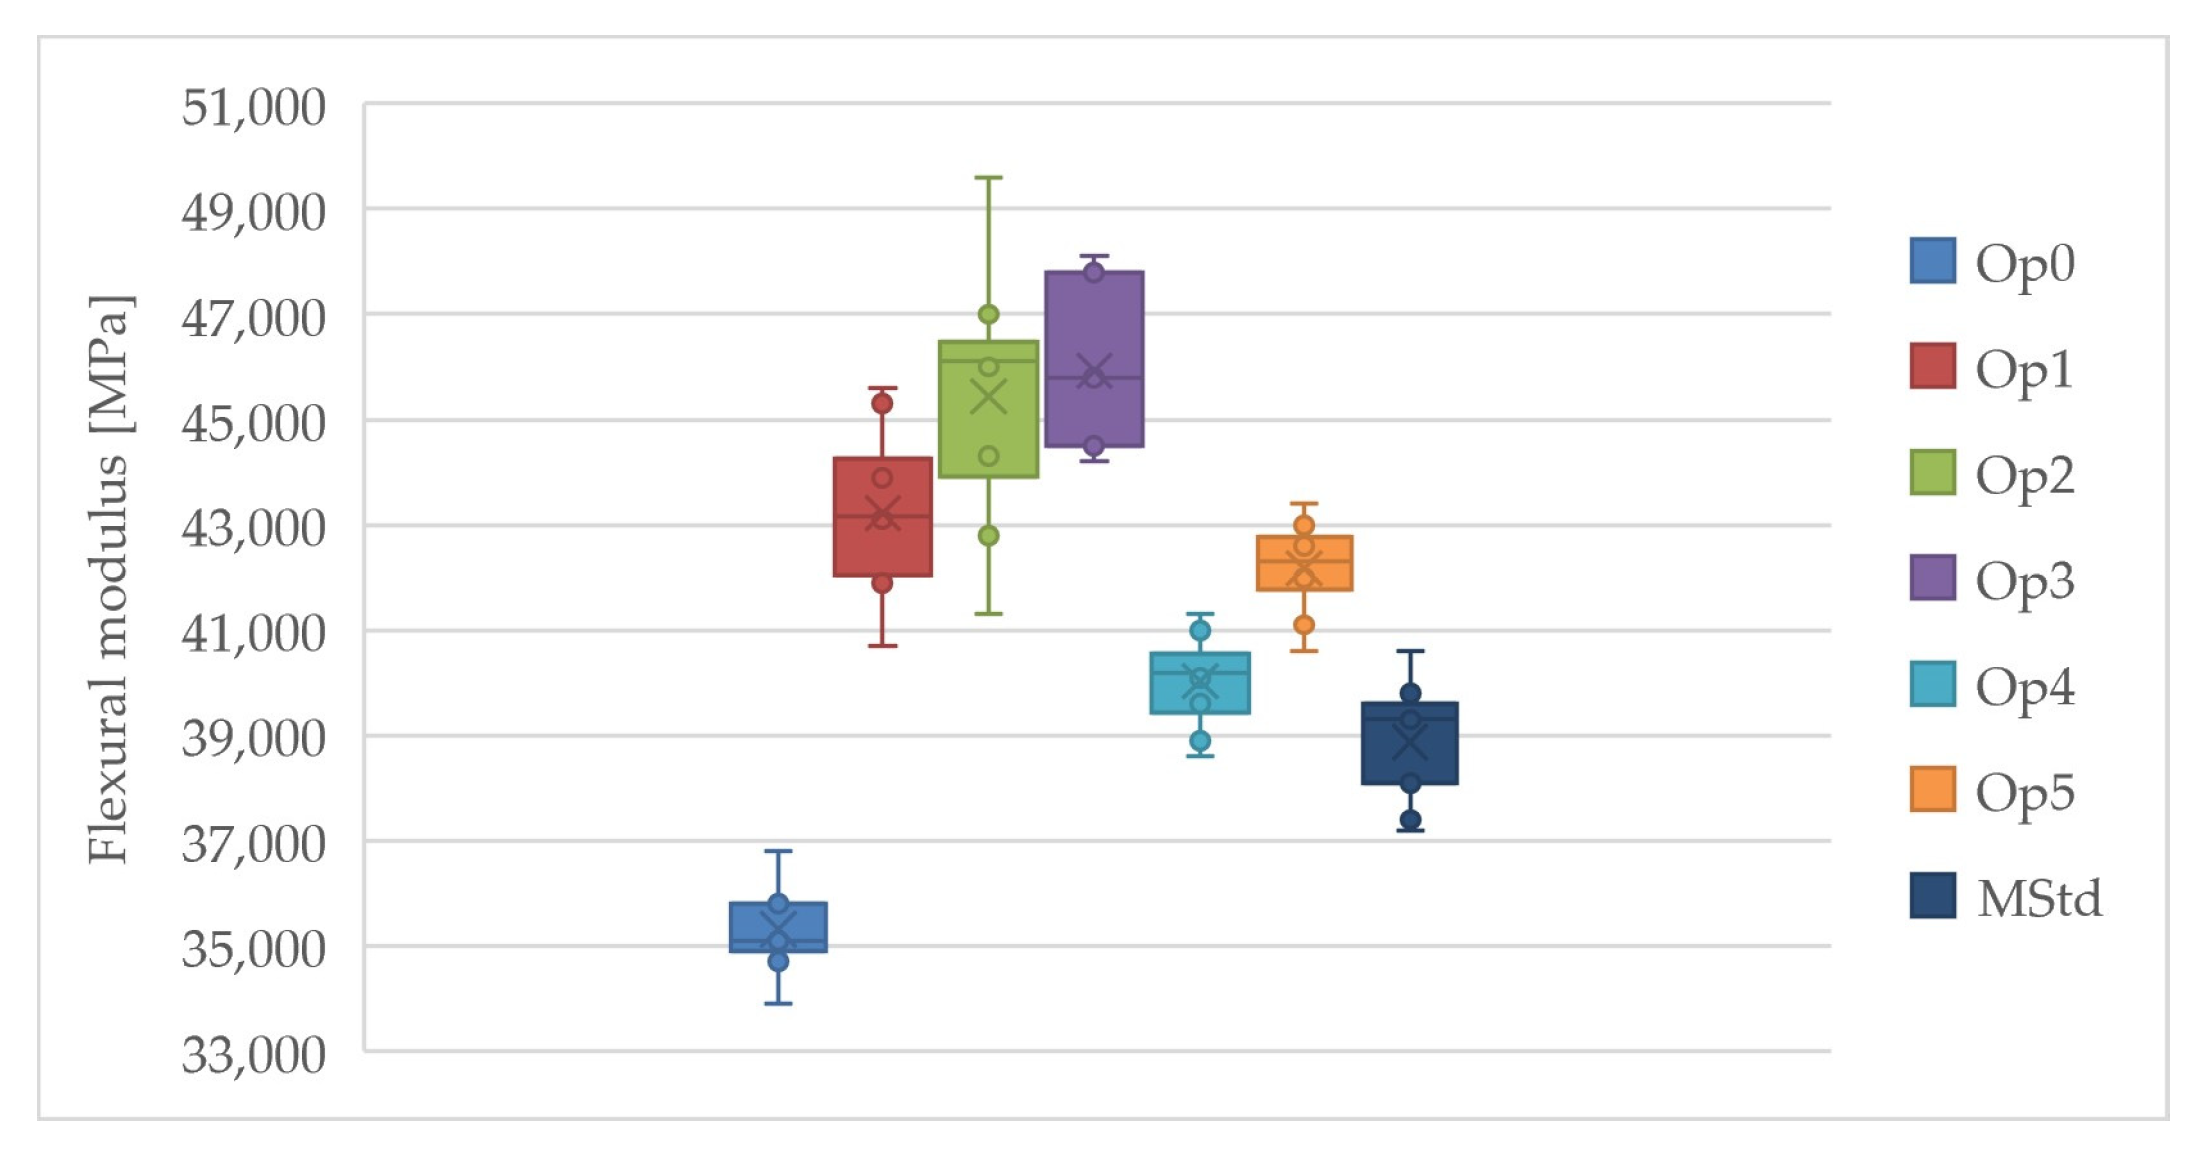
Figure 10.
Comparison of the flexural modulus of the cured laminates (dark blue: MStd, blue: Op0, red: Op1, green: Op2, purple: Op3, light blue: Op4, orange: Op5).
Figure 10.
Comparison of the flexural modulus of the cured laminates (dark blue: MStd, blue: Op0, red: Op1, green: Op2, purple: Op3, light blue: Op4, orange: Op5).
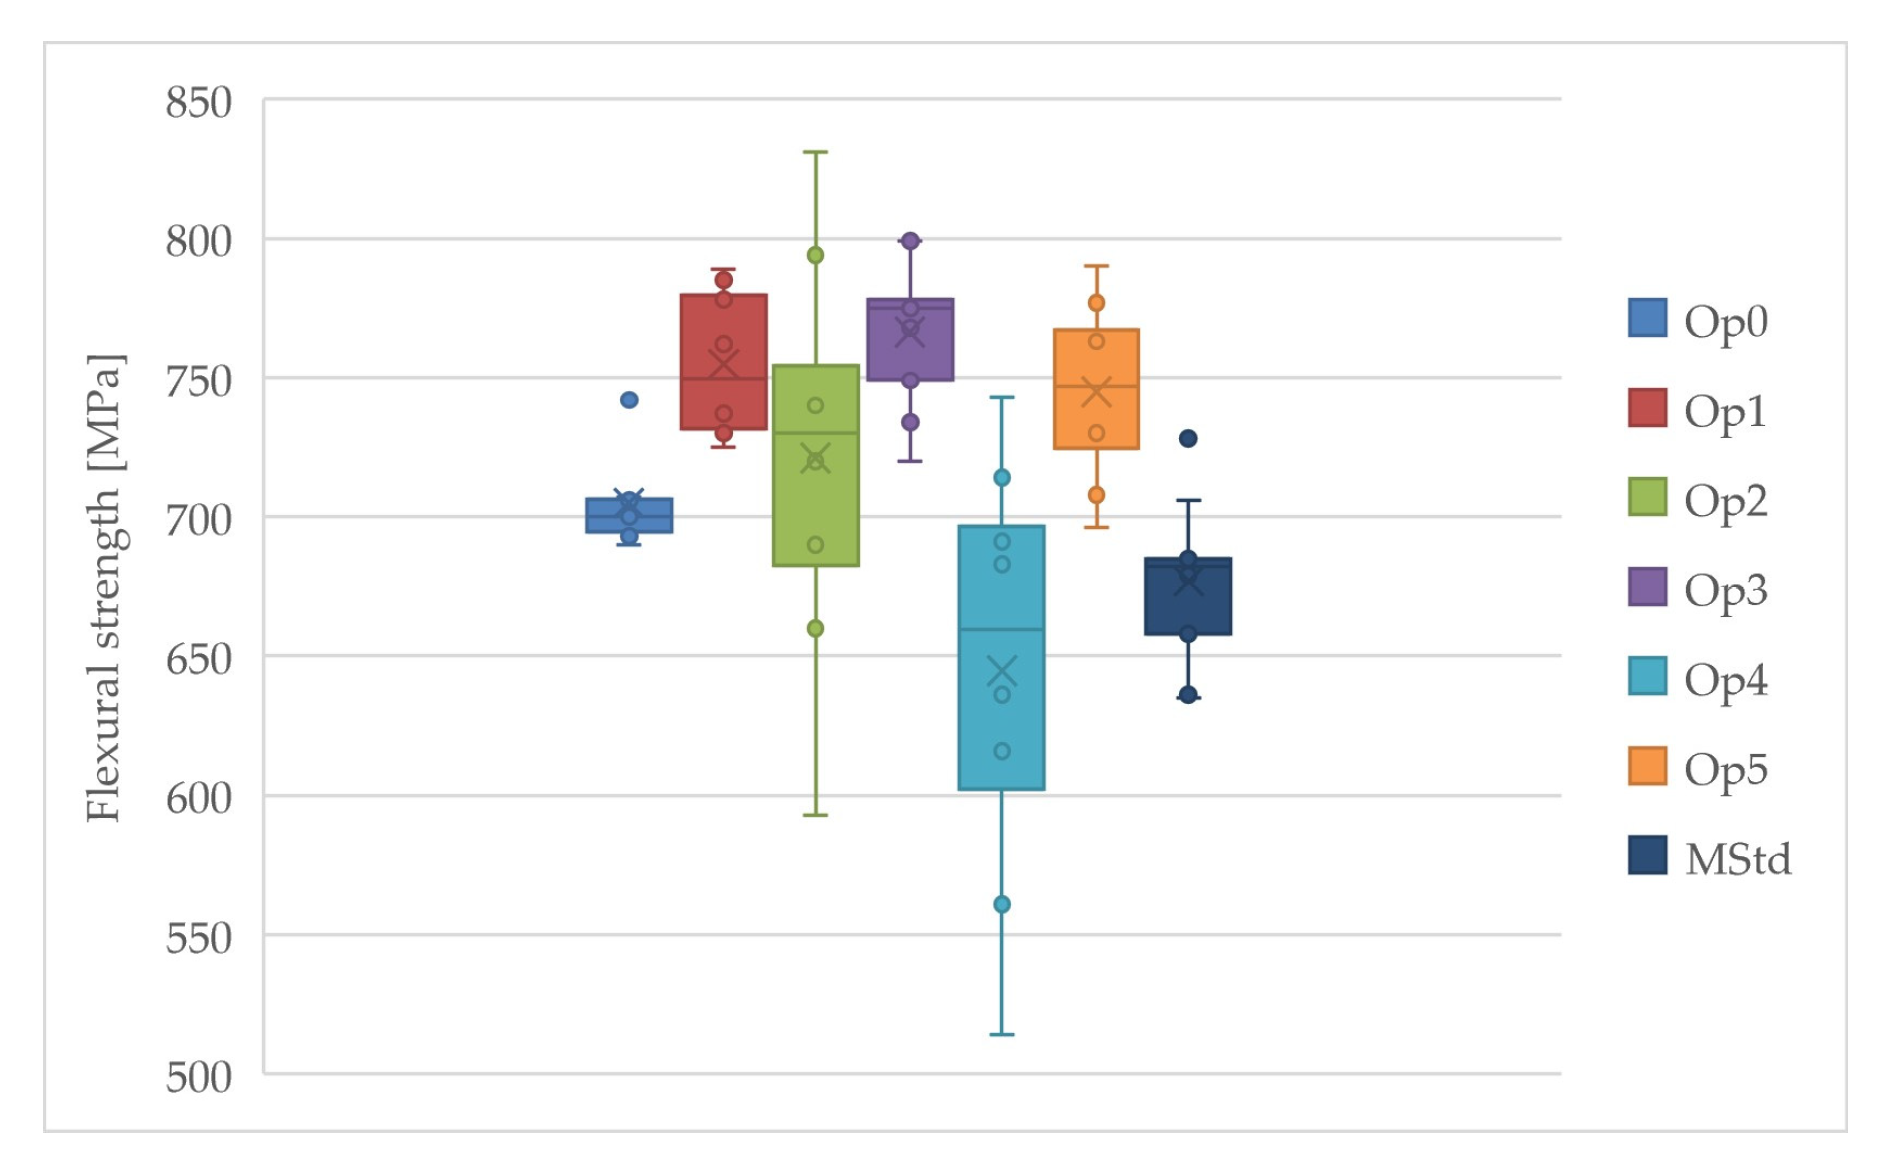
Figure 11.
Comparison of the flexural strength of the cured laminates (dark blue: MStd, blue: Op0, red: Op1, green: Op2, purple: Op3, light blue: Op4, orange: Op5).
Figure 11.
Comparison of the flexural strength of the cured laminates (dark blue: MStd, blue: Op0, red: Op1, green: Op2, purple: Op3, light blue: Op4, orange: Op5).
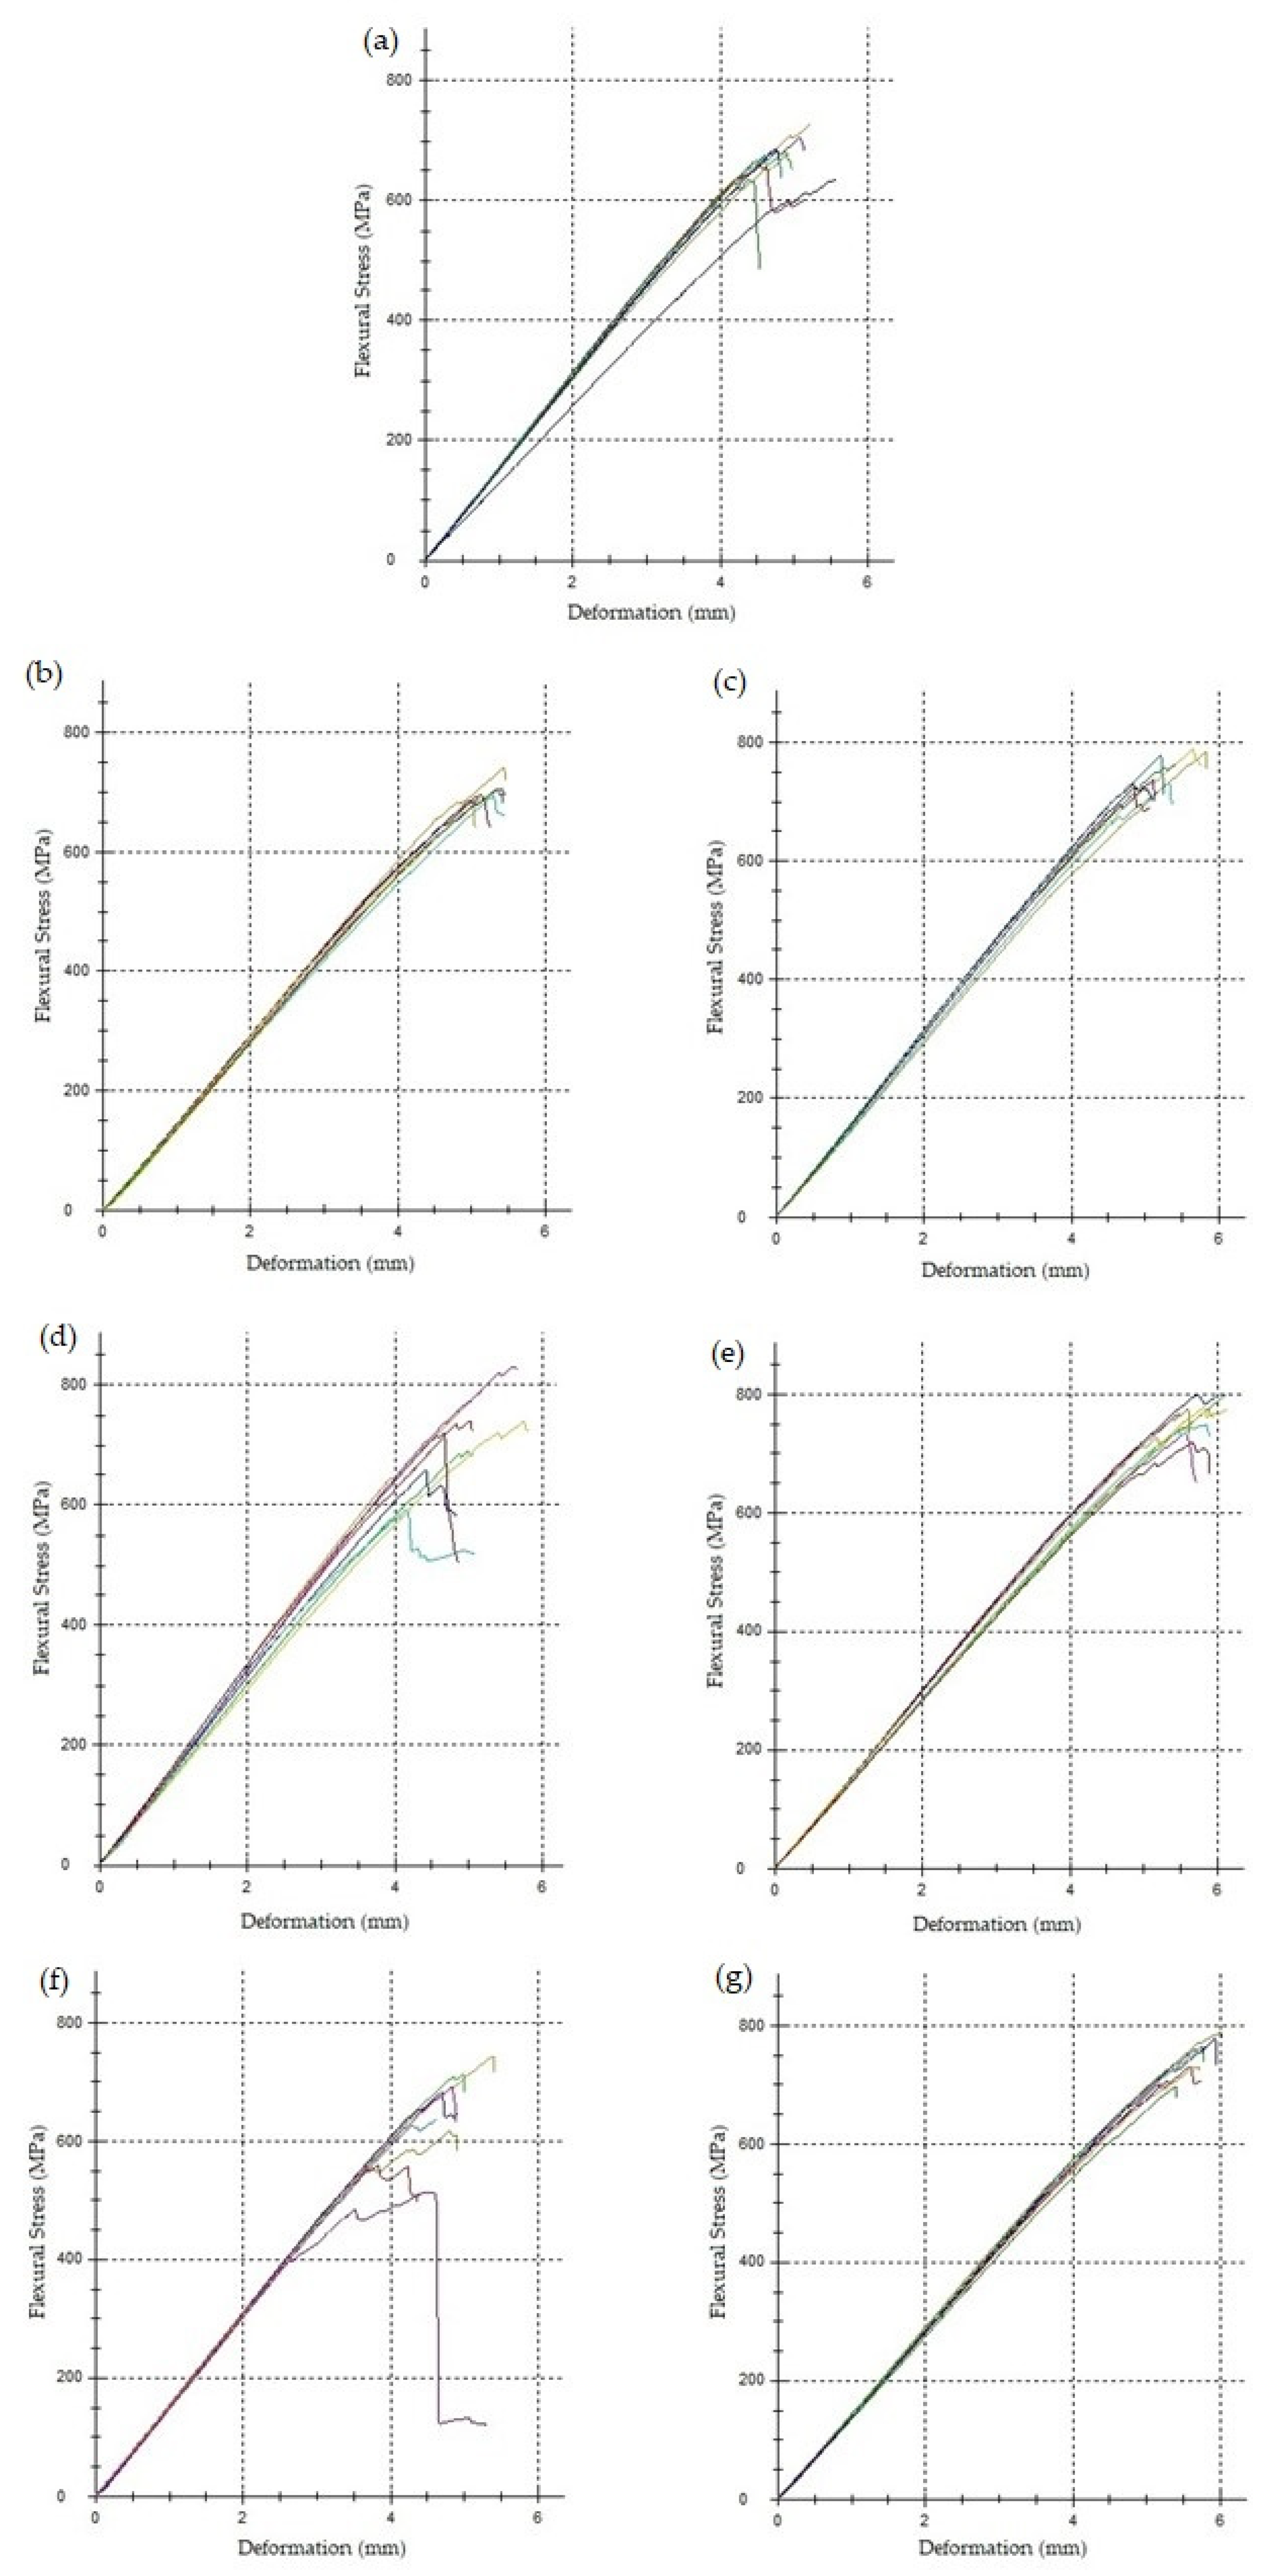
Figure 12.
Flexural stress–deformation curves ((a) MStd, (b) Op0, (c) Op1, (d) Op2, (e) Op3, (f) Op4, (g) Op5).
Figure 12.
Flexural stress–deformation curves ((a) MStd, (b) Op0, (c) Op1, (d) Op2, (e) Op3, (f) Op4, (g) Op5).
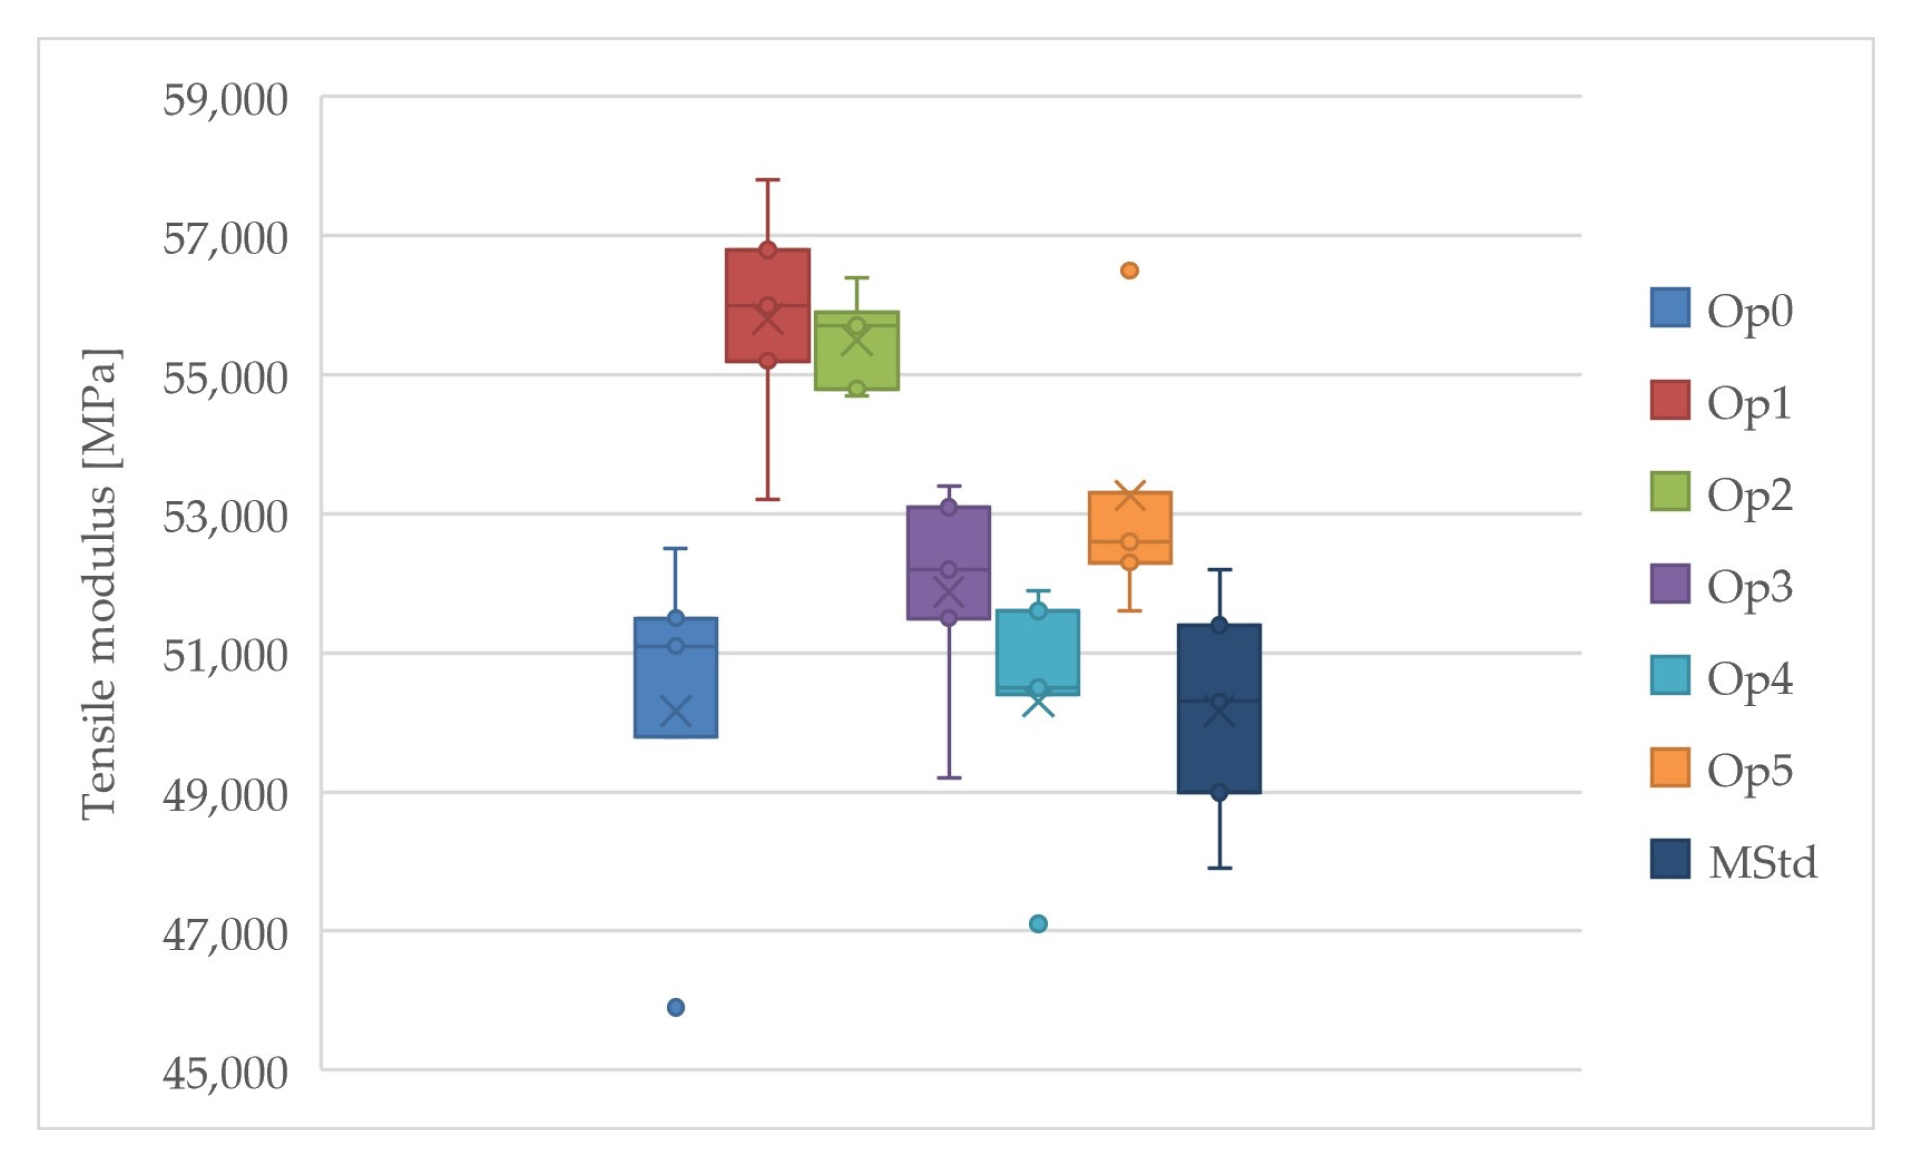
Figure 13.
Comparison of the tensile modulus of the cured laminates (dark blue: MStd, blue: Op0, red: Op1, green: Op2, purple: Op3, light blue: Op4, orange: Op5).
Figure 13.
Comparison of the tensile modulus of the cured laminates (dark blue: MStd, blue: Op0, red: Op1, green: Op2, purple: Op3, light blue: Op4, orange: Op5).
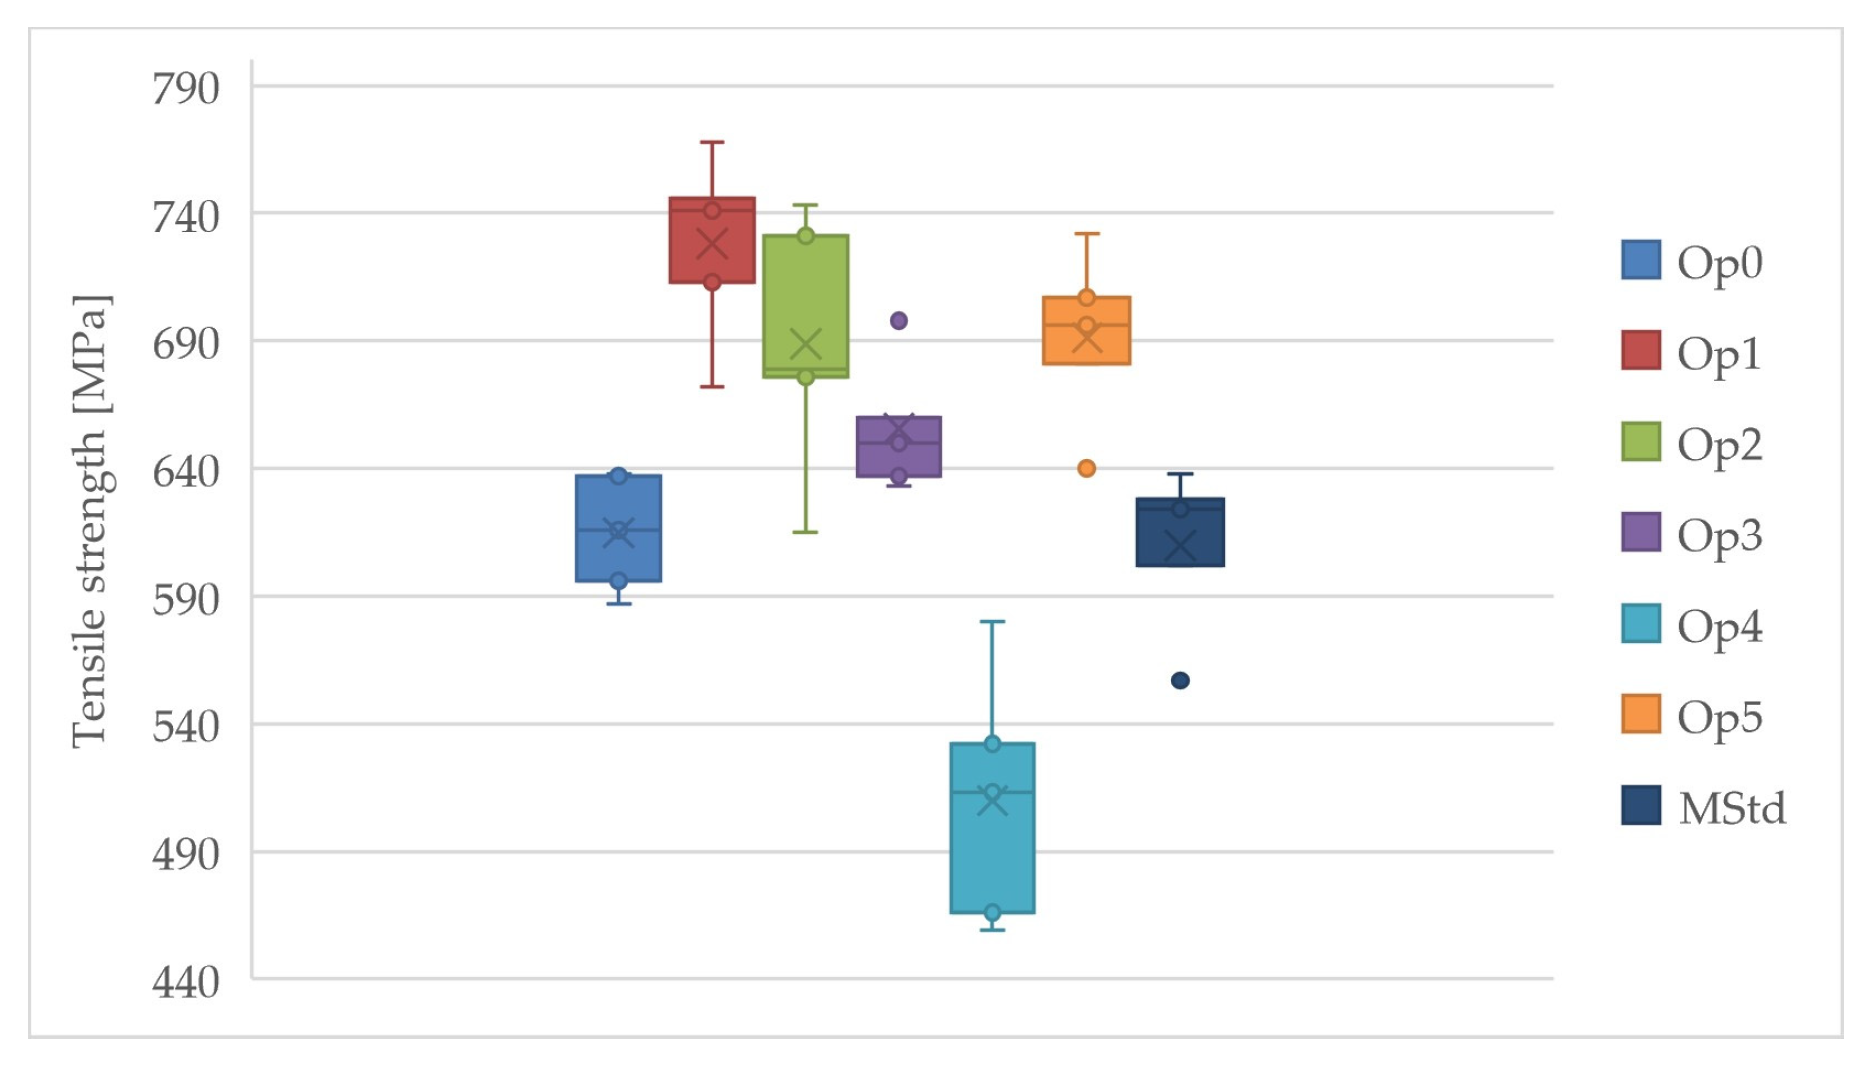
Figure 14.
Comparison of the tensile strength of the cured laminates (dark blue: MStd, blue: Op0, red: Op1, green: Op2, purple: Op3, light blue: Op4, orange: Op5).
Figure 14.
Comparison of the tensile strength of the cured laminates (dark blue: MStd, blue: Op0, red: Op1, green: Op2, purple: Op3, light blue: Op4, orange: Op5).
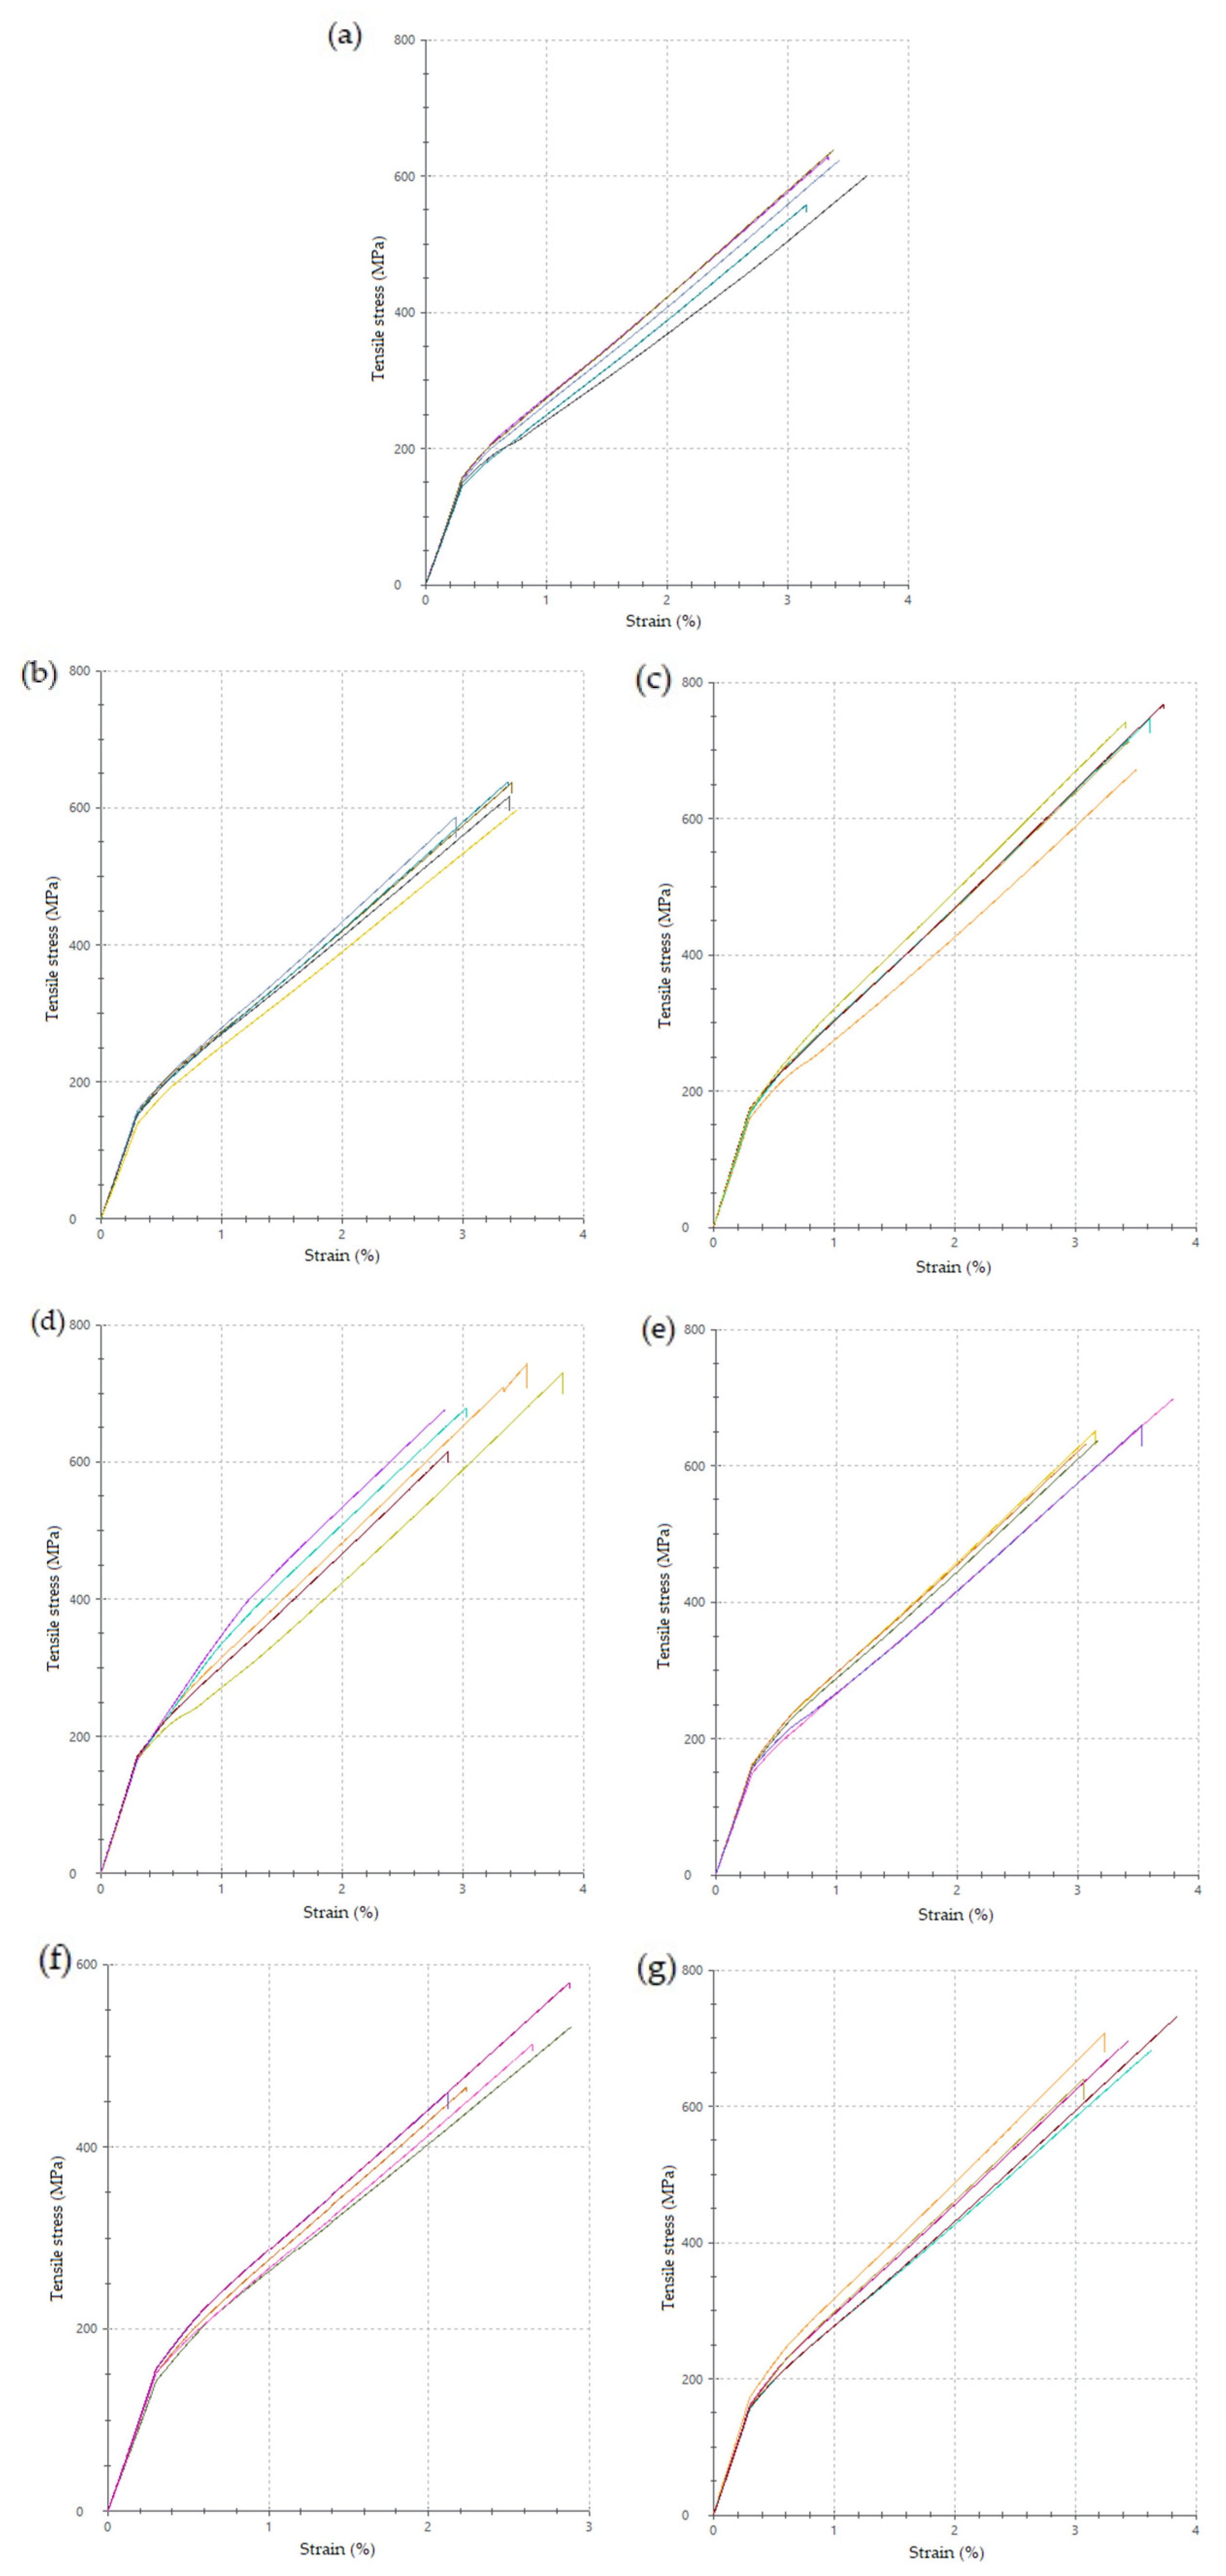
Figure 15.
Tensile stress–strain curves ((a) MStd, (b) Op0, (c) Op1, (d) Op2, (e) Op3, (f) Op4, (g) Op5).
Figure 15.
Tensile stress–strain curves ((a) MStd, (b) Op0, (c) Op1, (d) Op2, (e) Op3, (f) Op4, (g) Op5).
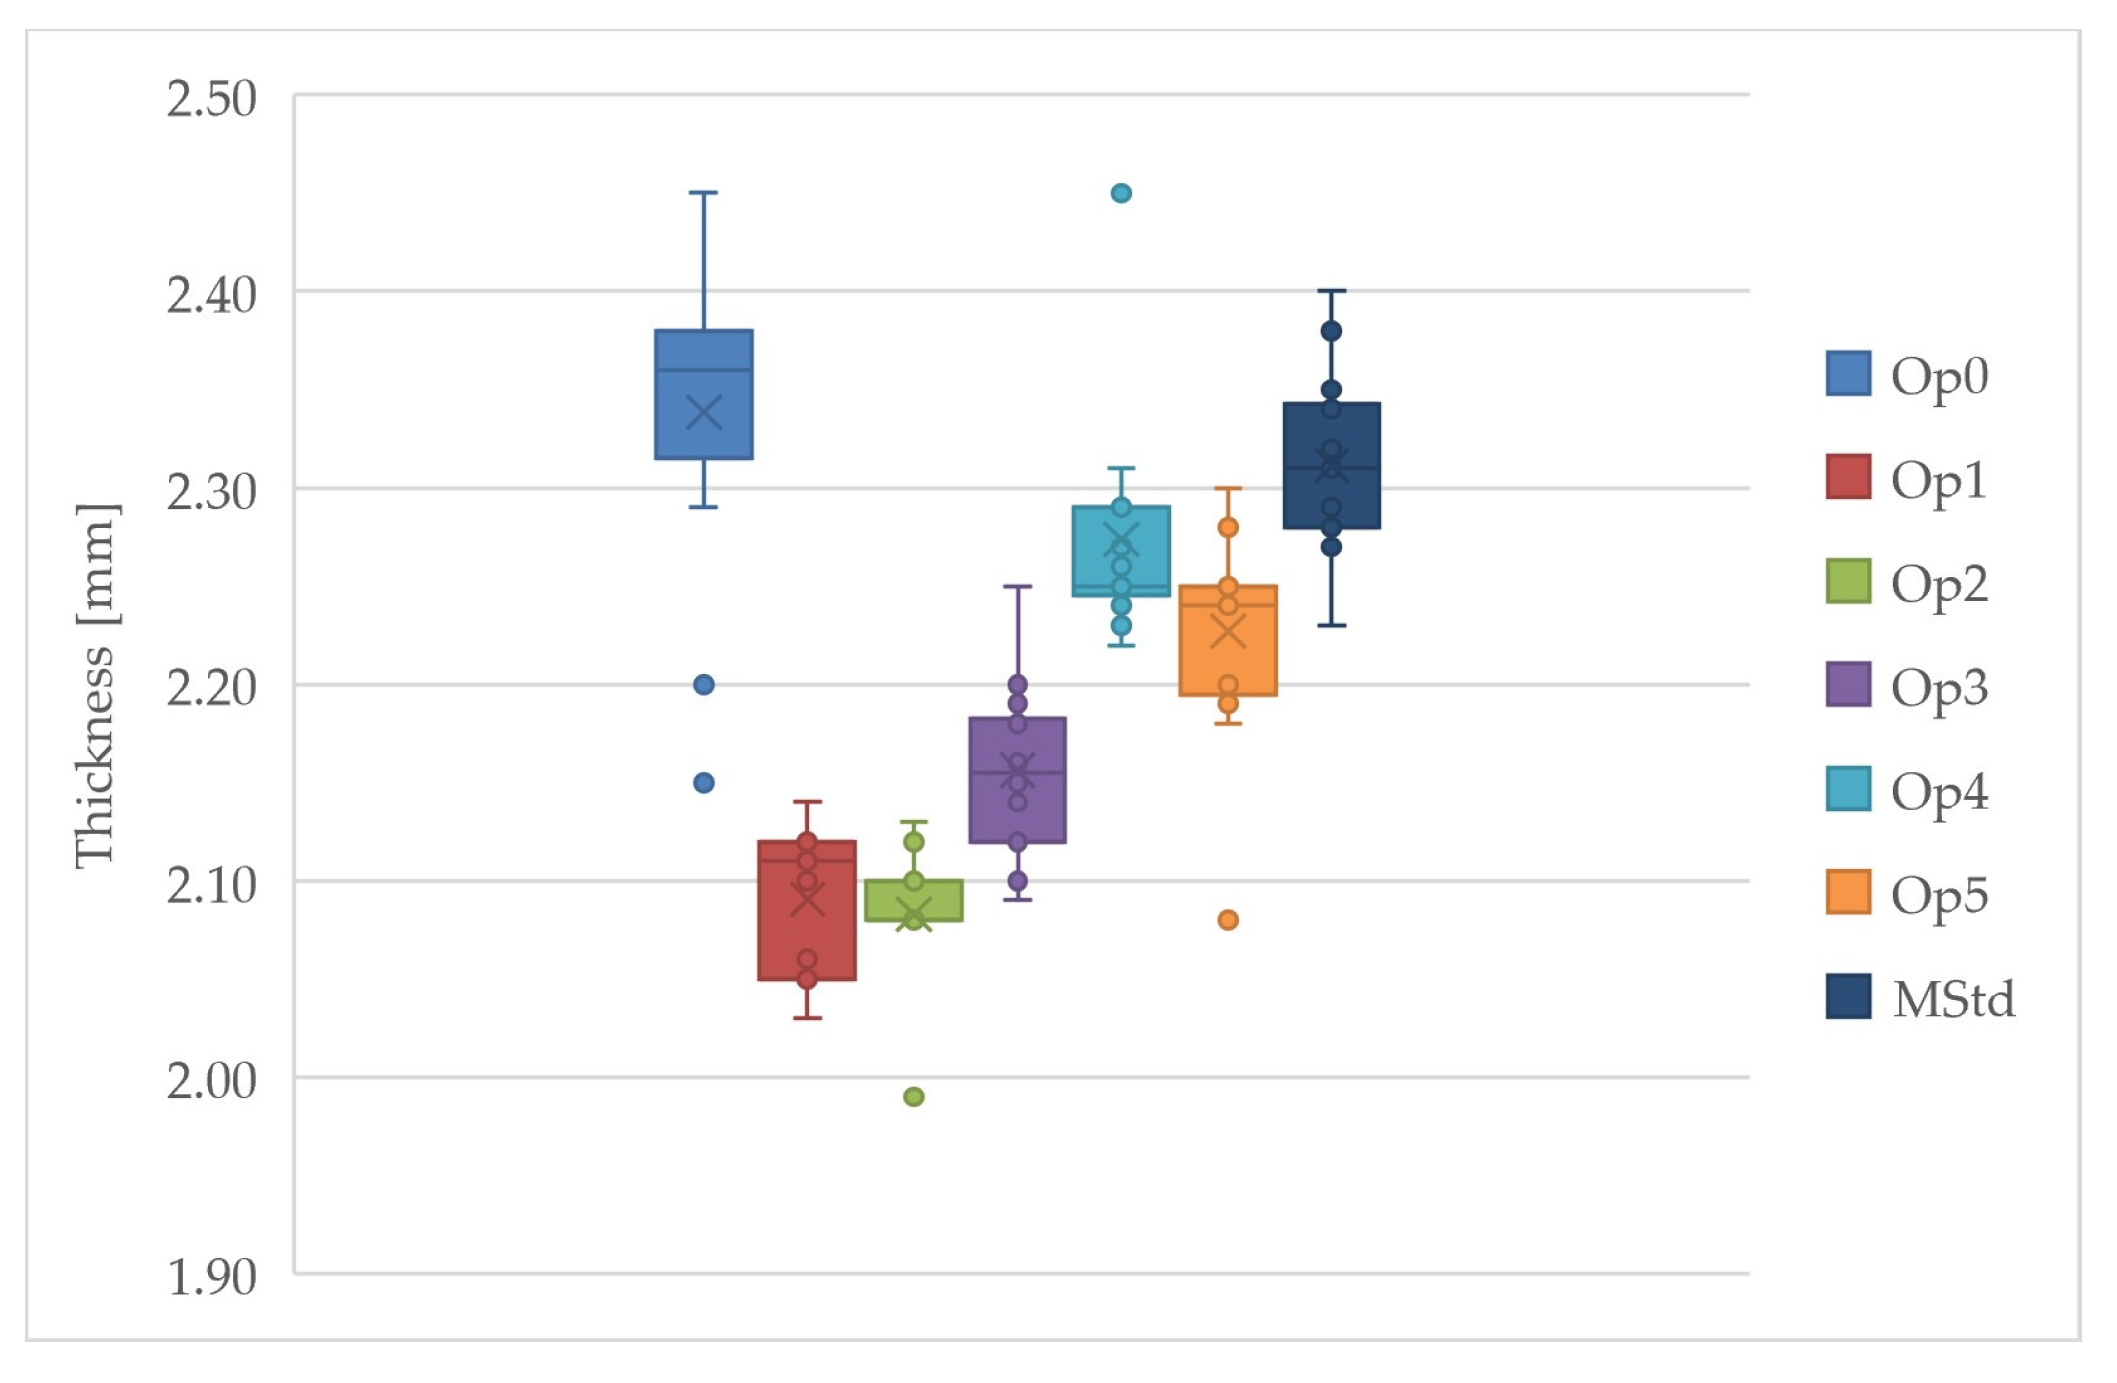
Figure 16.
Comparison of the thickness of the cured laminates (dark blue: MStd, blue: Op0, red: Op1, green: Op2, purple: Op3, light blue: Op4, orange: Op5).
Figure 16.
Comparison of the thickness of the cured laminates (dark blue: MStd, blue: Op0, red: Op1, green: Op2, purple: Op3, light blue: Op4, orange: Op5).
Table 1.
Reference prepreg material properties [
17].
Table 1.
Reference prepreg material properties [
17].
| Properties of Resin IMP503Z |
|---|
| Property | Value | Unit |
|---|
| Density | 1.15 ÷ 1.25 | g/cm3 |
| Gel time 125 °C | 6 ÷ 9 | min |
| Gel time 110 °C | 20 ÷ 26 | min |
| Tack level | intermediate ÷ high | - |
| Void content | <1 | % |
| Tg—cured resin | 120 | °C |
| Out-life 23 °C | 5 | weeks |
| Shelf life −18 °C | 1 | year |
| Reference properties of prepreg GG204P IMP503Z cured by compression molding |
| Property | Value | Unit |
| Flexural strength (ASTM D790) | 810 | MPa |
| Flexural modulus (ASTM D790) | 53,000 | MPa |
| Fiber volume fraction | 59 | % |
Table 2.
The scale of the index of indentation viscosity of a prepreg with expected values of viscosity.
Table 2.
The scale of the index of indentation viscosity of a prepreg with expected values of viscosity.
| Expected State of Prepreg Material | i (-) | η (mPas) |
|---|
| rigid | 1.0 | N/A |
| less rigid with high tackiness | 0.9 | N/A |
| soft | 0.8 | N/A |
| soft to very high viscosity transition zone | 0.7 | N/A |
| very high viscosity | 0.6 | (500,000, 1,000,000) |
| high viscosity | 0.5 | (200,000, 500,000) |
| very high and medium viscosity transition zone | 0.4 | (100,000, 200,000) |
| medium viscosity | 0.3 | (50,000, 100,000) |
| medium and low viscosity transition zone | 0.2 | (10,000, 50,000) |
| low viscosity | 0.1 | (2000, 10,000) |
| very low viscosity | 0.0 | (0, 2000) |
Table 3.
Temperature settings of the performed cure cycles.
Table 3.
Temperature settings of the performed cure cycles.
| MStd | Op0, Op1, Op2, Op3, Op4, Op5 |
|---|
| Time [min] | Temperature (°C) | Time [min] | Temperature (°C) |
|---|
| 0 | 20 | 0 | 20 |
| 55 | 125 | 30 | 100 |
| 115 | 125 | 50 | 100 |
| 165 | 45 | 55 | 125 |
| | | 115 | 125 |
| | | 165 | 45 |
Table 4.
Pressure settings of the performed cure cycles.
Table 4.
Pressure settings of the performed cure cycles.
| MStd | | Op0 | Op1 | Op2 | Op3 | Op4 | Op5 |
|---|
| Time [min] | Pressure [bar] | Time [min] | Pressure [bar] | Pressure [bar] | Pressure [bar] | Pressure [bar] | Pressure [bar] | Pressure [bar] |
|---|
| 0 | 0 | 0 | 0 | 0 | 0 | 0 | 0 | 0 |
| 25 | 6 | 5 | 0 | 1 | 2 | 3 | 4 | 5 |
| 130 | 6 | 55 | 0 | 1 | 2 | 3 | 4 | 5 |
| 165 | 0 | 60 | 6 | 6 | 6 | 6 | 6 | 6 |
| | | 130 | 6 | 6 | 6 | 6 | 6 | 6 |
| | | 165 | 0 | 0 | 0 | 0 | 0 | 0 |
Table 5.
Evaluation of the flexural modulus of the cured laminates.
Table 5.
Evaluation of the flexural modulus of the cured laminates.
| Flexural Modulus (MPa) |
|---|
| | Op0 | Op1 | Op2 | Op3 | Op4 | Op5 | MStd |
|---|
| 35,350 | 43,225 | 45,438 | 45,922 | 40,025 | 42,175 | 38,867 |
| 864 | 1682 | 2585 | 1618 | 947 | 951 | 1152 |
| ua | 305 | 595 | 914 | 539 | 335 | 317 | 384 |
| (%) | 2.44 | 3.89 | 5.69 | 3.52 | 2.37 | 2.26 | 2.96 |
Table 6.
Evaluation of the flexural strength of the cured laminates.
Table 6.
Evaluation of the flexural strength of the cured laminates.
| Flexural Strength (MPa) |
|---|
| | Op0 | Op1 | Op2 | Op3 | Op4 | Op5 | MStd |
|---|
| 703 | 755 | 721 | 766 | 645 | 745 | 677 |
| 17 | 27 | 75 | 27 | 78 | 34 | 30 |
| ua | 6 | 9 | 26 | 9 | 28 | 11 | 10 |
| (%) | 2.48 | 3.55 | 10.38 | 3.55 | 12.17 | 4.52 | 4.49 |
Table 7.
Evaluation of the tensile modulus of the cured laminates.
Table 7.
Evaluation of the tensile modulus of the cured laminates.
| Comparison of Tensile Modulus (MPa) |
|---|
| | Op0 | Op1 | Op2 | Op3 | Op4 | Op5 | MStd |
|---|
| 50,160 | 55,800 | 55,500 | 51,880 | 50,300 | 53,260 | 50,160 |
| 2571 | 1744 | 731 | 1675 | 1907 | 1911 | 1744 |
| ua | 909 | 616 | 259 | 558 | 674 | 637 | 581 |
| (%) | 5.12 | 3.12 | 1.32 | 3.23 | 3.79 | 3.59 | 3.48 |
Table 8.
Evaluation of the tensile strength of the cured laminates.
Table 8.
Evaluation of the tensile strength of the cured laminates.
| Comparison of Tensile Strength (MPa) |
|---|
| | Op0 | Op1 | Op2 | Op3 | Op4 | Op5 | MStd |
|---|
| 615 | 728 | 689 | 656 | 510 | 691 | 610 |
| 23 | 37 | 51 | 26 | 50 | 34 | 32 |
| ua | 8 | 13 | 18 | 9 | 18 | 11 | 11 |
| (%) | 3.78 | 5.07 | 7.41 | 3.97 | 9.77 | 4.94 | 5.30 |
Table 9.
Comparison of the thicknesses of the cured laminates (where is the arithmetic mean, and is the standard deviation of the data set).
Table 9.
Comparison of the thicknesses of the cured laminates (where is the arithmetic mean, and is the standard deviation of the data set).
| Comparison of Thickness (mm) |
|---|
| | Op0 | Op1 | Op2 | Op3 | Op4 | Op5 | MStd |
|---|
| 2.34 | 2.09 | 2.08 | 2.16 | 2.27 | 2.23 | 2.31 |
| 0.08 | 0.04 | 0.03 | 0.04 | 0.06 | 0.06 | 0.05 |
| CPT | 0.260 | 0.232 | 0.231 | 0.240 | 0.252 | 0.248 | 0.256 |


