

Methods to Reduce Energy and Polymer Consumption for Fused Filament Fabrication 3D Printing


Abstract
1. Introduction
2. Experimental
2.1. Experiments
- Energy measurement:
- Heated bed influence on energy results. All three machines will build parts with and without bed insulation and the energy will be measured for each.
- Hot-end influence on energy. All three machines will build parts with and without nozzle insulation and the energy will be measured for each.
- Printer enclosure influence on energy. All three machines will build parts with and without the enclosure and the energy will be measured for each.
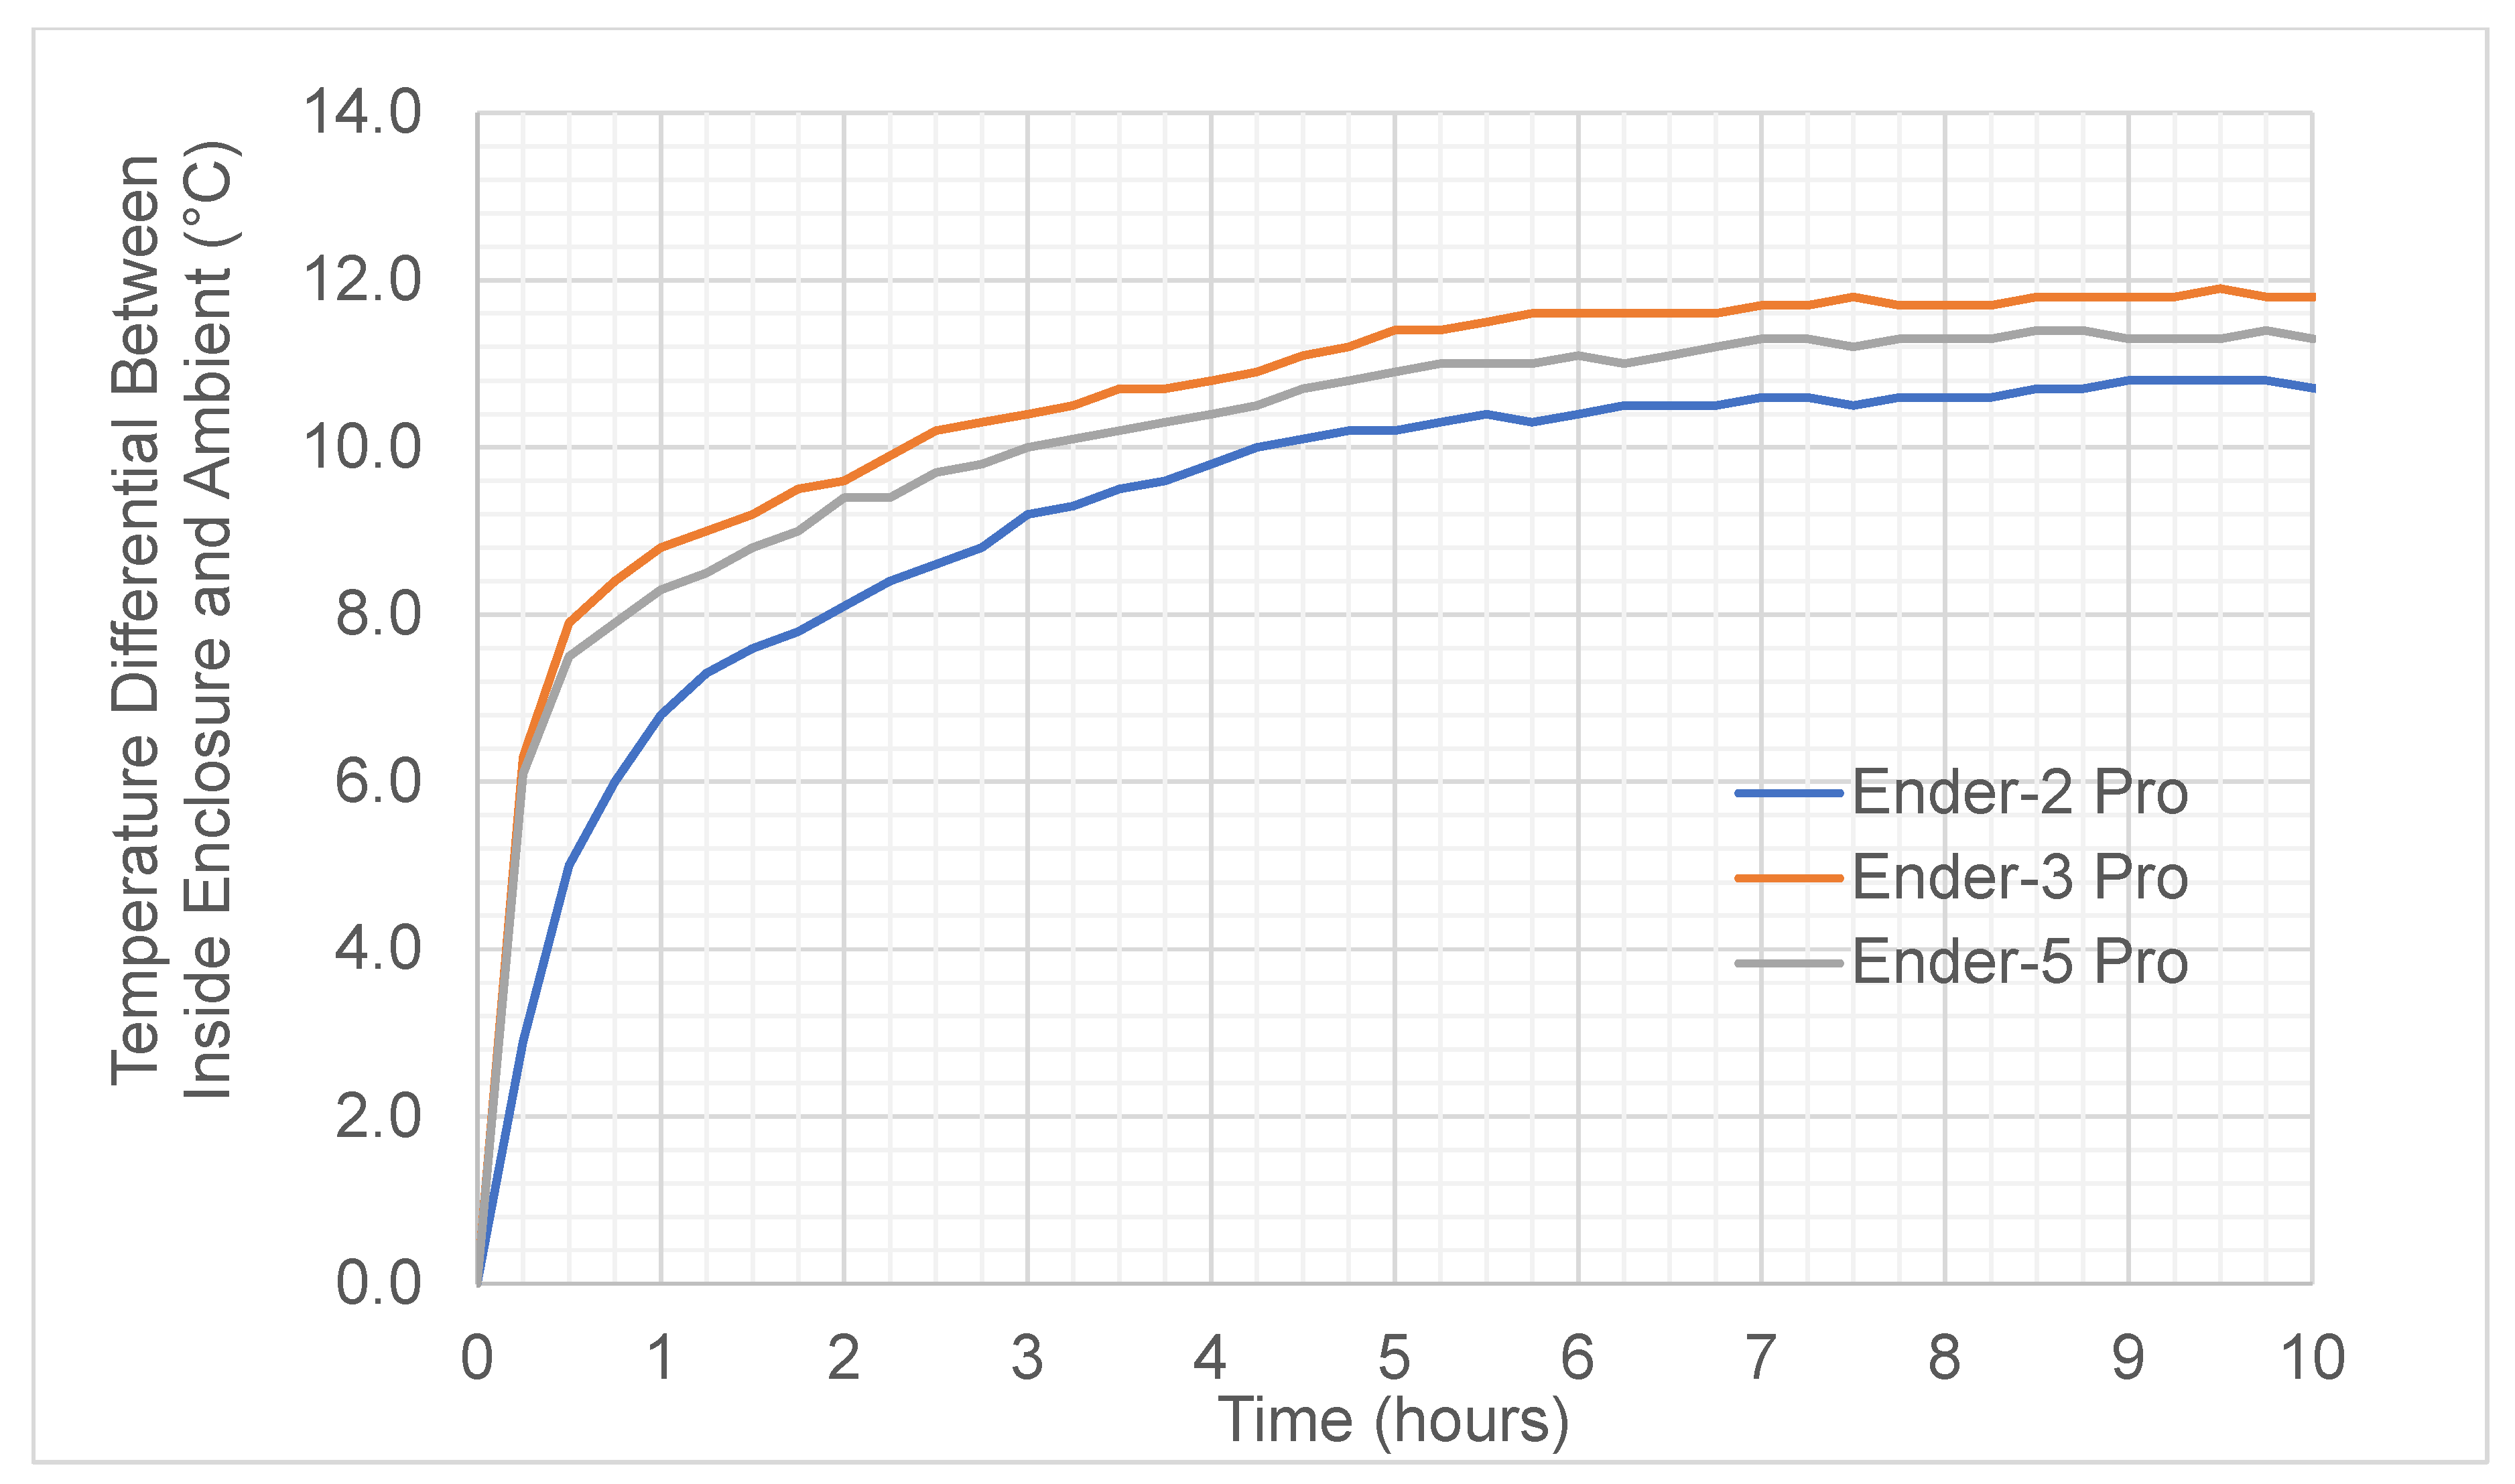
- For all three machines, an extended print test (>8 h) will be performed to observe the temperature differential inside and outside the printer enclosure.
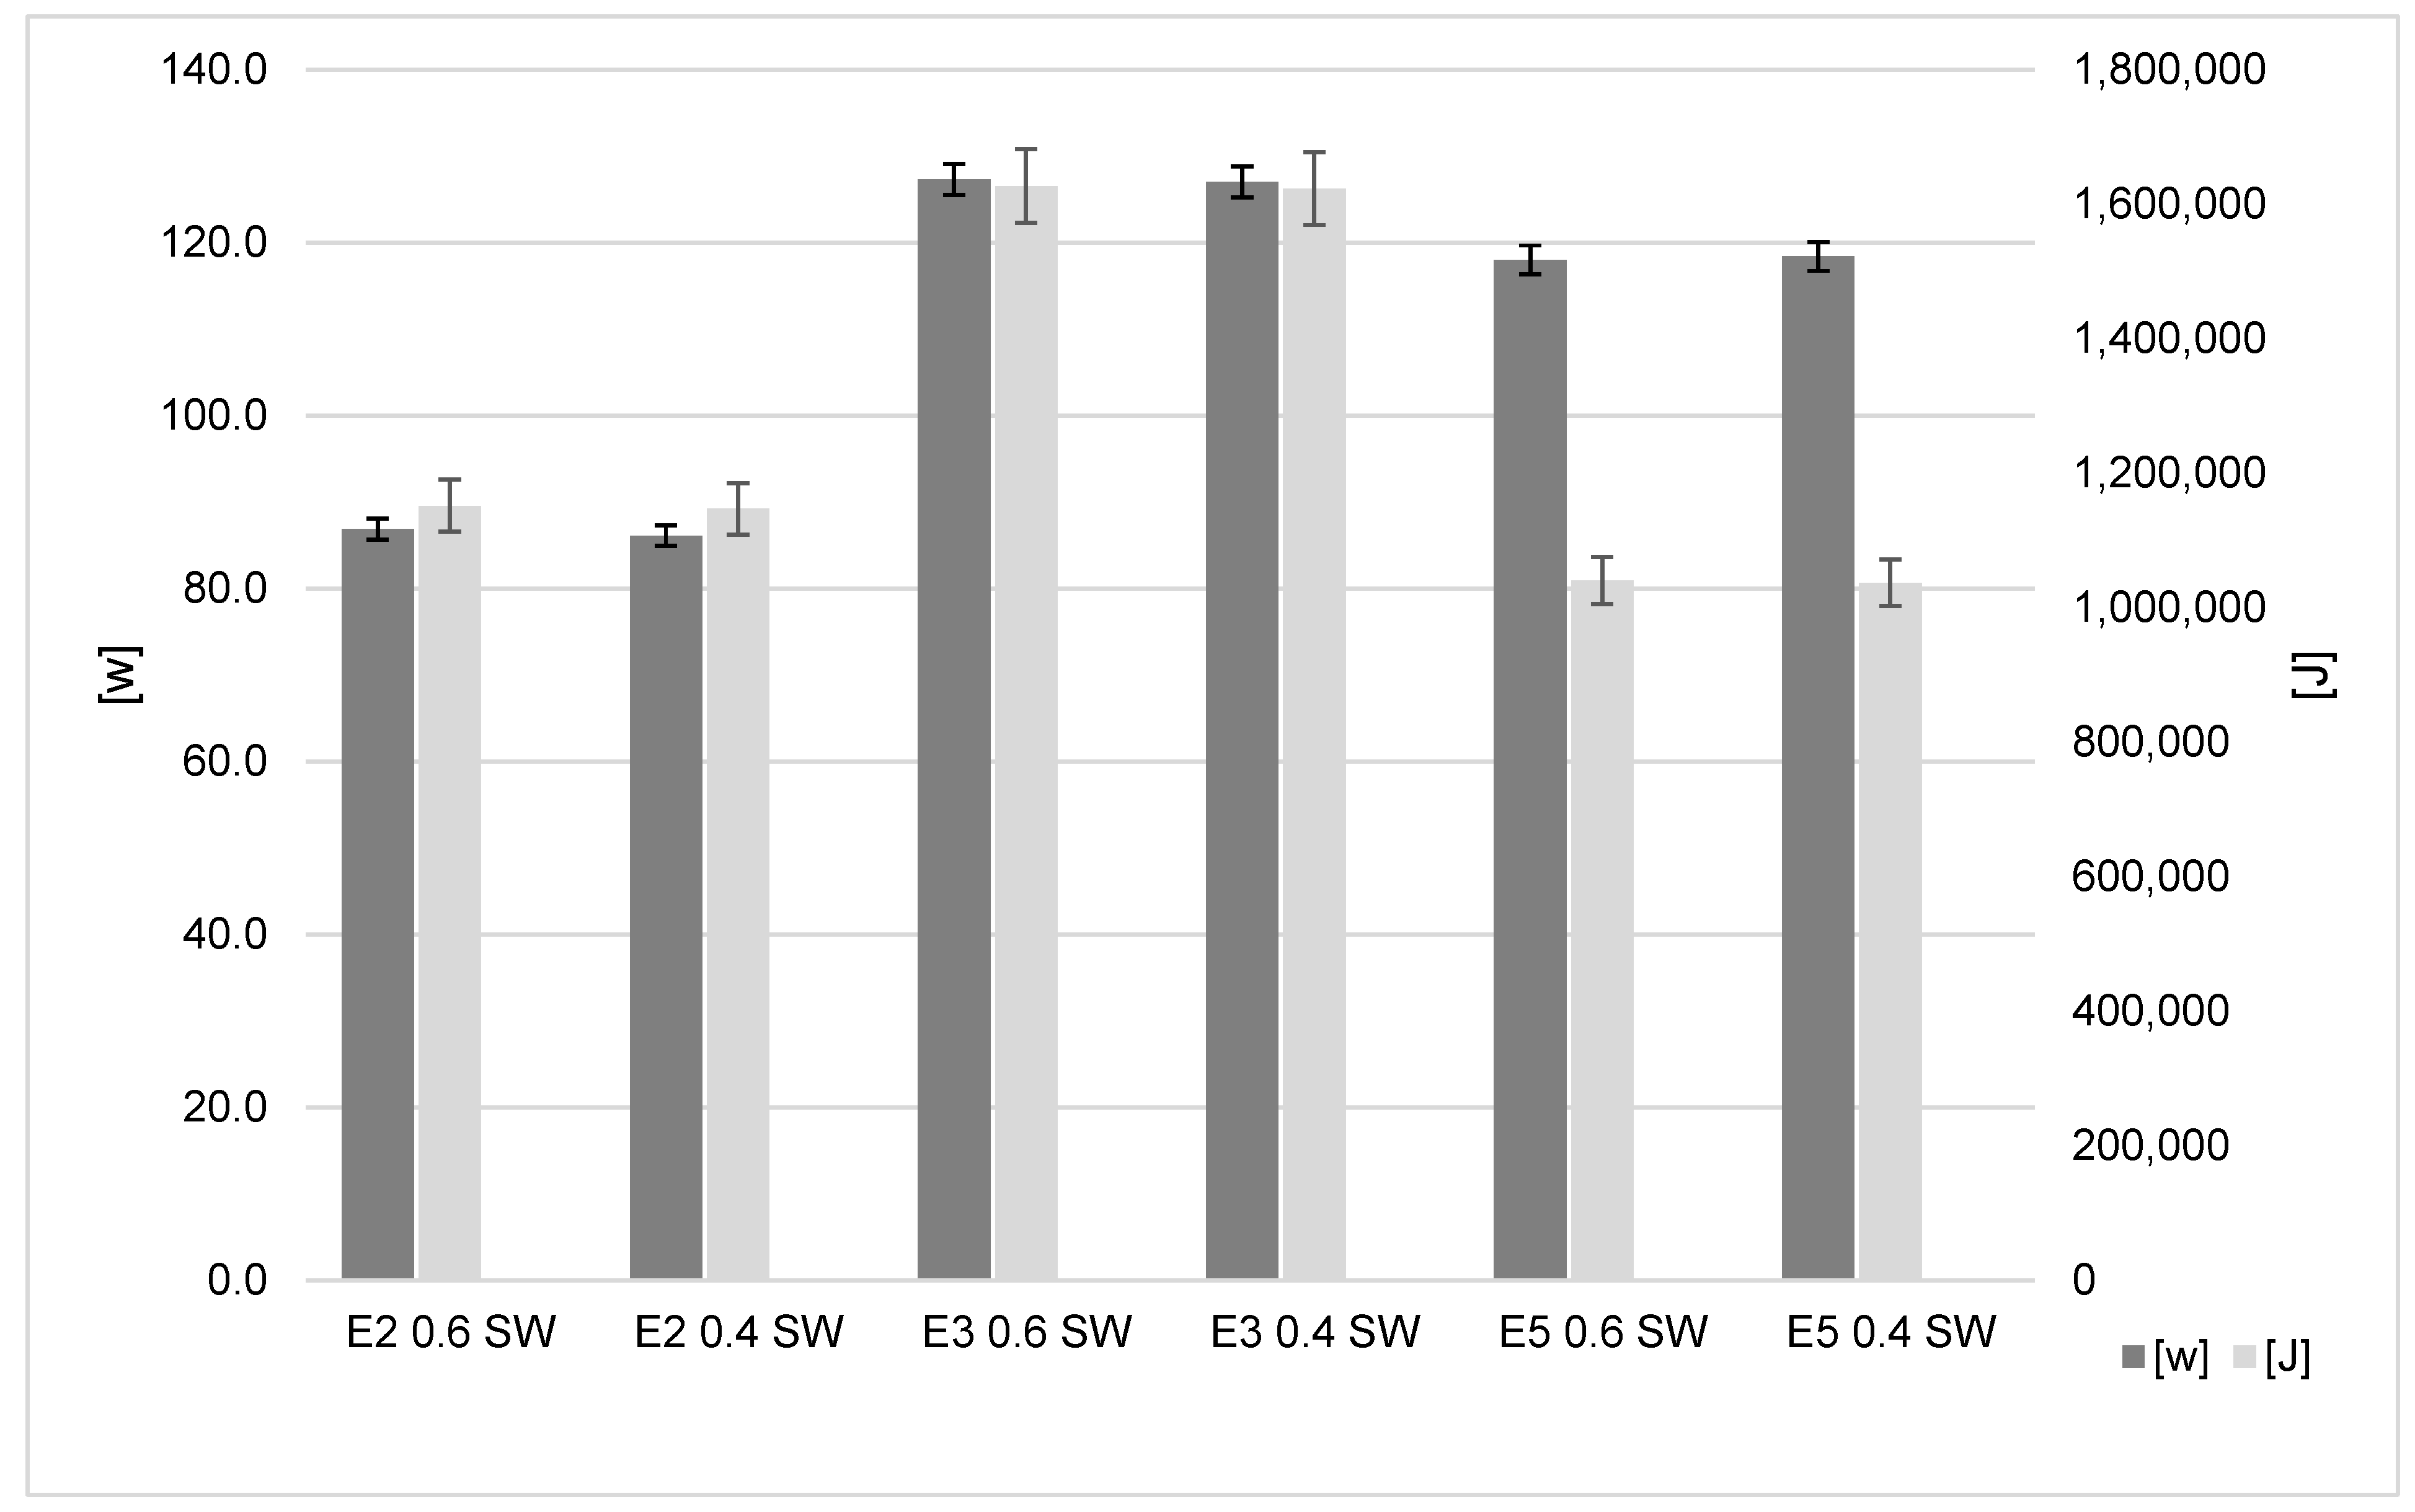
- Support line width influence on energy. All three machines will build parts with two different line widths and the energy will be measured for each.
- Infill influence on energy. All three machines will build parts with two different infill types and the energy will be measured for each.
- Optimised energy results. All three machines will build parts with optimised insulation, line width and foaming PLA.
- Build time and Material measurement:
- 8.
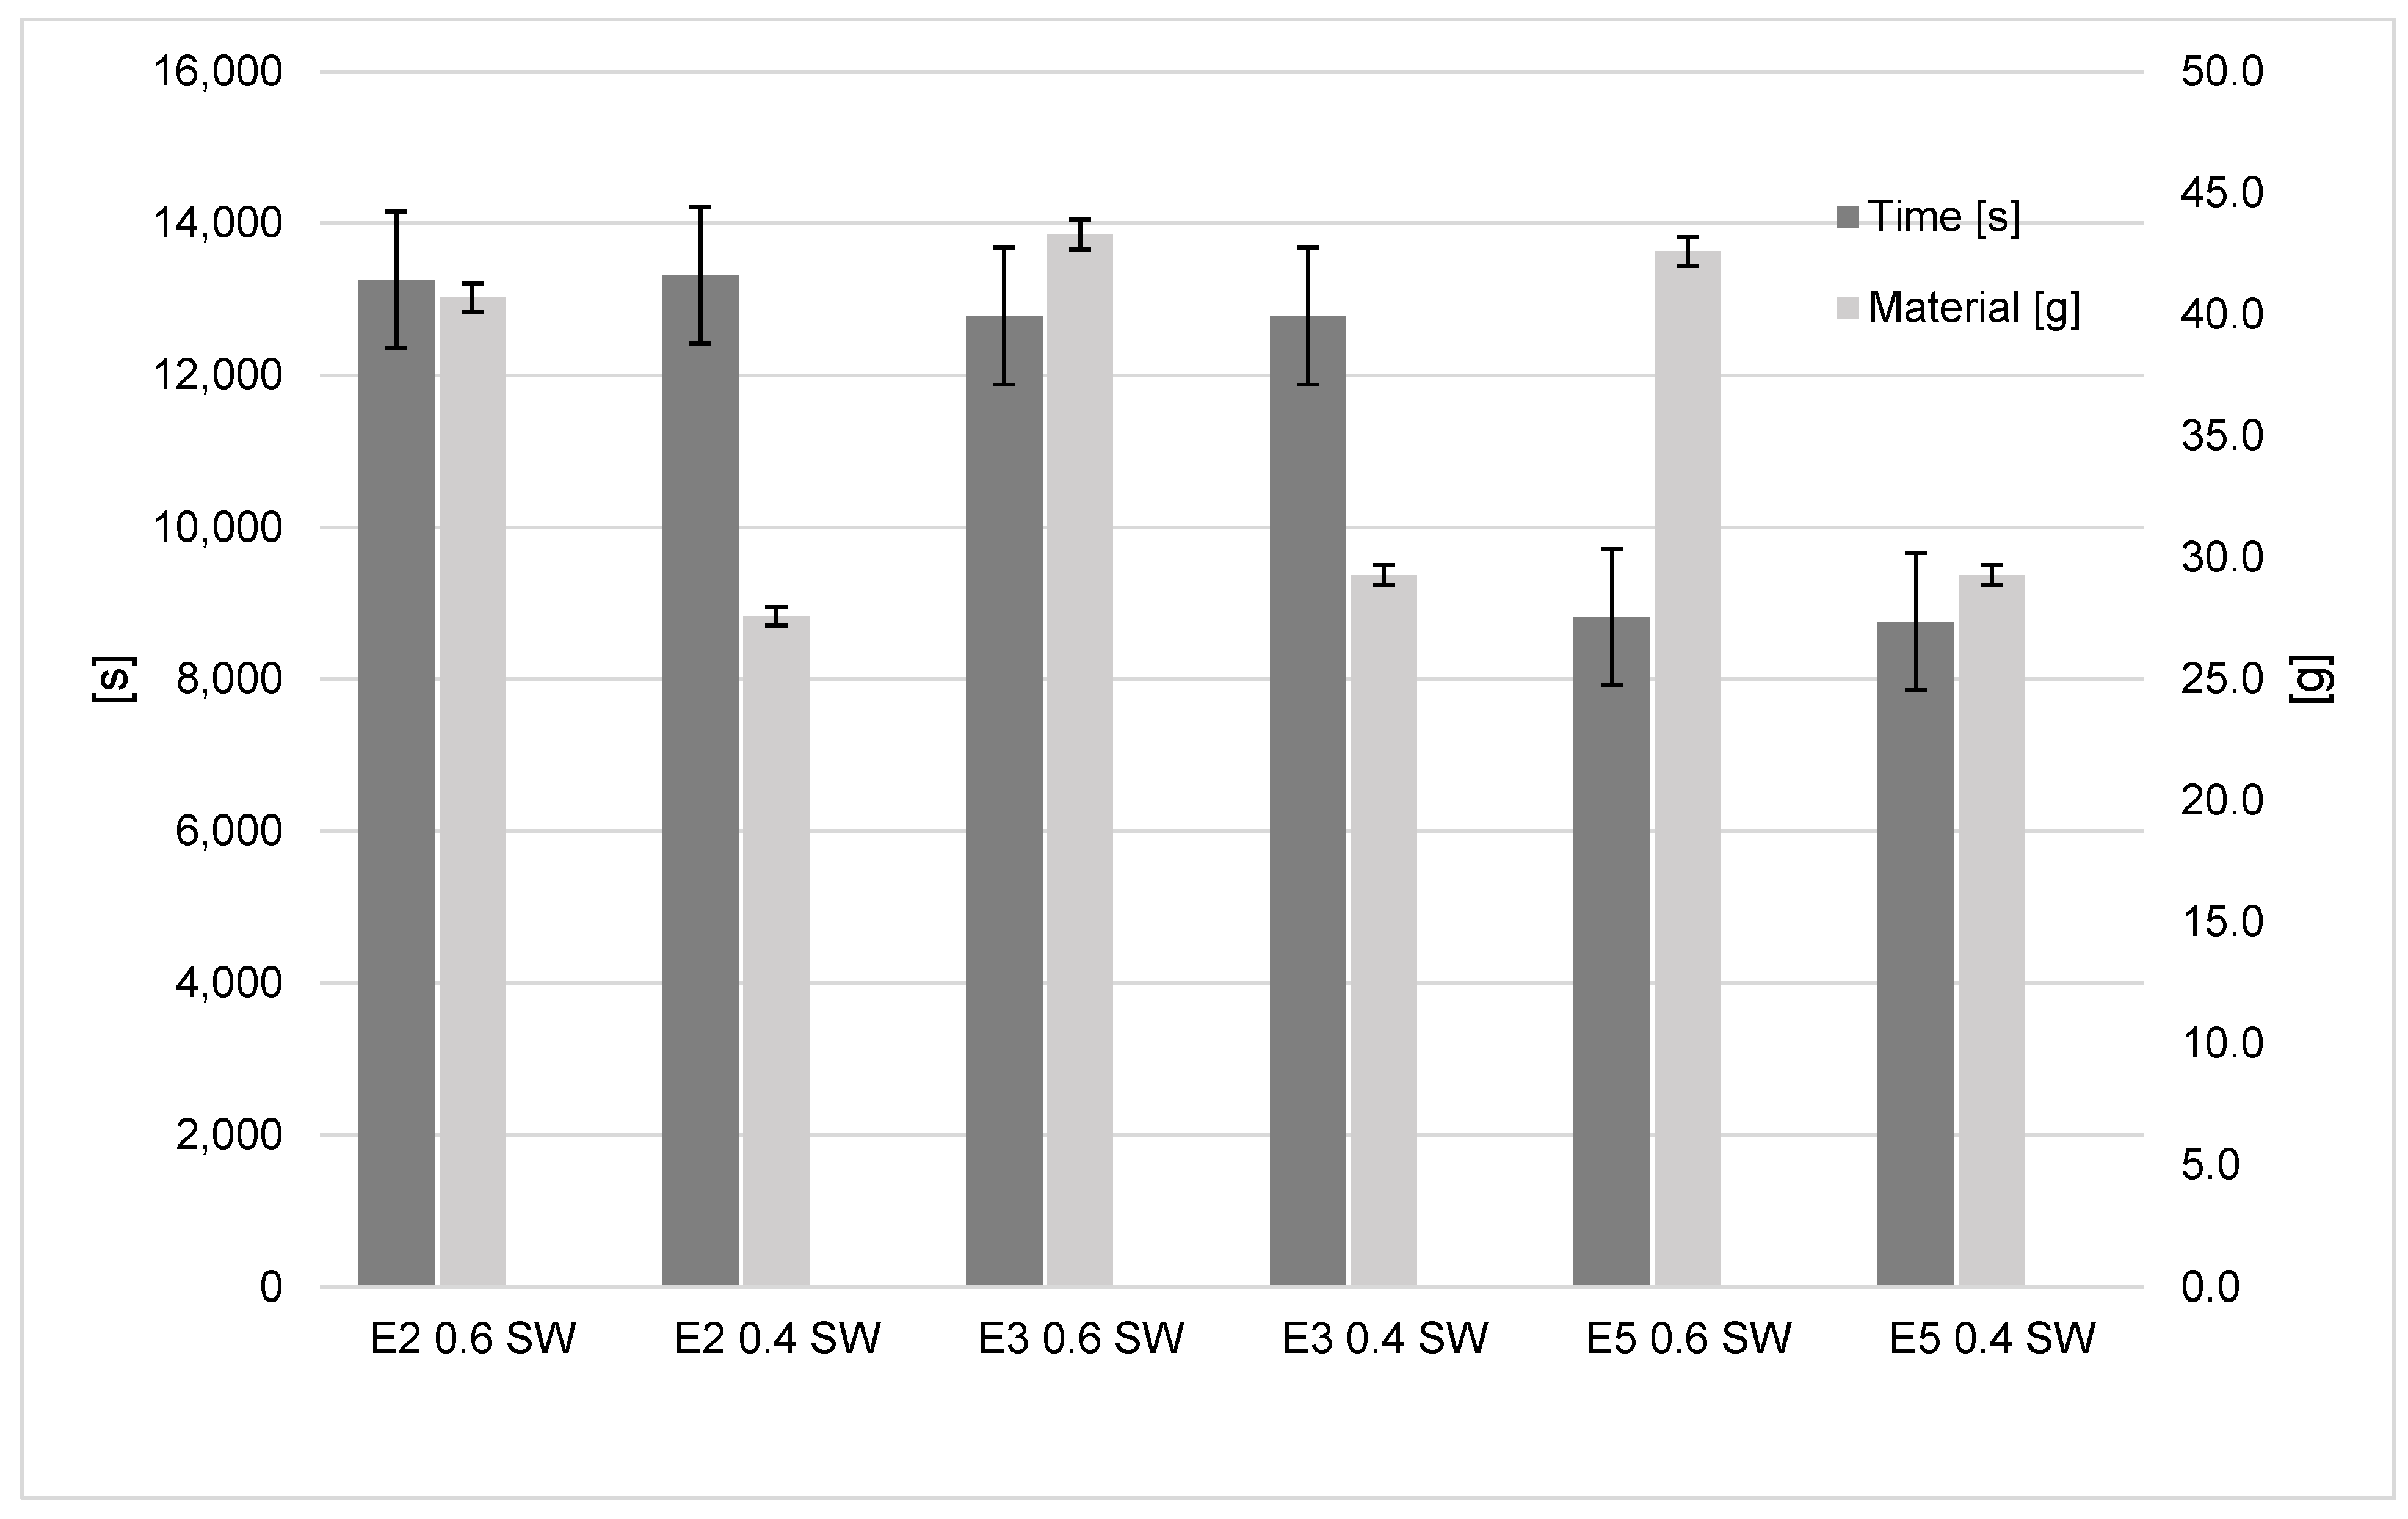
- Support line width influence on time and material results. All three machines will build parts with two different line widths and the time and material will be measured for each.
- 9.
- Infill influence on time and material results. All three machines will build parts with two different infill types and the time and material will be measured for each.
- 10.
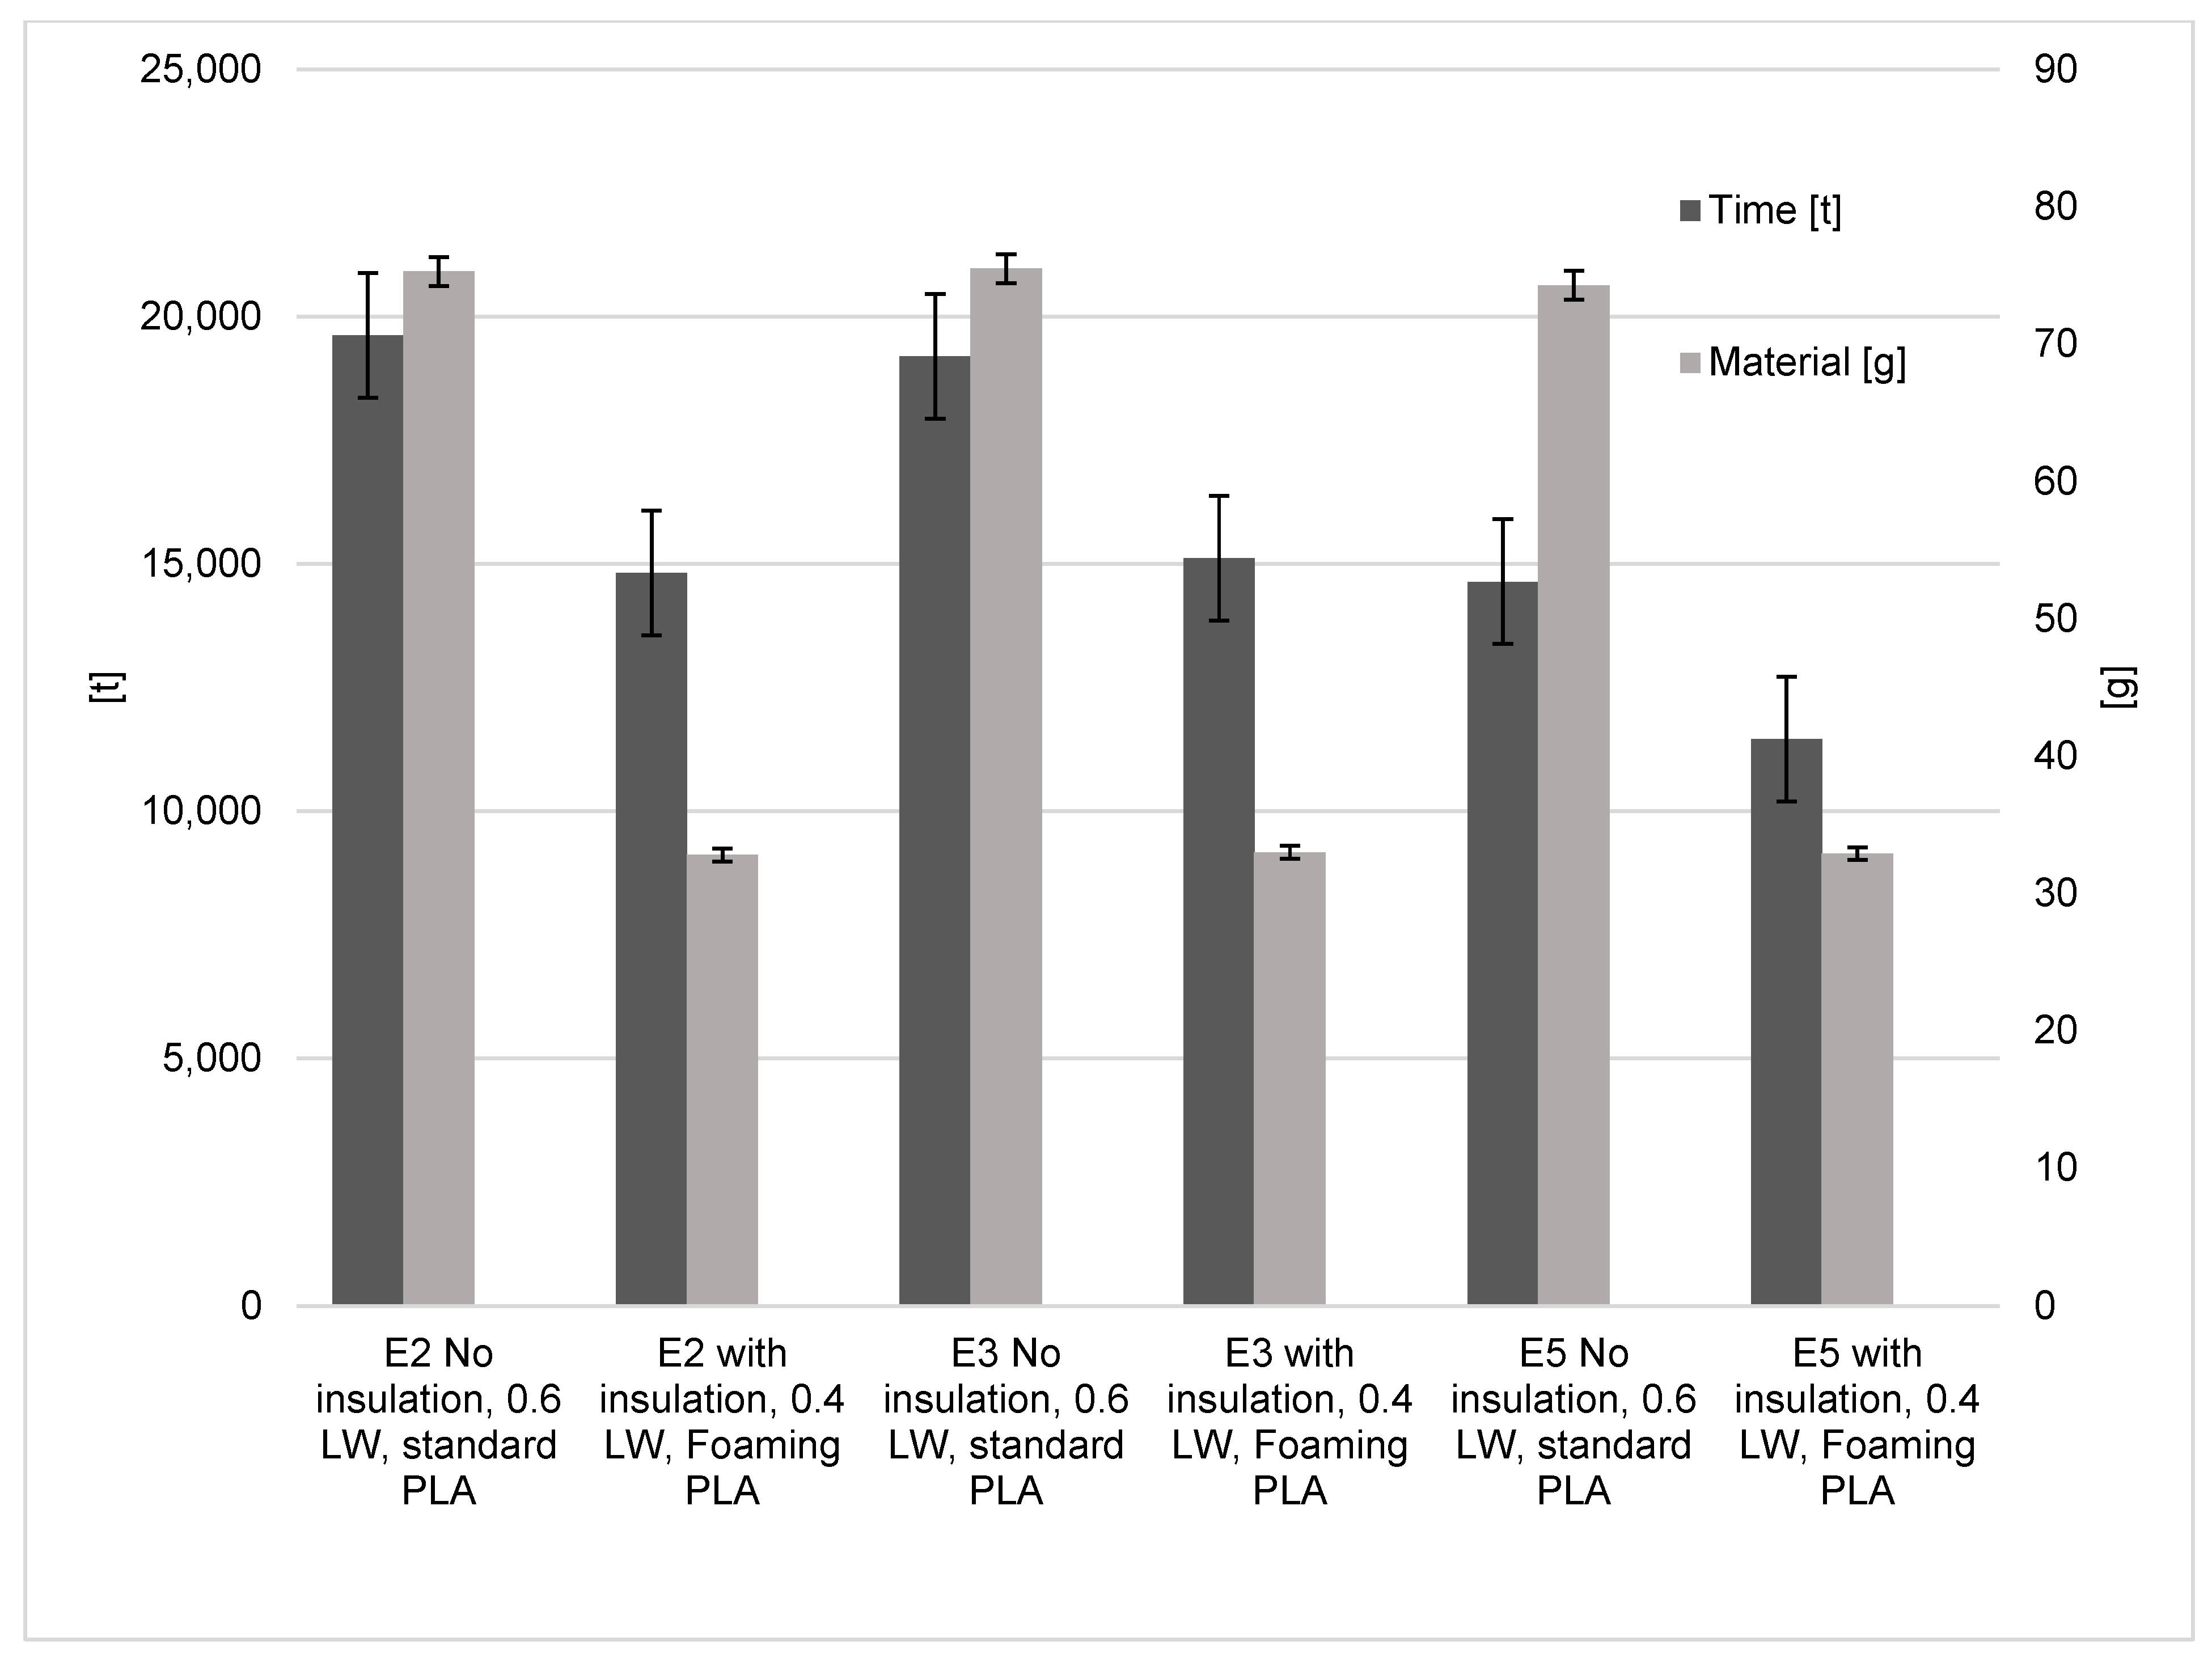
- Optimised material and time results. All three machines will build parts with optimised insulation, line width and foaming PLA.
2.2. Pre-Trials
2.3. 3D Printers
2.4. Power Consumption Tests
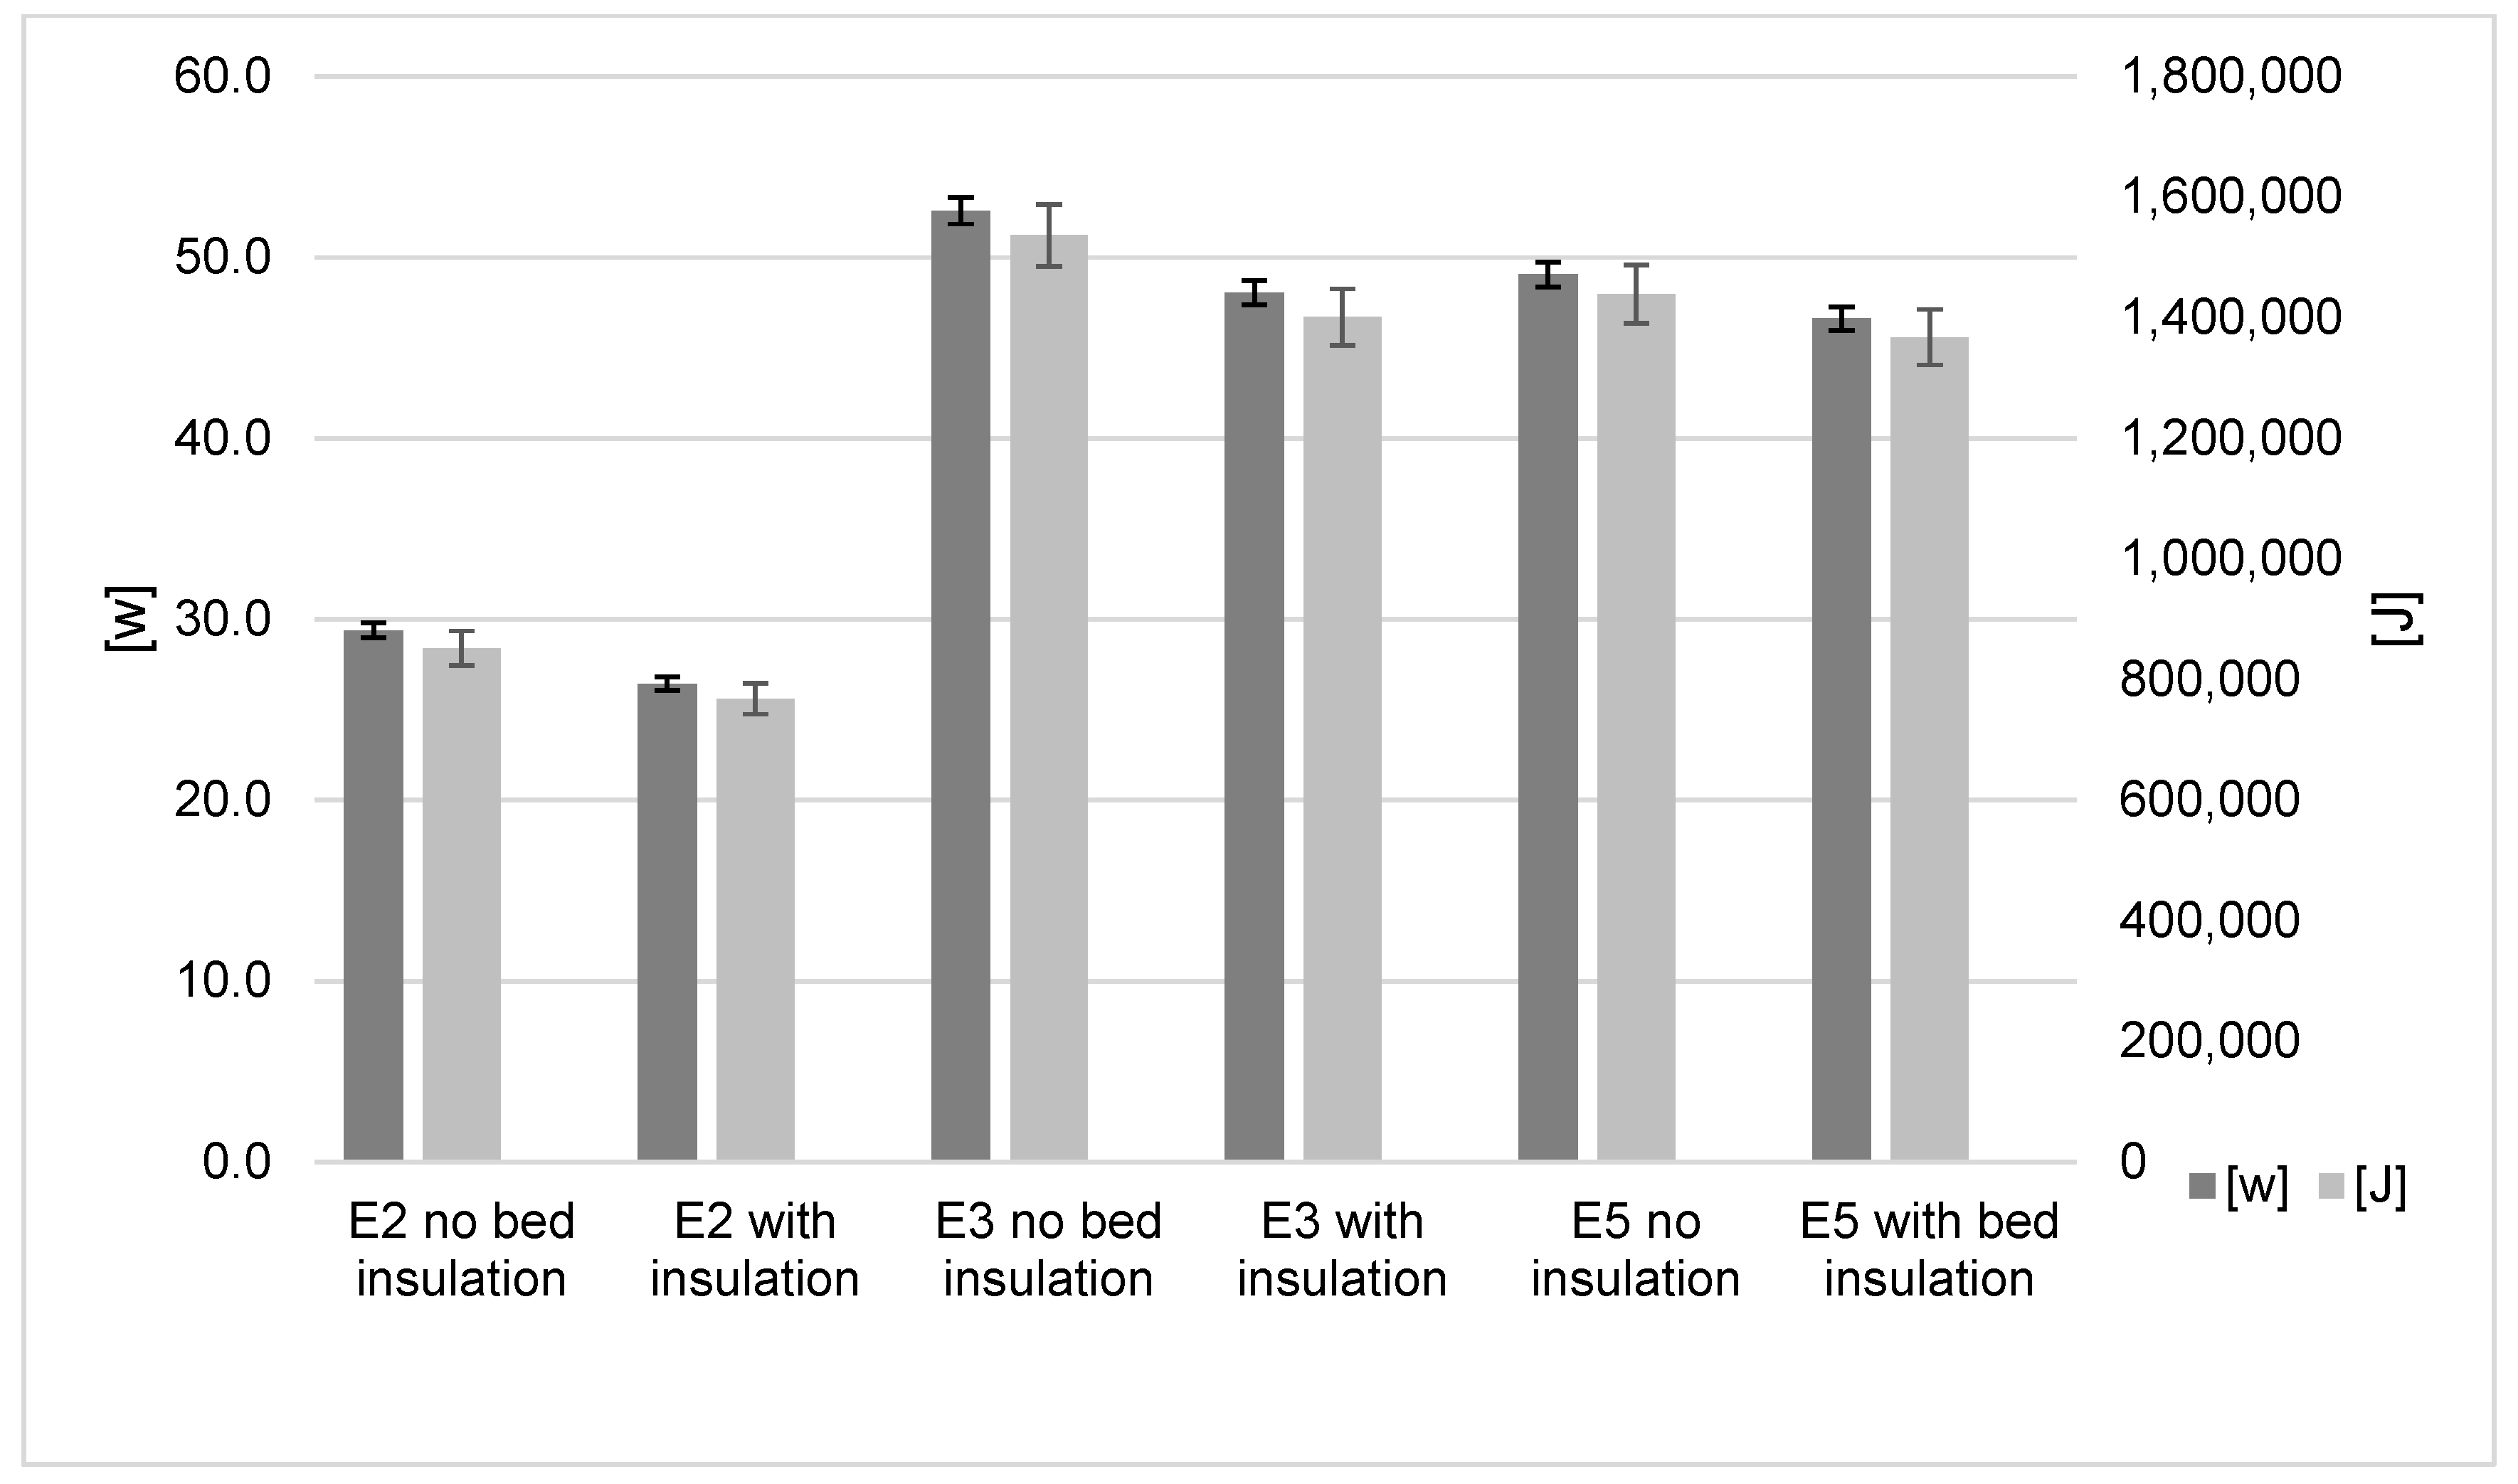
2.5. Heated Bed Insulation
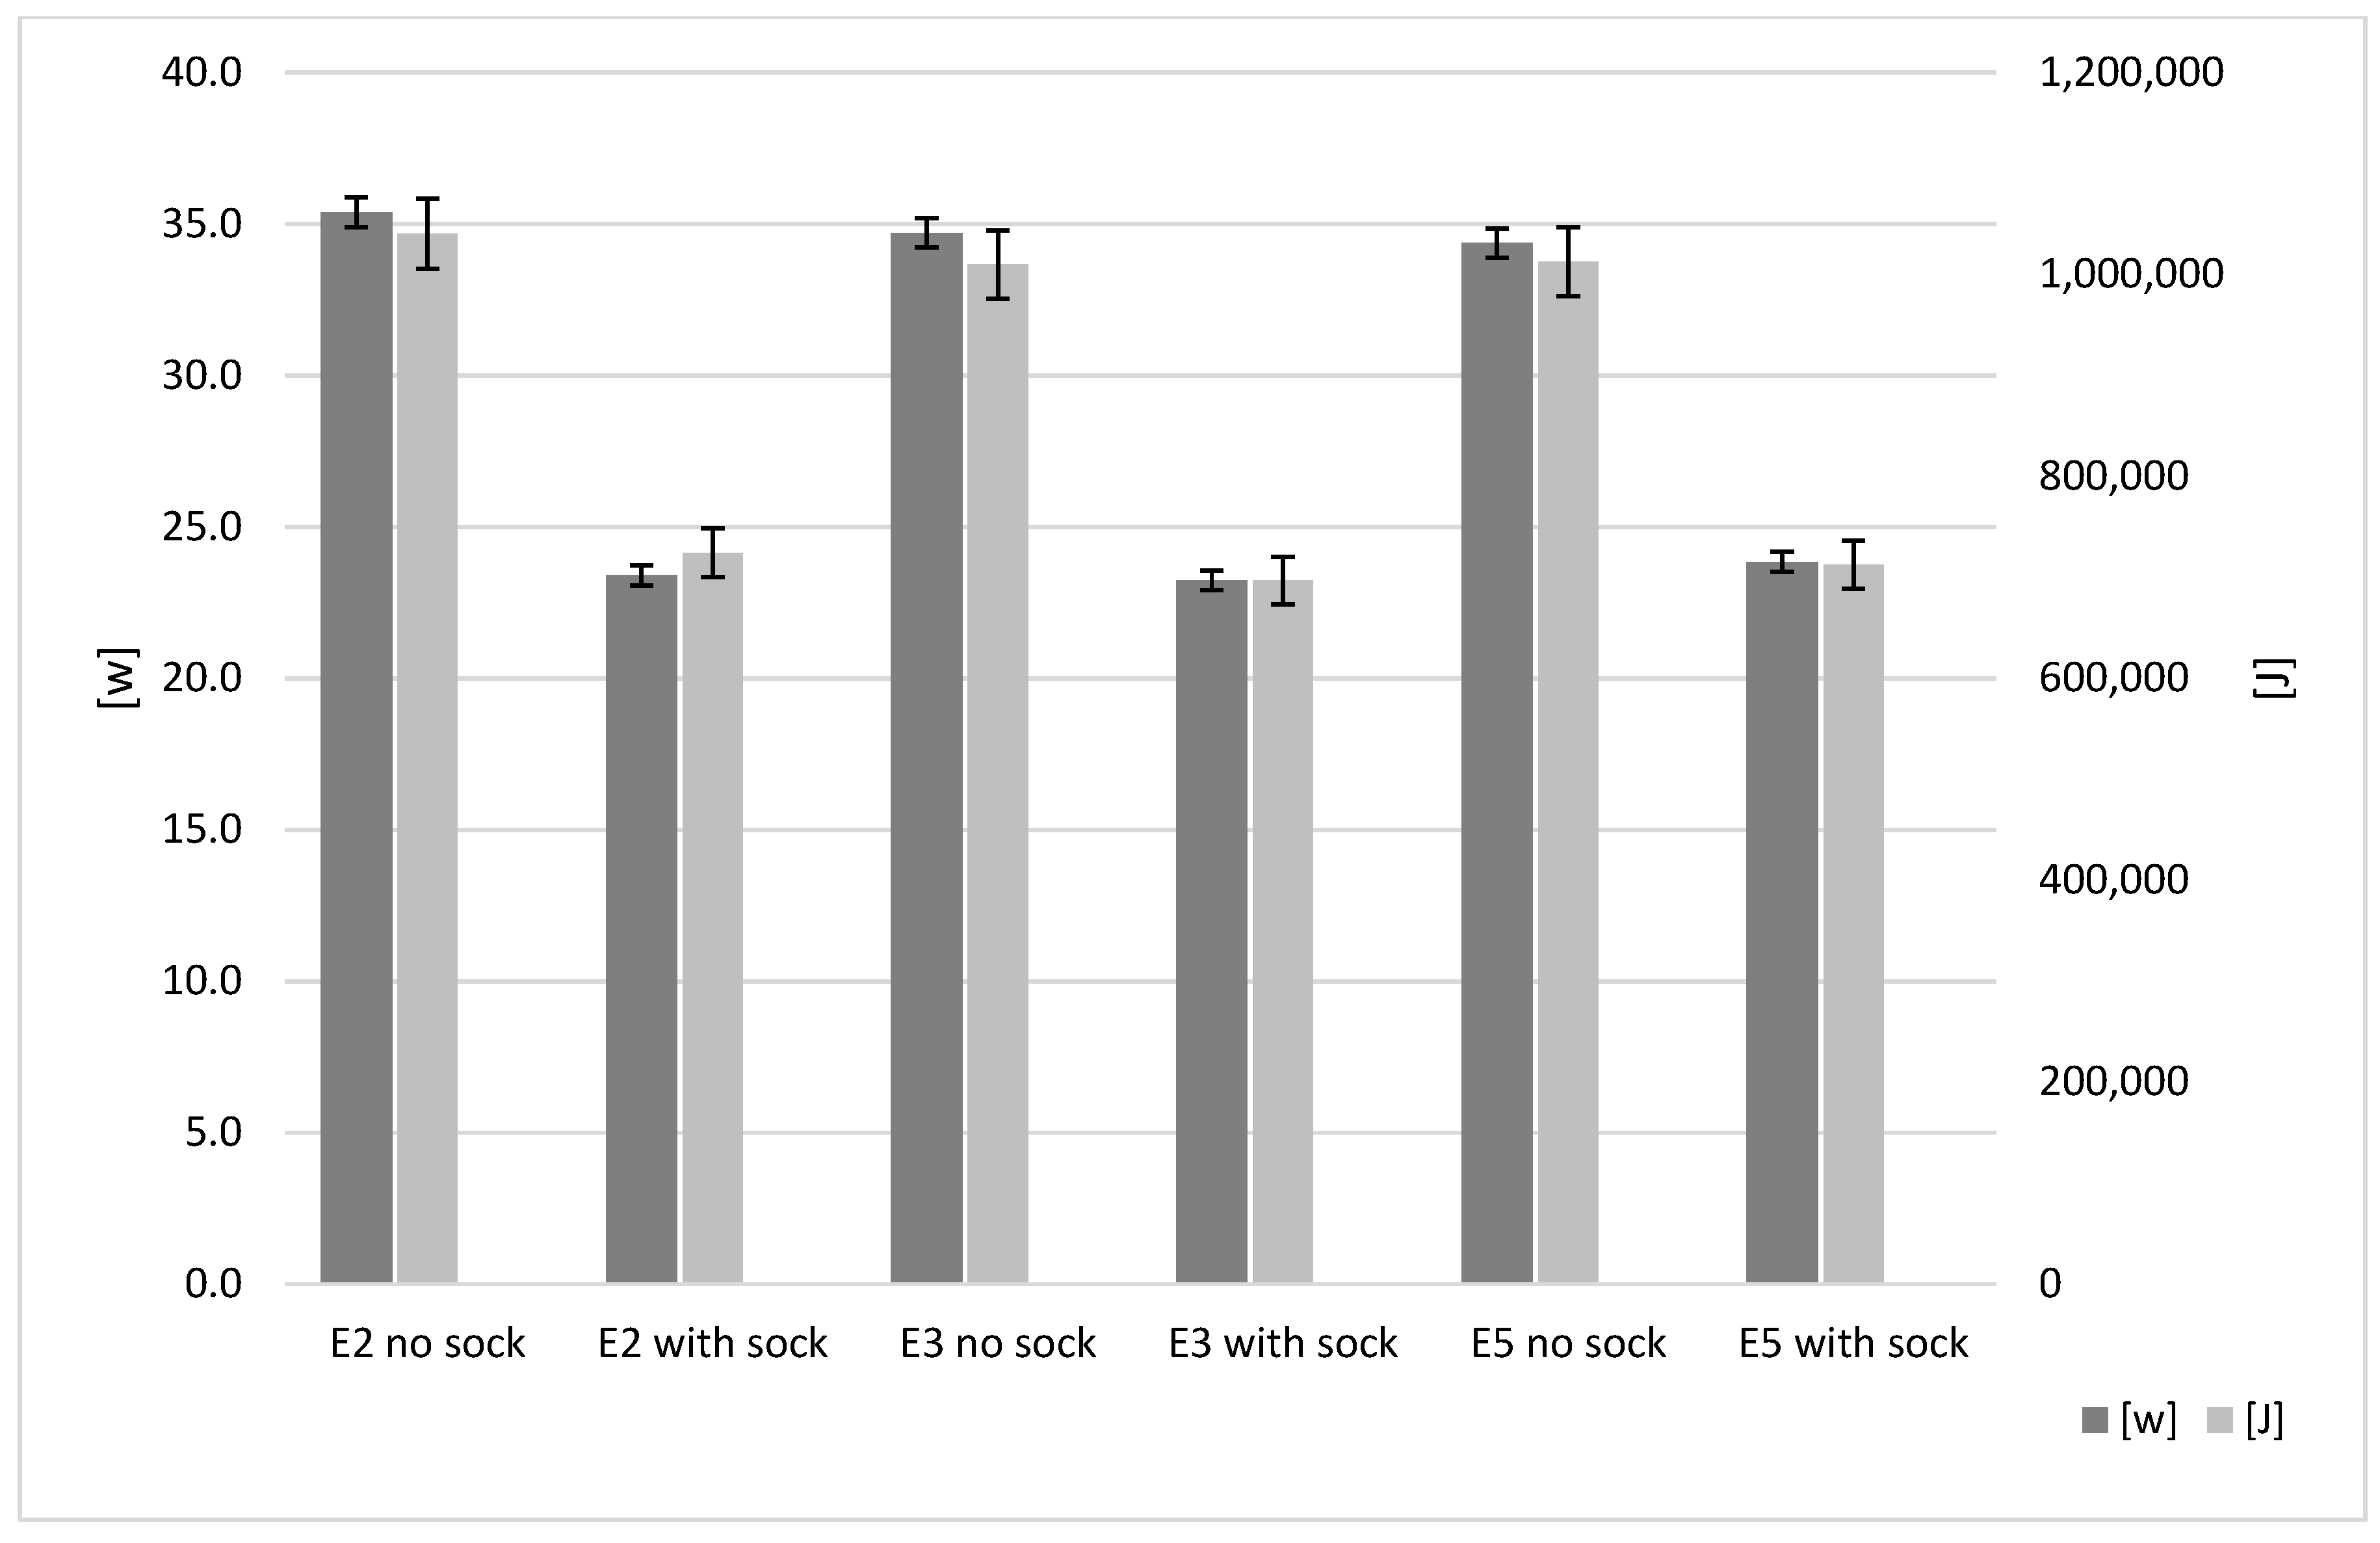
2.6. Hot-End Insulation
2.7. Full 3D Printer Enclosure
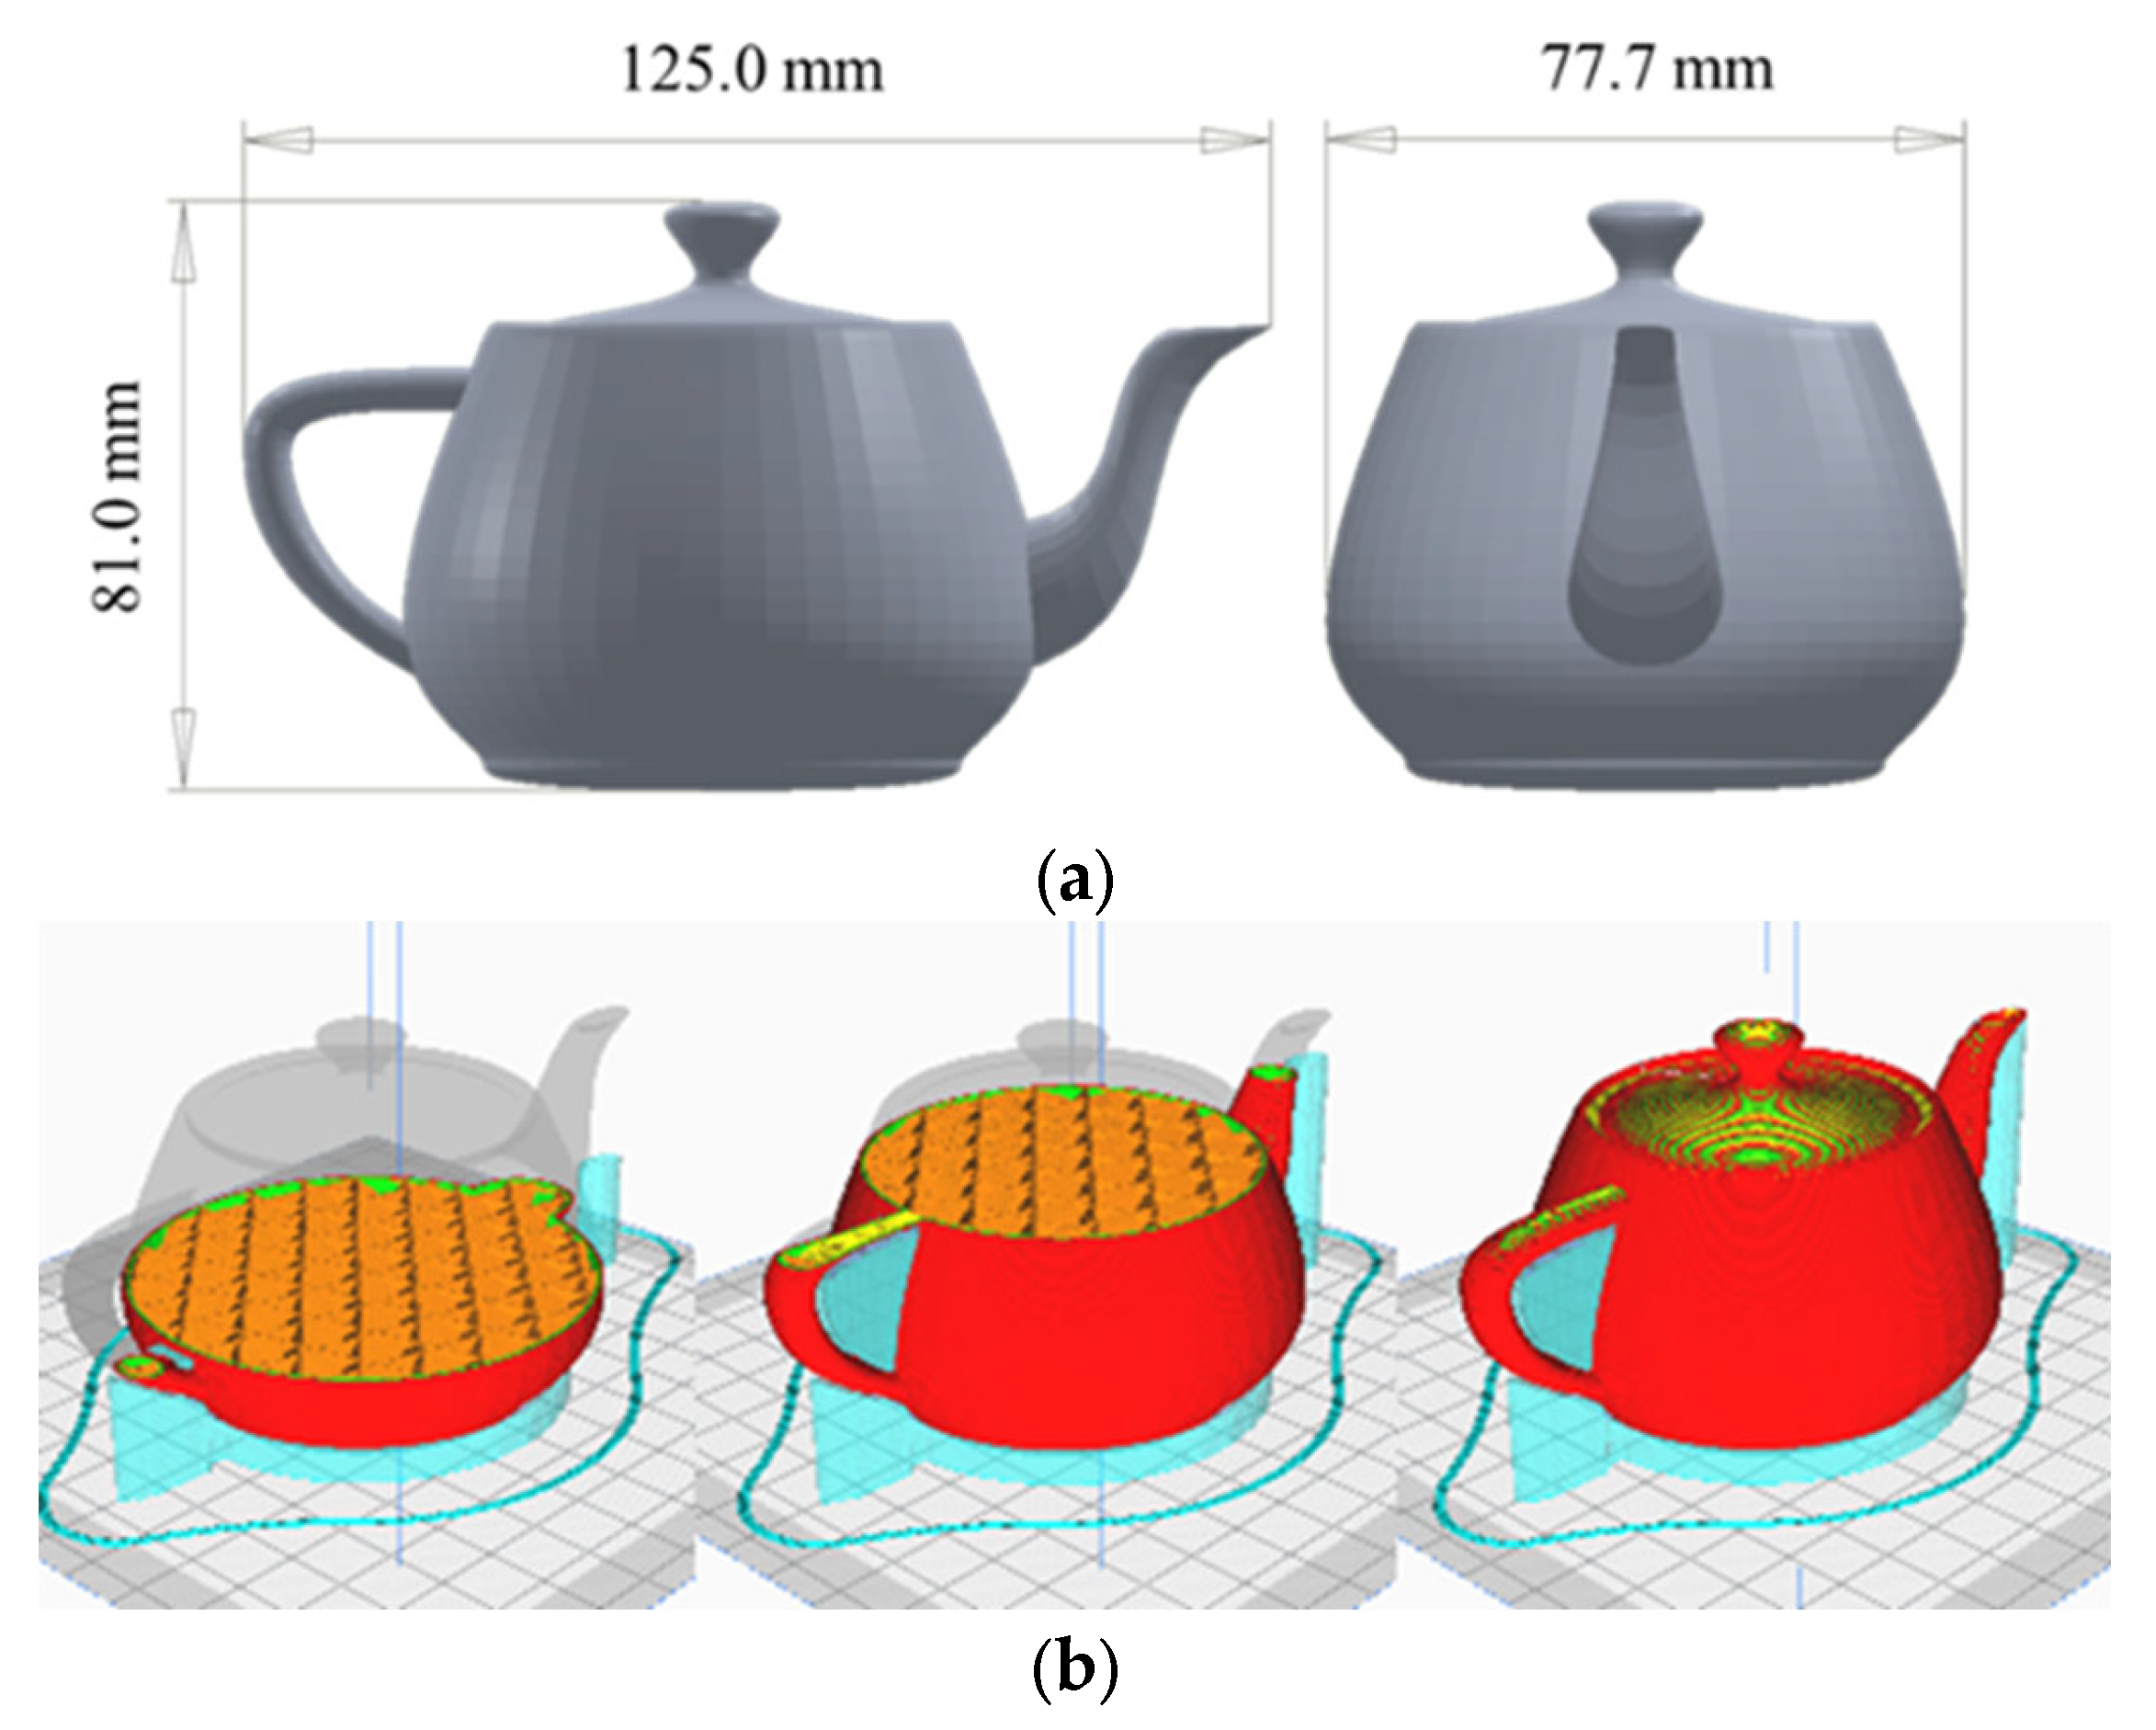
2.8. Test Part and Printer Settings
2.9. Polymer Consumption Tests
2.10. Reduced Support Line Width
2.11. Lightning Infill
2.12. Foaming Polymer
3. Results
3.1. Heated Bed Insulation
3.2. Hot-End Insulation
3.3. Full 3D Printer Enclosure
3.4. Reduced Support Line Width
3.5. Lightning Infill
3.6. Optimised Settings and Use of Foaming PLA
4. Discussion
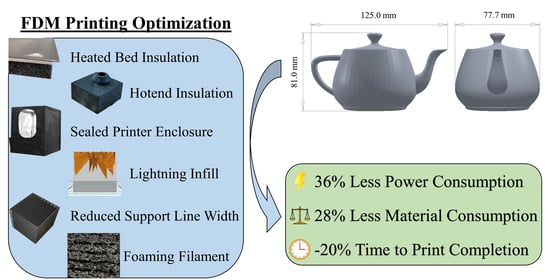
5. Conclusions
- For the insulation research, it was shown that heated bed insulation did not provide exceptional power consumption savings (5–10%). The hot-end insulation was more distinct, with savings of 33.8–30.63%, and significant power savings were also achieved while using the printer enclosures (15.65–18.16%). Importantly, the enclosure insulation findings show that there will be increased savings with build times above two hours. The ease of installation for these three modifications will ensure energy savings over the operating life.
- It was shown that there are opportunities to reduce polymer usage and electrical energy consumption for 3D printers by the careful selection of print parameters and not simply accepting ‘default’ parameters. By reducing support line width from 0.6 mm to 0.4 mm, material savings amounting to 31.2–32.3% can be seen, and the choice of lightning infill provides a material saving of 51% for all three printers.
- The combined power consumption and material saving of all three machines with optimised insulation modifications, reduced line width and the foaming PLA were tested on builds of the Utah Teapot test part. With all of the modifications applied, the material consumption was reduced between 55.8% and 56.4%, and an average power consumption reduction of 29 to 38% was observed.
Author Contributions
Funding
Institutional Review Board Statement
Informed Consent Statement
Data Availability Statement
Acknowledgments
Conflicts of Interest
References
- Net Zero Strategy: Build Back Greener. Available online: https://www.gov.uk/government/publications/net-zero-strategy (accessed on 28 March 2022).
- What is the European Green Deal? Available online: https://ec.europa.eu/commission/presscorner/detail/en/fs_19_6714 (accessed on 28 March 2022).
- Pusavec, F.; Krajnik, P.; Kopac, J. Transitioning to sustainable production–Part I: Application on machining technologies. J. Clean. Prod. 2010, 18, 174–184. [Google Scholar] [CrossRef]
- Hussain, G.; Al-Ghamdi, K.A. Empirical modeling and simultaneous optimization of energy efficiency/demand, cost and productivity in incremental forming of metallic clad composite. Int. J. Hydrog. Energy 2017, 42, 20375–20385. [Google Scholar] [CrossRef]
- DePalma, K.; Walluk, M.; Murtaugh, A.; Hilton, J.; McConky, S.; Hilton, B. Assessment of 3D printing using fused deposition modeling and selective laser sintering for a circular economy. J. Clean. Prod. 2020, 264, 121567. [Google Scholar] [CrossRef]
- Agrawal, R. Sustainable material selection for additive manufacturing technologies: A critical analysis of rank reversal approach. J. Clean. Prod. 2021, 296, 126500. [Google Scholar] [CrossRef]
- Sharma, A.; Rai, A. Fused deposition modelling (FDM) based 3D & 4D Printing: A state of art review. Mater. Today Proc. 2022, 62, 367–372. [Google Scholar] [CrossRef]
- Wang, Y.; Ahmed, A.; Azam, A.; Bing, D.; Shan, Z.; Zhang, Z.; Tariq, M.K.; Sultana, J.; Mushtaq, R.T.; Mehboob, A. Applications of additive manufacturing (AM) in sustainable energy generation and battle against COVID-19 pandemic: The knowledge evolution of 3D printing. J. Manuf. Syst. 2021, 60, 709–733. [Google Scholar] [CrossRef]
- Peng, T.; Yan, F. Dual-objective analysis for desktop FDM printers: Energy consumption and surface roughness. Procedia CIRP 2018, 69, 106–111. [Google Scholar] [CrossRef]
- Wohlers, T.; Gornet, T. History of additive manufacturing. In Wohlers Report; Wohlers Associates: Fort Collins, CO, USA, 2014. [Google Scholar]
- Pham, D.; Dimov, S.S. Rapid Manufacturing: The Technologies and Applications of Rapid Prototyping and Rapid Tooling; Springer Science & Business Media: Berlin/Heidelberg, Germany, 2012. [Google Scholar]
- Griffiths, C.; Howarth, J.; Rowbotham, G.d.-A.; Rees, A. Effect of build parameters on processing efficiency and material performance in fused deposition modelling. Procedia CIRP 2016, 49, 28–32. [Google Scholar] [CrossRef]
- Griffiths, C.; Howarth, J.; De Almeida-Rowbotham, G.; Rees, A.; Kerton, R. A design of experiments approach for the optimisation of energy and waste during the production of parts manufactured by 3D printing. J. Clean. Prod. 2016, 139, 74–85. [Google Scholar] [CrossRef]
- Quinlan, H.E.; Hasan, T.; Jaddou, J.; Hart, A.J. Industrial and Consumer Uses of Additive Manufacturing: A Discussion of Capabilities, Trajectories, and Challenges; Wiley Online Library: Hoboken, NJ, USA, 2017; Volume 21, pp. S15–S20. [Google Scholar] [CrossRef]
- Yoon, H.-S.; Lee, J.-Y.; Kim, H.-S.; Kim, M.-S.; Kim, E.-S.; Shin, Y.-J.; Chu, W.-S.; Ahn, S.-H. A comparison of energy consumption in bulk forming, subtractive, and additive processes: Review and case study. Int. J. Precis. Eng. Manuf.-Green Technol. 2014, 1, 261–279. [Google Scholar] [CrossRef]
- Nagarajan, H.P.; Malshe, H.A.; Haapala, K.R.; Pan, Y. Environmental performance evaluation of a fast mask image projection stereolithography process through time and energy modeling. J. Manuf. Sci. Eng. 2016, 138, 101004. [Google Scholar] [CrossRef]
- Bourell, D.L.; Leu, M.; Rosen, D. Roadmap for Additive Manufacturing: Identifying the Future of Freeform Processing; University of Texas at Austin Labratory for Freeform Fabrication Advanced: Austin, TX, USA, 2009. [Google Scholar]
- Balogun, V.A.; Kirkwood, N.D.; Mativenga, P.T. Direct electrical energy demand in fused deposition modelling. Procedia CIRP 2014, 15, 38–43. [Google Scholar] [CrossRef]
- Simon, T.R.; Lee, W.J.; Spurgeon, B.E.; Boor, B.E.; Zhao, F. An experimental study on the energy consumption and emission profile of fused deposition modeling process. Procedia Manuf. 2018, 26, 920–928. [Google Scholar] [CrossRef]
- Elkaseer, A.; Schneider, S.; Scholz, S.G. Experiment-based process modeling and optimization for high-quality and resource-efficient FFF 3D printing. Appl. Sci. 2020, 10, 2899. [Google Scholar] [CrossRef]
- Karimi, S.; Kwon, S.; Ning, F. Energy-aware production scheduling for additive manufacturing. J. Clean. Prod. 2021, 278, 123183. [Google Scholar] [CrossRef]
- Nguyen, N.D.; Ashraf, I.; Kim, W. Compact model for 3d printer energy estimation and practical energy-saving strategy. Electronics 2021, 10, 483. [Google Scholar] [CrossRef]
- Gutowski, T.; Jiang, S.; Cooper, D.; Corman, G.; Hausmann, M.; Manson, J.A.; Schudeleit, T.; Wegener, K.; Sabelle, M.; Ramos-Grez, J. Note on the rate and energy efficiency limits for additive manufacturing. J. Ind. Ecol. 2017, 21, S69–S79. [Google Scholar] [CrossRef]
- Song, R.; Telenko, C. Material and energy loss due to human and machine error in commercial FDM printers. J. Clean. Prod. 2017, 148, 895–904. [Google Scholar] [CrossRef]
- Torrence, A. Martin Newell’s original teapot. In Proceedings of the ACM SIGGRAPH 2006 Teapot Copyright Restrictions Prevent ACM from Providing the Full Text for the Teapot Exhibits, New York, NY, USA, 30 July–3 August 2006; p. 29. [Google Scholar]
- Newell, M. Utah Teapot. Salt Lake City: University of Utah. Available online: https://www.cs.utah.edu/~natevm/newell_teaset/ (accessed on 6 April 2023).
- Peng, T. Analysis of energy utilization in 3D printing processes. Procedia Cirp 2016, 40, 62–67. [Google Scholar] [CrossRef]
- PZEM-003/017 DC; Communication Module [Internet]. Peacefair: Ningbo, China, 2021.
- Specification CC400 VAF-S; Acoustic Foam. Mechanical Air Supplied Ltd.: Leatherhead, UK, 2016.
- US6722872B1; High Temperature Modeling Apparatus. Stratasys Inc.: Austin, TX, USA, 2022.
- Aloyaydi, B.; Sivasankaran, S.; Mustafa, A. Investigation of infill-patterns on mechanical response of 3D printed poly-lactic-acid. Polym. Test. 2020, 87, 106557. [Google Scholar] [CrossRef]
- How to Print Like a Flash with Lightning Infill. Available online: https://ultimaker.com/learn/how-to-use-lightning-infill (accessed on 6 April 2023).
- COLORFABB LW-PLA-TESTING FOAMING PLA. Available online: https://www.cnckitchen.com/blog/colorfabb-lw-pla-testing-foaming-pla (accessed on 6 April 2023).
- Matuana, L.M.; Faruk, O.; Diaz, C.A. Cell morphology of extrusion foamed poly (lactic acid) using endothermic chemical foaming agent. Bioresour. Technol. 2009, 100, 5947–5954. [Google Scholar] [CrossRef] [PubMed]
- 3D Printing Filament Market Size, Share & Trends Analysis Report By Type (Plastics, Metal, Ceramics), By Plastic Type (Polylactic Acid, ABS), By Application (Industrial, Aerospace & Defense), By Region, And Segment Forecasts, 2020–2027. [ebook] Grand View Research. Available online: https://www.grandviewresearch.com/industry-analysis/3d-printing-filament-market (accessed on 6 April 2023).
- Baichtal, J. Thingiverse. com Launches A Library of Printable Objects. Wired 2008, 20. Available online: https://www.wired.com/2008/11/thingiversecom/ (accessed on 6 April 2023).


| Experiment | SE Mean (S2) | Variance (σ2) | COV | Standard Deviation (σ) |
|---|---|---|---|---|
| 1 | 0.0094 | 0.00088 | 0.29 | 0.0208 |
| 2 | 0.0068 | 0.00046 | 0.21 | 0.0215 |
| 3 | 0.0233 | 0.006 | 0.81 | 0.0237 |
| 4 | 0.0349 | 0.0097 | 0.76 | 0.0297 |
| 5 | 0.014 | 0.001 | 0.37 | 0.0313 |
| 6 | 0.0096 | 0.00056 | 0.28 | 0.0408 |
| 7 | 0.0167 | 0.0017 | 0.49 | 0.0446 |
| 8 | 0.0251 | 0.0038 | 0.75 | 0.0615 |
| 9 | 0.0169 | 0.002 | 0.55 | 0.0773 |
| 10 | 0.0104 | 0.0004 | 0.25 | 0.0987 |
| Settings | Default |
|---|---|
| Layer Height | 0.2 mm |
| Nozzle Diameter | 0.6 mm |
| Line Width | 0.6 mm |
| Support Line Width | 0.6 mm |
| Wall Line Count | 2 |
| Top Layers | 4 |
| Bottom Layers | 4 |
| Infill Density | 20% |
| Infill Pattern | Cubic |
| Printing Temperature | 230 °C |
| Build Plate Temperature | 60 °C |
| Support Pattern | Zig-Zag |
| Support Overhang Angle | 45° |
| Connect Support Zig-Zags | On |
| Support Density | 20% |
| Support Interface | Off |
| Build Plate Adhesion | Skirt |
| Skirt Line Count | 3 |
| Product | Material Saving Based on Download Count (Tons) | Power Saving Based on Download Count (kWh) |
|---|---|---|
| 1 | 2.58 | 5920 |
| 2 | 42.56 | 97,615 |
| 3 | 0.13 | 301 |
| 4 | 0.01 | 19 |
| 5 | 0.60 | 1383 |
| 6 | 0.97 | 2226 |
| 7 | 38.13 | 87,443 |
| 8 | 1.54 | 3531 |
| 9 | 2.43 | 5571 |
| 10 | 2.56 | 5863 |
| Total | 91.51 | 209,873 |
Disclaimer/Publisher’s Note: The statements, opinions and data contained in all publications are solely those of the individual author(s) and contributor(s) and not of MDPI and/or the editor(s). MDPI and/or the editor(s) disclaim responsibility for any injury to people or property resulting from any ideas, methods, instructions or products referred to in the content. |
© 2023 by the authors. Licensee MDPI, Basel, Switzerland. This article is an open access article distributed under the terms and conditions of the Creative Commons Attribution (CC BY) license (https://creativecommons.org/licenses/by/4.0/).
Share and Cite
Harding, O.J.; Griffiths, C.A.; Rees, A.; Pletsas, D. Methods to Reduce Energy and Polymer Consumption for Fused Filament Fabrication 3D Printing. Polymers 2023, 15, 1874. https://doi.org/10.3390/polym15081874
Harding OJ, Griffiths CA, Rees A, Pletsas D. Methods to Reduce Energy and Polymer Consumption for Fused Filament Fabrication 3D Printing. Polymers. 2023; 15(8):1874. https://doi.org/10.3390/polym15081874
Chicago/Turabian StyleHarding, Owen James, Christian Andrew Griffiths, Andrew Rees, and Dimitrios Pletsas. 2023. "Methods to Reduce Energy and Polymer Consumption for Fused Filament Fabrication 3D Printing" Polymers 15, no. 8: 1874. https://doi.org/10.3390/polym15081874
APA StyleHarding, O. J., Griffiths, C. A., Rees, A., & Pletsas, D. (2023). Methods to Reduce Energy and Polymer Consumption for Fused Filament Fabrication 3D Printing. Polymers, 15(8), 1874. https://doi.org/10.3390/polym15081874